Embed Size (px)
Citation preview
PPIC.ORG
California’s Historic Corrections Reforms
Magnus Lofstrom, Mia Bird, and Brandon Martin
September 2016

© 2016 Public Policy Institute of California.
PPIC is a public charity. It does not take or support positions on any ballot measures or on any local, state, or federal legislation, nor does it endorse, support, or oppose any political parties or candidates for public office.
Short sections of text, not to exceed three paragraphs, may be quoted without written permission provided that full attribution is given to the source.
Research publications reflect the views of the authors and do not necessarily reflect the views of our funders or of the staff, officers, advisory councils, or board of directors of the Public Policy Institute of California.
Library of Congress Cataloging-in-Publication Data are available for this publication.
ISBN: 978-1-58213-164-1
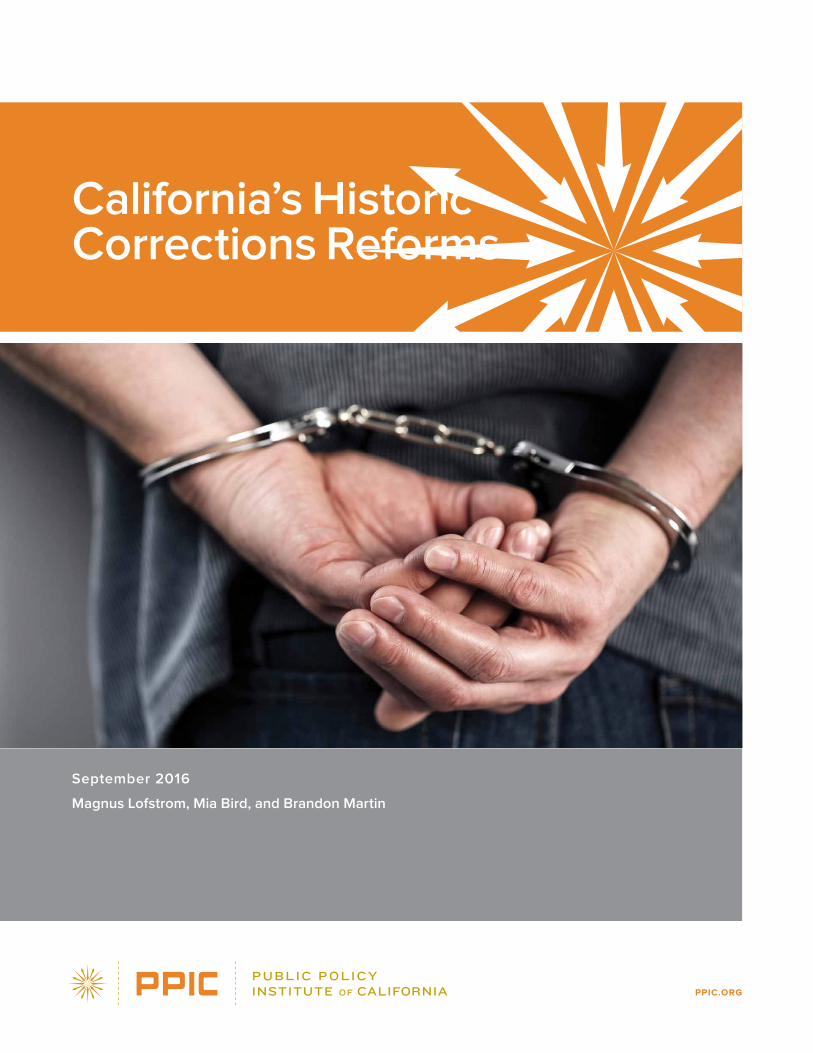
SUMMARYCalifornia leads the nation in correctional reforms and reduced reliance on incar-
ceration. In 2011, the state enacted public safety realignment, which shifted the
management of lower-level felons from the state prison and parole systems to
county jail and probation systems. Three years later, voters approved Proposition
47, which further reprioritized correctional resources and lowered incarceration.
In this report, we describe the impact of these historic changes.
Over the past decade, California has reversed a long-term trajectory of
increasing incarceration.
� Since reaching a peak in 2006 of almost 256,000 inmates, the total population
incarcerated in California’s state prisons and county jails has dropped by
roughly 55,000. The incarceration rate has fallen from 702 to 515 per 100,000
residents—a level not seen since the early 1990s.
� Realignment substantially reduced the prison population, but led to an
increase in the county jail population of about 10,000 inmates, pushing the
statewide jail population above its rated capacity and leading to more early
releases due to overcapacity. Proposition 47 brought the statewide jail popula-
tion down to pre-realignment levels.
Dramatically reduced incarceration from realignment did not lead to a broad
increase in crime rates.
� Crime rates in California are on a long-term decline, though there are year-to-
year fluctuations. Realignment resulted in an additional 18,000 offenders on
the street, but through 2014, we found no evidence of an impact on violent
crime. Auto thefts did increase, by about 60 per 100,000 residents in 2014.
� From 2014 to 2015, the violent crime rate increased by 8.4 percent and the
property crime rate by 6.6 percent. The role of Proposition 47 on crime remains
unknown, but preliminary data show that compared to other states, California’s
increase in property crime appears to stand out more than its increase in
violent crime.
Reforms have not yet succeeded in reducing the state’s high rates of recidivism.
� Rearrest and reconviction rates for offenders released from state prison are
similar to pre-realignment levels. The two-year rearrest rate is 69 percent. The
two-year reconviction rate (42%) is about 5 percentage points higher than
before realignment, but this higher rate may simply reflect prosecution of
offenses that in the past would have been processed administratively.
� Realignment helped stanch the flow of returning offenders to state prison for
parole violation. Two-year return-to-prison rates dropped from 55 percent
pre-realignment to 16.5 percent.
� Offenders released from state prison who are supervised by county probation
have higher recidivism rates than those supervised by state parole. This
difference is primarily due to a significantly higher share of so-called high-risk
offenders among the former population.
CONTENTS
Introduction 4
Incarceration Has Decreased Dramatically 6
Crime Rates Are Historically Low 10
Recidivism Rates Remain Stubbornly High 14
State Corrections Spending Continues to Grow 22
Conclusions 25
Notes 28
References 31
About the Authors 32
Acknowledgments 33
A technical appendix to this report is available on the PPIC website.
4 CALIFORNIA'S HISTORIC CORRECTIONS REFORMS
IntroductionOver the past 40 years, California’s corrections system has undergone remarkable changes. “Tough on crime” policies going back to the 1970s led to dramatic increases in the prison popu-lation.1 Between 1980 and 2006, the state prison population grew more than sevenfold. Over the same period, expenditures rose markedly and corrections’ share of the state budget roughly tripled. Although the state increased the number of prisons from 11 to 33 over this period, the prison population still outpaced capacity.
Severe overcrowding and poor prison conditions led to several lawsuits filed against the California Department of Corrections and Rehabilitation (CDCR), claiming the department provided inadequate medical and mental health care.2 In 2007, a federal three-judge panel was appointed. Citing excessive crowding that prevented improved conditions, the panel ordered the state in 2009 to reduce its institutional prison population to 137.5 percent of design capacity—at the time equivalent to a reduction of almost 40,000 prisoners. Since then, California has pursued a series of correctional reforms through legislative actions, voter initiatives, and CDCR population reduction measures (Figure 1).
Corrections spending continues to grow and is at historic highs.
� Despite lower incarceration, the state’s General Fund corrections spending is $10.6 billion—
9 percent more than the $9.7 billion spent in 2010–11, the last year before realignment. Budgetary
increases have funded additional capacity, medical and mental health care, bond repayment, and
employee salary and benefits.
� Bringing down the prison population enough to close a state prison or eliminate the practice of
housing prisoners in non-state facilities may be necessary to yield substantial reductions in costs.
California’s historic corrections reforms have brought some success and also presented new chal-
lenges, including changes in the composition of the jail population. Future efforts will need to keep
incarceration and crime rates down, while beginning to lower recidivism and costs. Achieving these
manifold goals will require that the state and counties work to identify cost-effective strategies in
order to reduce crime and recidivism.
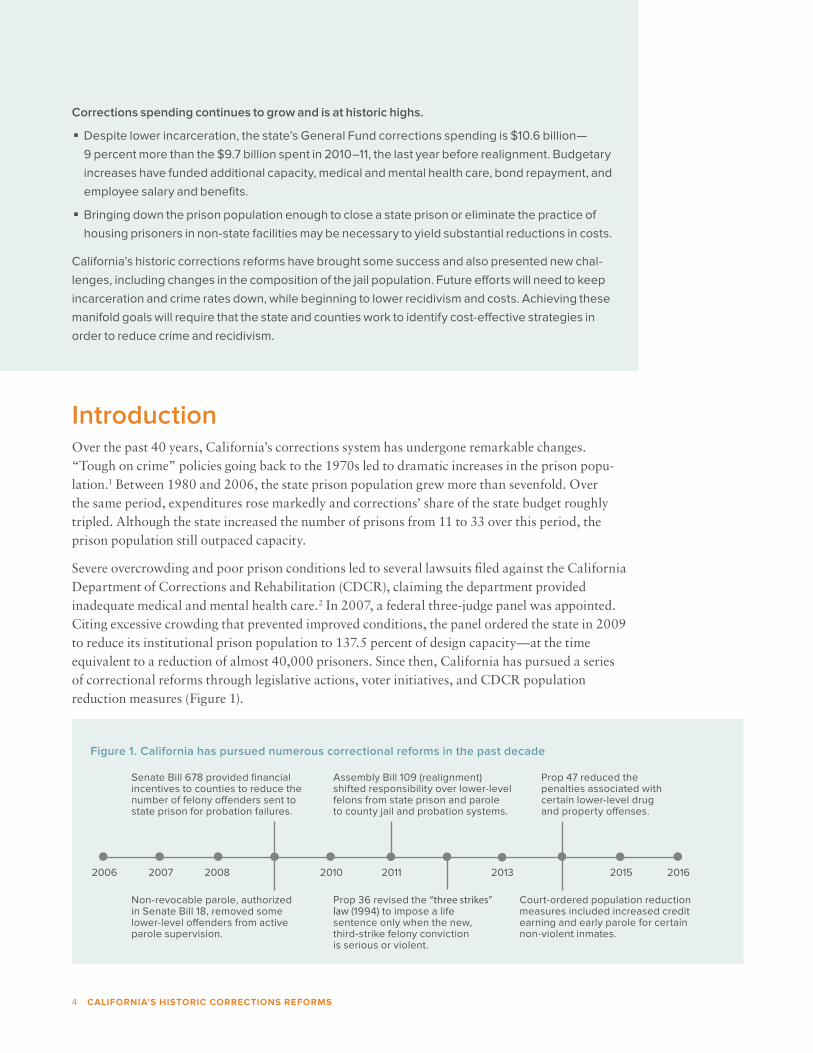
Figure 1. California has pursued numerous correctional reforms in the past decade
Senate Bill 678 provided financial incentives to counties to reduce the number of felony o�enders sent to state prison for probation failures.
Assembly Bill 109 (realignment) shifted responsibility over lower-level felons from state prison and parole to county jail and probation systems.
Prop 47 reduced the penalties associated with certain lower-level drug and property o�enses.
Non-revocable parole, authorized in Senate Bill 18, removed some lower-level o�enders from active parole supervision.
Prop 36 revised the “three strikes” law (1994) to impose a life sentence only when the new, third-strike felony conviction is serious or violent.
Court-ordered population reduction measures included increased credit earning and early parole for certain non-violent inmates.
2006 2011 20162007 2008 2010 2013 2015
PPIC.ORG 5
In 2011, the US Supreme Court upheld the 2009 fed-eral court order requiring the state to reduce the prison population. In response, the state enacted Public Safety Realignment (Assembly Bill 109): legislation designed to address prison crowding by shifting responsibility for managing most lower-level felons from the state to the counties. To quickly reduce the prison population, the historic reform introduced two significant measures:
� First, most offenders convicted of non-serious, non-violent, and non-sexual crimes (known as triple-non offenses) with no serious, violent, or sexual crimes appearing in their criminal records, now serve their sentences in county jail or under probation supervision rather than in state prison.
� Second, most parole violators are not eligible to be sent to prison unless they are convicted of a new, prison-eligible felony. Instead, parole violators now serve short stays (no more than six months) in county jails, or face other local sanctions.
Realignment also introduced an important measure designed to lower California’s high rates of recidivism. This measure shifted the supervision of lower-level offenders released from state prison from state parole to county probation departments (on Post-Release Commu-nity Supervision, or PRCS).
The reform quickly reduced the state prison population, but not enough to reach the mandated target. It was not until the state passed another significant reform, Proposition 47 (Prop 47), through a voter initiative in November 2014 that the prison population fell below the mandated target. Prop 47 reduced penalties for a number of drug and property offenses by classifying them as misdemeanors instead of felonies or wobblers, which can be charged as misdemeanors or felonies at the discre-tion of the prosecutor. The initiative allowed inmates serving sentences for these offenses to petition to have their sentences shortened. This not only helped lower the prison population, which has stayed below the mandated target since January 2015, but also significantly reduced the jail population (Lofstrom and Martin 2015; Bird et al. 2016).
In this report, we examine important lessons from these historic changes, with a special focus on realignment, which is now approaching its five-year anniversary.
Glossary of Terms
Board of State and Community Corrections (BSCC):
an independent state agency that provides expertise
on regulations and serves as a data clearinghouse to
the community correctional systems in California.
California Department of Corrections and Rehabilita-
tion (CDCR): the state agency that runs all state prisons
and the parole system.
Capacity-constrained releases: early releases of
inmates in capacity-constrained county jails. Once the
jail population reaches a court-ordered or locally
decided level, the sheriff begins releasing sentenced
and pretrial inmates early to bring down the population.
Contract beds: beds in private and public facilities in
state and out of state. The state pays for inmates to
reside in contract beds to comply with the federal court
population order.
Jail: county-run correctional facility holding individuals
awaiting trial and those sentenced for misdemeanors
or lower-level felony offenses.
Parole: state-run, post-prison-release community
supervision. After realignment, only inmates convicted
for the most serious, violent, or sexual offenses, or
those with severe mental health problems, are super-
vised by state parole after release from state prison.
Post-Release Community Supervision (PRCS): county
probation supervision for individuals released from
state prison for non-serious, non-violent, non-sexual
felony offenses. Before realignment, individuals on
PRCS would have been supervised by state parole.
Prison: state-run correctional facility holding individu-
als convicted of the most serious felony offenses.
Probation: county-run community supervision. Proba-
tion can be given by the courts to individuals instead
of jail or prison sentences, or in combination with a
sentence in county jail.
Property crime: defined by the FBI to be crimes
committed against property, including burglary, motor
vehicle theft, and larceny theft.
Recidivism: the return to offending by individuals
previously convicted of a crime. It is commonly mea-
sured by rearrest, reconviction, and/or return to custody.
Violent crime: defined by the FBI to be certain crimes
committed against a person, including homicide, rape,
robbery, and aggravated assault. While many crimes
against persons are considered violent crimes, some
crimes against persons may be non-violent, such as
harassment or stalking.
6 CALIFORNIA'S HISTORIC CORRECTIONS REFORMS
We take stock of the key effects of realignment on incarceration, crime, recidivism, and state correctional spending. We also assess the extent to which subsequent reforms—particularly Prop 47—have enhanced or mitigated the effects of realignment.
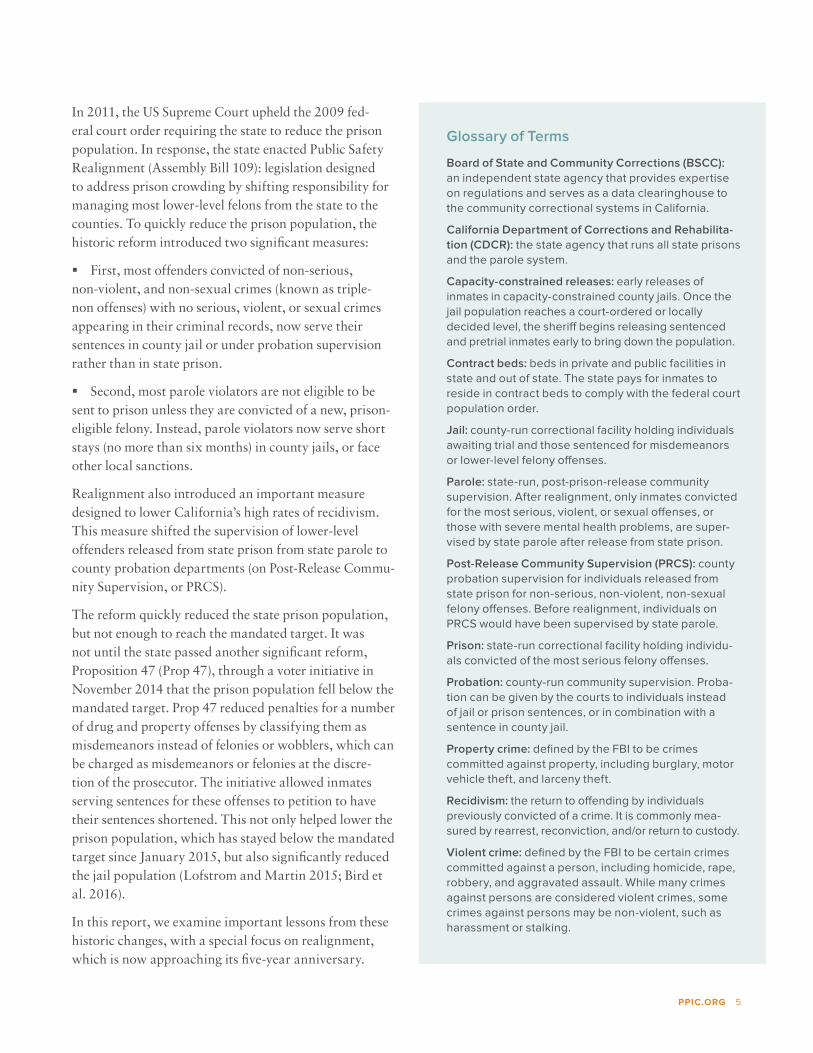
Incarceration Has Decreased DramaticallyRealignment, Prop 47, and other measures have reduced the total incarcerated population by almost 55,000 inmates since 2006. This translates to roughly 44,700 fewer state prison inmates and 10,100 fewer county jail inmates. At its peak in 2006, the state’s total incarceration rate was 701.7 per 100,000 residents. The incarceration rate is now down to 514.5 per 100,000 residents, a decline of 26 percent as of December 2015 (Figure 2).3 A total incarceration rate this low has not been seen in California since the early 1990s, before voters passed a “three strikes” law mandating sentences of 25 years to life for most felony offenders with two previous serious and/or violent convictions (Prop 184).
Most of the decline in the total incarceration rate comes from the drop in the prison population. This is not surprising since most reforms focused on lowering the number of inmates in state prisons. In October 2006, 475.3 per 100,000 California residents were incarcer-ated in state prison. By December 2015, the prison incarceration rate had dropped to 328.3 per 100,000 residents, a decline of 30 percent. The state’s county jail incarceration rate has also declined, but not as much due to the significant increase in the jail population stem-ming from realignment. The jail incarceration rate declined from 226.4 per 100,000 residents in October 2006 to 186.2 per 100,000 residents in December 2015, a drop of 18 percent.
Realignment Rapidly Lowered the Prison Population The 2009 federal court mandate to reduce the prison population posed a significant challenge for the state, which needed to implement multiple reforms, measures, and capacity expansions to meet the mandate. These actions succeeded in reducing the state prison population. From January 2009 to the end of June 2016, the prison population declined by about 41,600 inmates. Realign-ment is estimated to have contributed to well over half of this decline, or about 27,000 inmates.4
By the time the US Supreme Court upheld the court mandate in 2011, the state needed to reduce the prison population by an additional 34,000 inmates by June 2013.5 Partly motivated by the idea that “locals can do a better job,” realignment shifted the responsibility for incarceration and supervision of many lower-level felons from the state prison system to county sheriff and proba-tion departments. The bill went from proposal to implementation very quickly: it was proposed by Governor Jerry Brown in January 2011, passed by the legislature in March 2011, and went into effect in October 2011.
Figure 2. California’s total incarceration rate has declined significantly and steadily since 2009
SOURCE: Board of State and Community Corrections, Jail Profile Survey and California Department of Corrections and Rehabilitation, Monthly Population Report, January 1996–December 2015.
NOTE: The figure shows the total (combined prison and jail) incarcerated population per 100,000 residents.
400
450
500
550
600
650
700
750
1996 2000 2004 2008 2012
Tota
l in
ca
rce
rati
on
ra
te
pe
r 10
0,0
00
re
sid
en
ts
Realignment
Prop 47
PPIC.ORG 7
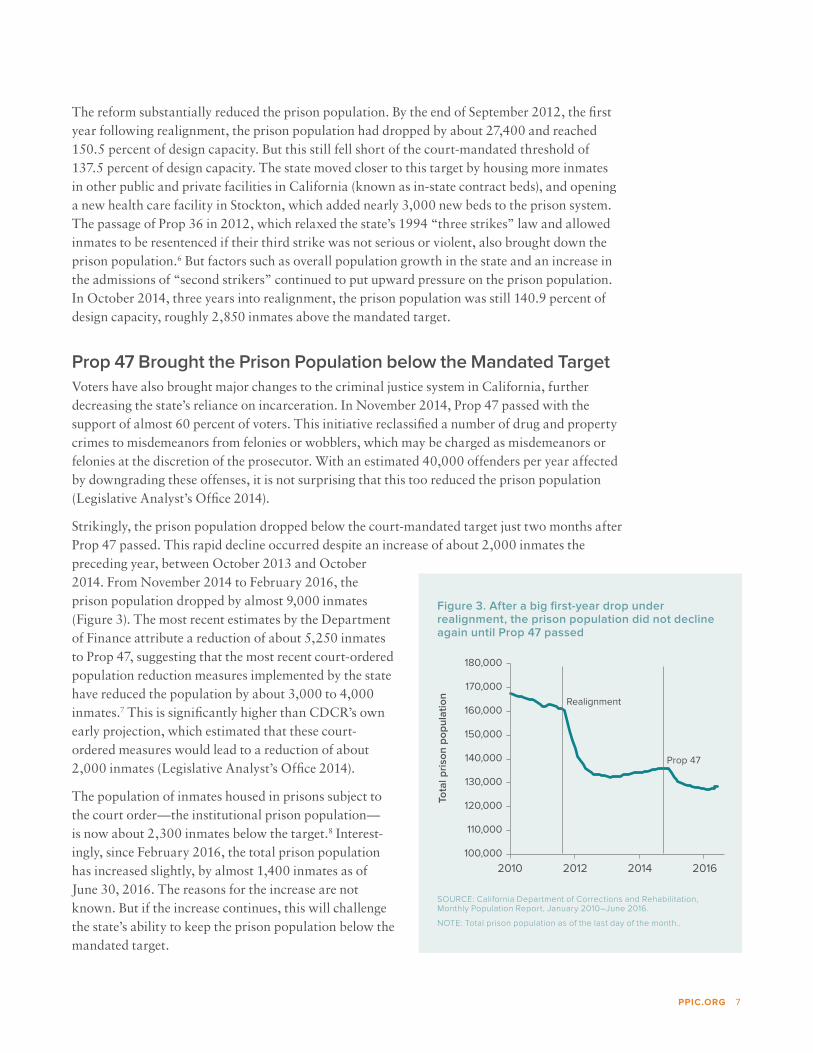
The reform substantially reduced the prison population. By the end of September 2012, the first year following realignment, the prison population had dropped by about 27,400 and reached 150.5 percent of design capacity. But this still fell short of the court-mandated threshold of 137.5 percent of design capacity. The state moved closer to this target by housing more inmates in other public and private facilities in California (known as in-state contract beds), and opening a new health care facility in Stockton, which added nearly 3,000 new beds to the prison system. The passage of Prop 36 in 2012, which relaxed the state’s 1994 “three strikes” law and allowed inmates to be resentenced if their third strike was not serious or violent, also brought down the prison population.6 But factors such as overall population growth in the state and an increase in the admissions of “second strikers” continued to put upward pressure on the prison population. In October 2014, three years into realignment, the prison population was still 140.9 percent of design capacity, roughly 2,850 inmates above the mandated target.
Prop 47 Brought the Prison Population below the Mandated TargetVoters have also brought major changes to the criminal justice system in California, further decreasing the state’s reliance on incarceration. In November 2014, Prop 47 passed with the support of almost 60 percent of voters. This initiative reclassified a number of drug and property crimes to misdemeanors from felonies or wobblers, which may be charged as misdemeanors or felonies at the discretion of the prosecutor. With an estimated 40,000 offenders per year affected by downgrading these offenses, it is not surprising that this too reduced the prison population (Legislative Analyst’s Office 2014).
Strikingly, the prison population dropped below the court-mandated target just two months after Prop 47 passed. This rapid decline occurred despite an increase of about 2,000 inmates the preceding year, between October 2013 and October 2014. From November 2014 to February 2016, the prison population dropped by almost 9,000 inmates (Figure 3). The most recent estimates by the Department of Finance attribute a reduction of about 5,250 inmates to Prop 47, suggesting that the most recent court-ordered population reduction measures implemented by the state have reduced the population by about 3,000 to 4,000 inmates.7 This is significantly higher than CDCR’s own early projection, which estimated that these court-ordered measures would lead to a reduction of about 2,000 inmates (Legislative Analyst’s Office 2014).
The population of inmates housed in prisons subject to the court order—the institutional prison population— is now about 2,300 inmates below the target.8 Interest-ingly, since February 2016, the total prison population has increased slightly, by almost 1,400 inmates as of June 30, 2016. The reasons for the increase are not known. But if the increase continues, this will challenge the state’s ability to keep the prison population below the mandated target.
Figure 3. After a big first-year drop under realignment, the prison population did not decline again until Prop 47 passed
100,000
110,000
120,000
130,000
140,000
150,000
160,000
170,000
180,000
2010 2012 2014 2016
Tota
l p
riso
n p
op
ula
tio
n
Realignment
Prop 47
SOURCE: California Department of Corrections and Rehabilitation, Monthly Population Report, January 2010–June 2016.
NOTE: Total prison population as of the last day of the month..
8 CALIFORNIA'S HISTORIC CORRECTIONS REFORMS
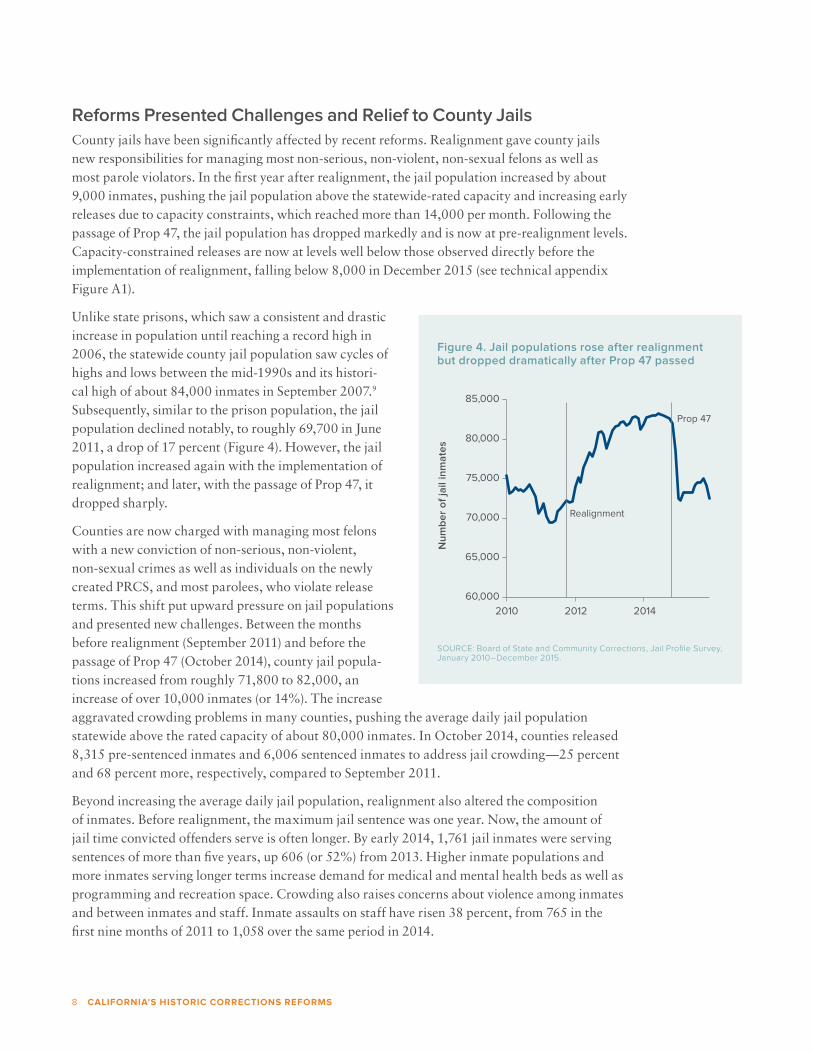
Reforms Presented Challenges and Relief to County JailsCounty jails have been significantly affected by recent reforms. Realignment gave county jails new responsibilities for managing most non-serious, non-violent, non-sexual felons as well as most parole violators. In the first year after realignment, the jail population increased by about 9,000 inmates, pushing the jail population above the statewide-rated capacity and increasing early releases due to capacity constraints, which reached more than 14,000 per month. Following the passage of Prop 47, the jail population has dropped markedly and is now at pre-realignment levels. Capacity-constrained releases are now at levels well below those observed directly before the implementation of realignment, falling below 8,000 in December 2015 (see technical appendix Figure A1).
Unlike state prisons, which saw a consistent and drastic increase in population until reaching a record high in 2006, the statewide county jail population saw cycles of highs and lows between the mid-1990s and its histori-cal high of about 84,000 inmates in September 2007.9 Subsequently, similar to the prison population, the jail population declined notably, to roughly 69,700 in June 2011, a drop of 17 percent (Figure 4). However, the jail population increased again with the implementation of realignment; and later, with the passage of Prop 47, it dropped sharply.
Counties are now charged with managing most felons with a new conviction of non-serious, non-violent, non-sexual crimes as well as individuals on the newly created PRCS, and most parolees, who violate release terms. This shift put upward pressure on jail populations and presented new challenges. Between the months before realignment (September 2011) and before the passage of Prop 47 (October 2014), county jail popula-tions increased from roughly 71,800 to 82,000, an increase of over 10,000 inmates (or 14%). The increase aggravated crowding problems in many counties, pushing the average daily jail population statewide above the rated capacity of about 80,000 inmates. In October 2014, counties released 8,315 pre-sentenced inmates and 6,006 sentenced inmates to address jail crowding—25 percent and 68 percent more, respectively, compared to September 2011.
Beyond increasing the average daily jail population, realignment also altered the composition of inmates. Before realignment, the maximum jail sentence was one year. Now, the amount of jail time convicted offenders serve is often longer. By early 2014, 1,761 jail inmates were serving sentences of more than five years, up 606 (or 52%) from 2013. Higher inmate populations and more inmates serving longer terms increase demand for medical and mental health beds as well as programming and recreation space. Crowding also raises concerns about violence among inmates and between inmates and staff. Inmate assaults on staff have risen 38 percent, from 765 in the first nine months of 2011 to 1,058 over the same period in 2014.
Figure 4. Jail populations rose after realignment but dropped dramatically after Prop 47 passed
60,000
65,000
70,000
75,000
80,000
85,000
2010 2012 2014
Nu
mb
er
of
jail
inm
ate
s
Realignment
Prop 47
SOURCE: Board of State and Community Corrections, Jail Profile Survey, January 2010–December 2015.

PPIC.ORG 9
The passage of Prop 47 initiated a quick and dramatic decline in the jail population. From October 2014 to January 2015, the jail population dropped by 9,769 inmates (or 12%). But, more recently, there has been a small uptick in the jail population, which increased by 265 inmates between January 2015 and December 2015. The currently available statewide data only include 14 months following the passage of Prop 47; and the proposition’s long-term effect may not become evident until counties refine release policies in response to the new law. Furthermore, even though Prop 47 significantly reduced jail populations, these facilities may now house higher shares of inmates who committed serious crimes, as we describe in more detail below. This could continue to make inmate supervision more difficult.
Reforms Affected the Composition of the Jail PopulationWhile the preceding analysis of statewide data shows that the jail population increased sub-stantially in the wake of realignment and then decreased dramatically following Prop 47, more detailed data from select counties allow us to examine recent changes in the composition of the jail population. In collaboration with the Board of State and Community Corrections (BSCC), PPIC researchers are currently working with 12 counties to collect individual-level data on local criminal justice populations.10 This project—the BSCC–PPIC Multi-County Study (MCS)— captures about two-thirds of the state’s jail population. We find the jail population trends within this group are consistent with statewide trends, but it is important to keep in mind that the data presented below are based on a subgroup of counties.
Using these newly available data, PPIC researchers found the number of offenders held in local jails for drug and property offenses increased substantially between October 2011 and October 2014 (Grattet et al. 2016). As a result, the share of the jail population held for drug offenses increased from 17.7 percent to 23.0 percent and the share held for property offenses increased from 19.6 percent to 23.0 percent during the three years following realignment. The number of inmates held in jail for crimes against persons—of which violent crimes are a subset—remained fairly stable under realignment.11 But the share of inmates held for crimes against persons was driven down by the relative growth in the number of inmates held for drug and property offenses.
Jails also appeared to house more serious drug and property offenders after realignment. The median length of stay for felony drug offenders increased from 45 days for offenders released in October 2011 to 73 days for those released in October 2014 (Grattet et al. 2016). Median length of stay also increased for felony property offenders, from 66 days to 71 days over the same period. These changes in length of stay reflect the fact that county jails are now holding offenders who would have served their sentences in state prison prior to realignment.
In some respects, the passage of Prop 47 reversed the compositional trends we saw under realignment. Prop 47 targeted lower-level drug and property offenders and, as a result, the number of inmates held for these offenses declined markedly. In the year following Prop 47, the share of inmates held for drug offenses declined from 23.0 percent to 16.1 percent, and the share held for property offenses declined from 23.0 percent to 21.6 percent. Under Prop 47, the share of the jail population held for crimes against persons increased to 31.8 percent, nearly reaching its pre-realignment level. While relative
Together, realignment and Prop 47 prioritized resources for more serious offenders.
10 CALIFORNIA'S HISTORIC CORRECTIONS REFORMS
reductions in drug and property offenders drove much of this compositional change, the number of inmates held for crimes against persons also increased between October 2014 and October 2015 (from 13,335 to 14,561).
In addition to these compositional changes, Prop 47 drove an overall decline in the jail popula-tion. A number of factors appear to have eased jail population pressure, including both reductions in the number of individuals held for new drug and property crimes, and petitions for sentence reductions from offenders convicted prior to the law’s implementation.12 Within the counties included in the MCS, the jail population declined by about 9 percent (or 4,767 inmates) between October 2014 and October 2015, one year after the implementation of Prop 47 (Bird et al. 2016). However, the population held for Prop 47 offenses declined by more than 50 percent (or 6,334 inmates) during the same period, suggesting that observing the overall change in the jail popula-tion would lead to an underestimation of the direct effect of Prop 47. The reform also had indirect effects on the jail population. In those county jail systems operating under court-ordered population caps, initial reductions in population pressure associated with a reduction in Prop 47 offenders allowed counties to reduce capacity-constrained releases for more serious offenders (Bird et al. 2016).
Taken together, realignment and Prop 47 represent a reprioritization of costly correctional resources toward more serious offenders. Realignment reprioritized prison beds for the most seri-ous offenders in California, shifting large populations of lower-level felons into less costly county jail systems. Three years later, Prop 47 led to a further reprioritization of jail beds for the most serious offenders among the local jail populations.
Crime Rates Are Historically LowThe major policy reforms implemented in California provide an opportunity to answer one of the most pressing questions facing efforts to reduce incarceration: can we lower incarceration without jeopardizing public safety? With realignment approaching its five-year anniversary, there is now ample data to draw lessons from this reform.
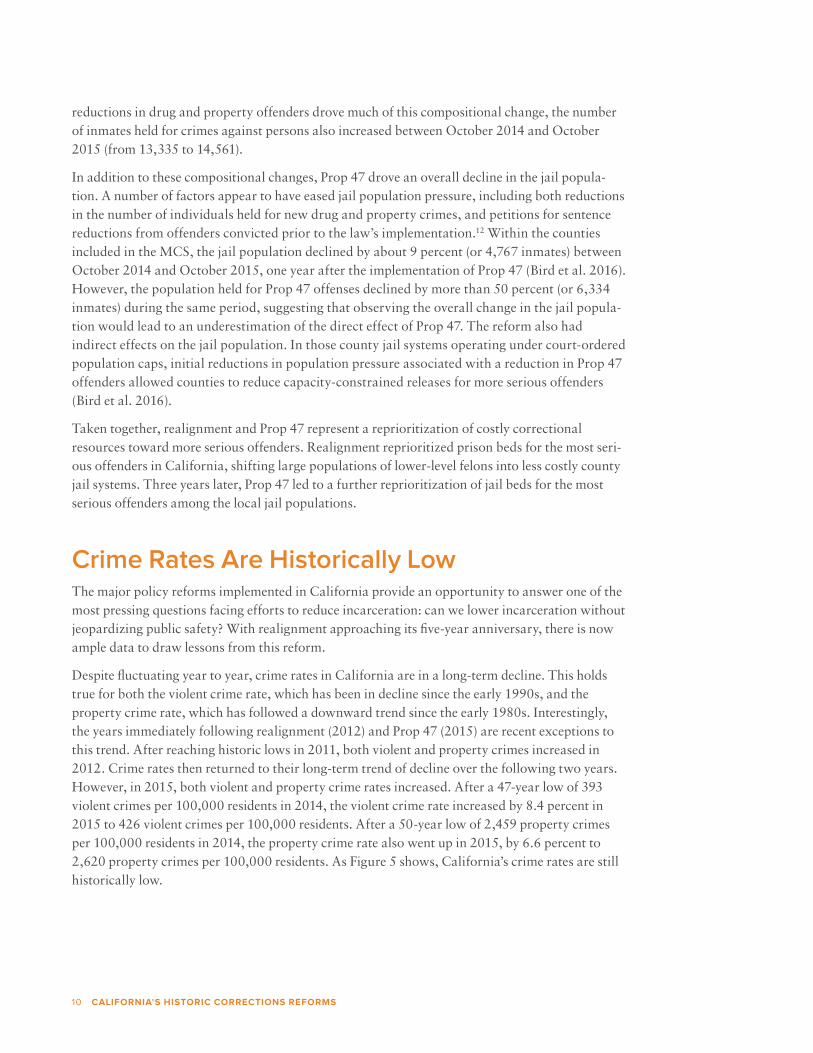
Despite fluctuating year to year, crime rates in California are in a long-term decline. This holds true for both the violent crime rate, which has been in decline since the early 1990s, and the property crime rate, which has followed a downward trend since the early 1980s. Interestingly, the years immediately following realignment (2012) and Prop 47 (2015) are recent exceptions to this trend. After reaching historic lows in 2011, both violent and property crimes increased in 2012. Crime rates then returned to their long-term trend of decline over the following two years. However, in 2015, both violent and property crime rates increased. After a 47-year low of 393 violent crimes per 100,000 residents in 2014, the violent crime rate increased by 8.4 percent in 2015 to 426 violent crimes per 100,000 residents. After a 50-year low of 2,459 property crimes per 100,000 residents in 2014, the property crime rate also went up in 2015, by 6.6 percent to 2,620 property crimes per 100,000 residents. As Figure 5 shows, California’s crime rates are still historically low.
PPIC.ORG 11
Realignment Did Not Increase Violent Crime, But Auto Thefts RoseThere is no evidence to suggest that realignment affected violent crime. Realignment quickly and significantly reduced the prison population—by about 27,000 during its first year. While county jail populations did increase, the increase was only a fraction of the drop in the prison popula-tion: county jail populations increased by 9,000, offsetting roughly one-third of the decline in the prison population. Reduced incarceration and the increase in the number of former inmates—about 18,000—on the street led to concerns that realignment threatened the long-term decline in the state’s crime rates. These concerns were exacerbated when 2012 crime data revealed increases in both violent and property crimes.
These concerns were mostly unwarranted (Lofstrom and Raphael 2013b). Previous research has found no evidence of an impact on violent crime and concluded that the increase in 2012 was part of broader changes also seen in similar states. Although part of the increase in property crime could be attributed to the prison population decline, that impact was modest and limited to an increase in auto thefts.13
In a follow-up study including updated data for 2013, the findings remain unchanged and also show that realignment did not add offenders on the street beyond the 18,000 during its first year of implementation (Lofstrom and Raphael 2015). The only crime effect attributable to realign-ment is a modest rise in property crime, again entirely driven by an increase in auto thefts. Estimates indicate that realignment increased the auto theft rate by slightly more than 70 per 100,000 residents (Lofstrom and Raphael 2015). Put differently, the result shows that the auto theft rate in California is about 17 percent higher than it would have been had realignment not been implemented.
Figure 5. California has experienced a long-term decline in crime rates
SOURCE: Authors’ calculation based on the FBI’s Uniform Crime Report 1960–2002 and the California Department of Justice’s Criminal Justice Statistics Center, California Crimes and Clearances Files, 2003–2015.
NOTE: Violent crime includes homicide, rape, robbery, and aggravated assault; property crime includes burglary, motor vehicle theft, and larceny theft (including non-felonious larceny theft).
0
500
1,000
1,500
2,000
2,500
3,000
0
1,000
2,000
3,000
4,000
5,000
6,000
7,000
8,000
1960 1965 1970 1975 1980 1985 1990 1995 2000 2005 2010 2015
Vio
len
t cri
me
ra
te p
er
100
,00
0 r
esi
de
nts
Pro
pe
rty c
rim
e r
ate
pe
r 10
0,0
00
re
sid
en
ts Property crime rate
Violent crime rate
12 CALIFORNIA'S HISTORIC CORRECTIONS REFORMS
The property crime rate returned to its long-term trend of decline in 2013 and 2014, and remains below the 2010 rate. This may suggest that the 2012 increase was an anomaly and had little to do with realignment. To better understand the extent to which this is true, we turn to a comparison of California’s crime trends to those of other states, now updating the analysis with 2014 crime data. If the 2012 increase in property crime was truly unrelated to realignment, then we might expect California’s crime rate declines in 2013 and 2014 to stand out compared to other states, reducing or erasing the estimated property crime rate gap between California and comparison states reported in Lofstrom and Raphael (2013b).14 Note that at this time we are unable to incor-porate the 2015 crime rates into this portion of the analysis, as the FBI has not yet released 2015 data for all states.
There is no evidence that realignment has affected violent crime. California’s violent crime rate continues to follow the trend of the comparison states (see technical appendix Figure A2). Post-realignment changes in violent crimes in California fluctuate in similar ways to the com-parison states, and none of the deviations from the trend is statistically significant. We also analyze each of the four violent crime offense trends separately and find that changes in murder, rape, aggravated assault, and robbery in California do not stand out when compared to changes in other states.15
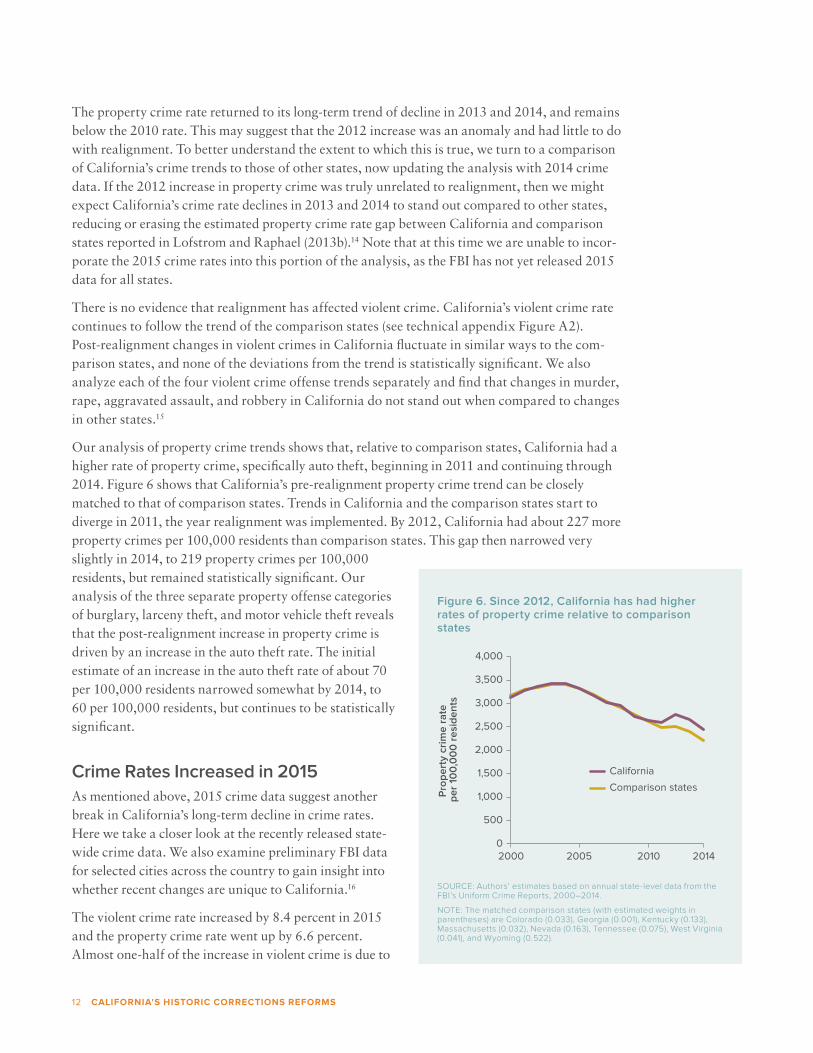
Our analysis of property crime trends shows that, relative to comparison states, California had a higher rate of property crime, specifically auto theft, beginning in 2011 and continuing through 2014. Figure 6 shows that California’s pre-realignment property crime trend can be closely matched to that of comparison states. Trends in California and the comparison states start to diverge in 2011, the year realignment was implemented. By 2012, California had about 227 more property crimes per 100,000 residents than comparison states. This gap then narrowed very slightly in 2014, to 219 property crimes per 100,000 residents, but remained statistically significant. Our analysis of the three separate property offense categories of burglary, larceny theft, and motor vehicle theft reveals that the post-realignment increase in property crime is driven by an increase in the auto theft rate. The initial estimate of an increase in the auto theft rate of about 70 per 100,000 residents narrowed somewhat by 2014, to 60 per 100,000 residents, but continues to be statistically significant.
Crime Rates Increased in 2015 As mentioned above, 2015 crime data suggest another break in California’s long-term decline in crime rates. Here we take a closer look at the recently released state-wide crime data. We also examine preliminary FBI data for selected cities across the country to gain insight into whether recent changes are unique to California.16
The violent crime rate increased by 8.4 percent in 2015 and the property crime rate went up by 6.6 percent. Almost one-half of the increase in violent crime is due to
Figure 6. Since 2012, California has had higher rates of property crime relative to comparison states
0
500
1,000
1,500
2,000
2,500
3,000
3,500
4,000
2000 2005 2010 2014
Pro
pe
rty c
rim
e r
ate
p
er
100
,00
0 r
esi
de
nts
California
Comparison states
SOURCE: Authors’ estimates based on annual state-level data from the FBI’s Uniform Crime Reports, 2000–2014.
NOTE: The matched comparison states (with estimated weights in parentheses) are Colorado (0.033), Georgia (0.001), Kentucky (0.133), Massachusetts (0.032), Nevada (0.163), Tennessee (0.075), West Virginia (0.041), and Wyoming (0.522).
PPIC.ORG 13
the increase in the most common violent crime, aggra-vated assaults—the rate of which went up by 6.6 percent. Roughly one-quarter is due to the increase in robberies (up by 6.9 percent). The reported number of rapes also increased, accounting for the remaining one-quarter of the broader uptick in the 2015 violent crime rate. The number of reported rapes per 100,000 residents increased by 34.1 percent. A significant reason for the increased number of reported rapes is the definitional expansion introduced by the FBI of what constitutes rape in the data.17 Almost 90 percent of the increase in the property crime rate is due to the 9.1 percent increase in the larceny theft rate. The 10.9 percent increase in the motor vehicle theft rate accounted for the rest of the broader increase in property crime, as the burglary rate dropped by 4.1 percent.
Much of the state experienced increases in violent and property crime in 2015. Of California’s 58 counties, 40 saw increases in the violent crime rate, and 41 saw increases in the property crime rate. Many of these counties experienced increases in crime rates of more than 10 percent: 21 counties saw increases of more than 10 percent in the violent crime rate, and 13 counties saw increases of more than 10 percent in the property crime rate. If we limit the analysis to the 26 counties with at least 250,000 residents, where percent changes in crime are less sensitive to small changes in the number of crimes, we find that the violent crime rate rose in 21 out of the 26 counties (nine experienced increases of at least 10%), and the property crime rate also rose in 21 counties (seven experienced increases of at least 10%).
Preliminary FBI data indicate that many cities in other states also reported increases in crime in the first half of 2015.18 These data allow us to calculate year-over-year changes between January–June 2014 and January–June 2015 for 245 cities in 41 states throughout the country. The 66 California cities included in the FBI data contain about half of the state’s total population.
The preliminary data show that cities in 24 of the 41 states saw increases in violent crime, while cities in 14 states reported increases in property crime. However, increases in California’s crime rates are notably larger than those of many other states. The increase in the violent crime rate of 26.3 per 100,000 residents in the included California cities is greater than the increase of 10.1 per 100,000 residents for all 245 cities combined. Other large states also saw increases in violent crime over this period. Violent crime increased in Florida and Texas, by 8.4 and 6.7 violent crimes per 100,000 residents, respectively. However, New York saw a decrease, by 12 violent crimes per 100,000 residents.
The property crime rate in the select California cities increased by 116.9 per 100,000 residents, whereas the property crime rate for all included cities decreased by 29.6 per 100,000 residents. Compared to the nation’s other most populous states, California’s increasing property crime rates appear unique. Texas, New York, Florida, and Illinois all saw decreases of between 111.1 (Texas) and 47.7 (New York) property crimes per 100,000 residents.
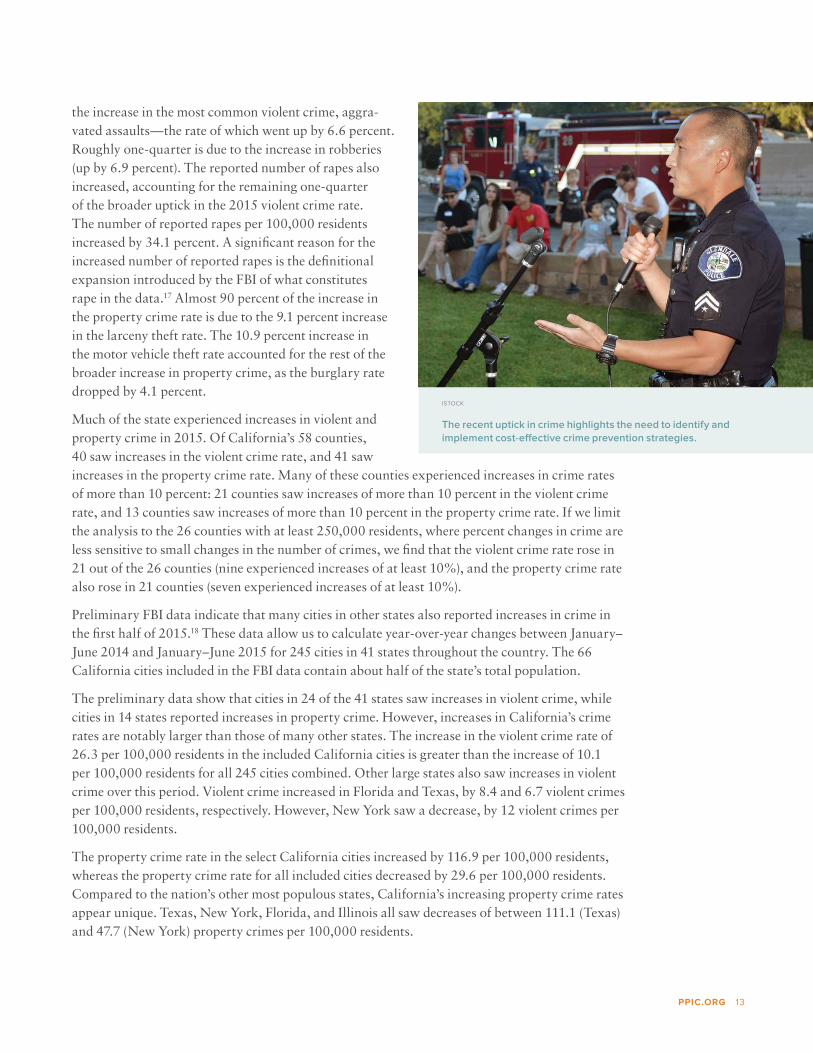
ISTOCK
The recent uptick in crime highlights the need to identify and implement cost-effective crime prevention strategies.
14 CALIFORNIA'S HISTORIC CORRECTIONS REFORMS
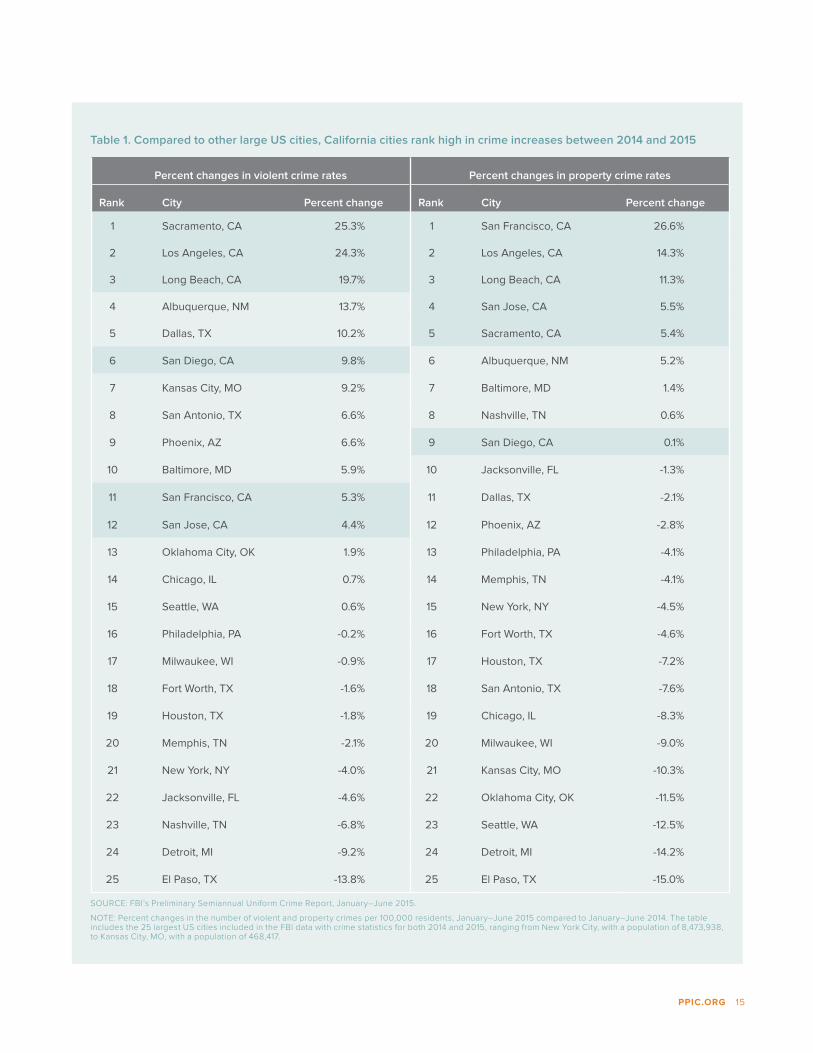
Overall, compared to other states, California’s increase in property crime in 2015 stands out more than its increase in violent crime. The increase in the property crime rate in the select California cities ranks 6th out of the 41 included states, while the increase in the violent crime rate ranks 12th. When examining changes in crime by individual cities, 46 of the 66 California cities were among the 100 cities with the largest increases in the property crime rate, and 32 were among the 100 with the greatest increase in the violent crime rate.
Table 1 shows the changes in violent and property crime rates between 2014 and 2015 among the 25 largest cities included in the FBI data. Two California cities saw the largest percent increases in violent and property crime rates: Sacramento and San Francisco, respectively. Of the 25 included largest cities, the five cities with the highest percent growth in the property crime rate between 2014 and 2015, and the three cities with the highest percent growth in the violent crime rate, are in California.
Lastly, caution should be used in drawing strong conclusions about Prop 47 from the above comparison of California to the rest of the country. The increases in the included California cities in the preliminary data for the first six months of 2015 are greater than those observed for the full year and all cities in California. The violent crime rate in the preliminary data increased by 12.9 percent, compared to 8.4 percent for the whole state for 2015. The property crime rate in the preliminary data increased by 9.3 percent, while we see an increase of 6.6 percent for the more complete 2015 data. Whether the discrepancy is due to the preliminary nature of the FBI data, differences in the cities included, or different trends in the second half of 2015 is not known at this time.19 Another reason for caution is the lesson from realignment: in spite of increases in 2012 (by 7.6% in the number of property crimes and 3.4% in the number of violent crimes), we find that only property crime increased due to that reform, and it was entirely driven by an increase in auto thefts.
The possibility that the state’s long-term downward trend in crime rates may be challenged, at least temporarily, highlights the need to identify and implement cost-effective crime prevention strategies. Evidence suggests that pre-realignment incarceration levels were generally not cost effective. Cost-benefit estimates show that an additional dollar spent on incarceration generated only 23 cents in crime savings (Lofstrom and Raphael 2013b). Promising alternative strategies may focus on various aspects of crime reduction, such as deterrence (e.g., increased policing) or prevention (e.g., early childhood programs and targeted interventions for high-risk youth). Other promising approaches aim to change the trajectories of individuals already involved in the criminal justice system through rehabilitation. Such approaches may involve cognitive behavioral therapy or alternative systems of managing probationers and parolees, including “swift and certain yet moderate” sanctions systems, such as Hawaii’s Opportunity Probation with Enforcement (HOPE).
Recidivism Rates Remain Stubbornly High Recidivism, the rate at which offenders are found to reoffend within a certain period, is a primary gauge for measuring correctional system performance. One critical goal of realignment was to reduce recidivism among lower-level offenders—especially important given that California had some of the highest recidivism rates in the nation (Pew Center on the States 2011).
PPIC.ORG 15
Table 1. Compared to other large US cities, California cities rank high in crime increases between 2014 and 2015
Percent changes in violent crime rates Percent changes in property crime rates
Rank City Percent change Rank City Percent change
1 Sacramento, CA 25.3% 1 San Francisco, CA 26.6%
2 Los Angeles, CA 24.3% 2 Los Angeles, CA 14.3%
3 Long Beach, CA 19.7% 3 Long Beach, CA 11.3%
4 Albuquerque, NM 13.7% 4 San Jose, CA 5.5%
5 Dallas, TX 10.2% 5 Sacramento, CA 5.4%
6 San Diego, CA 9.8% 6 Albuquerque, NM 5.2%
7 Kansas City, MO 9.2% 7 Baltimore, MD 1.4%
8 San Antonio, TX 6.6% 8 Nashville, TN 0.6%
9 Phoenix, AZ 6.6% 9 San Diego, CA 0.1%
10 Baltimore, MD 5.9% 10 Jacksonville, FL -1.3%
11 San Francisco, CA 5.3% 11 Dallas, TX -2.1%
12 San Jose, CA 4.4% 12 Phoenix, AZ -2.8%
13 Oklahoma City, OK 1.9% 13 Philadelphia, PA -4.1%
14 Chicago, IL 0.7% 14 Memphis, TN -4.1%
15 Seattle, WA 0.6% 15 New York, NY -4.5%
16 Philadelphia, PA -0.2% 16 Fort Worth, TX -4.6%
17 Milwaukee, WI -0.9% 17 Houston, TX -7.2%
18 Fort Worth, TX -1.6% 18 San Antonio, TX -7.6%
19 Houston, TX -1.8% 19 Chicago, IL -8.3%
20 Memphis, TN -2.1% 20 Milwaukee, WI -9.0%
21 New York, NY -4.0% 21 Kansas City, MO -10.3%
22 Jacksonville, FL -4.6% 22 Oklahoma City, OK -11.5%
23 Nashville, TN -6.8% 23 Seattle, WA -12.5%
24 Detroit, MI -9.2% 24 Detroit, MI -14.2%
25 El Paso, TX -13.8% 25 El Paso, TX -15.0%
SOURCE: FBI’s Preliminary Semiannual Uniform Crime Report, January–June 2015.
NOTE: Percent changes in the number of violent and property crimes per 100,000 residents, January–June 2015 compared to January–June 2014. The table includes the 25 largest US cities included in the FBI data with crime statistics for both 2014 and 2015, ranging from New York City, with a population of 8,473,938, to Kansas City, MO, with a population of 468,417.
16 CALIFORNIA'S HISTORIC CORRECTIONS REFORMS
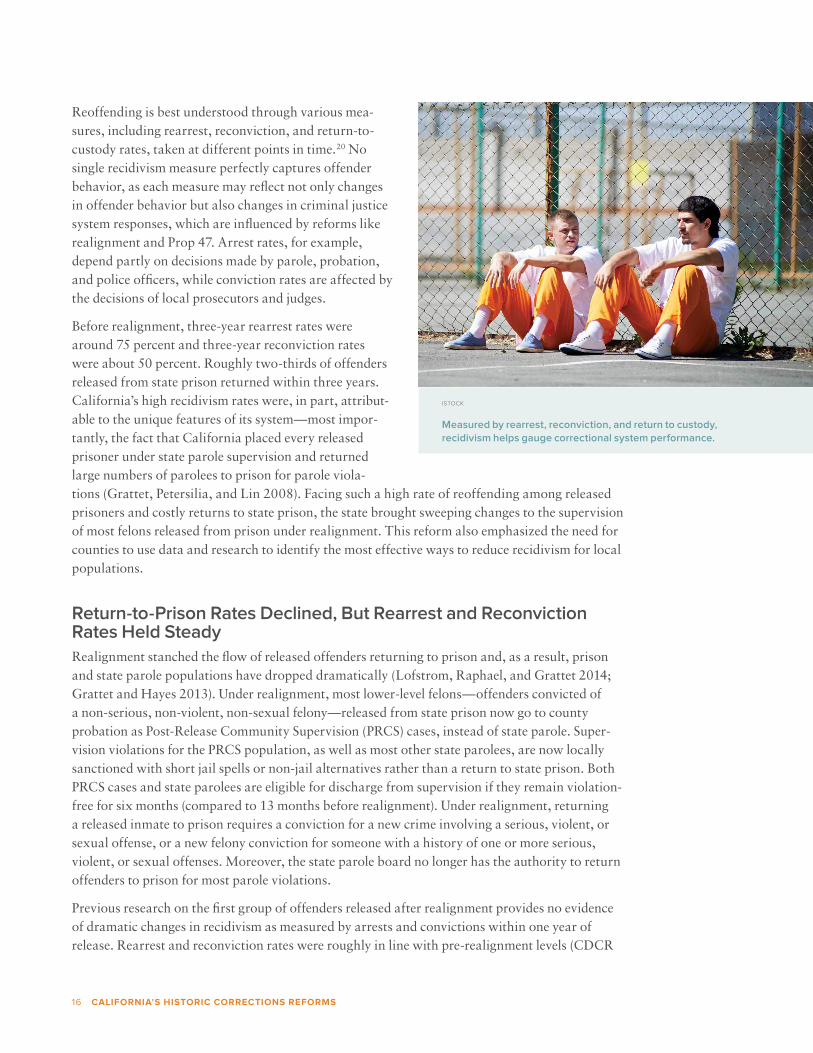
Reoffending is best understood through various mea-sures, including rearrest, reconviction, and return-to-custody rates, taken at different points in time.20 No single recidivism measure perfectly captures offender behavior, as each measure may reflect not only changes in offender behavior but also changes in criminal justice system responses, which are influenced by reforms like realignment and Prop 47. Arrest rates, for example, depend partly on decisions made by parole, probation, and police officers, while conviction rates are affected by the decisions of local prosecutors and judges.
Before realignment, three-year rearrest rates were around 75 percent and three-year reconviction rates were about 50 percent. Roughly two-thirds of offenders released from state prison returned within three years. California’s high recidivism rates were, in part, attribut-able to the unique features of its system—most impor-tantly, the fact that California placed every released prisoner under state parole supervision and returned large numbers of parolees to prison for parole viola-tions (Grattet, Petersilia, and Lin 2008). Facing such a high rate of reoffending among released prisoners and costly returns to state prison, the state brought sweeping changes to the supervision of most felons released from prison under realignment. This reform also emphasized the need for counties to use data and research to identify the most effective ways to reduce recidivism for local populations.
Return-to-Prison Rates Declined, But Rearrest and Reconviction Rates Held SteadyRealignment stanched the flow of released offenders returning to prison and, as a result, prison and state parole populations have dropped dramatically (Lofstrom, Raphael, and Grattet 2014; Grattet and Hayes 2013). Under realignment, most lower-level felons—offenders convicted of a non-serious, non-violent, non-sexual felony—released from state prison now go to county probation as Post-Release Community Supervision (PRCS) cases, instead of state parole. Super-vision violations for the PRCS population, as well as most other state parolees, are now locally sanctioned with short jail spells or non-jail alternatives rather than a return to state prison. Both PRCS cases and state parolees are eligible for discharge from supervision if they remain violation-free for six months (compared to 13 months before realignment). Under realignment, returning a released inmate to prison requires a conviction for a new crime involving a serious, violent, or sexual offense, or a new felony conviction for someone with a history of one or more serious, violent, or sexual offenses. Moreover, the state parole board no longer has the authority to return offenders to prison for most parole violations.
Previous research on the first group of offenders released after realignment provides no evidence of dramatic changes in recidivism as measured by arrests and convictions within one year of release. Rearrest and reconviction rates were roughly in line with pre-realignment levels (CDCR
ISTOCK
Measured by rearrest, reconviction, and return to custody, recidivism helps gauge correctional system performance.

PPIC.ORG 17
2013; Lofstrom, Raphael, and Grattet 2014). For example, one-year rearrest rates only dropped 2 percentage points. But realignment did essentially halt the practice of returning released offend-ers to prison for parole violations. Before the reform, California had the nation’s highest return-to-prison rate. More than 40 percent of released offenders were back in prison within a year. In realignment’s first year, this rate dropped by about 33 percentage points, down to about 7 per-cent, putting the state below the national average (Lofstrom, Raphael, and Grattet 2014).
Thus far, research in this area has been limited to the very first post-realignment releases and a follow-up period of one year (CDCR 2013; Lofstrom, Raphael, and Grattet 2014). It is also lim-ited in the sense that it has not examined return-to-jail or recidivism rates of felons released from county jail. Here we take a step to update the existing research by examining CDCR data to ana-lyze two-year recidivism rates of all offenders released from prison during the first year of realign-ment, and to break down the analysis by offenders supervised by state parole and county proba-tion. In an effort to better understand the new supervision challenges faced by county probation, and how these challenges may differ from those of state parole, we also examine differences in the reoffending-related characteristics between parolees and the PRCS population. Lastly, due to current data limitations, we are constrained to offenders released during the first year of realign-ment, but those data allow us to track reoffending up to as recently as October 2014, for inmates released from prison in October 2012.
Updated data largely confirm previous findings of overall recidivism rates. Figure 7 displays three key recidivism measures for all released offenders one and two years after release:
� One- and two-year rearrest rates for all released offenders continue to hover at 58 percent and 69 percent, respectively, where they have held steady for over a decade (CDCR 2013). These data do not point toward noticeable changes in arrest rates compared to those reported by CDCR for pre-realignment releases (CDCR 2014).
Figure 7. Rearrest and reconviction rates remain high, with differences between the PRCS population and parolees
SOURCE: Authors’ calculations based on CDCR individual-level administrative data.
NOTE: Offenders released from state prison between October 1, 2011, and September 30, 2012. The category “All” includes all offenders released from prison over this period. “PRCS” are those offenders released from prison supervised by county probation on Post-Release Community Supervision. “Parole” includes only those supervised by state parole.
0
10
20
30
40
50
60
70
80
One-yeararrest rate
Two-year arrest rate
One-yearconviction rate
Two-yearconviction rate
One-year return-to-
prison rate
Two-year return-to-
prison rate
%
All
PRCS
Parole
18 CALIFORNIA'S HISTORIC CORRECTIONS REFORMS
� Both the one-year and two-year reconviction rates of 24 percent and 42 percent, respectively, are about 5 percentage points higher compared to pre-realignment levels. This may not be a reflection of increased reoffending, but may be due to successful prosecution through the courts for offenses that in the past would have been processed administratively through the state parole board (Lofstrom, Raphael, and Grattet 2014).
� Released offenders are, as expected, much less likely to be returned to prison. One-year and two-year return-to-prison rates had been declining before realignment to about 40 percent and 55 percent, respectively, but are now much lower, at 7 percent and 16.5 percent.
The CDCR data presented in Figure 7 show that rearrest and reconviction rates are mostly higher for offenders released from prison to county PRCS compared to those released to state parole. But differences in rearrest rates between these two populations are smaller after two years. While the one-year rearrest rate is about 6.5 percentage points higher among offenders released to PRCS compared to those released to state parole, the gap between the two groups narrows to 4.9 per-centage points for the second-year rearrest rate. This may hint at counties successfully adjusting their recidivism-reduction strategies and approaches, although the reconviction rate gap actually increases somewhat (from 8.2 percentage points to 9.3 percentage points). When examining the two-year return-to-prison rate, we observe that PRCS offenders are slightly less likely to be sent back to prison compared to parolees.
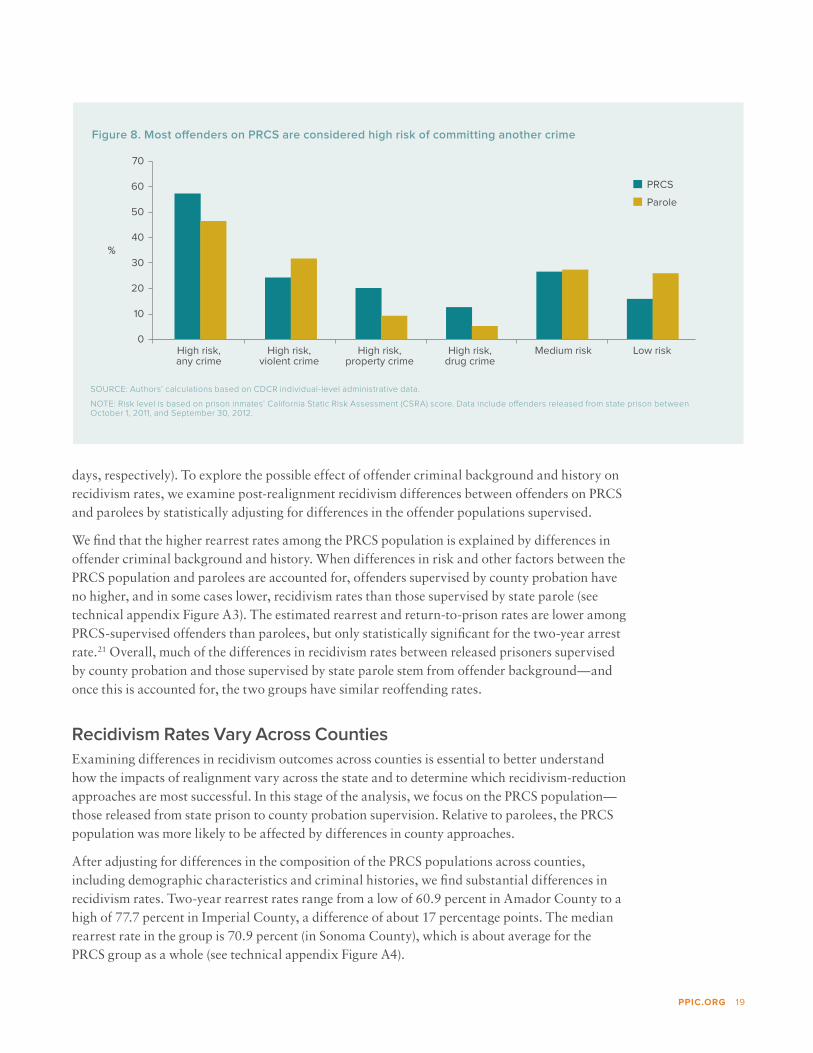
More Offenders on County Probation Are at High Risk of Committing Another CrimeDifferences in recidivism rates may be at least partly due to differences in the offender popula-tion supervised by county probation and state parole. The CDCR data show that most inmates released to PRCS are at high risk for recidivism, as measured by the California Static Risk Assess-ment (CSRA) score. Specifically, 57.4 percent are rated as “high risk for any crime.” Slightly less than half, 46.5 percent, of state parolees are considered high risk. The CSRA score is calculated based on an offender’s record of previous convictions and classifies the offender into one of five groups for risk of reoffending (high risk of violent, property, or drug crimes; moderate risk; or low risk). Compared to state parolees, a lower share of offenders on PRCS are rated as high risk to commit a violent crime, but higher shares—more than double the comparable shares of state parolees—are rated as high risk to commit property and drug crimes (Figure 8).
There are many notable differences in offender characteristics and background between released prisoners supervised by county probation and state parole (see technical appendix Table A1 for more detail). These differences include age, gender, race/ethnicity, and, most significantly, the offense for which inmates just served time prior to their release. While almost 60 percent of parolees served time for a crime against persons, slightly less than 15 percent of those on PRCS did so. Most released offenders on PRCS served time for either a property or drug offense (37.5 and 34.2 percent, respectively). As a result, the number of days in prison before being released for the PRCS population is less than half of what it is among parolees (443 and 925
Offender background accounts for most differences in recidivism between the PRCS population and parolees.
PPIC.ORG 19
days, respectively). To explore the possible effect of offender criminal background and history on recidivism rates, we examine post-realignment recidivism differences between offenders on PRCS and parolees by statistically adjusting for differences in the offender populations supervised.
We find that the higher rearrest rates among the PRCS population is explained by differences in offender criminal background and history. When differences in risk and other factors between the PRCS population and parolees are accounted for, offenders supervised by county probation have no higher, and in some cases lower, recidivism rates than those supervised by state parole (see technical appendix Figure A3). The estimated rearrest and return-to-prison rates are lower among PRCS-supervised offenders than parolees, but only statistically significant for the two-year arrest rate.21 Overall, much of the differences in recidivism rates between released prisoners supervised by county probation and those supervised by state parole stem from offender background—and once this is accounted for, the two groups have similar reoffending rates.
Recidivism Rates Vary Across CountiesExamining differences in recidivism outcomes across counties is essential to better understand how the impacts of realignment vary across the state and to determine which recidivism-reduction approaches are most successful. In this stage of the analysis, we focus on the PRCS population—those released from state prison to county probation supervision. Relative to parolees, the PRCS population was more likely to be affected by differences in county approaches.
After adjusting for differences in the composition of the PRCS populations across counties, including demographic characteristics and criminal histories, we find substantial differences in recidivism rates. Two-year rearrest rates range from a low of 60.9 percent in Amador County to a high of 77.7 percent in Imperial County, a difference of about 17 percentage points. The median rearrest rate in the group is 70.9 percent (in Sonoma County), which is about average for the PRCS group as a whole (see technical appendix Figure A4).
Figure 8. Most offenders on PRCS are considered high risk of committing another crime
SOURCE: Authors’ calculations based on CDCR individual-level administrative data.
NOTE: Risk level is based on prison inmates’ California Static Risk Assessment (CSRA) score. Data include offenders released from state prison between October 1, 2011, and September 30, 2012.
0
10
20
30
40
50
60
70
High risk,any crime
High risk,violent crime
High risk,property crime
High risk,drug crime
Medium risk Low risk
%
PRCS
Parole
20 CALIFORNIA'S HISTORIC CORRECTIONS REFORMS
Two-year reconviction rates, adjusted for differences in population, range from a low of 20.1 percent in Merced County to a high of 58.9 percent in Napa County—with a median of 45.0 percent—for the PRCS population. The range across counties is much wider for reconvictions than for rearrests, reflecting a reconviction rate in the highest-recidivism county that is nearly three times that in the lowest-recidivism county (see technical appendix Figure A5). One possible contributing factor for this wider range is that arrest outcomes may be less responsive to county policy than conviction outcomes. A large share of arrests are made by city police departments, and these departments only had minimal participation in the Community Corrections Partner-ships (CCPs), which brought various agencies together to reenvision local justice systems and develop realignment implementation plans.22 In addition, there may be more opportunities for discretion in the decision to prosecute than in the decision to arrest, which could contribute to greater variation in convictions compared to arrests.
Did county-level implementation policies affect recidivism? While many factors—including the state of the local economy, the level of county resources, and county crime rates—may play a role in recidivism, the strategic approach the county takes to implementing realignment is one factor directly under the control of policymakers and practitioners. Realign-ment emphasized the potential for counties to achieve recidivism reductions where the state had failed to do so through the use of evidence-based interventions tailored to the needs of their local populations. In exchange for state funding, counties developed realignment implemen-tation plans and budgets to guide these efforts. In analyz-ing these plans and budgets, researchers have found considerable variation in counties’ strategic approach to realignment (Lin and Petersillia 2013; Bird and Grattet 2014).
While some counties directed the majority of their realignment funding toward traditional enforcement purposes—such as expanding jail space and increasing sheriff staff—others directed larger shares toward probation supervision and reentry programs and services. These differences provide the opportunity to test whether there is a relationship between the strategic approaches of counties and the recidivism outcomes of their PRCS populations. In a previous study, PPIC researchers found that offenders released to counties that prioritized reentry spending had lower post-realignment recidivism rates compared to those released to counties that prioritized enforce-ment (Bird and Grattet 2014). However, previous research was only able to assess six-month recidivism rates.
Here we reexamine the relationship between realignment funding allocations and longer-term recidivism outcomes for the PRCS population released from state prison during the first year of realignment. In this analysis, we characterize county approaches to realignment as reentry-focused, enforcement-focused, or somewhere in the middle.23 Allocations to reentry programs and services and to probation departments are categorized as “reentry” allocations, while alloca-tions to the sheriff’s department and additional jail bed space are categorized as “enforcement” allocations. We find that 24 counties had reentry allocations that were more than two times their enforcement allocations. These counties were characterized as reentry-focused. In contrast, 19 counties had enforcement allocations that were greater than their reentry allocations, and these counties were characterized as enforcement-focused relative to other counties.24
The PRCS population had lower recidivism rates in counties that prioritized reentry.
PPIC.ORG 21
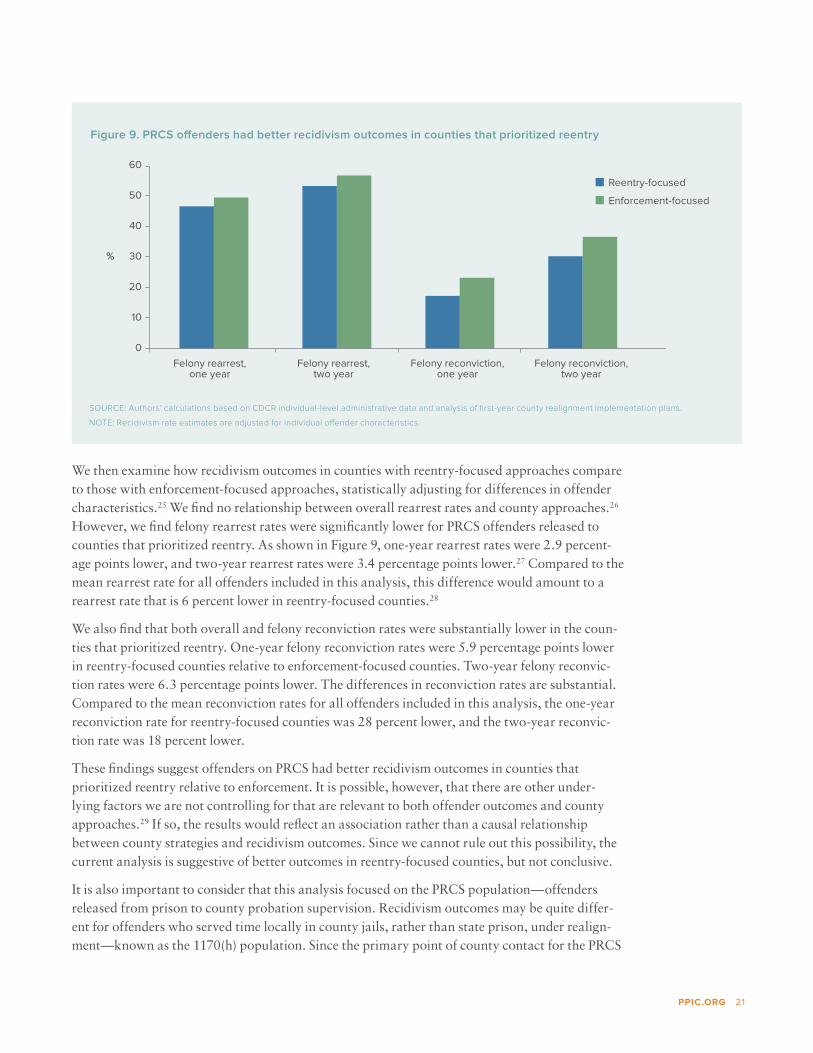
We then examine how recidivism outcomes in counties with reentry-focused approaches compare to those with enforcement-focused approaches, statistically adjusting for differences in offender characteristics.25 We find no relationship between overall rearrest rates and county approaches.26 However, we find felony rearrest rates were significantly lower for PRCS offenders released to counties that prioritized reentry. As shown in Figure 9, one-year rearrest rates were 2.9 percent-age points lower, and two-year rearrest rates were 3.4 percentage points lower.27 Compared to the mean rearrest rate for all offenders included in this analysis, this difference would amount to a rearrest rate that is 6 percent lower in reentry-focused counties.28
We also find that both overall and felony reconviction rates were substantially lower in the coun-ties that prioritized reentry. One-year felony reconviction rates were 5.9 percentage points lower in reentry-focused counties relative to enforcement-focused counties. Two-year felony reconvic-tion rates were 6.3 percentage points lower. The differences in reconviction rates are substantial. Compared to the mean reconviction rates for all offenders included in this analysis, the one-year reconviction rate for reentry-focused counties was 28 percent lower, and the two-year reconvic-tion rate was 18 percent lower.
These findings suggest offenders on PRCS had better recidivism outcomes in counties that prioritized reentry relative to enforcement. It is possible, however, that there are other under-lying factors we are not controlling for that are relevant to both offender outcomes and county approaches.29 If so, the results would reflect an association rather than a causal relationship between county strategies and recidivism outcomes. Since we cannot rule out this possibility, the current analysis is suggestive of better outcomes in reentry-focused counties, but not conclusive.
It is also important to consider that this analysis focused on the PRCS population—offenders released from prison to county probation supervision. Recidivism outcomes may be quite differ-ent for offenders who served time locally in county jails, rather than state prison, under realign-ment—known as the 1170(h) population. Since the primary point of county contact for the PRCS
Figure 9. PRCS offenders had better recidivism outcomes in counties that prioritized reentry
SOURCE: Authors’ calculations based on CDCR individual-level administrative data and analysis of first-year county realignment implementation plans.
NOTE: Recidivism rate estimates are adjusted for individual offender characteristics.
0
10
20
30
40
50
60
Felony rearrest,one year
Felony rearrest,two year
Felony reconviction,one year
Felony reconviction,two year
Reentry-focused
Enforcement-focused
%

22 CALIFORNIA'S HISTORIC CORRECTIONS REFORMS
population is the county probation department, coun-ties that allocated a large share of realignment funds to county probation departments and to reentry programs and services may see better outcomes for this popula-tion. However, it remains to be seen whether the 1170(h) population and other offenders will also have better outcomes in reentry-focused counties. For example, it is possible that county sheriffs allocated significant funds to recidivism-reduction interventions for the 1170(h) population and, in that case, we may see better outcomes for this population in enforcement-focused counties.
To date, analysis of realignment’s effect on recidivism has primarily focused on the outcomes of offenders released from prison because of data limitations. To overcome these limitations, PPIC researchers collabo-rated with the BSCC to launch the Multi-County Study, which was mentioned earlier in this report. New data from this study will allow researchers and government agencies to investigate how realignment affected recidi-vism outcomes for the large and locally held 1170(h) population of offenders. This study will also allow for examination of the effects of particular interventions—including specific programs, services, and sanctions—on recidivism outcomes. In contrast, previous research has focused on county-level strategic approaches.
Moving forward, as policymakers and practitioners seek to improve evidence-based practices, it will be essential to understand whether this shift from state to local management has improved outcomes for the realignment population and to identify the interventions that are most effective at reducing recidivism.
State Corrections Spending Continues to GrowThe dramatic increase in California's prison population between 1980 and 2006 brought a corresponding increase in state corrections spending. In 1980, the corrections budget made up only 3 percent of General Fund expenditures, but by 2010 it accounted for more than 10 per-cent.30 The Great Recession brought budget turmoil, stopping the consistent year-to-year growth in CDCR’s budget. One anticipated benefit of realignment and additional changes made by CDCR was the prospect of budgetary savings on state corrections (CDCR 2012). Savings were expected from a drop in prisoner and parolee populations (CDCR 2016).
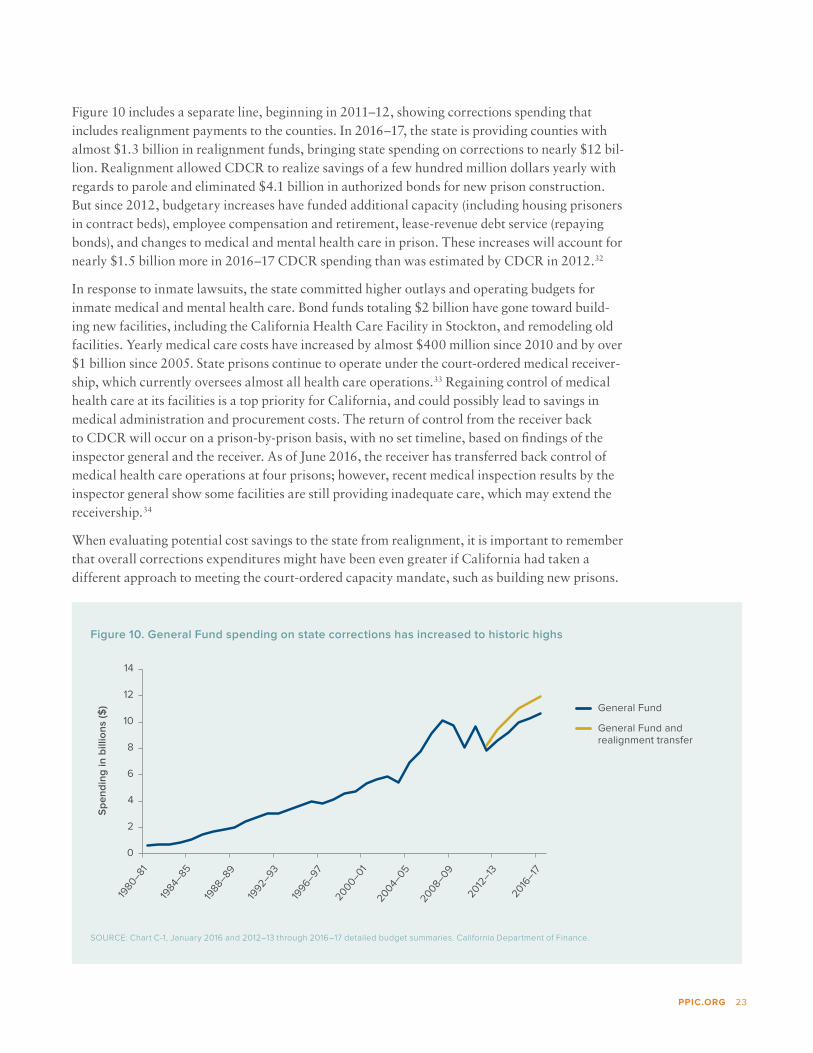
Figure 10 shows that those estimated savings have not materialized. California’s 2016–17 General Fund corrections spending is $10.6 billion, a 9 percent increase from the $9.7 billion spent in 2010–11, the last full budget year before realignment. This is also more than the $10.1 billion spent in 2007–08, when the state had 40,000 more inmates and over 80,000 more parolees under its supervision.31 These budget figures do not include funds the state allocates to counties for realignment, or other special fund expenditures.
ISTOCK
In 2016–17, total state spending on corrections was nearly $12 billion.
PPIC.ORG 23
Figure 10 includes a separate line, beginning in 2011–12, showing corrections spending that includes realignment payments to the counties. In 2016–17, the state is providing counties with almost $1.3 billion in realignment funds, bringing state spending on corrections to nearly $12 bil-lion. Realignment allowed CDCR to realize savings of a few hundred million dollars yearly with regards to parole and eliminated $4.1 billion in authorized bonds for new prison construction. But since 2012, budgetary increases have funded additional capacity (including housing prisoners in contract beds), employee compensation and retirement, lease-revenue debt service (repaying bonds), and changes to medical and mental health care in prison. These increases will account for nearly $1.5 billion more in 2016–17 CDCR spending than was estimated by CDCR in 2012.32
In response to inmate lawsuits, the state committed higher outlays and operating budgets for inmate medical and mental health care. Bond funds totaling $2 billion have gone toward build-ing new facilities, including the California Health Care Facility in Stockton, and remodeling old facilities. Yearly medical care costs have increased by almost $400 million since 2010 and by over $1 billion since 2005. State prisons continue to operate under the court-ordered medical receiver-ship, which currently oversees almost all health care operations.33 Regaining control of medical health care at its facilities is a top priority for California, and could possibly lead to savings in medical administration and procurement costs. The return of control from the receiver back to CDCR will occur on a prison-by-prison basis, with no set timeline, based on findings of the inspector general and the receiver. As of June 2016, the receiver has transferred back control of medical health care operations at four prisons; however, recent medical inspection results by the inspector general show some facilities are still providing inadequate care, which may extend the receivership.34
When evaluating potential cost savings to the state from realignment, it is important to remember that overall corrections expenditures might have been even greater if California had taken a different approach to meeting the court-ordered capacity mandate, such as building new prisons.
Figure 10. General Fund spending on state corrections has increased to historic highs
SOURCE: Chart C-1, January 2016 and 2012–13 through 2016–17 detailed budget summaries. California Department of Finance.
0
2
4
6
8
10
12
14
1980
–81
1984
–85
1988
–89
1992
–93
1996
–97
2000–0
1
2004–
05
2008–
09
2012
–13
2016
–17
Sp
en
din
g in
bill
ion
s ($
) General Fund
General Fund andrealignment transfer
24 CALIFORNIA'S HISTORIC CORRECTIONS REFORMS
With continued increases in costs associated with employee compensation and retirement, rehabilitation programming, and inmate health care, it might only be possible to see a large budget reduction by bringing the inmate population down enough to drastically curtail the use of contract beds and/or close a state-run prison. In 2016–17, the state will spend several hundred million dollars renting and leasing beds in public and private facilities in California and other states. Limiting the use of these beds, while still satisfying the court mandate, would help the state achieve notable reductions in costs. Alternatively, closing a state-run prison would save hundreds of millions of dollars each year in staffing and maintenance costs.
State Spending Also Supports Local CorrectionsThe state is also providing financial support to local correctional agencies as a part of realignment and Prop 47. Under realignment, counties receive yearly budget allocations from the state, which were constitutionally guaranteed with the passage of Prop 30 in 2012.35 These allocations provide over $1 billion annually to the counties (Bird and Hayes 2013).
In addition to yearly realignment-related transfers, since 2007, the state has made over $2.5 billion in one-time bond funds available for county jail construction.36 Other funding programs passed between 2007 and 2016 are paying for the addition of an estimated 14,000 new jail beds across the state. Recently, funding programs have emphasized more space for rehabilitation rather than added capacity through new jail beds. While these programs have had delays, counties will receive much-needed space for medical, educational, and other services. This new jail space will be vital to counties that are trying to avoid overcrowding and lawsuits, while providing adequate services in a safe and secure environment.
The state also transfers state savings from Prop 47 to local grant programs, though there is no set funding amount from year to year. Specifically, Prop 47 required that any state savings from the measure be deposited in an account, the Safe Neighborhoods and Schools Fund. Funds from this account are used to reduce truancy and drop-outs in K–12 schools (25% of savings allocation), increase victim services (10%), and support mental health and substance use disorder treatment (65%). The first transfer to the fund will occur in the 2016–17 budget year. The California Department of Finance estimates Prop 47 reduced the state prison population by 5,247 in 2015–16, leading to a net allocation of almost $39.5 million. The current estimate for ongoing savings in future years is $62.6 million (Department of Finance 2016). Beyond the esti-mated savings of $39.5 million, the 2016–17 budget includes $28 million in additional one-time funding for Prop 47 programs.37
Bringing down the prison population enough to curtail the use of contract beds or close a state prison may be necessary to see notable reductions in costs.
PPIC.ORG 25
ConclusionsIn 2009, following decades of rising incarceration levels and corrections spending, California’s prisons were so overcrowded that a federal court ordered the state to lower the number of inmates. Since that time, California has embarked on a path—unmatched by any other state— of reducing incarceration and reforming its correctional system. The implementation of the state’s most significant reform, public safety realignment, will reach its five-year anniversary in October 2016. More recently, the passage of Prop 47 in 2014 triggered even more changes to the state’s prisons and jails. Below we consider current findings and implications for the future in four key areas.
IncarcerationThe prison population dropped substantially under realignment, and declined even further under Prop 47. These reforms and other measures succeeded in bringing the state’s prison population below the court-mandated target of 137.5 percent of design capacity. From January 2009 to June 2016, the prison population declined by about 41,600 inmates, and the state is currently 2,300 inmates below the target. Yet the prison population has recently started to grow, by almost 1,400 inmates between February and June 2016—perhaps indicating a shifting trend. The factors behind the increase are not fully understood; but if the increase continues, the state will again face challenges keeping the prison population below the mandated target.
County jails have had to adapt continually under realignment and Prop 47. Shifting incarceration of most non-serious, non-violent, non-sexual offenders from state prison to county jails increased the statewide jail population by about 10,000 inmates within the first year of realignment. This sudden growth led to crowding in many local systems and increased early releases due to capacity constraints. Prop 47 reversed this trend, returning the jail population to pre-realignment levels. However, realignment also transitioned jails from institutions that held individuals for relatively short periods to institutions that may hold sentenced offenders for many years. Accordingly, jails now have a greater need for medical and mental health beds, as well as rehabilitation and reentry programming and recreational space. In recent years, the state has made over $2.5 billion avail-able for county jail construction; but the many aging jail facilities still in operation may continue to challenge sheriffs’ ability to provide effective reentry programs. Research providing further insight into the changing jail populations and identifying incarceration strategies and programs that produce the best outcomes for inmates will be critical.
CrimeArguably, the most important lesson from realignment is that a significant reduction in incarcera-tion was achieved without a broad impact on public safety. In 2014, the most recent year with comprehensive data available, crime rates were at lows not seen since the 1960s. The additional 18,000 offenders on the street as a result of realignment did not lead to an increase in violent crime. The only impact on public safety that years of research can detect is an increase in auto thefts, by about 60 per 100,000 residents in 2014. We find that both violent and property crime rates increased in California in 2015, but data are not yet available to allow us to conclusively

26 CALIFORNIA'S HISTORIC CORRECTIONS REFORMS
determine whether this increase is part of a larger national trend or specific to California. Keeping a close eye on crime rates, as well as the impact of Prop 47 on the incarcerated population and public safety, is imperative.
Despite historically low crime rates, the 2015 uptick in crime highlights the need to identify and implement cost-effective crime prevention strategies. Evidence suggests that at pre-realignment levels, incarceration was not cost effective, with an additional dollar spent on incarceration generating only 23 cents in crime savings. Cost-effective strategies may focus on various aspects of crime reduction, including deterrence, prevention, and rehabilitation. Promising approaches include increased policing, early childhood programs, targeted interventions for high-risk youth, cognitive behavioral therapy, and alternative systems of managing probationers and parolees.
RecidivismThe state has yet to achieve the long-term goal of lowering its high rates of recidivism. But it did make one significant advance: realignment effectively reduced the costly practice of returning offenders to state prison for parole violations. The two-year return-to-prison rate declined from 55 percent to 16.5 percent. However, when we examine statewide rearrest and reconviction rates, we do not see evidence of reduced reoffending. Sixty-nine percent of offenders released from state prison are rearrested within two years, similar to pre-realignment levels. Also, while the two-year reconviction rate of 42 percent is about 5 percentage points higher than pre-realignment levels, this higher rate may be due to the prosecution of offenses that in the past would have been processed administratively, rather than increased reoffending. Indeed, it is noteworthy that reof-fending rates have been maintained with less reliance on incarceration as a supervision sanctioning tool. Neverthe-less, the lack of improvement in recidivism overall points toward the need for more effective reentry treatment and programming.
County probation departments are supervising an offender population (the PRCS population) that is at higher risk of reoffending, compared to the offender population supervised by state parole. Recidivism rates for the PRCS population also vary substantially across counties. While many factors could be driving this variation, coun-ties’ strategic choices in allocating realignment funds are associated with recidivism outcomes. Specifically, offenders released to counties that allocated large shares of their realignment budgets toward reentry had lower rates of recidivism. While research to date suggests county approaches matter, more in-depth research is on the horizon through the BSCC–PPIC Multi-County Study, which will bring together state and county data to evaluate recidivism outcomes and identify effective recidivism-reduction interventions under realignment. The study will also allow for an examination of the effects of Prop 47 on recidivism.
The lack of overall improvement in recidivism points toward the need for more effective reentry programming.
PPIC.ORG 27
SpendingThe state has not seen significant budgetary savings since realignment and continues to grapple with the challenges of a large and expensive corrections system. The state’s General Fund correc-tions spending is $10.6 billion, 9 percent more than the $9.7 billion spent in 2010–11, the last year before realignment. Realignment payments to the counties account for about an additional $1.3 billion in corrections spending. Continued increases in costs associated with employee pay and retirement, health care, deferred maintenance, and population growth will put pressure on the state’s prisons and corrections budget over the long term. The state has also invested significant resources in prisons to improve the overall delivery of health care for inmates, including a new prison specifically for medical and mental health needs. In spite of these efforts, as of June 2016, the federal receiver has turned over management of prison health care to the state at only four of California’s 34 prisons. Regaining control of health care at its prisons is a top priority for the state, and could help to reduce costs.
Given the cost structure of the prison system, it seems unlikely that significant corrections savings will be achieved without decreasing the prison population enough to allow for the closure of a state-run prison. Closing a prison would save the state hundreds of millions of dollars each year in staffing and upkeep. Alternatively, reduced use of contract beds could also yield significant cost savings.
Looking ForwardDespite drastically lowering incarceration, California still houses roughly 200,000 inmates and spends at historically high levels on corrections —nearly $12 billion in 2016–17. Identifying cost-effective strategies to reduce crime and recidivism will be critical as the state and counties address continued challenges from this massive correctional system. The BSCC–PPIC Multi-County Study is a significant step forward in this effort and will help identify effective strategies, keeping in mind local context and the extent to which efforts can be expanded and replicated. These interventions will be key to achieving reductions in recidivism and, as a result, lowering the size of our state correctional population.

28 CALIFORNIA'S HISTORIC CORRECTIONS REFORMS
NOTES1 Examples of “tough on crime” policies include determinate sentencing, increased mandatory minimum sentences and sentence enhancements, three strikes, and the war on drugs.
2 Coleman v. Brown (originally filed in 1990) and Plata v. Brown (originally filed in 2001) played central roles. The lawsuits led federal courts to appoint a special master and a receiver. The special master is the court-appointed monitor for mental health care in California’s state prisons. The receiver is the court-appointed official in charge of medical care in California’s state prisons. The special master does not make day-to-day decisions regarding the operations of mental health care, but submits oversight reports to the court regarding compliance with the court’s rulings. However, the receiver has complete control over day-to-day decisions regarding the operations of medical care in prison. Over time, the receiver will give back control of individual medical facilities to CDCR when the receiver believes the facilities are able to provide adequate care. The receiver is also required to submit regular reports to the court regarding improvements in medical care.
3 December 2015 is the most recent date for which statewide data on jails are available.
4 The post-realignment drop in the prison population may understate the reform’s impact somewhat, as CDCR pre-realignment projections predicted an increase in the prison population from 161,546 in June 2011 to 164,262 in June 2015. Using the difference between the actual June 2015 population number, 128,898, and the projected one of 164,262, an alternative estimate of realignment’s impact on the prison population is 35,364. This estimate, however, likely overstates the impact somewhat as it does not account for the effects of Proposition 36, which passed in 2012.
5 Through negotiations with the federal court, the deadline to reach the mandated target was later extended to February 2016.
6 As of March 2015, this measure had led to the release of about 2,050 prison inmates.
7 These measures include increased credit earning for “second strikers” and minimum custody inmates, as well as early parole for “second strikers,” those with severe medical conditions, and elderly inmates.
8 In addition to the 34 CDCR facilities, about 10,600 inmates are housed in in-state and out-of-state contract beds. Out-of-state, private contract beds are located in Arizona and Mississippi. In-state contract beds are in a mix of public and private facilities.
9 October 1995 is the earliest month available from the Jail Profile Survey portal on the BSCC website.
10 The following counties are participating in this study: Alameda, Contra Costa, Fresno, Humboldt, Kern, Los Angeles, Orange, Sacramento, San Bernardino, San Francisco, Shasta, and Stanislaus.
11 Crimes against persons include crimes that directly harm or threaten harm to a person. Many crimes against persons are violent crimes, such as assault, rape, or murder. Other crimes against persons may be non-violent, such as harassment or stalking.
12 In the first two months following implementation, over 53,000 individuals statewide who had been convicted of Prop 47 offenses applied for sentence reductions (Judicial Council of California 2016). Two other factors also played an important role. First, fewer individuals were booked into jail for Prop 47 offenses following implemen-tation, and those booked after implementation were more likely to receive pretrial release. Second, length of stay declined for those released after serving sentences for Prop 47 offenses.
13 It should be noted that crime data analyses are limited to the violent crimes (homicide, rape, robbery, and aggra-vated assault) and property crimes (burglary, motor vehicle theft, and larceny theft) included in the FBI’s Uniform Crime Report. These data, for example, do not include drug crimes, offenses which were targeted by both realign-ment and Prop 47.
14 To examine whether changes in property crime can credibly be attributed to realignment, we extend the Lof-strom and Raphael (2013b and 2015) analysis to include the 2014 crime data. As in the previous reports, we use a data-driven matching strategy to identify a combination of states that had very similar crime trends to California prior to realignment (that is, we use the so-called synthetic control method). The post-realignment crime trends of the matched group of states best represent what the crime rates would have been in California had the state not implemented realignment. For more details about the application of the synthetic control method in this context, see the Technical Appendix of Lofstrom and Raphael (2013b).
PPIC.ORG 29
15 To test whether the differences between California and the matched comparison states are statistically signifi-cant, we re-run the matching process for each of the other states to generate their own set of matched states and then compare the observed post-realignment differences to the pre-realignment-year differences. A ranking of the magnitude of the estimated changes tells us whether California’s changes stand out and provides the basis for statistical significance. We would conclude that California’s post-realignment change is statistically significant at the commonly used 5 percent significance level if it ranks first or second. At a 10 percent significance level, the change needs to be ranked fourth or higher. California’s post-realignment change in the violent crime rate ranks no higher than 14th when we simulate a policy change in all other states.
16 Since 2015 FBI crime data for all other states are currently unavailable, we cannot implement an analysis directly addressing the question of whether California’s most recent major criminal justice reform, Prop 47, has affected public safety and crime rates.
17 Since 2014, the definition now includes both male and female victims as well as additional forms of sexual penetration.
18 Note that these data, the FBI’s Uniform Crime Reporting Statistics preliminary semiannual data, are both limited and preliminary. They cover only January through June 2015 and are limited to cities with populations of at least 100,000 that report crime data to the FBI.
19 This uncertainty is best addressed when the FBI releases the complete 2015 Uniform Crime Report numbers for all states.
20 For a more complete performance assessment—beyond the scope of this report—we also need measures of the types of crimes for which and the frequency with which released offenders are observed to be arrested and sanc-tioned, including parole violations, misdemeanors, and felonies (possibly further disaggregated by severity of the crime), measured at various times since release.
21 The only recidivism rate that is higher for PRCS offenders at a statistically significant level is the one-year con-viction rate, by 1.7 percentage points, or one-fifth of the unadjusted difference of 8.2 percentage points.
22 These partnerships were formed to facilitate cross-agency coordination planning to determine what strategic approach the county would take and how it would allocate new funds under realignment. CCPs are headed by the county probation chief and include representation from the sheriff’s department, the district attorney’s office, the public defender’s office, the courts, and public health and welfare agencies.
23 This categorization is based on first-year realignment plans, as counties were only required to submit plans to the state for the first year and plans were not consistently submitted after that point. Therefore, this analysis would not capture changes counties made to their strategic approach after the first year.
24 Although Alpine County was classified among the 19 enforcement-focused counties, the county received no PRCS releases in the year following realignment and, therefore, was later excluded from the analysis. The 15 counties with reentry allocations that were between 100 percent and 200 percent of their enforcement allocations were classified as neutral in orientation because these counties do not represent one extreme or the other. Offenders released to these relatively neutral counties were not included in the analysis.
25 See technical appendix Table A2 for more detailed information on offender characteristics.
26 Overall rearrest rates include both misdemeanor and felony rearrests.
27 See technical appendix Table A3 for full results of felony arrest and conviction analysis.
28 See technical appendix Table A4 for full results of overall arrest and conviction analysis.
29 As a sensitivity check, we examine whether crime rates are higher in the counties classified as high-enforcement. We find that 2011 property crime rates were slightly higher in enforcement-focused counties than in reentry-focused counties (2,402 vs. 2,306 per 100,000 residents), while violent crime rates were slightly lower in the enforcement-focused group (328 vs. 375 per 100,000 residents). There does not appear to be a clear relationship between crime rates and county realignment strategies; however, it is possible that there are other factors that influenced both county strategy and recidivism outcomes that we have not captured in this analysis.
30 When referring to General Fund expenditures we are only talking about the amount of money the state spends on the state prison system. Local corrections systems, like county and city jails, mostly use local funds, with some limited funding coming from the state (i.e., realignment dollars).
30 CALIFORNIA'S HISTORIC CORRECTIONS REFORMS
31 The General Fund expenditures come from Chart C-1, available on the California Department of Finance website. This chart gives historical program expenditures by fund. These expenditure amounts come from the January 2016 publication, thus, the 2016–17 estimate may not reflect the final approved budget amount.
32 Budgetary increases since the original 2012 report include: $835 million as a result of higher employee compen-sation and retirement costs; an increase of $250 million for contracted capacity to continue to meet the court-ordered population cap; $289 million in yearly operating costs to operate the California Health Care Facility; and an additional $170 million a year in lease-revenue payments. These numbers are for the 2016–17 budget and might not reflect totals for years into the future.
33 For more background on the federal medical receivership, see Footnote 2.
34 The four facilities include Folsom (July 2015), Correctional Training Facility (March 2016), Chuckawalla Valley (May 2016), and California Correctional Institute (June 2016). The most recent receiver report can be found on the California Correctional Health Care Services website. The inspector general’s medical inspection reports can be found on the Office of the Inspector General website.
35 The formula, created by the California State Association of Counties, is based on a number of realignment workload and county-level factors, and includes both a base and growth allocation.
36 All jail construction programs are funded by the use of lease-revenue bonds. Such bonds do not need to be approved by voters, like general obligation bonds. The state public works board sells the bonds to pay for the new jail construction and CDCR or BSCC pays yearly payments, or leases, from their budgets to the state public works board.
37 Specifically, the 2016–17 budget includes $18 million for school truancy and dropout prevention, and $10 million for recidivism-reduction programs.
PPIC.ORG 31
REFERENCES
Bird, Mia, and Ryken Grattet. 2014. Do Local Realignment Policies Affect Recidivism in California? Public Policy Institute of California.
Bird, Mia, and Joe Hayes. 2013. Funding Public Safety Realignment. Public Policy Institute of California.
Bird, Mia, Sonya Tafoya, Ryken Grattet and Viet Nguyen. 2016. How Has Proposition 47 Affected California’s Jail Population? Public Policy Institute of California.
California Department of Corrections and Rehabilitation. 2012. The Future of California Corrections: A Blue-print to Save Billions of Dollars, End Federal Oversight, and Improve the Prison System.
California Department of Corrections and Rehabilitation. 2013. An Examination of Offenders Released from State Prison in the First Year of Public Safety Realignment. CDCR, December.
California Department of Corrections and Rehabilitation. 2014. 2013 Outcome Evaluation Report. CDCR, January.
California Department of Corrections and Rehabilitation. 2016. An Update to the Future of California Corrections. CDCR, January.
California Department of Finance. 2016. “Governor’s May Revision 2016–17.”
Grattet, Ryken, and Joe Hayes. 2013. “California’s Changing Parole Population.” Just the Facts (August). Public Policy Institute of California.
Grattet, Ryken, Joan Petersilia, and Jeffrey Lin. 2008. Parole Violations and Revocations in California. Final Report to the National Institute of Justice.
Grattet, Ryken, Sonya Tafoya, Mia Bird, and Viet Nguyen. 2016. California’s County Jails in the Era of Reform. Public Policy Institute of California.
Judicial Council of California. 2016. “Proposition 47 Data Summary Report.” Judicial Council of California, June.
Legislative Analyst’s Office. 2014. “Administration’s Response to Prison Overcrowding Order.” Legislative Analyst’s Office, February 28.
Lin, Jeff, and Joan Petersillia. 2013. “Follow the Money: How California Counties Are Spending Their Public Safety Realignment Funds.” Stanford Criminal Justice Center.
Liedke, Raymond, Anne Morrison Piehl, and Bert Useem. 2006. “The Crime Control Effect of Incarceration: Does Scale Matter?” Criminology and Public Policy 5 (2): 245–275.
Lofstrom, Magnus, and Brandon Martin. 2015. Public Safety Realignment: Impacts So Far. Public Policy Institute of California.
Lofstrom, Magnus, and Steven Raphael. 2013a. Impact of Realignment on County Jail Populations. Public Policy Institute of California.
Lofstrom, Magnus, and Steven Raphael. 2013b. Public Safety Realignment and Crime Rates in California. Public Policy Institute of California.
Lofstrom, Magnus, and Steven Raphael. 2015. Realignment, Incarceration, and Crime Trends in California. Public Policy Institute of California.
Lofstrom, Magnus, Steven Raphael, and Ryken Grattet. 2014. Is Public Safety Realignment Reducing Recidivism in California? Public Policy Institute of California.
Martin, Brandon, and Magnus Lofstrom. 2014. Key Factors in California’s Jail Construction Needs. Public Policy Institute of California.
Pew Center on the States. 2011. State of Recidivism: The Revolving Door of America’s Prisons. The Pew Charitable Trusts, April.

32 CALIFORNIA'S HISTORIC CORRECTIONS REFORMS
ABOUT THE AUTHORS
Magnus Lofstrom is a senior research fellow at the Public Policy Institute of California. His areas of expertise include public safety, immigration, entre-preneurship, and education. His recent work examines crime trends in California, public safety realignment and recidivism, and California’s jail capacity and construction needs. He also holds appointments as research fellow at the Institute for the Study of Labor (IZA), Germany, community scholar at the Julian Samora Research Institute at Michigan State University, and research associate at the Center for Comparative Immigration Studies at the University of California, San Diego. He serves on the editorial board of Industrial Relations and was a member of California controller John Chi-ang’s Council of Economic Advisors. Prior to joining PPIC, he was an assistant professor of economics at the University of Texas at Dallas. He received his PhD in economics from the University of California, San Diego.
Mia Bird is a research fellow in the areas of corrections and health and human services at the Public Policy Institute of California. She currently leads projects focused on how two major changes in California policy—Public Safety Realignment and the implementation of the Affordable Care Act—affect recidivism outcomes for the criminal justice population. Her past work has covered topics such as the allocation of realignment funding, the enroll-ment of correctional populations in health insurance, and the use of data to improve policymaking. She also serves on the faculty of the Goldman School of Public Policy. Her academic work focuses on the relationship between family formation, family life, and public policy. She holds a PhD in public policy, an MA in demography, and an MPP from the University of California, Berkeley.
Brandon Martin is a research associate at the Public Policy Institute of California. He studies corrections and public safety, with recent work examining the need for jail construction in California and the changes in state and local correctional populations. He has previous research experience in the area of legislative committees, including legislative and oversight responsibilities and the electoral considerations of committee assignments. He holds an MA in political science from the University of California, Davis, and a BA in political science from Michigan State University.
PPIC.ORG 33
ACKNOWLEDGMENTS
This report benefited from valuable feedback from our external reviewers, Aaron Edwards and Emma Hughes. We also appreciate very helpful com-ments from our internal reviewers, Ryken Grattet and Shannon McConville; insights from our director of government affairs, Deborah Gonzalez; and editorial support from Vicki Hsieh and Lynette Ubois. This work would not be possible without data provided by the California Department of Correc-tions and Rehabilitation and the California Department of Justice. This report also draws on findings from previous studies using county-level data provided by sheriffs. This kind of sustained support for research among California’s justice agencies enables efforts to investigate the effects of major criminal justice reforms and to identify promising practices for the future.

MAS MASUMOTO, CHAIR
Author and Farmer
MARK BALDASSARE
President and CEOPublic Policy Institute of California
RUBE N BARR ALES
President and CEOGROW Elect
MARÍA B L ANCO
Executive DirectorUndocumented Student Legal Services CenterUniversity of California Office of the President
LOUISE HE NRY BRYSON
Chair Emerita, Board of TrusteesJ. Paul Getty Trust
A . MARISA CHUN
PartnerMcDermott Will & Emery LLP
CHET HE WIT T
President and CEO Sierra Health Foundation
PHI L ISE NBE RG
Former Chair Delta Stewardship Council
DONNA LUCAS
Chief Executive OfficerLucas Public Affairs
STE VE N A . ME RKSAME R
Senior PartnerNielsen, Merksamer, Parrinello, Gross & Leoni, LLP
G E R ALD L . PARSK Y
ChairmanAurora Capital Group
KIM POLESE
ChairmanClearStreet, Inc.
GADDI H . VASQUEZ
Senior Vice President, Government AffairsEdison InternationalSouthern California Edison
BOARD OF DIRECTORS
Public Policy Institute of California 500 Washington Street, Suite 600 San Francisco, CA 94111 T 415.291.4400 F 415.291.4401PPIC.ORG
PPIC Sacramento Center Senator Office Building 1121 L Street, Suite 801 Sacramento, CA 95814 T 916.440.1120 F 916.440.1121
The Public Policy Institute of California is dedicated to informing and improving public policy in California through independent, objective, nonpartisan research.