Embed Size (px)
Citation preview

Gray Davis, GovernorState of California
Grantland Johnson, Secretary
California Health and Human Services Agency
Diana M. Bontá, R.N., Dr.P.H., Director California Department of Health Services
California Department of Health Services
March 2003
Chlamydia Screening in Women and
Data Validation Study
Medi-Cal Managed Care Health Plans

CChhllaammyyddiiaa SSccrreeeenniinngg iinn WWoommeenn aanndd DDaattaa VVaalliiddaattiioonn SSttuuddyy March 2003 PPaaggee ii California Department of Health Services Medi-Cal Managed Care Division Health Services Advisory Group, Inc.
TABLE OF CONTENTS
Executive Summary .............................................................................................................. 1
I. Background and Purpose ................................................................................................... 3
II. Chlamydia Screening Rates ............................................................................................... 5
III. Validation Results .............................................................................................................. 10
IV. Discussions, Conclusions, and Recommendations ............................................................ 13 Appendices
• Appendix A – Medi-Cal Managed Care Model Types.......................................... A-1 • Appendix B – Methodology....................................................................................B-1
• Appendix C – Technical Considerations for Chlamydia Screening in Women .....C-1
• Appendix D – HEDIS 2000 Technical Specifications........................................... D-1
• Appendix E – Chlamydia Screening Tool and Instructions....................................E-1

CChhllaammyyddiiaa SSccrreeeenniinngg iinn WWoommeenn aanndd DDaattaa VVaalliiddaattiioonn SSttuuddyy March 2003 PPaaggee 11 California Department of Health Services Medi-Cal Managed Care Division Health Services Advisory Group, Inc.
HEDIS® is a registered trademark of the National Committee for Quality Assurance (NCQA).
EXECUTIVE SUMMARY
This report provides results of a study of chlamydia screening in women by Medi-Cal managed care health plans in 2000. The study, which was conducted by Health Services Advisory Group, Inc. (HSAG), also includes validation of the data used to calculate the screening rates. Chlamydia trachomatis is a commonly reported sexually transmitted disease. In California, it affects an estimated 5 percent to 10 percent of young women between the ages of 16 and 20. If left untreated, the disease can eventually result in severe complications and higher treatment costs. As part of the overall quality improvement program for the Medi-Cal managed care program, all Medi-Cal managed care health plans participate in a statewide Quality Improvement Collaborative Initiative (QICI) addressing a common topic. The QICI topic is jointly selected by the California Department of Health Services (DHS) and the participating managed care health plans. The health plans must use a standardized methodology in performing and reporting the selected measure, allowing comparison among health plans and at the aggregate level. After collecting and reporting on the baseline results, the health plans and DHS work collaboratively to design and implement interventions to improve baseline results. A remeasurement is generally performed in the third year of the QICI and further activity is determined by the results of remeasurement. The Health Plan Employer Data and Information Set (HEDIS®) measure, Chlamydia Screening in Women, was chosen as the QICI topic for two reasons. First, chlamydia is the most common sexually transmitted disease in the United States. According to the national Centers for Disease Control and Prevention (CDC), chlamydia affects an estimated three million people each year. Complications associated with chlamydia include pelvic inflammatory disease, infertility, and ectopic pregnancy, with related costs estimated at more than $2 billion annually.1 Screening for chlamydia for all female health plan members 16 to 26 years of age is mandated to prevent, diagnose, and treat chlamydia to avoid these complications and related costs of the disease. Second, this measure was selected for this study because it requires measurement by administrative data only (billing and encounter data) and provides the opportunity to validate administrative data across claims, encounters, laboratory data, and pharmacy data. The aggregate baseline Medi-Cal managed care chlamydia screening rate was 27 percent. Individual health plan rates ranged from a low of 6 percent to a high of nearly 60 percent (59.9). Although the aggregate Medi-Cal managed care rate was lower than the NCQA 2000 national Medicaid average of 31.4 percent, 14 individual health plans (48.3 percent) had chlamydia screening rates above 31.4 percent. The aggregate Medi-Cal managed care rates of 27.6 percent for women in the 16- to 20-year-old age group, and 26.7 percent for women in the 21- to 26-year-old group were well above the NCQA national commercial plan averages of 18.5 percent and 16.0 percent, respectively.
1 CDC—Centers for Disease Control and Prevention, National Center for HIV, STD and TB Prevention, Division of Sexually Transmitted Diseases. “Chlamydia in the United States.” April 2001. http://www.cdc.gov/nchstp/dstd/Fact_Sheets/chlamydia_facts.htm.
CChhllaammyyddiiaa SSccrreeeenniinngg iinn WWoommeenn aanndd DDaattaa VVaalliiddaattiioonn SSttuuddyy March 2003 PPaaggee 22 California Department of Health Services Medi-Cal Managed Care Division Health Services Advisory Group, Inc.
Although the chlamydia screening rates were higher for the Medi-Cal managed care plans compared with commercial health plans, nearly three out of every four (73.0 percent) eligible women in the Medi-Cal managed care plans did not receive chlamydia screening. This indicates the need for improving chlamydia screening and encounter data submission in the Medi-Cal managed care plans. The validation of the claims and/or encounter data showed that more than 90.0 percent of the data were accurate and documented within the medical record. Several health plans proved to have less than reliable processes to assure accuracy in the reported rate. Additionally, nine other health plans had difficulty in obtaining the medical records from their providers for validation. Some health plans that subcontract services to other health plans did not have adequate oversight of the delegated services, nor did they receive all of the needed data for the measure. One health plan had difficulty in how it captured the data administratively and needed to merge several databases to obtain the date of service with the actual laboratory screening. Several health plans reported difficulties in obtaining medical records from out-of-plan (or non-contracted) providers, closed clinics, and providers who could not be located. Federal law permits health plan members to seek family planning services outside of their managed care plan. Several out-of-plan providers refused to release medical records due to confidentiality concerns. Although some Medi-Cal managed care health plans performed well above national averages for chlamydia screening, there is still significant opportunity for improvement. The wide range between the lowest and highest scoring health plans suggest that sharing “best practices” might prove beneficial. Provider and member education are effective approaches to improving chlamydia screening rates; routine screening for all pregnant women may also have a positive impact with minimal additional effort from the health plans. Improvements in data collection and information systems are also likely to trigger improvements in the reported rates. Collaborative discussion among the health plans and DHS have already begun with the goal to produce quality improvement practices to specifically target the at-risk population for improved screening. Clinical practice guidelines have been completed in a collaborative effort of the Medi-Cal Managed Care Division (MMCD), the Sexually Transmitted Disease (STD) Branch, and the California Chlamydia Action Coalition. Health plans are also implementing a variety of quality improvement efforts to increase chlamydia screening rates, including guideline dissemination, provider education and feedback, and financial incentives for providers.
CChhllaammyyddiiaa SSccrreeeenniinngg iinn WWoommeenn aanndd DDaattaa VVaalliiddaattiioonn SSttuuddyy March 2003 PPaaggee 33 California Department of Health Services Medi-Cal Managed Care Division Health Services Advisory Group, Inc.
I. Background and Purpose The QICI was developed as a mechanism for health plans and DHS to work collaboratively to improve the quality of care for Medi-Cal managed care members, using standardized measures to allow for comparison among health plans. The Chlamydia Screening in Women measure was chosen from HEDIS, a set of standardized performance measures developed by NCQA, to allow for reliable comparisons of managed care organizations’ performance. The Chlamydia Screening in Women measure was chosen for the QICI study for several reasons:
• Chlamydia trachomatis is the most commonly reported sexually transmitted disease in California.2 In 1999, 7.2 percent of women aged 15 to 24 years tested in family planning clinics in California tested positive for chlamydia.3 Because these young women and their partners usually are asymptomatic, the chlamydia infection goes undetected if routine screening tests are not performed. Left untreated, chlamydia infections in young women can cause infertility and severe health complications, such as tubal pregnancies, pelvic infections, and chronic pelvic pain.4 Chlamydia increases the rate of abnormal Pap smears and the risk of transmission of the HIV virus. In addition, undetected chlamydia infections in pregnant women may be transmitted to the fetus, causing conjunctivitis and pneumonia.
• Treatment of complications from chlamydia requires costly medical interventions,
hospitalization, complex diagnostic tests, and surgeries. The CDC has estimated that costs to treat complications resulting from chlamydia are more than $2 billion each year.5
• Screening for chlamydia can be done with a urine test.
• Treatment is simple, convenient, and inexpensive.
HSAG, the External Quality Review Organization (EQRO), contracted by DHS, conducted the study during the annual on-site NCQA HEDIS Compliance AuditsTM of the health plans. This report provides audited results of the Chlamydia Screening in Women measure for each health plan, along with comparative national averages. It should be noted that this was a new HEDIS measure nationally. Rates are usually low for first-year measures as health plans experience “learning curves.” Following NCQA methodology, rates for new measures are not
2 http://www.ucsf.edu/castd/std_statistics.html#chlam_facts. 3 http://www.cdc.gov/nchstp/dstd/Stats_Trends/Trends2000.pdf. 4 CDC—Centers for Disease Control and Prevention, National Center for HIV, STD and TB Prevention, Division of Sexually Transmitted Diseases. “Chlamydia in the United States.” April 2001:1. http://www.cdc.gov/nchstp/dstd/Fact_Sheets/chlamydia_facts.htm. 5 Ibid, 2.
NCQA HEDIS® Compliance AuditTM is a trademark of National Committee for Quality Assurance (NCQA).

CChhllaammyyddiiaa SSccrreeeenniinngg iinn WWoommeenn aanndd DDaattaa VVaalliiddaattiioonn SSttuuddyy March 2003 PPaaggee 44 California Department of Health Services Medi-Cal Managed Care Division Health Services Advisory Group, Inc.
reported publicly at the health plan level for the first year. The reasons for not reporting the individual rates are: 1) to allow for refinement of the measure by NCQA if needed, and 2) to encourage health plans to perform the measure. In addition to providing the chlamydia screening rates for 2000, this report provides results of a data validation study. While examining the chlamydia screening rates, HSAG also determined if the diagnosis and/or procedure code submitted on the billing form (i.e., claim or encounter) accurately reflected the documentation in the medical record. The methodology for reporting the chlamydia screening rates and conducting the data validation study can be found in Appendix B.
CChhllaammyyddiiaa SSccrreeeenniinngg iinn WWoommeenn aanndd DDaattaa VVaalliiddaattiioonn SSttuuddyy March 2003 PPaaggee 55 California Department of Health Services Medi-Cal Managed Care Division Health Services Advisory Group, Inc.
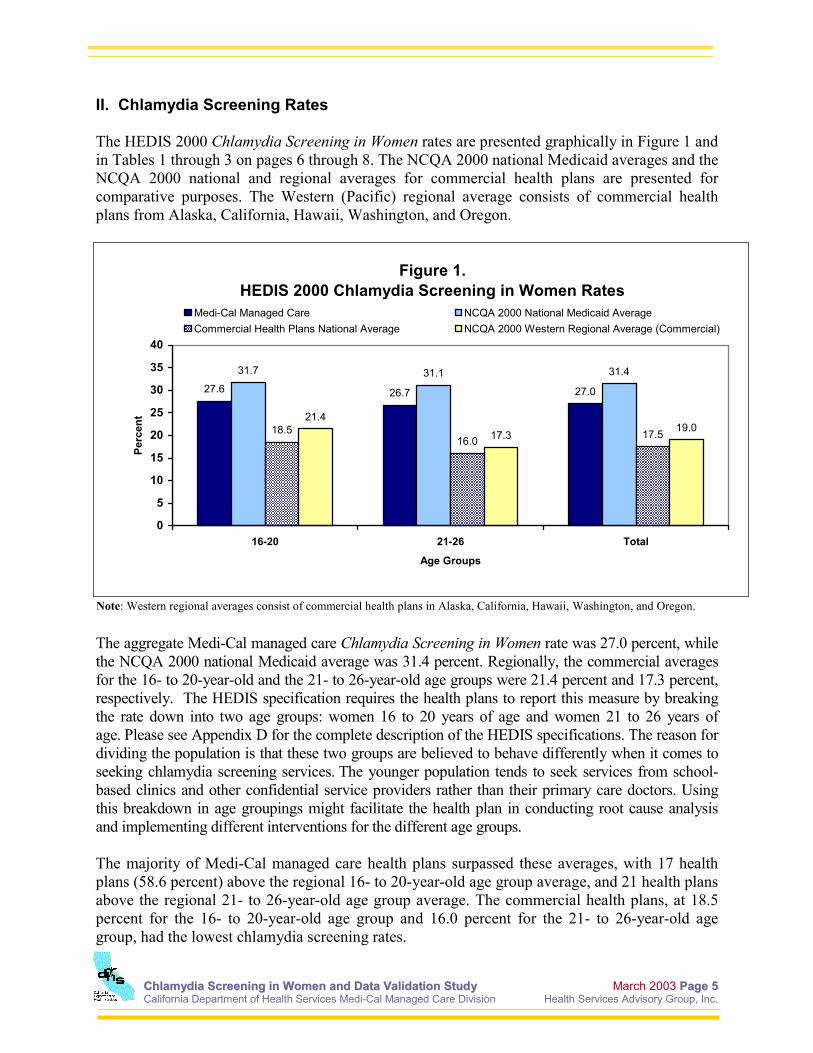
II. Chlamydia Screening Rates The HEDIS 2000 Chlamydia Screening in Women rates are presented graphically in Figure 1 and in Tables 1 through 3 on pages 6 through 8. The NCQA 2000 national Medicaid averages and the NCQA 2000 national and regional averages for commercial health plans are presented for comparative purposes. The Western (Pacific) regional average consists of commercial health plans from Alaska, California, Hawaii, Washington, and Oregon.
Figure 1. HEDIS 2000 Chlamydia Screening in Women Rates
27.6 26.7 27.0
31.7 31.1 31.4
18.516.0 17.5
21.4
17.319.0
0
5
10
15
20
25
30
35
40
16-20 21-26 Total
Age Groups
Perc
ent
Medi-Cal Managed Care NCQA 2000 National Medicaid AverageCommercial Health Plans National Average NCQA 2000 Western Regional Average (Commercial)
The aggregate Medi-Cal managed care Chlamydia Screening in Women rate was 27.0 percent, while the NCQA 2000 national Medicaid average was 31.4 percent. Regionally, the commercial averages for the 16- to 20-year-old and the 21- to 26-year-old age groups were 21.4 percent and 17.3 percent, respectively. The HEDIS specification requires the health plans to report this measure by breaking the rate down into two age groups: women 16 to 20 years of age and women 21 to 26 years of age. Please see Appendix D for the complete description of the HEDIS specifications. The reason for dividing the population is that these two groups are believed to behave differently when it comes to seeking chlamydia screening services. The younger population tends to seek services from school-based clinics and other confidential service providers rather than their primary care doctors. Using this breakdown in age groupings might facilitate the health plan in conducting root cause analysis and implementing different interventions for the different age groups. The majority of Medi-Cal managed care health plans surpassed these averages, with 17 health plans (58.6 percent) above the regional 16- to 20-year-old age group average, and 21 health plans above the regional 21- to 26-year-old age group average. The commercial health plans, at 18.5 percent for the 16- to 20-year-old age group and 16.0 percent for the 21- to 26-year-old age group, had the lowest chlamydia screening rates.
Note: Western regional averages consist of commercial health plans in Alaska, California, Hawaii, Washington, and Oregon.
CChhllaammyyddiiaa SSccrreeeenniinngg iinn WWoommeenn aanndd DDaattaa VVaalliiddaattiioonn SSttuuddyy March 2003 PPaaggee 66 California Department of Health Services Medi-Cal Managed Care Division Health Services Advisory Group, Inc.
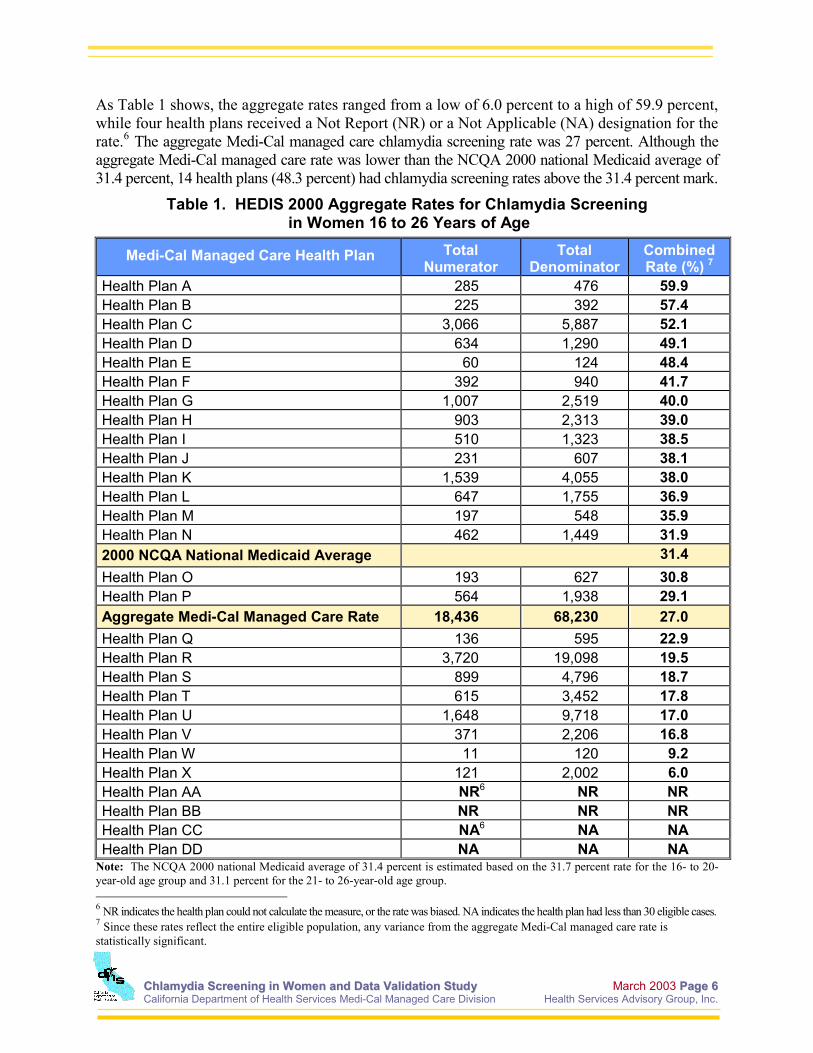
As Table 1 shows, the aggregate rates ranged from a low of 6.0 percent to a high of 59.9 percent, while four health plans received a Not Report (NR) or a Not Applicable (NA) designation for the rate.6 The aggregate Medi-Cal managed care chlamydia screening rate was 27 percent. Although the aggregate Medi-Cal managed care rate was lower than the NCQA 2000 national Medicaid average of 31.4 percent, 14 health plans (48.3 percent) had chlamydia screening rates above the 31.4 percent mark.
Table 1. HEDIS 2000 Aggregate Rates for Chlamydia Screening in Women 16 to 26 Years of Age
Medi-Cal Managed Care Health Plan Total Numerator
Total Denominator
Combined Rate (%) 7
Health Plan A 285 476 59.9 Health Plan B 225 392 57.4 Health Plan C 3,066 5,887 52.1 Health Plan D 634 1,290 49.1 Health Plan E 60 124 48.4 Health Plan F 392 940 41.7 Health Plan G 1,007 2,519 40.0 Health Plan H 903 2,313 39.0 Health Plan I 510 1,323 38.5 Health Plan J 231 607 38.1 Health Plan K 1,539 4,055 38.0 Health Plan L 647 1,755 36.9 Health Plan M 197 548 35.9 Health Plan N 462 1,449 31.9 2000 NCQA National Medicaid Average 31.4 Health Plan O 193 627 30.8 Health Plan P 564 1,938 29.1 Aggregate Medi-Cal Managed Care Rate 18,436 68,230 27.0 Health Plan Q 136 595 22.9 Health Plan R 3,720 19,098 19.5 Health Plan S 899 4,796 18.7 Health Plan T 615 3,452 17.8 Health Plan U 1,648 9,718 17.0 Health Plan V 371 2,206 16.8 Health Plan W 11 120 9.2 Health Plan X 121 2,002 6.0 Health Plan AA NR6 NR NR Health Plan BB NR NR NR Health Plan CC NA6 NA NA Health Plan DD NA NA NA
Note: The NCQA 2000 national Medicaid average of 31.4 percent is estimated based on the 31.7 percent rate for the 16- to 20-year-old age group and 31.1 percent for the 21- to 26-year-old age group. 6 NR indicates the health plan could not calculate the measure, or the rate was biased. NA indicates the health plan had less than 30 eligible cases. 7 Since these rates reflect the entire eligible population, any variance from the aggregate Medi-Cal managed care rate is statistically significant.

CChhllaammyyddiiaa SSccrreeeenniinngg iinn WWoommeenn aanndd DDaattaa VVaalliiddaattiioonn SSttuuddyy March 2003 PPaaggee 77 California Department of Health Services Medi-Cal Managed Care Division Health Services Advisory Group, Inc.
Table 2, below, shows the actual reported rates for Chlamydia Screening in Women 16 to 20 years of age. The aggregate Medi-Cal managed care chlamydia screening rate for this age group was 27.6 percent. Among commercial health plans, the NCQA 2000 national average for chlamydia screening for the 16- to 20-year-old age group was 18.5 percent, while the NCQA 2000 national average for Medicaid was considerably higher at 31.7 percent. Nineteen health plans (65.5 percent) had rates higher than the commercial health plan average. Fifteen health plans (51.7 percent) also had rates higher than the NCQA 2000 national Medicaid average.
Table 2. HEDIS 2000 Chlamydia Screening Rates in Women 16 to 20 Years of Age
Medi-Cal Managed Care Health Plan Numerator Denominator Reported Rate (%)
Health Plan A 152 224 67.9 Health Plan B 75 125 60.0 Health Plan D 280 539 51.9 Health Plan C 1,237 2,481 49.9 Health Plan E 31 64 48.4 Health Plan I 231 547 42.2 Health Plan G 332 792 41.9 Health Plan J 121 297 40.7 Health Plan H 409 1,038 39.4 Health Plan K 681 1,764 38.6 Health Plan F 139 363 38.3 Health Plan L 244 670 36.4 Health Plan M 100 284 35.2 Health Plan N 175 530 33.0 Health Plan O 87 264 33.0 NCQA 2000 National Medicaid Average 31.7 Health Plan P 269 901 29.9 Aggregate Medi-Cal Managed Care Rate 7,486 27,156 27.6 Health Plan Q 54 240 22.5 Health Plan R 1,383 7,156 19.3 Health Plan V 194 1,021 19.0 Health Plan S 333 1,809 18.4 Health Plan T 255 1,416 18.0 Health Plan U 635 3,633 17.5 Health Plan W 5 52 9.6 Health Plan X 64 946 6.8 Health Plan AA NR6 NR NR Health Plan BB NR NR NR Health Plan CC NA6 NA NA Health Plan DD NA NA NA

CChhllaammyyddiiaa SSccrreeeenniinngg iinn WWoommeenn aanndd DDaattaa VVaalliiddaattiioonn SSttuuddyy March 2003 PPaaggee 88 California Department of Health Services Medi-Cal Managed Care Division Health Services Advisory Group, Inc.
Table 3, below, shows the rates for women 21 to 26 years of age. The aggregate Medi-Cal managed care chlamydia screening rate for this age group was 26.7 percent. For this age group of women, the NCQA 2000 national average was 16.0 percent for commercial health plans and 31.1 percent for Medicaid health plans. Twenty-two health plans (75.9 percent) had rates higher than the commercial average. Fifteen health plans (51.7 percent) had rates higher than the NCQA 2000 national Medicaid average.
Table 3. HEDIS 2000 Chlamydia Screening in Women 21 to 26 Years of Age Rates
Medi-Cal Managed Care Health Plan Numerator Denominator Reported Rate (%)
Health Plan B 150 267 56.2 Health Plan C 1,829 3,406 53.7 Health Plan A 133 252 52.8 Health Plan E 29 60 48.3 Health Plan D 354 751 47.1 Health Plan F 253 577 43.8 Health Plan G 675 1,727 39.1 Health Plan H 494 1,275 38.7 Health Plan K 858 2,291 37.5 Health Plan L 403 1,085 37.1 Health Plan M 97 264 36.7 Health Plan I 279 776 36.0 Health Plan J 110 310 35.5 Health Plan DD 19 59 32.2 Health Plan N 287 919 31.2 NCQA 2000 National Medicaid Average 31.1 Health Plan O 106 363 29.2 Health Plan P 295 1,037 28.4 Aggregate Medi-Cal Managed Care Rate 10,969 41,133 26.7 Health Plan Q 82 355 23.1 Health Plan R 2,337 11,942 19.6 Health Plan S 566 2,987 18.9 Health Plan T 360 2,036 17.7 Health Plan U 1,013 6,085 16.6 Health Plan V 177 1,185 14.9 Health Plan W 6 68 8.8 Health Plan X 57 1,056 5.4 Health Plan AA NR6 NR NR Health Plan BB NR NR NR Health Plan CC NA6 NA NA

CChhllaammyyddiiaa SSccrreeeenniinngg iinn WWoommeenn aanndd DDaattaa VVaalliiddaattiioonn SSttuuddyy March 2003 PPaaggee 99 California Department of Health Services Medi-Cal Managed Care Division Health Services Advisory Group, Inc.
A comparison of chlamydia screening rates by health plan model type is shown in Figure 2. Please see Appendix A for a complete description of the health plan model types. The Geographic Managed Care (GMC) health plan model types (both GMC-North and GMC-South) registered the highest performance, with chlamydia screening rates of nearly 37 percent, or about 10 percentage points above the aggregate Medi-Cal managed care rate of 27.0 percent. Commercial Plans (CP) and County Organized Health Systems (COHS) were nearly equal at 30.2 percent and 29.2 percent, respectively.
Figure 2.HEDIS 2000 Combined Chlamydia Screening for Women 16 to 26
Years of Age by Managed Care Model Type
36.8 36.730.2 29.2 23.3
0
20
40
60
80
100
Perc
ent
Combined % 36.8 36.7 30.2 29.2 23.3
Denominator 2,552 5,093 15,605 7,640 37,340
GMC-North GMC-South CP COHS LI*
NCQA 2000 NationalMedicaid Average = 31.4%
Medi-Cal Managed Care
27.0
68,230
27.0
Note: The NCQA 2000 national Medicaid average of 31.4 percent is estimated based on the 31.7 percent rate for the 16- to 20-year-old age group and 31.1 percent for the 21- to 26-year-old age group. *The Local Initiatives (LI), at 23.3 percent, were below the aggregate Medi-Cal managed care average, andsignificantly (p-value < 0.05) below the other health plan model types.
CChhllaammyyddiiaa SSccrreeeenniinngg iinn WWoommeenn aanndd DDaattaa VVaalliiddaattiioonn SSttuuddyy March 2003 PPaaggee 1100 California Department of Health Services Medi-Cal Managed Care Division Health Services Advisory Group, Inc.
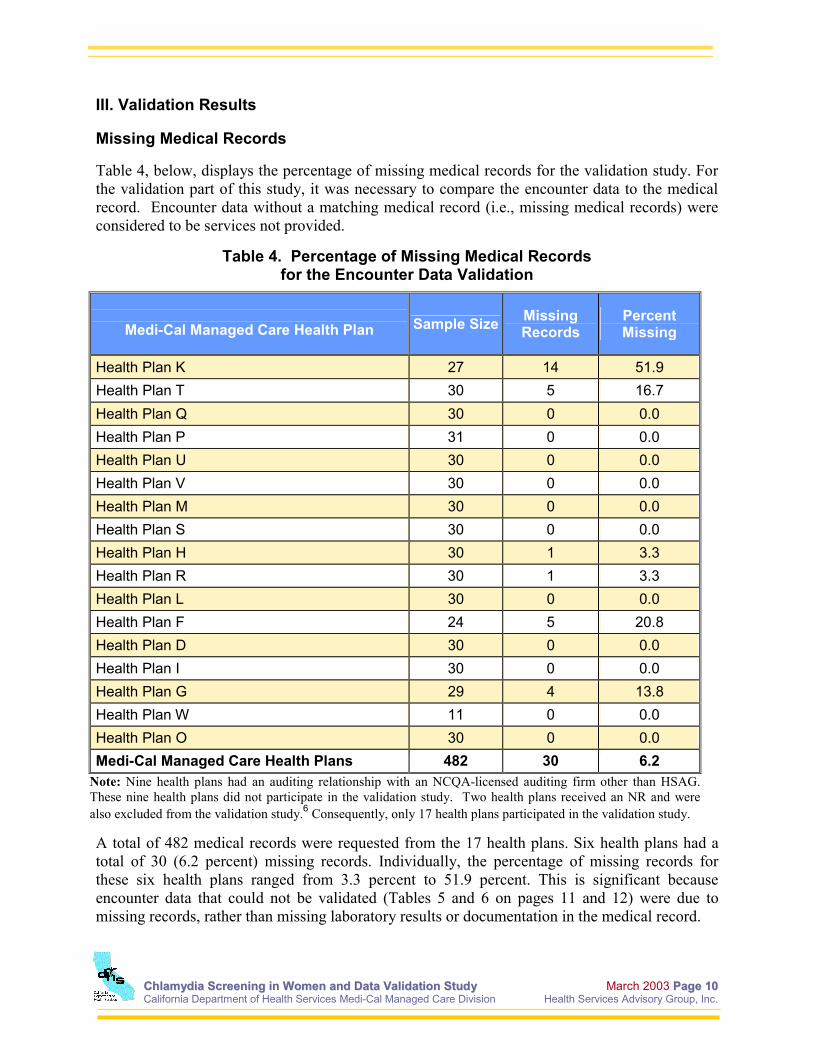
III. Validation Results Missing Medical Records Table 4, below, displays the percentage of missing medical records for the validation study. For the validation part of this study, it was necessary to compare the encounter data to the medical record. Encounter data without a matching medical record (i.e., missing medical records) were considered to be services not provided.
Table 4. Percentage of Missing Medical Records for the Encounter Data Validation
Medi-Cal Managed Care Health Plan Sample Size Missing
Records Percent Missing
Health Plan K 27 14 51.9 Health Plan T 30 5 16.7 Health Plan Q 30 0 0.0 Health Plan P 31 0 0.0 Health Plan U 30 0 0.0 Health Plan V 30 0 0.0 Health Plan M 30 0 0.0 Health Plan S 30 0 0.0 Health Plan H 30 1 3.3 Health Plan R 30 1 3.3 Health Plan L 30 0 0.0 Health Plan F 24 5 20.8 Health Plan D 30 0 0.0 Health Plan I 30 0 0.0 Health Plan G 29 4 13.8 Health Plan W 11 0 0.0 Health Plan O 30 0 0.0 Medi-Cal Managed Care Health Plans 482 30 6.2
Note: Nine health plans had an auditing relationship with an NCQA-licensed auditing firm other than HSAG. These nine health plans did not participate in the validation study. Two health plans received an NR and were also excluded from the validation study.6 Consequently, only 17 health plans participated in the validation study.
A total of 482 medical records were requested from the 17 health plans. Six health plans had a total of 30 (6.2 percent) missing records. Individually, the percentage of missing records for these six health plans ranged from 3.3 percent to 51.9 percent. This is significant because encounter data that could not be validated (Tables 5 and 6 on pages 11 and 12) were due to missing records, rather than missing laboratory results or documentation in the medical record.

CChhllaammyyddiiaa SSccrreeeenniinngg iinn WWoommeenn aanndd DDaattaa VVaalliiddaattiioonn SSttuuddyy March 2003 PPaaggee 1111 California Department of Health Services Medi-Cal Managed Care Division Health Services Advisory Group, Inc.
The results of the data validation portion of the study are presented in Table 5 and Table 6. As discussed, the determination of the accuracy between the medical record and the claim/encounter is referred to as the agreement rate. The agreement rate for this study was expected to be at least 90.0 percent or better, based on industry standards. Overall, medical record documentation supporting the denominator was high with a 94.0 percent agreement. Individually, 13 out of the 17 health plans had agreement rates above 95.0 percent. Denominators produced from computer source codes also were validated using claim/encounter screens. This showed a very high 98.0 percent overall agreement. Several health plans reported difficulties in obtaining medical records from out-of-plan (or non-contracted) providers, closed clinics, and providers who could not be located. Although federal law permits health plan members the right to seek family planning services outside of their managed care plan, several out-of-plan providers refused to release medical records due to confidentiality concerns.
Table 5. Validation of Encounter Data for Chlamydia Screening Denominators
Denominator
Medi-Cal Managed Care Health Plan Encounter Data
Validated Encounter
Data
Agreement Rate
% Health Plan K 27 13 48 Health Plan T 30 25 83 Health Plan Q 30 30 100 Health Plan P 31 31 100 Health Plan U 30 30 100 Health Plan V 30 30 100 Health Plan M 30 30 100 Health Plan S 30 30 100 Health Plan H 30 29 97 Health Plan R 30 29 97 Health Plan L 30 30 100 Health Plan F 24 19 79 Health Plan D 30 30 100 Health Plan I 30 30 100 Health Plan G 29 25 86 Health Plan W 11 11 100 Health Plan O 30 30 100 Medi-Cal Managed Care Health Plans 482 452 94
Notes: Health Plan W had a small population for this measure because of the continuous enrollment criteria. Excluding this health plan does not change the overall agreement rate of 94.0 percent. Nine health plans had an auditing relationship with an NCQA-licensed auditing firm other than HSAG. These nine health plans did not participate in the validation study. Two health plans received an NR and were also excluded from the validation study.6 Consequently, only 17 health plans participated in the validation study.

CChhllaammyyddiiaa SSccrreeeenniinngg iinn WWoommeenn aanndd DDaattaa VVaalliiddaattiioonn SSttuuddyy March 2003 PPaaggee 1122 California Department of Health Services Medi-Cal Managed Care Division Health Services Advisory Group, Inc.
Validation results of numerator events were nearly the same as the denominator results. Approximately 92 percent of the numerator claims and encounters were found documented in the medical record as shown below in Table 6. Individually, 12 out of 17 health plans (71.0 percent) had agreement rates above 95.0 percent.
Table 6. Validation of Encounter Data for Chlamydia Screening Numerators
Numerator
Medi-Cal Managed Care Health Plan Encounter Data
Validated Encounter
Data
Agreement Rate
% Health Plan K 27 10 37 Health Plan T 30 22 73 Health Plan Q 30 29 97 Health Plan P 31 31 100 Health Plan U 30 30 100 Health Plan V 30 30 100 Health Plan M 30 30 100 Health Plan S 30 30 100 Health Plan H 30 28 93 Health Plan R 30 29 97 Health Plan L 30 30 100 Health Plan F 24 18 75 Health Plan D 30 30 100 Health Plan I 30 30 100 Health Plan G 22 22 100 Health Plan W 3 2 67 Health Plan O 30 30 100 Medi-Cal Managed Care Health Plans 467 431 92
Notes: Health Plan W had a small population for this measure because of the continuous enrollment criteria. Excluding this health plan does not change the overall agreement rate of 92.0 percent. Nine health plans had an auditing relationship with an NCQA-licensed auditing firm other than HSAG. These nine health plans did not participate in the validation study. Two health plans received an NR and were also excluded from the validation study.6 Consequently, only 17 health plans participated in the validation study.
CChhllaammyyddiiaa SSccrreeeenniinngg iinn WWoommeenn aanndd DDaattaa VVaalliiddaattiioonn SSttuuddyy March 2003 PPaaggee 1133 California Department of Health Services Medi-Cal Managed Care Division Health Services Advisory Group, Inc.
IV. Discussions, Conclusions, and Recommendations Nearly three out of every four (73.0 percent) eligible women in Medi-Cal managed care plans did not appear to receive recommended chlamydia screening. While screening rates were significantly higher in Medi-Cal managed care plans (screening rate = 27.0 percent) than in commercial health plans (screening rate = 18.0 percent), the results, nonetheless, indicate a great need for quality improvement efforts to improve chlamydia screening in young women. A limitation of this study was the inability to distinguish between chlamydia screening not being provided, versus data not being submitted to show that the service was provided. The data validation study sought to validate administrative data through evaluating its consistency with the medical record; the study did not seek to identify services in the medical record that were not reflected in the medical record. In the absence of complete data, it is difficult to determine the extent to which the low screening rate measured is due to data deficiencies or true quality of care deficiencies. In either case, however, improvement is needed. MMCD and the contracted health plans, in collaboration with the DHS STD Branch, have initiated collaborative quality improvement efforts. These efforts—which vary among health plans—include:
• developing and disseminating clinical guidelines on chlamydia screening to health plans and providers;
• developing and disseminating member education materials;
• creating a web-based provider training;
• creating additional provider training programs;
• implementing provider feedback on screening rates; and
• implementing provider financial incentives to improve chlamydia screening and reporting.
In addition, the STD Branch is developing a laboratory data warehouse for chlamydia testing that will facilitate more complete reporting; health plans are also working to improve data collection and information systems. Remeasurement of Chlamydia Screening in Women is planned for HEDIS 2003, at which time the effect of the current QI efforts will be assessed.
CChhllaammyyddiiaa SSccrreeeenniinngg iinn WWoommeenn aanndd DDaattaa VVaalliiddaattiioonn SSttuuddyy March 2003 PPaaggee AA--11 California Department of Health Services Medi-Cal Managed Care Division Health Services Advisory Group, Inc.
Appendix A
Medi-Cal Managed Care Model Types
CChhllaammyyddiiaa SSccrreeeenniinngg iinn WWoommeenn aanndd DDaattaa VVaalliiddaattiioonn SSttuuddyy March 2003 PPaaggee AA--22 California Department of Health Services Medi-Cal Managed Care Division Health Services Advisory Group, Inc.
MEDI-CAL MANAGED CARE MODEL TYPES
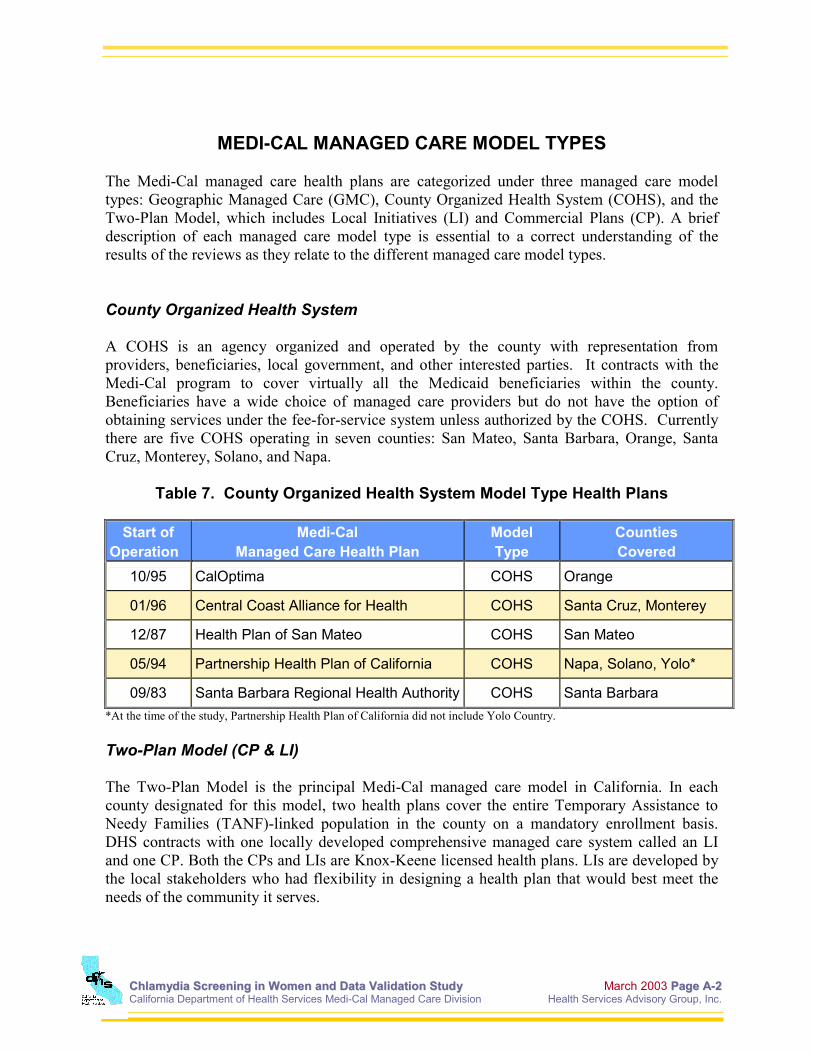
The Medi-Cal managed care health plans are categorized under three managed care model types: Geographic Managed Care (GMC), County Organized Health System (COHS), and the Two-Plan Model, which includes Local Initiatives (LI) and Commercial Plans (CP). A brief description of each managed care model type is essential to a correct understanding of the results of the reviews as they relate to the different managed care model types. County Organized Health System A COHS is an agency organized and operated by the county with representation from providers, beneficiaries, local government, and other interested parties. It contracts with the Medi-Cal program to cover virtually all the Medicaid beneficiaries within the county. Beneficiaries have a wide choice of managed care providers but do not have the option of obtaining services under the fee-for-service system unless authorized by the COHS. Currently there are five COHS operating in seven counties: San Mateo, Santa Barbara, Orange, Santa Cruz, Monterey, Solano, and Napa.
Table 7. County Organized Health System Model Type Health Plans
Start of Operation
Medi-Cal Managed Care Health Plan
Model Type
Counties Covered
10/95 CalOptima COHS Orange
01/96 Central Coast Alliance for Health COHS Santa Cruz, Monterey
12/87 Health Plan of San Mateo COHS San Mateo
05/94 Partnership Health Plan of California COHS Napa, Solano, Yolo*
09/83 Santa Barbara Regional Health Authority COHS Santa Barbara *At the time of the study, Partnership Health Plan of California did not include Yolo Country. Two-Plan Model (CP & LI) The Two-Plan Model is the principal Medi-Cal managed care model in California. In each county designated for this model, two health plans cover the entire Temporary Assistance to Needy Families (TANF)-linked population in the county on a mandatory enrollment basis. DHS contracts with one locally developed comprehensive managed care system called an LI and one CP. Both the CPs and LIs are Knox-Keene licensed health plans. LIs are developed by the local stakeholders who had flexibility in designing a health plan that would best meet the needs of the community it serves.

CChhllaammyyddiiaa SSccrreeeenniinngg iinn WWoommeenn aanndd DDaattaa VVaalliiddaattiioonn SSttuuddyy March 2003 PPaaggee AA--33 California Department of Health Services Medi-Cal Managed Care Division Health Services Advisory Group, Inc.
The CP is selected through a competitive bidding process. The presence of the CP is to ensure that the beneficiaries are able to select a health plan that also provides care to privately insured individuals. This is consistent with the expressed intent of the California Legislature.
Table 8. Two-Plan Model Type Health Plans
Start of Operation
Medi-Cal Managed Care Health Plan
Model Type Counties Covered
02/96 Blue Cross of California 2 Plan (CP)
Alameda, Contra Costa, Fresno, Kern, San Francisco, Santa Clara, San Joaquin
07/97 Health Net 2 Plan (CP) Los Angeles, Fresno, Tulare
03/99 Molina Medical Centers 2 Plan (CP) Riverside, San Bernardino
01/96 Alameda Alliance for Health 2 Plan (LI) Alameda
10/97 Blue Cross of California 2 Plan (LI) Stanislaus
02/97 Contra Costa Health Plan 2 Plan (LI) Contra Costa
03/99 Blue Cross of California 2 Plan (LI) Tulare
02/96 Health Plan of San Joaquin 2 Plan (LI) San Joaquin
09/96 Inland Empire Health Plan 2 Plan (LI) Riverside, San Bernardino
07/96 Kern Family Health Care 2 Plan (LI) Kern
04/97 L.A. Care Health Plan 2 Plan (LI) Los Angeles
01/97 San Francisco Health Plan 2 Plan (LI) San Francisco
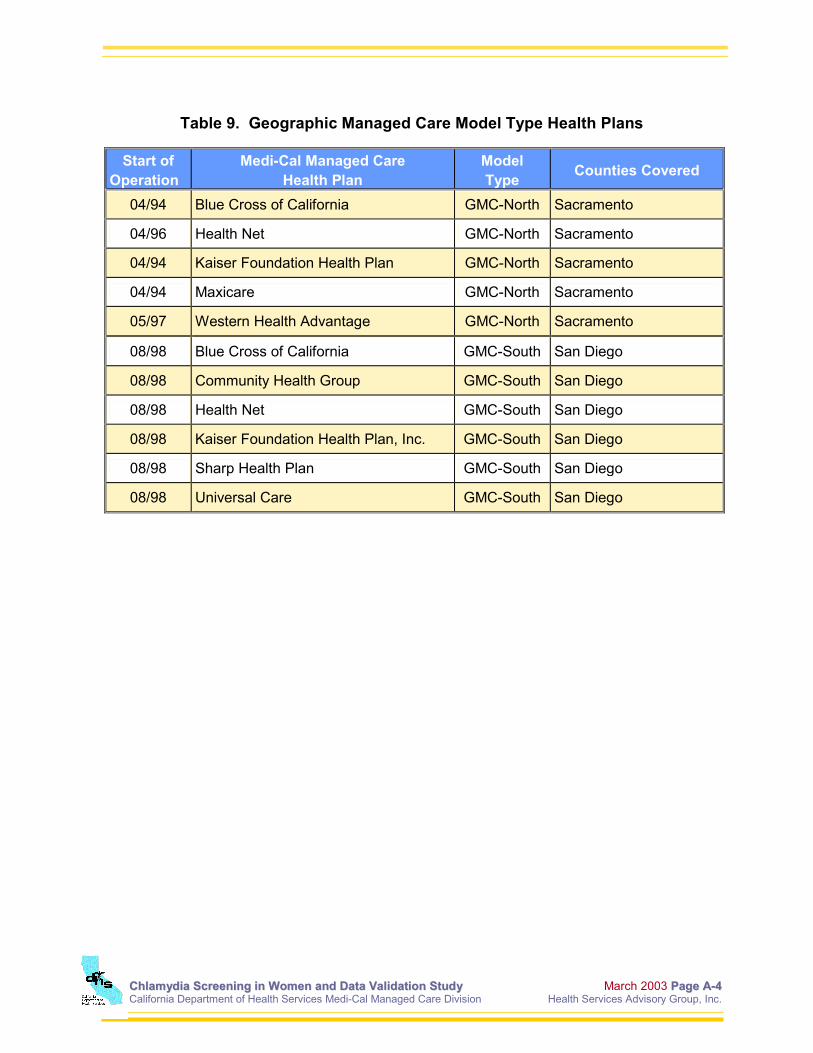
02/97 Santa Clara Family Health Plan 2 Plan (LI) Santa Clara Geographic Managed Care Under this system, DHS contracts with GMC health plans to cover the entire TANF-linked population in the county on a mandatory enrollment basis. The beneficiaries are given the option of choosing from among multiple commercial managed care health plans for health care services. The initial GMC program was implemented in Sacramento County in 1994, and includes six health plans. The second GMC program was implemented in San Diego County in 1998, and includes seven health plans. For the purposes of this report, the GMC model type is separated by GMC-North and GMC-South. Hence, the Sacramento GMCs are referred to as the GMC-North, while the health plans in the San Diego GMC are classified as the GMC-South. This is necessary for appropriate comparisons between regions and measurement years.
CChhllaammyyddiiaa SSccrreeeenniinngg iinn WWoommeenn aanndd DDaattaa VVaalliiddaattiioonn SSttuuddyy March 2003 PPaaggee AA--44 California Department of Health Services Medi-Cal Managed Care Division Health Services Advisory Group, Inc.
Table 9. Geographic Managed Care Model Type Health Plans
Start of
Operation Medi-Cal Managed Care
Health Plan Model Type Counties Covered
04/94 Blue Cross of California GMC-North Sacramento
04/96 Health Net GMC-North Sacramento
04/94 Kaiser Foundation Health Plan GMC-North Sacramento
04/94 Maxicare GMC-North Sacramento
05/97 Western Health Advantage GMC-North Sacramento
08/98 Blue Cross of California GMC-South San Diego
08/98 Community Health Group GMC-South San Diego
08/98 Health Net GMC-South San Diego
08/98 Kaiser Foundation Health Plan, Inc. GMC-South San Diego
08/98 Sharp Health Plan GMC-South San Diego
08/98 Universal Care GMC-South San Diego

CChhllaammyyddiiaa SSccrreeeenniinngg iinn WWoommeenn aanndd DDaattaa VVaalliiddaattiioonn SSttuuddyy March 2003 PPaaggee BB--11
California Department of Health Services Medi-Cal Managed Care Division Health Services Advisory Group, Inc.
Appendix B
Methodology

CChhllaammyyddiiaa SSccrreeeenniinngg iinn WWoommeenn aanndd DDaattaa VVaalliiddaattiioonn SSttuuddyy March 2003 PPaaggee BB--22
California Department of Health Services Medi-Cal Managed Care Division Health Services Advisory Group, Inc.
METHODOLOGY Chlamydia Screening in Women Following review and approval by HSAG of the source code for the HEDIS 2000 Chlamydia Screening in Women measure, each health plan identified the population of women who met the numerator and denominator criteria as described below:
• Numerator: Sexually active women between the ages of 16 and 26 who received a chlamydia screening test performed by a health care practitioner during 1999.
• Denominator: All sexually active women between the ages of 16 and 26 who were continuously enrolled in the health plan during 1999 and as of December 31, 1999. No more than one 30-day gap in enrollment was allowed during 1999.
Appendix C contains the technical considerations for this HEDIS measure. The HEDIS specification requires the health plans to report this measure by breaking the rate down into two age groups: women 16 to 20 years of age and women 21 to 26 years of age. Please see Appendix D for the complete description of the HEDIS specifications. The reason for dividing the population is that these two groups are believed to behave differently when it comes to seeking chlamydia screening services. The younger population tends to seek services from school-based clinics and other confidential service providers rather than their primary care doctors. Using this breakdown in age groupings might facilitate the health plan in conducting root cause analysis and implementing different interventions for the different age groups. Primary source verification was then performed for each health plan. This detailed level of analysis traced data (e.g., claims, encounters, enrollment, and providers) on samples of women in the population to ensure proper integration of the various data systems and compliance with the source code. As a result of the NCQA HEDIS Compliance AuditTM, HSAG assigned an audit measure designation for the Chlamydia Screening in Women measure for each health plan. The audit measure designations are based on the rationales defined by NCQA and are presented in Table 10 on page B-3.

CChhllaammyyddiiaa SSccrreeeenniinngg iinn WWoommeenn aanndd DDaattaa VVaalliiddaattiioonn SSttuuddyy March 2003 PPaaggee BB--33
California Department of Health Services Medi-Cal Managed Care Division Health Services Advisory Group, Inc.
Table 10. Audit Measure Designations
Notation Audit Measure Designation
Rationales
R Reported 1. The health plan followed the specifications and produced a reportable rate for the measure.
2. The health plan followed the specifications for producing a reportable denominator, but the denominator was too small to report a valid rate (i.e., less than 30 cases), resulting in a not applicable (NA) designation.
NR Not Reported 1. The health plan calculated the measure but the rate was materially biased.
2. The health plan did not calculate the measure even though a population existed for which the measure could have been calculated.
3. The health plan calculated the measure, but chose not to report the rate.
Two health plans did not have more than 30 women who met the continuous enrollment criteria for this measure, but otherwise were able to calculate the measure correctly. In these cases, the rate for the measure is listed as Not Applicable (NA), but the audit measure designation is Report (R). Health plans with an NA for the measure were used in the calculation of the aggregate Medi-Cal managed care chlamydia screening rate. However, the health plans that received a Not Report (NR) designation for this measure were excluded from the aggregate Medi-Cal managed care chlamydia screening rate. Four of the health plans had previously established a relationship with an NCQA-licensed auditing firm other than HSAG, and they were allowed to continue this relationship. These health plans did not participate in the validation study, but did provide audited results of the Chlamydia Screening in Women measure to HSAG. The Chlamydia Screening in Women measure is an administrative only measure; sampling is not allowed (i.e., the denominator is the population of all eligible women) and, similarly, the numerator is derived using only claims and encounter data (i.e., medical record review is not allowed). HSAG calculated the Medi-Cal managed care rate by dividing the sum of the numerators for each health plan by the sum of the denominators. Therefore, health plans with a large population for this measure contributed more to the overall rate. Since the entire eligible population was used, this method provided an exact Medi-Cal managed care rate that can be compared with NCQA national Medicaid percentiles. Furthermore, the Medi-Cal managed care weighted average is equal to the Medi-Cal managed care rate.

CChhllaammyyddiiaa SSccrreeeenniinngg iinn WWoommeenn aanndd DDaattaa VVaalliiddaattiioonn SSttuuddyy March 2003 PPaaggee BB--44
California Department of Health Services Medi-Cal Managed Care Division Health Services Advisory Group, Inc.
Validation of Administrative Data From each health plan, a sample of 30 administrative positive cases was randomly selected from those women who met the denominator and numerator specifications. If a health plan had less than 30 administrative positive cases, all cases were used for the sample. For each of the 30 members that were selected for the validation sample, the health plan provided HSAG with a hard copy of the billing data that represented both the denominator-qualifying code and the numerator-qualifying code. In addition, the health plan pursued the medical record for those claims or encounters and provided HSAG with the documentation to support the claims or encounters when available. HSAG provided comprehensive training to medical record reviewers employed by all the health plans HSAG audited, followed by an assessment of accuracy and inter-rater reliability before the start of the review process. The process for reviewing the medical records, the process for documenting conflicting information, definitions of errors, and the use of appropriate reference material (coding manuals) were addressed. Throughout the review process, HSAG performed ongoing re-review of a sample of abstracted records in order to assure a 95.0 percent or greater level of agreement. (A copy of the assessment tool and instructions are located in Appendix E.) The medical record reviewer compared the necessary data elements on the submitted billing form to the medical record documentation for the appropriate date of service and made a determination as to whether the information was accurate. The determination of the accuracy between the medical record and the billing form is referred to as the agreement rate in this part of the study. A validation was performed separately for numerators and denominators. If a discrepancy was discovered between the information on the billing form and that in the medical record, the medical record reviewer documented the most likely reason or explanation under the “comments” section of the data collection instrument. Issues with providers or laboratories also were noted and discussed in the findings.

CChhllaammyyddiiaa SSccrreeeenniinngg iinn WWoommeenn aanndd DDaattaa VVaalliiddaattiioonn SSttuuddyy March 2003 PPaaggee CC--11
California Department of Health Services Medi-Cal Managed Care Division Health Services Advisory Group, Inc.
Appendix C
Technical Considerations for Chlamydia Screening in
Women

CChhllaammyyddiiaa SSccrreeeenniinngg iinn WWoommeenn aanndd DDaattaa VVaalliiddaattiioonn SSttuuddyy March 2003 PPaaggee CC--22 California Department of Health Services Medi-Cal Managed Care Division Health Services Advisory Group, Inc.
Reprinted from: HEDIS 2000 Technical Specifications, Volume 2: CHLAMYDIA SCREENING IN WOMEN, TECHNICAL CONSIDERATIONS Universal vs. High Risk Screening: Analyses of the costs and benefits of selective versus universal screening indicate that it is cost-effective to screen all women at increased risk if the prevalence exceeds 2 percent; the leading risk factor is age under 25.8 Recent estimates suggest that the prevalence is markedly higher among adolescents than the required threshold for cost savings. For example, in a national sample of women recruited into the Army the prevalence among 17-year-olds was 12 percent.9 In a study of a random sample of 7th to 12th graders, 9.7 percent of females screened positive for chlamydia; because the students were not asked about sexual activity, this is a likely underestimate of the rate among those who are sexually active.10 The proposed measure is intended to apply to women in the target age range (15-25) who are sexually active. A major challenge for measure development was designing a method for identifying the eligible population. We considered three possible approaches: an administrative data-based algorithm, a review of medical records, and a survey. The medical record and survey approaches are both more expensive and raise confidentiality concerns, particularly given the inclusion of adolescents in the measure. Identifying Sexually Active Women: The administrative algorithm includes a list of ICD-9 and CPT-4 codes for health services that are primarily provided to sexually active women. These codes include Pap tests and pelvic examination, contraceptive prescriptions, pregnancy-related services, and screening and treatment for other sexually transmitted diseases. This algorithm was tested in four managed care organizations (MCOs) from different regions of the country and representing different model types. The proportion of women ages 15-25 who were eligible ranged from 47-49 percent and increased by age group from about 20 percent among 15-16 year olds to almost 70 percent among 22-25 year olds. A random sample of charts was examined in each MCO from women who did not qualify as sexually active according to the algorithm to determine what proportion would be missed using the administrative approach. Overall, about 13 percent of the women who were not sexually active according to the algorithm, were found to be sexually active according to the chart (range 8 percent to 17 percent). The provision of chlamydia screening for young women varied widely in the four MCOs and was low overall. The proportion screened ranged from 1.5 percent to 41.5 percent (average across the four MCOs was 16 percent). Using the hybrid method did not change these results. Thus, the measure appears to be appropriate for use as an administrative measure.
8 Marrazzo, JM, Celum, CL, Hillis, SD, et al. Performance and cost-effectiveness of selective screening criteria for Chlamydia trachomatis infection in women: implications for a national control strategy. Sexually Transmitted Diseases. 1997; 24:131-141. 9 Gaydos, CA, Howell, MR, Pare B, et al. Chlamydia trachomatis infections in female military recruits. New England Journal of Medicine. 1998; 339:739-744. 10 Cohen, DA, Nauami, M, Etame RB, et al. A school-based chlamydia control program using DNA amplification technology. Pediatrics. 1998; 101:E11-E15.

CChhllaammyyddiiaa SSccrreeeenniinngg iinn WWoommeenn aanndd DDaattaa VVaalliiddaattiioonn SSttuuddyy March 2003 PPaaggee CC--33 California Department of Health Services Medi-Cal Managed Care Division Health Services Advisory Group, Inc.
While the algorithm underrepresents the eligible population, the effect of the measure should be considerably broader by underscoring the importance of routine screening for chlamydia among young women who are sexually active. Screening Methods: Nonculture methods of laboratory testing for chlamydia infection have changed dramatically in the last three years. These methods include: ♦ nucleic acid amplification techniques, including polymerase chain reaction (PCR) and ligase
reaction.
♦ nucleic acid nonamplification tests, including the Probe test.
♦ enzyme immunoassay (EIA).
♦ direct fluorescent antibody (DFA) tests. These new tests are highly sensitive and specific, and have the added advantage of performing well on non-cervical samples, including male and female urine samples. Data Collection: We recognize that there is some difficulty in using surrogates to determine sexual activity. In some cases, there are ICD-9 codes, CPT codes, and pharmaceutical prescriptions included in the denominator of this measure, which may not exclusively be associated with sexual activity. However, this is not expected to occur in significant enough numbers to invalidate the data. We also recognize that there are women who receive their gynecological care outside of their MCO. This may be especially true for adolescent females concerned with confidentiality issues. The actual percentages are unknown and possibly differ among MCOs. Variability Among MCOs in the Prevalence of Sexual Activity: Based on demographic data, one might expect differences among MCOs in the proportion of young women who are sexually active. However, we found little overall variation among the MCOs that participated in the testing project. There were differences in the categories that made women eligible by MCO. For example, in MCO A, two-thirds of women were eligible based on codes related to either treatment of a sexually transmitted disease or presentation for a general exam. In MCO B, almost half of women were eligible based on obtaining a prescription for contraception. In MCO C, almost half of women were eligible based on presentation for a general exam. In MCO D, 70 percent of women were eligible based on presentation for a general exam. Variability Among MCOs in Rates of Screening for Chlamydia: We found substantial variation among MCOs in the rates of screening for chlamydia. There were some differences among MCOs in rates of screening by category of eligibility. MCOs had similar rates of screening among women who were eligible based on pregnancy (about 15 percent) or screening (about one-third). Considerable variation in screening was found among women who were eligible based on treatment, contraception, or general examination.

CChhllaammyyddiiaa SSccrreeeenniinngg iinn WWoommeenn aanndd DDaattaa VVaalliiddaattiioonn SSttuuddyy March 2003 PPaaggee CC--44 California Department of Health Services Medi-Cal Managed Care Division Health Services Advisory Group, Inc.
Variability Among MCOs in Reproducibility: We examined whether women who qualified for the measure based on administrative data, but did not appear to have a screening test for chlamydia, had evidence of such a test in the medical record. Only six women across all four MCOs (about 8 percent of the sample) had evidence of a chlamydia screening test in the medical record. Variability Among MCOs in Risk Adjustability: The major method of risk adjustment is identifying sexually active women in the MCO. Because rates of sexual activity vary by age, race, and geography, requiring that the denominator include a consistent method for identifying sexually active women should provide adequate adjustment for differences in eligibility for the service.
CChhllaammyyddiiaa SSccrreeeenniinngg iinn WWoommeenn aanndd DDaattaa VVaalliiddaattiioonn SSttuuddyy March 2003 PPaaggee DD--11
California Department of Health Services Medi-Cal Managed Care Division Health Services Advisory Group, Inc.
Appendix D
HEDIS 2000 Technical Specifications
CChhllaammyyddiiaa SSccrreeeenniinngg iinn WWoommeenn aanndd DDaattaa VVaalliiddaattiioonn SSttuuddyy March 2003 PPaaggee DD--22
California Department of Health Services Medi-Cal Managed Care Division Health Services Advisory Group, Inc.
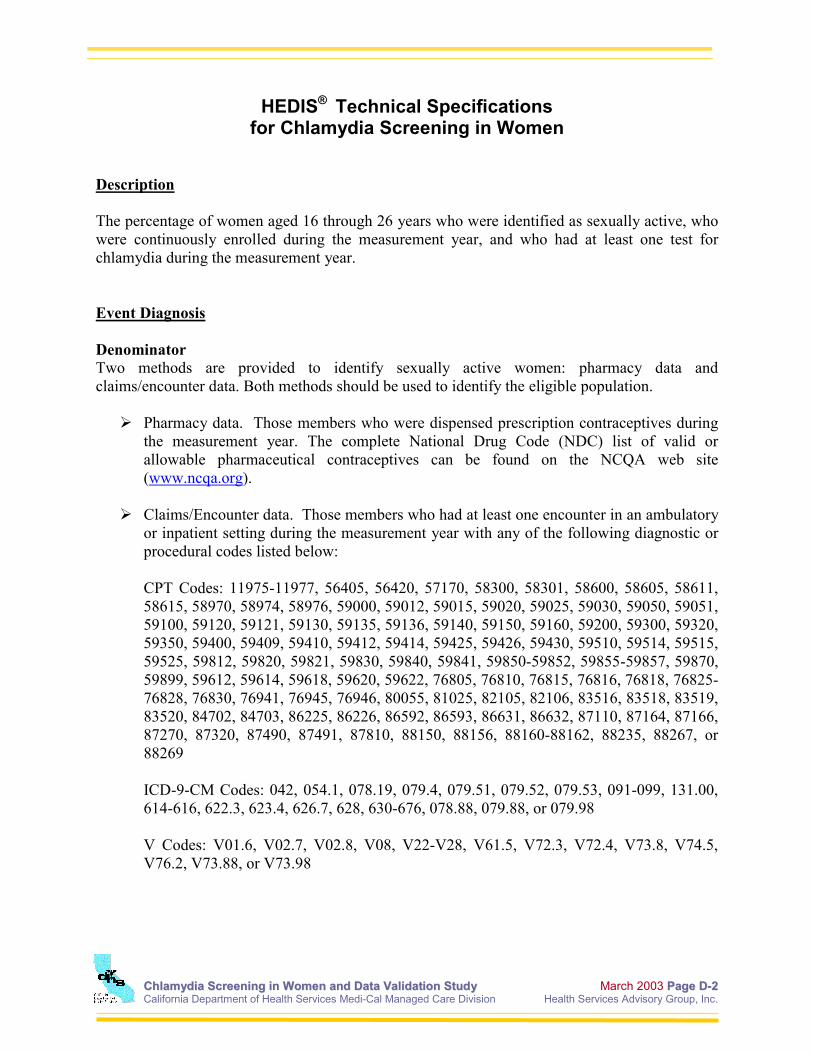
HEDIS® Technical Specifications for Chlamydia Screening in Women
Description The percentage of women aged 16 through 26 years who were identified as sexually active, who were continuously enrolled during the measurement year, and who had at least one test for chlamydia during the measurement year. Event Diagnosis Denominator Two methods are provided to identify sexually active women: pharmacy data and claims/encounter data. Both methods should be used to identify the eligible population.
Pharmacy data. Those members who were dispensed prescription contraceptives during the measurement year. The complete National Drug Code (NDC) list of valid or allowable pharmaceutical contraceptives can be found on the NCQA web site (www.ncqa.org).
Claims/Encounter data. Those members who had at least one encounter in an ambulatory
or inpatient setting during the measurement year with any of the following diagnostic or procedural codes listed below:
CPT Codes: 11975-11977, 56405, 56420, 57170, 58300, 58301, 58600, 58605, 58611, 58615, 58970, 58974, 58976, 59000, 59012, 59015, 59020, 59025, 59030, 59050, 59051, 59100, 59120, 59121, 59130, 59135, 59136, 59140, 59150, 59160, 59200, 59300, 59320, 59350, 59400, 59409, 59410, 59412, 59414, 59425, 59426, 59430, 59510, 59514, 59515, 59525, 59812, 59820, 59821, 59830, 59840, 59841, 59850-59852, 59855-59857, 59870, 59899, 59612, 59614, 59618, 59620, 59622, 76805, 76810, 76815, 76816, 76818, 76825-76828, 76830, 76941, 76945, 76946, 80055, 81025, 82105, 82106, 83516, 83518, 83519, 83520, 84702, 84703, 86225, 86226, 86592, 86593, 86631, 86632, 87110, 87164, 87166, 87270, 87320, 87490, 87491, 87810, 88150, 88156, 88160-88162, 88235, 88267, or 88269 ICD-9-CM Codes: 042, 054.1, 078.19, 079.4, 079.51, 079.52, 079.53, 091-099, 131.00, 614-616, 622.3, 623.4, 626.7, 628, 630-676, 078.88, 079.88, or 079.98 V Codes: V01.6, V02.7, V02.8, V08, V22-V28, V61.5, V72.3, V72.4, V73.8, V74.5, V76.2, V73.88, or V73.98
CChhllaammyyddiiaa SSccrreeeenniinngg iinn WWoommeenn aanndd DDaattaa VVaalliiddaattiioonn SSttuuddyy March 2003 PPaaggee DD--33 California Department of Health Services Medi-Cal Managed Care Division Health Services Advisory Group, Inc.
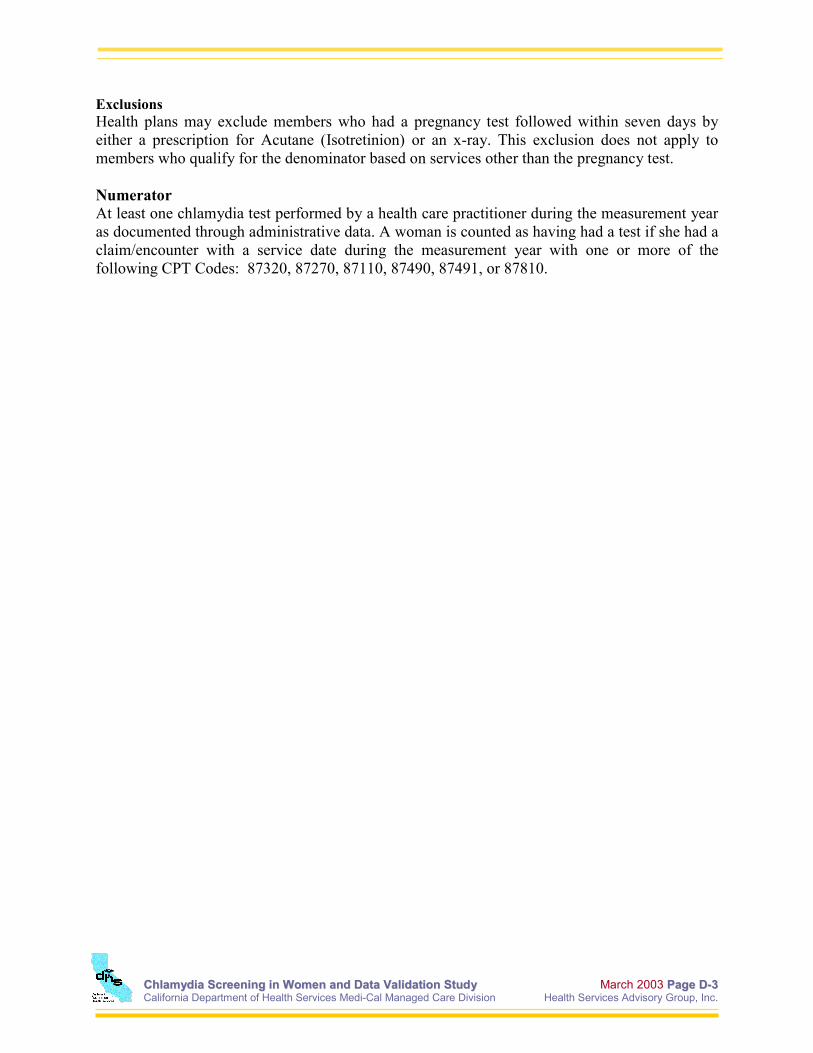
Exclusions Health plans may exclude members who had a pregnancy test followed within seven days by either a prescription for Acutane (Isotretinion) or an x-ray. This exclusion does not apply to members who qualify for the denominator based on services other than the pregnancy test. Numerator At least one chlamydia test performed by a health care practitioner during the measurement year as documented through administrative data. A woman is counted as having had a test if she had a claim/encounter with a service date during the measurement year with one or more of the following CPT Codes: 87320, 87270, 87110, 87490, 87491, or 87810.

CChhllaammyyddiiaa SSccrreeeenniinngg iinn WWoommeenn aanndd DDaattaa VVaalliiddaattiioonn SSttuuddyy March 2003 PPaaggee EE--11 California Department of Health Services Medi-Cal Managed Care Division Health Services Advisory Group, Inc.
Appendix E
Chlamydia Screening Tool and Instructions

HEDIS® is a registered trademark of the National Committee for Quality Assurance Property of HSAG
Page 1 of 2
Health Services Advisory Group HEDIS® 2000 MEDICAL RECORD OVER-READS
Tool for CHLAMYDIA SCREENING IN WOMEN
DEMOGRAPHIC INFORMATION
Last Name: ______________________________________ First Name: _________________________________________ D.O.B.: _________________________________________ Gender: (circle one) M F Plan Name: ______________________________________ Member ID# ________________________________________
DENOMINATOR QUALIFYING CODE Record the date and denominator-qualifying code (NDC, CPT, ICD-9, & V codes that identify the female as sexually active) from the hard copy of the claim or encounter: Pharmacy Data: _______________________Code ____/____/____Date _______________________________Description Claims/Encounter Data: _______________________Code ____/____/____Date _______________________________Description
Verify documentation of the denominator-qualifying code in the medical record: YES, there is corresponding documentation of the
prescribed contraceptive in the medical record. NO, there is no documentation of the prescribed
contraceptive in the medical record. YES, there is corresponding documentation of the
described service rendered in the medical record. NO, there is no documentation of the described service
rendered in the medical record.
NUMERATOR QUALIFYING CODE Record the date and numerator-qualifying code (Chlamydia screening/ test) performed by a health care practitioner during the measurement year (1999) from the hard copy of a claim/encounter form:
_____/_____/_____ Date ________________Code
Verification of documentation in the patients medical record that a numerator-qualifying code (Chlamydia screening/ test) was performed on the date indicated by the claim/encounter form or a result of the test: YES, there is corresponding documentation for the test
and/or result in the medical record. NO, documentation for either the test and/or the result was
not found in the medical record.
ABSTRACTOR INFORMATION
ID# __________________________ ABSTRACTION TIME: _______________ ABSTRACTION DATE: _______________
H SA G

HEDIS® is a registered trademark of the National Committee of Quality Assurance Property of HSAG
Page 2 of 2
Health Services Advisory Group HEDIS® 2000 MEDICAL RECORD OVER-READS
CHLAMYDIA SCREENING IN WOMEN Tool Instructions
DEMOGRAPHIC INFORMATION 1. Complete the members’ last name followed by the first name and date of birth. 2. Circle the gender. If patient is a male, he is immediately excluded, check Υ Υ Υ Υ the “patient is a
male for a female only measure” box and stop abstracting. 3. Fill in the name of the managed care plan. 4. Fill in the member identification number. DENOMINATOR QUALIFYING CODE Sexually Active: To further qualify for the denominator in this measure, the plan must identify the member as being sexually active. The MCO determines the sexual activity status by one or both of the following methods:
(a) Pharmacy data: the member must have been dispensed a prescription for oral contraceptives, IUD, diaphragm or other prescribed contraceptive during the measurement year (1999). (See Attachment A {Chlamydia NDC List} for a standardized list of required prescriptions and non-pharmaceutical contraceptives.)
(b) Claims/encounter data: the member must have had at least one encounter in an ambulatory or inpatient setting during the review year with any of the diagnostic or procedural codes. (See Attachment D {Codes to Identify Sexually Active Women} for CPT, ICD-9 and V-Codes.)
The MCO will provide a hard copy of one or both of the above methods of identifying sexually active females (either prescription and/or claims/encounter forms with the denominator-qualifying code). Determine which type of code you are validating (you may be validating both types). Record pharmacy data (the date, code and code description) on the lines provided. Record claims/encounter data (the date, code and code description) on the lines provided. You may be validating both types of methods (pharmacy or claims/encounter) for a particular member or just one of the methods. Therefore, there may be times when one of the data areas are not completed. In the box on the right, place a check (ΥΥΥΥ) in the corresponding “YES” box(es) if there is supporting documentation in the medical record for the particular code(s) descriptions abstracted from the hard copy pharmacy and/or claim/encounter form. Place a check (ΥΥΥΥ) in the “NO” box(es) if there is no supporting documentation in the medical record. NUMERATOR QUALIFYING CODE In the box on the left, record the date and the code from a claims/encounter form (See Attachment C, Table 1 {Codes to Identify Chlamydia Screening}) of at least one Chlamydia screening/test performed by a health care practitioner during the review year (1999). Search the medical record for supporting evidence of the claim/encounter by either documentation of the screening/test and/or a result of the test. Remember, the screening/test must be provided by a health care practitioner. In the box on the right, place a check (ΥΥΥΥ) in the “YES” box if there is supporting documentation in the medical record that the Chlamydia screening/test was performed or the results/findings were reported. Place a check (ΥΥΥΥ) in the “NO” box if there is no supporting documentation in the medical record. ABSTRACTOR INFORMATION Fill in your Abstractor ID#, the date the abstraction was completed and the time it took to complete the tool.