Embed Size (px)
Citation preview
Rates of absenteeism, retention and turnover are indications of the workplace environment and satisfaction of employees. By calculating these rates, you can determine how well your workplace has adapted to the current realities of the workforce and your level of preparation required to address future human resource needs.
To ensure that information is consistent, the following definitions are provided:
Absenteeism: Employees missing part or whole days of work due to personal illness, personal business, or other reasons (excluding paid vacation). These absences may be avoidable or unavoidable.
Retention: Employer’s capacity to keep employees.
Turnover: Replacement of employees who have left the workplace due to either voluntary or involuntary reasons.
Calculating Absenteeism, Retention & Turnover
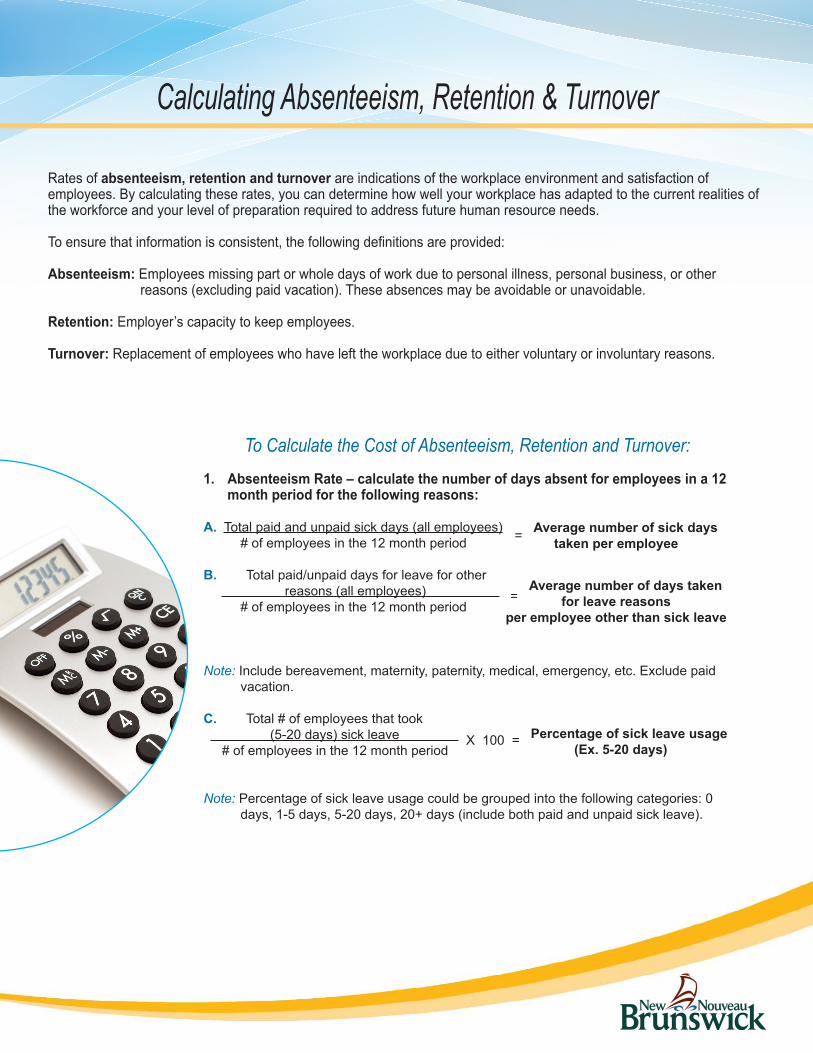
To Calculate the Cost of Absenteeism, Retention and Turnover:
1. Absenteeism Rate – calculate the number of days absent for employees in a 12 month period for the following reasons:
A. Total paid and unpaid sick days (all employees) # of employees in the 12 month period
B. Total paid/unpaid days for leave for other reasons (all employees) # of employees in the 12 month period
Note: Include bereavement, maternity, paternity, medical, emergency, etc. Exclude paid vacation.
C. Total # of employees that took (5-20 days) sick leave # of employees in the 12 month period
Note: Percentage of sick leave usage could be grouped into the following categories: 0 days, 1-5 days, 5-20 days, 20+ days (include both paid and unpaid sick leave).
= Average number of sick daystaken per employee
= Average number of days taken
for leave reasonsper employee other than sick leave
X 100 = Percentage of sick leave usage (Ex. 5-20 days)
Case Example: Five years ago, Company ABC experienced a sudden increase in new clients. Althoughthe increase brought in additional revenue, the additional workload began having negative effects onemployees.
An employee survey found that more than 50% of the workforce reported experiencing moderate to highlevels of stress as a direct result of difficulties in trying to balance work and family life. During the past year, the company experienced its highest absenteeism rate with an average of 10 sick days taken per employee. This resulted in lost productivity and decreased employee satisfaction.
Recognizing the negative impact on business, management gathered suggestions from employees on how to address their human resources issues. Based on feedback, the company introduced a number of family friendly policies such as flex-time, reduced hours, working-from-home option, and reduced overtime as part of their commitment towards a healthier and more balanced workplace.
A recent follow-up employee survey shows increased levels of employee satisfaction and engagement and an astounding 35% reduction in the absenteeism rate.
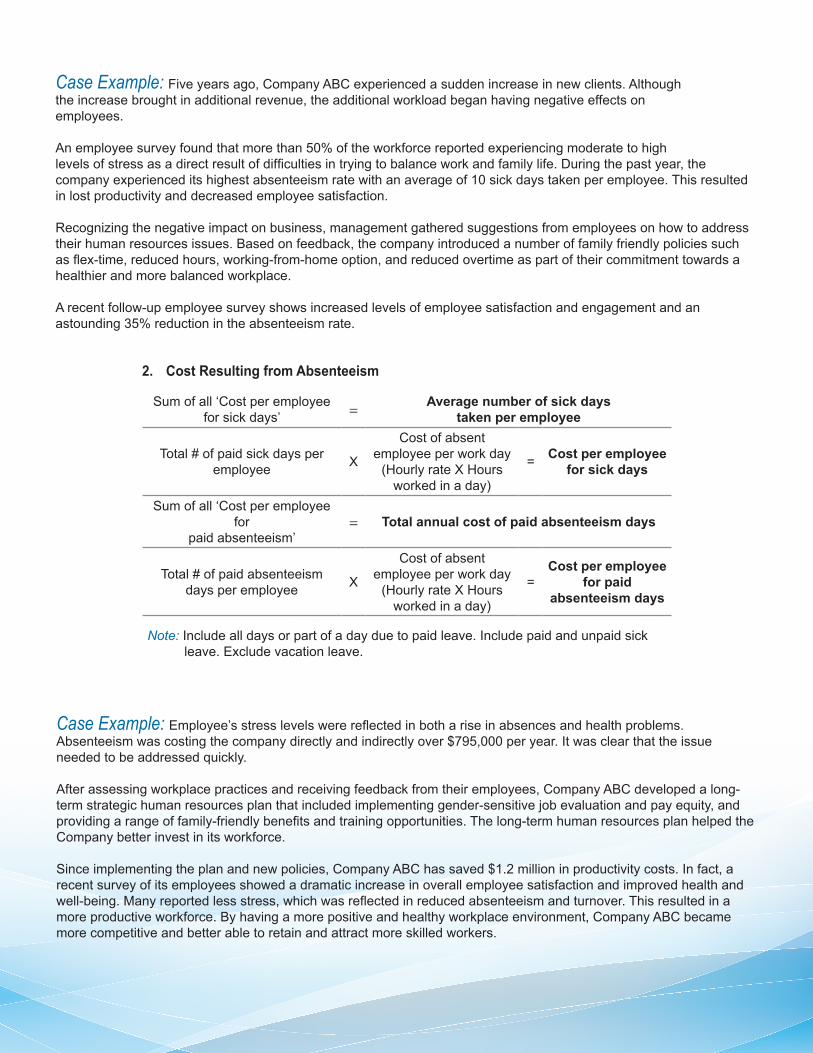
2. Cost Resulting from Absenteeism
Sum of all ‘Cost per employee for sick days’ = Average number of sick days
taken per employee
Total # of paid sick days per employee X
Cost of absent employee per work day
(Hourly rate X Hours worked in a day)
= Cost per employeefor sick days
Sum of all ‘Cost per employee for
paid absenteeism’= Total annual cost of paid absenteeism days
Total # of paid absenteeismdays per employee X
Cost of absent employee per work day
(Hourly rate X Hours worked in a day)
=Cost per employee
for paidabsenteeism days
Note: Include all days or part of a day due to paid leave. Include paid and unpaid sick leave. Exclude vacation leave.
Case Example: Employee’s stress levels were reflected in both a rise in absences and health problems. Absenteeism was costing the company directly and indirectly over $795,000 per year. It was clear that the issue needed to be addressed quickly.
After assessing workplace practices and receiving feedback from their employees, Company ABC developed a long-term strategic human resources plan that included implementing gender-sensitive job evaluation and pay equity, and providing a range of family-friendly benefits and training opportunities. The long-term human resources plan helped the Company better invest in its workforce.
Since implementing the plan and new policies, Company ABC has saved $1.2 million in productivity costs. In fact, a recent survey of its employees showed a dramatic increase in overall employee satisfaction and improved health and well-being. Many reported less stress, which was reflected in reduced absenteeism and turnover. This resulted in a more productive workforce. By having a more positive and healthy workplace environment, Company ABC became more competitive and better able to retain and attract more skilled workers.
www.gnb.ca/women [email protected] Toll Free:1-877-253-0266
April
201
5
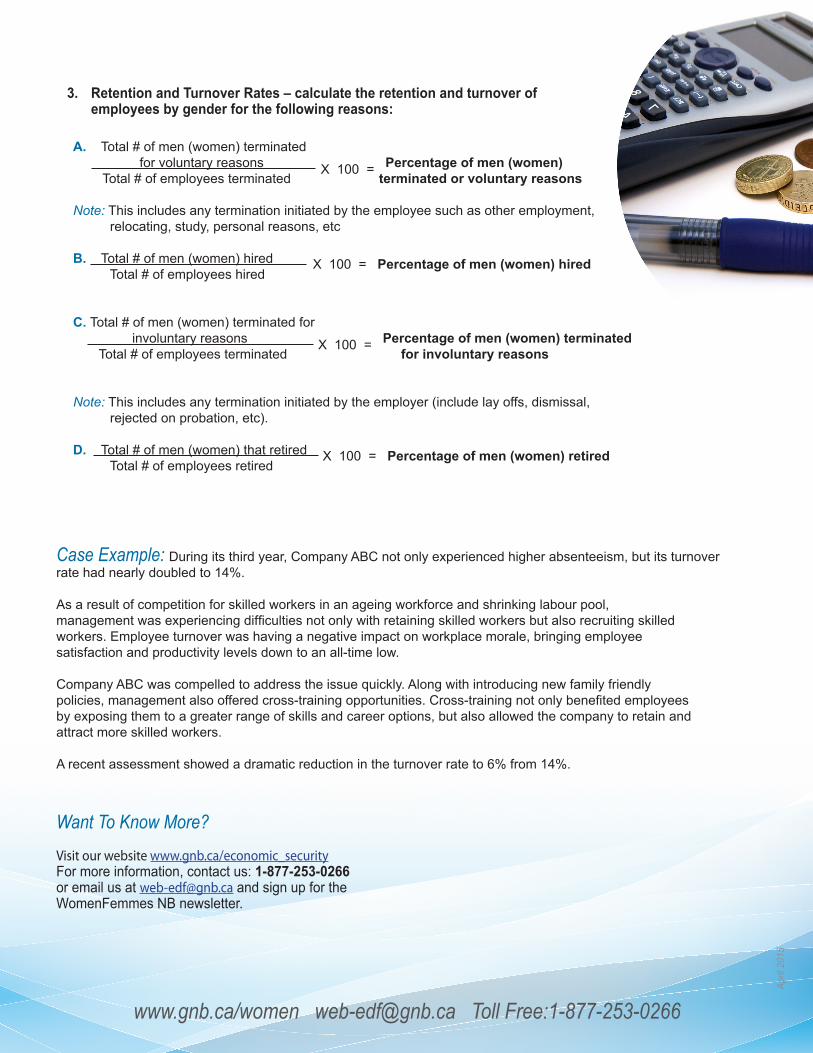
3. Retention and Turnover Rates – calculate the retention and turnover of employees by gender for the following reasons:
Case Example: During its third year, Company ABC not only experienced higher absenteeism, but its turnoverrate had nearly doubled to 14%.
As a result of competition for skilled workers in an ageing workforce and shrinking labour pool,management was experiencing difficulties not only with retaining skilled workers but also recruiting skilledworkers. Employee turnover was having a negative impact on workplace morale, bringing employeesatisfaction and productivity levels down to an all-time low.
Company ABC was compelled to address the issue quickly. Along with introducing new family friendlypolicies, management also offered cross-training opportunities. Cross-training not only benefited employeesby exposing them to a greater range of skills and career options, but also allowed the company to retain andattract more skilled workers.
A recent assessment showed a dramatic reduction in the turnover rate to 6% from 14%.
A. Total # of men (women) terminated for voluntary reasons Total # of employees terminated
Note: This includes any termination initiated by the employee such as other employment, relocating, study, personal reasons, etc
B. Total # of men (women) hired Total # of employees hired
C. Total # of men (women) terminated for involuntary reasons Total # of employees terminated
Note: This includes any termination initiated by the employer (include lay offs, dismissal, rejected on probation, etc).
D. Total # of men (women) that retired Total # of employees retired
X 100 = Percentage of men (women) terminated or voluntary reasons
X 100 = Percentage of men (women) hired
X 100 = Percentage of men (women) terminated for involuntary reasons
X 100 = Percentage of men (women) retired
Want To Know More? Visit our website www.gnb.ca/economic_securityFor more information, contact us: 1-877-253-0266 or email us at [email protected] and sign up for theWomenFemmes NB newsletter.