Embed Size (px)
Citation preview

www.cafonline.org
An overview of charitable
giving in the UK
March 2018#UKGiving
CAF UK
GIVING 2018
2 | CAF UK GIVING 2018
Contents
Foreword 3
Introduction 4
About CAF 4
Key findings 5
Detailed findings
1.0 Overall picture of how people get involved 6
1.1 Giving money 6
1.2 Volunteering 8
1.3 Giving goods 9
1.4 Protesting and petitioning 9
2.0 Who engages most? 10
3.0 Frequency of giving 10
4.0 Total amount given 11
5.0 Typical amount given 11
5.1 Typical amount given in donations 11
5.2 Typical amount given in sponsorship 12
6.0 What people give to 12
6.1 Proportions given to cause areas 13
6.2 Who gives to what? 14
7.0 How people give 15
7.1 Being asked to give 16
8.0 Trust in charities 17
9.0 The impact of Brexit on charitable giving 18
Method 19
Copyright © The Trustees of the Charities Aid Foundation 2018 All rights reserved. No part of this publication may be reproduced, stored in a retrieval system or transmitted, in any form or by any means, including electronic, mechanical, photocopying, recording or otherwise, without the prior written permission of Charities Aid Foundation, the copyright owner.

| 3CAF UK GIVING 2018 CAF UK GIVING 2018
ForewordOne of the most amazing things about giving to charity in this country is the fact that people give to their favourite causes through thick and thin. In good times and bad times, people are driven to support a huge variety of causes, often dealing with issues which have touched them personally, or affected their family and friends.
For more than a decade the CAF UK Giving survey has recorded the enduring generosity of people across our country, something confirmed in this year’s results.
But we can look closer. The CAF UK Giving project now surveys 12,000 people a year, allowing us to look in more detail than ever before at patterns of giving.
We see that although total donations are slightly up, the number of people giving has fallen. It’s far too soon to tell if that represents a trend, but we need to be careful if giving becomes concentrated in fewer, larger donations. This is something we will monitor carefully in our monthly surveys.
It is also telling that the gap between participation by men and women has widened. Again we will have to see if there are longer term changes taking place.
One statistic is crucial though, that trust in charities remains stable. Charities have faced many challenges, and can never cease earning the trust which they enjoy. While we in charities always need to strive for the best, and never be complacent about the high standards people expect of us, the enduring trust people have in our country’s voluntary sector should be a source of pride, and something precious to protect for the future.
Sir John LowChief Executive, Charities Aid Foundation

4 | CAF UK GIVING 2018
In May 2016 we switched the UK Giving methodology to online, to enable us to conduct 1,000 interviews every month to help charities understand UK giving behaviour in much more detail. This meant that in last year’s report on partial data we doubled the number of interviews we reported on from 4,000 per year to 8,000 per year. We are now in a position to report on a tripled number of 12,000 for the 2017 year.
UK Giving is the largest study of giving behaviour in the UK made freely available to charities. In last year’s report we mentioned how excited we were with these developments and the options the increased sample size gave us. We are therefore delighted to report that last year we rolled out initiatives such as free monthly infographics with key insights for charities and our first ever CAF Scotland Giving report, which will become an annual publication. In 2018 we will be looking for further ways to disseminate the results from this expanded survey.
Within this report we will be looking at month by month comparisons and will comment on seasonality where applicable.
Introduction
About CAF
We help people and businesses support the causes they care about, and for charities, we provide simple and straightforward day-to-day banking and fundraising services, freeing them up to concentrate on the real work of making a difference.
We also understand and influence the wider environment for charities and civil society across the UK and beyond via our research, policy and campaigns work.

CAF UK GIVING 2018 | 5CAF UK GIVING 2018
Key findingsThe key findings for individual giving in the UK in 2017 are:
�� The total amount given to charity increased to £10.3 billion – however, this is driven by fewer people giving more.
�� The number of people who gave to charity either via donations or sponsoring someone in 2017 decreased from the previous year – led by the decrease in sponsorship.
�� November and December were the peak months for donations to charity whilst June was the peak month for sponsoring someone.
�� People continued to sign petitions and take part in public demonstrations in 2017 at the high levels seen for the first time in 2016.
�� Despite innovation in charitable giving over the years, cash remains the main way in which people give, although the level has decreased slightly in 2017.
�� Women remain more likely than men to participate in charitable and social activity though the gap is widening rather than narrowing between the two groups.
�� Trust in charity has shown no real movement since 2016, with 51% agreeing that charities are trustworthy. Men in particular are most likely to disagree that charities are trustworthy.

6 | CAF UK GIVING 2018
1.0 Overall picture of how people get involved
All those interviewed were shown a list of behaviours and asked whether they had done any of these a) in the last four weeks; b) in the last 12 months. We have shown the behaviours split to differentiate between the charitable and social actions.
60%
56%
35%
17%
54%
28%
14%
7%
12%
32%
26%
9%
9%
26%
13%
4%
2%
35%
In the last year
In the last four weeks
Donated money to charity
Given goods to charity
Sponsored someone for a charity
Volunteered for a charity
Signed a petition
Bought an ethical product
Taken part in a local public consultation
Taken part in a public demonstration/protest
None of the above
Figure 1: Which, if any, of the following have you done in the last year/four weeks?
Base: All adults 16+ (n=12,211)
At an overall level, we see slightly fewer people (88%) reporting to have participated in at least one charitable or social action over the previous year, compared to 89% during 2016. When people are asked about their behaviour in the previous four weeks, there is a notable decrease from last year’s report, with just under two thirds (65%) claiming to have participated in the last four weeks, compared to 68% during 2016. Although this is a disappointing movement, it is key to note that both of these levels are still much higher than the level of 79% of people who had participated in the previous year and 57% during the previous four weeks when asked in 2015.
In subsequent sections we will look at where the changes have occurred since 2016.
1.1 Giving money
The number of people who say they have donated money in the last year when asked in 2017 was very similar to 2016 (60% vs 61% in 2016). Those having given in the last four weeks was also very similar at around a third (32% vs 33% in 2016).
However, where there has been more of a drop is in the number saying they have sponsored someone, with those having done so in the last year down two percentage points year on year (from 37% to 35%) and those having done so in the last four weeks down from 11% to 9%.
Detailed findings
Overall participation in charitable
activity down in 2017

| 7CAF UK GIVING 2018 CAF UK GIVING 2018
The cumulative effect of this is that the number of those having given money either by donating or via sponsorship decreased between 2016 and 2017.
When looking at a combination of donating money to charity and sponsoring someone, 37% had done so in the last four weeks, which is down from 39% in 2016. This small decrease can be attributed predominantly to the two percentage point decrease among those sponsoring someone in the last four weeks.
32% 30%34%
32% 32% 33% 32%29% 28%
32%36% 37%
4% 6% 8% 9%12%
15%12%
9% 9% 11%7% 5%
Donated
Sponsored
January
Febru
ary
March
AprilMay
JuneJuly
August
Septem
ber
October
November
Decem
ber
Figure 2: Which, if any, of the following have you done in the last four weeks?(Donated money to charity, sponsored someone for a charity)
Base: All adults 16+ (n=12,211)
As mentioned at the start of this report, we are now in a position where we can look at every month of the calendar year. When we do this, we see clear differences on the peaks for donating vs sponsorship. It is perhaps of no surprise that sponsorship peaks over the summer months, when many sporting events take place that people obtain sponsorship for including runs and walks of various distances. This peaks at 15% in June but falls to 4% in January. This is a similar pattern to what we saw in 2016. However, in 2016, September was also a key month for sponsorship (14%) but this same month in 2017, sponsorship dropped to 9%. Although we do not know the exact reason for this, it may be that in 2016 there was an ‘Olympics bounce’ in people embarking on sporting sponsored events around the time of the Rio de Janeiro Olympics in August of this year.
In terms of donating money, the peak months for giving are November and December at 36% and 37% respectively having donated in the last four weeks compared to an average across all months of 32%. This is again a similar trend to that seen in 2016, when these were the two months with the highest levels of giving and is likely related to various campaigns such as the Poppy Appeal, Movember and #givingtuesday running in November and the Christmas appeals of December. These months towards the end of the year are heavily saturated with established campaigns.
The donating figure for December is consistent with 2016, when 38% reported giving, and giving to ‘homeless people, housing and refuge shelters in the UK’ (25%) remains higher in December than other months suggesting that this is a cause area particularly supported in this month.
Although November was one of the top two months for donating in 2017, this was down considerably on 2016, when we saw 41% having given in the last four weeks compared to 36% in November 2017 and is in fact the biggest drop year on year within any given calendar month. During November, donors
% sponsoring
someone down in 2017

8 | CAF UK GIVING 2018
were more likely to have given to ‘children or young people’ (32%) and to charities that fall into the ‘other’ category (26%), with 47% of these directly mentioning either the Royal British Legion or the Poppy Appeal, highlighting the impact of the major appeals.
As we saw in 2016, November (51%), followed by December (47%) saw the highest proportions of donors using cash to give in the last four weeks compared to the rest of the year, highlighting the campaign-led ad hoc nature of giving towards the end of the year.
Among those who reported donating to charity, over half (52%) said they used Gift Aid on their donation, consistent with the level we saw in 2016. Gift Aid use was lowest in December (46%) and November (48%), further highlighting the spontaneous nature of giving in these months but also demonstrating that charities are losing out on valuable Gift Aid income during these high giving months. This perhaps demonstrates the point that the UK population is good at reactive giving such as response to appeals and campaigns but less so at planned giving.
1.2 Volunteering In 2017, one in six (17%) said they had volunteered for a charity over the last year, while almost one in ten (9%) reported doing so in the last four weeks. Both of these figures are identical to the increased levels we saw in 2016 suggesting that this is a trend.
Women remain more likely to have volunteered in the last year than men (19% vs. 15% of men).
Similarly to 2016, the highest levels of volunteering in the last year were reported amongst full time students. Positively, the level of volunteering amongst this group has actually increased from 23% to 27% this year.
The increased sample size for this year’s report has enabled us to look at more demographic breakdowns and from this we can see that those working part time (less than 8 hours a week) are equally as likely as students to have volunteered in the last year. This is likely due to the higher level of time available to these groups, the continuing existence of the ‘gig economy’, as well as the encouragement schools and universities give to volunteer.
CAF has written extensively about encouraging people to give in different ways, including volunteering, through its Growing Giving work1. This includes recommendations to UCAS to recognise volunteering when evaluating university applications, a policy recommendation which has now been adopted. It also explores a post careers advice service for those of (approaching) retirement age and how they could get into volunteering.
1 https://www.cafonline.org/about-us/campaigns-and-public-affairs/previous-campaigns-and-projects/growing-giving
Donating money
peaks in Nov/Dec and sponsorship
in June
Full time students
and those working part timemost likely to volunteer

| 9CAF UK GIVING 2018 CAF UK GIVING 2018
1.3 Giving goods
After donating money, giving goods to charity is the second most common charitable or social action taken part in. Well over half (56%) report giving goods in the last year, while a quarter (26%) say they have done so in the last four weeks, exactly the same levels seen in 2016.
As seen in previous reports, giving goods is especially prevalent among older people. Specifically, amongst those aged 16-24 only 10% had donated in the past 4 weeks in this way, with a steady increase of about ten percentage points through the age groups, peaking at 42% of 65+ year olds. Apart from donating money, giving goods is the only charitable or social activity which increases through the age groups in this way.
Given the proliferation of older people giving goods to charity shops, this may provide an ideal place for charities to advertise volunteering opportunities amongst this age group.
1.4 Protesting and petitioning
The third most common charitable or social action engaged with is signing a petition, with 54% reporting doing so in the last year, and 26% in the last four weeks. This is very similar to the 56% and 27% respectively that we reported last year.
At the time of reporting last year, we thought this level may be a result of a number of tumultuous events across 2016, such as the EU referendum vote and the election of Donald Trump as President of the USA. It now appears however that 2016 was not a one off year in terms of people participating in these activities and demonstrates people’s increased willingness to take part. This would support the narrative that recent events have woken up a spirit of activism within the population, something we started to see in our 2016 report A Stronger Britain2 which showed that people were engaging more in their local communities and want to make a difference.
As with 2016, the age group most likely to have signed a petition in the last year is those aged 16-24 (61% vs. 49% of those aged 65+). Women are again more likely to have done this activity in the last year than men (57% vs. 51%).
Seven per cent report taking part in a public demonstration or protest in the last year, with 2% reporting doing so in the last four weeks, again both similar levels to the previous year.
Londoners are the most likely to have taken part in a public demonstration or protest in the last year (14%), likely as a result of many of the major protests taking place in the capital city. They are also most likely to have signed a petition. As with signing petitions, the youngest group are also the most likely to have protested in the last year (11% of 16-24s vs. 4% of 65+s).
2 https://www.cafonline.org/about-us/publications/2016-publications/a-stronger-britain-how-can-charities-build-post-brexit-britain
Over half signed a
petition in 2017
10 | CAF UK GIVING 2018
2.0 Who engages most?
In terms of who engages most, we see the same picture as in previous years, with women and older people overall the most likely to engage in charitable and social activities. Only 8% of women report doing none of the eight activities (shown in Figure 1), compared to double the number of men (16%). Whilst this level has remained the same for women year on year, the number of men not participating has increased, from 14%. Among all adults aged 65+, only 8% say they have done none of the activities, compared to 16% of 16-24s.
However, it is still worth noting that the type of charitable and social engagement varies by age, and there are specific actions such as volunteering, petition signing and protests that younger people are more likely to be involved in.
3.0 Frequency of giving
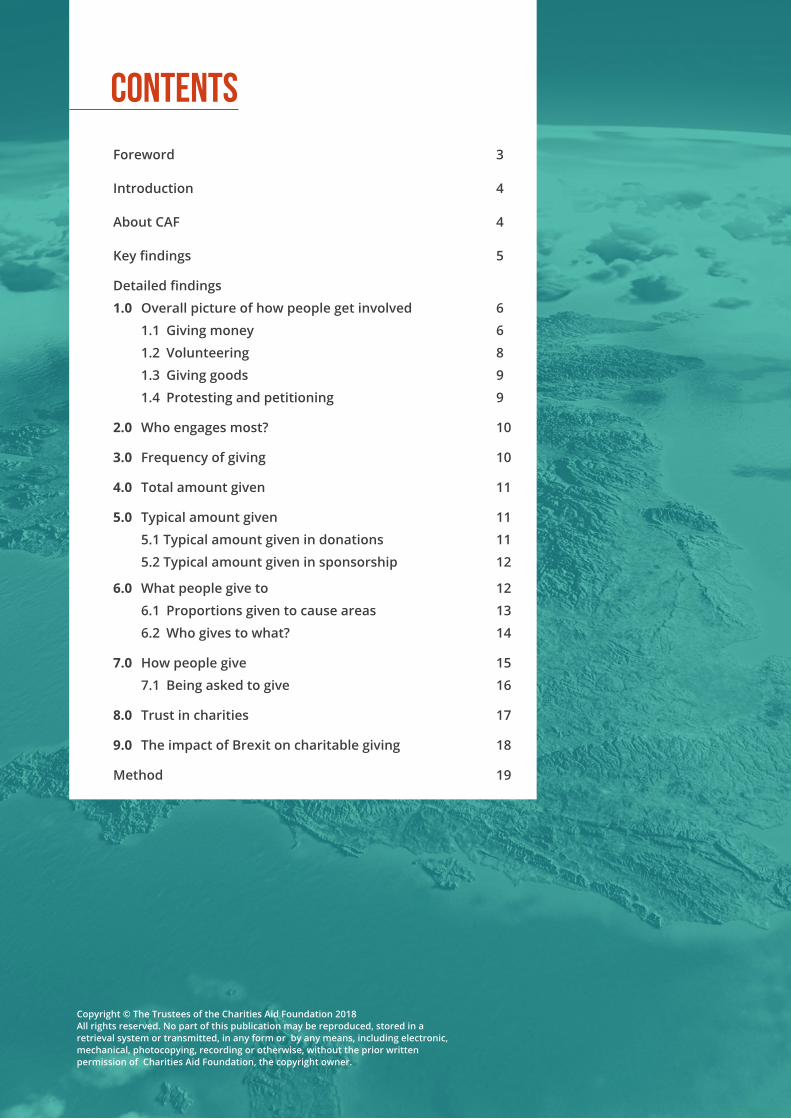
The frequency of giving in 2017 was similar to the frequency of giving seen in 2016, with the majority (51%) giving from time to time, a further quarter (25%) giving monthly, and 4% giving weekly. There remains a consistent number giving less regularly, with 13% saying they give to charity rarely and 5% stating that they never give.
Men are more than twice as likely as women to say that they rarely or never give to charity (25% vs. 12%). This may provide a starting point to policy makers trying to get more people to give, as the challenge is much more amongst men than women.
Giving weekly or monthly is more common among those in the highest social grades (39% of ABs, compared to 24% of DEs), likely due to their higher levels of disposable income.
3%
11%
51%
23%
7%3%
22%
50%
16%
6%5%
27%
52%
11%
4%5%
33%
51%
7%3%
16-24 25-44 45-64 65+
Figure 3: Which of the following best describes how often you give to charity?
Weekly Monthly From time-to-time Rarely Never
Base: All adults 16+ (n=12,211)*Don’t know figures not shown on chart
Levels of giving from time to time are fairly consistent across all age ranges, but we see that giving regularly (weekly or monthly) is significantly higher among the oldest age group (38% of those aged 65+) and giving rarely or never is significantly higher among the youngest (30% of those aged 16-24).
Fewer men are participating
in charitable or social activity in 2017 compared to
previous year
Majority continue to give infrequently,
from time to time
| 11CAF UK GIVING 2018 CAF UK GIVING 2018
4.0 Total amount given
In 2016, we factored up 8 months of results to account for a 12 month calendar year. In 2017, as we have interviewed every month, we have been able to calculate the total amount donated by taking into account all months of the year, and allow for any seasonal differences. Our research suggests a total amount donated for 2017 of £10.3 billion. This shows an increase from 2016’s figure of £9.7 billion. This however is only part of the picture and we will go on to see in the next section how fewer people are giving more to produce this total figure.
It is important to note that the UK Giving estimate for total giving is calculated from reported giving, as recalled and relayed by individual survey participants, and so is subject to respondent reliability, as well as other considerations that apply to all surveys based on a sample of a population rather than a census.
5.0 Typical amount given
5.1 Typical amount given in donations
This section focuses on the amounts given via both direct donations and sponsorship.
The median monthly amount given by a donor in 2017, either donating or sponsoring in the last four weeks, was £20, while the mean amount given was £44 3. Both of these figures were higher than those recorded in 2016 (£18 and £40 respectively). This shows that despite the fact that fewer people were giving money to charity either directly or via sponsorship, those who did give, on average gave more. Whilst it is positive that more money was donated in total to charity in 2017 and that those giving were more generous, it is however of some concern that fewer people gave overall. This ties in with a key policy question about encouraging giving and whether it should target getting those who give to give more or target getting more people to give, or indeed, a combination of both.
When examined by month, there was very little change in the median amount given month by month, with only February and December dropping below the £20 figure to £18. There was more variance in the mean amount donated in the last four weeks, with the figures ranging from £37 in October to £58 in September.
Those aged 65+ have both the highest median and mean donation amount (£22 and £50 respectively), which we also saw in 2016. However, in 2017 we saw the lowest donation figures come from those aged 25-34, with a mean of £31 and a median of £12. Previously we saw the lowest levels from the youngest age groups of 16-24 year olds. This may be due to a squeeze on wages within this slightly older age group, with added pressures on saving for house deposits, supporting children etc leading to less disposable income and in turn, lower donations to charity. This is something we shall monitor closely to see whether a generational shift is starting to occur.
In 2016, we saw that women had a higher median amount than men, while men had a higher mean. However, in 2017 this has evened out and both have a median donation amount of £20. Men continue to
3 Mean = average amount given across all individuals. Median = middle value of all amounts given by individuals.
£10.3 billion
donated to charity
in 2017
Average amounts given have
increased (but fewer giving)

12 | CAF UK GIVING 2018
have a higher mean donation amount than women (£46 vs. £42), but the gap between them has closed and is no longer significant. It is not the case that the mean has dropped for men to make them more closely aligned but that the mean for women has increased from £35 to £42, closing the gap.
5.2 Typical amount given in sponsorship
Looking just at sponsorship shows a lower level of giving than through direct donations, something we have seen before. The median sponsorship contribution is £15, while the mean is £28. Both of these figures are higher than those recorded in 2016, when the median was £10 and the mean £22.
The most popular causes to sponsor someone for have remained the same as 2016, with medical and health based charities coming out on top. Medical research (33%) was by far the most popular, followed by hospitals and hospices (24%) and physical and mental health care (21%).
6.0 What people give to
The top five causes donors report donating directly to in the last four weeks remains the same in 2017 as it was in 2016.
26% 24% 23% 23% 23%
Figure 4: Which of the following causes have you given to in the last four weeks?
Base: All adults 16+ who have donated to a charity in the last four weeks (n= 4,028)
Medical research Animal welfareChildren or
young peopleHospitals
and hospicesOverseas aid and
disaster relief
Medical research (26%), animal welfare (24%), children or young people (23%) and hospitals and hospices (23%) were the most popular causes to donate money to, all at similar levels to 2016. Overseas aid and disaster relief remains the fifth most popular cause to donate to in 2017, with nearly a quarter (23%) of donors saying they gave money to the cause. This cause has increased considerably from 19% in 2016. This rise in giving is likely due to the number of large scale, highly covered international disasters which unfortunately occurred in 2017, including the Rohingya crisis, Hurricanes Harvey and Maria, the earthquake in Mexico, and monsoon flooding and landslides in Bangladesh, Sierra Leone and Colombia. We have seen in other research that the British population is incredibly generous in response to disaster appeals and this is demonstrated by the levels giving to this cause area in 2017.
We do see seasonal differences and spikes in terms of causes given to each month, for example, children and young people reached its peak in November with a third (32%) of donors reporting giving to the
Average sponsorship
amount
increased SINCE 2016
Medical research
top cause donated to in 2017

| 13CAF UK GIVING 2018 CAF UK GIVING 2018
cause. This coincides with the televised Children in Need campaign. This once again supports the argument that the UK is in quite large part, a nation of reactive, rather than planned givers.
Consistently with previous years, the arts and sports and recreation remain the least popular causes for UK donors to give to, both 3%, and exactly the same levels as those recorded in 2016.
6.1 Proportions given to cause areas
Amongst donors who gave directly to charity, religious causes once again see by far the largest donations, with a mean donation of £59 in the last four weeks, similar to the £60 mean donation seen in 2016. This is followed by the arts (£36) and sports and recreation (£29). In 2017 the donations for schools, colleges, universities and other education fell dramatically to £21 from more than double this (£46) in 2016. The reason for this huge drop is unknown and we will continue to monitor what happens to it.
Despite the third highest mean donations, sports and recreation has the joint lowest median donation of £5, indicating that the standard donation to this cause is low, but that there are also some big ticket donations. Physical and mental health care and elderly people also saw small median donations of £5, while religious organisations continue to come out on top, with £25.
Figure 5: Proportion of total donation amount received by each cause in 2017
Base: All adults 16+ who have donated directly to a charity in the last four weeks (n=4,028)
Animal welfare8% Arts
2%
Physical and mentalhealth care
6%
Religiousorganisations
19%
Sports andrecreation
2%
Other7%
Children oryoung people
7%
Conservation, environmentand heritage
5%
Disabled people5%
Education2%
Elderly people3%
Homeless people, housingand refuge shelters
7%
Hospitals and hospices8%
Medical research8%
Overseas aid anddisaster relief
12%

14 | CAF UK GIVING 2018
Reflecting what we saw in 2016, religious organisations received 19% of the money donated in 2017, but were given to by only 15% of donors. This is due to the high level of the mean donations for this cause. Conversely, despite being the most likely cause for people to have donated to (26%), medical research only received 8% of the total donations in monetary terms. It is, however, the only cause area which occupies a place in the top three causes for both percentage of people donating and for proportion of the donations.
The majority of causes have maintained their proportion of donations received from 2016 to 2017. The biggest changes we saw were a decrease for schools and education (from 4% in 2016 to 2% in 2017), because of the drop in the mean donations for this cause area, and an increase for overseas aid and disaster relief (from 10% in 2016 to 12% in 2017). This increase can be attributed both to the larger mean donation and to the larger percentage of donors giving to the cause in 2017.
6.2 Who gives to what?
Women are more likely than men to give to several causes, including animal welfare (29% vs. 19%), hospitals and hospices (25% vs. 20%), children and young people (25% vs. 21%), and homeless people, housing and refuge shelters (21% vs. 16%). The only cause men are more likely to give to is sports and recreation (4% vs. 2% of women).
Young people are once again the most likely group to give to physical and mental health care (27% vs. 16% overall), homeless people, housing and refuge shelters (23% vs. 16% of those aged 65+) and educational institutions (9% vs. 2% of 65+). For each of these, the percentage of 16-24s having given to them has increased since 2016.
The oldest age group of 65+ year olds are the most likely to give to hospitals and hospices (29% vs. 16% of 16-24 year olds), overseas aid and disaster relief (27% vs 20% of 16-24 year olds), religious organisations (22% vs. 11% for those under 65) and elderly people (12% vs. 5% of 16-24s).
Those in social grades AB are more likely to have donated to overseas aid and disaster relief (30% vs. 23% overall), homeless people, housing and refuge shelters (22% vs. 19% overall) and conservation, the environment and heritage (17% vs. 14% overall), while those in social grades DE are more likely to have donated to animal welfare (28% vs. 24% overall) and hospitals and hospices (27% vs. 23% overall).
Londoners in 2017 were more likely than the rest of the country to give to otherwise smaller causes, including the arts (7% vs. 3% overall) and educational institutions (7% vs. 4% overall), and are also the most likely to have given to homeless people, housing and refuge shelters (23% vs. 19%). People in Northern Ireland are the most likely to have given to religious organisations (27% vs. 15% overall), people in Wales are the most likely to give to animal welfare (31% vs. 24% overall), and people in the South West are the most likely to have given to conservation, the environment and heritage (20% vs. 14% overall).
One fifth of total donations go to
religious causes
| 15CAF UK GIVING 2018 CAF UK GIVING 2018
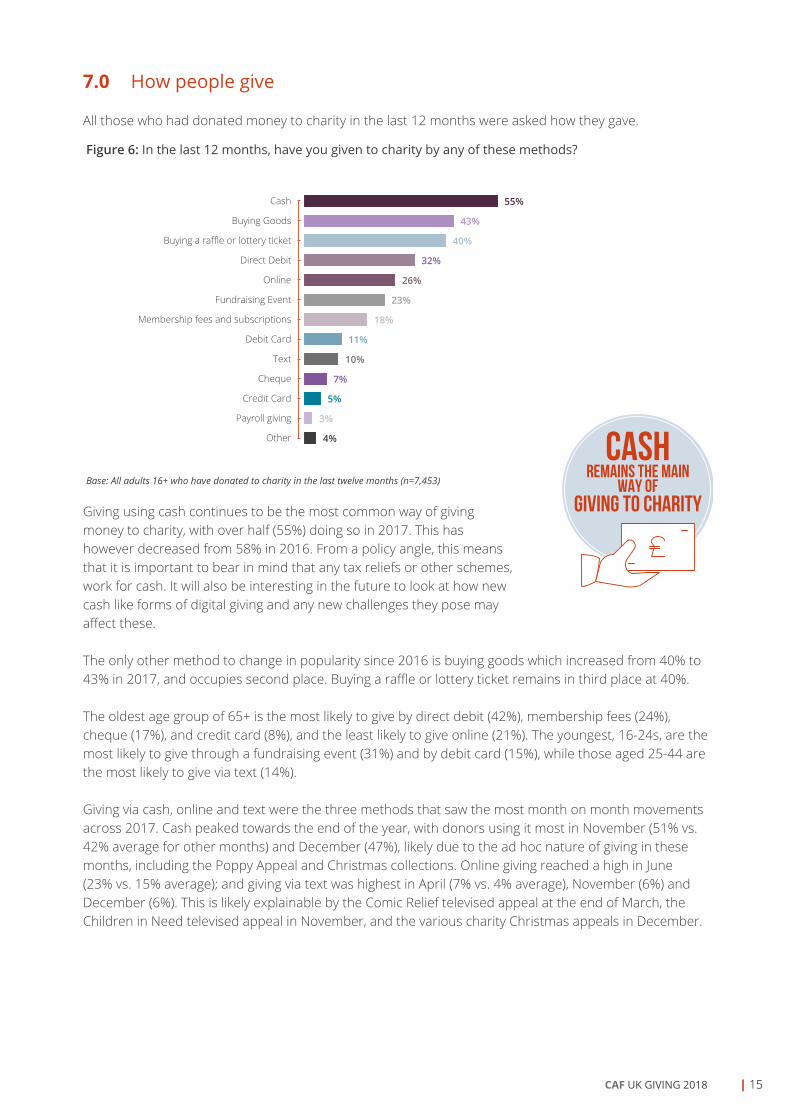
7.0 How people give
All those who had donated money to charity in the last 12 months were asked how they gave.
Figure 6: In the last 12 months, have you given to charity by any of these methods?
Base: All adults 16+ who have donated to charity in the last twelve months (n=7,453)
Cash
Buying Goods
Buying a raffle or lottery ticket
Direct Debit
Online
Fundraising Event
Membership fees and subscriptions
Debit Card
Text
Cheque
Credit Card
Payroll giving
Other
55%
43%
40%
32%
26%
23%
18%
11%
10%
7%
5%
3%
4%
Giving using cash continues to be the most common way of giving money to charity, with over half (55%) doing so in 2017. This has however decreased from 58% in 2016. From a policy angle, this means that it is important to bear in mind that any tax reliefs or other schemes, work for cash. It will also be interesting in the future to look at how new cash like forms of digital giving and any new challenges they pose may affect these.
The only other method to change in popularity since 2016 is buying goods which increased from 40% to 43% in 2017, and occupies second place. Buying a raffle or lottery ticket remains in third place at 40%.
The oldest age group of 65+ is the most likely to give by direct debit (42%), membership fees (24%), cheque (17%), and credit card (8%), and the least likely to give online (21%). The youngest, 16-24s, are the most likely to give through a fundraising event (31%) and by debit card (15%), while those aged 25-44 are the most likely to give via text (14%).
Giving via cash, online and text were the three methods that saw the most month on month movements across 2017. Cash peaked towards the end of the year, with donors using it most in November (51% vs. 42% average for other months) and December (47%), likely due to the ad hoc nature of giving in these months, including the Poppy Appeal and Christmas collections. Online giving reached a high in June (23% vs. 15% average); and giving via text was highest in April (7% vs. 4% average), November (6%) and December (6%). This is likely explainable by the Comic Relief televised appeal at the end of March, the Children in Need televised appeal in November, and the various charity Christmas appeals in December.
CASHremains the main
way of giving to charity

16 | CAF UK GIVING 2018
7.1 Being asked to give
We asked people, regardless of their giving behaviour, how they had been asked to give to charity in the last four weeks. The most common way people reported being approached to donate was on the street (37%), followed by on television (30%) and via direct mail (26%). The top three remain consistent with 2016.
In November, being approached both on the street (40%) and on television (35%) spiked to their highest point, which is consistent with Children in Need and the Poppy Appeal taking place at this time. Being asked by a friend or family member to sponsor them was highest in the summer months, reaching its peak in June (21%), and ties in with being the peak month in which people actually sponsor someone. December saw the highest level of approaches through direct mail (33%), possibly because of the charity Christmas appeals.
Young people are more likely to have been asked to give on the street (40% vs. 33% of 65+s), online (28% vs. 19% of 65+s), and at a charity event (14% vs. 10% of 65+s), while the older group are more likely to have been asked through direct mail (42% vs. 11% of 16-24s) and on the telephone (8% vs. 4% of 16-24s). These patterns are the same as we saw in 2016 and have seen in other research we have conducted.
most common way of being asked to
donateis being approached on the
street

| 17CAF UK GIVING 2018 CAF UK GIVING 2018
8.0 Trust in charities
Around half the UK population (51%) agree that charities are trustworthy, a finding that is consistent with 2016, and indicates that trust in charities has remained stable over the year. There are some small fluctuations between months, with trust reaching a peak in August (54%) and a low in December (48%), though on the whole, it remains relatively consistent throughout the year.
49%
52%
57%
51%
49%
49%
58%
53%
48%
45%
25%
27%
19%
26%
29%
28%
24%
26%
28%
27%
23%
16%
18%
19%
20%
20%
15%
18%
20%
22%
Male
Female
16-24
25-44
45-64
65+
AB
C1
C2
DE
Agree Neither agree nor disagree Disagree
Figure 7: To what extent, if at all, do you agree or disagree that most charities are trustworthy?
Base: All adults 16+ (n=12,211)*Don’t know figures not shown on chart
Demographically, women (52% vs. 49% of men), younger people aged 16-24 (57% vs. 49% of those aged 65+), and those of social grade AB (58% vs. 45% of DEs) are significantly more likely to consider charities to be trustworthy across 2017. These findings are also consistent with what we saw in 2016.
As well as looking at the agreement figures, the level of those disagreeing can reveal a lot. When looking at the results in this way, the difference between men and women becomes even more apparent, with almost a quarter (23%) of men actually disagreeing that charities are trustworthy.
Given that men were increasingly less likely to take part in any charitable or social activity, along with donating less, and are also less trusting of charities, charities themselves could be doing more to reach this group. As a sector, we should all be doing more to increase trust but from this evidence, particularly amongst men.
Although it is difficult to separate cause from effect, of those who never give to charity, 50% disagree that charities are trustworthy whilst amongst those who rarely give, the level is 32%, both much higher levels than the average.
18 | CAF UK GIVING 2018
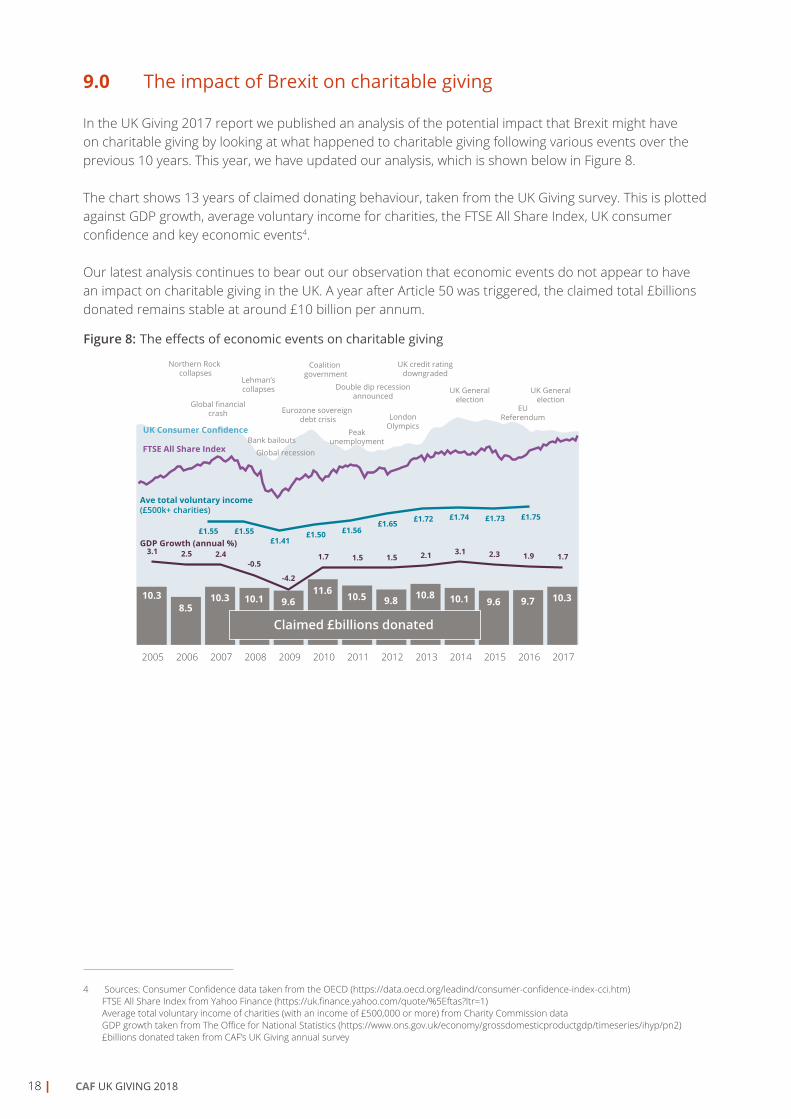
9.0 The impact of Brexit on charitable giving
In the UK Giving 2017 report we published an analysis of the potential impact that Brexit might have on charitable giving by looking at what happened to charitable giving following various events over the previous 10 years. This year, we have updated our analysis, which is shown below in Figure 8.
The chart shows 13 years of claimed donating behaviour, taken from the UK Giving survey. This is plotted against GDP growth, average voluntary income for charities, the FTSE All Share Index, UK consumer confidence and key economic events4.
Our latest analysis continues to bear out our observation that economic events do not appear to have an impact on charitable giving in the UK. A year after Article 50 was triggered, the claimed total £billions donated remains stable at around £10 billion per annum.
10.38.5
10.3 10.1 9.611.6 10.5 9.8 10.8 10.1 9.6 9.7 10.3
3.1 2.5 2.4-0.5
-4.2
1.7 1.5 1.5 2.1 3.1 2.3 1.9 1.7
2005 2006 2007 2008 2009 2010 2011 2012 2013 2014 2015 2016 2017
Claimed £billions donated
Northern Rock collapses
Coalition government
Double dip recessionannounced
GDP Growth (annual %)
Global financialcrash
Bank bailouts
Eurozone sovereign debt crisis
Global recession
LondonOlympics
Peakunemployment
Ave total voluntary income(£500k+ charities)
UK Consumer Confidence
EUReferendum
FTSE All Share Index
Lehman’scollapses UK General
electionUK General
election
£1.55 £1.55£1.41
£1.50 £1.56£1.65 £1.72 £1.74 £1.73 £1.75
UK credit ratingdowngraded
Figure 8: The effects of economic events on charitable giving
4 Sources: Consumer Confidence data taken from the OECD (https://data.oecd.org/leadind/consumer-confidence-index-cci.htm) FTSE All Share Index from Yahoo Finance (https://uk.finance.yahoo.com/quote/%5Eftas?ltr=1) Average total voluntary income of charities (with an income of £500,000 or more) from Charity Commission data GDP growth taken from The Office for National Statistics (https://www.ons.gov.uk/economy/grossdomesticproductgdp/timeseries/ihyp/pn2) £billions donated taken from CAF’s UK Giving annual survey

| 19CAF UK GIVING 2018 CAF UK GIVING 2018
CAF has been producing the UK Giving report since 2004, and has been tracking giving in the UK for several decades. In that time, there have been a number of changes to how the study is conducted in terms of approach and questions asked.
During 2016 the UK Giving survey transitioned from a quarterly face to face survey with 1,000 responses each time to a monthly survey with 1,000 responses conducted online. Last year was the first year we reported on this new boosted sample size. This new monthly approach enables us to level out seasonal effects as well as those established spikes in charitable giving that occur around particular high-profile events or as a result of humanitarian disasters or specific appeals. The changes also results in the ability to access an annual pool of 12,000 responses with all the advantages of sub-group analysis. This has enabled us to produce additional analysis and launch our first annual CAF Scotland Giving5 report.
Further information on the detail of transitioning the survey to this approach can be found in CAF UK Giving 2017.6
5 https://www.cafonline.org/about-us/publications/2017-publications/scotland-giving6 https://www.cafonline.org/docs/default-source/about-us-publications/caf-uk-giving-web.pdf?sfvrsn=8
Method

Registered charity number 268369
Charities Aid Foundation@cafonline
2377
C/03
18 T: +44 (0)3000 123 000E: [email protected]
Charities Aid Foundation 25 Kings Hill Avenue, Kings Hill, West Malling, Kent ME19 4TA UK