Embed Size (px)
Citation preview
Abstract. Modeling of airflow resistance in bulk grain requires knowledge of the shape, length, velocity and ultimately the tortuosity of air flow paths in the grain bulk. In this study, experiments were carried out to determine these characteristics of airflow paths by analyzing the digital images of the flow paths
obtained with a high speed camera. A 27 25 2cm rectangular box made with Plexiglas was used as the grain container (bin) to simulate two – dimensional air flow. Colored smoke with approximately the same density as the air was introduced into the grain bulk for the visualization of the airflow in the grain bulk. The effects of the airflow rates and the grain filling methods on length, velocity and tortuosity of the flow paths were studied. Soybeans with a moisture content of 8.82% on wet basis were used in the study. The images from the video of the visualized airflow patterns captured with the high speed digital camera were processed using ImageJ, a public domain Java-based image processing software developed by the United State National institute of Health, to analyze the video images frame by frame for the measurement of the size, length, tortuosity of the different flow paths, as well as air velocities. The results indicated that increasing air flow rates increased the overall average of the flow path length, tortuosity and velocity and changing filling method from loose fill to dense fill increased the average length and average tortuosity of flow path, but decreased the average velocity of the flow path.
For presentation at NABEC-CSBE/SCGAB 2012 Joint Meeting and Technical Conference
Northeast Agricultural & Biological Engineering Conference Canadian Society for Bioengineering Lakehead University, Orillia, Ontario
July 15-18, 2012
C. Nwaizu and Q. Zhang Department of Biosystems Engineering University of Manitoba, Winnipeg, MB. Canada.
Keywords. Tortuosity, Grain bulks, Airflow resistance, Pore structure, smoke, Filling methods, Flow rate.
Paper # NABEC/CSBE 12-111
Characterizing Airflow paths in Grain bulks.
A Community of
Introduction
The resistance to airflow through grain bulks is fundamental in efficient design of grain drying and aeration systems. (Shedd, 1951; Crozza et al, 1995; Pagano et al, 2000; Lukaszuk et al, 2008; Shahbai, 2011). Basically, the airflow resistance has always been empirically obtained by the measurement of pressure drop along the bed of the material being tested at different flow rates. Curves for various grains that has been established for pressure drop along the bed of the grains by Shedd (1951) was adopted as standard curves in 1996 by the American society of Agricultural Engineers (ASAE Standard, 1999). Navarro and Noyes (2002) showed that the values of the airflow resistance obtained from empirical curves were based on the assumption that resistance to airflow is constant in the volume of the grain bulks and independent of its pore structure. This assertion has been supported by several researches on resistance to airflow of grain bulks. Variables like size, shape, height, bed porosity, airflow velocity, airflow direction, moisture content, filling methods all have a significant effect on airflow resistance through grain bulks (Calderwood, 1973; Stephen and Foster, 1976; Kumar and Muir, 1986; Hood and Thorpes, 1992; Neethirajan et al, 2006; Lukaszk et al, 2008; Shahbai, 2011). And based on these real field factors that affect the airflow resistance, Jinsui et al (2006) developed a airflow resistance model that not only was expressed as a function of porosity, particle size and shape, but also assumed that the capillaries in the porous medium were tortuous, unlike the fundamental Ergun’s (1952) airflow resistance model for flow through porous media, where the tortuous nature of airflow in the porous media was not considered.
The airflow resistance model by Jinsui et al (2006) showed that flow resistance is related to the tortuous flow of air in the porous media which is often quantified by a parameter known as tortuosity (τ). This concept was first introduced by Kozeny (1927) and was later mathematically explained by Carman (1937) However, it should be noted that the nature of the tortuous path of airflow in any porous media like agricultural grain bulks is very complicated microscopically,
hence the difficult in the determination of tortuosity. Generally, tortuosity ( ) is physically defined as the ratio (or the square of the ratio) of the effective length ( ) of the fluid flow path through
the porous media to the apparent length ( ).
(1)
This equation shows that a straight channel has a tortuosity of one, while the tortuosity of a channel going through a grain bulks will have a tortuosity value greater than one. There have been many experimental methods that lead to an indirect estimation of tortuosity. Measuring a quantity termed formation factor obtained from the resistivity measurement of a given fluid in a porous medium of a known porosity, many researchers (Wyllie and Spangler, 1952; Winsauer et al, 1952; Cornell and Katz, 1953; Faris et al, 1954; Pirson, 1983; Garrouch et al, 2001; Attia, 2005) have been able to indirectly estimate the values of tortuosity for difference porous media. Garrouch et al (2001) estimated the tortuosity of variety of sandstone rock samples to be in the range of 2 to 4. And Attia (2005) in his study of rocks with porosity between 0.2 and 0.3 obtained the value of tortuosity between 1.3 and 2.
Another common method for the determination of tortuosity is through the results from diffusion measurements, by relating the diffusion coefficient measurement of a fluid in the porous media with the tortuosity (Faris et al, 1954; Brakel and Heertjes, 1974; Dogu and Smith, 1975; Barrande et al, 2007). Based on this principle, Choudhary and Horwath (1997) determined the tortuosity of various siliceous packed in a column to range between 1 and 1.3 for a porosity of
0.5. In a study of diffusion with different sizes (ranges from 30 - 40 ) of fixed bed glass beads, Barrande et al (2007) estimated the tortuosity value to be between 1.3 and 2.5.
Another method, pressure drop measurement across bulk particles, has been used by Comiti and Renaud (1989) for indirect estimation of tortuosity. Techniques like the mercury intrusion porosimetry and ultrasonic reflectivity have been suggested by Webb (2001) and Fellah et al. (2003) respectively for indirect determination of tortuosity. It can be seen from equation 1 above that the actual path length determines the tortuosity. And since the indirect determination of tortuosity sometimes results in unrealistic values of more than one thousand (Papadokostaki et al., 1998) or below one (Foster and Parrott, 1990), a more realistic direct method is needed.
Direct measurement of flow path length in porous media is possible when image analysis is used. Although, Yu et al, (2006) have used scanning electron microscopy (SEM) to calculate tortuosity from the actual flow path in pharmaceutical tablets, to our knowledge little information is available in the literature on the direct determination of tortuosity from actual flow path in grain bulks.
The objective of this study was to use image processing techniques for determination of the length, tortuosity and velocity of airflow paths in the grain bulks.
Materials and Methods
Material
The grain used in this study was soybeans. Moisture content was determined by the standard oven method using temperature setting at 1050C for 72 hours as outlined in ASAE Standard (2004). The moisture content was obtained as 8.82% w.b.
Experimental methodology
Image Acquisition
A 27 25 2cm rectangular test bin (shown in Figure 1) made with Plexiglas was used. Because the flow of air in grain bulks could only be visible at the surface of the grain bulk or the wall of the container, a narrow box was used to simulate a 2-D flow. Regin S102x colored smoke cartridge, with approximately the same density as air, producing 150 cubic feet of smoke in 45 seconds was used throughout the test. The smoke cartridge was lighted by a lighter and then
drop into the plenum which was also made with Plexiglas with a dimension of 33 6cm , connected to the base of the rectangular bin by a 65mm i.d polyvinyl chloride (PVC) pipe. A 12V 4D Coleman Quick pump was used to push the air/smoke through the test bin.
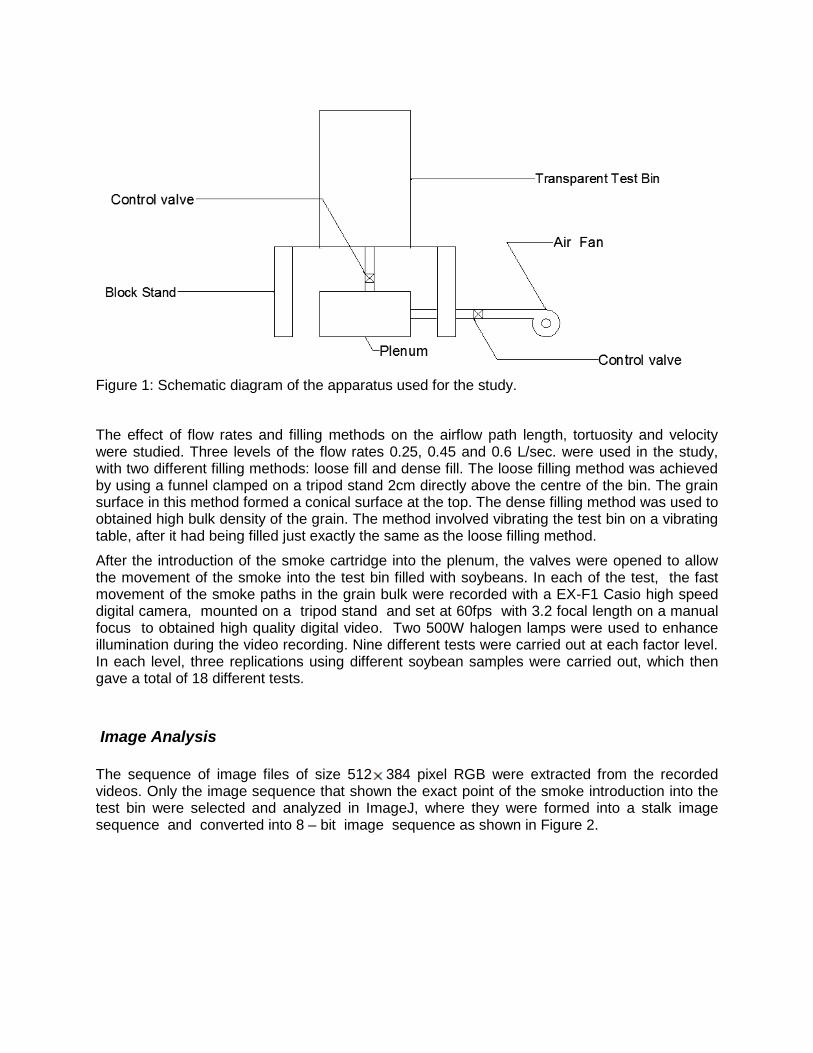
Figure 1: Schematic diagram of the apparatus used for the study.
The effect of flow rates and filling methods on the airflow path length, tortuosity and velocity were studied. Three levels of the flow rates 0.25, 0.45 and 0.6 L/sec. were used in the study, with two different filling methods: loose fill and dense fill. The loose filling method was achieved by using a funnel clamped on a tripod stand 2cm directly above the centre of the bin. The grain surface in this method formed a conical surface at the top. The dense filling method was used to obtained high bulk density of the grain. The method involved vibrating the test bin on a vibrating table, after it had being filled just exactly the same as the loose filling method.
After the introduction of the smoke cartridge into the plenum, the valves were opened to allow the movement of the smoke into the test bin filled with soybeans. In each of the test, the fast movement of the smoke paths in the grain bulk were recorded with a EX-F1 Casio high speed digital camera, mounted on a tripod stand and set at 60fps with 3.2 focal length on a manual focus to obtained high quality digital video. Two 500W halogen lamps were used to enhance illumination during the video recording. Nine different tests were carried out at each factor level. In each level, three replications using different soybean samples were carried out, which then gave a total of 18 different tests.
Image Analysis
The sequence of image files of size 512 384 pixel RGB were extracted from the recorded videos. Only the image sequence that shown the exact point of the smoke introduction into the test bin were selected and analyzed in ImageJ, where they were formed into a stalk image sequence and converted into 8 – bit image sequence as shown in Figure 2.
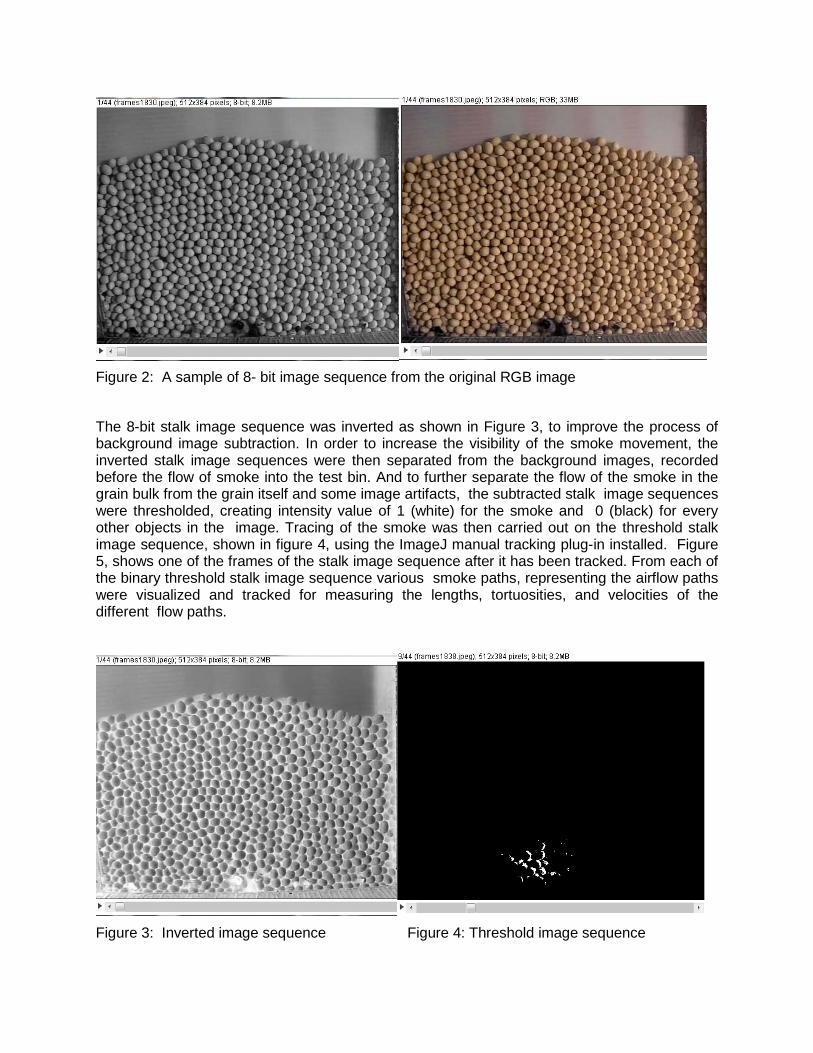
Figure 2: A sample of 8- bit image sequence from the original RGB image
The 8-bit stalk image sequence was inverted as shown in Figure 3, to improve the process of background image subtraction. In order to increase the visibility of the smoke movement, the inverted stalk image sequences were then separated from the background images, recorded before the flow of smoke into the test bin. And to further separate the flow of the smoke in the grain bulk from the grain itself and some image artifacts, the subtracted stalk image sequences were thresholded, creating intensity value of 1 (white) for the smoke and 0 (black) for every other objects in the image. Tracing of the smoke was then carried out on the threshold stalk image sequence, shown in figure 4, using the ImageJ manual tracking plug-in installed. Figure 5, shows one of the frames of the stalk image sequence after it has been tracked. From each of the binary threshold stalk image sequence various smoke paths, representing the airflow paths were visualized and tracked for measuring the lengths, tortuosities, and velocities of the different flow paths.
Figure 3: Inverted image sequence Figure 4: Threshold image sequence
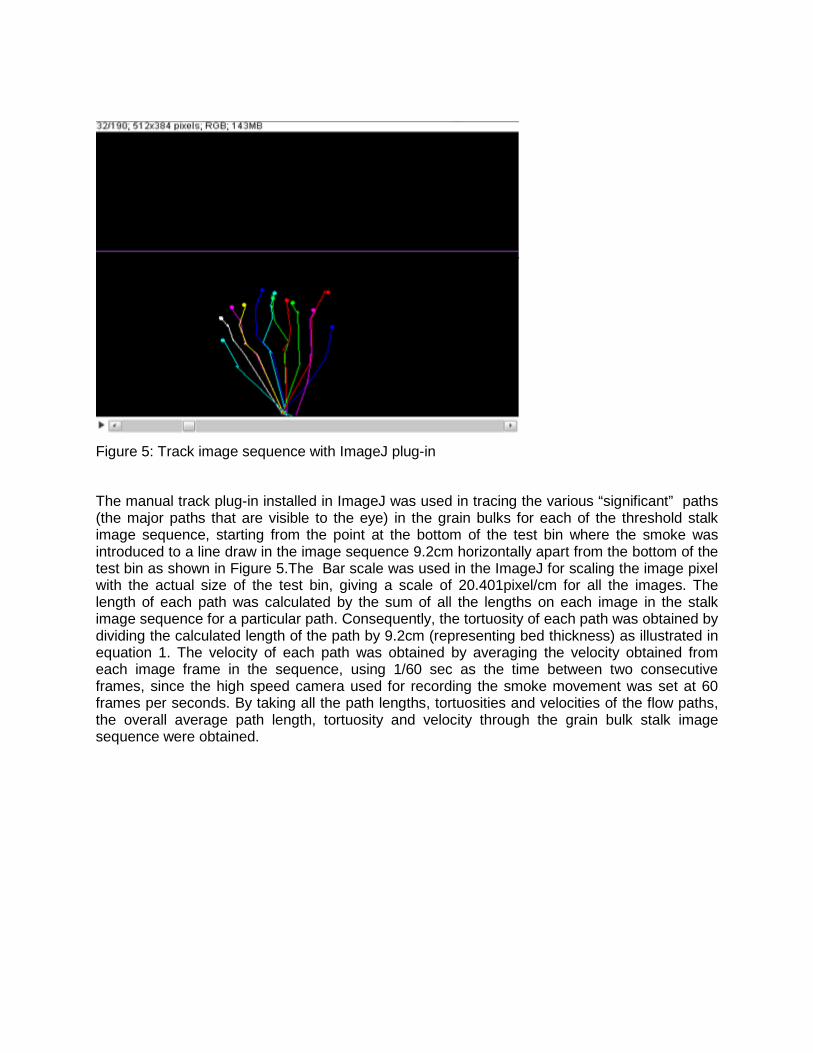
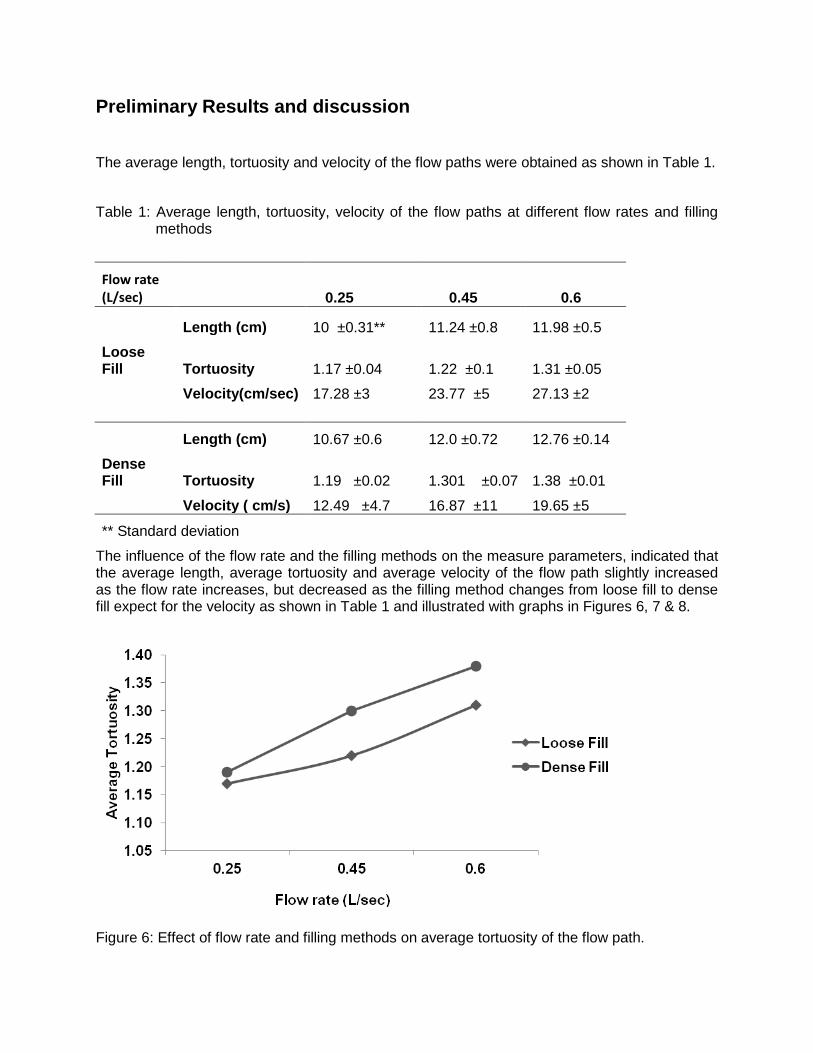
Figure 5: Track image sequence with ImageJ plug-in
The manual track plug-in installed in ImageJ was used in tracing the various “significant” paths (the major paths that are visible to the eye) in the grain bulks for each of the threshold stalk image sequence, starting from the point at the bottom of the test bin where the smoke was introduced to a line draw in the image sequence 9.2cm horizontally apart from the bottom of the test bin as shown in Figure 5.The Bar scale was used in the ImageJ for scaling the image pixel with the actual size of the test bin, giving a scale of 20.401pixel/cm for all the images. The length of each path was calculated by the sum of all the lengths on each image in the stalk image sequence for a particular path. Consequently, the tortuosity of each path was obtained by dividing the calculated length of the path by 9.2cm (representing bed thickness) as illustrated in equation 1. The velocity of each path was obtained by averaging the velocity obtained from each image frame in the sequence, using 1/60 sec as the time between two consecutive frames, since the high speed camera used for recording the smoke movement was set at 60 frames per seconds. By taking all the path lengths, tortuosities and velocities of the flow paths, the overall average path length, tortuosity and velocity through the grain bulk stalk image sequence were obtained.
Preliminary Results and discussion The average length, tortuosity and velocity of the flow paths were obtained as shown in Table 1.
Table 1: Average length, tortuosity, velocity of the flow paths at different flow rates and filling methods
Flow rate (L/sec)
0.25 0.45 0.6
Length (cm) 10 ±0.31** 11.24 ±0.8 11.98 ±0.5
Loose Fill Tortuosity 1.17 ±0.04 1.22 ±0.1 1.31 ±0.05
Velocity(cm/sec) 17.28 ±3 23.77 ±5 27.13 ±2
Length (cm) 10.67 ±0.6 12.0 ±0.72 12.76 ±0.14
Dense Fill Tortuosity 1.19 ±0.02 1.301 ±0.07 1.38 ±0.01
Velocity ( cm/s) 12.49 ±4.7 16.87 ±11 19.65 ±5
** Standard deviation
The influence of the flow rate and the filling methods on the measure parameters, indicated that the average length, average tortuosity and average velocity of the flow path slightly increased as the flow rate increases, but decreased as the filling method changes from loose fill to dense fill expect for the velocity as shown in Table 1 and illustrated with graphs in Figures 6, 7 & 8.
Figure 6: Effect of flow rate and filling methods on average tortuosity of the flow path.
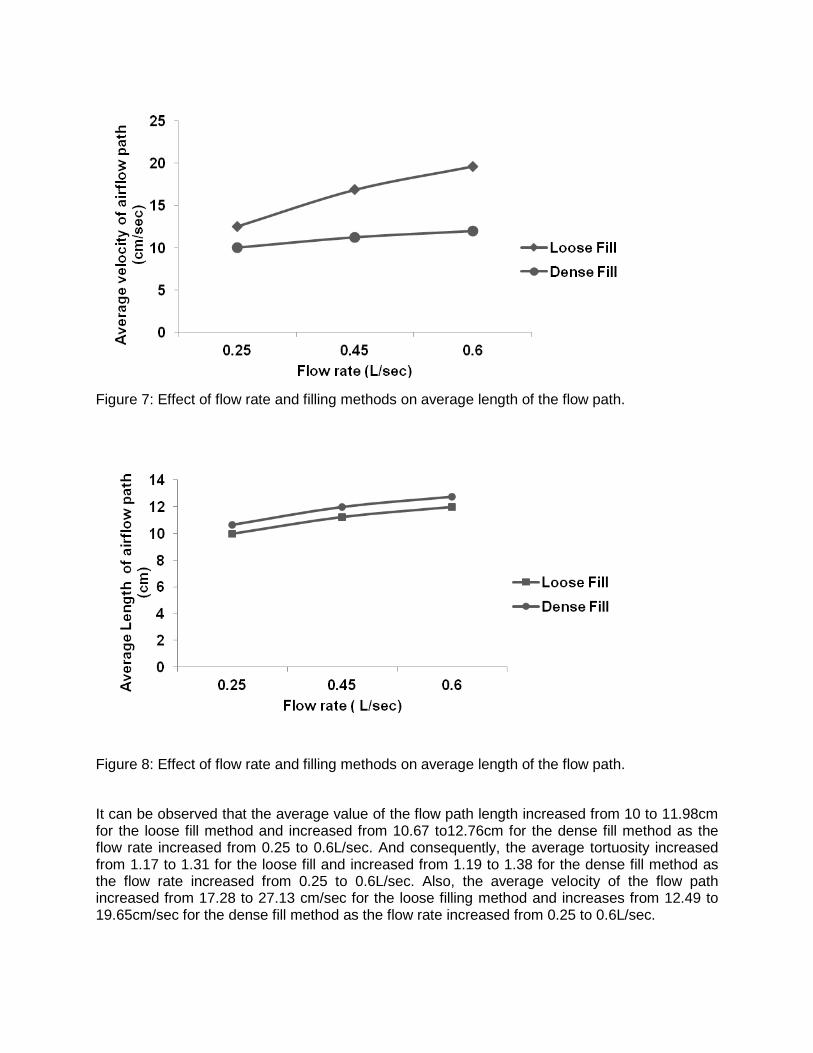
Figure 7: Effect of flow rate and filling methods on average length of the flow path.
Figure 8: Effect of flow rate and filling methods on average length of the flow path.
It can be observed that the average value of the flow path length increased from 10 to 11.98cm for the loose fill method and increased from 10.67 to12.76cm for the dense fill method as the flow rate increased from 0.25 to 0.6L/sec. And consequently, the average tortuosity increased from 1.17 to 1.31 for the loose fill and increased from 1.19 to 1.38 for the dense fill method as the flow rate increased from 0.25 to 0.6L/sec. Also, the average velocity of the flow path increased from 17.28 to 27.13 cm/sec for the loose filling method and increases from 12.49 to 19.65cm/sec for the dense fill method as the flow rate increased from 0.25 to 0.6L/sec.
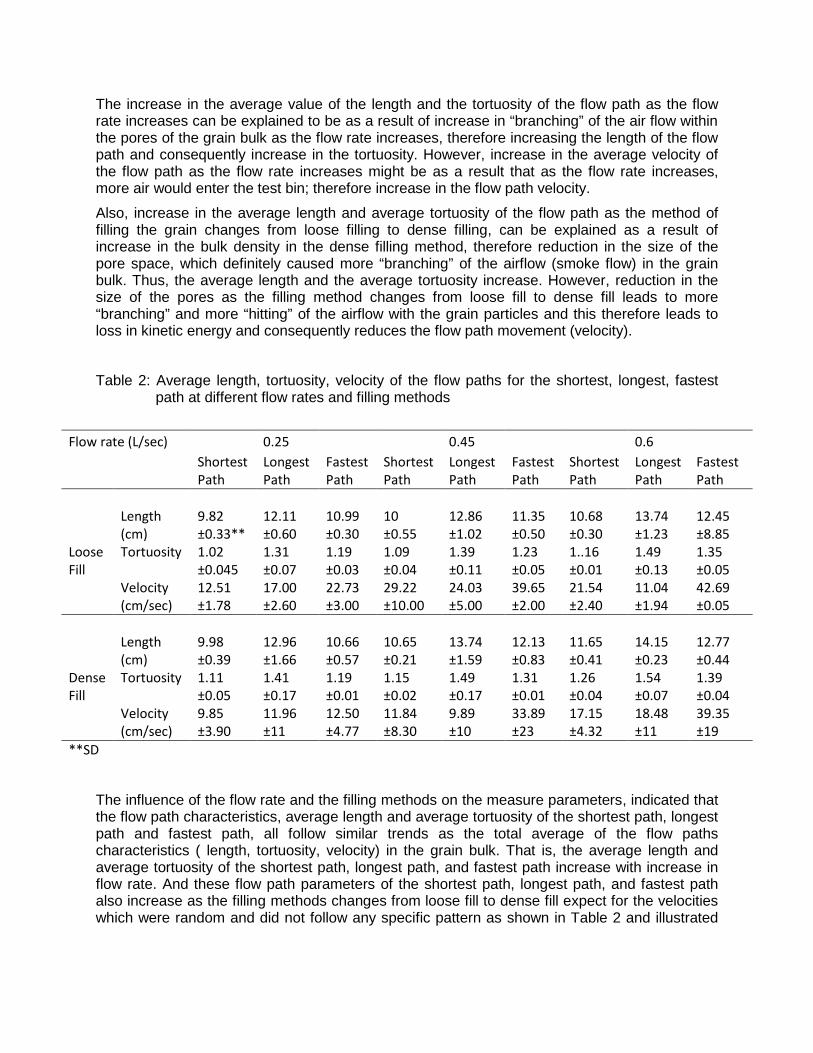
The increase in the average value of the length and the tortuosity of the flow path as the flow rate increases can be explained to be as a result of increase in “branching” of the air flow within the pores of the grain bulk as the flow rate increases, therefore increasing the length of the flow path and consequently increase in the tortuosity. However, increase in the average velocity of the flow path as the flow rate increases might be as a result that as the flow rate increases, more air would enter the test bin; therefore increase in the flow path velocity.
Also, increase in the average length and average tortuosity of the flow path as the method of filling the grain changes from loose filling to dense filling, can be explained as a result of increase in the bulk density in the dense filling method, therefore reduction in the size of the pore space, which definitely caused more “branching” of the airflow (smoke flow) in the grain bulk. Thus, the average length and the average tortuosity increase. However, reduction in the size of the pores as the filling method changes from loose fill to dense fill leads to more “branching” and more “hitting” of the airflow with the grain particles and this therefore leads to loss in kinetic energy and consequently reduces the flow path movement (velocity).
Table 2: Average length, tortuosity, velocity of the flow paths for the shortest, longest, fastest path at different flow rates and filling methods
The influence of the flow rate and the filling methods on the measure parameters, indicated that the flow path characteristics, average length and average tortuosity of the shortest path, longest path and fastest path, all follow similar trends as the total average of the flow paths characteristics ( length, tortuosity, velocity) in the grain bulk. That is, the average length and average tortuosity of the shortest path, longest path, and fastest path increase with increase in flow rate. And these flow path parameters of the shortest path, longest path, and fastest path also increase as the filling methods changes from loose fill to dense fill expect for the velocities which were random and did not follow any specific pattern as shown in Table 2 and illustrated
Flow rate (L/sec) 0.25 0.45 0.6 Shortest
Path Longest Path
Fastest Path
Shortest Path
Longest Path
Fastest Path
Shortest Path
Longest Path
Fastest Path
Length
(cm) 9.82 ±0.33**
12.11 ±0.60
10.99 ±0.30
10 ±0.55
12.86 ±1.02
11.35 ±0.50
10.68 ±0.30
13.74 ±1.23
12.45 ±8.85
Loose Fill
Tortuosity 1.02 ±0.045
1.31 ±0.07
1.19 ±0.03
1.09 ±0.04
1.39 ±0.11
1.23 ±0.05
1..16 ±0.01
1.49 ±0.13
1.35 ±0.05
Velocity (cm/sec)
12.51 ±1.78
17.00 ±2.60
22.73 ±3.00
29.22 ±10.00
24.03 ±5.00
39.65 ±2.00
21.54 ±2.40
11.04 ±1.94
42.69 ±0.05
Length
(cm) 9.98 ±0.39
12.96 ±1.66
10.66 ±0.57
10.65 ±0.21
13.74 ±1.59
12.13 ±0.83
11.65 ±0.41
14.15 ±0.23
12.77 ±0.44
Dense Fill
Tortuosity 1.11 ±0.05
1.41 ±0.17
1.19 ±0.01
1.15 ±0.02
1.49 ±0.17
1.31 ±0.01
1.26 ±0.04
1.54 ±0.07
1.39 ±0.04
Velocity (cm/sec)
9.85 ±3.90
11.96 ±11
12.50 ±4.77
11.84 ±8.30
9.89 ±10
33.89 ±23
17.15 ±4.32
18.48 ±11
39.35 ±19
**SD
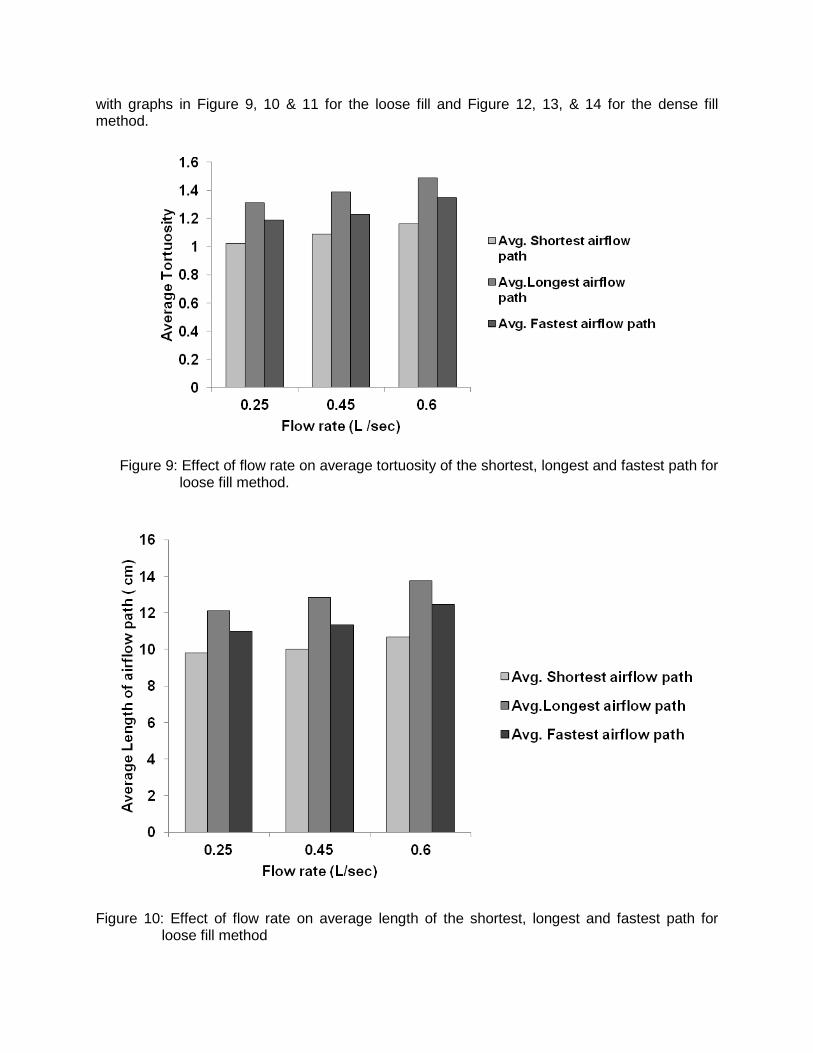
with graphs in Figure 9, 10 & 11 for the loose fill and Figure 12, 13, & 14 for the dense fill method.
Figure 9: Effect of flow rate on average tortuosity of the shortest, longest and fastest path for
loose fill method.
Figure 10: Effect of flow rate on average length of the shortest, longest and fastest path for
loose fill method
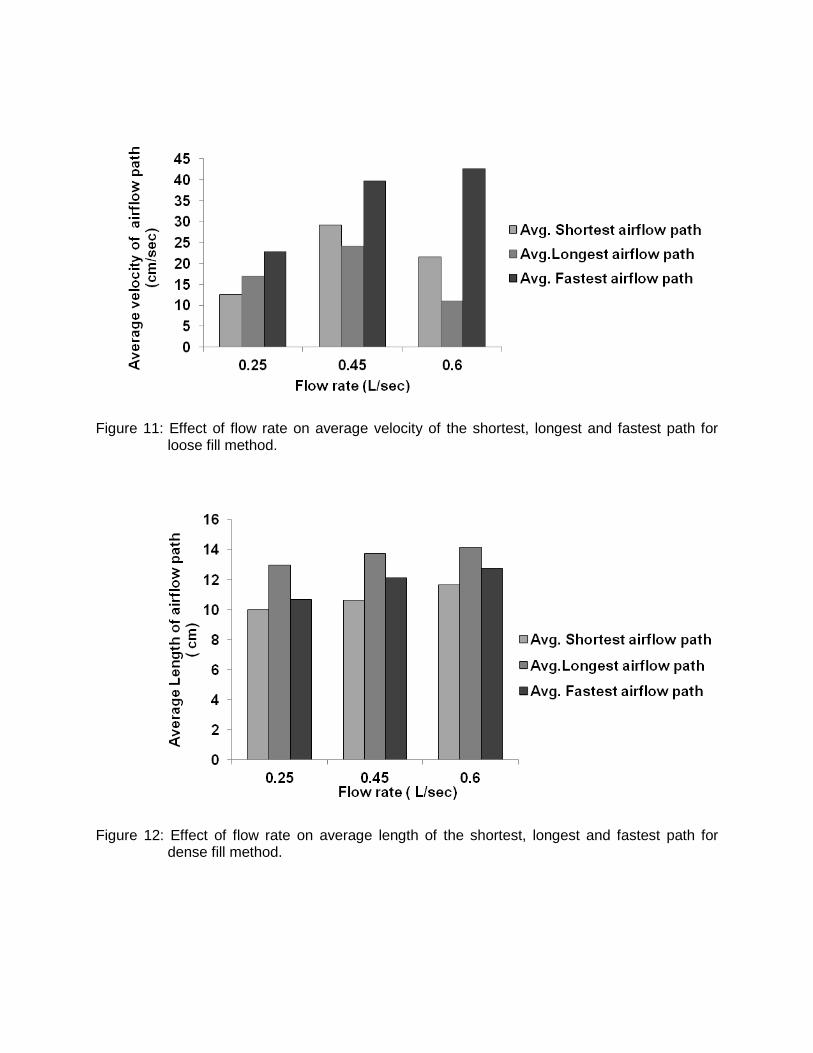
Figure 11: Effect of flow rate on average velocity of the shortest, longest and fastest path for
loose fill method.
Figure 12: Effect of flow rate on average length of the shortest, longest and fastest path for
dense fill method.
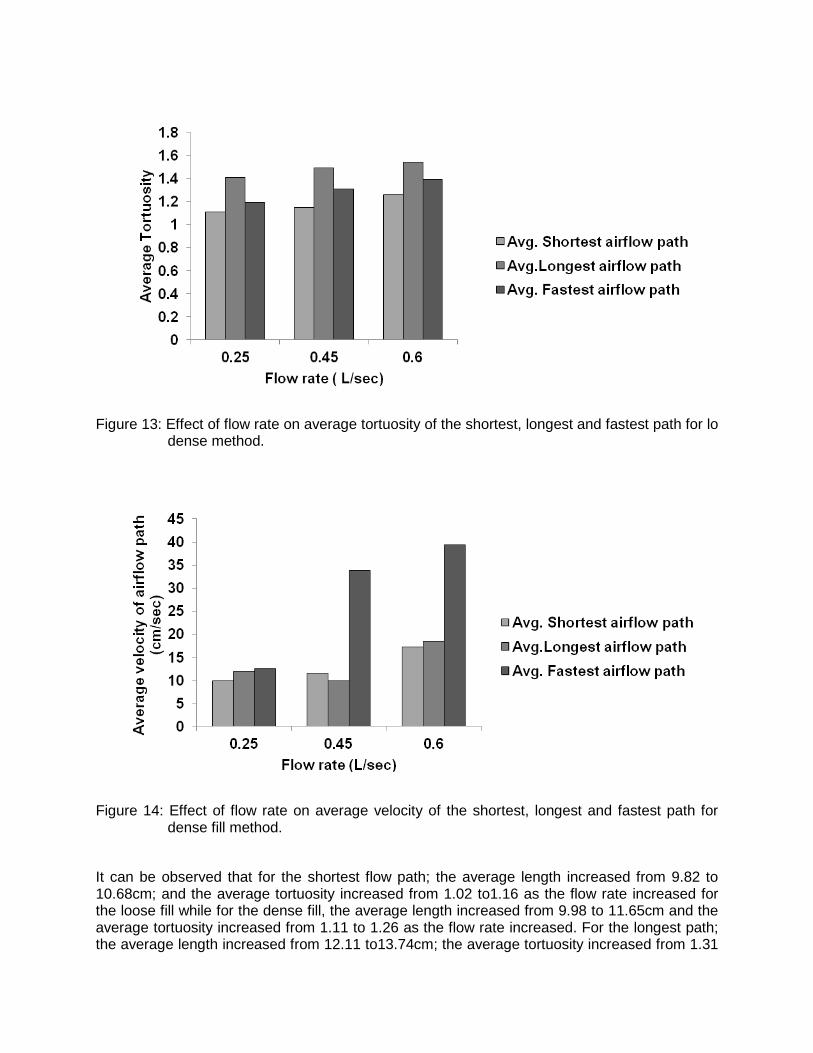
Figure 13: Effect of flow rate on average tortuosity of the shortest, longest and fastest path for lo
dense method.
Figure 14: Effect of flow rate on average velocity of the shortest, longest and fastest path for
dense fill method.
It can be observed that for the shortest flow path; the average length increased from 9.82 to 10.68cm; and the average tortuosity increased from 1.02 to1.16 as the flow rate increased for the loose fill while for the dense fill, the average length increased from 9.98 to 11.65cm and the average tortuosity increased from 1.11 to 1.26 as the flow rate increased. For the longest path; the average length increased from 12.11 to13.74cm; the average tortuosity increased from 1.31
to 1.49; as the flow rate increased for the loose fill while for the dense fill, average length increased from 12.96 to 14.15cm and the average tortuosity increased from 1.41 to1.54 as the flow rate increased. For the fastest path; the average length increased from 10 to 12.45cm; average tortuosity increases from 1.09 to 1.35; as the flow rate increased for the loose fill while for the dense fill, the average length increases from 10.65 to12.77cm and the average tortuosity increased from 1.15 to 1.39 as the flow rate increased.
The increase in the average value of the length and the tortuosity of the flow path for the shortest path, longest path and fastest path as the flow rate increases can be explained to be as a result of increase in “branching” of the air flow within the pores of the grain bulk as the flow rate increases, therefore increasing the length of the flow path and consequently increase in the tortuosity. Also, increase in the average length and average tortuosity of the flow path for the shortest path, longest path, and fastest path as the method of filling the grain changes from loose filling to dense filling, can be explained as a result of increase in the bulk density in the dense filling method, therefore reduction in the size of the pore space, which caused more “branching” of the airflow (smoke flow) in the grain bulk. Thus, the average length and the average tortuosity increased.
However, the random distribution of flow path velocity observed for the shortest path, the longest path, and the fastest path might be as a result that the resistance to air flow in porous media is not uniform (Lukaszuk et al, 2008; Shahbai, 2011).
It was of interest to observed that the fastest paths, though not always the shortest paths, was always very close to the shortest path at a low flow rate. However, at high flow rate, the fastest path was very close to the longest path observed. This observation is in consistent with the observation made by Yu et al (2006) in their study of measuring relative path length in pharmaceutical tablets. They observed that when the propagation speed is low the fastest path stayed rather straight, short and the tortuosity was only marginally higher than one. This can be explained as a result that at a low flow speed (flow rate) the “branching” of the air flow reduces drastically, unlike at high flow rates. Also, Yu et al (2006) concluded that the tortuosity values increased as the propagation speed increased for the tablet bulk, which is the same with the result in this study. It should be noted that the tortuosity values obtained in this study for the entire flow paths fall within the tortuosity range of 1.0 to 1.6, which was estimated by Yu et al (2006) over the grains and through the pores. And also the results of the shortest path tortuosity from this study, which ranges from 1.02 to 1.16 for the loose fill are consistent with the values of tortuosity for shortest path obtained theoretically by Wojciech et al (2012) and experimentally with CT image by Neethirajan et al (2006) that gave 1.15 and 1.14 respectively as the values of the tortuosity of the shortest path.
Conclusion The preliminary results from this study indicated that increasing air flow rate increased the overall average of the flow path characteristics (Length, tortuosity and velocity) and changing filling method from loose fill to dense fill increased the average length and average tortuosity of flow path, but decreased the average velocity of the flow path. Similarly, the flow path average length and average tortuosity of the shortest, longest and fastest path followed similar trends with the overall averages, except the average velocity which shows random distribution pattern.

Acknowledgements
The financial support for this project is provided by the Natural Science and Engineering Research Council of Canada (NSERC)
References ASAE Standards, MAR1996. R2011. D272.3: Resistance to airflow of grains, seeds, other
agricultural products and perforated metal sheet. St Joseph Mich: ASAE.
ASAE Standards, APR1998. R2008.S352.2: Moisture measurement – Grain and seeds. St Joseph Mich: ASAE
Attia, M. 2005. Effects of petro physical rock properties on tortuosity factor. J. Pet. Sci. Eng 48: 185 - 198
Barrande, M., R.Bouchet, and R. Denoyel. 2007. Tortuosity of porous particles. Anal. Chem. 79: 9115 – 9121.
Brakel, J.V, and P.M. Heertjes. 1974. Analysis of diffusion in macro porous media in terms of porosity, tortuosity and constrictivity factor. Int. J. Heat. Transfer. 17: 1093-1099.
Calderwood, D.L. 1973. Resistance to airflow of rough brown and milled rice. Transactions of the ASAE 16: 525-532.
Carman, P.C. 1937. Fluid flow through a granular bed. Trans. Inst. Chem. Eng. 15:150 – 156.
Choudhary, G and C.Horvath. 1997. Dynamic of capillary electro chromatography experimental study on the electrosomtic flow and conductance in open and packed capillaries. J. Chromatogr. 781: 161 – 183.
Comiti, J, and M. Renaud. 1989. A new model for determining mean structure parameters of fixed beds from pressure drop measurement: application to beds packed ith parallelepipedal particles. Chem. Eng. Sci. 44: 1539- 1545.
Cornell, D and D.L. Katz. 1953. Flow of gasses through consolidated media. Ind. Eng. Chem. 45:2145 - 2152
Crozza, D.E., A.M. Pagano, and M.S. Nolasco. 1995. Resistance to airflow of bulk oat seeds. J. Latin. American Applied Research. 25: 249 – 252.
Dogu, G, and J.M. Smith. 1975. A dynamic method for catalyst diffusivities. AIChE. J. 21: 58
Ergun, S. 1952. Fluid flow through packed columns. Chem. Engr. Progr. 48: 89 – 94.
Faris, S.R., L.S. Gournay., L.B. Lipson, and T.S. Webb. 1954. Verification of tortuosity equations. Bull. Am. Assoc. Pet. Geol. 38:2226 -2234.
Fellah, Z.E.A., W. Fellah. W. Lauriks and C. Depollier. 2003. Direct and inverse scattering of transient acoustic waves by a slab of rigid porous material. J. Acoust. Soc. Am. 113: 61 -73.
Foster, T.P, and E.L. Parrott. 1990. Release of highly water – soluble medicinal compounds from inert, heterogeneous matrices in physical mixtures. J. Pharm. Sci. 79: 806 – 810.
Garrouch, A.A, and H.M.S. Lababidi. 1995. An Inverted petrophysical model for shay sands. In sittu 19: 125-232
Hood, T.J. A., G.R. Thorpes. 1992. The effects of the anisotropic resistance to airflow on the design of aeration systems for bulk stored grains. Agricultural Engineering Australia 21:18 – 23.
Jinsui, W., Y. Boming, and Y. Meijuan. 2007. A resistance model for flow through porous media. Transp. Porous. Med. 71: 331 – 343.
Kozeny, J. 1927. Uber Kapillare leitung des wassers im boden. Sitzungbererichte der Akadamie der Wissenschaftung in Wein Abeilung 136: 271 – 301
Kumar, A., W.E. Muir. 1986. Airflow resistance of wheat and barley affected by airflow direction, filling method and dockage. Transaction of the ASAE 29(6):1423 – 1426.
Lukaszuk, J., M. Molenda, and J. Horabik. 2006. Influence of the method sample formation on airflow resistance in wheat, Acta. Agrophysica 8: 881 – 891.
Navarro, S and R. Noyes. 2002. The mechanics and physics of modern grain aeration management. Boca Raton: CRC Press.
Neethirajan, S., C. Karunakaran., D.S.Jayas, and N.D.G. White. 2006. X- ray computed tomography image analysis to explain the airflow resistance differences in grain bulks. Biosystems Engineering 94: 545 - 555.
Pagano, A.M., S.M. Crozza, and S.M. Nolasco. 2000. Airflow resistance of oat seeds: effect of the airflow direction, moisture content, and foreign material. J. Drying Technology 18: 457 – 468.
Papsdokostaki, K.G., S.G. Amarantos and J.H. Petropoulos. 1998. Kinetic of release of particulate solutes incorporated in cellusic polymer matrices as a function of the solute solubility and polymer sealability. Sparingly soluble solutes. J. Appl. Polym. Sci. 67:227 – 287.
Pirson, S.J. 1983. Geological Well Log Analysis. Houston, TX: Gulf Publishing.
Shahbazi, F. 2011. Resistance of bulk chickpea seeds to airflow. J. Agr. Sci. Tech. 13:996-676.
Shedd, C.K. 1951. Some new data on resistance of grains to airflow. J. Agricultural Engineering. 32: 493 – 495
Stephen, L.E and G.H. Foster. 1976. Grain bulk properties as affected by mechanical grain spreader. Transaction of the ASAE 19 (3): 345 – 358.
Webb, P.A. 2001.An introduction to the physical characterization of materials by mercury intrusion porosimetry with emphasis on reduction and presentation of experiment data. http://www.particletesting.com/docs/intro_mip.pdf (Assessed, June 28, 2012)
Winsauer, W.O; H.M. Shearin; P.H. Masson, and M. Williams. 1952. Resistivity of brine saturated sands in relation to pore geometry. Bull. Am. Assoc. Petrol. Geol. 36: 253
Wojciech, S., Q. Zhang, and L. Chuanyum. 2012. Predicting tortuosity for airflow through porous beds consisting of randomly packed spherical particles. Transp. Porous. Med. 93: 431 – 451.
Wyllie, M.R.J, and M.B. Spangler. 1966. Application of Electrical resistivity measurement to problem of fluid flow in porous media. AIChE. J 12: 321- 329
Yu, S.W., J. Lucas., V. Van., W. Henderik, and V. Kess. 2006. The determination of relative path length as a measure for tortuosity in compacts using image analysis. Euro. J. of Pharm. Sci. 28: 434 – 440.

NOTE:
Papers presented at CSBE/SCGAB meetings are considered the property of the Society. In general, the Society reserves the right of first publication of such papers in complete form; however, CSBE/SCGAB has no objections to publication, in condensed form with credit to the Society and the author, in other publications prior to use in Society publications. Permission to publish a paper in full may be requested from the CSBE/SCGAB Secretary ([email protected]). The Society is not responsible for statements or opinions advanced in papers or discussions at its meetings.