Embed Size (px)
Citation preview

Street Vendors in Nakuru, KenyaStreet Vendors in Nakuru, Kenyaby Grace Nyonyintono Lubaale and Owen Nyang`oro September 2013
Nakuru
IEMS Informal EconomyMonitoring StudyIEMS Informal EconomyMonitoring Study

Informal Economy Monitoring Study: Waste Pickers in Nakuru, Kenya Field research for this report was conducted in Nakuru between August–September 2012. The Nakuru Research Team consisted of: Grace Lubaale, Evalyne Wanyama, Owen Nyang’oro, and Charles Munene Kiura.
AuthorsGrace Nyonyintono Lubaale is an urban planner and researcher; and currently Strategic Advisor, Kenya Urban Sector for UN-Habitat. His main interests include: planning, urban poverty and policy research, and consultancy in strategic planning and management of local development, evaluation research and advocacy. Grace’s professional experience covers community, civil society, national and local government, academic and bilateral and multilateral contexts in East, Central, Southern and West Africa.
Owen Nyang`oro is a lecturer at the School of Economics, University of Nairobi, Kenya. His interests are in applied economic research focusing mainly on finance, monetary and development economics. His previous work has mainly covered investment climate, decentralization, competition among firms, cost modelling and macroeconomic projections and risk monitoring. He has provided his expertise on an advisory capacity to Government, International and private organizations.
Membership-Based Organization CoordinatorFrancis Kapere is a social scientist with a Diploma in Business Studies and a Degree in Sociology (bias in Micro Credit Management and Community Development).
He has previously worked for CARE International, SANA International, and PENDEZA Africa among other organizations. Francis is currently the National Coordinator for Kenya National Alliance of Street Vendors and Informal Traders (KENASVIT) and based in Nakuru, Kenya.
Technical AdvisorMelanie Samson is WIEGO’s Africa Waste Sector Specialist and postdoctoral fellow at the Public Affairs Research Institute in Johannesburg. She has a PhD in political science from York University. Melanie has published widely on the privatization of waste, as well as the politics and political economy of inclusive municipal waste management systems. Melanie is the editor and primary author of Refusing to be Cast Aside: Waste Pickers Organizing Around the World.
AcknowledgementsThis report, written by Grace Nyonyintono Lubaale and Owen Nyang’oro, was based on qualitative and quantitative research they led in Nakuru. The qualitative team comprised Grace Lubaale and Evalyne Wanyama, while the quantitative team comprised Owen Nyang’oro and Charles Munene Kiura. Messrs: Francis Kapere and Muraya Karuiki of KENASVIT provided support as the local partner in a membership-based organization. Both Melanie Samson and Sally Roever of WIEGO provided substantive editing, advice and support with the writing of this report. We are grateful to the research participants for the untiring support and thoughtfulness they patiently offered as they explained and analyzed various aspects of their everyday lives.
This research report was commissioned to contribute to public debate and to invite feedback on informal economy development, policy, and practice. The views expressed are those of the authors and not necessarily those of WIEGO or KENASVIT.
Publication date: September 2013
ISBN number: 978-92-95095-80-9
Published by Women in Informal Employment: Globalizing and Organizing (WIEGO). A Charitable Company Limited by Guarantee – Company No. 6273538, Registered Charity No. 1143510
WIEGO Secretariat WIEGO Limited Harvard University 521 Royal Exchange 79 John F. Kennedy Street Manchester M2 7EN Cambridge, MA 02138, USA United Kingdom
www.wiego.org
Copyright © WIEGO. This report can be replicated for educational and organizing purposes as long as the source is acknowledged.
Full citation: Lubaale, Grace N. and Owen Nyang’oro. 2013. Informal Economy Monitoring Study: Street Vendors in Nakuru, Kenya. Manchester, UK: WIEGO.
Cover photograph by: Pius Mburu of Gathanga Studios
Design by: Julian Luckham of Luckham Creative

About the Informal Economy Monitoring Study The Informal Economy Monitoring Study (IEMS) is a major, longitudinal study of the urban informal economy being undertaken initially at two points in time, 2012 and 2015, in 10 cities around the world: Accra, Ghana; Ahmedabad, India; Bangkok, Thailand; Belo Horizonte, Brazil; Bogota, Colombia; Durban, South Africa; Lahore, Pakistan; Lima, Peru; Nakuru, Kenya; and Pune, India. The study combines qualitative and quantitative research methods to provide an in-depth understanding of how three groups of urban informal workers – home-based workers, street vendors, and waste pickers – are affected by and respond to economic trends, urban policies and practices, value chain dynamics, and other economic and social forces. The IEMS will generate panel data on the urban informal economy.
In each city, a team of five researchers worked in collaboration with a local membership-based organization of informal workers from April 2012 to April 2013 to collect and analyze the first round of the data.
All city research reports, as well as sector reports (one each for home-based work, street vending and waste work), a global report, and other information on the study can be found at www.inclusivecities.org and www.wiego.org.

AbbreviationsAPDK – Association of People of Disabilities of Kenya
CBD – Central Business District
FGD – Focus Group Discussion
IEMS – Informal Economy Monitoring Study
KENASVIT – Kenya National Alliance of Street Vendors and Informal Traders
KIPPRA – Kenya Institute for Public Policy, Research and Analysis
KNBS – Kenya National Bureau of Statistics
Kshs. – Kenyan shillings
MBOs – Membership-Based Organizations
MCN – Municipal Council of Nakuru
MSE – Medium and Small Enterprises
NASTHA – Nakuru Street Traders and Hawkers Alliance
NGOs – Non-Governmental Organizations
PIEA – Participatory Informal Economy Appraisal
RBA – Retirement Benefits Authority
SACCOs – Savings and Credit Co-operative Societies
SMEP – Small and Micro-Enterprises Program
TAC – Technical Advisory Committee
WIEGO – Women in Informal Employment: Globalizing and Organizing

vStreet Vendors in Nakuru, Kenya
Table of Contents
Executive Summary 1Introduction 1Findings 1Driving Forces 1Recommendations 2
Introduction 3Study Objectives 3Conceptual Framework 3Methodology 4Brief Introduction to the Membership-Based Organization 6An Overview of Street Vending in Nakuru 6Roadmap of the Report 7
Part 1: Workers, Households & Enterprises 81.1 Introduction 81.2 Characteristics of Individual Workers and their Households 81.3 Characteristics of Workers’ Enterprises 101.4 Collective Description of the Sector Activities and Value Chains 13
Part 2: Changes in the Sector 162.1 Introduction 162.2 Negative Driving Forces 16 2.2.1 Macroeconomic Forces 17 2.2.2 Government Policy and Practices 18 2.2.3 Value Chain Dynamics 192.3 Positive Driving Forces 222.4 Responses 232.5 Intermediary Factors 24 2.5.1 Institutions and Actors 24 2.5.2 Role of Institutions in Supporting Street Vendors 26
Part 3: Linkages and Contributions 303.1 Introduction 303.2 Economic Linkages 303.3 Policy/City Linkages 323.4 Contributions of the Sector 33 3.4.1 Workers’ Contributions to the City 33 3.4.2 Sector’s Contribution to Livelihoods 34
Part 4: Policy Implications 364.1 Introduction 364.2 Key Findings 364.3 Policy Recommendations 38
References 39
Appendix 41

vi IEMS Informal Economy Monitoring Study
List of TablesTable 1 - An Overview of the IEMS 3Table 2 - Variables for Sampling 5Table 3 - Basic Household Characteristics, By Sex 8Table 4 - Household Demographics, by Sex 9Table 5 - Respondents’ Level of Education, By Sex (%) 9Table 6 - Main Source of Household Income, By Sex (%) 9Table 7 - Access to Other Types of Household Income, by Sex (%) 10Table 8 - Status in Employment, By Sex (%) 10Table 9 - Number of Paid and Unpaid Helpers, by Sex and Location (%) 11Table 10 - Earnings/Work Stability, by Sex and Location (%) 11Table 11 - Types of Support When Unable To Work, by Sex and Location (%) 12Table 12 - Type of Second Work Activity, by Sex (%) 12Table 13 - Expectations for Street Vending Work over the Next Year (%) 15Table 14 - Main Ways that Goods Are Acquired, by Location (%) 15Table 15 - Negative Driving Forces in the Informal Economy for Street Vendors 16Table 16 - Changes in Harassment by the Police over the Past 12 Months (%) 19Table 17 - Access to Basic Amenities, by Location (%) 19Table 18 - Changes in Street Vending Work over the Past Year (%) 21Table 19 - Problems Related To Product Markets and Competition (%) 21Table 20 - Main Reasons for Not Working a Usual Week Last Week (%) 22Table 21 - Positive Driving Forces in the Informal Economy for Street Vendors 23Table 22 - Main Ways of Coping with Fallen Revenues, by Location (%) 24Table 23 - Profile of Important Institutions and Actors for Street Vendors 24Table 24 - Importance of Institutions 25Table 25 - A Perspective of What Institutions Could Do to Improve Their Helpfulness 27Table 26 - Types of Organizations Identified as Being Helpful, by Sex and Location (%) 28Table 27 -Types of Organizations Identified as Being Unhelpful, by Sex and Location (%) 28Table 28 - Reported Problems with Infrastructure and Institutional Obstacles, by Usual Location (%) 29Table 29 - Main Customers or Buyers, by Location (%) 32Table 30 - Types of Services Used by Vendors, by Location (%) 32Table 31 - Mean Turnover and Working Hours, by Sex and Location 35
List of Figures, Diagrams and ChartsFigure 1 - Diagram Showing Typical Products/Services Sold by Street Vendors 14Figure 2 - Causal Flow Diagram Showing Effects of Bad Economy and How Street Vendors Cope 17Figure 3 - Causal Flow Diagram Showing How Harassment Affects Street Vendors and How They Cope 18Figure 4 - Causal Flow Diagram Showing How Lack of Capital Affects Street Vendors and How They Cope 20Figure 5 - Institutional Map Showing Important Institutions for Street Vendors 26Figure 6 - Street Vendors Sector Linkages in Nakuru: Perspective of Street Vendors’ Leaders 30Figure 7 - Backward - Forward Linkages for Street Vendors, Women who Work Outside the Stage 31Figure 8 - Backward - Forward Linkages for Street Vendors, Men Who Work at the Stage 31Figure 9 - Contribution of Street Vendor Sector to Nakuru 33Figure A1 - Map Showing Location of Street Vendors Groups in Nakuru 41

1Street Vendors in Nakuru, Kenya
Executive Summary
IntroductionRecent advancements in official statistics show that informal employment accounts for as much as 80 per cent of total non-agricultural employment in most of sub-Saharan Africa. Though some studies offer theories to explain the persistence and growth of informal employment, few have evaluated the grounded realities of work in the informal economy. The Informal Economy Monitoring Study (IEMS) seeks to fill this gap, providing credible, grounded evidence of the range of driving forces, both positive and negative, that affect conditions of work in the informal economy over time in 10 cities across nine countries. This report examines street vending – one of three sectors (along with home-based work and waste picking) explored as part of the IEMS – in Nakuru, Kenya. Informal workers and their membership-based organizations (MBOs) are at the centre of the analysis.
Both qualitative and quantitative methods are used in this study. The qualitative component consists of a participatory informal economy appraisal (PIEA), an innovative method designed to capture systematically the perceptions and understandings of 75 informal workers, in their own words, in a focus group setting. The quantitative component consists of a survey questionnaire administered to the focus group participants, plus another approximately 75 workers for a total of about 150 per city-sector. The questionnaire is designed to supplement the data collected through the focus groups by collecting information on the household profile and income sources of the workers; the asset profile of the workers’ households; detailed information on the workers’ enterprises; and linkages between the informal economy and the formal economy. The sample is comprised of women and men who are members of the Kenya National Alliance of Street Vendors and Informal Traders (KENASVIT) and who trade in the Central Business District, both within and outside “the stage” – a confluence of bus stops/stages with heavy foot traffic in central Nakuru.
FindingsThe study found that 9 in 10 street vendors in Nakuru rely on informal work as the main source of household income, whether from street vending or from the informal activities of another household member. About 91 per cent of men and 74 per cent of women (83 per cent overall) live in households for which their work as a street vendor is the main source of household income, and another 10 per cent rely on earnings from informal work by other household members. Just four per cent name formal employment as the primary source of household income; only 14 per cent have a formal worker in the household. Two per cent access government grants and less than one per cent have access to a pension. This heavy reliance on income from informal work does not reflect extremely low levels of education, however; over half the sample has at least some secondary education, and 13 per cent have post-secondary education.
The location of the street vending enterprise has a significant influence on working conditions for street vendors in Nakuru. Inside the stage, vendors are more likely to be mobile hawkers, with less stock, lower turnover, and fewer expenditures than vendors outside the stage. Vendors outside the stage are six times more likely than those inside the stage to have paid helpers who can manage the enterprise when the vendor is unable to work. Vendors inside the stage have stronger linkages to formal enterprises: nearly half of vendors inside the stage use formal enterprises as their suppliers, compared to 37 per cent of vendors outside the stage; the latter are more likely to produce their own goods or source them from other street vendors.
Driving ForcesThe study found value chain dynamics to be the most significant driving force in Nakuru’s street vending sector. Above all, a lack of capital was identified as the most common and significant problem in the sector. Street vendors related the lack of capital both to low and decreasing demand for goods and to difficulty accessing or repaying loans. Without sufficient capital, vendors are unable to maintain stock levels and keep customers; several reported that they are unable to meet their own daily needs as a result. Nearly 78 per cent of vendors said there were too few customers for their goods; the same percentage reported low profits as a problem, and two thirds complained of large variations in their income.
Urban policies and other driving forces related to the city also influence street vendors’ working

2 IEMS Informal Economy Monitoring Study
conditions. Harassment on the part of city authorities and a lack of space for vending accounted for more than half of the mentions of city-related factors in focus groups. Vendors reported that harassment often entails or leads to arrests, confiscations of merchandise, and demands for bribes, which reduce the earnings on which their households rely. Basic workplace amenities are also lacking for many vendors; two-thirds do not have access to running water and one-third lack access to a storage facility. Although high prices and a slow economy were also cited as negative macroeconomic forces, 62 per cent thought they would be able to increase their sales in the next year, and nearly two-thirds of vendors thought harassment had gone down in the past year.
In response to the challenges associated with low and falling revenues, four out of five street vendors reported that their response is simply to cut down on personal expenses. Yet institutional interventions, such as more favourable interest rates, less asset repossession, better workplace infrastructure and more affordable licences, were viewed as potentially helpful support mechanisms. Vendors’ contributions to the urban economy – as buyers from formal enterprises (including modern, multinational firms), informal firms and farms; as distributors of goods to the general public; as generators of jobs for carriers, porters, security guards, and storage space operators; and as taxpayers – call for a policy framework that can help mitigate the many sources of income loss and thereby help protect the earnings on which vendors’ households rely.
Recommendations The following policy recommendations build on the key findings of the IEMS study of street vendors in Nakuru:
1. Inclusive policy environment: Given its significant role in the urban economy, the street vending sector in Nakuru should be provided with a statutory bargaining forum in which structured dialogue with local government can address deficits in working conditions that undermine livelihoods and limit household income. This forum should address, in particular, fairness and transparency in licensing schemes; the elimination of everyday harassment of vendors, especially women, e.g. through an identity card programme and/or training of local security forces; and improvements in basic workplace infrastructure.
2. Productive formal-informal linkages: The terms on which street vendors engage in transactions with private banks and formal sector suppliers should be monitored and regulated so that small and micro enterprise stability, productivity and growth are supported.
3. Access to grants, pensions, and small business support: Households of street vendors and other informal workers should be targeted in eligibility and registration drives for government grants, pension schemes, and small business support facilities.
4. Participatory urban design: Street vendors and their membership-based organizations (MBOs) should work collaboratively with local government to design more appropriate vending zones and facilities inside the stage and at other natural markets where vendors and pedestrians congregate.
5. Local economic development partnerships: Local government should identify mechanisms for local economic development partnerships with street vendors and other business actors, e.g. to support collective wholesale purchases by street vendors and boost overall demand for goods and services.

3Street Vendors in Nakuru, Kenya
Introduction
Study ObjectivesIt is now widely recognized that the majority of workers in the developing world earn their livelihoods in the informal economy. Official statistics show that informal employment accounts for more than half of total non-agricultural employment in most regions, and as much as 82 per cent in South Asia and 80 per cent in many sub-Saharan African countries (WIEGO website 2013). Though many studies offer theories to explain the persistence, characteristics and growth of informal employment, few have evaluated the grounded realities of work in the informal economy – and none have done so over time and across a sufficiently large number of sectors and cities. The Informal Economy Monitoring Study (IEMS) seeks to fill this gap.
More specifically, the objective of the study is to provide credible, grounded evidence of the range of driving forces, both positive and negative, that affect conditions of work in the informal economy over time. The study, which places informal workers and their organizations at the center of the analysis, examines not only the impact of these forces but also informal workers’ strategic responses to them. It is based on a collaborative approach between researchers and membership-based organizations (MBOs) of informal workers to monitor, on an ongoing basis, the state of the working poor in three sectors – home-based work, street vending, and waste picking – and also to build the capacity of MBOs to assess and mediate the driving forces that affect their work. The study is based in 10 cities, as follows:
Table 1 - An Overview of the IEMS
Sector(s) Local Partner
Africa
Accra, Ghana Street Vending Institute of Statistical, Social and Economic Research (ISSER) and StreetNet Ghana Alliance
Durban, South Africa Street Vending, Waste Picking
Asiye eTafuleni (AeT)
Nakuru, Kenya Street Vending, Waste Picking
Kenya National Alliance of Street Vendors and Informal Traders (KENASVIT)
Asia
Ahmedabad, India Home-Based Work, Street Vending
Self-Employed Women’s Association (SEWA)
Bangkok, Thailand Home-Based Work HomeNet ThailandLahore, Pakistan Home-Based Work HomeNet PakistanPune, India Waste Picking Kagad Kach Patra Kashtakari Panchayat (KKPKP)
Latin America
Belo Horizonte, Brazil Waste Picking Instituto Nenuca de Desenvolvimento Sustentável de Belo Horizonte
Bogota, Colombia Waste Picking Asociación de Recicladores de Bogotá (ARB)Lima, Peru Street Vending Federación Departamental de Vendedores
Ambulantes de Lima y Callao (FEDEVAL)
Conceptual FrameworkIn the IEMS, the term “driving forces” is used to refer to systemic factors that may impact, in either positive or negative ways, the occupations or livelihoods of urban informal workers. Three categories of “driving forces” anchor the study. First, the IEMS explores the economy as a driving force: that is, the macroeconomic conditions such as inflation, recession, and patterns of growth that may influence working conditions in the informal economy. Second, the IEMS examines government policies and practice, specifically, but not exclusively, at the city level, including urban planning and policies,

4 IEMS Informal Economy Monitoring Study
zoning regulations, sector-specific policies, regulatory norms, and urban infrastructure and service delivery. Third, the IEMS considers sector-specific value chain dynamics, including the power relations between informal workers and their suppliers and buyers, and the role of intermediaries in the value chain. The framework also allows for the identification of other driving forces, such as migration, that may have a significant impact on working conditions in a particular sector or city.
The IEMS assumes that the impact of these driving forces is mediated by institutions and actors related to the particular sector under study in each city. The study examines a range of institutions including government institutions, civil society organizations, and, fundamentally, MBOs of informal workers. It explores the responses of informal workers to key driving forces in each city, and on the economic, political, and spatial linkages within each sector. Finally, through its sampling design, the study allows for comparisons at the individual level by sex (in cities in which both men and women belong to the partner MBO), employment status, and location of the workplace.
The data collection tools – i.e., the participatory focus group methodology and the survey questionnaire – were designed with reference to a few prevailing “myths” about the informal economy. Those myths were identified by the IEMS technical advisory committee (TAC) and MBO partners at a Research Design workshop in London in May 2011, and then were used to inform the study hypotheses and the design of the data collection tools. These included the following:
Myth #1: The informal economy is not linked to the formal economy. Hypothesis #1: Informal workers are closely linked to the formal economy.
Myth #2: The informal economy is not a part of the modern economy. Hypothesis #2: Informal workers are part of modern chains of production, distribution and services that download risks and costs to informal workers.
Myth #3: Informal workers intentionally “hide” from regulations and avoid the costs of formalization. Hypothesis #3: Informal workers are not hiding from regulations; rather, regulations are unknown, inappropriate, or hostile to informal workers. Hypothesis #4: Economic policies and urban reforms/policies are not supportive of urban informal livelihoods.
Myth #4: The informal economy does not contribute to the city (e.g. informal workers do not pay taxes). Hypothesis #5: Informal workers do pay taxes and other types of fees, but do not get the benefits thereof. Hypothesis #6: Informal workers contribute to the city in a variety of ways.
MethodologyThe IEMS is based on both qualitative and quantitative methods. The qualitative component consists of a participatory informal economy appraisal (PIEA), an innovative method designed to capture systematically the perceptions and understandings of informal workers in their own words, in a focus group setting.1 Each city team conducted 15 focus groups (per sector) in which nine tools – organized around the themes of sector characteristics, driving forces and responses, the institutional environment, and contributions of the sector to the city – were used to generate data related to the conceptual framework. The results of the focus groups were recorded in reports of about 12 pages, on average, immediately after each focus group was conducted; those reports were then analyzed.
The quantitative component consists of a survey questionnaire administered to the 75 focus group participants per sector, plus another approximately 75 workers in each city-sector. Thus an overall sample size of about 150 was achieved (with minor variation in the sample size in some cities/sectors). The questionnaire is designed to supplement the data collected through the focus groups by collecting information on the household profile and income sources of the workers; the assets profile of the workers’ households; detailed information on the enterprise or occupation of the workers; and linkages between the informal economy and the formal economy. The questionnaires were
1 The methodology was developed collaboratively with Caroline Moser, Angélica Acosta, and Irene Vance, who also trained the city teams in the data collection methods and later in data analysis. PIEA is an adaptation of participatory methodolo-gies developed by Chambers (1994), Moser and Holland (1997), Moser and McIlwaine (1999, 2004), and Moser, Acosta and Vásquez (2006).

5Street Vendors in Nakuru, Kenya
administered using a data-capture tool. It took approximately 90 minutes for each respondent to complete the questionnaire.
Collectively, the focus groups and questionnaires provide data on the context within which informal workers earn their livelihoods, and the forces that impact, both positively and negatively, on workers’ incomes and working conditions. We are also able to understand how workers adapt their work strategies in the face of these economic, social and institutional forces.
The sampling approach was designed to maintain comparability in the results across the 13 city-sectors, on the one hand, and to allow some flexibility as demanded by local circumstances, on the other hand. As much as possible, the following principles were followed in every city-sector: only members of the MBO were included; and each sector sample was based on two variables as shown in table 2.
Table 2 - Variables for Sampling
Sector Sampling Variable 1 Sampling Variable 2
Home-Based Work Employment Status Product Category
Self-Employed Sub-Contracted Category 1 Category 2
Street Vending Sex Location of Workplace
Women Men Central city Periphery
Waste Picking Sex Source of Materials
Women Men Fixed Variable
Each city team developed the “best sample possible” based on the sampling variables outlined above. “Best” was defined as (a) the most representative sample possible of the study population of MBO members, and (b) the most sensible, feasible, and locally appropriate sample possible. In cities where the partner MBO maintains an updated registry of members with data on the sampling variables, for example, it was possible to develop a stratified random sample that was statistically representative of the MBO population on the sampling variables. In cities where there was no accurate registry, the city team used a quota sampling approach. In each city, the local researchers worked with the MBO to identify what the best possible sample would be, based on local circumstances.
The second sampling variable – product category for home-based workers, location of workplace for street vendors, and source of materials for waste pickers – was designed to correlate with a degree of vulnerability that stems from sector-specific circumstances. In the street vending sector, for example, vendors who work in the central city are typically more vulnerable to evictions than those who work in the periphery. Each city team identified the best way to operationalize this variable according to local circumstances.
During the discussions with the leadership of the groups in Nakuru, we realized virtually all street vendors, particularly the members of the MBO, are located in what is administratively referred to as the central business district (CBD). To mitigate this challenge, we considered the physical location of the vendors. The analysis, as shown in the map prepared by leaders, revealed that almost half of the members of the MBO operate in what is popularly known as “the stage” (Appendix, figure A1). The stage is a confluence of numerous bus stop/stages distributed within a radius of about 500 metres. This area is also, arguably, the busiest within Nakuru. Therefore, the stage is considered as the central city or CBD for the purposes of the study.
Depending on the location and composition of the groups, there are varying ratios of men to women; but with a generally normal spread of youth and non-youth vendors. The vendors in the stage sell a range of goods and services. These include, but are not limited to: shoe shining, photography, fruits, sweets, soft drinks, wallets, clothing, shoes, household items, vegetables, and assorted merchandise.
In the non-city center, we used the vendors of groups that operate outside the stage. Although there are more women-only groups operating outside the stage, from the records that were provided, these are not numerous enough to justify increasing the number of women in the sample significantly. In terms of the work these vendors do, although similar to their counterparts working in the stage, there are differences. For example, these vendors also manufacture detergents and shoes, and make animal toys.

6 IEMS Informal Economy Monitoring Study
Brief Introduction to the Membership-Based OrganizationThe Kenya National Alliance of Street Vendors and Informal Traders (KENASVIT) is a network of informal traders and street vendors. The members of KENASVIT started this organization because of a strong desire to improve and secure their socio-economic conditions. KENASVIT started informally in 2002, and was registered in 2006 under the Societies’ Act of 1968. Based in Nakuru, the organization currently has members in 14 urban areas/towns of Kenya: Busia, Eldoret, Kakamega, Thika, Kisii, Kisumu, Kitale, Machakos, Migori, Mombasa, Nairobi, Nyeri, Embu, and Nakuru. KENASVIT plans to establish new branches in Bondo, Voi and Kitui towns.
The vision of KENASVIT is “to transform street vending and informal businesses into corporate establishments.” Its mission is “to organize and empower street vendors and informal traders to improve their businesses through training, access to credit, dialogue with local authorities and other relevant institutions on appropriate by-laws and policies that would give recognition to and bring to an end harassment and discrimination against street vendors and informal traders.”
Membership to KENASVIT is through specific town umbrella associations called Urban Alliances. For example, KENASVIT’s affiliate in Nakuru is called Nakuru Street Traders and Hawkers Alliance (NASTHA). NASTHA was formed in the year 2003 and its Chairman also doubles as the National Chairman of KENASVIT.
An Overview of Street Vending in NakuruWith an estimated population of 300,000 people (Republic of Kenya 2009), Nakuru town is the fourth largest in Kenya after Nairobi, Mombasa and Kisumu cities. The town lies in the Municipal Council of Nakuru (MCN), about 160 km northwest of Nairobi. Nakuru is a fast growing town. However, this growth is not without challenges. According to the Regional Business Agenda Report of 2011, there is poor service delivery by the Municipal Council; residents receive inadequate and inefficient infrastructure services (including poor water supply, an electrical supply prone to power outages and a poor road network). High land rates, unfair valuation systems, and corruption within official systems are other issues (KAM 2011).
Informal employment in Kenya is also growing quickly and involves a significant share of the urban labour force. The informal economy remains the largest source of jobs in the country, accounting for over 75 per cent of the total employment. In 2006, the informal economy grew by 6.5 per cent, creating an estimated 400,000 jobs. The formal sector, in comparison, grew by just about 2.8 per cent, accounting for only about 50,000 jobs (KNBS 2007; KIPPRA 2009).
The informal economy in Nakuru Municipality is quite visible and employs more than 10,000 traders. According to NASTHA, the number was larger in the past, but decreased as the post-election violence that rocked the country in 2008 displaced people. There is no doubt that the street vending sector is contributing its fair share in raising families and educating children (KENASVIT 2006). However, it is not possible to quantify its economic contribution to the city precisely, due to a lack of reliable information about the size and other key characteristics of this occupational sector.
Street vendors have long existed as purveyors of goods and services to a large public that spans class and income. The integral role played by street vendors in the daily lives of most of Kenya’s – and the world’s – population stands in sharp contrast to the precariousness of their own lives. Despite this, the enormous contribution of the sector to the economy has yet to be fully recognized by economists, urban planners and policymakers (Population Council 2000).
In Kenya, street vendors are a vital part of the Medium and Small Enterprises Sector (MSE) involved in trade and service provision. However, street vending is a survivalist activity because vendors’ engagement in commerce primarily involves basic and low quality forms of production with the intention of earning income to meet subsistence needs (KIPPRA 2002).
The CBD offers a wider market for the vendors. According to the NASTHA, 80 per cent of the vendors in Nakuru are located in the town’s CBD, with the key attraction being the large population of potential buyers. The most concentrated areas are the main bus stage and the main streets in the town. In the evenings, areas around the big supermarkets become popular selling points, especially for the fruit vendors. Residential areas such as Langa Langa, Ponda Mali, Free Area, and Section 58 also attract some sellers. Because most of these customers buy small quantities, they do not feel justified in travelling to the centre of town to make purchases.

7Street Vendors in Nakuru, Kenya
Most of the street vendors in Nakuru town are Kenyan nationals. However, there are a few foreign nationals from neighbouring countries.
Roadmap of the ReportThis report is organized in five parts, including this introduction. After the introduction, this paper describes the street vending sector in Nakuru based on analyses of the survey on demographic, households and enterprises characteristics. In the next two chapters, the paper presents the other quantitative and qualitative findings. These findings demonstrate the usefulness of mixed methods – combining results of the survey and qualitative research, specifically participatory research how on street vending are affected by changes in the economy and how they respond to, and cope with, these changes. The results also show the linkages in the street vending sector. The final chapter ends with an assessment of the prospects for street vendors and implications for the street vending sector.

8 IEMS Informal Economy Monitoring Study
Part 1: Workers, Households & Enterprises
1.1 IntroductionThis section provides a basic description of the workers and their enterprises. It presents the demographic characteristics of the street vendors and characteristics of their enterprises. First, the characteristics of the individual workers covered by the sample are presented by considering the household size, dependency levels, education and sources of income. An analysis of the nature of enterprises the workers are engaged in is then presented. This includes the nature of work, earnings, hours worked, and assistance with work.
1.2 Characteristics of Individual Workers and their HouseholdsThe sample consisted of 54 per cent male and 46 per cent female with half of the sample (i.e. 50 per cent) having participated in the qualitative interviews. As shown in table 3, the age of street vendors who participated in the survey ranges from 20 years to 72 years, with a mean age of 37 years and a median age of 35 years, irrespective of sex. The maximum age of vendors recorded was 72 years for men and 60 years for women. The mean household size is 4.1, with a dependency ratio in relation to household members who work of 0.47. The household size is the same for the street vendors irrespective of sex, but the dependency ratio is higher for male respondents than for female respondents at 0.48 and 0.46 respectively. The average household size from the survey is consistent with the most current data provided in the Nakuru District Development Plan (Nakuru District 2009).
The difference in the dependency ratio for men and women was not significant; however, there was marked difference in other members of the household who work. Our survey showed that almost 53 per cent of male respondents have other workers in the household. Of these, nearly three times as many have informal workers, rather than formal workers, in their households. By contrast, almost 62 per cent of female respondents indicated having other workers in their households, and the proportion of these other workers who were informal was even larger than in the men’s households. The existence of other workers in the households for women was above the overall average of 56 per cent, while that for men was below the average. Overall, 42 per cent of the street vendors’ households included other informal workers while 14 per cent of households included formal workers.
Table 3 - Basic Household Characteristics, By Sex
Men Women Total
Household size 4.10 4.10 4.12Household dependency ratio (ratio of workers to total household size) 0.48 0.46 0.47Percentage with:
Other workers in the household 52.63 61.54 55.94Other informal workers in the household 38.16 47.69 41.96Other formal workers in the household 14.47 13.85 13.99N 76 65 141
Source: Nakuru street vendor IEMS survey data (2012)
The survey, as shown in table 4, revealed that within the street vendors’ households there is an overall average of 1.7 children. There was no variation across the sexes. The number of working-age adults was slightly higher in households of women street vendors. However, the number of adults who completed secondary school was 1, on average, irrespective of sex. This was consistent with the proportion of household members who had at least completed secondary education in a household.

9Street Vendors in Nakuru, Kenya
Table 4 - Household Demographics, by Sex
Characteristics Men Women Total
Average number of children 1.71 1.66 1.70Average number of working-age adults 2.18 2.40 2.27Average number of pensioners 0.07 0.00 0.04Average number of adults who completed secondary school 1.02 0.98 0.99N 76 65 141
Source: Nakuru street vendor IEMS survey data (2012)
Education levels were relatively high for the street vendors in Nakuru. In table 5, over half of the vendors have some secondary education or higher education levels, while only 2 per cent (all of whom were women) reported having no education at all. Across sexes, male vendors were slightly more educated than female vendors: 46 per cent of male vendors had at least completed secondary education compared to almost 34 per cent of female vendors. Of these, over 9 per cent of male vendors and 6 per cent of female vendors had completed tertiary education.
Table 5 - Respondents’ Level of Education, By Sex (%)
Level of Education Men Women Total
None 0.00 4.62 2.13Some primary 11.84 12.31 12.06Completed primary 34.21 35.38 34.75Some secondary 7.89 13.85 10.64Completed secondary 31.58 21.54 26.95At least some tertiary 5.29 6.15 5.67Completed tertiary 9.21 6.15 7.80Total 100.0 100.0 100.0N 76 65 141
Source: Nakuru street vendor IEMS survey data (2012)
The survey also showed, as presented in table 6, that street vendors and their households were highly dependent on the income from informal work. Over 90 per cent of the male respondents and almost 74 per cent of female respondents reported their informal income was the main source of household income.
Table 6 - Main Source of Household Income, By Sex (%)
Main Source of Household Income Men Women Total
Your own informal business/enterprise/work 90.79 73.85 82.98Earnings from informal work by other household members 3.95 16.92 9.93Formal sector wage employment (respondent) in public sector 1.32 1.54 1.42Formal sector wage employment (respondent) in private firm 0.00 1.54 0.71Formal sector wage employment (other household members) in public sector
1.32 3.08 2.13
Other 2.63 3.08 2.84N 76 65 141
Source: Nakuru street vendor IEMS survey data (2012)

10 IEMS Informal Economy Monitoring Study
The second most common source of household income – reported by only 10 per cent of vendors, and far more commonly among the women vendors – was informal work done by other household members (table 7). Less than 5 per cent of respondents rely on formal sector wage employment, whether in public or private sector.
Table 7 - Access to Other Types of Household Income, by Sex (%)
Men Women Total
Government grants 1.32 3.08 2.13Worker’s compensation 1.32 0.00 0.71Rental income 2.63 0.00 1.42Remittances 6.58 12.31 9.22Pension 1.32 0.00 0.71N 76 65 141
Source: Nakuru street vendor IEMS survey data (2012)
Remittances were the other source of household income that most street vendors accessed. The level of access varied between the sexes. Access to remittances was twice as high for women than men (12 per cent and 7 per cent, respectively). A small proportion of women (3 per cent) and men (1 per cent) have access to government grants. However, only male workers reported receiving rental income, pension or worker’s compensation, though again the numbers were very small.
1.3 Characteristics of Workers’ EnterprisesAs shown in table 8, nearly all of the respondents – almost 99 per cent – are street vending on their own account, not as employees of someone else.
Table 8 - Status in Employment, By Sex (%)
Status of employment Men Women Total
Own account worker 97.37 100.00 98.58Employer 2.63 0.00 1.42Total 100.0 100.0 100.0N 76 65 141
Source: Nakuru street vendor IEMS survey data (2012)
The survey also revealed that stock was the biggest expenditure for the street vendors. On average, the street vendors spent Kshs.37,7522 per month on stock, which accounted for 83 per cent of their total expenditure. For vendors who work outside the stage, stock cost an average of Kshs.43,225 per month. Other significant differences, by location, were found. In all instances, vendors outside the stage reported higher – often considerably higher – costs. For example, street vendors who employed others at the stage paid less than half in total wages of what those outside the stage paid. Furthermore, the average monthly storage fees and membership fees for street vendors outside the stage were roughly twice that of their counterparts at the stage.
A very small proportion of vendors reported getting help with work, especially unpaid help. However, there was a distinction in the type of help sought that correlated to location of the vendor. Street vendors at the stage relied more on unpaid family within the week prior to the survey compared to those outside the stage, who relied more on both paid workers and unpaid non-family. For instance, as table 9 shows, 32 per cent of men and 23 per cent of women outside the stage relied on paid helpers, compared to about 8 per cent of men and 6 per cent of women at the stage. The same pattern was evident during the busiest time of the year, during which 39 per cent of men and 31 per cent of women relied on paid helpers, compared to 10 per cent of men and just under 9 per cent of women at the stage. For women alone, those operating outside the stage did not use any unpaid
2 1 Kenyan shilling = .012 US dollars at May 1, 2013, per www.xe.com’s mid-market rate.

11Street Vendors in Nakuru, Kenya
family help, while women at the stage had the highest usage of unpaid family help but did not use any unpaid non-family help. Also, female vendors use twice as much unpaid family at the busiest time of the year compared to the week prior to the survey.
The high proportion of usage of paid helpers outside the stage strongly suggests that the difference in business types between vendors at the stage and outside the stage is important. At the stage, most vendors are mobile (i.e. they were hawkers) while outside the stage most businesses operate in stalls.
Table 9 - Number of Paid and Unpaid Helpers, by Sex and Location (%)
Stage Outside the stage
Men Women Men Women
Last WeekPercentage with:
Unpaid family 5.00 8.82 3.57 0.00Unpaid non-family 2.50 0.00 14.29 7.69Paid 7.50 5.88 32.14 23.08
At the busiest time of the yearPercentage with:
Unpaid family 7.50 17.65 7.14 0.00Unpaid non-family 2.50 0.00 3.57 0.00Paid 10.00 8.82 39.29 30.77N 40 34 28 26
Source: Nakuru street vendor IEMS survey data (2012)
At least three of every five vendors indicated that their revenues had fallen over the past 12 months, with a higher proportion of vendors outside the stage indicating a decline in revenue. There was no significant variation based on sex. The results in table 10 show that almost the same proportion of women and men reported a drop in revenue over the last 12 months, with a difference of only 2 per cent between the sexes in each location. The decline in revenue is reflected in the desire to have more hours, especially by male workers outside the stage. Only about one-fifth of street vendors had a second job, whether at the stage or outside the stage. Across locations, women were slightly more likely than men to have a second job, and both men and women outside the stage were more likely to have a second job than their counterparts at the stage.
Table 10 - Earnings/Work Stability, by Sex and Location (%)
Earnings/stability
Stage Outside the stage
Men Women Men Women
Revenue fallen over past 12 months
67.50 70.59 78.57 80.77
Would have liked more hours 47.50 47.06 60.71 57.69Have a second job 17.95 20.59 21.43 26.92N 40 34 28 26
Source: Nakuru street vendor IEMS survey data (2012)
Being unable for any reason to work causes a significant interruption in the earnings of street vendors. When asked about the kind of support they received when unable to work, most vendors indicated they did not receive any support. The main differences in whether support was available were found between locations, rather than between men and women. Table 11 shows that workers at the stage were much less likely to be able to rely on someone else to help out. The analysis further shows that sex differences did not emerge when seeking support for their work if the street vendor was unable

12 IEMS Informal Economy Monitoring Study
to work. At least half of the vendors did not earn any income from their main economic activity, as there was no one to support them with work when the vendor was absent from work. However, there were a number of options available to support the workers when they were unable to work. For the workers located at the stage, most support for male vendors came from a household member, and in some cases from an employee. By contrast, female workers were more dependent on another informal worker or household member. For vendors who worked outside the stage, the highest support for men was received from an employee or household member, with friends or another informal worker making up a much smaller proportion of helpers. The women outside the stage were also supported by employees, friends and household members in respectively declining percentages. Reliance on employees by vendors outside the stage was reflected in the high proportion of paid helpers. Use of another informal worker occurred in roughly the same percentage for men outside the stage and women at the stage; however, the reasons for this were not revealed in the focus group discussions.
Table 11 - Types of Support When Unable To Work, by Sex and Location (%)
When unable to work
Stage Outside the stage
Men Women Men Women
No support 77.50 79.41 50.00 57.69An employee will take over 5.00 2.94 28.57 26.92Household member will take over 7.50 5.88 10.71 3.85Friend will take over 2.50 2.94 7.14 11.54Another informal worker will take over
2.50 8.82 7.14 0.00
N 40 34 28 26
Source: Nakuru street vendor IEMS survey data (2012)
The survey also showed that a number of street vendors had additional work. These activities usually (though not always) supplemented income received from the main activity – street vending. Table 12 shows that for almost 36 per cent of vendors, the most common second activity involved offering services, followed by selling goods (19 per cent) and producing goods (13 per cent). However, the type of second activity varied by sex. Men were involved in services, farming work, helping in a family business/farm (for free), selling goods, and working for commission. Women, on the other hand, were involved in services, producing goods for sale, and selling goods.
Table 12 - Type of Second Work Activity, by Sex (%)
Type of second work Men Women Total
Selling goods 13.33 25.00 19.35Producing goods for sale 0.00 25.00 12.90Services 40.00 31.25 35.48Farming work and breeding farming animals 20.00 6.25 12.90Working for tips 6.67 0.00 3.32Working for commission 13.33 6.25 9.68Helping for free in a family business or farm 20.00 0.00 9.68Other 13.33 6.25 9.68N 15 16 31
Source: Nakuru street vendor IEMS survey data (2012)

13Street Vendors in Nakuru, Kenya
1.4 Collective Description of the Sector Activities and Value ChainsStreet vendors in Nakuru sold a broad range of merchandise. The results of the participatory exercises3 showed that these vendors sold at least 100 different types of goods. These goods were mainly for household and personal consumption. The four main items were, in order of their frequency, fruit, vegetables, soda/drinks, and clothing. Unsurprisingly, the bulk of the street vending was carried out at the stage. Other trading was done outside the stage but this was not as voluminous and busy as inside the stage. The most common products sold outside the stage are clothing, food, drinks and personal care products.
The results also revealed important differences in the goods that men and women sold. Generally, the men sold higher value items than their female counterparts. Men sold: watches, nail files, wallets, toys, sunglasses, new clothes, shoes, trousers, jumpers, jackets, T-shirts, chains and other jewelry, socks, spices, and electronics. The women, on the other hand, sold: malimali,4 sweets, panties, bras, hair pins, fish, soap, embroidery, animal toys, turpentine, hair dressings, vegetables, puddings, and air time for mobile phones.
There were however, a number of goods that were sold by both men and women street vendors. These included: books, cigarettes, drinks such as soda and juice, biscuits, and paper bags. Figure 1 illustrates the main type of goods sold by street vendors of both sexes.
3 For the IEMS, the qualitative methodology adapted a project planning and management method, encourages participatory planning and analysis. The tool was used to explore with participants the nature of their occupations.
4 Malimali is a Kiswahili word referring to mixed or assorted goods that are conveniently sold to customers/clients. These goods include, but are not limited to the following: underwear, hair pins, caps, belts, reading glasses, wallets, batteries, radios, pens, toys, socks, sunglasses, spices, jewellery, and crockery/cutlery.

14 IEMS Informal Economy Monitoring Study
Figure 1 - Diagram Showing Typical Products/Services Sold by Street Vendors
Onions
Onions
Onions
Paperbags
Paperbags
Paperbags
Paperbags
Communication
Fruits
Fruits
Making new shoes
Making new shoes
Paper bags
Tomatoes Tomatoes
Airtime Airtime
Airtime
Airtime
Cooked Food
Service/production
Juice
Juice
Juice
Juice
Beverages Food
Kales
Kales
Water
Water Water
Water
Cigarettes
Cigarettes
Sweets
Sweets
Sweets
Tissues
Food
Shoe repair
Shoe repair
Ball pens
Ball pens
Soda
Soda
Soda
Soda
Luxuries
Match box
Match boxes
Toilet paper
Source: Focus group with two men and two women (with a baby) from inside and outside the stage, 31 July 2012
Evaluations of their expectations for street vending over the next year were mostly positive. The results in table 13 show that nearly three fourths of vendors expected they would be able to sell more products/services, and that selling prices would go up. However, the picture was not entirely positive, as 84 per cent of the vendors expected supplies to be more expensive over the next year and 83 per cent expected the number of people who sold products/services similar to theirs to increase. The expectations that competition would increase, potentially affecting returns from the business, were stronger than the expectations that the number of customers would also increase.

15Street Vendors in Nakuru, Kenya
Table 13 - Expectations for Street Vending Work over the Next Year (%)
Expectations for street vending More Less Stay the same
Would be able to sell more products/services over the next one year
73.95 22.69 3.36
Would be able to charge higher prices over the next one year 77.86 8.40 13.74Supplies would become more expensive over the next one year 84.43 9.02 6.56There would be more people buying the products/services that you sell over the next one year
64.80 26.40 8.80
There would be more people selling the products/services that you sell over the next one year
82.58 5.30 12.12
N 143
Source: Nakuru street vendor IEMS survey data (2012)
The results in table 14 show that the vendors acquired their goods both from the formal and informal sector, with a greater proportion bought from the formal sector. Most of the vendors, about two in every five, bought the goods they sold from a formal enterprise, while about one in every five bought from informal enterprises. One in every 10 bought from another street vendor or made/grew them themselves. Most vendors at the stage either bought goods from a formal or an informal enterprise. Vendors located outside the stage, while they still bought from formal and informal enterprises, were more likely than those at the stage to buy from another street vendor or make/grow the goods themselves. Most of the vendors at the stage were hawkers and they stated that they bought their goods from (formal) wholesalers. These relationships depict the link of the informal economy to the formal economy. It is also important to note that while some vendors mentioned that they bought from the informal enterprises, some of these enterprises could actually be formal but operating within the informal environment.
Table 14 - Main Ways that Goods Are Acquired, by Location (%)
Ways goods are acquired Stage Outside the stage Total
Make or grow them myself 9.72 16.98 12.80Acquire them free 1.39 0.00 0.80Buy them from another street vendor 2.78 20.75 10.40Buy them from an informal enterprise 26.39 20.75 24.00Buy them from a formal enterprise 47.22 37.74 43.20Acquire them from formal supplier to sell on commission 1.39 0.00 0.80Other 11.11 3.77 8.00Total 100.00 100.00 100.00N 72 53 125
Source: Nakuru street vendor IEMS survey data (2012)

16 IEMS Informal Economy Monitoring Study
Part 2: Changes in the Sector
2.1 IntroductionThis section discusses how the economy, the city, and sector-specific street vending value chains as driving forces influenced the working conditions of street vendors in Nakuru. The discussion then shifts to how the street vendors respond to, mitigate, and/or adapt to the adverse effects of these driving forces. Finally, the section considers the effectiveness of institutions and other actors in mediating the impacts of the driving forces.
2.2 Negative Driving ForcesAs noted above, the three main categories of driving forces investigated in the IEMS study are macroeconomic, government policies and practices, and value chains. The specific negative driving forces identified by the street vendors in focus groups are detailed in table 15.
Table 15 - Negative Driving Forces in the Informal Economy for Street Vendors
Driving Force Priority 1 Priority 2 Priority 3 Frequency
Macroeconomic 3 3 4 10
Electricity black-outs 1 1Demonstrations by matatu* operators 1 1High taxation 1 1High prices 1 2 1 4Decline in the economy 2 2Low business 1 1Government Policy – City/Urban 6 9 4 19
Harassment 3 4 1 8Poor services 1 1Lack of space 2 1 3Operating municipality receipts 1 1Lack of shelter 1 1 2Lack of water 1 1High cost of licences 1 1Lack of health services 1 1Rain/bad weather 1 1Value Chain 11 4 8 23
Time management 1 1Abuse by customers 2 2Transport 1 1Security 1 1Lack of access to capital/loans 9 1 10Low population 1 1Selling on credit 1 1
Lack of materials 2 1 3Bad quality goods 1 1Lack of discipline to deal with competition 1 1 2
* Matutu are public transport vehicles that carry between 14 and 25 passengers. Source: Grouping, listing and ranking from 15 focus groups

17Street Vendors in Nakuru, Kenya
The ranking in table 15 shows that the value chain, particularly access to capital/loans, was seen to be the most important negative driving force. This was followed by city/urban policies; unfavourable changes in the macroeconomic conditions were cited as the third negative driving force. Although street vending is largely considered to be part of the informal economy, the results in table 15 strongly suggest a close connection between the formal and informal economy, thus macroeconomic and value chain dynamics were cited as crucial negative driving forces for the street vendors. Within the macroeconomic forces, high prices were the most important negative driving force.
Government policies, especially at the city level, were important for the survival of vendors’ businesses as they affected availability and access to goods. Poor service provision increases transaction costs and affects working capital, creating a shortage of funds that leads to an inability to grow stock to match demand. This reduces profits for street vendors. When this cycle of insufficient funds is considered in the context of the value chain, the need for interventions at the national level to provide better access to capital, and the need for a clear policy on street vending at the city level, are clear.
2.2.1 Macroeconomic ForcesOur discussions with street vendors revealed different aspects of negative macroeconomic driving forces. Analysis of findings in table 15 showed a surprising complexity of macroeconomic conditions. The aspects identified ranged from high prices to a decline in the economy, electricity outages, high taxes and public transport disruptions due to the demonstrations by matutu operators. The matatu demonstrations were raised as a concern especially because these related to the increase in fuel prices, which affect the sector and result in high transport costs. Electricity was discussed as something managed at the national level that affects the entire economy. Adverse changes in the macroeconomic conditions, simply referred to in the discussions as “bad economy,” affected the street vendors in myriad ways. For instance, women street vendors who sell clothing, fruit, merchandise, shoes, vegetables, and soda at the stage and outside of the stage discussed a typical example of how a “bad economy” affects their work and how they cope. The causal flow diagram in figure 2 presents the findings of that discussion.
Elaborating the effects of the “bad economy” one of the women in the group said: “Many things are transported by vehicles. When the economy worsens, transport costs rise. Since our businesses are dependent on transport, increases in transportation costs will result in high prices of our goods” (Focus group with five women, 20 July 2012).
Another woman in this group added: “If I was selling sweets at one shilling for a sweet; when transport costs go up and I have to sell the sweet at two shillings, I will lose my customers. Therefore, we have fewer customers” (Focus group with five women, 20 July 2012).
The disruption in transport, power outages, and high taxes, while indicative of a “bad economy” all had adverse effects on the businesses of the street traders. This was mainly seen in reduced sales and income. For instance, a hairdresser remarked, “When there is no electricity I cannot work, I cannot blow dry or even make any money” (Focus group with two men and four women, 1 August 2012).
Figure 2 - Causal Flow Diagram Showing Effects of Bad Economy and How Street Vendors Cope
How street vendors are affected How they cope
Reduce our Stock
We negotiate with our customers
We opt to borrow money to survive
in business
BADECONOMY
High cost of goodsHigh
TransportationCosts
Few Customers
Reduced Stock
Dead stock
Source: Focus Group with 5 women, 20th July 2012

18 IEMS Informal Economy Monitoring Study
2.2.2 Government Policy and PracticesThe research participants prioritized a number of different negative forces related to city and state policy. As shown in table 15, these included: harassment by the municipality; poor service delivery and infrastructure; prohibitive licence fees, and lack of health services. Taken together, these driving forces relate to harassment on one hand, and poor services coupled with restricted access to the services. While the vendors also mentioned rain/bad weather, the concern was on inadequate infrastructure such as shelter in their places of work. These negative forces affected street vendors in Nakuru in diverse ways, as five men who work at the stage revealed. Their discussion of coping strategies, detailed in figure 3, indicates that vendors lose time and money because of harassment, as they have fewer hours to work and added expenditures on bribes and interest on loans.
Figure 3 - Causal Flow Diagram Showing How Harassment Affects Street Vendors and How They Cope
How they are affected Coping
You are arrested
We work for few hours
High fines Bribe Municipal
AskarisNo justice
When fined, we are forced to find money from shylock or you are jailed
Harassment by the Municipal Council
AskarisWe make losses when
arrested
Our families are affected by this
harassment
We negotiate with local government to give
us time to work
Source: Focus Group with 5 men from inside the stage, on 23rd July 2012
As shown in table 15, harassment was widely reported by the research participants. Because virtually all of the street vendors in the study identified harassment, clarification was sought. An elderly woman in a discussion with women who work outside the stage responded: “Harassment is when you are relentlessly coaxed for bribes. They take our goods… They take the confiscated goods and give to their wives. To get your goods back is real stress. And it is difficult to ever get these goods” (Focus group with five women, 18 July 2012). She also noted that bribes are sometimes taken in exchange for allocation of space to favoured traders.
In other cases, the street vendors indicated that harassment also included assault, abuse and other dehumanizing acts. But as figure 3 shows, the traders invariably found strategic ways to adapt to the harassment so they could continue trading.
The survey also asked the vendors to state the changes in harassment by the police over the past 12 months. The results, shown in table 16, reveal that about 62 per cent of the vendors stated harassment was less prevalent now than a year before, while only 17 per cent stated it was more prevalent. However, this perception varied in relation to the location of the vendor, with a greater proportion of vendors outside the stage feeling that the situation had improved. Vendors located at the stage were less likely to report a lessening of harassment. In keeping with this trend, only 9 per cent of vendors outside the stage said they had experienced a growth in harassment over the year, while almost 23 per cent of street vendors working in the stage said harassment had increased. At the same time, about 20 per cent of vendors outside the stage and 12 per cent of those at the stage stated that there was no difference in the level of harassment now and a year earlier. Unfortunately, the survey could not glean why the level of harassment may or may not have changed, and the focus group discussions did not reveal any insights into this.

19Street Vendors in Nakuru, Kenya
Table 16 - Changes in Harassment by the Police over the Past 12 Months (%)
Changes in harassment Stage Outside the stage Total
More 22.97 8.93 16.92Less 56.76 67.86 61.54Same 12.16 19.64 15.38Not applicable 8.11 3.57 6.15Total 100.00 100.00 100.00N 74 56 130
Source: Nakuru street vendor IEMS survey data (2012)
When asked about their access to basic amenities in their place of work, as shown in table 17, 82 per cent said they have access to a toilet but only 34 per cent have access to running water. However, there is a great discrepancy between locations – access to a toilet is high for vendors at the stage, while access to running water is high outside the stage. However, access to storage facilities, which about two thirds of vendors reported having, is not affected by the location of the vendor.
The other driving force was bad weather. A man with a disability who works at the stage observed:
“When the weather is good and sunny, people sit out. There are a lot of drinks and others things. But when the prices are not good sometimes we are not able to make a good profit. But when the price is good and the weather is good we are able to make very good sales and good profit. When it rains, there are few customers. We close the business very early. People complain a lot during the cold season. Customers do not buy cold drinks. Our goods are even sometimes swept off by the winds. The dust also affects our goods. This is made worse by a low supply of goods – especially when the trucks that carry those goods to Nakuru are stuck on the roads.”
Focus group with three men and two women, 27 July 2012
Table 17 - Access to Basic Amenities, by Location (%)
Access Stage Outside the stage Total
Access to running water 31.08 37.50 33.85Access to a toilet 86.49 76.79 82.31Access to storage facilities 64.86 64.29 64.62N 74 56 130
Source: Nakuru street vendor IEMS survey data (2012)
2.2.3 Value Chain DynamicsAnalysis of the data presented in table 15 shows that value chain dynamics are the most important negative driving force that street vendors face, with limited access to capital far outstripping other concerns. Named as a first priority nine times in focus groups, the lack of capital confounds the street vendors’ ability to do business. In a focus group of men and women who work outside the stage, one of the women participants observed: “It is not possible to satisfy your customers. The customer may know you sell panties and they need, say, 10 panties and you only have two! If this kind of trend continues, then you end up losing your customers” (Focus group with two men and three women, 30 July 2012).
Lack of capital is clearly a very serious problem. While its effects are devastating, the methods and strategies street vendors employ to adapt are equally risky. In a discussion with men and women street vendors who work both at the stage and outside, the widespread effects of the lack of capital emerged. These included a reduction in stock, a lack of morale for business, the inability to repay loans, and the inability to meet daily needs such as food. Similarly, so were the coping strategies. Figure 4 presents the results of the discussion.

20 IEMS Informal Economy Monitoring Study
Although it was conventional wisdom that if one lacked capital, one would invariably have to close down the business, it became evident that the impact was not straightforward and street vendors reacted in very personal ways. As shown in the following quote, the effects on vendors were serious. For instance, a woman participant in a group working outside the stage observed:
“You will be depressed; so stressed. Because whenever a customer asks for goods you do not have the goods! You are unable to care for your needs and are not even able to pay the self help group. Really the needs are more than the income. I really cannot participate in the group and that is because I lack capital. You cannot even pay your loans.”
Focus group with two men and four women, 1 August 2012.
Figure 4 - Causal Flow Diagram Showing How Lack of Capital Affects Street Vendors and How They Cope
How they are affected How they cope
Reduction in stock
Borrow from friendsClose
businessLoans from
bankLack of morale for business
Get goods on credit
Lack of Capital
Cannot meet our daily needs
Unable to buy food Borrow to
pay loansCannot repay loans Debt
ridden
Join groups
Assist one another
Assume needs
Source: Focus Group with 2 men and 4 women from inside and outside the stage, 1st August 2012
The other important negative driving force in the value chain dynamics was lack of materials. This was prioritized three times; twice as a second priority and once as third priority. Interestingly, the range of negative forces that comprised value chain dynamics suggested a genuine complexity that belies a seemingly straight-forward issue. These other forces were: time management, abuse by customers, security, low population/market, difficulty of selling items on credit, poor quality merchandise, and high cost of credit.
Even if it was not prioritized as high as capital, the gratuitous abuse of street vendors by the public was raised with much emotion during the discussions. One woman street trader in a group of vendors from outside and inside the stage remarked: “There are customers who close windows when you approach. They also abuse you. Some are good; others will buy and tell you that you should keep the change to buy milk for the children. The good ones understand; it is very possible they have gone through similar challenges in life like ours” (Focus group with two men and four women, 1 August 2012).
In another discussion, a woman who worked at the stage noted: “Customers needlessly insult you; saying ‘Why did you not go to school?’ Adding that if you had successfully gone to school, then you should have found a good job and not as a street vendor. These people think that street vending is not a job” (Focus group with five women, 16 July 2012).
The street vendors were asked questions that compare their activities with the same period last year. As shown in table 18, about three in every five vendors thought that they sold less; about the same percentage thought that they were able to charge higher prices. About four in every five vendors reported that they thought supplies have become more expensive compared to last year and about the same number also thought that there were more people selling the products/services that they sold compared to last year. However, one in every five vendors thought that there were more people buying the products/services that they sold compared to a year ago. It is also interesting to note that while 80 per cent thought that supplies have become more expensive, only 62 per cent were able to

21Street Vendors in Nakuru, Kenya
charge higher prices. This implies that almost one fifth of street vendors were unable to cope with higher prices by charging more, and are likely seeing a drop in profits or experience actual losses.
Table 18 - Changes in Street Vending Work over the Past Year (%)
More Less Stay the same
Whether you are able to sell more, less or the same amount of products/services compared with this time last year
22.38 61.54 13.99
Whether you are able to charge higher prices compared with this time last year
62.24 9.79 25.87
Whether your supplies have become more expensive compared with this time last year
79.72 5.59 11.89
Whether there are more people buying the products/services that you sell compared with this time last year
30.07 51.05 17.48
Whether there are more people selling the products/services that you sell compared with this time last year
74.13 9.09 16.08
N 143
Source: Nakuru street vendor IEMS survey data (2012)
Indeed the results in table 19 indicate that about four in every five vendors reported low profits. A similar proportion reported having too few customers for their materials or goods. However low profits were more prominent at the stage while too few customers was a more prominent problem outside the stage. Vendors at the stage are mostly mobile and have access to travellers who buy their wares, and are at times forced to charge at a lower premium when demand is low, given the kind of wares they deal in. On the other hand, most vendors outside the stage are in specific locations where access to customers is only possible when customers visit those locations; however, these vendors sell slightly higher value wares compared to vendors at the stage. The other important problems reported are large variations in sales/income (67 per cent) and too many competitors (58 per cent), with almost the same percentage irrespective of the location of the vendor. Other problems were customers who never paid their debts (34 per cent) and customers who rejected products (30 per cent).
Table 19 - Problems Related To Product Markets and Competition (%)
Stage Outside the stage Total
Too few customers of materials or goods 75.68 80.36 77.69Large variations in sales/income 66.22 67.86 66.92Low profits 83.78 70.91 78.29Customers reject products 32.88 25.45 29.69Don’t know what customers want 24.32 19.64 22.31Customers don’t pay their debts 36.49 30.36 33.85Distance from markets 9.46 33.33 19.53Too many competitors 58.11 58.18 58.14N 74 56 130
Source: Nakuru street vendor IEMS survey data (2012)
Other street vendors also alluded to the need for self-discipline. The relatively older vendors noted that their younger colleagues often suffered lack of discipline and were not patient with customers. In a group discussion with men working outside the stage, one of them cautioned:
“This bad language refers to both the vendors and customers. As vendors we can also be abusive, for instance, I tell some customers, ‘You think I am here just to answer questions instead of selling?’ Or when customers get abusive telling you: ‘You could not find something better to do? You are just a hawker!’ But a lot of the bad language

22 IEMS Informal Economy Monitoring Study
is mainly used by customers. A lot of time we have to use good language and must develop good interpersonal skills. That is the only way you can sell otherwise; you will not have any work!”
Focus group with four men, 25 July 2012.
There were workers who indicated that they did not work a usual week the week before they were interviewed. The main reasons most of them gave involved personal or family reasons, reduction or suspension of work, illness or accident, or that they had found other temporary work. However, there were certain reasons which varied by location of the vendor. In table 20, the results show that most street vendors located at the stage most often mentioned other personal or family reasons (47 per cent), other reasons not stated (18 per cent), work reduction or suspension (12 per cent), or found other temporary work (12 per cent). Street vendors operating outside the stage, on the other hand, most often mentioned other reasons not stated (50 per cent) and work reduction or suspension (36 per cent).
Table 20 - Main Reasons for Not Working a Usual Week Last Week (%)
Stage Outside the stage Total
Work reduction or suspension 11.76 35.71 22.58Vacation time or holidays/festivals 5.88 0.00 3.23Illness or accident 5.88 7.14 6.45Other personal or family reasons 47.06 7.14 29.03Found other temporary work 11.76 0.00 6.45Other 17.65 50.00 32.26N 17 14 31
Source: Nakuru street vendor IEMS survey data (2012)
As the discussions in sections 2.2.1 to 2.2.3 show, street vendors invariably responded to the negative driving forces more at a personal level than at the group level.
2.3 Positive Driving ForcesThe focus group discussions with the street vendors identified a number of positive driving forces. These are summarized in table 21.
The results of the positive driving forces in table 21 show the extent to which the negative driving forces in table 15, when addressed, could become positive driving forces. Interestingly, however, the analysis of the positive driving forces suggests that city and urban planning – while an important driving force – was not as significant as value chain dynamics and macroeconomics for the street vendors in Nakuru. It is reasonable, therefore, to argue that for street vending in Nakuru to be more productive, ensuring that the value chain is functional and the vendors have positive and supportive economic conditions is vitally important. Finally, the results in table 3.7 highlight an additional crucial factor in street vending – the capacity of the individual vendor. From the factors that comprise the capacity of the street vendors’ driving forces, important insights into the crucial elements of capacities of street vendors are revealed.

23Street Vendors in Nakuru, Kenya
Table 21 - Positive Driving Forces in the Informal Economy for Street Vendors
Driving Force Priority 1 Priority 2 Priority 3 Frequency
Value Chain 11 10 5 26
Availability of materials 2 1 3No transport needed 1 1Buy cheap 1 1Offer better quality 1 1Cleanliness/display 1 3 4Good relations with buyers 1 2 3Deal with wholesalers 1 1Security 1 1 2Capital/Loans 8 1 1 10Economic 3 2 2 7
Growing town 1 1Population 2 2Merry-go round5 1 1 2Agriculture show 1 1Cash flow 1 1City/Urban Planning 1 7 8
Workplace 2 2Licence/fees 1 1 2Peace 1 1Freedom 1 1Bad/unfavourable weather 2 2Capacity of street vendor 1 2 4 7
Better management 1 1Good business language 1 1Hard work 2 2Self discipline 1 1Patience 1 1Ability to pay on time 1 1
Source: Grouping, listing and ranking from 15 focus groups5
2.4 ResponsesAs established earlier, about three in every five vendors reported a fall in revenues over the past 12 months (see table 11). When asked to state ways of coping with fallen revenues, four in every five vendors indicated that they cut down on personal expenses; this was true irrespective of location. The other most common ways of coping mentioned are borrowing money, late payment for supplies or loans, and finding other work. Table 22 shows the details. Other options which were available but were never mentioned by the vendors are substituting non-paid family workers for paid workers,
5 A merry-go-round is a local savings pool into which members of a group all contribute, then draw lots to determine who wins the full sum. Over time, everyone wins the money.

24 IEMS Informal Economy Monitoring Study
substituting non-paid apprentices (in exchange for training) for paid workers, or having a member of the vendor’s household find additional work or start working.
Table 22 - Main Ways of Coping with Fallen Revenues, by Location (%)
Ways of coping Stage Outside the stage Total
I used fewer workers 0.00 2.22 1.04I lengthened my work day 7.84 8.89 8.33I lengthened my workers’ work day 3.92 6.67 5.21I borrowed money 31.37 40.00 35.42I was late in paying suppliers or loan payments 11.76 13.33 12.50I found other work 7.84 6.67 7.29I cut down on my personal expenses 80.39 80.00 80.21No measures were taken 3.92 2.22 3.13Other 15.69 15.56 15.63N 51 45 96
Source: Nakuru street vendor IEMS survey data (2012)
As discussed in section 2.2, the typical response to the negative driving forces was at the individual level. Except for where households loaned street vendors money to enhance or revive their business, there was no other response at the household level.
Responses at the organizational level were clustered into five specific areas. These were: hired private security to protect their goods; borrowed loans from self-help groups and micro-finance institutions; asked for goods from wholesalers on credit; sought the help of KENASVIT when harassed by the municipality; and within groups, paid for licences to the council.
2.5 Intermediary Factors
2.5.1 Institutions and ActorsIn this study, the terms institution and actors were used broadly to include organizations and even individuals who had a positive and/or negative role on the work of street vendors. The positive and negative roles were analyzed in terms of how such institutions and actors helped or hindered the work of street vendors. Institutions and actors included both those inside and outside Nakuru. Seven main types of institutions were identified: private business; the city; community; national government; NGOs; religious; and others. Table 23 shares details of these institutions and actors.
Table 23 - Profile of Important Institutions and Actors for Street Vendors
Type Institution/Actor
Private business
Wholesalers, Banks, Kenya Women Finance Trust, SMEP, Gikomba Nairobi, SACCOs, Big companies, Moneylenders, Kenya Power Company, Nakuru Central Business Association, Micro-finance institutions, Markets, Insurance companies, Transporters, Communications sector
City Municipal Council of NakuruCommunity Family, Friends, Associations, Schools, Hospital, Colleges, HostelsNational government
National Fund for the Disabled, Government, Police, Administration Police, Kenya Wildlife Service
NGOs KENASVIT, APDK, NASTHA, MASCANI, Kenya Human Rights Commission, Kenya Land Alliance
Self help groups
Merry go round, East Road Mashambani Self Help Group
Others Politicians, councilors
Source: Compiled from institutional maps and matrices from 15 focus groups

25Street Vendors in Nakuru, Kenya
In table 24 we further analyze ways in which these institutions helped and/or hindered the work of street vendors in Nakuru. The analysis shows that the municipality, banks, street vendors’ self-help groups, and business, respectively, were spoken of most times. The municipality emerges not only as the most important, but also as the most helpful and the most unhelpful. However, the street vendors acknowledge the municipality’s role in regulating their business and ensuring a supportive environment.
Interestingly, the banks and street vendors’ self-help groups are mentioned the same number of times – 13. Further analysis reveals a startling similarity in the helpfulness of these institutions. The main difference lies in the scale of the institution, whether it is providing loans or seizing street vendors’ collateral in cases of default or failure to repay loans.
Table 24 - Importance of Institutions
InstitutionNumber of times
mentionedHelp (+)
Hinder (-)
Municipality 15 30 26Wholesalers, big business, super/market 10 11 10Banks 13 22 19Churches 4 5 3Self-groups, merry-go round 13 17 12Micro-finance institutions 8 20 11APDK 3 8 2KENASVIT 3 9 1Government 3 3 1SACCOs 2 3 2Family, friends 1 1 1Moneylenders 1 1 3Police 6 6 7Politicians 4 5 7Hospital 3 2 5NASTHA 2 5Kenya Power Company 1 1 1NGOs 5 6 2Schools, colleges, hostels 3 3 3
Source: Compiled matrices of institutional interventions from 15 groups
The results in table 24 further show that according to the street vendors, only NASTHA had the reputation of being exclusively helpful. It also emerged that the moneylenders, police, politicians and hospital were more unhelpful than helpful to the street vendors in Nakuru.
The participants were asked to draw diagrams depicting the relative importance of institutions and actors, with the size of the circles related to the importance of the institution or actor. For instance, in figure 5, men and women street vendors who work inside and outside the stage showed hospitals with the biggest circle, depicting it as the most important institution. The Association of People of Disabilities of Kenya (APDK), KENASVIT, the municipality and micro-finance institutions followed this. Conversely, the police and politicians with the smallest circles represented the least important institutions for this group of street vendors.
KENASVIT, APDK, the banks, and micro-finance institutions were shown as located both inside and outside Nakuru, hence the circles representing these institutions shown as partly in and out of the biggest circle that represents Nakuru.

26 IEMS Informal Economy Monitoring Study
Figure 5 - Institutional Map Showing Important Institutions for Street Vendors
+ -
-
+
_ _
+ -
Banks+ + -
M CN- -
KENASVIT+ +
Hospitals+ + -
+ -
APDK+ +
Municipal council of Nakuru
Police
Politicians
East RoadMashambani group
Microfinanceinstitutions
Insurancecompanies
Association of People with Disability of Kenya
Communicationnetwork e.g. safaricom
Source: Focus Group with 2 men and 3 women from outside the stage, 30th July 2012
The number of plus and minus signs in the institutions was used to show how positive or negative they were considered to be. In figure 5, for this group of street vendors, the police were unhelpful, but politicians and the municipality were the most unhelpful. The street vendors’ self help groups – East Road Mashambani, KENASVIT, and APDK – were the most helpful. But of the three helpful institutions, only East Road Mashambani was located inside Nakuru and belonged to the street vendors, while KENASVIT and APDK were located both inside and outside Nakuru. The other institutions, namely communications service providers (indicated as communications network), insurance companies, banks, and micro-finance institutions were both helpful and unhelpful.
2.5.2 Role of Institutions in Supporting Street VendorsIn table 24, we showed the perceptions of importance and the extent of helpfulness of institutions that help and hinder the work of street vendors in Nakuru. In addition to specifying the ways in which institutions were helpful, in this section we share participants’ views of how such important institutions could enhance their helpfulness to the work of street vendors. Table 25 shares an illustrative view of how a specific group of street vendors who work outside the stage proposed institutions could become more helpful to street vendors.

27Street Vendors in Nakuru, Kenya
Table 25 - A Perspective of What Institutions Could Do to Improve Their Helpfulness
Institution How they help or hinder What solution should be provided
Municipal Council of Nakuru
• Give space, shades, licences• Cleaning the city• Licences are costly• Very corrupt
• Affordable licences• Improve security• Clear drainage• Provide water, street lights, and roads
Politicians • Give bad/empty promises• Waste a lot of time
• Should keep their promises• Provide good leadership
Banks • Give loans• Keep our savings• Charge high interest rates
• Should give cheap per cent (interest) on their loans
SMEP (Small Medium Enterprises Programme)
• Give loans• Expect quick repayments
• Should slow down the speed with which they repossess assets of their clients
• Bring down their interest ratesNational Council for the Disabled
• Give funds• Provide identity to the disabled• Their processes are always full of
delays
• Should keep/honour their promises
Groups (Merry go round)
• Boost us when the jobs are down through loans
• Keep our savings• Are quick to repossess assets of
members in case of default on loan repayment
• Slow down the speed with which they repossess our assets
• Should bring down their interests
Kenya Wildlife Service
• Are doing nothing to protect us from the baboons
• Should provide security at their fences to keep the baboons inside the Park with immediate effect
Source: Focus group with four men, 25 July 2012
The role of a number of organizations in the street vending sector was considered in the survey by asking whether specific organizations have been “helpful” or “unhelpful”. As table 26 shows, a greater percentage of the workers mentioned MBOs and other workers as being helpful irrespective of sex and location. Within the stage, one in every two female workers and two in every five male workers also mentioned local government as being helpful, while for workers outside the stage, about one in every three female workers and four in every five male workers mentioned local government as helpful. The high rating of MBO and local government as helpful in relation to other organizations may be due to the institutional arrangement between the MBO and the local government in Nakuru that came through a Memorandum of Agreement allowing street vendors to operate within designated areas of the town.

28 IEMS Informal Economy Monitoring Study
Table 26 - Types of Organizations Identified as Being Helpful, by Sex and Location (%)
Type of Organization
Stage Outside the stage
Men Women Men Women
National government 20.00 17.65 35.71 34.62Local government 40.00 52.94 78.57 34.62NGOs 22.50 14.71 35.71 19.23MBO 72.50 91.18 78.57 84.62Police 17.50 14.71 32.14 11.54Other workers 67.50 73.53 67.86 65.38Workers’ cooperative 5.00 0.00 3.57 0.00Supermarkets or large retailers 12.50 2.94 14.29 7.69N 40 34 28 26
Source: Nakuru street vendor IEMS survey data (2012)
The identification of unhelpful institutions showed commonality of responses irrespective of the location. As shown in table 27, most street vendors mention supermarkets or large retailers, NGOs, and national government as unhelpful. Supermarkets or large retailers come first for vendors as they are viewed by most vendors as competitors. Two in every five workers at the stage also mentioned police as being unhelpful, with an almost equal number mentioning trade union and workers’ cooperatives. And despite the good rating of local government as helpful, it was also mentioned as being unhelpful by 38 per cent of women outside the stage and 38 per cent of men and 32 per cent of women at the stage.
Table 27 - Types of Organizations Identified as Being Unhelpful, by Sex and Location (%)
Stage Outside the stage
Men Women Men Women
National government 47.50 41.18 39.29 38.46Local government 37.50 32.35 17.86 38.46NGOs 50.00 44.12 42.86 38.46MBO 17.50 2.94 14.29 11.54Police 40.00 41.18 25.00 34.62Other workers 20.00 17.65 25.00 26.92Trade union 37.50 38.24 17.86 15.38Workers’ cooperatives 37.50 38.24 17.86 15.38Supermarkets or large retailers 50.00 55.88 53.57 46.15N 40 34 28 26
Source: Nakuru street vendor IEMS survey data (2012)
The main problems with infrastructure and institutional obstacles reported by the workers are analyzed in table 28. The problems reported by the greatest number of workers consistently centred on inadequate and unsafe space and poor services. However, the problems experienced by stationary vendors were quite different from those who move around. For instance, inadequate business space was reported by 43 per cent of vendors selling at the same location every day, while for vendors who sell from different locations, poor access to small business support centres was cited most often (by 41 per cent). Most of the vendors who move around have a small amount of goods which they either carry home at the close of business or keep at other business premises. Thus the lack of storage space and poor access to services like electricity and water bothered far more stationary vendors (22 per

29Street Vendors in Nakuru, Kenya
cent) than mobile vendors (7 per cent). However, slightly more (24 per cent) were bothered by no toilets or rubbish removal. Strikingly, almost one in three members of both groups noted occupational hazards were a problem, and more than a quarter of the combined respondents cited treatment by the local authority as an obstacle.
Table 28 - Reported Problems with Infrastructure and Institutional Obstacles, by Usual Location (%)
Same location every day
Vending from different locations Total
Poor access to infrastructure (electricity, water, lights) 32.65 19.51 28.67Cost of infrastructure (electricity, water, telephone) 27.55 21.95 25.87Inadequate business space 42.86 21.95 36.36Expensive rent 3.09 0.00 2.13Inadequate or lack of storage space 22.11 7.32 17.14Inadequate access to toilets or rubbish removal 24.49 24.39 23.78Poor access to small business support centers 32.29 41.46 34.75Can’t obtain a business licence 5.10 12.20 6.99Occupational hazards affecting safety of workers or self
34.02 26.83 32.39
Treatment by the local authority 22.68 29.27 26.06Treatment by the local authority 36.89 34.62 36.13N 98 41 139
Source: Nakuru street vendor IEMS survey data (2012)

30 IEMS Informal Economy Monitoring Study
Part 3: Linkages and Contributions
3.1 IntroductionIn this section we consider the different linkages in the sector as well as the contributions the street vending sector makes. We start with the economic linkages and explore the different ways these are manifested in Nakuru. We also consider some of the sector-specific conditions that shape these connections. We then move to city/policy links and end the section with an analysis of the contributions made by and/or attributed to this sector.
3.2 Economic LinkagesSeveral forward and backward linkages were identified between street vending and the formal and informal economies. The map in figure 6 shows some of these linkages.
Figure 6 - Street Vendors Sector Linkages in Nakuru: Perspective of Street Vendors’ Leaders
Source: Focus Group with 3 men and 2 women from outside and inside the stage, 14th July 2012
Street vendors buy a variety of goods, which they then sell at different places. For example clothing is often bought in Nairobi (represented by towers, top right, on the map) and taken to Kenyatta Avenue and some to the Brotherhood school. Some vendors buy cereals from the farms (top left), while the others buy cereal brought by middlemen from the farms to the Soko Wakulima (farmers’ market). Some of the cereal is sold to formal establishments such as the Midland Hotel, while the rest is sold to institutions such as the medical junction.
Some street vendors buy their goods from supermarkets such as the popular Gilani supermarket, shown on the map. They then sell the goods (e.g. malimali) along Kenyatta Avenue. Shoe shiners buy polish, shoe brushes and soap in the market and provide their shoe shining service along the various streets in the city. The map in figure 6 also shows the proximity of the street vendors to other formal businesses in the city. The relationship the street vendors have with the banks also signals their connection with the formal economy. They deposit their daily revenue in the bank. We also found that spaces behind some of the banks function as informal overnight warehousing and storage facilities for the street vendors when they leave the town centre to return to their homes.
The map also shows the bus stage, an important business hub for both formal and informal economy workers and a space for exchange of goods and services within and across the formal and informal economies in Nakuru.
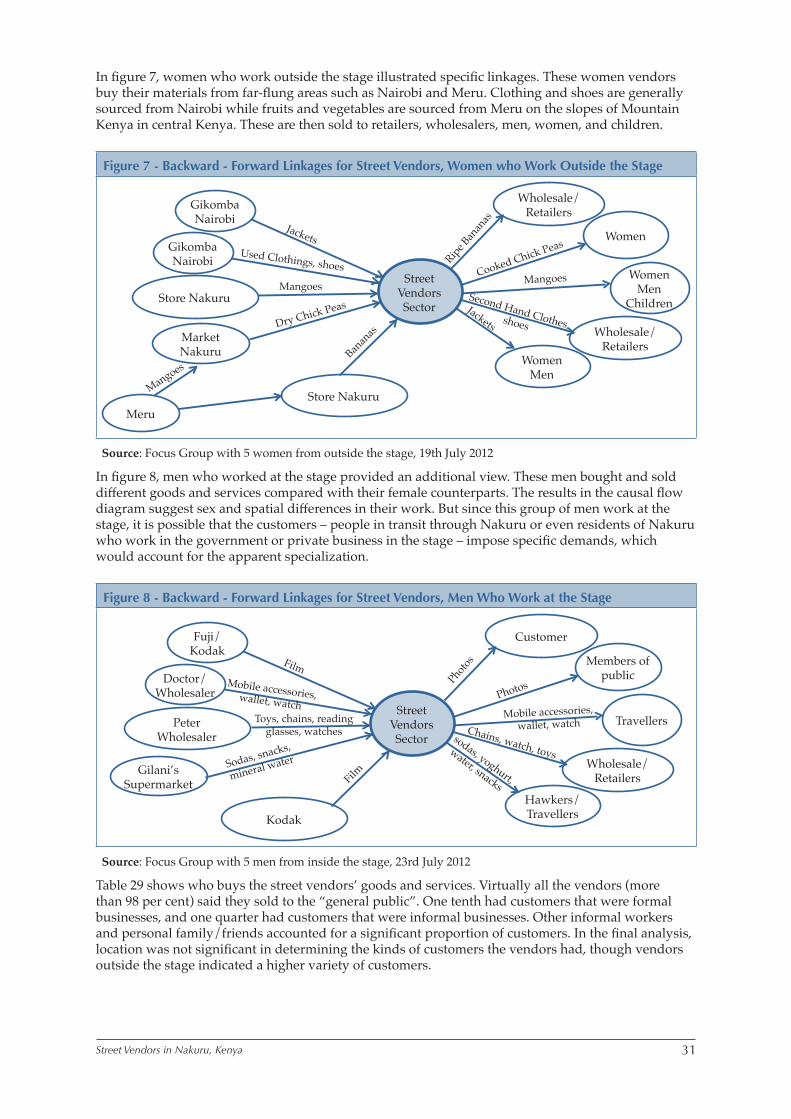
31Street Vendors in Nakuru, Kenya
In figure 7, women who work outside the stage illustrated specific linkages. These women vendors buy their materials from far-flung areas such as Nairobi and Meru. Clothing and shoes are generally sourced from Nairobi while fruits and vegetables are sourced from Meru on the slopes of Mountain Kenya in central Kenya. These are then sold to retailers, wholesalers, men, women, and children.
Figure 7 - Backward - Forward Linkages for Street Vendors, Women who Work Outside the Stage
Wholesale/Retailers
Wholesale/Retailers
GikombaNairobi
GikombaNairobi
Women
Women Men
Children
Street Vendors Sector
Store Nakuru
Store Nakuru
Market Nakuru
WomenMen
Meru
Jackets
Jackets
Used Clothings, shoes
Second Hand Clothes, shoes
Mangoes Mangoes
Mangoes
Dry Chick Peas
Cooked Chick Peas
Banan
as
Ripe Ban
anas
Source: Focus Group with 5 women from outside the stage, 19th July 2012
In figure 8, men who worked at the stage provided an additional view. These men bought and sold different goods and services compared with their female counterparts. The results in the causal flow diagram suggest sex and spatial differences in their work. But since this group of men work at the stage, it is possible that the customers – people in transit through Nakuru or even residents of Nakuru who work in the government or private business in the stage – impose specific demands, which would account for the apparent specialization.
Figure 8 - Backward - Forward Linkages for Street Vendors, Men Who Work at the Stage
Customer
Wholesale/Retailers
Fuji/Kodak
Doctor/Wholesaler
Members of public
TravellersStreet
Vendors Sector
PeterWholesaler
Kodak
Gilani’s Supermarket
Hawkers/Travellers
Film
sodas, yoghurt,
water, snacks
Mobile accessories, wallet, watch
Chains, watch, toys
Toys, chains, reading glasses, watches
Mobile accessories, wallet, watch
Sodas, snacks,
mineral water
Photos
Film
Photos
Source: Focus Group with 5 men from inside the stage, 23rd July 2012
Table 29 shows who buys the street vendors’ goods and services. Virtually all the vendors (more than 98 per cent) said they sold to the “general public”. One tenth had customers that were formal businesses, and one quarter had customers that were informal businesses. Other informal workers and personal family/friends accounted for a significant proportion of customers. In the final analysis, location was not significant in determining the kinds of customers the vendors had, though vendors outside the stage indicated a higher variety of customers.

32 IEMS Informal Economy Monitoring Study
Table 29 - Main Customers or Buyers, by Location (%)
Buyers/Customers Stage Outside the stage Total
Formal businesses 10.53 10.00 10.28Informal businesses 21.67 27.45 24.32Other informal workers 34.38 52.83 42.74Personal family/friends 38.10 50.00 43.36General public 100.00 96.43 98.46Private individuals 47.76 55.10 50.86Other 12.50 10.00 11.54
Source: Nakuru street vendor IEMS survey data (2012)
Vendors were also asked to state the services they used. Public toilets, municipal services and storage facilities topped the list. The results, as presented in table 30, show most vendors outside the stage also used carriers (50 per cent) and porters who transported goods using some type of cart or vehicle (39 per cent). This is because they have to move supplies to where they sell. Also, most vendors at the stage (88 per cent) used public toilet facilities because these are available at the stage – this compares to a lesser 66 per cent outside the stage. Both at and outside the stage, municipal services were used by close to the same percentage of vendors (60 per cent). Although not elaborated in this table, the type of services used by street vendors varied more by occupation than by location.
Table 30 - Types of Services Used by Vendors, by Location (%)
Type of services Stage Outside the stage Total
Carriers (who transport by hand) 22.97 50.00 34.62Porters (who transport using a cart/vehicle) 18.92 39.29 27.69Storage facilities 48.65 48.21 48.46Security/guards 28.38 16.07 23.08Repair services 14.86 16.07 15.38Delivery services 6.76 3.57 5.38Private transport for materials/goods 6.76 17.86 11.54Public toilets 87.84 66.07 78.46Day care 2.70 1.79 2.31Municipal services 60.81 58.93 60.00N 74 56 130
Source: Nakuru street vendor IEMS survey data (2012)
3.3 Policy/City LinkagesThe results of all the focus group discussions revealed that the street vending sector impacts on the city in five key areas. These are through taxes paid, by offering business services, by creating employment, through the provision of social protection, and by cleaning the city and boosting environmental health. In the view of the participants, business was their main contribution; this was followed by the taxes they pay, and the social protection and employment vending offers. There were a couple of observations on cleaning the city.
Starting with business, one woman participant working outside the stage said: “We provide quick services. There are customers who would not like to go to town to buy products so we deliver these goods, products, and services to small traders, therefore contributing to the [commercial] growth of the city.” Although not expressly stated, by making goods available outside the CBD, vendors outside the stage make it possible for buyers to avoid longer trips, helping reduce congestion and making an environmental contribution. She continued “We… pay licences and because we are many we pay a lot to Municipal Council of Nakuru” (Focus group with five women, 18 July 2012).

33Street Vendors in Nakuru, Kenya
A male street vendor working at the stage added, “We provide garbage collection, keeping the town clean.” The vendors do this by putting out garbage collection bags and by cleaning up the surroundings where they work. “We also create jobs for ourselves and others” (Focus group with five men, 23 July 2012).
Finally, a woman working outside the stage noted: “The 360 shillings we pay [for licences] contributes to revenue of the municipality. The municipality is therefore able to pay staff. Prices of the goods we sell are not fixed. We save time and energy for everyone. Everybody is able to get what he or she needs as soon as possible” (Focus group with two men and three women, 30 July 2012).
3.4 Contributions of the SectorAlthough each street vendor group provided different ideas on the contributions the sector makes, there were some similarities. The information presented in figure 9 illustrates what the street vendors in one focus group considered to be the contributions of their sector to the city’s economy.
Figure 9 - Contribution of Street Vendor Sector to Nakuru
Increase employment
Reduce poverty
Bring goods and services
Pay tax
Grow business
Give immediate services
Pay income tax
Provide for customer needs
Provide goods and service to those delayed
Foster economic growth
Make city attractive to investors
Make commodities available to customers
Provide comfort products for exhausted travelers
City can pay for development
Improve life
Quick service to travelers
PAYING TAX
DEVELOPMENT
QUICK, ACCESSIBLE SERVICESDISTRIBUTION
Source: Focus group with two men and three women from inside and outside the stage, 1 August 2012.
3.4.1 Workers’ Contributions to the CityThe discussions on the contributions made by the men and women of the street vending sector to Nakuru city were lively. In a mixed focus group with two men and three women (1 August 2012), the first woman kicked off the discussions by saying: “Of course you must be trustworthy. We bring goods close to the customers; for example we take stuff to them even in the vans, buses. We give quick service.”
A man followed: “Customers are able to get goods quickly. We help Nakuru grow and develop because we pay taxes.”

34 IEMS Informal Economy Monitoring Study
At this point another woman continued: “We increase work, employment, and our population is growing because people know they will find something to do or even employment. Industries around Nakuru are also assured of a market. Of course the town is growing.”
The first woman continued: “We contribute to the growth of the town. We attract people because of the good service and customer relations. When we sell, the wholesaler also grows and our [national] economy grows; also the economy of Nakuru grows.”
Finally the man ended the discussion saying: “We provide service to those who may be late. We reduce poverty. Since I did not go to school, I cannot be formally employed. We give people some rest as they recover from long trips. The goods are easily available, we pay tax, that way the municipality is able to implement development.”
3.4.2 Sector’s Contribution to LivelihoodsWhile earnings or turnover are seen as worker characteristics, they also show the role of the sector in provision of jobs and the returns workers get from these jobs. (See the text box “Earnings vs. Turnover” for a discussion of terminology.)
Earnings vs. Turnover
The data presented here were generated through a question designed to capture turnover—that is, the total value of sales. They do not take into consideration the cost of sales (opening stock plus later purchases of stock) or other expenses incurred in generating the sales, such as transport, storage, and fees. The literature on income clearly establishes that it is very difficult to capture distinctions between turnover, gross earnings, and net earnings reliably. As with similar studies, these data should not be taken out of context and should be interpreted with caution.
Data on turnover from all cities included in the IEMS study showed very high standard deviations and means that far exceeded medians. Means (rather than medians) for turnover are presented in the IEMS city reports.
Irrespective of sex, average monthly turnover among street vendors (table 31) was higher for workers outside the stage than those at the stage. Among vendors at the stage, turnover for men averaged Kshs.21,347, while turnover among women averaged Kshs.31,764. Among those who sold outside the stage, average turnover was Kshs.52,504 for men and Kshs.39,992 for women per month.
The average working hours per week were almost the same for women and for men irrespective of the location of vending, but in both locations women worked far fewer hours than men at street vending.
The mean working hours per week for male vendors at the stage was 50.6 hours compared to 57.4 hours for male vendors outside the stage, while that for female workers was 30.9 hours and 34.0 hours respectively. Overall, men worked almost twice as many hours at vending as women. The analysis shows that, on average, women were more productive than men given their turnover and hours worked. Although male workers sold high value products, this does not make them more productive than women.
The average months worked per year were however almost the same. Men worked almost the same number of months in the past year irrespective of location (i.e. about 11 months), however, women at the stage worked 11.8 months in the past one year, compared to those who vend outside the stage at 10.2 months.

35Street Vendors in Nakuru, Kenya
Table 31 - Mean Turnover and Working Hours, by Sex and Location
Mean earnings
Stage Outside the stage
Men Women Men Women
Mean monthly turnover (shillings)
21,347.37 31,763.64 52,503.70 39,992.31
Mean hours per week (last week) 50.55 30.85 57.35 33.96Mean months per year 11.30 10.79 11.25 10.19N 40 34 28 26
Source: Nakuru street vendor IEMS survey data (2012)

36 IEMS Informal Economy Monitoring Study
Part 4: Policy Implications
4.1 IntroductionThis study sought to provide credible, grounded evidence of the range of driving forces, both positive and negative, that affect conditions of informal work in street vending in Nakuru. The study also aimed to fill the gap in evidence and understanding of the impacts that macroeconomic, city/government, and value chain forces were having on the lives of informal economy workers. Informal workers’ strategic responses to the driving forces were also explored.
The results in the preceding sections make a useful contribution to existing knowledge. Current literature on the informal economy in Kenya is mainly focused on the jua kali – the broad categories of small-scale traders in urban areas. This study adds new information based on the grounded realities of street vendors in Nakuru. By showing the importance of, opportunities for, and threats to street vendors in a context of changing driving forces that affect the conditions of their work, this study also provides a foundation for further research and policy advocacy.
4.2 Key FindingsThe study found that the vast majority – over 90 per cent – of street vendors mainly rely on informal work as the main source of income in their households, whether from their own street vending enterprises or from the informal activities of other household members. Most of the vendors do not have other types of household income. Only a small proportion of them have access to remittances, government grants, rental income and worker’s compensation. An even smaller proportion has income from formal sector wage employment and engages in vending as an additional source of income (2 per cent). In addition, street vendors are likely to be the main providers for their families – and this is true of more than 90 per cent of the men and 74 per cent of the women surveyed. Street vendors are engaged in vending mainly on own account, with only a handful of male vendors acting as employers. Thus street vending is a crucial source of self-employment and livelihood in Nakuru.
Only about one fifth of street vendors had a second job which supplemented income, but vendors outside the stage were more likely to have a second job than their counterparts at the stage. Slightly more female vendors had a second job compared to male vendors. The second most common activity was offering services, followed by selling goods and producing.
Over half of the street vendors have education levels above primary. The relatively high education level reflects literacy among the informal workers, suggesting a lack of alternative opportunities. This may be a factor in competition, since more educated vendors may be better able to express themselves to potential customers than the less educated ones. It may also show the shift towards the informal economy as a major source of livelihood among the educated.
The earnings and working hours vary across vendors both by sex and location. Male vendors outside the stage earn more on average compared to female vendors, but male workers at the stage earn less than their female counterparts. However, workers who vend outside the stage earn more on average compared to those who vend at the stage, irrespective of sex. Men work more hours per week on average compared to women. At the same time, the average number of months worked in a year tends to be the same for both groups.
The use of helpers in street vending is higher among vendors who operate outside the stage than those at the stage, with a high proportion of them using paid helpers. Most vendors use helpers especially at the busiest time of the year, with female vendors outside the stage solely relying on paid helpers during these periods and male vendors reducing the use of unpaid non-family but increasing paid helpers. The extent of using paid workers depending on location of the vendor is related to the type of vending business and income earned.
Location was an important consideration in street vending that influenced many things, including the cost of doing business. Street vendors outside the stage paid over twice more wages on average than those at the stage. Also the average monthly storage fees and membership fees for street vendors outside the stage was twice that of their counterparts at the stage.
At the stage, most vendors were mobile (i.e. they were hawkers), while outside the stage most businesses were operated in stalls. This is also evident in the differences in turnover, where vendors at the stage generated relatively less turnover than those outside the stage. Three of every five vendors

37Street Vendors in Nakuru, Kenya
indicated their revenues had fallen over the past 12 months, the highest proportion being vendors outside the stage. The decline in revenue is reflected in the desire to have more hours, especially by male workers outside the stage.
The study found that value chain dynamics were the most important negative driving force, mainly limited access to capital and lack of materials, followed by city/urban policies and unfavourable changes in the macroeconomic conditions. Within the macroeconomic forces, rising prices were the most important negative driving force; for city/urban policies, harassment by the municipality, poor service delivery and infrastructure were the most important.
Limited access to capital was the most difficult problem the street vendors faced. This affected them in various and serious ways. It necessitated reductions in stock, fostered a lack of morale for business, and created an inability to repay loans as well as an inability to meet daily needs such as food. About four in every five vendors reported low profits and having too few customers of materials or goods. Low profits were more prominent at the stage, while having too few customers was a more significant problem outside the stage.
When vendors identified institutions that either helped or hindered their work, the municipality emerged as the most important, and as the most helpful and the most unhelpful. The street vendors acknowledge the municipality’s role in regulating their business and ensuring a supportive environment. A greater percentage of the workers mentioned MBOs and other workers as being helpful.
The main problems with infrastructure and institutional obstacles reported by the workers were inadequate business space, poor access to small business support, occupational hazards affecting worker safety, poor access to infrastructure, and poor treatment by the local authority. Also mentioned was inadequate storage space.
The study provides some insight into four prevailing “myths” about the informal economy, as identified by MBO partners in the study. The findings around these myths are as follows:
Myth #1: The informal economy is not linked to the formal economy.
The Nakuru study found that over 40 per cent of street vendors source their goods from formal firms, and one in ten consider formal sector enterprises among their customers. In that context, street vendors are linked to the formal economy primarily as distributors of goods sold by formal enterprises. Without street vendors, formal sector enterprises would see their sales decline.
Myth #2: The informal economy is not a part of the modern economy.
The study did not explore production linkages to modern high-end industries. It did find, however, that the major sources of loans are formal economy institutions such as banks and micro finance institutions, in addition to informal moneylenders.
Myth #3: Informal workers intentionally “hide” from regulations and avoid the costs of formalization.
The results from this study show that rules governing street vending in Nakuru are generally inappropriate – e.g. the unsupportive legal framework, the perpetual harassment of street vendors, and absence of designated spaces and facilities for street vendors. The pervasive harassment of vendors indicates that vendors are, in fact, very much reached by the state, not hidden outside of the regulatory apparatus. Moreover, although 54 per cent said they are aware of the rules and regulations, only 36 per cent said they are enforced fairly and equally for all vendors. Compliance on the part of the state with its own rules would help vendors grow their businesses.
Myth #4: The informal economy does not contribute to the city (e.g. informal workers do not pay taxes).
The results of the study confirm that street vendors pay taxes, but do not derive substantial benefits or services from taxes paid. On the contrary, the study finds that despite their poor working conditions, informal workers contribute to the city in specific ways such as providing social protection for the vulnerable, providing jobs to the unemployed poor and providing inputs to a growing recycling industry.

38 IEMS Informal Economy Monitoring Study
4.3 Policy RecommendationsGovernance in Kenya has taken a radical shift to devolved governments where the county governments gain significant powers, including legislative power at the county level. The developments in the government environment present excellent opportunities for the street vending sector and, we believe, enhance the prospects for quick acceptance of proposals to strengthen the sector and for success of the subsequent implementation.
Our discussions of the findings of the study with KENASVIT yielded consensus on the following:
1. Inclusive policy environment: Given its significant role in the urban economy, the street vending sector in Nakuru should be provided with a statutory bargaining forum in which structured dialogue with local government can address deficits in working conditions that undermine livelihoods and limit household income. This forum should address, in particular, fairness and transparency in licensing schemes; the elimination of everyday harassment of vendors, especially women, e.g. through an identity card programme and/or training of local security forces; and improvements in basic workplace infrastructure.
2. Productive formal-informal linkages: The terms on which street vendors engage in transactions with private banks and formal sector suppliers should be monitored and regulated so that small and micro enterprise stability, productivity and growth are supported.
3. Access to grants, pensions, and small business support: Households of street vendors and other informal workers should be targeted in eligibility and registration drives for government grants, pension schemes, and small business support facilities.
4. Participatory urban design: Street vendors and their membership-based organizations (MBOs) should work collaboratively with local government to design more appropriate vending zones and facilities inside the stage and at other natural markets where vendors and pedestrians congregate.
5. Local economic development partnerships: Local government should identify mechanisms for local economic development partnerships with street vendors and other business actors, e.g. to support collective wholesale purchases by street vendors and boost overall demand for goods and services.
39Street Vendors in Nakuru, Kenya
ReferencesAfrican Centre for Economic Growth. 2005. Development of Micro and Small Enterprises in Kenya: Renewed Policy and Strategy Framework. Nairobi: African Centre for Economic Growth.
Alila, P.O. and W.V. Mitullah. 1999. “Overview of Women Street Vendors in Kenya and Policies and Regulations Applicable to them in Nairobi, Kisumu, Migori and Machakos.” Submitted to International Development Research Centre (IDRC) (Centre File: 98-8556/55399).
Alila, P.O. and W.V. Mitullah. 1999. “Policies, Regulations and Organizational Capacity of Street Vendors: Towards Urban Policy Change.” Submitted to Price Waterhouse Coopers Consultants Kenya Limited, September.
Alila, P.O., W.V. Mitullah and A. Kamau. 2000. “Policies, Regulations and Organizational Capacity of Women Street Vendors in Kenya: Proceedings of the National Workshop.” IDS Discussion Paper Number 299. Nairobi: Institute of Development Studies, University of Nairobi.
Alila, P.O. and W.V. Mitullah and A.Kamau. 2000. Policies, Regulations and Organizational Capacity of Women Street Vendors in Kenya: A Handbook. Nairobi: Institute for Development Studies, University of Nairobi.
Chambers, Robert, 1994. “The Origins and Practice of Participatory Rural Appraisal,” World Development, Vol. 22(7), July, pp. 953-969.
Horn, Zoe. 2009. No Cushion to Fall Back On: The Global Economic Crisis and Informal Workers. Inclusive Cities Report.
Kenya Association of Manufacturers-KAM. 2010. Unpublished Nakuru Regional Business Agenda Report.
KENASVIT. 2006. The Street Trader, Vol.1; Issue 1.
KENASVIT. 2006. “The State of the Urban Informal Economy” Sector Profile of Street Vendors In Nakuru- Kenya, September 2011, Inclusive Cities Annual Monitoring Study.
Kenya Association of Manufacturers-KAM. 2006. Survey of the Manufacturing Sector in Kenya. Nairobi: Kenya Association of Manufacturers.
Kenya Institute for Public Policy Research and Analysis (KIPPRA). 2009. Kenya Economic Report 2009: KIPPRA Nairobi.
Kenya Institute of Public Policy Research and Analysis (KIPPRA). 2002. Review of Government Policies for the Promotion of Micro and Small Scale Enterprises in Kenya. Discussion Paper No. 20 of 2002. Kenya Institute for Public Policy Research and Analysis (KIPPRA).
Kenya National Bureau of Statistics (KNBS). 2007. Economic Survey 2006. Nairobi: KNBS Nairobi.
Moser, Caroline and Jeremy Holland. 1997. Urban Poverty and Violence in Jamaica. Washington, DC: IBRD/World Bank Latin American and Caribbean Studies.
Moser, Caroline and Cathy McIlwaine. 1999. “Participatory Urban Appraisal and Its Application for Research on Violence.” Environment and Urbanization, Vol. 11, No. 2, pp. 203–226.
Moser, Caroline and Cathy McIlwaine. 2004. Encounters with Violence in Latin America. Urban Poor Perceptions from Colombia and Guatemala. New York and London: Routledge.
Moser, Caroline, Angélica Acosta and María Eugenia Vásquez. 2006. Mujeres y paz. Construcción de consensos. Bogota: Social Policy International.
Onyango, J.O., W.L.A. Olima and L. Onyango. 2012. “Dynamics of Street Vending Phenomenon in the Kisumu Municipality.” International Journal of Arts and Commerce, Vol. 1(4), pp. 107-120.
Population Council. 2000. Seeds Pamphlet No. 20.
Republic of Kenya. 2005. Sessional Paper No. 2005 on Development of Micro and Small Enterprises for Wealth and Employment Creation for Poverty Reduction. Nairobi: Government Printer.
Republic of Kenya. 2009. Nakuru District Development Plan, 2008-2012. Nairobi: Government Printer.

40 IEMS Informal Economy Monitoring Study
Republic of Kenya. 2010. Population and Housing Census. Nairobi: Government Printer.
WIEGO website. 2013. “Statistical Picture.” Available at http://wiego.org/informal-economy/statistical-picture (accessed 01 May 2013).

41Street Vendors in Nakuru, Kenya
Appendix
Figure A1 - Map Showing Location of Street Vendors Groups in Nakuru
Source: Representatives of NASTHA, May 25, 2012

42 IEMS Informal Economy Monitoring Study

43Street Vendors in Nakuru, Kenya
The Informal Economy Monitoring Study (IEMS) is a part of the Inclusive Cities project. Inclusive Cities is a collaboration of membership-based organizations (MBOs) of the working poor, international alliances of MBOs and support organizations working together as partners to improve the situation of the working poor. Launched in late 2008, Inclusive Cities aims to strengthen MBOs in the areas of organizing, policy analysis and advocacy in order to ensure that urban informal workers have the tools necessary to make themselves heard within urban planning processes.
The Informal Economy Monitoring Study is being led by Women in Informal Employment: Globalizing and Organizing – WIEGO (see www.wiego.org) – a global action-research-policy network that seeks to improve the status of the working poor in the informal economy, especially women. WIEGO has convened a Technical Advisory Committee (TAC) to guide the project.
Core Members of the TAC are:
Imraan Valodia (University of KwaZulu-Natal), IEMS Director
Martha Chen (Harvard University), TAC Chair
Sally Roever (WIEGO), IEMS Qualitative Research Coordinator
Michael Rogan (University of KwaZulu-Natal), IEMS Quantitative Research Coordinator
Additional Members of the TAC:
Sonia Dias (WIEGO Waste Sector Specialist and Federal University of Minas Gerais)
Rhonda Douglas (WIEGO Global Projects Director)
Zoe Horn (WIEGO Research Officer, IEMS)
Francie Lund (University of KwaZulu-Natal)
Melanie Samson (WIEGO Africa Waste Picker Programme Coordinator and PARI)
Shalini Sinha (WIEGO Home-based Work Sector Specialist)
Caroline Skinner (WIEGO Urban Policies Programme Director, African Centre for Cities and University of Cape Town)
Caroline Moser, Angélica Acosta and Irene Vance led the development of, and training for, the qualitative modules of the study.