Embed Size (px)
Citation preview

by Alyssa Curran
* A synopsis of my research problem * Background information on original research paper * Some accepted findings on self-esteem * Explanation of Bayes Classification algorithm * An introduction to the data
~ How I chose the data subset ~ Pre-processing the data
* A summary of my analysis techniques * Assumptions * Results
~ Two performance measures ~ Explanation of results
* References
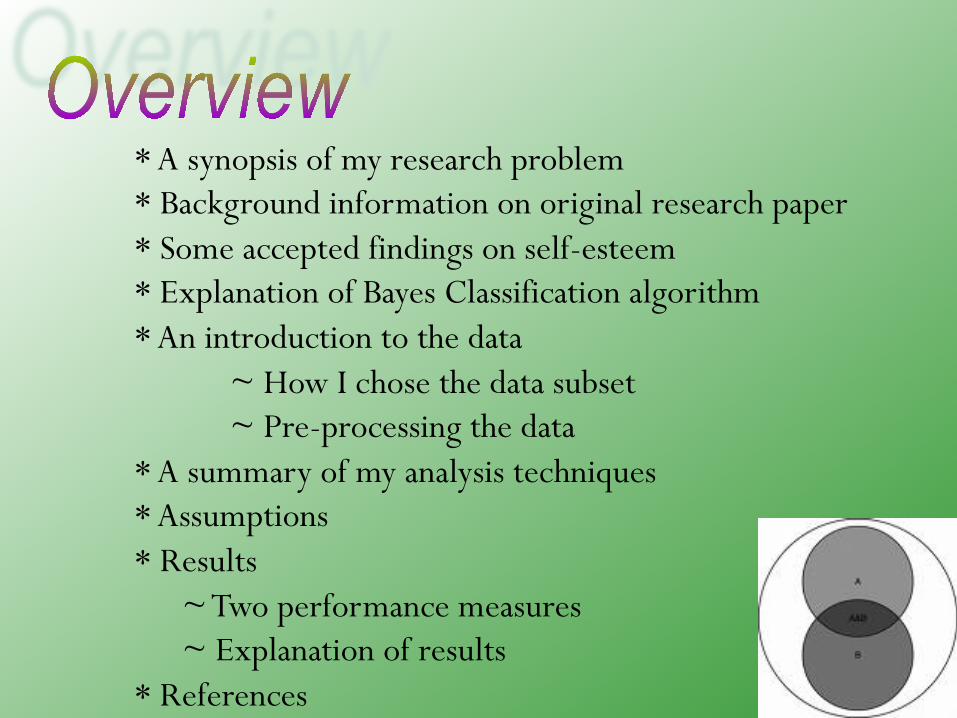
The objective of my research was to do an analysis on a large set of data collected by a psychological researcher.
I used Bayesian Classification to evaluate
whether or not a low measure of life satisfaction at age 18 and whether or not the individual had anxiety disorder at age 18 predicts whether or not the individual had low self-esteem at age 15.
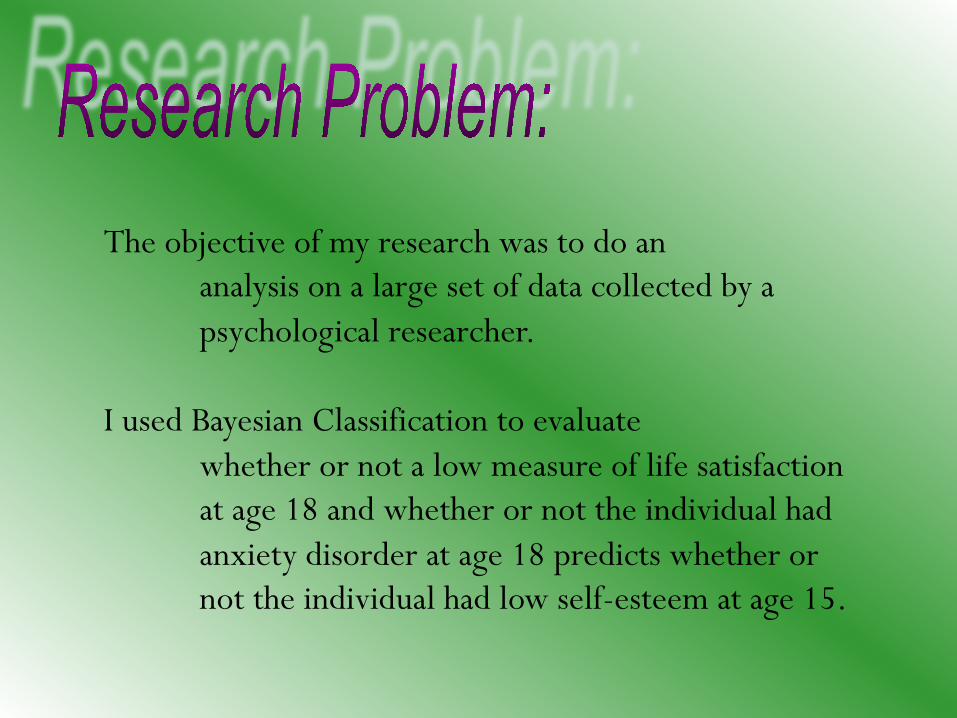
The original research paper was done by Joseph M. Boden, David M. Fergusson, and L. John Horwood, ~ Christchurch School of Medicine and Health Sciences
The paper is entitled: “Does adolescent self-esteem
predict later life outcomes? A test of the causal role of self-esteem.”
It studies the relationship between self-esteem and a
number of later life outcomes in adulthood The long-term study used data from a group of 1000 adults
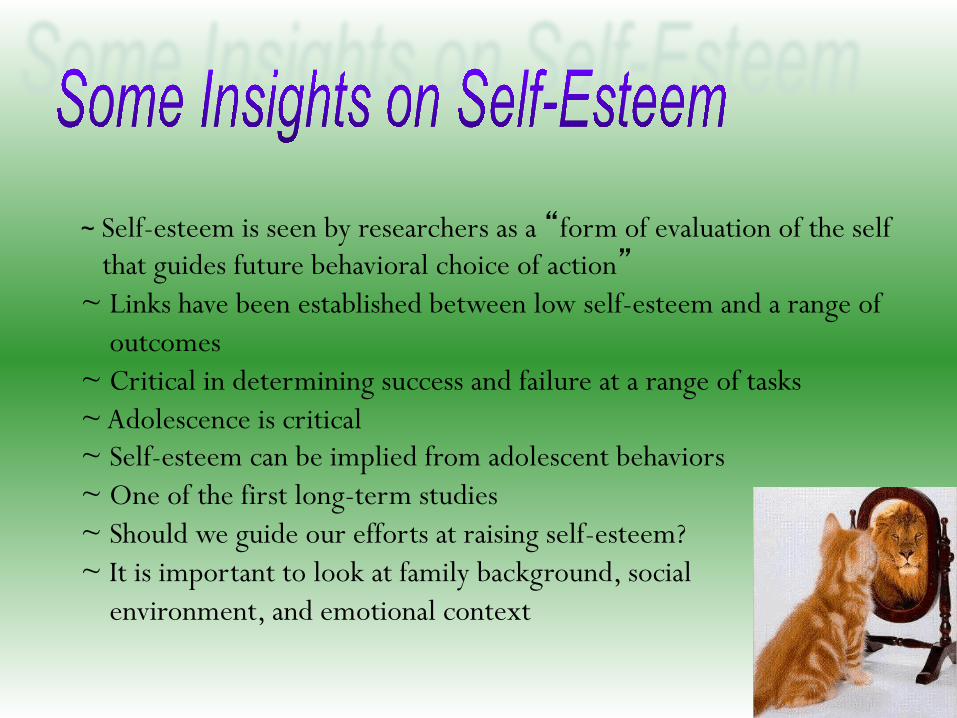
~ Self-esteem is seen by researchers as a “form of evaluation of the self that guides future behavioral choice of action” ~ Links have been established between low self-esteem and a range of outcomes ~ Critical in determining success and failure at a range of tasks ~ Adolescence is critical ~ Self-esteem can be implied from adolescent behaviors ~ One of the first long-term studies ~ Should we guide our efforts at raising self-esteem? ~ It is important to look at family background, social environment, and emotional context
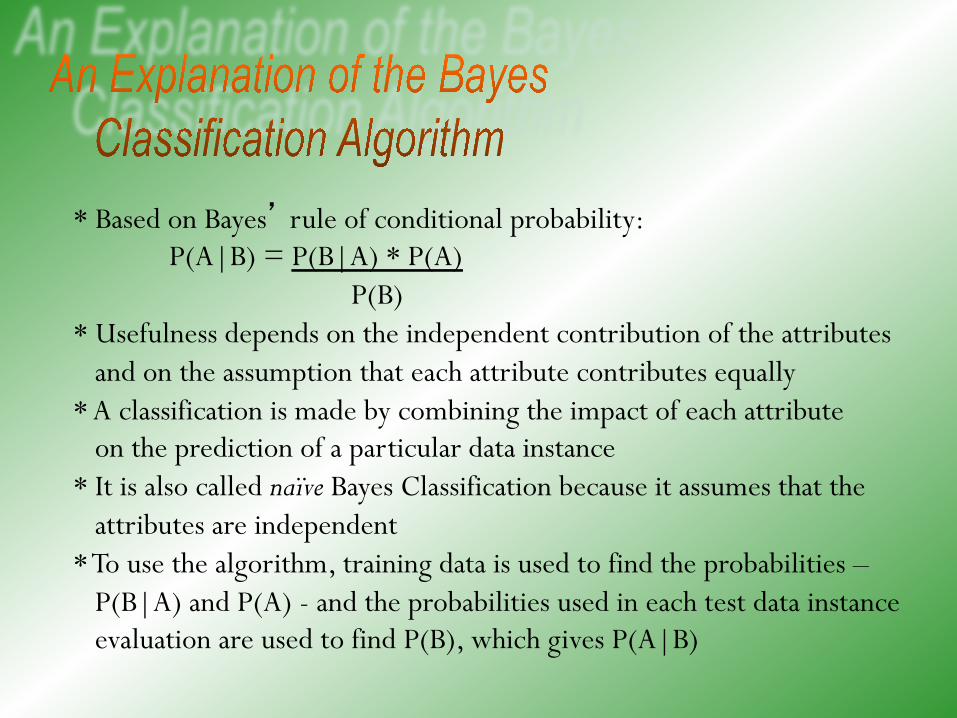
* Based on Bayes’ rule of conditional probability: P(A|B) = P(B|A) * P(A) P(B)
* Usefulness depends on the independent contribution of the attributes and on the assumption that each attribute contributes equally * A classification is made by combining the impact of each attribute on the prediction of a particular data instance * It is also called naïve Bayes Classification because it assumes that the attributes are independent * To use the algorithm, training data is used to find the probabilities – P(B|A) and P(A) - and the probabilities used in each test data instance evaluation are used to find P(B), which gives P(A|B)
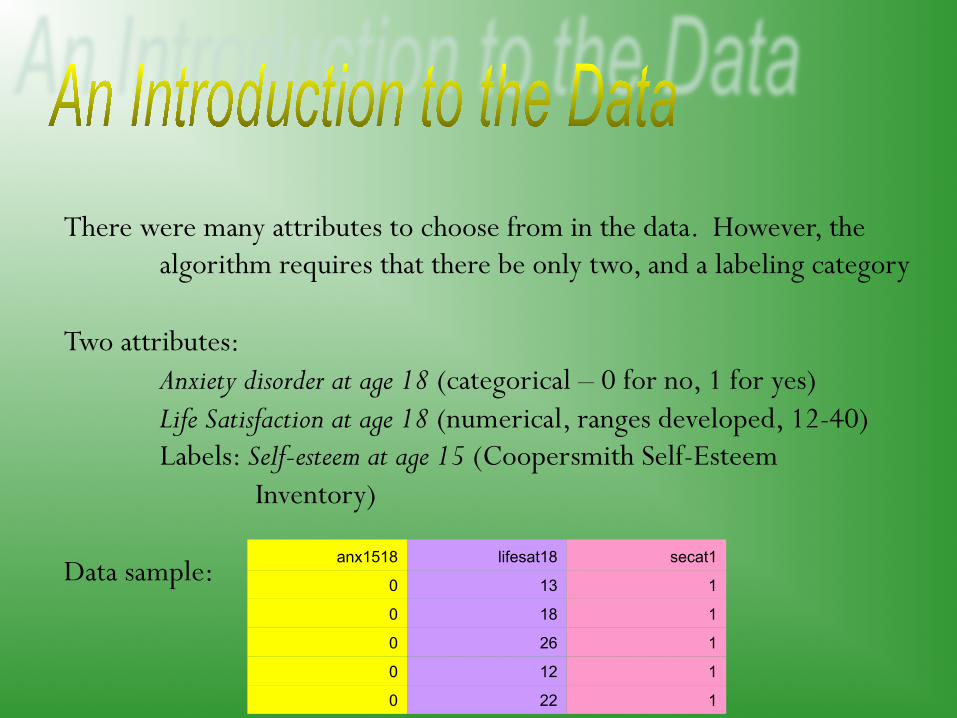
There were many attributes to choose from in the data. However, the algorithm requires that there be only two, and a labeling category
Two attributes:
Anxiety disorder at age 18 (categorical – 0 for no, 1 for yes) Life Satisfaction at age 18 (numerical, ranges developed, 12-40) Labels: Self-esteem at age 15 (Coopersmith Self-Esteem Inventory)
Data sample:
anx1518 lifesat18 secat1
0 13 1
0 18 1
0 26 1
0 12 1
0 22 1
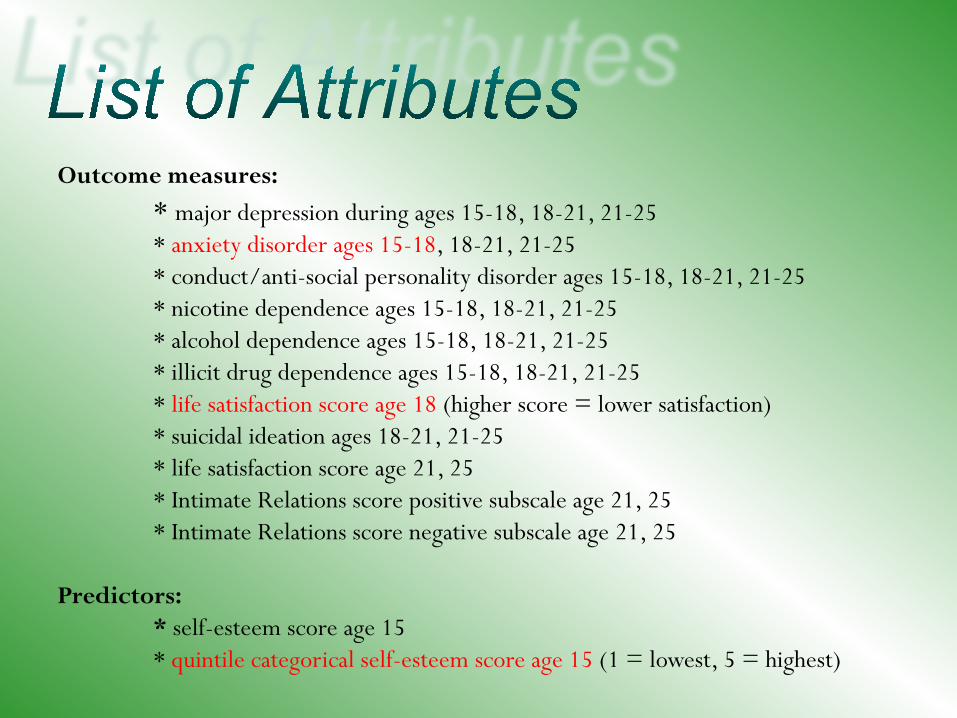
Outcome measures: * major depression during ages 15-18, 18-21, 21-25 * anxiety disorder ages 15-18, 18-21, 21-25 * conduct/anti-social personality disorder ages 15-18, 18-21, 21-25 * nicotine dependence ages 15-18, 18-21, 21-25 * alcohol dependence ages 15-18, 18-21, 21-25 * illicit drug dependence ages 15-18, 18-21, 21-25 * life satisfaction score age 18 (higher score = lower satisfaction) * suicidal ideation ages 18-21, 21-25 * life satisfaction score age 21, 25 * Intimate Relations score positive subscale age 21, 25 * Intimate Relations score negative subscale age 21, 25
Predictors:
* self-esteem score age 15 * quintile categorical self-esteem score age 15 (1 = lowest, 5 = highest)
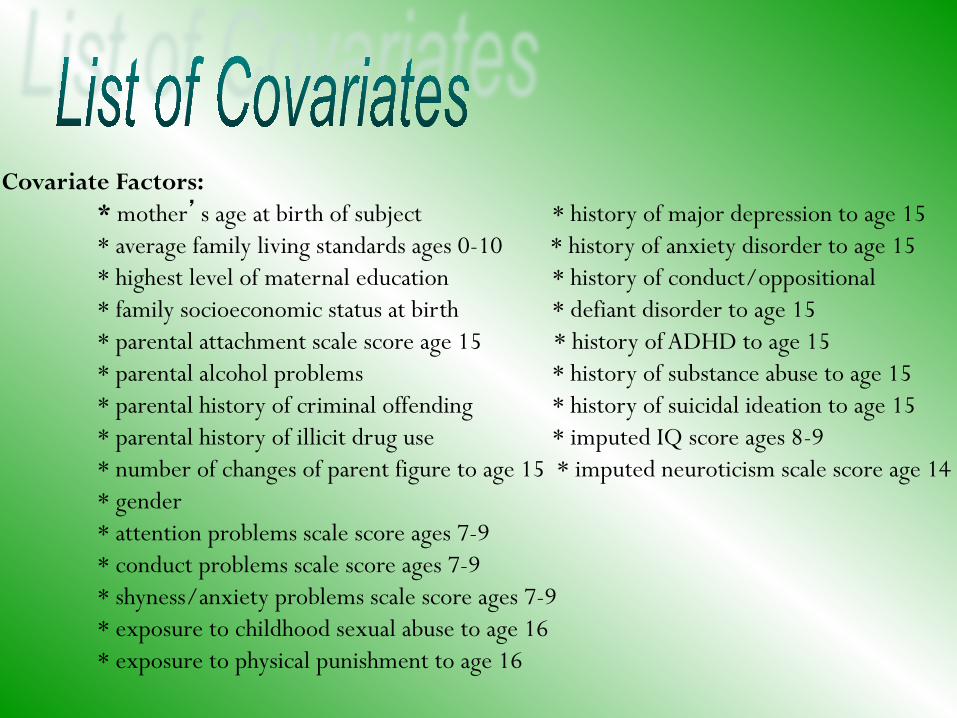
Covariate Factors: * mother’s age at birth of subject * history of major depression to age 15 * average family living standards ages 0-10 * history of anxiety disorder to age 15 * highest level of maternal education * history of conduct/oppositional * family socioeconomic status at birth * defiant disorder to age 15 * parental attachment scale score age 15 * history of ADHD to age 15 * parental alcohol problems * history of substance abuse to age 15 * parental history of criminal offending * history of suicidal ideation to age 15 * parental history of illicit drug use * imputed IQ score ages 8-9 * number of changes of parent figure to age 15 * imputed neuroticism scale score age 14 * gender * attention problems scale score ages 7-9 * conduct problems scale score ages 7-9 * shyness/anxiety problems scale score ages 7-9 * exposure to childhood sexual abuse to age 16 * exposure to physical punishment to age 16
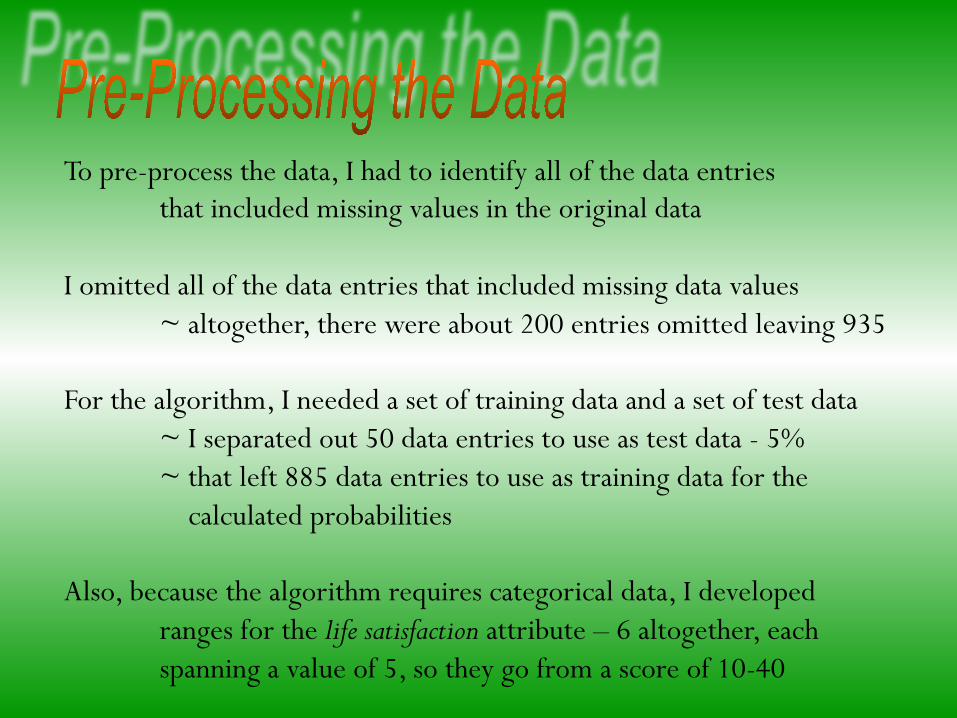
To pre-process the data, I had to identify all of the data entries that included missing values in the original data
I omitted all of the data entries that included missing data values ~ altogether, there were about 200 entries omitted leaving 935
For the algorithm, I needed a set of training data and a set of test data
~ I separated out 50 data entries to use as test data - 5% ~ that left 885 data entries to use as training data for the calculated probabilities
Also, because the algorithm requires categorical data, I developed
ranges for the life satisfaction attribute – 6 altogether, each spanning a value of 5, so they go from a score of 10-40
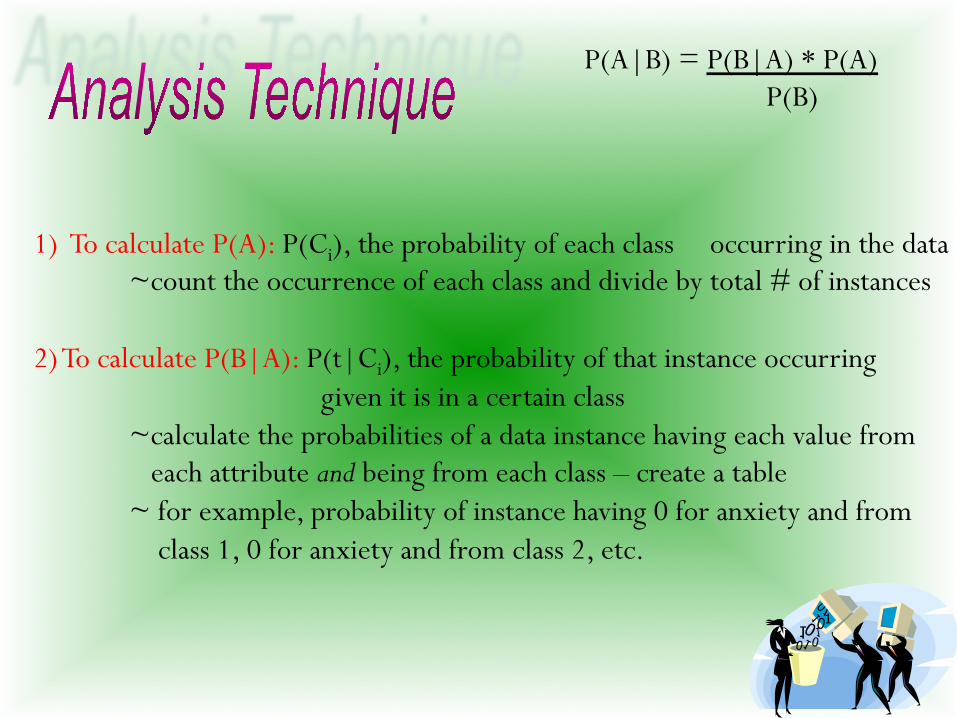
1) To calculate P(A): P(Ci), the probability of each class occurring in the data ~count the occurrence of each class and divide by total # of instances
2) To calculate P(B|A): P(t|Ci), the probability of that instance occurring
given it is in a certain class ~calculate the probabilities of a data instance having each value from each attribute and being from each class – create a table ~ for example, probability of instance having 0 for anxiety and from class 1, 0 for anxiety and from class 2, etc.
P(A|B) = P(B|A) * P(A) P(B)
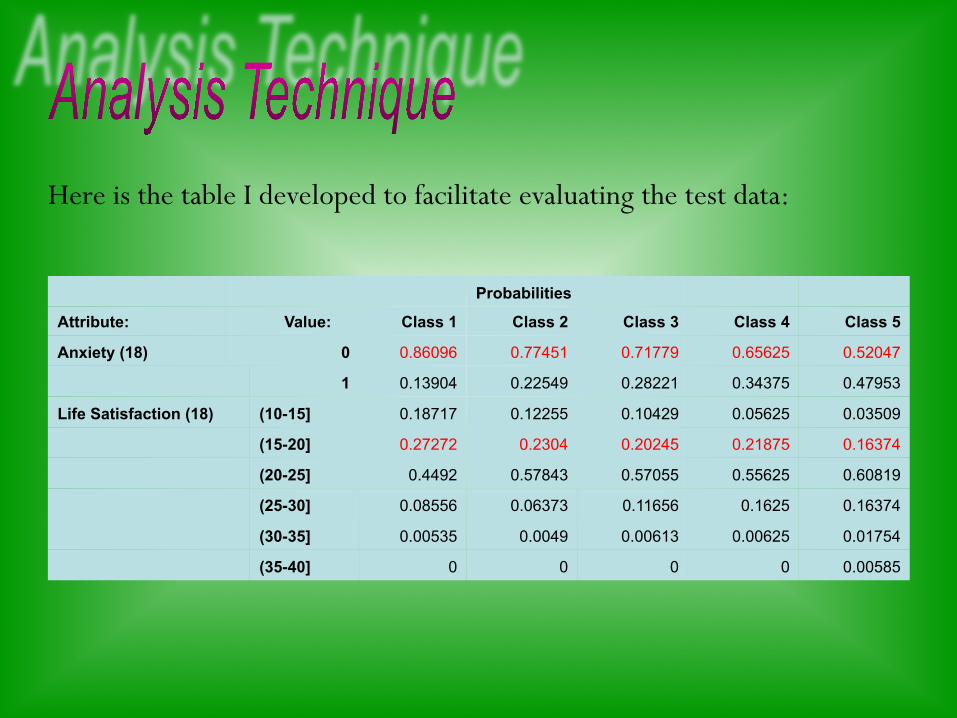
Probabilities
Attribute: Value: Class 1 Class 2 Class 3 Class 4 Class 5
Anxiety (18) 0 0.86096 0.77451 0.71779 0.65625 0.52047
1 0.13904 0.22549 0.28221 0.34375 0.47953
Life Satisfaction (18) (10-15] 0.18717 0.12255 0.10429 0.05625 0.03509
(15-20] 0.27272 0.2304 0.20245 0.21875 0.16374
(20-25] 0.4492 0.57843 0.57055 0.55625 0.60819
(25-30] 0.08556 0.06373 0.11656 0.1625 0.16374
(30-35] 0.00535 0.0049 0.00613 0.00625 0.01754
(35-40] 0 0 0 0 0.00585
Here is the table I developed to facilitate evaluating the test data:
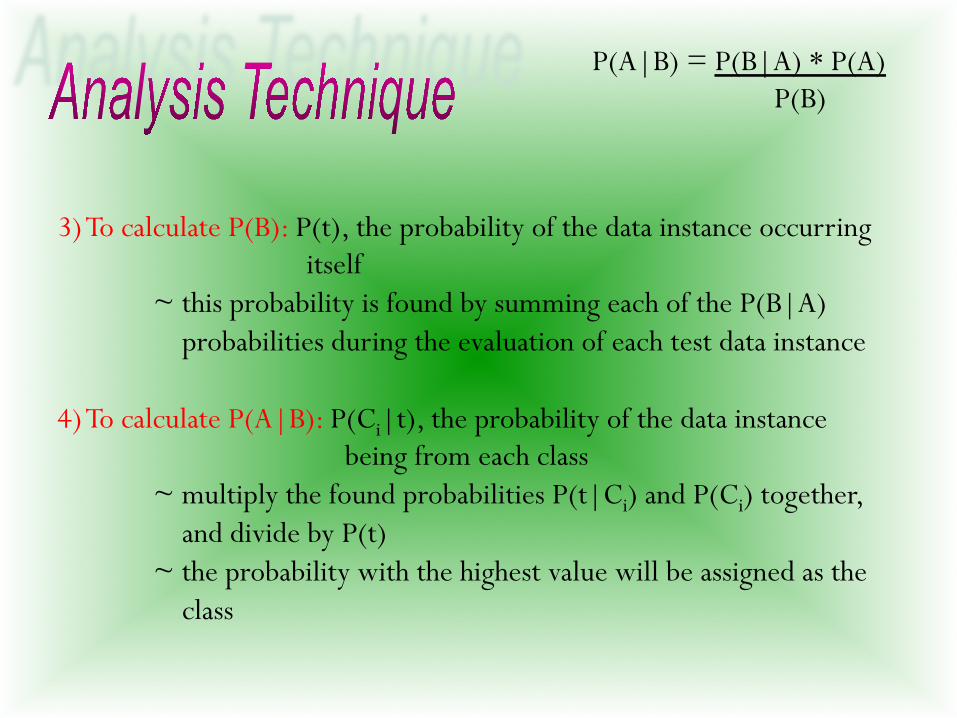
3) To calculate P(B): P(t), the probability of the data instance occurring itself ~ this probability is found by summing each of the P(B|A) probabilities during the evaluation of each test data instance
4) To calculate P(A|B): P(Ci|t), the probability of the data instance
being from each class ~ multiply the found probabilities P(t|Ci) and P(Ci) together, and divide by P(t) ~ the probability with the highest value will be assigned as the class
P(A|B) = P(B|A) * P(A) P(B)
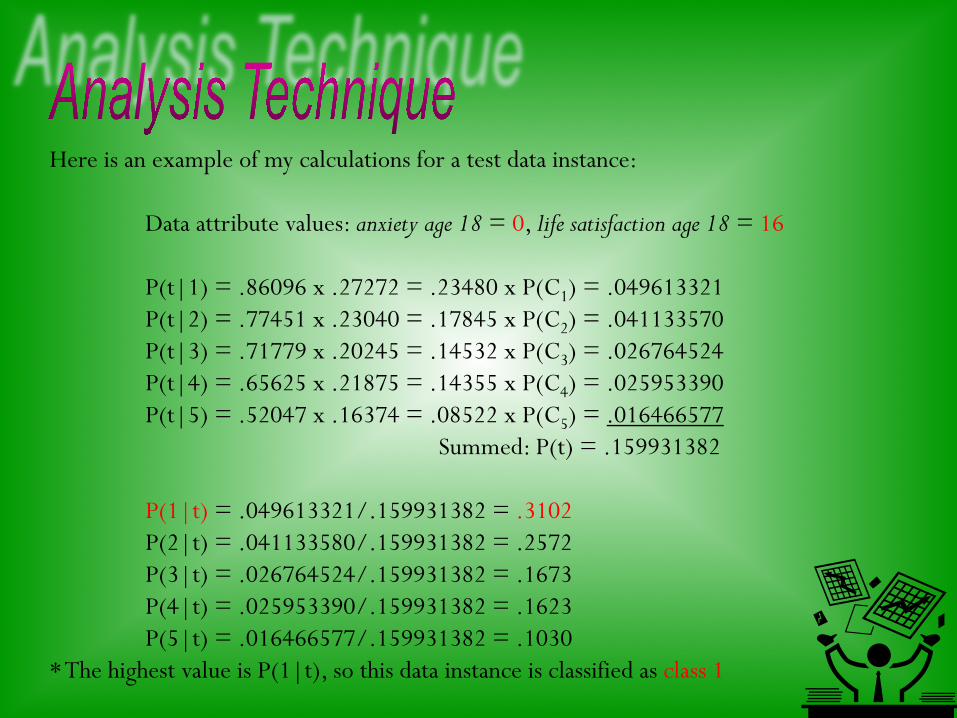
Here is an example of my calculations for a test data instance:
Data attribute values: anxiety age 18 = 0, life satisfaction age 18 = 16
P(t|1) = .86096 x .27272 = .23480 x P(C1) = .049613321 P(t|2) = .77451 x .23040 = .17845 x P(C2) = .041133570 P(t|3) = .71779 x .20245 = .14532 x P(C3) = .026764524 P(t|4) = .65625 x .21875 = .14355 x P(C4) = .025953390 P(t|5) = .52047 x .16374 = .08522 x P(C5) = .016466577 Summed: P(t) = .159931382
P(1|t) = .049613321/.159931382 = .3102 P(2|t) = .041133580/.159931382 = .2572 P(3|t) = .026764524/.159931382 = .1673 P(4|t) = .025953390/.159931382 = .1623 P(5|t) = .016466577/.159931382 = .1030
* The highest value is P(1|t), so this data instance is classified as class 1
1) The data is accurate. 2) The data is still useful after some data has been omitted due to missing values. 3) The data attributes (variables) are independent of each other. 4) The method used is sufficient to evaluate the data. 5) 5% of the data extracted from the dataset is sufficient to use
for test data.
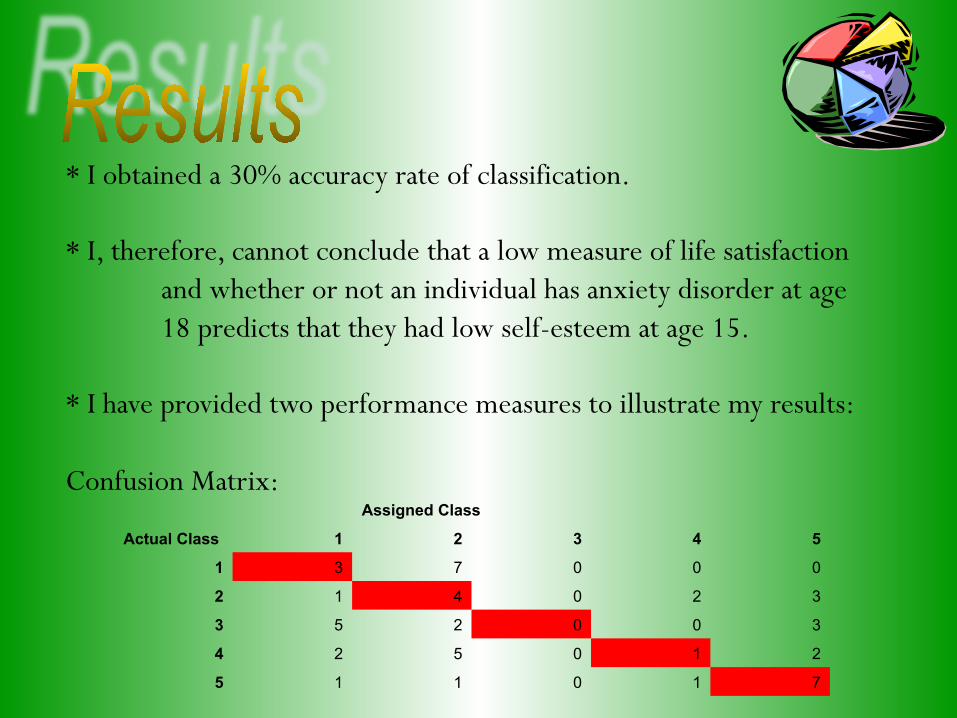
* I obtained a 30% accuracy rate of classification. * I, therefore, cannot conclude that a low measure of life satisfaction
and whether or not an individual has anxiety disorder at age 18 predicts that they had low self-esteem at age 15.
* I have provided two performance measures to illustrate my results: Confusion Matrix:
Assigned Class
Actual Class 1 2 3 4 5
1 3 7 0 0 0
2 1 4 0 2 3
3 5 2 0 0 3
4 2 5 0 1 2
5 1 1 0 1 7
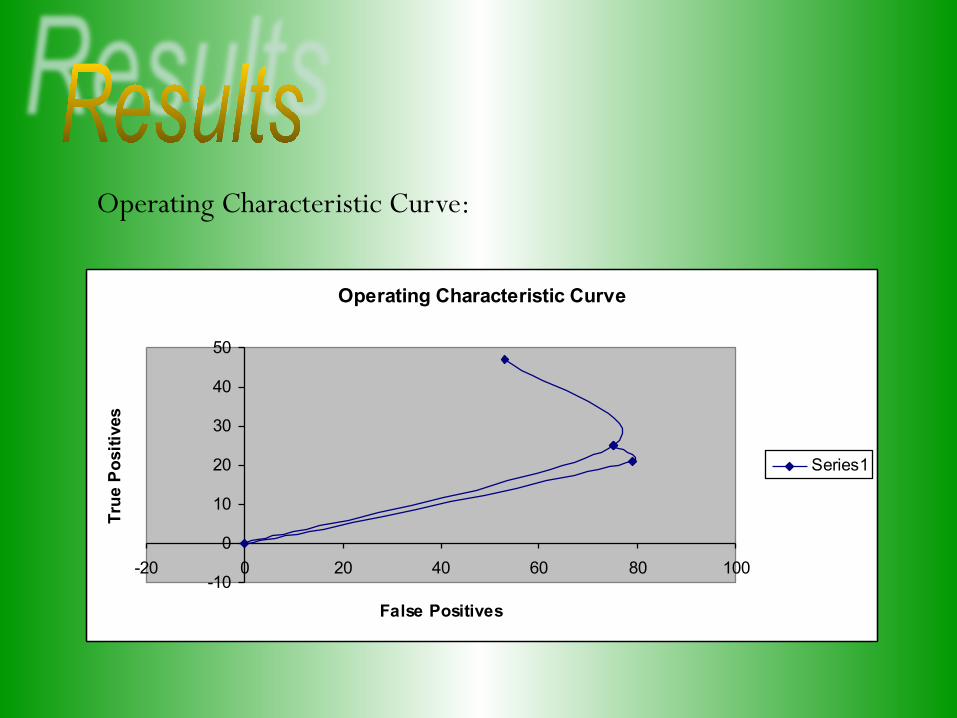
Operating Characteristic Curve:
Operating Characteristic Curve
-10
0
10
20
30
40
50
-20 0 20 40 60 80 100
False Positives
True
Pos
itive
s
Series1
In the original research paper, the researcher states that there are many covariates (factors that effect both self-esteem and later life outcomes) that can be accounted for, and therefore, that some of the data attributes have been found to be dependent – my analysis confirms this.
My analysis is different in that is was done in the opposite
direction. The researcher evaluated whether or not low self-esteem at 15 predicted later life outcomes, while I evaluated whether or not certain life outcomes can predict that the individual had low self-esteem at 15.
Boden, Joseph M.; Fergusson, David M.; Horwood, L. John. (2008). Does Adolescent self-esteem predict later life outcomes? A test of the causal role of self-esteem. Development and Psychology, 20, 319-339.
Dunham, Margaret H. (2003). Data Mining: Introductory and Advanced
Topics. Upper Saddle River, NJ: Pearson Education, Inc. Roiger, Richard J.; Geatz, Michael W. (2003). Data Mining: A Tutorial-
Based Primer. Boston, MA: Pearson Education, Inc.
* The raw data was obtained directly from Joseph M. Boden.