Embed Size (px)
Citation preview
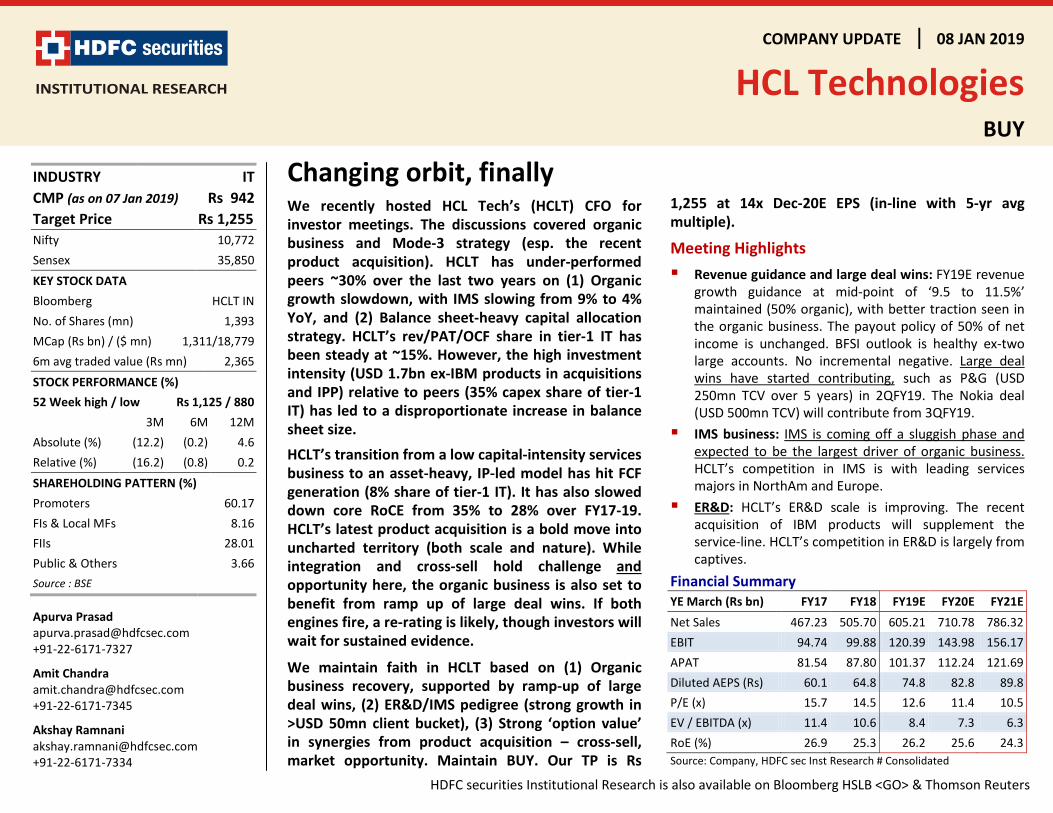
COMPANY UPDATE 08 JAN 2019
HCL Technologies BUY
HDFC securities Institutional Research is also available on Bloomberg HSLB <GO> & Thomson Reuters
Changing orbit, finallyWe recently hosted HCL Tech’s (HCLT) CFO for investor meetings. The discussions covered organic business and Mode-3 strategy (esp. the recent product acquisition). HCLT has under-performed peers ~30% over the last two years on (1) Organic growth slowdown, with IMS slowing from 9% to 4% YoY, and (2) Balance sheet-heavy capital allocation strategy. HCLT’s rev/PAT/OCF share in tier-1 IT has been steady at ~15%. However, the high investment intensity (USD 1.7bn ex-IBM products in acquisitions and IPP) relative to peers (35% capex share of tier-1 IT) has led to a disproportionate increase in balance sheet size. HCLT’s transition from a low capital-intensity services business to an asset-heavy, IP-led model has hit FCF generation (8% share of tier-1 IT). It has also slowed down core RoCE from 35% to 28% over FY17-19. HCLT’s latest product acquisition is a bold move into uncharted territory (both scale and nature). While integration and cross-sell hold challenge and opportunity here, the organic business is also set to benefit from ramp up of large deal wins. If both engines fire, a re-rating is likely, though investors will wait for sustained evidence.
We maintain faith in HCLT based on (1) Organic business recovery, supported by ramp-up of large deal wins, (2) ER&D/IMS pedigree (strong growth in >USD 50mn client bucket), (3) Strong ‘option value’ in synergies from product acquisition – cross-sell, market opportunity. Maintain BUY. Our TP is Rs
1,255 at 14x Dec-20E EPS (in-line with 5-yr avg multiple).
Meeting Highlights Revenue guidance and large deal wins: FY19E revenue
growth guidance at mid-point of ‘9.5 to 11.5%’ maintained (50% organic), with better traction seen in the organic business. The payout policy of 50% of net income is unchanged. BFSI outlook is healthy ex-two large accounts. No incremental negative. Large deal wins have started contributing, such as P&G (USD 250mn TCV over 5 years) in 2QFY19. The Nokia deal (USD 500mn TCV) will contribute from 3QFY19.
IMS business: IMS is coming off a sluggish phase and expected to be the largest driver of organic business. HCLT’s competition in IMS is with leading services majors in NorthAm and Europe.
ER&D: HCLT’s ER&D scale is improving. The recent acquisition of IBM products will supplement the service-line. HCLT’s competition in ER&D is largely from captives.
Financial Summary YE March (Rs bn) FY17 FY18 FY19E FY20E FY21E Net Sales 467.23 505.70 605.21 710.78 786.32 EBIT 94.74 99.88 120.39 143.98 156.17 APAT 81.54 87.80 101.37 112.24 121.69 Diluted AEPS (Rs) 60.1 64.8 74.8 82.8 89.8 P/E (x) 15.7 14.5 12.6 11.4 10.5 EV / EBITDA (x) 11.4 10.6 8.4 7.3 6.3 RoE (%) 26.9 25.3 26.2 25.6 24.3 Source: Company, HDFC sec Inst Research # Consolidated
INDUSTRY IT CMP (as on 07 Jan 2019) Rs 942 Target Price Rs 1,255 Nifty 10,772 Sensex 35,850 KEY STOCK DATA Bloomberg HCLT IN No. of Shares (mn) 1,393 MCap (Rs bn) / ($ mn) 1,311/18,779 6m avg traded value (Rs mn) 2,365 STOCK PERFORMANCE (%) 52 Week high / low Rs 1,125 / 880 3M 6M 12M Absolute (%) (12.2) (0.2) 4.6 Relative (%) (16.2) (0.8) 0.2 SHAREHOLDING PATTERN (%) Promoters 60.17 FIs & Local MFs 8.16 FIIs 28.01 Public & Others 3.66 Source : BSE
Apurva Prasad [email protected] +91-22-6171-7327
Amit Chandra [email protected] +91-22-6171-7345
Akshay Ramnani [email protected] +91-22-6171-7334
HCL TECHNOLOGIES: COMPANY UPDATE
Page | 2
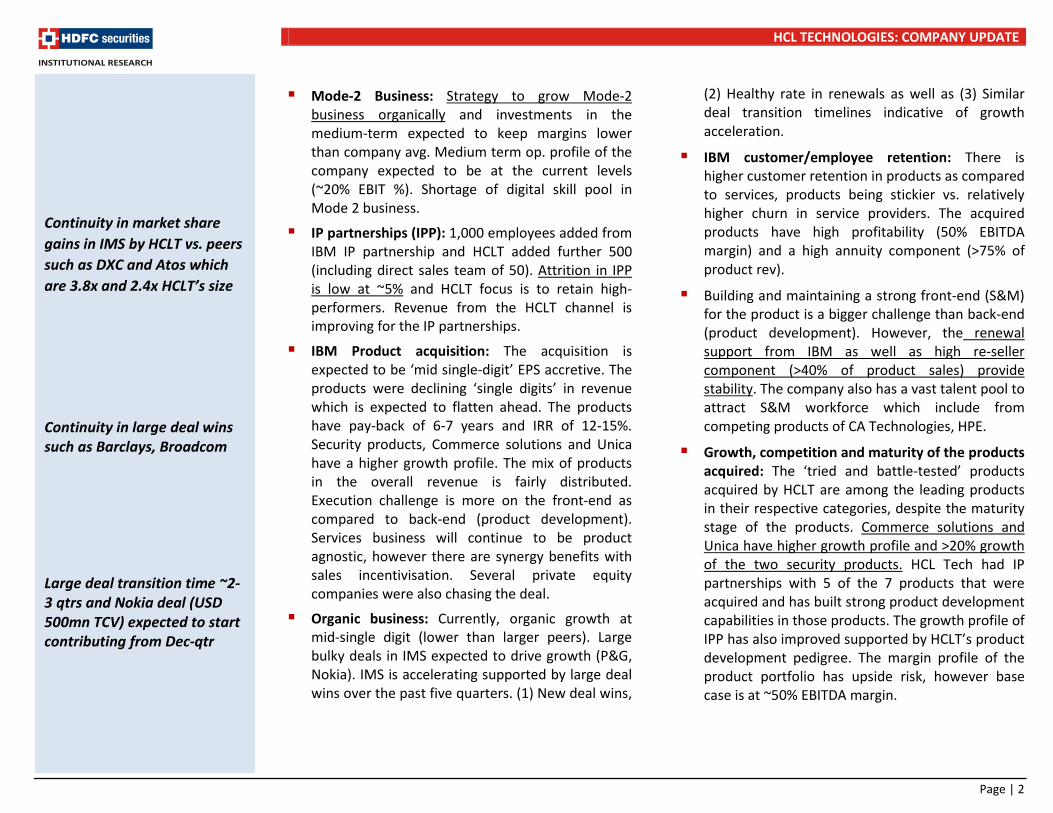
Mode-2 Business: Strategy to grow Mode-2 business organically and investments in the medium-term expected to keep margins lower than company avg. Medium term op. profile of the company expected to be at the current levels (~20% EBIT %). Shortage of digital skill pool in Mode 2 business.
IP partnerships (IPP): 1,000 employees added from IBM IP partnership and HCLT added further 500 (including direct sales team of 50). Attrition in IPP is low at ~5% and HCLT focus is to retain high-performers. Revenue from the HCLT channel is improving for the IP partnerships.
IBM Product acquisition: The acquisition is expected to be ‘mid single-digit’ EPS accretive. The products were declining ‘single digits’ in revenue which is expected to flatten ahead. The products have pay-back of 6-7 years and IRR of 12-15%. Security products, Commerce solutions and Unica have a higher growth profile. The mix of products in the overall revenue is fairly distributed. Execution challenge is more on the front-end as compared to back-end (product development). Services business will continue to be product agnostic, however there are synergy benefits with sales incentivisation. Several private equity companies were also chasing the deal.
Organic business: Currently, organic growth at mid-single digit (lower than larger peers). Large bulky deals in IMS expected to drive growth (P&G, Nokia). IMS is accelerating supported by large deal wins over the past five quarters. (1) New deal wins,
(2) Healthy rate in renewals as well as (3) Similar deal transition timelines indicative of growth acceleration.
IBM customer/employee retention: There is higher customer retention in products as compared to services, products being stickier vs. relatively higher churn in service providers. The acquired products have high profitability (50% EBITDA margin) and a high annuity component (>75% of product rev).
Building and maintaining a strong front-end (S&M) for the product is a bigger challenge than back-end (product development). However, the renewal support from IBM as well as high re-seller component (>40% of product sales) provide stability. The company also has a vast talent pool to attract S&M workforce which include from competing products of CA Technologies, HPE.
Growth, competition and maturity of the products acquired: The ‘tried and battle-tested’ products acquired by HCLT are among the leading products in their respective categories, despite the maturity stage of the products. Commerce solutions and Unica have higher growth profile and >20% growth of the two security products. HCL Tech had IP partnerships with 5 of the 7 products that were acquired and has built strong product development capabilities in those products. The growth profile of IPP has also improved supported by HCLT’s product development pedigree. The margin profile of the product portfolio has upside risk, however base case is at ~50% EBITDA margin.
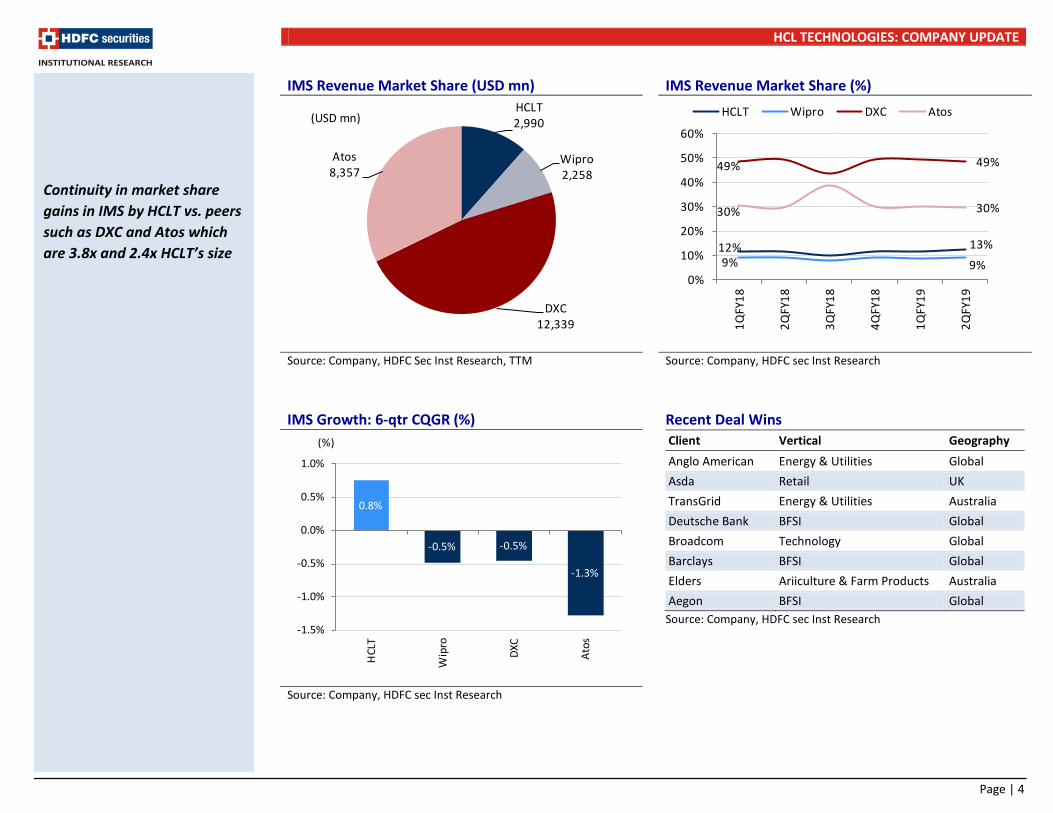
Continuity in market share gains in IMS by HCLT vs. peers such as DXC and Atos which are 3.8x and 2.4x HCLT’s size
Continuity in large deal wins such as Barclays, Broadcom Large deal transition time ~2-3 qtrs and Nokia deal (USD 500mn TCV) expected to start contributing from Dec-qtr
HCL TECHNOLOGIES: COMPANY UPDATE
Page | 3
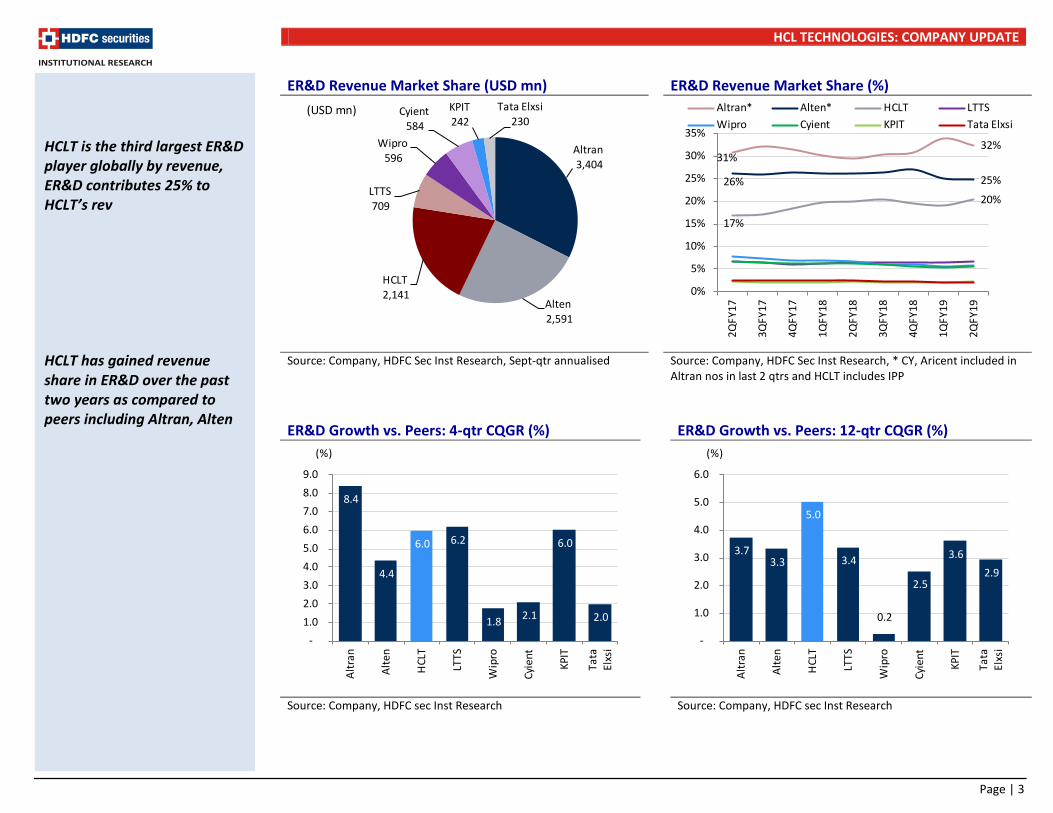
ER&D Revenue Market Share (USD mn) ER&D Revenue Market Share (%)
Source: Company, HDFC Sec Inst Research, Sept-qtr annualised Source: Company, HDFC Sec Inst Research, * CY, Aricent included in Altran nos in last 2 qtrs and HCLT includes IPP
ER&D Growth vs. Peers: 4-qtr CQGR (%) ER&D Growth vs. Peers: 12-qtr CQGR (%)
Source: Company, HDFC sec Inst Research Source: Company, HDFC sec Inst Research
HCLT is the third largest ER&D player globally by revenue, ER&D contributes 25% to HCLT’s rev HCLT has gained revenue share in ER&D over the past two years as compared to peers including Altran, Alten
Altran3,404
Alten2,591
HCLT2,141
LTTS709
Wipro596
Cyient584
KPIT242
Tata Elxsi230
(USD mn)
31%32%
26% 25%
17%
20%
0%
5%
10%
15%
20%
25%
30%
35%
2QFY
17
3QFY
17
4QFY
17
1QFY
18
2QFY
18
3QFY
18
4QFY
18
1QFY
19
2QFY
19
Altran* Alten* HCLT LTTSWipro Cyient KPIT Tata Elxsi
8.4
4.4
6.0 6.2
1.8 2.1
6.0
2.0
-1.0 2.0 3.0 4.0 5.0 6.0 7.0 8.0 9.0
Altr
an
Alte
n
HCL
T
LTTS
Wip
ro
Cyie
nt
KPIT
Tata
El
xsi
(%)
3.7 3.3
5.0
3.4
0.2
2.5
3.6 2.9
-
1.0
2.0
3.0
4.0
5.0
6.0
Altr
an
Alte
n
HCL
T
LTTS
Wip
ro
Cyie
nt
KPIT
Tata
El
xsi
(%)
HCL TECHNOLOGIES: COMPANY UPDATE
Page | 4
IMS Revenue Market Share (USD mn) IMS Revenue Market Share (%)
Source: Company, HDFC Sec Inst Research, TTM Source: Company, HDFC sec Inst Research IMS Growth: 6-qtr CQGR (%)
Recent Deal Wins
Client Vertical Geography Anglo American Energy & Utilities Global Asda Retail UK TransGrid Energy & Utilities Australia Deutsche Bank BFSI Global Broadcom Technology Global Barclays BFSI Global Elders Ariiculture & Farm Products Australia Aegon BFSI Global
Source: Company, HDFC sec Inst Research
Source: Company, HDFC sec Inst Research
Continuity in market share gains in IMS by HCLT vs. peers such as DXC and Atos which are 3.8x and 2.4x HCLT’s size
HCLT2,990
Wipro2,258
DXC12,339
Atos8,357
(USD mn)
12% 13%9% 9%
49% 49%
30% 30%
0%
10%
20%
30%
40%
50%
60%
1QFY
18
2QFY
18
3QFY
18
4QFY
18
1QFY
19
2QFY
19
HCLT Wipro DXC Atos
0.8%
-0.5% -0.5%
-1.3%
-1.5%
-1.0%
-0.5%
0.0%
0.5%
1.0%
HCL
T
Wip
ro
DXC
Atos
(%)
HCL TECHNOLOGIES: COMPANY UPDATE
Page | 5
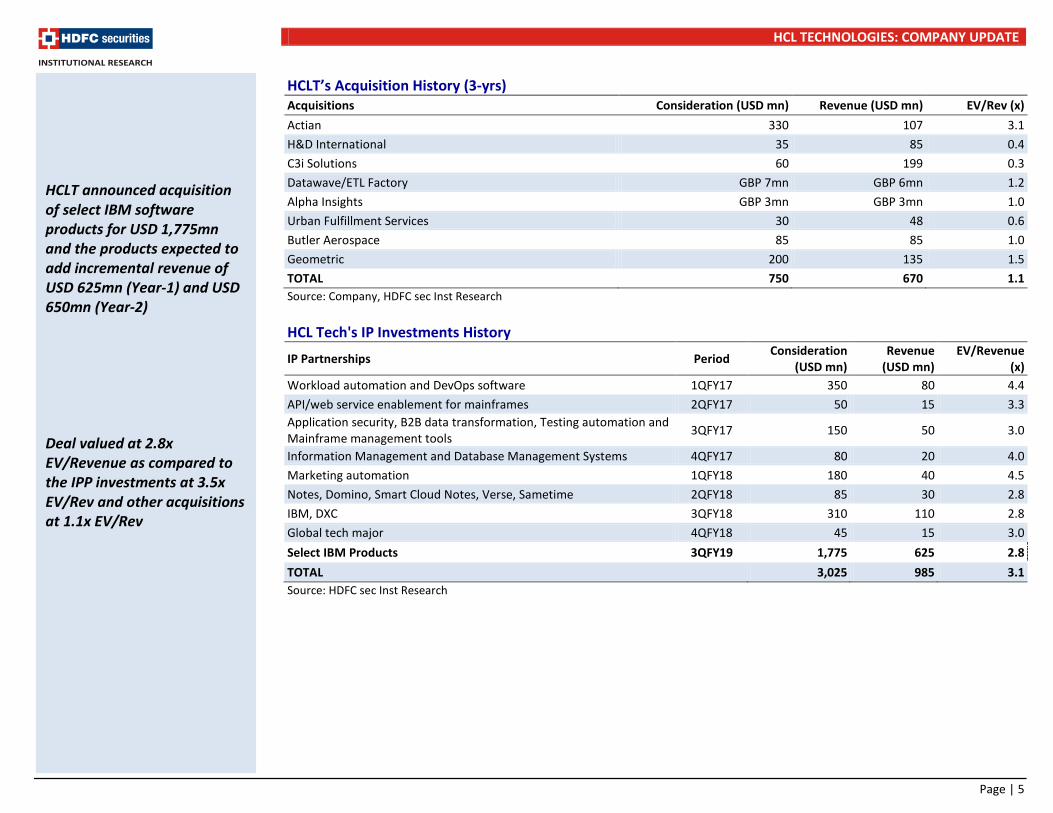
HCLT’s Acquisition History (3-yrs) Acquisitions Consideration (USD mn) Revenue (USD mn) EV/Rev (x) Actian 330 107 3.1 H&D International 35 85 0.4 C3i Solutions 60 199 0.3 Datawave/ETL Factory GBP 7mn GBP 6mn 1.2 Alpha Insights GBP 3mn GBP 3mn 1.0 Urban Fulfillment Services 30 48 0.6 Butler Aerospace 85 85 1.0 Geometric 200 135 1.5 TOTAL 750 670 1.1 Source: Company, HDFC sec Inst Research HCL Tech's IP Investments History
IP Partnerships Period Consideration (USD mn)
Revenue (USD mn)
EV/Revenue (x)
Workload automation and DevOps software 1QFY17 350 80 4.4 API/web service enablement for mainframes 2QFY17 50 15 3.3 Application security, B2B data transformation, Testing automation and Mainframe management tools 3QFY17 150 50 3.0
Information Management and Database Management Systems 4QFY17 80 20 4.0 Marketing automation 1QFY18 180 40 4.5 Notes, Domino, Smart Cloud Notes, Verse, Sametime 2QFY18 85 30 2.8 IBM, DXC 3QFY18 310 110 2.8 Global tech major 4QFY18 45 15 3.0 Select IBM Products 3QFY19 1,775 625 2.8 TOTAL 3,025 985 3.1 Source: HDFC sec Inst Research
HCLT announced acquisition of select IBM software products for USD 1,775mn and the products expected to add incremental revenue of USD 625mn (Year-1) and USD 650mn (Year-2) Deal valued at 2.8x EV/Revenue as compared to the IPP investments at 3.5x EV/Rev and other acquisitions at 1.1x EV/Rev
HCL TECHNOLOGIES: COMPANY UPDATE
Page | 6
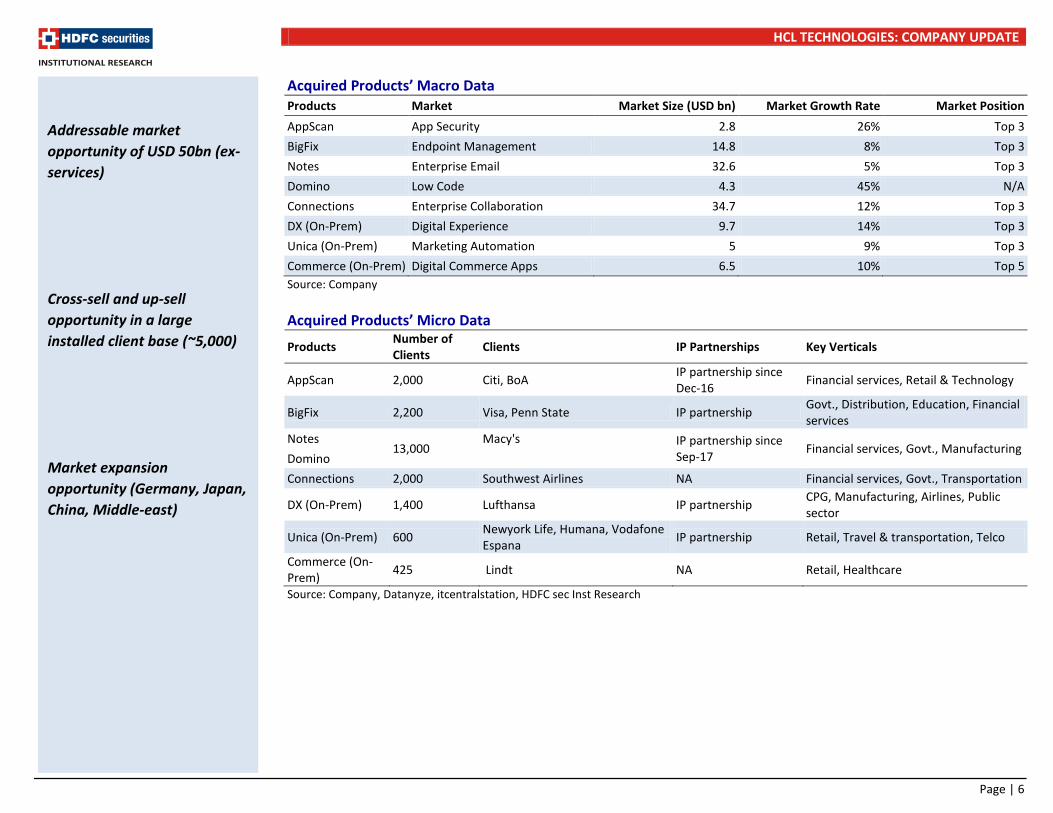
Acquired Products’ Macro Data Products Market Market Size (USD bn) Market Growth Rate Market Position AppScan App Security 2.8 26% Top 3 BigFix Endpoint Management 14.8 8% Top 3 Notes Enterprise Email 32.6 5% Top 3 Domino Low Code 4.3 45% N/A Connections Enterprise Collaboration 34.7 12% Top 3 DX (On-Prem) Digital Experience 9.7 14% Top 3 Unica (On-Prem) Marketing Automation 5 9% Top 3 Commerce (On-Prem) Digital Commerce Apps 6.5 10% Top 5 Source: Company Acquired Products’ Micro Data
Products Number of Clients Clients IP Partnerships Key Verticals
AppScan 2,000 Citi, BoA IP partnership since Dec-16 Financial services, Retail & Technology
BigFix 2,200 Visa, Penn State IP partnership Govt., Distribution, Education, Financial services
Notes 13,000
Macy's IP partnership since Sep-17 Financial services, Govt., Manufacturing
Domino Connections 2,000 Southwest Airlines NA Financial services, Govt., Transportation
DX (On-Prem) 1,400 Lufthansa IP partnership CPG, Manufacturing, Airlines, Public sector
Unica (On-Prem) 600 Newyork Life, Humana, Vodafone Espana IP partnership Retail, Travel & transportation, Telco
Commerce (On-Prem) 425 Lindt NA Retail, Healthcare
Source: Company, Datanyze, itcentralstation, HDFC sec Inst Research
Addressable market opportunity of USD 50bn (ex-services)
Cross-sell and up-sell opportunity in a large installed client base (~5,000)
Market expansion opportunity (Germany, Japan, China, Middle-east)
HCL TECHNOLOGIES: COMPANY UPDATE
Page | 7
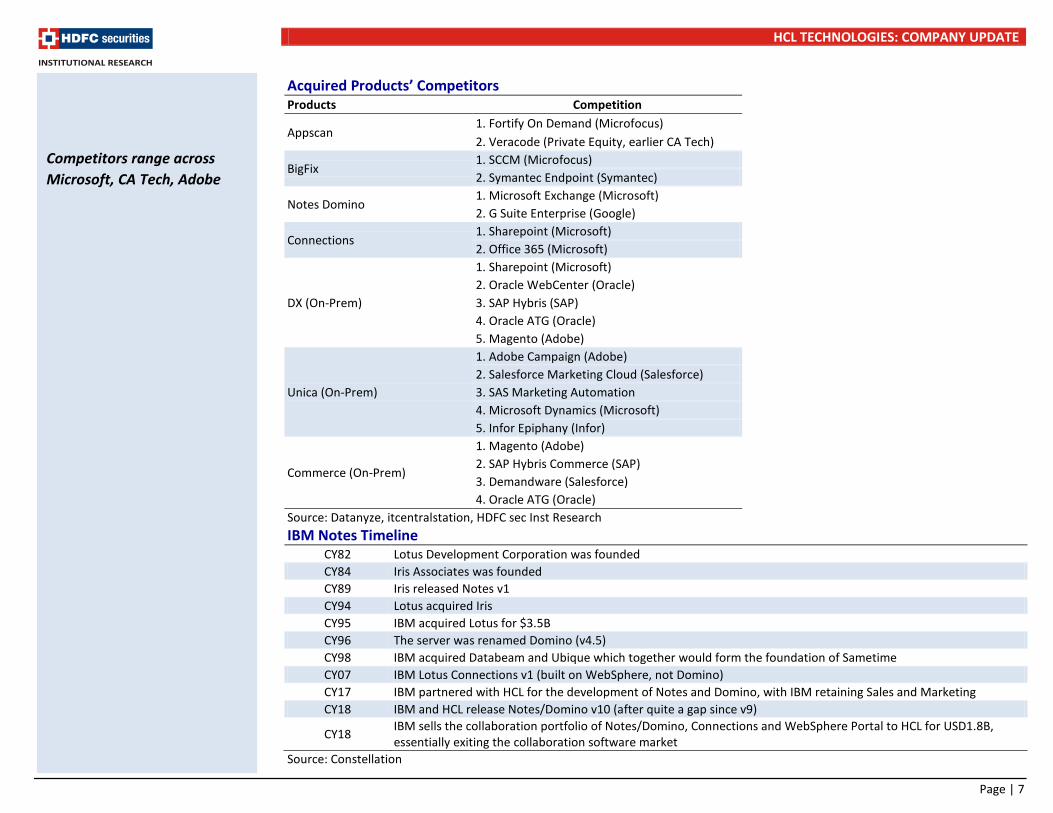
Acquired Products’ Competitors Products Competition
Appscan 1. Fortify On Demand (Microfocus) 2. Veracode (Private Equity, earlier CA Tech)
BigFix 1. SCCM (Microfocus) 2. Symantec Endpoint (Symantec)
Notes Domino 1. Microsoft Exchange (Microsoft) 2. G Suite Enterprise (Google)
Connections 1. Sharepoint (Microsoft) 2. Office 365 (Microsoft)
DX (On-Prem)
1. Sharepoint (Microsoft) 2. Oracle WebCenter (Oracle) 3. SAP Hybris (SAP) 4. Oracle ATG (Oracle) 5. Magento (Adobe)
Unica (On-Prem)
1. Adobe Campaign (Adobe) 2. Salesforce Marketing Cloud (Salesforce) 3. SAS Marketing Automation 4. Microsoft Dynamics (Microsoft) 5. Infor Epiphany (Infor)
Commerce (On-Prem)
1. Magento (Adobe) 2. SAP Hybris Commerce (SAP) 3. Demandware (Salesforce) 4. Oracle ATG (Oracle)
Source: Datanyze, itcentralstation, HDFC sec Inst Research IBM Notes Timeline
CY82 Lotus Development Corporation was founded CY84 Iris Associates was founded CY89 Iris released Notes v1 CY94 Lotus acquired Iris CY95 IBM acquired Lotus for $3.5B CY96 The server was renamed Domino (v4.5) CY98 IBM acquired Databeam and Ubique which together would form the foundation of Sametime CY07 IBM Lotus Connections v1 (built on WebSphere, not Domino) CY17 IBM partnered with HCL for the development of Notes and Domino, with IBM retaining Sales and Marketing CY18 IBM and HCL release Notes/Domino v10 (after quite a gap since v9)
CY18 IBM sells the collaboration portfolio of Notes/Domino, Connections and WebSphere Portal to HCL for USD1.8B, essentially exiting the collaboration software market
Source: Constellation
Competitors range across Microsoft, CA Tech, Adobe
HCL TECHNOLOGIES: COMPANY UPDATE
Page | 8
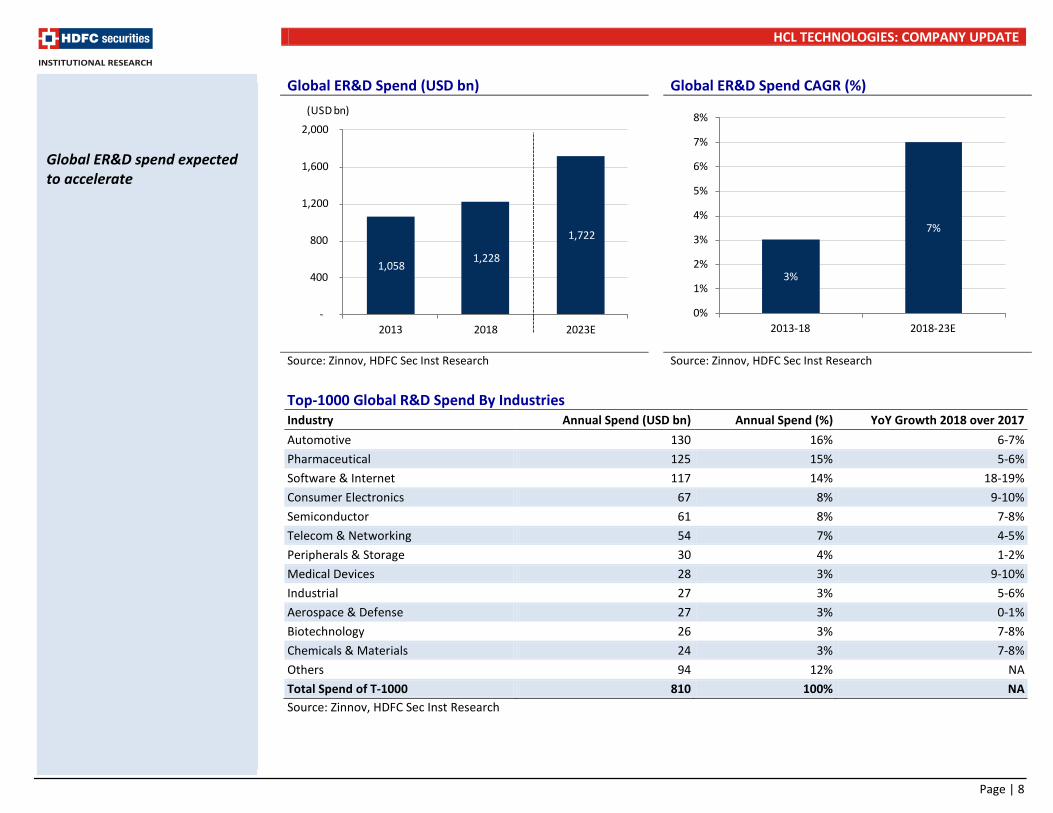
Global ER&D Spend (USD bn) Global ER&D Spend CAGR (%)
Source: Zinnov, HDFC Sec Inst Research Source: Zinnov, HDFC Sec Inst Research Top-1000 Global R&D Spend By Industries Industry Annual Spend (USD bn) Annual Spend (%) YoY Growth 2018 over 2017 Automotive 130 16% 6-7% Pharmaceutical 125 15% 5-6% Software & Internet 117 14% 18-19% Consumer Electronics 67 8% 9-10% Semiconductor 61 8% 7-8% Telecom & Networking 54 7% 4-5% Peripherals & Storage 30 4% 1-2% Medical Devices 28 3% 9-10% Industrial 27 3% 5-6% Aerospace & Defense 27 3% 0-1% Biotechnology 26 3% 7-8% Chemicals & Materials 24 3% 7-8% Others 94 12% NA Total Spend of T-1000 810 100% NA Source: Zinnov, HDFC Sec Inst Research
ER&D growth acceleration expected across industries
Global ER&D spend expected to accelerate
1,058 1,228
1,722
-
400
800
1,200
1,600
2,000
2013 2018 2023E
(USD bn)
3%
7%
0%
1%
2%
3%
4%
5%
6%
7%
8%
2013-18 2018-23E
HCL TECHNOLOGIES: COMPANY UPDATE
Page | 9
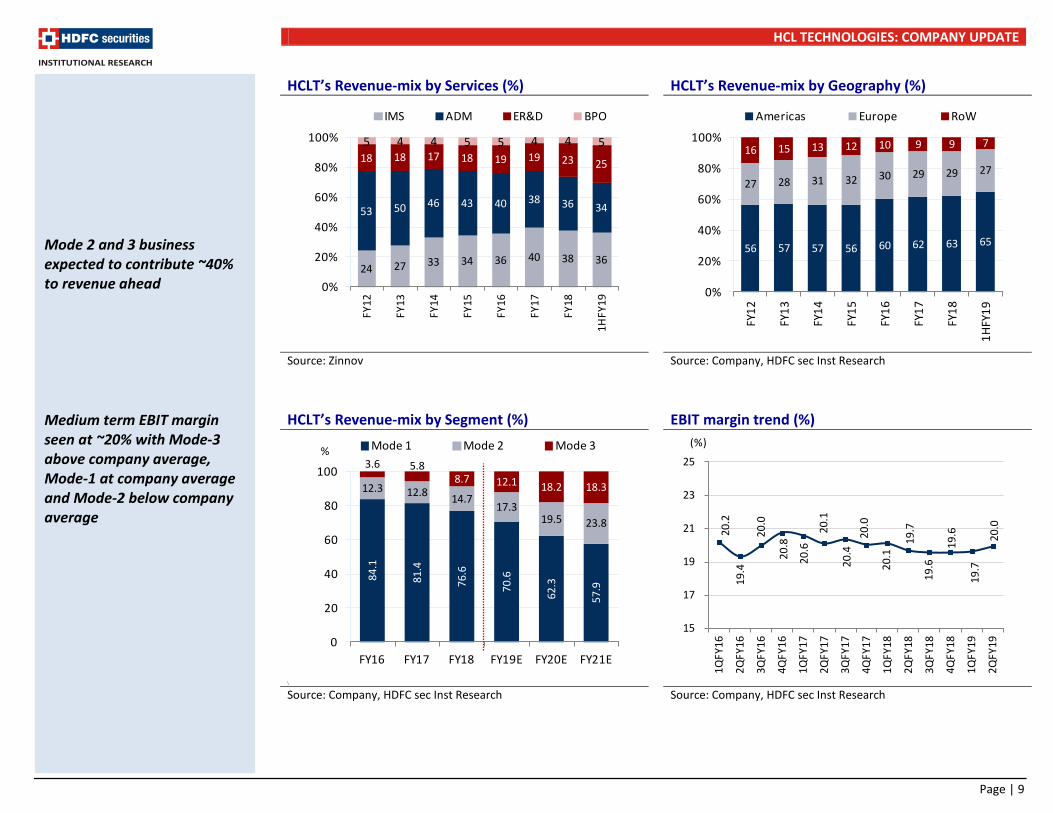
HCLT’s Revenue-mix by Services (%) HCLT’s Revenue-mix by Geography (%)
Source: Zinnov Source: Company, HDFC sec Inst Research HCLT’s Revenue-mix by Segment (%)
EBIT margin trend (%)
\
Source: Company, HDFC sec Inst Research Source: Company, HDFC sec Inst Research
Mode 2 and 3 business expected to contribute ~40% to revenue ahead Medium term EBIT margin seen at ~20% with Mode-3 above company average, Mode-1 at company average and Mode-2 below company average
24 27 33 34 36 40 38 36
53 50 46 43 40 38 36 34
18 18 17 18 19 19 23 25
5 4 4 5 5 4 4 5
0%
20%
40%
60%
80%
100%
FY12
FY13
FY14
FY15
FY16
FY17
FY18
1HFY
19
IMS ADM ER&D BPO
56 57 57 56 60 62 63 65
27 28 31 32 30 29 29 27
16 15 13 12 10 9 9 7
0%
20%
40%
60%
80%
100%
FY12
FY13
FY14
FY15
FY16
FY17
FY18
1HFY
19
Americas Europe RoW
84.1
81.4
76.6
70.6
62.3
57.9
12.3 12.8 14.717.3
19.5 23.8
3.6 5.88.7 12.1 18.2 18.3
0
20
40
60
80
100
FY16 FY17 FY18 FY19E FY20E FY21E
Mode 1 Mode 2 Mode 3%
20.2
19
.4
20.0
20.8
20.6
20.1
20.4
20
.0
20.1
19.7
19
.6
19.6
19.7
20.0
15
17
19
21
23
25
1QFY
16
2QFY
16
3QFY
16
4QFY
16
1QFY
17
2QFY
17
3QFY
17
4QFY
17
1QFY
18
2QFY
18
3QFY
18
4QFY
18
1QFY
19
2QFY
19
(%)
HCL TECHNOLOGIES: COMPANY UPDATE
Page | 10
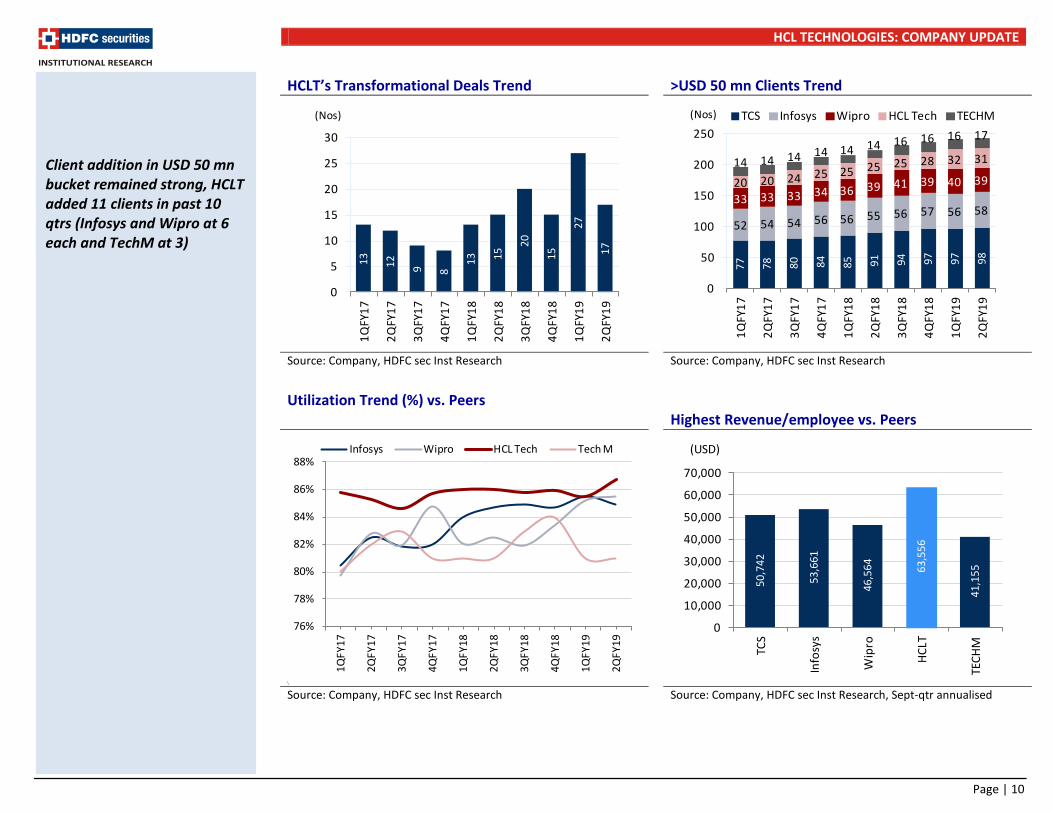
HCLT’s Transformational Deals Trend >USD 50 mn Clients Trend
Source: Company, HDFC sec Inst Research Source: Company, HDFC sec Inst Research Utilization Trend (%) vs. Peers
Highest Revenue/employee vs. Peers
\
Source: Company, HDFC sec Inst Research Source: Company, HDFC sec Inst Research, Sept-qtr annualised
Client addition in USD 50 mn bucket remained strong, HCLT added 11 clients in past 10 qtrs (Infosys and Wipro at 6 each and TechM at 3)
13 12 9 8
13 15
20
15
27
17
0
5
10
15
20
25
30
1QFY
17
2QFY
17
3QFY
17
4QFY
17
1QFY
18
2QFY
18
3QFY
18
4QFY
18
1QFY
19
2QFY
19
(Nos)
77
78
80
84
85 91 94 97 97 98
52 54 54 56 56 55 56 57 56 5833 33 33 34 36 39 41 39 40 3920 20 24 25 25 25 25 28 32 3114 14 14 14 14 14 16 16 16 17
0
50
100
150
200
250
1QFY
17
2QFY
17
3QFY
17
4QFY
17
1QFY
18
2QFY
18
3QFY
18
4QFY
18
1QFY
19
2QFY
19
TCS Infosys Wipro HCL Tech TECHM(Nos)
76%
78%
80%
82%
84%
86%
88%
1QFY
17
2QFY
17
3QFY
17
4QFY
17
1QFY
18
2QFY
18
3QFY
18
4QFY
18
1QFY
19
2QFY
19
Infosys Wipro HCL Tech Tech M
50,7
42
53,6
61
46,5
64
63,5
56
41,1
55
0
10,000
20,000
30,000
40,000
50,000
60,000
70,000
TCS
Info
sys
Wip
ro
HCLT
TECH
M
(USD)
HCL TECHNOLOGIES: COMPANY UPDATE
Page | 11
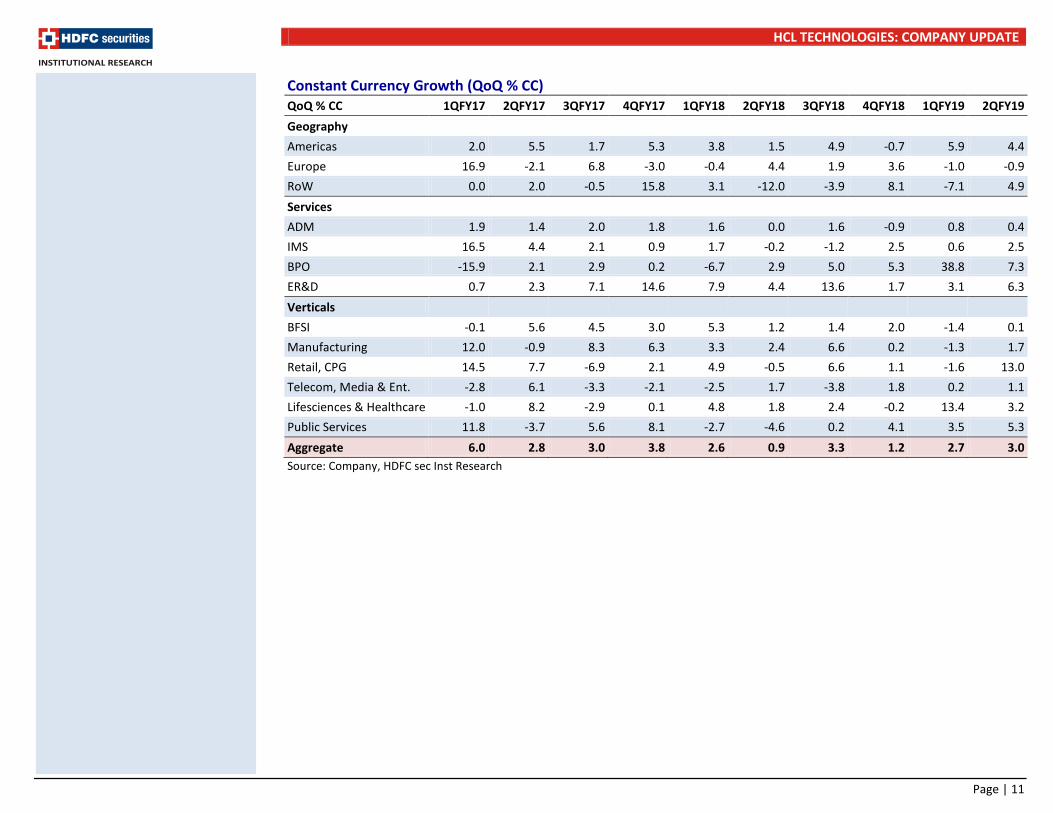
Constant Currency Growth (QoQ % CC) QoQ % CC 1QFY17 2QFY17 3QFY17 4QFY17 1QFY18 2QFY18 3QFY18 4QFY18 1QFY19 2QFY19 Geography Americas 2.0 5.5 1.7 5.3 3.8 1.5 4.9 -0.7 5.9 4.4 Europe 16.9 -2.1 6.8 -3.0 -0.4 4.4 1.9 3.6 -1.0 -0.9 RoW 0.0 2.0 -0.5 15.8 3.1 -12.0 -3.9 8.1 -7.1 4.9 Services ADM 1.9 1.4 2.0 1.8 1.6 0.0 1.6 -0.9 0.8 0.4 IMS 16.5 4.4 2.1 0.9 1.7 -0.2 -1.2 2.5 0.6 2.5 BPO -15.9 2.1 2.9 0.2 -6.7 2.9 5.0 5.3 38.8 7.3 ER&D 0.7 2.3 7.1 14.6 7.9 4.4 13.6 1.7 3.1 6.3 Verticals BFSI -0.1 5.6 4.5 3.0 5.3 1.2 1.4 2.0 -1.4 0.1 Manufacturing 12.0 -0.9 8.3 6.3 3.3 2.4 6.6 0.2 -1.3 1.7 Retail, CPG 14.5 7.7 -6.9 2.1 4.9 -0.5 6.6 1.1 -1.6 13.0 Telecom, Media & Ent. -2.8 6.1 -3.3 -2.1 -2.5 1.7 -3.8 1.8 0.2 1.1 Lifesciences & Healthcare -1.0 8.2 -2.9 0.1 4.8 1.8 2.4 -0.2 13.4 3.2 Public Services 11.8 -3.7 5.6 8.1 -2.7 -4.6 0.2 4.1 3.5 5.3 Aggregate 6.0 2.8 3.0 3.8 2.6 0.9 3.3 1.2 2.7 3.0 Source: Company, HDFC sec Inst Research
HCL TECHNOLOGIES: COMPANY UPDATE
Page | 12
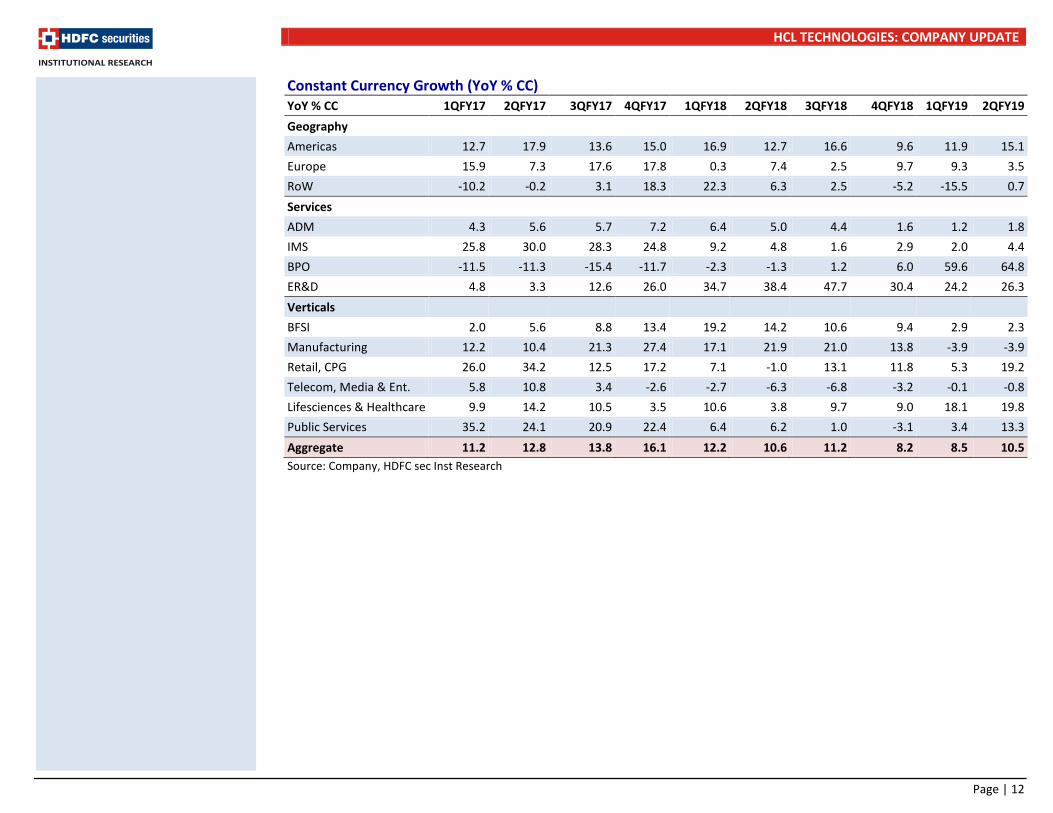
Constant Currency Growth (YoY % CC) YoY % CC 1QFY17 2QFY17 3QFY17 4QFY17 1QFY18 2QFY18 3QFY18 4QFY18 1QFY19 2QFY19 Geography Americas 12.7 17.9 13.6 15.0 16.9 12.7 16.6 9.6 11.9 15.1 Europe 15.9 7.3 17.6 17.8 0.3 7.4 2.5 9.7 9.3 3.5 RoW -10.2 -0.2 3.1 18.3 22.3 6.3 2.5 -5.2 -15.5 0.7 Services ADM 4.3 5.6 5.7 7.2 6.4 5.0 4.4 1.6 1.2 1.8 IMS 25.8 30.0 28.3 24.8 9.2 4.8 1.6 2.9 2.0 4.4 BPO -11.5 -11.3 -15.4 -11.7 -2.3 -1.3 1.2 6.0 59.6 64.8 ER&D 4.8 3.3 12.6 26.0 34.7 38.4 47.7 30.4 24.2 26.3 Verticals BFSI 2.0 5.6 8.8 13.4 19.2 14.2 10.6 9.4 2.9 2.3 Manufacturing 12.2 10.4 21.3 27.4 17.1 21.9 21.0 13.8 -3.9 -3.9 Retail, CPG 26.0 34.2 12.5 17.2 7.1 -1.0 13.1 11.8 5.3 19.2 Telecom, Media & Ent. 5.8 10.8 3.4 -2.6 -2.7 -6.3 -6.8 -3.2 -0.1 -0.8 Lifesciences & Healthcare 9.9 14.2 10.5 3.5 10.6 3.8 9.7 9.0 18.1 19.8 Public Services 35.2 24.1 20.9 22.4 6.4 6.2 1.0 -3.1 3.4 13.3 Aggregate 11.2 12.8 13.8 16.1 12.2 10.6 11.2 8.2 8.5 10.5 Source: Company, HDFC sec Inst Research
HCL TECHNOLOGIES: COMPANY UPDATE
Page | 13
HCLT P/E (1-yr fwd Trend) P/E Trend: HCLT vs. Wipro (1-yr fwd Trend)
Source: Company, HDFC sec Inst Research Source: Company, HDFC sec Inst Research
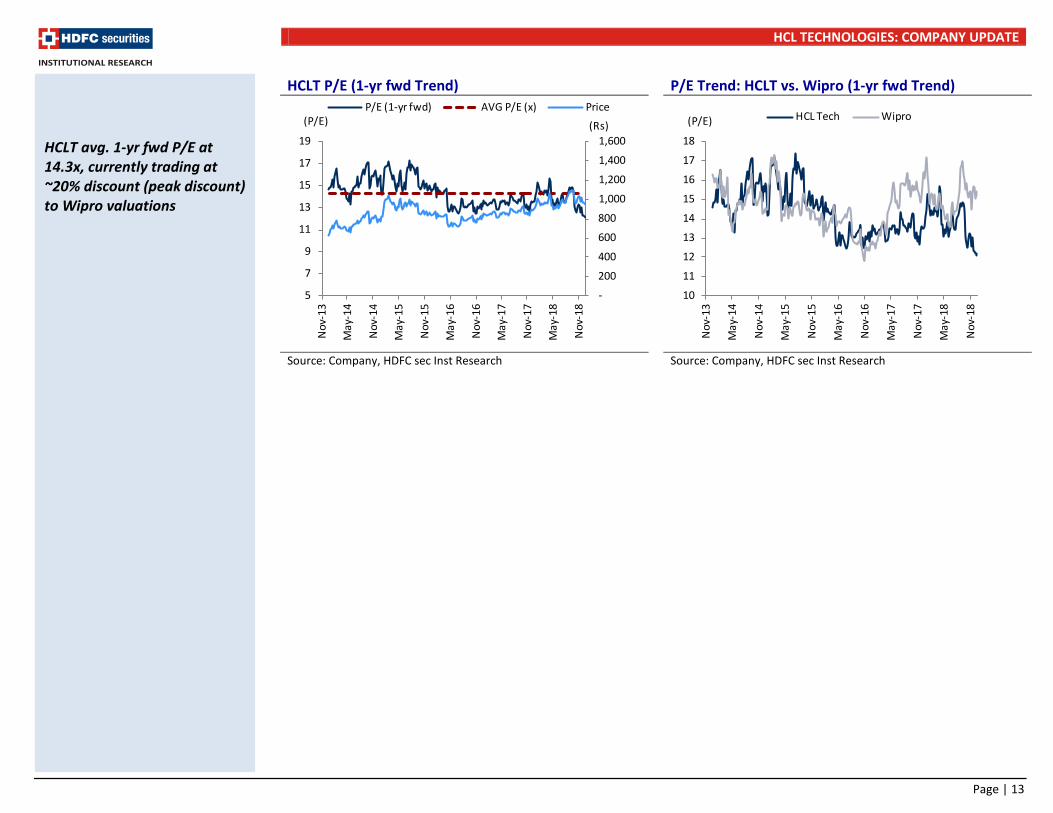
HCLT avg. 1-yr fwd P/E at 14.3x, currently trading at ~20% discount (peak discount) to Wipro valuations
-
200
400
600
800
1,000
1,200
1,400
1,600
5
7
9
11
13
15
17
19
Nov
-13
May
-14
Nov
-14
May
-15
Nov
-15
May
-16
Nov
-16
May
-17
Nov
-17
May
- 18
Nov
-18
(Rs)(P/E)P/E (1-yr fwd) AVG P/E (x) Price
10
11
12
13
14
15
16
17
18
Nov
-13
May
-14
Nov
-14
May
-15
Nov
-15
May
-16
Nov
-16
May
-17
Nov
-17
May
-18
Nov
-18
(P/E) HCL Tech Wipro
HCL TECHNOLOGIES: COMPANY UPDATE
Page | 14
Change In Estimates
Particulars Earlier estimates Revised estimates % change
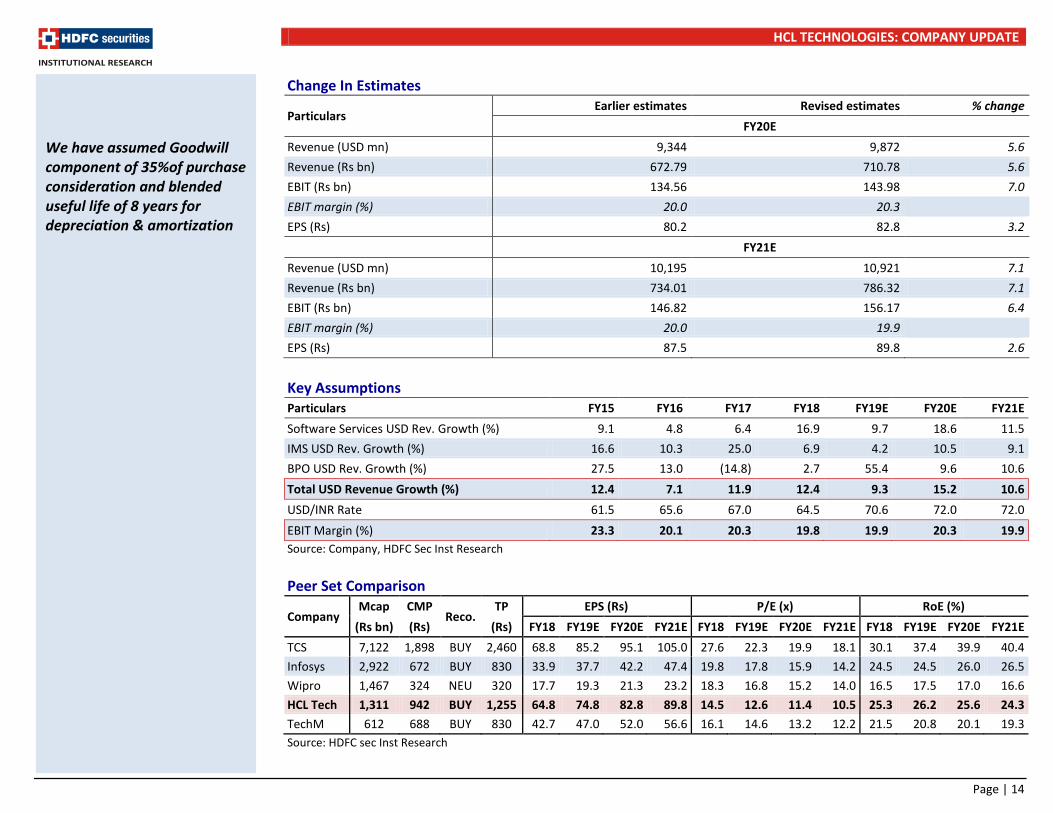
FY20E Revenue (USD mn) 9,344 9,872 5.6 Revenue (Rs bn) 672.79 710.78 5.6 EBIT (Rs bn) 134.56 143.98 7.0 EBIT margin (%) 20.0 20.3 EPS (Rs) 80.2 82.8 3.2
FY21E Revenue (USD mn) 10,195 10,921 7.1 Revenue (Rs bn) 734.01 786.32 7.1 EBIT (Rs bn) 146.82 156.17 6.4 EBIT margin (%) 20.0 19.9 EPS (Rs) 87.5 89.8 2.6
Key Assumptions Particulars FY15 FY16 FY17 FY18 FY19E FY20E FY21E Software Services USD Rev. Growth (%) 9.1 4.8 6.4 16.9 9.7 18.6 11.5 IMS USD Rev. Growth (%) 16.6 10.3 25.0 6.9 4.2 10.5 9.1 BPO USD Rev. Growth (%) 27.5 13.0 (14.8) 2.7 55.4 9.6 10.6 Total USD Revenue Growth (%) 12.4 7.1 11.9 12.4 9.3 15.2 10.6 USD/INR Rate 61.5 65.6 67.0 64.5 70.6 72.0 72.0 EBIT Margin (%) 23.3 20.1 20.3 19.8 19.9 20.3 19.9 Source: Company, HDFC Sec Inst Research Peer Set Comparison
Company Mcap CMP
Reco. TP EPS (Rs) P/E (x) RoE (%)
(Rs bn) (Rs) (Rs) FY18 FY19E FY20E FY21E FY18 FY19E FY20E FY21E FY18 FY19E FY20E FY21E TCS 7,122 1,898 BUY 2,460 68.8 85.2 95.1 105.0 27.6 22.3 19.9 18.1 30.1 37.4 39.9 40.4 Infosys 2,922 672 BUY 830 33.9 37.7 42.2 47.4 19.8 17.8 15.9 14.2 24.5 24.5 26.0 26.5 Wipro 1,467 324 NEU 320 17.7 19.3 21.3 23.2 18.3 16.8 15.2 14.0 16.5 17.5 17.0 16.6 HCL Tech 1,311 942 BUY 1,255 64.8 74.8 82.8 89.8 14.5 12.6 11.4 10.5 25.3 26.2 25.6 24.3 TechM 612 688 BUY 830 42.7 47.0 52.0 56.6 16.1 14.6 13.2 12.2 21.5 20.8 20.1 19.3 Source: HDFC sec Inst Research
We have assumed Goodwill component of 35%of purchase consideration and blended useful life of 8 years for depreciation & amortization
HCL TECHNOLOGIES: COMPANY UPDATE
Page | 15
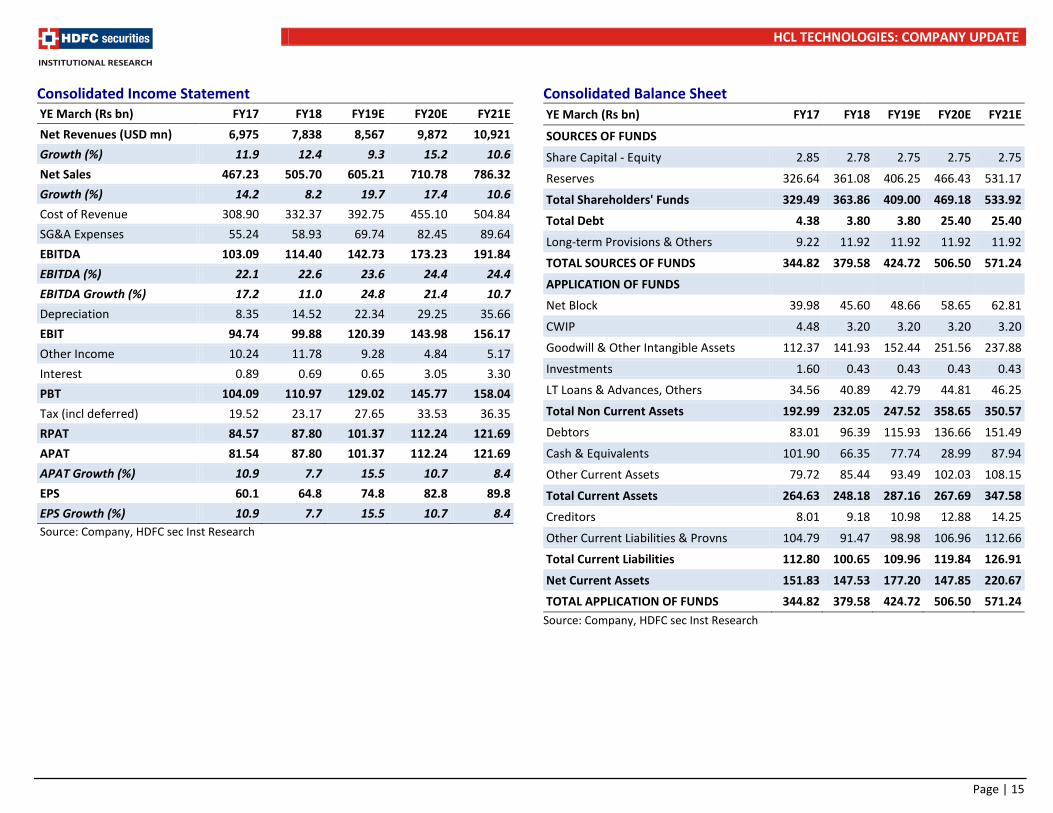
Consolidated Income Statement YE March (Rs bn) FY17 FY18 FY19E FY20E FY21E Net Revenues (USD mn) 6,975 7,838 8,567 9,872 10,921 Growth (%) 11.9 12.4 9.3 15.2 10.6 Net Sales 467.23 505.70 605.21 710.78 786.32 Growth (%) 14.2 8.2 19.7 17.4 10.6 Cost of Revenue 308.90 332.37 392.75 455.10 504.84 SG&A Expenses 55.24 58.93 69.74 82.45 89.64 EBITDA 103.09 114.40 142.73 173.23 191.84 EBITDA (%) 22.1 22.6 23.6 24.4 24.4 EBITDA Growth (%) 17.2 11.0 24.8 21.4 10.7 Depreciation 8.35 14.52 22.34 29.25 35.66 EBIT 94.74 99.88 120.39 143.98 156.17 Other Income 10.24 11.78 9.28 4.84 5.17 Interest 0.89 0.69 0.65 3.05 3.30 PBT 104.09 110.97 129.02 145.77 158.04 Tax (incl deferred) 19.52 23.17 27.65 33.53 36.35 RPAT 84.57 87.80 101.37 112.24 121.69 APAT 81.54 87.80 101.37 112.24 121.69 APAT Growth (%) 10.9 7.7 15.5 10.7 8.4 EPS 60.1 64.8 74.8 82.8 89.8 EPS Growth (%) 10.9 7.7 15.5 10.7 8.4
Source: Company, HDFC sec Inst Research
Consolidated Balance Sheet YE March (Rs bn) FY17 FY18 FY19E FY20E FY21E
SOURCES OF FUNDS Share Capital - Equity 2.85 2.78 2.75 2.75 2.75
Reserves 326.64 361.08 406.25 466.43 531.17
Total Shareholders' Funds 329.49 363.86 409.00 469.18 533.92
Total Debt 4.38 3.80 3.80 25.40 25.40
Long-term Provisions & Others 9.22 11.92 11.92 11.92 11.92
TOTAL SOURCES OF FUNDS 344.82 379.58 424.72 506.50 571.24
APPLICATION OF FUNDS Net Block 39.98 45.60 48.66 58.65 62.81
CWIP 4.48 3.20 3.20 3.20 3.20
Goodwill & Other Intangible Assets 112.37 141.93 152.44 251.56 237.88
Investments 1.60 0.43 0.43 0.43 0.43
LT Loans & Advances, Others 34.56 40.89 42.79 44.81 46.25
Total Non Current Assets 192.99 232.05 247.52 358.65 350.57
Debtors 83.01 96.39 115.93 136.66 151.49
Cash & Equivalents 101.90 66.35 77.74 28.99 87.94
Other Current Assets 79.72 85.44 93.49 102.03 108.15
Total Current Assets 264.63 248.18 287.16 267.69 347.58
Creditors 8.01 9.18 10.98 12.88 14.25
Other Current Liabilities & Provns 104.79 91.47 98.98 106.96 112.66
Total Current Liabilities 112.80 100.65 109.96 119.84 126.91
Net Current Assets 151.83 147.53 177.20 147.85 220.67
TOTAL APPLICATION OF FUNDS 344.82 379.58 424.72 506.50 571.24 Source: Company, HDFC sec Inst Research
HCL TECHNOLOGIES: COMPANY UPDATE
Page | 16
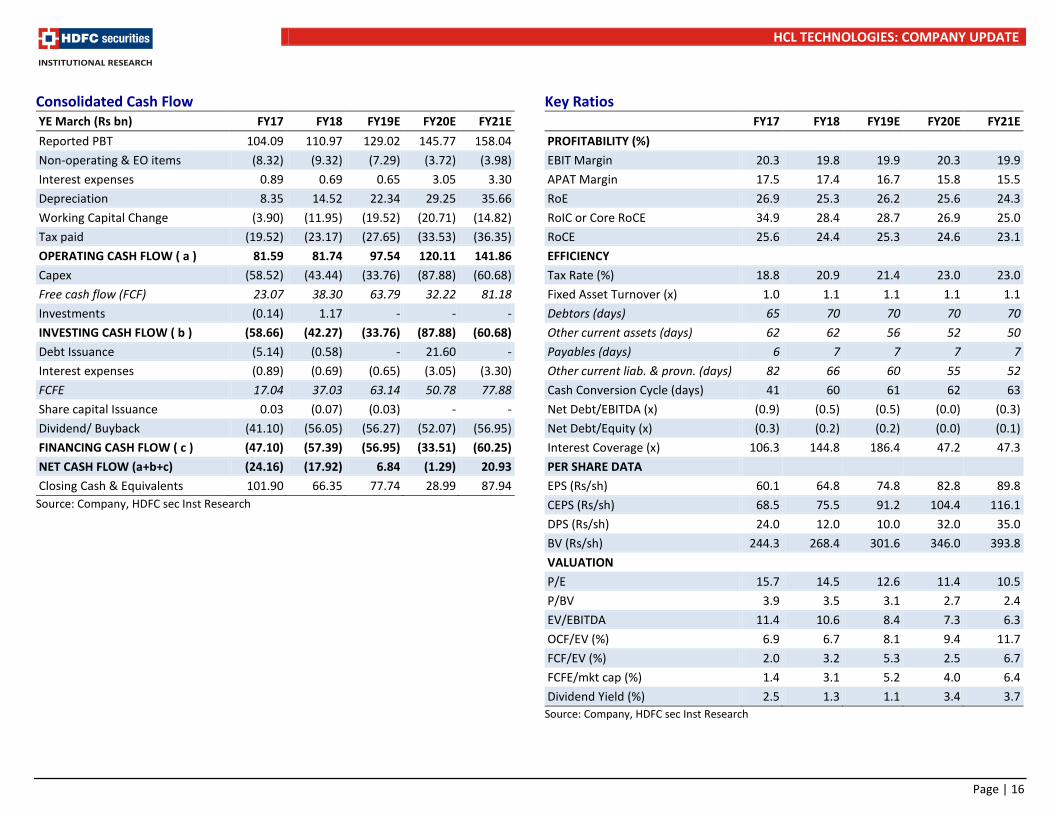
Consolidated Cash Flow YE March (Rs bn) FY17 FY18 FY19E FY20E FY21E Reported PBT 104.09 110.97 129.02 145.77 158.04 Non-operating & EO items (8.32) (9.32) (7.29) (3.72) (3.98) Interest expenses 0.89 0.69 0.65 3.05 3.30 Depreciation 8.35 14.52 22.34 29.25 35.66 Working Capital Change (3.90) (11.95) (19.52) (20.71) (14.82) Tax paid (19.52) (23.17) (27.65) (33.53) (36.35) OPERATING CASH FLOW ( a ) 81.59 81.74 97.54 120.11 141.86 Capex (58.52) (43.44) (33.76) (87.88) (60.68) Free cash flow (FCF) 23.07 38.30 63.79 32.22 81.18 Investments (0.14) 1.17 - - - INVESTING CASH FLOW ( b ) (58.66) (42.27) (33.76) (87.88) (60.68) Debt Issuance (5.14) (0.58) - 21.60 - Interest expenses (0.89) (0.69) (0.65) (3.05) (3.30) FCFE 17.04 37.03 63.14 50.78 77.88 Share capital Issuance 0.03 (0.07) (0.03) - - Dividend/ Buyback (41.10) (56.05) (56.27) (52.07) (56.95) FINANCING CASH FLOW ( c ) (47.10) (57.39) (56.95) (33.51) (60.25) NET CASH FLOW (a+b+c) (24.16) (17.92) 6.84 (1.29) 20.93 Closing Cash & Equivalents 101.90 66.35 77.74 28.99 87.94
Source: Company, HDFC sec Inst Research
Key Ratios FY17 FY18 FY19E FY20E FY21E PROFITABILITY (%) EBIT Margin 20.3 19.8 19.9 20.3 19.9 APAT Margin 17.5 17.4 16.7 15.8 15.5 RoE 26.9 25.3 26.2 25.6 24.3 RoIC or Core RoCE 34.9 28.4 28.7 26.9 25.0 RoCE 25.6 24.4 25.3 24.6 23.1 EFFICIENCY Tax Rate (%) 18.8 20.9 21.4 23.0 23.0 Fixed Asset Turnover (x) 1.0 1.1 1.1 1.1 1.1 Debtors (days) 65 70 70 70 70 Other current assets (days) 62 62 56 52 50 Payables (days) 6 7 7 7 7 Other current liab. & provn. (days) 82 66 60 55 52 Cash Conversion Cycle (days) 41 60 61 62 63 Net Debt/EBITDA (x) (0.9) (0.5) (0.5) (0.0) (0.3) Net Debt/Equity (x) (0.3) (0.2) (0.2) (0.0) (0.1) Interest Coverage (x) 106.3 144.8 186.4 47.2 47.3 PER SHARE DATA EPS (Rs/sh) 60.1 64.8 74.8 82.8 89.8 CEPS (Rs/sh) 68.5 75.5 91.2 104.4 116.1 DPS (Rs/sh) 24.0 12.0 10.0 32.0 35.0 BV (Rs/sh) 244.3 268.4 301.6 346.0 393.8 VALUATION P/E 15.7 14.5 12.6 11.4 10.5 P/BV 3.9 3.5 3.1 2.7 2.4 EV/EBITDA 11.4 10.6 8.4 7.3 6.3 OCF/EV (%) 6.9 6.7 8.1 9.4 11.7 FCF/EV (%) 2.0 3.2 5.3 2.5 6.7 FCFE/mkt cap (%) 1.4 3.1 5.2 4.0 6.4 Dividend Yield (%) 2.5 1.3 1.1 3.4 3.7
Source: Company, HDFC sec Inst Research
HCL TECHNOLOGIES: COMPANY UPDATE
Page | 17
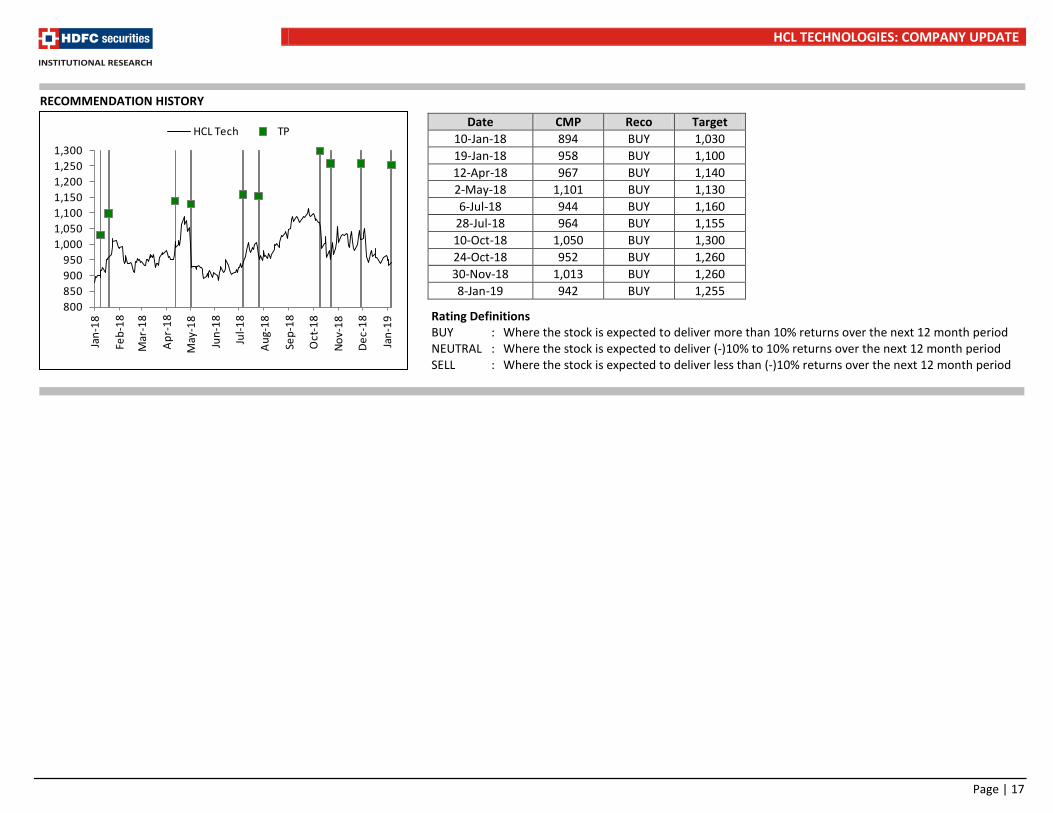
Rating Definitions BUY : Where the stock is expected to deliver more than 10% returns over the next 12 month period NEUTRAL : Where the stock is expected to deliver (-)10% to 10% returns over the next 12 month period SELL : Where the stock is expected to deliver less than (-)10% returns over the next 12 month period
Date CMP Reco Target 10-Jan-18 894 BUY 1,030 19-Jan-18 958 BUY 1,100 12-Apr-18 967 BUY 1,140 2-May-18 1,101 BUY 1,130 6-Jul-18 944 BUY 1,160
28-Jul-18 964 BUY 1,155 10-Oct-18 1,050 BUY 1,300 24-Oct-18 952 BUY 1,260 30-Nov-18 1,013 BUY 1,260 8-Jan-19 942 BUY 1,255
RECOMMENDATION HISTORY
800850900950
1,0001,0501,1001,1501,2001,2501,300
Jan-
18
Feb-
18
Mar
-18
Apr-
18
May
-18
Jun-
18
Jul-1
8
Aug-
18
Sep-
18
Oct
-18
Nov-
18
Dec-
18
Jan-
19
HCL Tech TP
HCL TECHNOLOGIES: COMPANY UPDATE
Page | 18
Disclosure: We, Apurva Prasad, MBA, Amit Chandra, MBA & Akshay Ramnani, CA, authors and the names subscribed to this report, hereby certify that all of the views expressed in this research report accurately reflect our views about the subject issuer(s) or securities. HSL has no material adverse disciplinary history as on the date of publication of this report. We also certify that no part of our compensation was, is, or will be directly or indirectly related to the specific recommendation(s) or view(s) in this report. Research Analyst or his/her relative or HDFC Securities Ltd. does not have any financial interest in the subject company. Also Research Analyst or his relative or HDFC Securities Ltd. or its Associate may have beneficial ownership of 1% or more in the subject company at the end of the month immediately preceding the date of publication of the Research Report. Further Research Analyst or his relative or HDFC Securities Ltd. or its associate does not have any material conflict of interest. Any holding in stock –No HDFC Securities Limited (HSL) is a SEBI Registered Research Analyst having registration no. INH000002475. Disclaimer: This report has been prepared by HDFC Securities Ltd and is meant for sole use by the recipient and not for circulation. The information and opinions contained herein have been compiled or arrived at, based upon information obtained in good faith from sources believed to be reliable. Such information has not been independently verified and no guaranty, representation of warranty, express or implied, is made as to its accuracy, completeness or correctness. All such information and opinions are subject to change without notice. This document is for information purposes only. Descriptions of any company or companies or their securities mentioned herein are not intended to be complete and this document is not, and should not be construed as an offer or solicitation of an offer, to buy or sell any securities or other financial instruments. This report is not directed to, or intended for display, downloading, printing, reproducing or for distribution to or use by, any person or entity who is a citizen or resident or located in any locality, state, country or other jurisdiction where such distribution, publication, reproduction, availability or use would be contrary to law or regulation or what would subject HSL or its affiliates to any registration or licensing requirement within such jurisdiction. If this report is inadvertently send or has reached any individual in such country, especially, USA, the same may be ignored and brought to the attention of the sender. This document may not be reproduced, distributed or published for any purposes without prior written approval of HSL. Foreign currencies denominated securities, wherever mentioned, are subject to exchange rate fluctuations, which could have an adverse effect on their value or price, or the income derived from them. In addition, investors in securities such as ADRs, the values of which are influenced by foreign currencies effectively assume currency risk. It should not be considered to be taken as an offer to sell or a solicitation to buy any security. HSL may from time to time solicit from, or perform broking, or other services for, any company mentioned in this mail and/or its attachments. HSL and its affiliated company(ies), their directors and employees may; (a) from time to time, have a long or short position in, and buy or sell the securities of the company(ies) mentioned herein or (b) be engaged in any other transaction involving such securities and earn brokerage or other compensation or act as a market maker in the financial instruments of the company(ies) discussed herein or act as an advisor or lender/borrower to such company(ies) or may have any other potential conflict of interests with respect to any recommendation and other related information and opinions. HSL, its directors, analysts or employees do not take any responsibility, financial or otherwise, of the losses or the damages sustained due to the investments made or any action taken on basis of this report, including but not restricted to, fluctuation in the prices of shares and bonds, changes in the currency rates, diminution in the NAVs, reduction in the dividend or income, etc. HSL and other group companies, its directors, associates, employees may have various positions in any of the stocks, securities and financial instruments dealt in the report, or may make sell or purchase or other deals in these securities from time to time or may deal in other securities of the companies / organizations described in this report. HSL or its associates might have managed or co-managed public offering of securities for the subject company or might have been mandated by the subject company for any other assignment in the past twelve months. HSL or its associates might have received any compensation from the companies mentioned in the report during the period preceding twelve months from t date of this report for services in respect of managing or co-managing public offerings, corporate finance, investment banking or merchant banking, brokerage services or other advisory service in a merger or specific transaction in the normal course of business. HSL or its analysts did not receive any compensation or other benefits from the companies mentioned in the report or third party in connection with preparation of the research report. Accordingly, neither HSL nor Research Analysts have any material conflict of interest at the time of publication of this report. Compensation of our Research Analysts is not based on any specific merchant banking, investment banking or brokerage service transactions. HSL may have issued other reports that are inconsistent with and reach different conclusion from the information presented in this report. Research entity has not been engaged in market making activity for the subject company. Research analyst has not served as an officer, director or employee of the subject company. We have not received any compensation/benefits from the subject company or third party in connection with the Research Report. HDFC securities Limited, I Think Techno Campus, Building - B, "Alpha", Office Floor 8, Near Kanjurmarg Station, Opp. Crompton Greaves, Kanjurmarg (East), Mumbai 400 042 Phone: (022) 3075 3400 Fax: (022) 2496 5066 Compliance Officer: Binkle R. Oza Email: [email protected] Phone: (022) 3045 3600 HDFC Securities Limited, SEBI Reg. No.: NSE-INB/F/E 231109431, BSE-INB/F 011109437, AMFI Reg. No. ARN: 13549, PFRDA Reg. No. POP: 04102015, IRDA Corporate Agent License No.: HDF 2806925/HDF C000222657, SEBI Research Analyst Reg. No.: INH000002475, CIN - U67120MH2000PLC152193 Mutual Funds Investments are subject to market risk. Please read the offer and scheme related documents carefully before investing.
HCL TECHNOLOGIES: COMPANY UPDATE
Page | 19
HDFC securities Institutional Equities Unit No. 1602, 16th Floor, Tower A, Peninsula Business Park, Senapati Bapat Marg, Lower Parel, Mumbai - 400 013 Board : +91-22-6171-7330 www.hdfcsec.com