Embed Size (px)
Citation preview

W H E N W O M E N T H R I V E ,B U S I N E S S E S T H R I V E
T H E W O R L D ’ S M O S T C O M P R E H E N S I V E R E S E A R C H O N W O M E N I N T H E W O R K P L A C E
L I N K I N G A C T I O N S T O R E S U LT S
H E A LT H W E A LT H C A R E E R

1
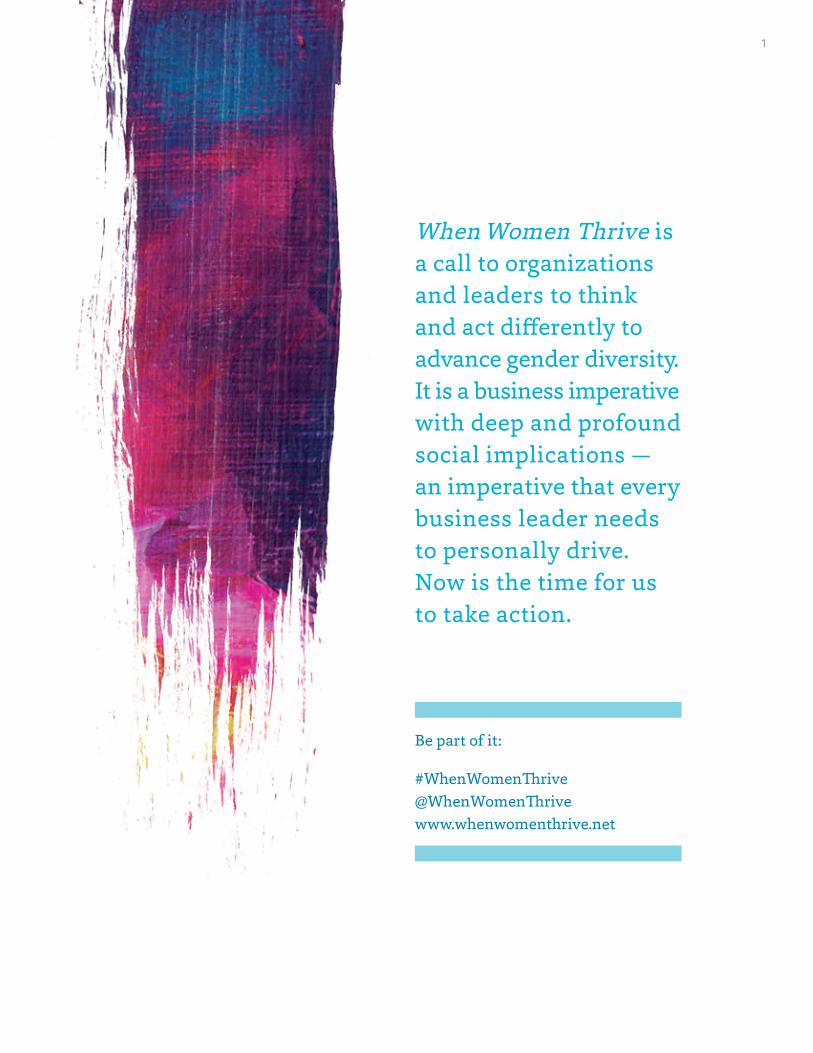
When Women Thrive is a call to organizations and leaders to think and act differently to advance gender diversity. It is a business imperative with deep and profound social implications — an imperative that every business leader needs to personally drive. Now is the time for us to take action.
Be part of it:
#WhenWomenThrive @WhenWomenThrivewww.whenwomenthrive.net
2 W H E N W O M E N T H R I V E , B U S I N E S S E S T H R I V E
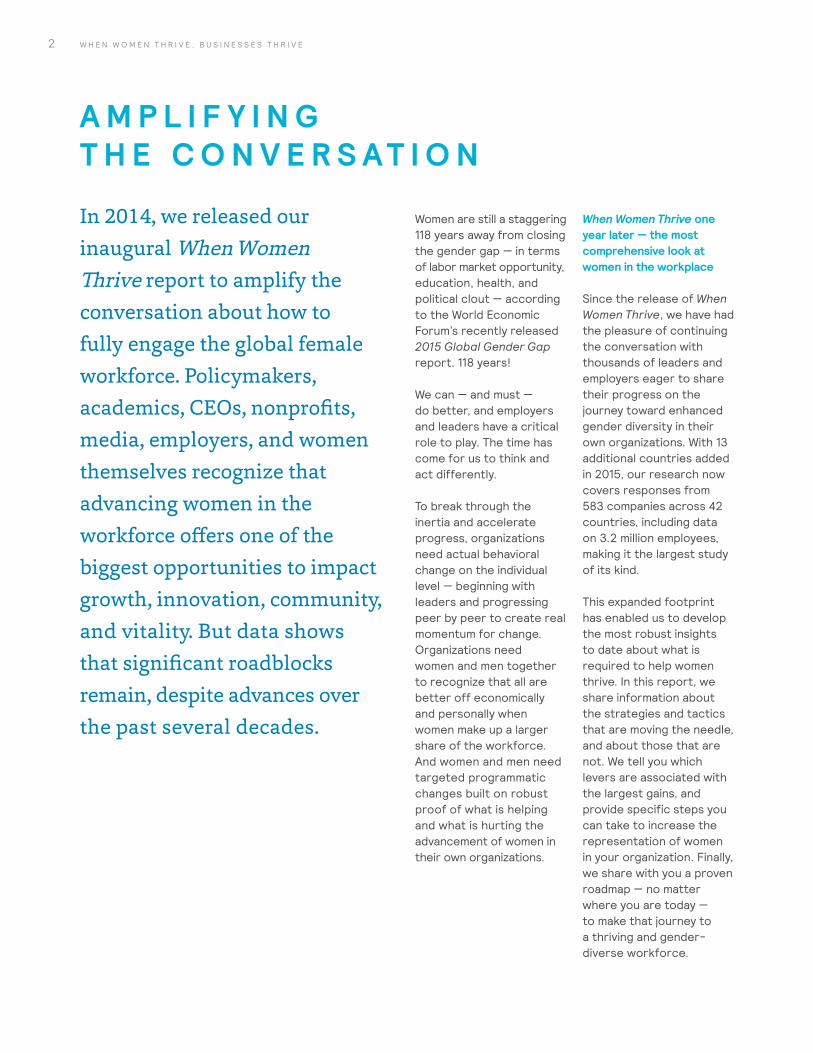
A M P L I F Y I N G T H E C O N V E R S AT I O N
In 2014, we released our inaugural When Women Thrive report to amplify the conversation about how to fully engage the global female workforce. Policymakers, academics, CEOs, nonprofits, media, employers, and women themselves recognize that advancing women in the workforce offers one of the biggest opportunities to impact growth, innovation, community, and vitality. But data shows that significant roadblocks remain, despite advances over the past several decades.
Women are still a staggering 118 years away from closing the gender gap — in terms of labor market opportunity, education, health, and political clout — according to the World Economic Forum’s recently released 2015 Global Gender Gap report. 118 years!
We can — and must — do better, and employers and leaders have a critical role to play. The time has come for us to think and act differently.
To break through the inertia and accelerate progress, organizations need actual behavioral change on the individual level — beginning with leaders and progressing peer by peer to create real momentum for change. Organizations need women and men together to recognize that all are better off economically and personally when women make up a larger share of the workforce. And women and men need targeted programmatic changes built on robust proof of what is helping and what is hurting the advancement of women in their own organizations.
When Women Thrive one year later — the most comprehensive look at women in the workplace
Since the release of When Women Thrive, we have had the pleasure of continuing the conversation with thousands of leaders and employers eager to share their progress on the journey toward enhanced gender diversity in their own organizations. With 13 additional countries added in 2015, our research now covers responses from 583 companies across 42 countries, including data on 3.2 million employees, making it the largest study of its kind.
This expanded footprint has enabled us to develop the most robust insights to date about what is required to help women thrive. In this report, we share information about the strategies and tactics that are moving the needle, and about those that are not. We tell you which levers are associated with the largest gains, and provide specific steps you can take to increase the representation of women in your organization. Finally, we share with you a proven roadmap — no matter where you are today — to make that journey to a thriving and gender-diverse workforce.
3E X E C U T I V E R E P O R T 2 0 1 6
Women are just one component of a thriving workforce
Our ultimate goal in sponsoring this work is broader than ensuring that women thrive — it is ensuring a thriving workforce that is diverse and inclusive of all populations. This is what drives innovation and growth in organizations and what drives the advancement of society.
We begin here with women because of the glaring and persistent gap in female workforce participation worldwide and the tremendous danger — and opportunity — this presents to companies and societies. But our approach to analyzing and addressing the drivers of female participation can and should be used to maximize the engagement and productivity of all diverse segments of the workforce.
Thank you to all our participating organizations
We are very grateful to all the organizations that contributed their data and insights to inform When Women Thrive. Our goal now is to further focus the tremendous interest and commitment generated over the past year into an ongoing dialogue among stakeholders that accelerates our progress toward sustained gender diversity in the workforce. Over the course of this multiyear journey, we will continue to track progress across this community and refine our recommendations as needed.
We invite you to join us in seizing this moment. Only by engaging the full talents of both women and men can we expect to keep our organizations and our societies growing.
PATRICIA A. MILLIGANGlobal Leader of When Women Thrive and Multinational Client Group, Mercer
I N T E R N A L R E S O U R C E G R O U P S A S D R I V E R S O F C H A N G E A N D O F T H E B U S I N E S S
When Women Thrive was established by our internal Women@Mercer business resource group, which was set up more than 10 years ago and consists of more than 50 local chapters across Mercer’s offices and regions. Women@Mercer strategically advises and empowers our efforts to recruit, develop, retain, and advance female talent to the benefit of our clients and our own organizational performance — a people and business imperative.
4 W H E N W O M E N T H R I V E , B U S I N E S S E S T H R I V E
C O N T E N T S
5E X E C U T I V E R E P O R T 2 0 1 6
A B O U T T H I S S T U D Y
S E C T I O N 1 : T H R I V I N G O R N O T ?
S E C T I O N 3 : W H E N W I L L W O M E N T H R I V E ?
P R O G R E S S A N D O P P O R T U N I T I E S B Y R E G I O N
A P P E N D I X
E X E C U T I V E S U M M A R Y
S E C T I O N 2 : K E Y F I N D I N G S A N D P U T T I N G
T H E 6 P ’ S I N T O A C T I O N
S E C T I O N 4 : A C C E L E R A T I N G Y O U R
J O U R N E Y T O A T H R I V I N G W O R K F O R C E
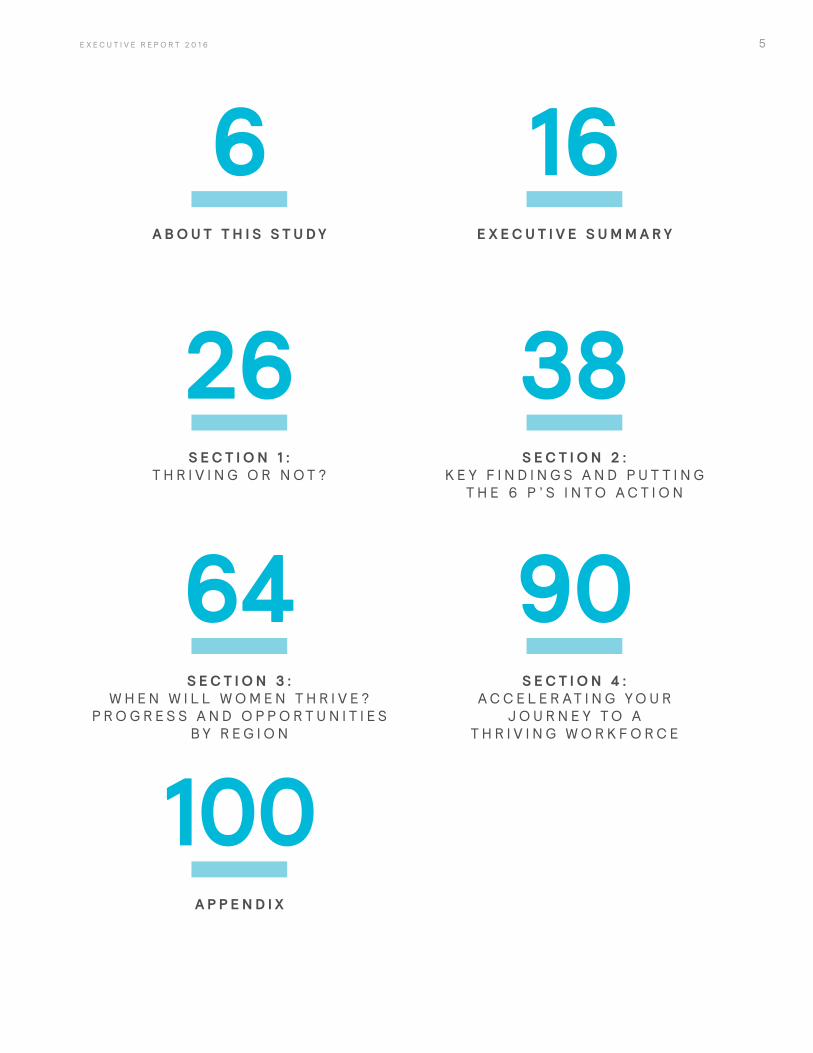
6
26
64
100
16
38
90
6 W H E N W O M E N T H R I V E , B U S I N E S S E S T H R I V E
A B O U T T H I S S T U D Y
7E X E C U T I V E R E P O R T 2 0 1 6
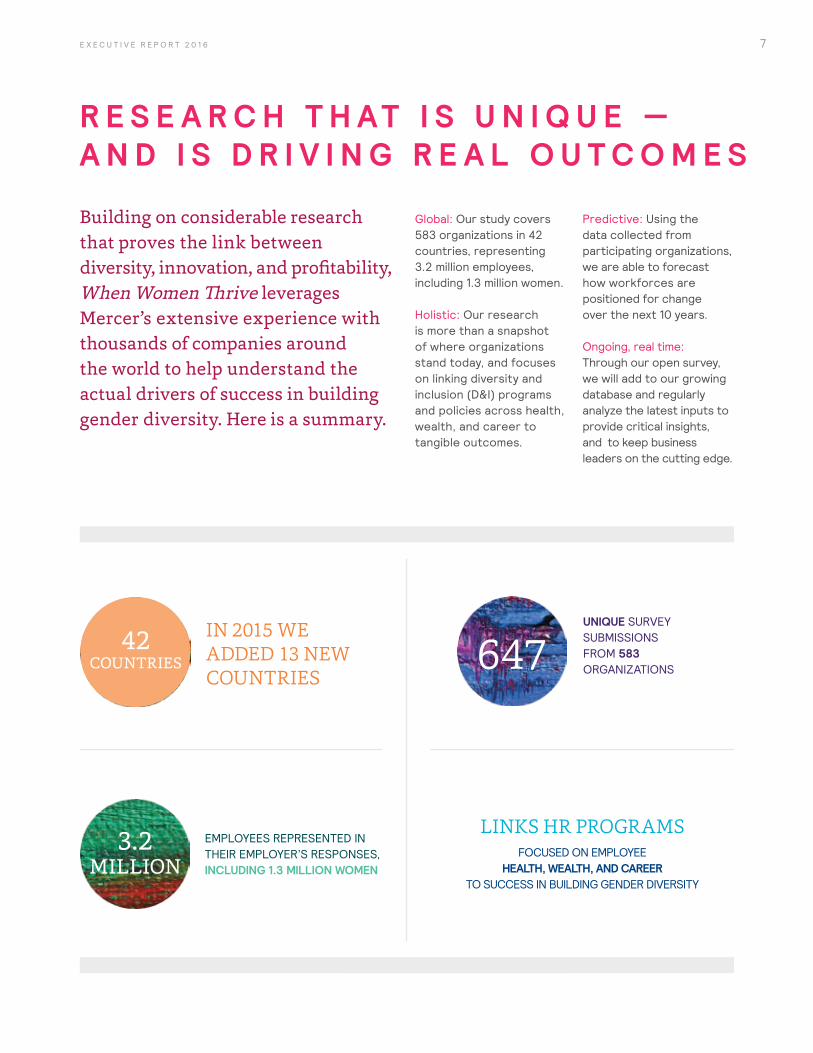
R E S E A R C H T H AT I S U N I Q U E — A N D I S D R I V I N G R E A L O U T C O M E S
Building on considerable research that proves the link between diversity, innovation, and profitability, When Women Thrive leverages Mercer’s extensive experience with thousands of companies around the world to help understand the actual drivers of success in building gender diversity. Here is a summary.
Global: Our study covers 583 organizations in 42 countries, representing 3.2 million employees, including 1.3 million women.
Holistic: Our research is more than a snapshot of where organizations stand today, and focuses on linking diversity and inclusion (D&I) programs and policies across health, wealth, and career to tangible outcomes.
Predictive: Using the data collected from participating organizations, we are able to forecast how workforces are positioned for change over the next 10 years.
Ongoing, real time: Through our open survey, we will add to our growing database and regularly analyze the latest inputs to provide critical insights, and to keep business leaders on the cutting edge.
IN 2015 WE ADDED 13 NEW COUNTRIES
EMPLOYEES REPRESENTED IN THEIR EMPLOYER’S RESPONSES, INCLUDING 1.3 MILLION WOMEN
LINKS HR PROGRAMS FOCUSED ON EMPLOYEE
HEALTH, WEALTH, AND CAREER TO SUCCESS IN BUILDING GENDER DIVERSITY
UNIQUE SURVEY SUBMISSIONS FROM 583 ORGANIZATIONS647
3.2 MILLION
42 COUNTRIES
8 W H E N W O M E N T H R I V E , B U S I N E S S E S T H R I V E
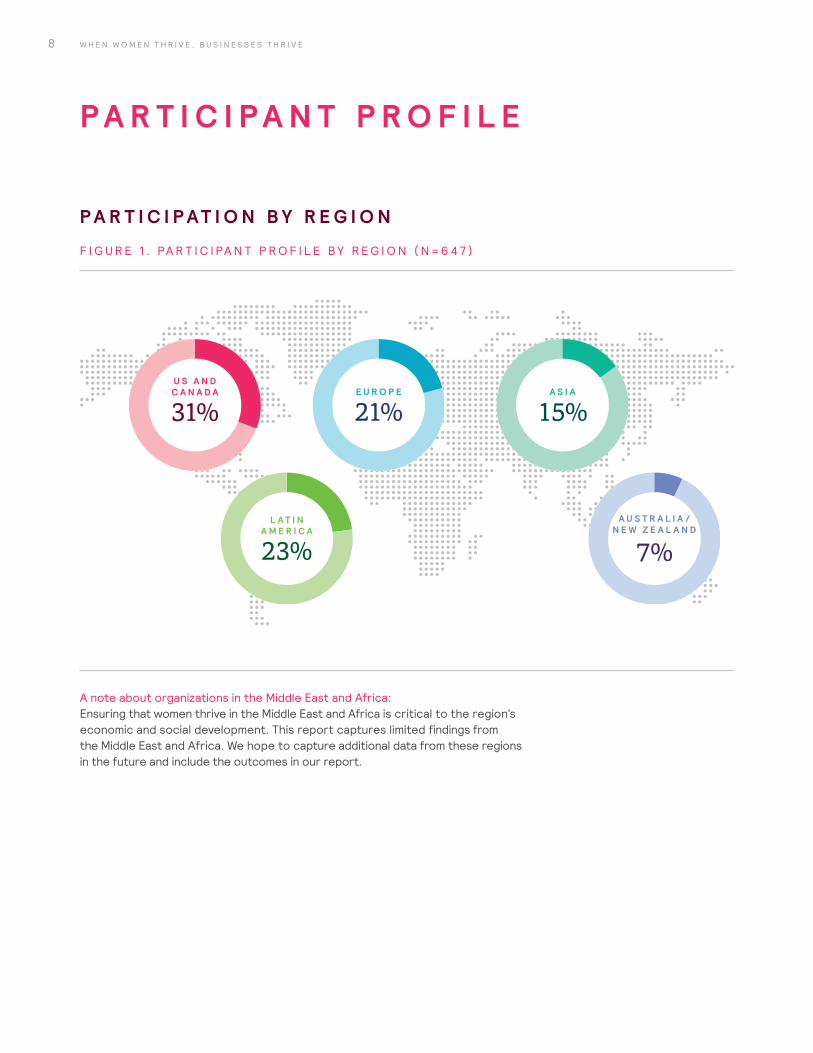
P A R T I C I P A N T P R O F I L E
A U S T R A L I A /N E W Z E A L A N D
7%
A S I A
15%
L A T I NA M E R I C A
23%
U S A N DC A N A D A
31%E U R O P E
21%
P A R T I C I P A T I O N B Y R E G I O N
F I G U R E 1 . PA R T I C I PA N T P R O F I L E B Y R E G I O N ( N = 6 4 7 )
A note about organizations in the Middle East and Africa: Ensuring that women thrive in the Middle East and Africa is critical to the region’s economic and social development. This report captures limited findings from the Middle East and Africa. We hope to capture additional data from these regions in the future and include the outcomes in our report.

9E X E C U T I V E R E P O R T 2 0 1 6
P A R T I C I P A T I O N B Y I N D U S T R Y
F I G U R E 2 . PA R T I C I PAT I O N B Y I N D U S T R Y ( N = 6 4 7 )
P R O D U C T S /M A N U FA C T U R I N G
31%
11%
F I N A N C E / B A N K I N G
S E R V I C E S
24%
8%
E N E R G Y
I N F O R M AT I O N A N D T E C H N O L O G Y
11%
15%
O T H E R

10 W H E N W O M E N T H R I V E , B U S I N E S S E S T H R I V E
20% 1,000–4,99915%
100–999
6%
Less than 100
23% 10,000–49,000
9% 50,000–99,000 13%
100,000 or more
5% No response
9% 5,000–9,999
P A R T I C I P AT I O N B Y G L O B A L E M P L O Y E E H E A D C O U N T S I Z E
F I G U R E 3 . D I S T R I B U T I O N B Y H E A D C O U N T S I Z E ( N = 6 4 7 )
P A R T I C I P A T I O N B Y T O T A L R E V E N U E S I Z E
F I G U R E 4 . D I S T R I B U T I O N B Y R E V E N U E S I Z E ( G L O B A L LY ) ( N = 6 4 7 )
18%
$100 million < $500 million
21%
Less than $100 million
6%No response
19%
$500 million< $2.5 billion
$10 billion or more
18%
18% $2.5 billion
< $10 billion
11E X E C U T I V E R E P O R T 2 0 1 6
P A R T I C I P AT I N G O R G A N I Z AT I O N S
• 36 South Capital Advisors LLP• 3M• Aberdeen Asset Management• Acando• Accor• Adidas Group• AECOM-INOCSA• Airbus Helicopters• Alcon• Alliance One International• Alstom• Amadeus• AMD• American Express• Amgen• Amica Mutual Insurance• Amil• Amundi• Andersen Tax• Apotex• Arcos Dourados Comercio de
Alimentos • Armaggan• Arriva• Arrow Electronics• Assicurazioni Generali• AstraZeneca• AT&T• Atkins• Atla Consultoria• Australia and New Zealand Banking
Group (ANZ)• Avaya Argentina SRL• Avery Dennison• Avon• AXA• B. Braun Medical Devices • Bakhtar Development Network
Global (BDN Global)• Banco Hipotecario• Bancompartir
• BASF• Bayer• BC Assessment• Beaulieu ASIA• Beijing Kerry Property
Development• Belatrix Software• Belgacom• Bell• Bematech• Bepensa• Best Buy• Blue Shield of California• BNP Paribas• Bose• Bouygues • British Petroleum• Brown-Forman Corporation• Brownells• Bruker Corporation• BT• Bunge• CA Technologies• California Institute of Technology• Canadian Nuclear Laboratories• Canadian Oil Sands • Canexus Corporation• CAPA International Education• Capgemini• Capital Group• Capital One• Carvajal Educación• Caterpillar • Celgene• Cementos Progreso• CEMEX • Central 1 Credit Union• CEPM• CEVA Logistics• CGG• CH2M
• Charles Schwab• Cineplex Inc.• City of Olathe, Kansas• City of Yarra• Civeo • Clayton Utz• Club Assist• Coca-Cola • Colgate Palmolive• College of Lake County• COM DEV International • Compass Group• Compass Metrics• ConAgra Foods• Constant Contact• Construtora Andrade Gutierrez• Continental• Copersucar• Crawford & Company• Credit Union Central of Manitoba• Crescent Point Energy• Crown Worldwide Holdings • CSIRO• CSL Behring• CUNA Mutual Group• Danone Nutricia Early Life Nutrition• Decathlon• Dedham Public Schools• Del Monte Fresh Produce• DENSO• Deutsche Bank• Devon Energy• Dixon Hughes Goodman • DNP Property Management • Durham University• Eastman Chemical Company• Eaton• Eczacibasi Group• Edebé Group• Educational Testing Service
12 W H E N W O M E N T H R I V E , B U S I N E S S E S T H R I V E
• Eletros • Embassy of Australia• Embraer• Emeco International• Emerson • Empresas Polar• Enbridge• Energias de Portugal• Eneva• Equión Energía• Ernst & Young• Erste Group• ERT• European Investment Bank• EVRAZ• Falabella• Federal Mogul• Fidelity International Limited• First American Financial• First State Super• Forrester Research• Fresenius Medical Care • Fujitsu• GEBALIS • Georgia Institute of Technology• Giesecke & Devrient• Glasgow Caledonian University• Gleason• Goldcorp • Grace• Graphic Packaging International• Groupe SEB• Grupo Clarín • Grupo Omnilife-Chivas• Guangzhou Nanxin Pharmacy • H&M Retail• Halliburton• Henkel • Herbalife• Hercules Offshore• Hershey
• Hewlett-Packard• HomeServe• Honeywell• Hopewell Group of Companies• Hoteles City Express• HSBC• Humana• Hydro Ottawa• ICA• ICL Group• IFA Celtics• IHS• Indra• Information Services Corporation• Infraestruturas de Portugal• ING Direct• Ingersoll Rand• Ingram Industries Inc.• Interceramic• International Flavors & Fragrances• International Personal Finance• Intesa Sanpaolo• IPM Informed Portfolio
Management • Jack in the Box • Jacobs• John Howard Society of Ontario• John Lewis Partnership• Johnson & Johnson Switzerland• Johnson Controls• Johnson Electric• Johnson Matthey• JTEKT Corporation• K+S Potash Canada• Kimberly-Clark• Kinross Gold Corporation• Klohn Crippen Berger• KPMG• Kroll• Lancaster University• LandCorp
• Lantmännen Unibake• Laurentian Bank• LCJ Investments • Leighton Holdings• Lendlease• Level 3• Lexmark• Lindorff Group• Logicalis Inc.• L’Oréal • Lowe’s• Lufthansa Group• Macquarie Group• Mahle• Maison Délice• Manulife Financial• Maple Reinders Group• Marathon Oil Company• Marsh• Marsh & McLennan Companies• Massachusetts Technology
Corporation• MassMutual• MasterCard• Materialise • McCain Foods• Mead Johnson Nutrition • Media Capital Grupo• Medtronic• MEG Energy• Mercedes-Benz • Mercer• Merck & Company• Merrick & Company• MetLife• Mexichem • Molinos• Monsanto• Motorola Solutions• Motta Internacional• Mundicenter
13E X E C U T I V E R E P O R T 2 0 1 6
• NASDAQ • National Bank of Canada• National Democratic Institute for
International Affairs• Natura Cosméticos• NCM• Nestlé• Nexteer Automotive• Nice • Nielsen• Nissan• Nomura• Northwestern Mutual• Nutrisa• Oliver Wyman• ON Semiconductor• Opain S.A.• Oxfam• PACCAR • Pacific Gas and Electric Company• Pacific Life Insurance• Pan American Silver• Panalpina• Panasonic • Pentair Valves & Controls • PepsiCo• Pernod Ricard• Perrigo• Petrobras • PI (Physik Instrumente)• Piper Alderman• PJM Interconnection• Plaza Logística• Portugal Telecom• Portunus Corporate Advisory• PPG Industries• PricewaterhouseCoopers• Principal Financial Group• Privalia• Proeza• Prologis
• ProMéxico• Proximus• PVH• QIC• Québecor Média • Raytheon• Reckitt Benckiser • Reinsurance Group of America• Reliance Home Comfort• Resolute Energy Corporation• Rexam BCSA • Robert Bosch • Roche• Royal Bank of Canada• Ruizhi Petro Services• Ryan Companies • Sage• SAICA• San Miguel Global• Sandvik• Sanofi• SAP• SCA Group• Schneider Electric• Schneider National• Schroder Investment Management
Australia• Serco • Siemens• Simplot• SKF• Smartmatic• Smiths Medical• Solar Turbines• Solvay• Sonae• SPDAD, Unipessoal (Decathlon
Portugal)• SPX Corporation• State Street Corporation• State Super Financial Services
• Steck Indústria Elétrica • SteelBridge Solutions• Stinger Ghaffarian Technologies• Strauss Group• SunGard• SunTrust Banks• Superior Propane• Swiss Re• Symantec Corporation• TAM S.A.• TAQA Bratani • TasNetworks • TC Transcontinental• TE Connectivity• TechMahindra• Telstra• Tenaris Andean• TenarisTamsa• Tenzing• Tetra Pak• Thai Central Chemical • The Calgary Airport Authority (YYC)• The Canadian Real Estate
Association• The Canterbury Community Trust• The Phoenix Group• The Rockport Company• Tieto• Time Warner Cable• TNT Express Worldwide• TUH• UBS• UCB• Union Gas • United Breweries Limited• United Launch Alliance• United Rentals• United Super (Cbus)• UnitedHealth Group• Unitywater• University of Hull
14 W H E N W O M E N T H R I V E , B U S I N E S S E S T H R I V E
A note about organizations: Organizations listed have agreed to be named in the study. This is not a comprehensive list of all participants, as some have indicated they did not want their names published.
• University of Leeds • University of Liverpool• University of Ottawa• University of Wales
Trinity Saint David• URS Corporation• Vancouver Foundation• Vermilion Energy • Veyance Technologies• Victoria University• Virgin Australia
• VLI Logistica• Vodafone • Volaris• Walmart • Washington Trust Bank• Waters• Weir Minerals• Wesfarmers Chemicals,
Energy & Fertilisers• West Corporation• Wheaton Franciscan Healthcare
• William Blair• Wipfli LLP• Workday• World Resources Institute• Wrigley • Xerox• Xylem• Zinfra Group
15E X E C U T I V E R E P O R T 2 0 1 6
M E T H O D O L O G Y
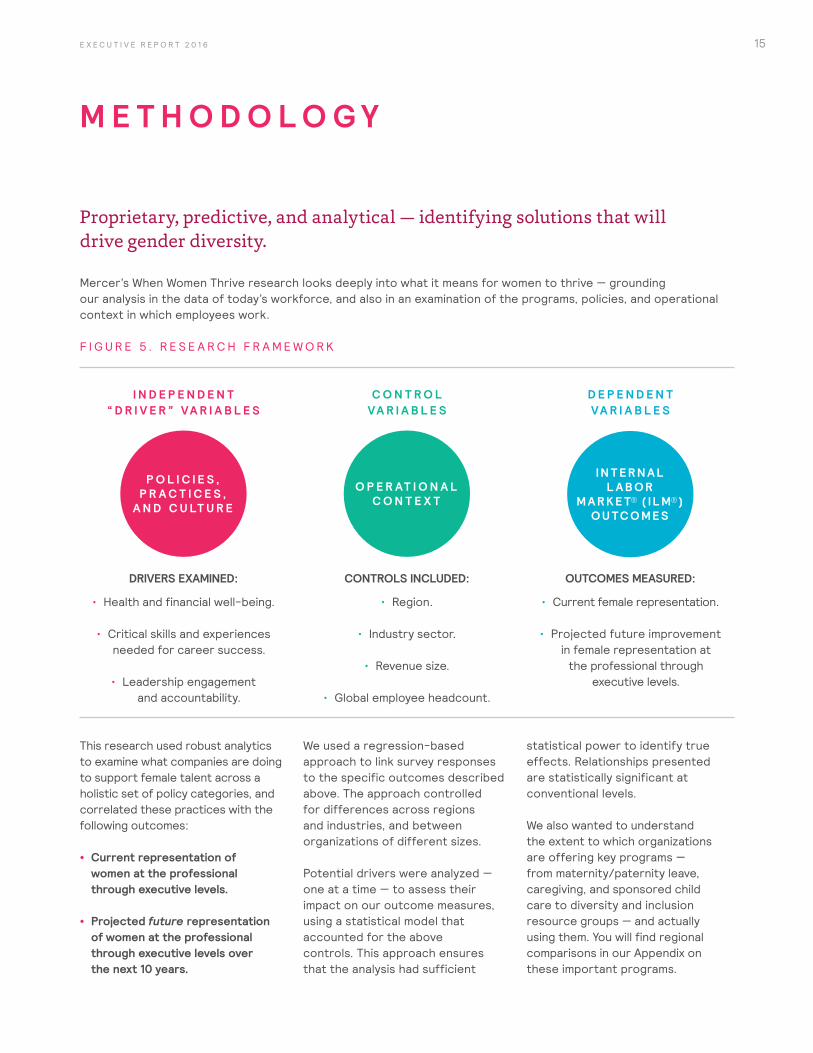
This research used robust analytics to examine what companies are doing to support female talent across a holistic set of policy categories, and correlated these practices with the following outcomes:
• Current representation of women at the professional through executive levels.
• Projected future representation of women at the professional through executive levels over the next 10 years.
We used a regression-based approach to link survey responses to the specific outcomes described above. The approach controlled for differences across regions and industries, and between organizations of different sizes.
Potential drivers were analyzed — one at a time — to assess their impact on our outcome measures, using a statistical model that accounted for the above controls. This approach ensures that the analysis had sufficient
statistical power to identify true effects. Relationships presented are statistically significant at conventional levels.
We also wanted to understand the extent to which organizations are offering key programs — from maternity/paternity leave, caregiving, and sponsored child care to diversity and inclusion resource groups — and actually using them. You will find regional comparisons in our Appendix on these important programs.
P O L I C I E S , P R A C T I C E S ,
A N D C U LT U R E
O P E R AT I O N A L C O N T E X T
I N T E R N A L L A B O R
M A R K E T® ( I L M® ) O U TC O M E S
I N D E P E N D E N T “ D R I V E R ” VA R I A B L E S
DRIVERS EXAMINED:
• Health and financial well-being.
• Critical skills and experiences needed for career success.
• Leadership engagement and accountability.
CONTROLS INCLUDED:
• Region.
• Industry sector.
• Revenue size.
• Global employee headcount.
OUTCOMES MEASURED:
• Current female representation.
• Projected future improvement in female representation at
the professional through executive levels.
C O N T R O L VA R I A B L E S
D E P E N D E N T VA R I A B L E S
Proprietary, predictive, and analytical — identifying solutions that will drive gender diversity. Mercer’s When Women Thrive research looks deeply into what it means for women to thrive — grounding our analysis in the data of today’s workforce, and also in an examination of the programs, policies, and operational context in which employees work.
F I G U R E 5 . R E S E A R C H F R A M E W O R K
16 W H E N W O M E N T H R I V E , B U S I N E S S E S T H R I V E
E X E C U T I V E S U M M A R Y
17E X E C U T I V E R E P O R T 2 0 1 6
T H I S I S A G L O B A L E C O N O M I C I M P E R AT I V E W I T H D E E P S O C I A L I M P L I C AT I O N S
• Today, there is no region thatremains uncommitted to improvinggender equality. Indeed, there areprofound implications for women,their economies, their companies,even their families.
• What we’re doing now isradically changing the trajectory —addressing the deep-rooted inertiathat has held organizations andleaders back from real progresson gender diversity.
• Studying and talking alone won’tlead to change.
• Our research shows that thereare strategies waiting for you. Withthis report, we give you the actionsto take today to become thecompany you want to be tomorrow.
K E Y F I N D I N G S
W O M E N C O N T I N U E T O B E U N D E R R E P R E S E N T E D I N T H E W O R K F O R C E AT A L L C A R E E R L E V E L S
• Women make up only 35%of the average company’sworkforce at the professionallevel and above.
• Female representationdeclines as career levelrises. Globally, women makeup 33% of managers, 26% ofsenior managers, and only20% of executives.
• There is an increased focus onhiring and promoting womeninto executive ranks, seeminglydriven by regulation andheightened media attention.
O R G A N I Z AT I O N S A R E FA I L I N G T O B U I L D F U T U R E F E M A L E TA L E N T P I P E L I N E S
• Current female hiring,promotion, and retention areinsufficient to create genderequality over the next decade.
• Improvements in hiring atthe highest levels of theorganization are not extendingto lower levels.
• The progress made over our2014 data does not appearto be the result of systemicimprovements in goodpractices that will supportlong-term success. Instead, itseems to result from ad hocactions, such as increasedhiring at the top.
Tel l our s tory but reference and connect to the s tudy - recent s tudy found that . .- in our work we see the same issues
ThemesOngoing f indings that whi le we are making progress there i s s t i l l work to be done.
p20-21
18 W H E N W O M E N T H R I V E , B U S I N E S S E S T H R I V E
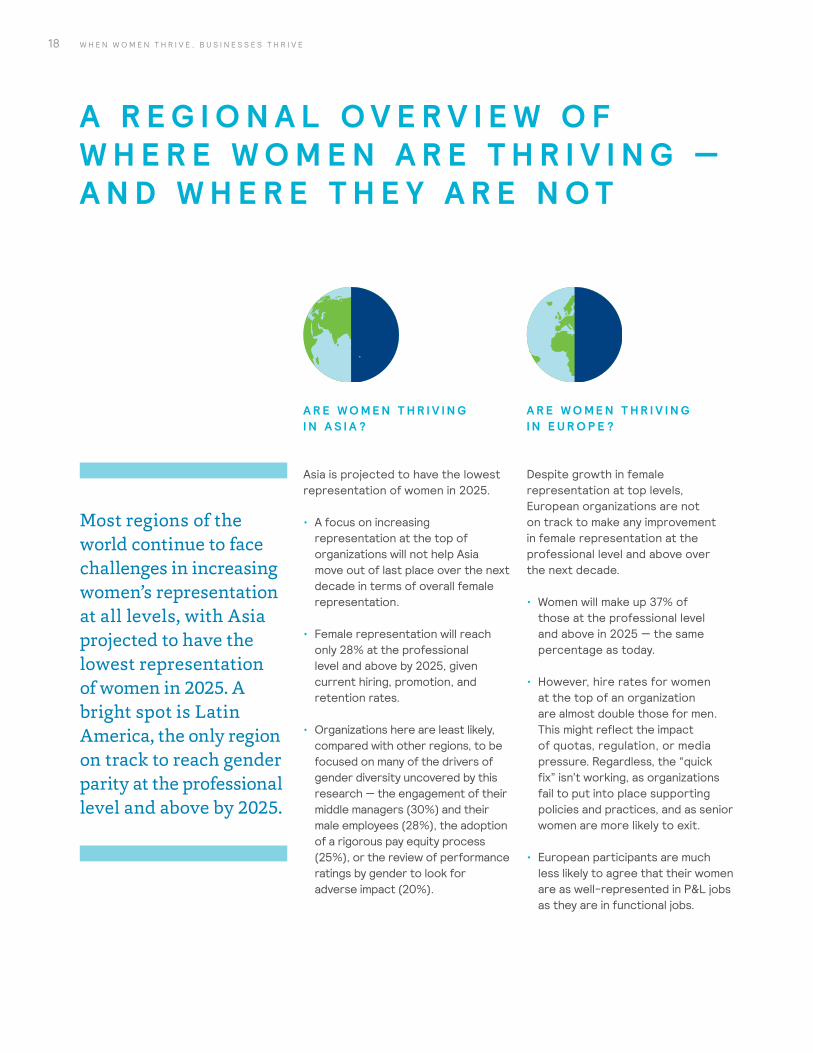
A R E G I O N A L O V E R V I E W O F W H E R E W O M E N A R E T H R I V I N G — A N D W H E R E T H E Y A R E N O T
A R E W O M E N T H R I V I N G I N A S I A ?
Asia is projected to have the lowest representation of women in 2025.
• A focus on increasing representation at the top of organizations will not help Asia move out of last place over the next decade in terms of overall female representation.
• Female representation will reach only 28% at the professional level and above by 2025, given current hiring, promotion, and retention rates.
• Organizations here are least likely, compared with other regions, to be focused on many of the drivers of gender diversity uncovered by this research — the engagement of their middle managers (30%) and their male employees (28%), the adoption of a rigorous pay equity process (25%), or the review of performance ratings by gender to look for adverse impact (20%).
A R E W O M E N T H R I V I N G I N E U R O P E ?
Despite growth in female representation at top levels, European organizations are not on track to make any improvement in female representation at the professional level and above over the next decade.
• Women will make up 37% of those at the professional level and above in 2025 — the same percentage as today.
• However, hire rates for women at the top of an organization are almost double those for men. This might reflect the impact of quotas, regulation, or media pressure. Regardless, the “quick fix” isn’t working, as organizations fail to put into place supporting policies and practices, and as senior women are more likely to exit.
• European participants are much less likely to agree that their women are as well-represented in P&L jobs as they are in functional jobs.
Most regions of the world continue to face challenges in increasing women’s representation at all levels, with Asia projected to have the lowest representation of women in 2025. A bright spot is Latin America, the only region on track to reach gender parity at the professional level and above by 2025.
19E X E C U T I V E R E P O R T 2 0 1 6
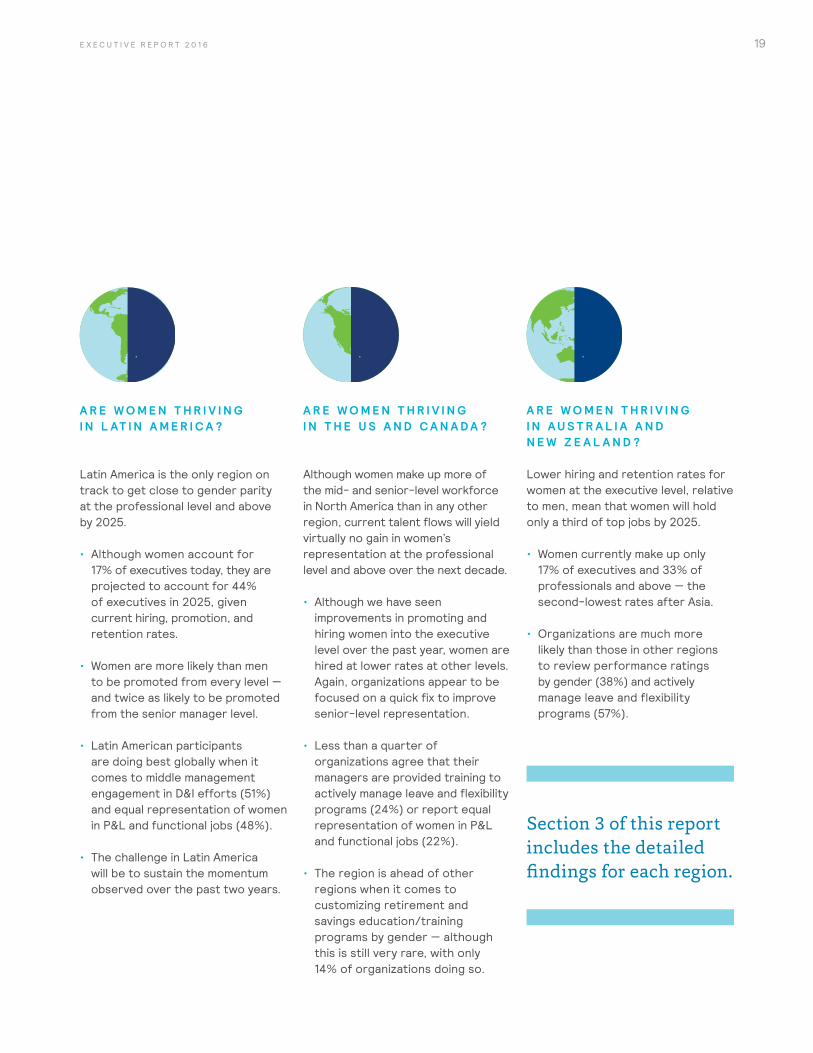
A R E W O M E N T H R I V I N G I N L AT I N A M E R I C A ?
Latin America is the only region on track to get close to gender parity at the professional level and above by 2025.
• Although women account for 17% of executives today, they are projected to account for 44% of executives in 2025, given current hiring, promotion, and retention rates.
• Women are more likely than men to be promoted from every level — and twice as likely to be promoted from the senior manager level.
• Latin American participants are doing best globally when it comes to middle management engagement in D&I efforts (51%) and equal representation of women in P&L and functional jobs (48%).
• The challenge in Latin America will be to sustain the momentum observed over the past two years.
A R E W O M E N T H R I V I N G I N T H E U S A N D C A N A D A ?
Although women make up more of the mid- and senior-level workforce in North America than in any other region, current talent flows will yield virtually no gain in women’s representation at the professional level and above over the next decade.
• Although we have seen improvements in promoting and hiring women into the executive level over the past year, women are hired at lower rates at other levels. Again, organizations appear to be focused on a quick fix to improve senior-level representation.
• Less than a quarter of organizations agree that their managers are provided training to actively manage leave and flexibility programs (24%) or report equal representation of women in P&L and functional jobs (22%).
• The region is ahead of other regions when it comes to customizing retirement and savings education/training programs by gender — although this is still very rare, with only 14% of organizations doing so.
A R E W O M E N T H R I V I N G I N A U S T R A L I A A N D N E W Z E A L A N D ?
Lower hiring and retention rates for women at the executive level, relative to men, mean that women will hold only a third of top jobs by 2025.
• Women currently make up only 17% of executives and 33% of professionals and above — the second-lowest rates after Asia.
• Organizations are much more likely than those in other regions to review performance ratings by gender (38%) and actively manage leave and flexibility programs (57%).
Section 3 of this report includes the detailed findings for each region.
20 W H E N W O M E N T H R I V E , B U S I N E S S E S T H R I V E
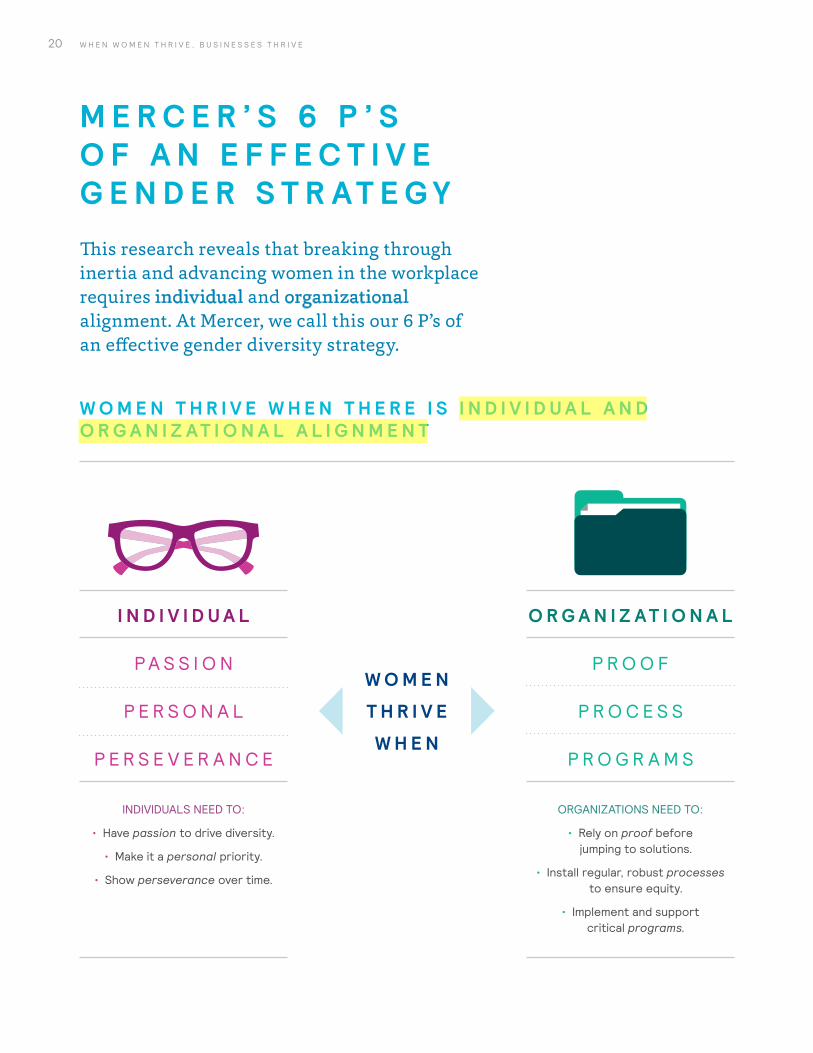
M E R C E R ’ S 6 P ’ S O F A N E F F E C T I V E G E N D E R S T R AT E G Y
P A S S I O N
P E R S O N A L
P E R S E V E R A N C E
P R O O F
O R G A N I Z A T I O N A LI N D I V I D U A L
P R O C E S S
P R O G R A M S
W O M E N
T H R I V E
W H E N
This research reveals that breaking through inertia and advancing women in the workplace requires individual and organizational alignment. At Mercer, we call this our 6 P’s of an effective gender diversity strategy.
W O M E N T H R I V E W H E N T H E R E I S I N D I V I D U A L A N D O R G A N I Z A T I O N A L A L I G N M E N T
ORGANIZATIONS NEED TO:
• Rely on proof before jumping to solutions.
• Install regular, robust processes to ensure equity.
• Implement and support critical programs.
INDIVIDUALS NEED TO:
• Have passion to drive diversity.
• Make it a personal priority.
• Show perseverance over time.
21E X E C U T I V E R E P O R T 2 0 1 6
P A S S I O N AT E L E A D E R S H I P
W O M E N T H R I V E W H E N L E A D E R S AT A L L L E V E L S A R E PA S S I O N AT E LY E N G A G E D
Only 52% of organizations believe their board members are engaged in D&I initiatives, and just 39% agree their middle managers are engaged.
• Organizations with leaders who are actively engaged in D&I have more women at the top, and they hire, promote, and retain women at higher rates relative to men.
• Our experience shows that it is not enough for leaders to mandate change — they must personally drive change through communication and exemplary behavior.
P E R S O N A L C O M M I T M E N T
W O M E N T H R I V E W H E N M E N A R E E N G A G E D — A N D S E E G E N D E R D I V E R S I T Y A S A W I N - W I N
Men today are not perceived to be strongly engaged in gender diversity efforts — only 38% of organizations say their male employees are engaged in D&I activities.
• Organizations in which men are actively driving D&I efforts have made more progress on improving gender diversity than those in which men are not engaged.
• Greater gender equity can improve family economics and afford greater opportunities and flexibility to both men and women.
• Incentives for executives to achieve goals are insufficient to drive progress. Executives need to be deeply committed to success.
22 W H E N W O M E N T H R I V E , B U S I N E S S E S T H R I V E
P E R S E V E R A N C E
W O M E N T H R I V E W H E N T H E F O C U S I S B R O A D E R T H A N A C Q U I R I N G D I V E R S E TA L E N T AT T H E T O P
Organizations are not making progress in building their future female talent pipelines.
• Though our data show a recent improvement in hire rates for women relative to men at senior levels, in most regions, men continue to be hired into and promoted from midlevel positions at higher rates than women. And women in senior levels are more likely than men to leave an organization.
• Although focus at the top is necessary given that women today hold only 20% of executive-level positions, the failure to focus further down the pipeline means that women will still represent only 40% of the workforce at the professional level and above by 2025. Organizations need to focus on systemic, supporting practices to build the female talent pipeline that will sustain gender equality in the long term.
23E X E C U T I V E R E P O R T 2 0 1 6
• When both men and women use leave programs, organizations exhibit higher female representation.
• Only 29% of organizations say they give their managers training so they can effectively support employees through the maternity/paternity leave and return-to-work processes — and effectively counter any unconscious bias in rewards and promotion decisions that might be triggered by leave.
P R O O F O F W H A T I S H E L P I N G A N D W H A T I S H U R T I N G
W O M E N T H R I V E W H E N L E AV E A N D F L E X I B I L I T Y P R O G R A M S A R E A C T I V E LY M A N A G E D
Leave and flexibility programs can either help or hurt gender diversity, depending on who uses them and how well they are managed.
Our research finds that women have different and unique skills relative to men — skills that are considered critical to career success.
W O M E N T H R I V E W H E N T H E I R U N I Q U E C O M P E T E N C I E S A R E L E V E R A G E D I N H I G H B U S I N E S S - I M PA C T R O L E S
• Traditional job design and valuation leave business growth potential untapped, as leadership competencies are often more closely aligned with the relative strengths of men. Competencies should be updated to reflect what companies need in order to be successful in a changing economy.
24 W H E N W O M E N T H R I V E , B U S I N E S S E S T H R I V E
P R O C E S S E S T H A T A C T I V E LY S U P P O R T W O M E N
W O M E N T H R I V E W H E N T H E R E I S A D I L I G E N T PAY E Q U I T Y P R O C E S S
W O M E N T H R I V E W H E N P R O M O T I O N A N D P E R F O R M A N C E M A N A G E M E N T P R O C E S S E S I N C L U D E A G E N D E R L E N S
Less than 30% of organizations routinely review performance ratings by gender to check for disparities that translate into differences in opportunities for men and women.
Only 35% of organizations report a pay equity analysis process built on a robust statistical approach.
• Organizations with a robust pay equity process and a dedicated team have greater female representation.
• Organizations should build processes that rely on pay data and statistical analysis.
• Formal remediation protocols to address identified pay equity risks should be part of the process.
• Progress on gender diversity requires regular focus on equity in performance evaluation and advancement opportunity.
• Organizations that apply a gender lens to promotion and performance management processes have greater female representation.
• Ensuring systemic focus on equity in performance evaluation and advancement opportunities is the responsibility of both HR and business functions.
25E X E C U T I V E R E P O R T 2 0 1 6
1 Nasdaq. “Men vs. Women: Risk Aversion,” 2013, available at http://www.nasdaq.com/article/men-vs-women-risk-aversion-cm297364.
P R O G R A M S T H A T S U P P O R T W O M E N ’ S U N I Q U E N E E D S
W O M E N T H R I V E W H E N T H E I R U N I Q U E H E A LT H N E E D S A R E S U P P O R T E D
W O M E N T H R I V E W H E N T H E I R U N I Q U E F I N A N C I A L N E E D S A R E S U P P O R T E D
• Women have a unique relationship with health care — as patients, caretakers, and decision-makers — but only 45% of organizations agree that supporting this unique relationship is important in attracting and retaining female talent.
• Only 22% of organizations conduct analyses to identify gender-specific health needs and education.
• Women face a “perfect storm” financially, because they tend to work in lower-paid employment than men, have more significant gaps in service, and live longer than men, so they need retirement funds to last longer. On top of that, women are more risk-averse investors,1 impacting overall returns.
• Less than 10% of organizations offer retirement programs customized for the behaviors and needs of different genders, or monitor savings and investment choices by gender.
Female representation increases when organizations understand and support women’s unique health needs.
Gender-specific financial wellness practices drive better future representation of women.
26 W H E N W O M E N T H R I V E , B U S I N E S S E S T H R I V E
S E C T I O N 1 : T H R I V I N G O R N O T ?
27E X E C U T I V E R E P O R T 2 0 1 6
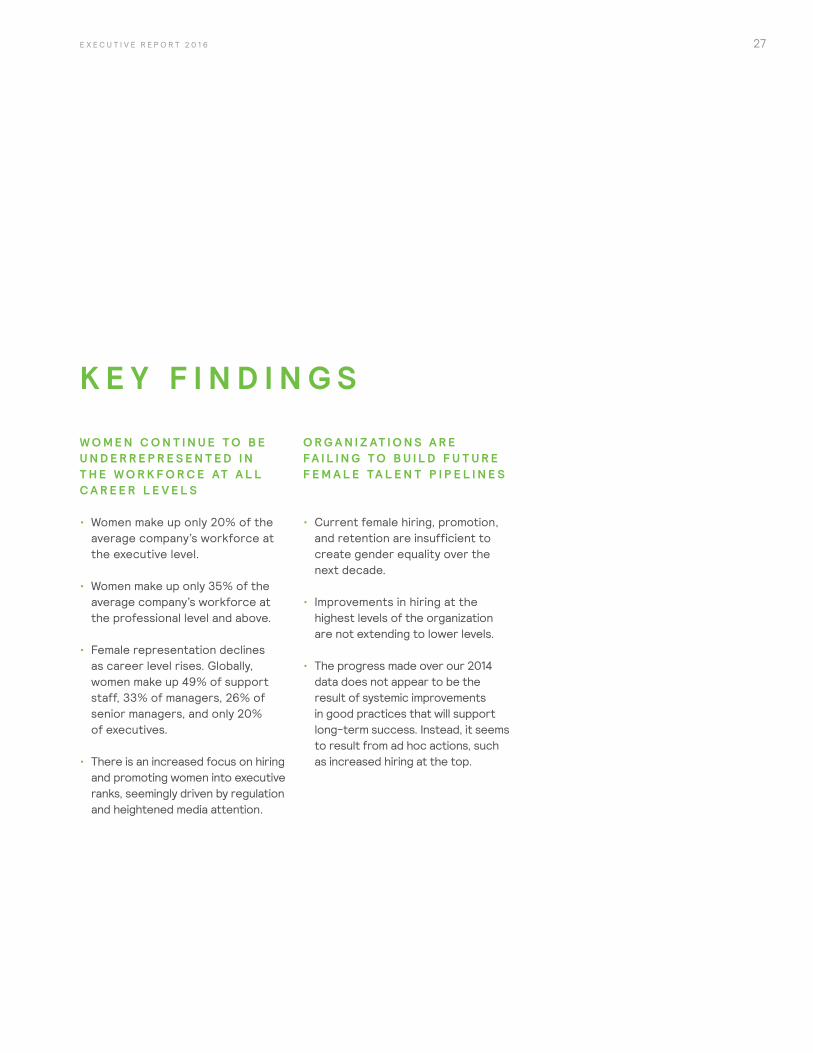
K E Y F I N D I N G S
W O M E N C O N T I N U E T O B E U N D E R R E P R E S E N T E D I N T H E W O R K F O R C E AT A L L C A R E E R L E V E L S
• Women make up only 20% of the average company’s workforce at the executive level.
• Women make up only 35% of the average company’s workforce at the professional level and above.
• Female representation declines as career level rises. Globally, women make up 49% of support staff, 33% of managers, 26% of senior managers, and only 20% of executives.
• There is an increased focus on hiring and promoting women into executive ranks, seemingly driven by regulation and heightened media attention.
O R G A N I Z AT I O N S A R E FA I L I N G T O B U I L D F U T U R E F E M A L E TA L E N T P I P E L I N E S
• Current female hiring, promotion, and retention are insufficient to create gender equality over the next decade.
• Improvements in hiring at the highest levels of the organization are not extending to lower levels.
• The progress made over our 2014 data does not appear to be the result of systemic improvements in good practices that will support long-term success. Instead, it seems to result from ad hoc actions, such as increased hiring at the top.
28 W H E N W O M E N T H R I V E , B U S I N E S S E S T H R I V E
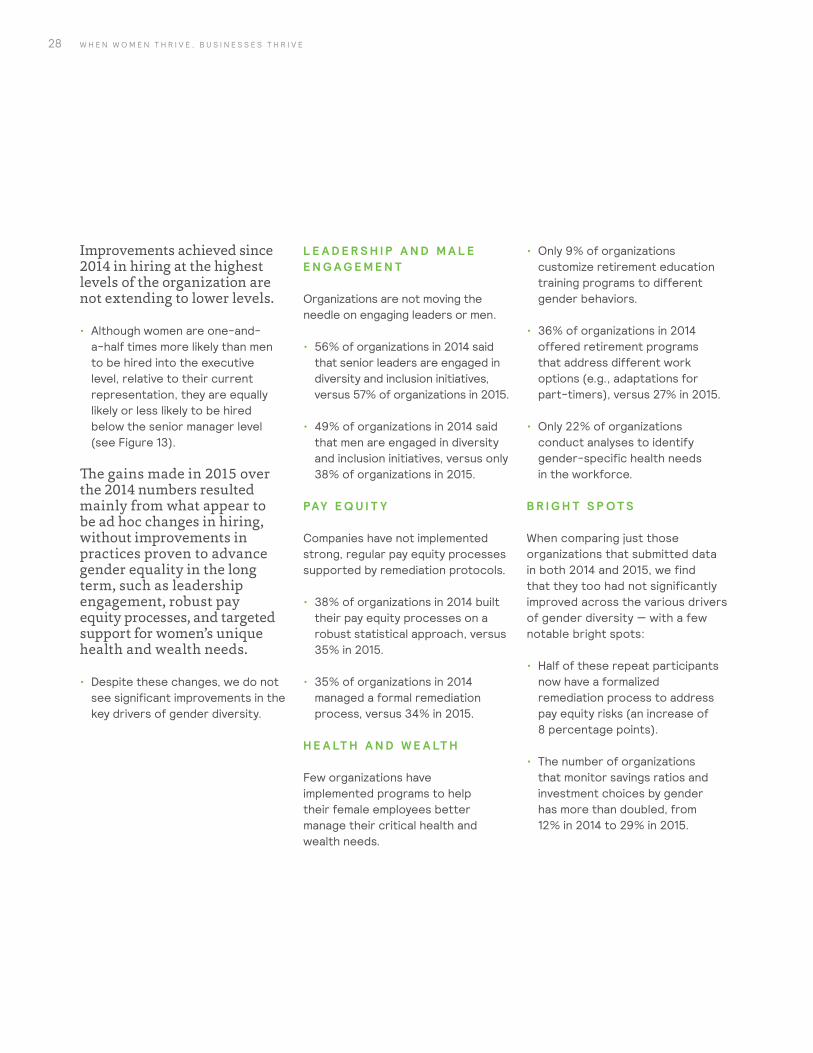
Improvements achieved since 2014 in hiring at the highest levels of the organization are not extending to lower levels.
• Although women are one-and-a-half times more likely than men to be hired into the executive level, relative to their current representation, they are equally likely or less likely to be hired below the senior manager level (see Figure 13).
The gains made in 2015 over the 2014 numbers resulted mainly from what appear to be ad hoc changes in hiring, without improvements in practices proven to advance gender equality in the long term, such as leadership engagement, robust pay equity processes, and targeted support for women’s unique health and wealth needs.
• Despite these changes, we do not see significant improvements in the key drivers of gender diversity.
L E A D E R S H I P A N D M A L E E N G A G E M E N T Organizations are not moving the needle on engaging leaders or men.
• 56% of organizations in 2014 said that senior leaders are engaged in diversity and inclusion initiatives, versus 57% of organizations in 2015.
• 49% of organizations in 2014 said that men are engaged in diversity and inclusion initiatives, versus only 38% of organizations in 2015.
PAY E Q U I T Y Companies have not implemented strong, regular pay equity processes supported by remediation protocols.
• 38% of organizations in 2014 built their pay equity processes on a robust statistical approach, versus 35% in 2015.
• 35% of organizations in 2014 managed a formal remediation process, versus 34% in 2015.
H E A LT H A N D W E A LT H Few organizations have implemented programs to help their female employees better manage their critical health and wealth needs.
• Only 9% of organizations customize retirement education training programs to different gender behaviors.
• 36% of organizations in 2014 offered retirement programs that address different work options (e.g., adaptations for part-timers), versus 27% in 2015.
• Only 22% of organizations conduct analyses to identify gender-specific health needs in the workforce.
B R I G H T S P O T S When comparing just those organizations that submitted data in both 2014 and 2015, we find that they too had not significantly improved across the various drivers of gender diversity — with a few notable bright spots:
• Half of these repeat participants now have a formalized remediation process to address pay equity risks (an increase of 8 percentage points).
• The number of organizations that monitor savings ratios and investment choices by gender has more than doubled, from 12% in 2014 to 29% in 2015.

29E X E C U T I V E R E P O R T 2 0 1 6
30 W H E N W O M E N T H R I V E , B U S I N E S S E S T H R I V E
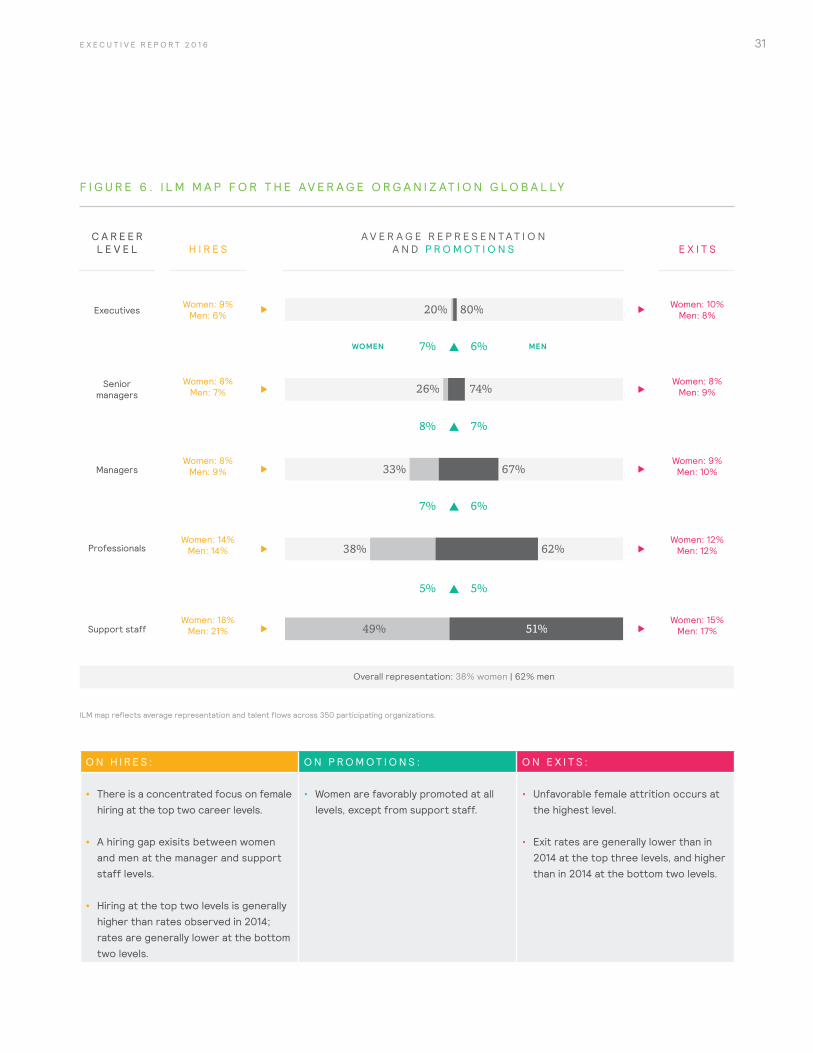
R E A D I N G A N I L M M A P
Throughout this report, we use Mercer’s Internal Labor Market® (ILM ®) maps and workforce projection graphs to summarize the results of our analysis and diagnose issues related to talent flows across the database of participating organizations in this study.
For over 20 years, Mercer has used Internal Labor Market (ILM) maps and statistical modeling to diagnose issues related to talent flows. Mercer’s ILM maps provide a graphical representation of the talent pipeline in the average survey respondent — a point-in-time snapshot of male and female representation by career level.
For each standardized career level used for the survey, the ILM map summarizes the rate at which talent is entering the organization (hires), moving up through the hierarchy (promotions), and ultimately departing the workforce (exits).
Gray percentages in the middle of the map indicate female and male representation at each career level, and green percentages represent how many women and men are promoted from that career level. Yellow percentages on the left represent hire rates, and pink percentages represent exit rates.
In Figure 6, we see that women make up 33% of the population of the manager career level. Relative to their current representation at the manager level, women are hired at a rate of 8% (data to the left of the bar), exit at a rate of 9% (data to the right of the bar), and are promoted out of the level at a rate of 8% (arrow above the bar).
Hire, promotion, and exit rates are calculated as the total number of events divided by average headcount, by level, and by gender, over a 12-month period.
31E X E C U T I V E R E P O R T 2 0 1 6
O N H I R E S : O N P R O M O T I O N S : O N E X I T S :
• There is a concentrated focus on female hiring at the top two career levels.
• A hiring gap exisits between women and men at the manager and support staff levels.
• Hiring at the top two levels is generally higher than rates observed in 2014; rates are generally lower at the bottom two levels.
• Women are favorably promoted at all levels, except from support staff.
• Unfavorable female attrition occurs at the highest level.
• Exit rates are generally lower than in 2014 at the top three levels, and higher than in 2014 at the bottom two levels.
F I G U R E 6 . I L M M A P F O R T H E AV E R A G E O R G A N I Z AT I O N G L O B A L LY
Women: 9%Men: 6%
Women: 10%Men: 8%
Women: 8%Men: 7%
Women: 8%Men: 9%
Women: 8%Men: 9%
Women: 9%Men: 10%
Women: 14%Men: 14%
Women: 12%Men: 12%
Women: 18%Men: 21%
Women: 15%Men: 17%
H I R E SC A R E E R L E V E L E X I T S
Overall representation: 38% women | 62% men
20% 80%
26% 74%
33% 67%
38% 62%
49% 51%
8% 7%
7% 6%
5% 5%
7% 6%WOMEN MEN
A V E R A G E R E P R E S E N T A T I O N A N D P R O M O T I O N S
Seniormanagers
Support staff
Professionals
Managers
Executives
ILM map reflects average representation and talent flows across 350 participating organizations.
32 W H E N W O M E N T H R I V E , B U S I N E S S E S T H R I V E
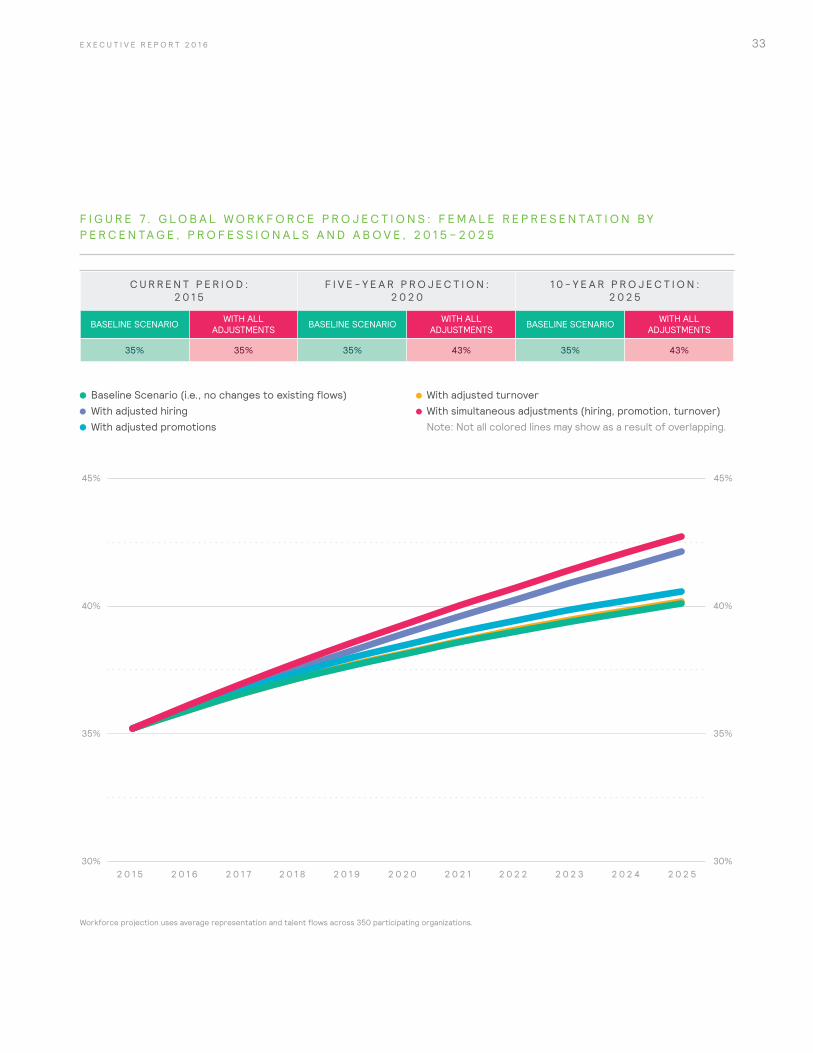
R E A D I N G A W O R K F O R C E P R O J E C T I O N
A workforce projection uses the talent flows from the ILM map to forecast scenarios of how female representation would change at the professional level and above if certain dynamics were to continue over time.
• In the Baseline Scenario, men and women enter the organization at the same rates as they do now, promotion rates remain unchanged, and turnover rates (exits) stay stable.
• The Adjusted Hiring Scenario approximates future representation of women if their hire rates were comparable to those of men.
• The Adjusted Promotion Scenario approximates future representation of women if their promotion rates were comparable to those of men.
• The Adjusted Turnover Scenario approximates future representation of women if their turnover rates (exits) were comparable to those of men.
• Finally, the Simultaneous Adjustments Scenario represents the total opportunity available to organizations if, where rates are currently unfavorable to women, companies were to increase female hiring and promotion rates and reduce female turnover rates to match those of men.
33E X E C U T I V E R E P O R T 2 0 1 6
F I G U R E 7 . G L O B A L W O R K F O R C E P R O J E C T I O N S : F E M A L E R E P R E S E N TAT I O N B Y P E R C E N TA G E , P R O F E S S I O N A L S A N D A B O V E , 2 0 1 5 – 2 0 2 5
C U R R E N T P E R I O D : 2 0 1 5
F I V E - Y E A R P R O J E C T I O N : 2 0 2 0
1 0 - Y E A R P R O J E C T I O N : 2 0 2 5
BASELINE SCENARIO WITH ALL ADJUSTMENTS BASELINE SCENARIO WITH ALL
ADJUSTMENTS BASELINE SCENARIO WITH ALL ADJUSTMENTS
35% 35% 35% 43% 35% 43%
Workforce projection uses average representation and talent flows across 350 participating organizations.
30%
35%
45%
40%
30%
45%
35%
40%
2 0 1 5 2 0 1 6 2 0 1 7 2 0 1 8 2 0 1 9 2 0 2 0 2 0 2 1 2 0 2 2 2 0 2 3 2 0 2 4 2 0 2 5
Baseline Scenario (i.e., no changes to existing flows) With adjusted hiring With adjusted promotions
With adjusted turnover With simultaneous adjustments (hiring, promotion, turnover) Note: Not all colored lines may show as a result of overlapping.
34 W H E N W O M E N T H R I V E , B U S I N E S S E S T H R I V E
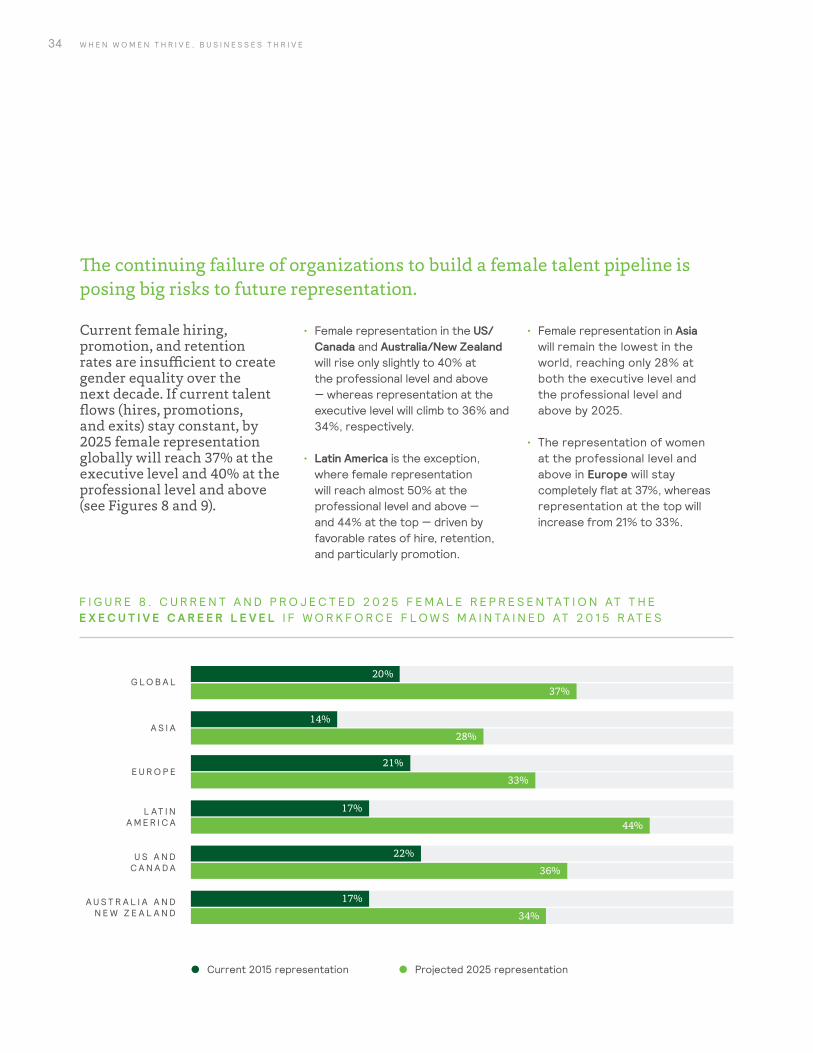
The continuing failure of organizations to build a female talent pipeline is posing big risks to future representation.
Current female hiring, promotion, and retention rates are insufficient to create gender equality over the next decade. If current talent flows (hires, promotions, and exits) stay constant, by 2025 female representation globally will reach 37% at the executive level and 40% at the professional level and above (see Figures 8 and 9).
• Female representation in the US/Canada and Australia/New Zealand will rise only slightly to 40% at the professional level and above — whereas representation at the executive level will climb to 36% and 34%, respectively.
• Latin America is the exception, where female representation will reach almost 50% at the professional level and above — and 44% at the top — driven by favorable rates of hire, retention, and particularly promotion.
• Female representation in Asia will remain the lowest in the world, reaching only 28% at both the executive level and the professional level and above by 2025.
• The representation of women at the professional level and above in Europe will stay completely flat at 37%, whereas representation at the top will increase from 21% to 33%.
F I G U R E 8 . C U R R E N T A N D P R O J E C T E D 2 0 2 5 F E M A L E R E P R E S E N TAT I O N AT T H E E X E C U T I V E C A R E E R L E V E L I F W O R K F O R C E F L O W S M A I N TA I N E D AT 2 0 1 5 R AT E S
Current 2015 representation Projected 2025 representation
20%
37%
14%
28%
17%
34%
21%
33%
17%
22%
44%
36%
G L O B A L
A S I A
E U R O P E
L AT I N A M E R I C A
U S A N D C A N A D A
A U S T R A L I A A N D N E W Z E A L A N D
35E X E C U T I V E R E P O R T 2 0 1 6
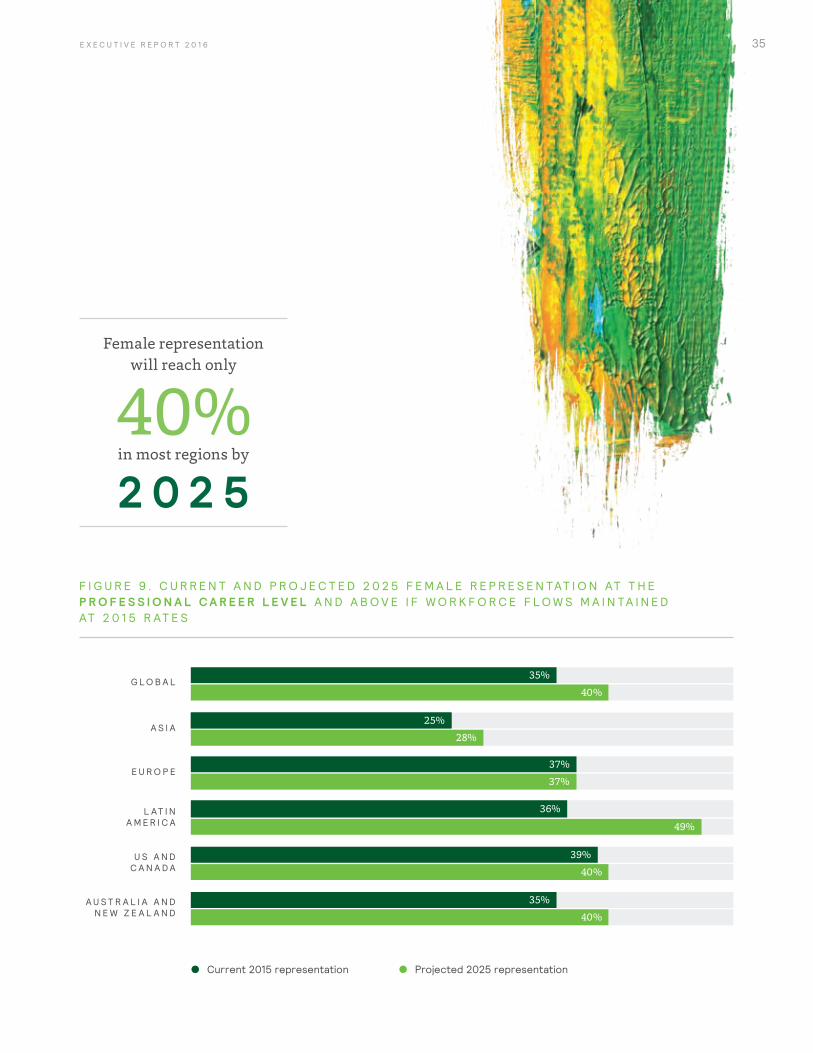
F I G U R E 9 . C U R R E N T A N D P R O J E C T E D 2 0 2 5 F E M A L E R E P R E S E N TAT I O N AT T H E P R O F E S S I O N A L C A R E E R L E V E L A N D A B O V E I F W O R K F O R C E F L O W S M A I N TA I N E D AT 2 0 1 5 R AT E S
Current 2015 representation Projected 2025 representation
35%
40%
25%
28%
35%
40%
37%
37%
36%
39%
49%
40%
A S I A
E U R O P E
L AT I N A M E R I C A
U S A N D C A N A D A
A U S T R A L I A A N D N E W Z E A L A N D
G L O B A L
Female representation will reach only
in most regions by
36 W H E N W O M E N T H R I V E , B U S I N E S S E S T H R I V E
Section 3 of this report includes detailed ILM maps, workforce projections, key findings, and rankings for each region.
37E X E C U T I V E R E P O R T 2 0 1 6
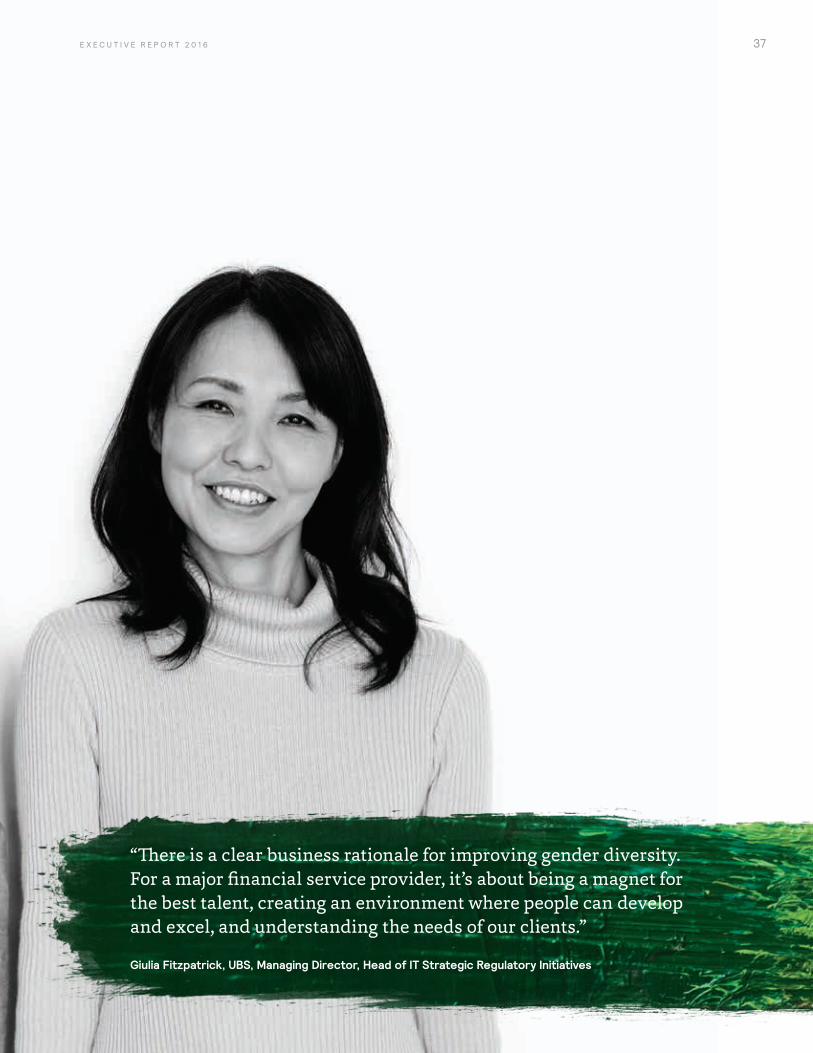
“There is a clear business rationale for improving gender diversity. For a major financial service provider, it’s about being a magnet for the best talent, creating an environment where people can develop and excel, and understanding the needs of our clients.” Giulia Fitzpatrick, UBS, Managing Director, Head of IT Strategic Regulatory Initiatives
SECTION 2: KEY FINDINGS AND PUT TING
THE 6 P ’S INTO ACTION
38 W H E N W O M E N T H R I V E , B U S I N E S S E S T H R I V E
39E X E C U T I V E R E P O R T 2 0 1 6
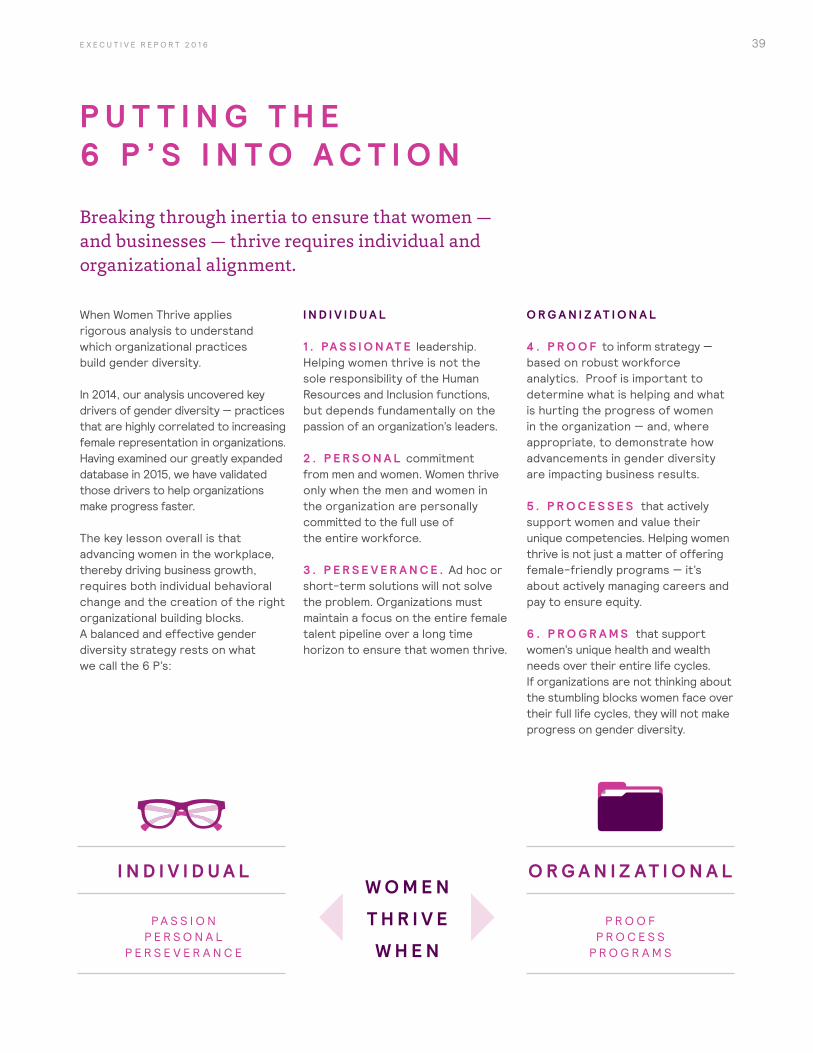
P U T T I N G T H E 6 P ’ S I N T O A C T I O N
Breaking through inertia to ensure that women — and businesses — thrive requires individual and organizational alignment.
When Women Thrive applies rigorous analysis to understand which organizational practices build gender diversity.
In 2014, our analysis uncovered key drivers of gender diversity — practices that are highly correlated to increasing female representation in organizations. Having examined our greatly expanded database in 2015, we have validated those drivers to help organizations make progress faster.
The key lesson overall is that advancing women in the workplace, thereby driving business growth, requires both individual behavioral change and the creation of the right organizational building blocks. A balanced and effective gender diversity strategy rests on what we call the 6 P’s:
I N D I V I D U A L 1 . PA S S I O N AT E leadership. Helping women thrive is not the sole responsibility of the Human Resources and Inclusion functions, but depends fundamentally on the passion of an organization’s leaders.
2 . P E R S O N A L commitment from men and women. Women thrive only when the men and women in the organization are personally committed to the full use of the entire workforce.
3 . P E R S E V E R A N C E . Ad hoc or short-term solutions will not solve the problem. Organizations must maintain a focus on the entire female talent pipeline over a long time horizon to ensure that women thrive.
O R G A N I Z AT I O N A L 4 . P R O O F to inform strategy — based on robust workforce analytics. Proof is important to determine what is helping and what is hurting the progress of women in the organization — and, where appropriate, to demonstrate how advancements in gender diversity are impacting business results.
5 . P R O C E S S E S that actively support women and value their unique competencies. Helping women thrive is not just a matter of offering female-friendly programs — it’s about actively managing careers and pay to ensure equity.
6 . P R O G R A M S that support women’s unique health and wealth needs over their entire life cycles. If organizations are not thinking about the stumbling blocks women face over their full life cycles, they will not make progress on gender diversity.
P A S S I O N P E R S O N A L
P E R S E V E R A N C E
P R O O F P R O C E S S
P R O G R A M S
O R G A N I Z A T I O N A LI N D I V I D U A LW O M E N
T H R I V E
W H E N
40 W H E N W O M E N T H R I V E , B U S I N E S S E S T H R I V E
W O M E N T H R I V E W H E N L E A D E R S AT A L L L E V E L S A R E P A S S I O N AT E LY E N G A G E D
P A S S I O N AT E L E A D E R S H I P
K E Y F I N D I N G S
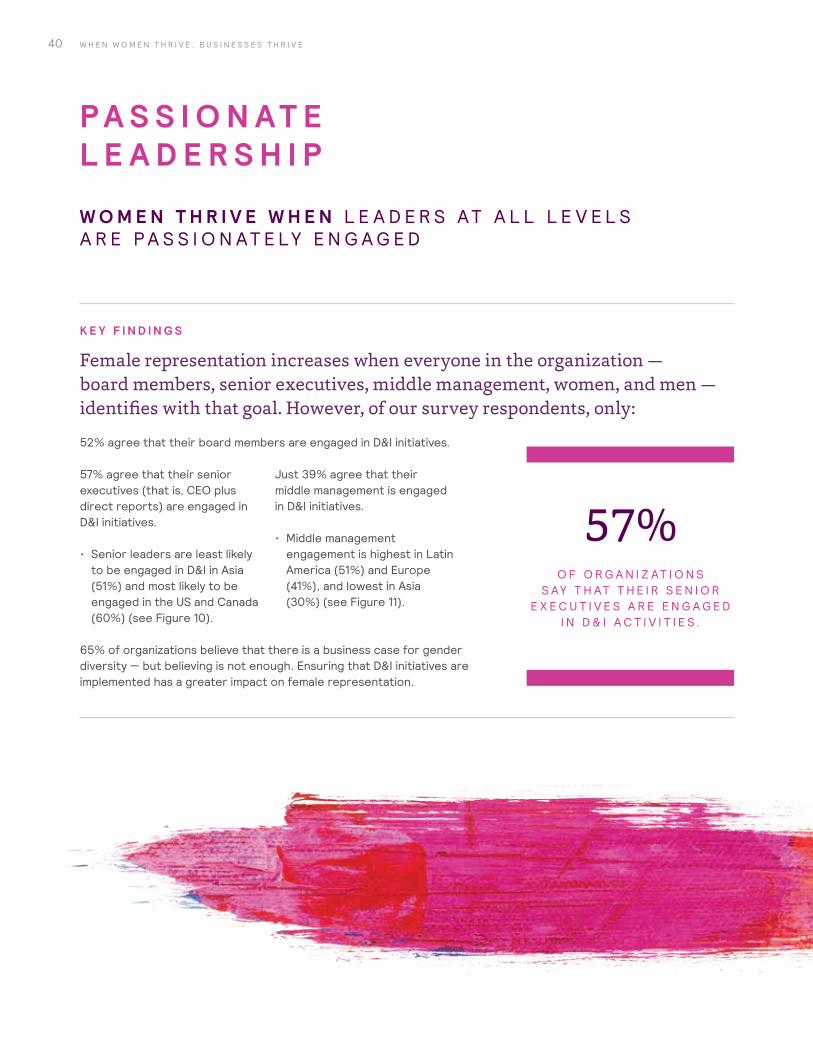
Female representation increases when everyone in the organization — board members, senior executives, middle management, women, and men — identifies with that goal. However, of our survey respondents, only:
52% agree that their board members are engaged in D&I initiatives.
65% of organizations believe that there is a business case for gender diversity — but believing is not enough. Ensuring that D&I initiatives are implemented has a greater impact on female representation.
57% agree that their senior executives (that is, CEO plus direct reports) are engaged in D&I initiatives.
• Senior leaders are least likely to be engaged in D&I in Asia (51%) and most likely to be engaged in the US and Canada (60%) (see Figure 10).
Just 39% agree that their middle management is engaged in D&I initiatives.
• Middle management engagement is highest in Latin America (51%) and Europe (41%), and lowest in Asia (30%) (see Figure 11).
57% O F O R G A N I Z AT I O N S
S AY T H AT T H E I R S E N I O R E X E C U T I V E S A R E E N G A G E D
I N D & I A C T I V I T I E S .

41E X E C U T I V E R E P O R T 2 0 1 6
W H Y I T M AT T E R S
• Success in gender diversity depends fundamentally on the passion of an organization’s leaders. Organizations with leaders who are actively involved in D&I programs not only have more women at the top but are also bringing in, promoting, and retaining women at more equitable rates. Executive goals linked to attainment of diversity goals have, on their own, no association with success in building gender diversity.
• Engaging senior leaders, though critical, is not sufficient. Managers at all levels of an organization — including managers who oversee staff day to day — must be engaged to achieve gender diversity. Whether employees know about critical HR programs, feel able to take advantage of them, and are actively managed and supported throughout their professional life cycles is largely dependent on the effective training and commitment of managers to ensuring that all talent thrives.
F I G U R E 1 0 . P E R C E N TA G E O F O R G A N I Z AT I O N S T H AT A G R E E T H E I R S E N I O R L E A D E R S H I P I S E N G A G E D I N D & I E F F O R T S , I N O R D E R O F R E G I O N A L R A N K I N G
S E N I O R L E A D E R S H I P E N G A G E M E N T I N D & I E F F O R T S
RANK
US and Canada 60% 1
Europe 59% 2
Australia and New Zealand 57% 3
Global 57%
Latin America 54% 4
Asia 51% 5
F I G U R E 1 1 . P E R C E N TA G E O F O R G A N I Z AT I O N S T H AT A G R E E T H E I R M I D D L E M A N A G E M E N T I S E N G A G E D I N D & I E F F O R T S , I N O R D E R O F R E G I O N A L R A N K I N G
M I D D L E M A N A G E M E N T E N G A G E M E N T I N D & I E F F O R T S
RANK
Latin America 51% 1
Europe 41% 2
Global 39%
Australia and New Zealand 36% 3
US and Canada 36% 4
Asia 30% 5
TA K E A C T I O N
• Find champions outside the HR and D&I functions with the passion to drive change.
• It is not enough for leaders to mandate or hold people accountable — they must personally cause the change.
• Invest in diversity and unconscious bias development programs for employees to educate and raise awareness of inherent biases and negative stereotypes, and to encourage individual behavior and culture change.
42 W H E N W O M E N T H R I V E , B U S I N E S S E S T H R I V E
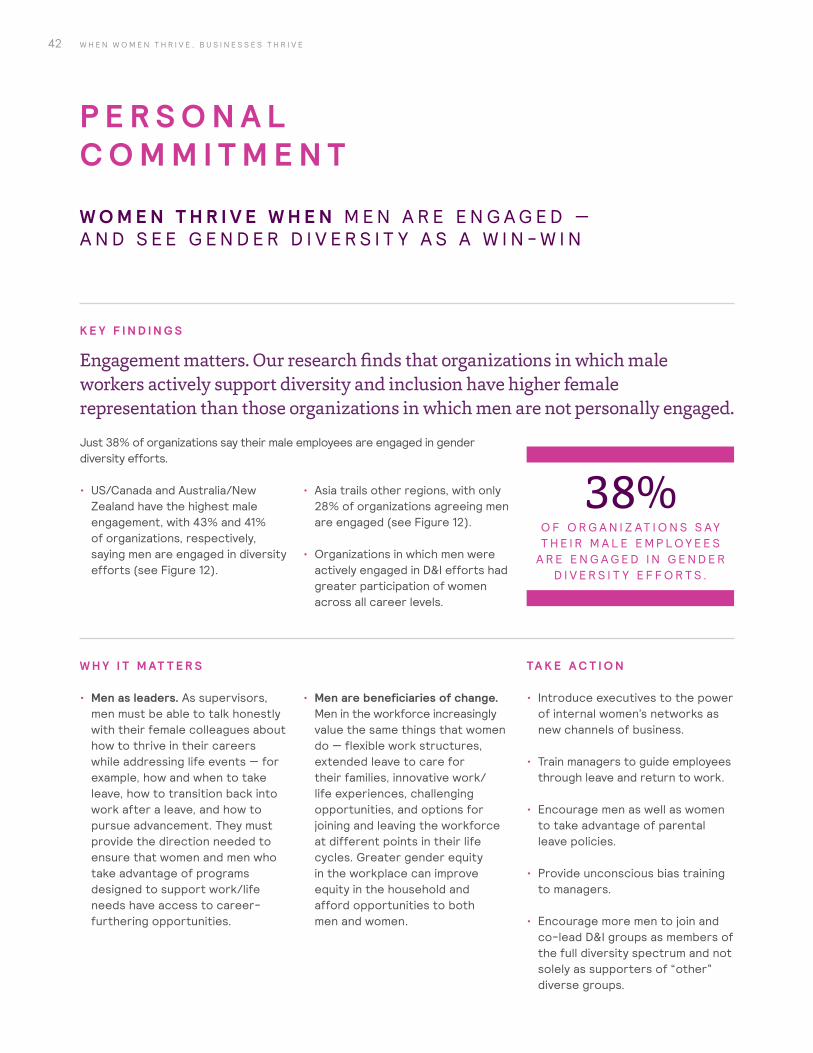
W H Y I T M AT T E R S
• Men as leaders. As supervisors, men must be able to talk honestly with their female colleagues about how to thrive in their careers while addressing life events — for example, how and when to take leave, how to transition back into work after a leave, and how to pursue advancement. They must provide the direction needed to ensure that women and men who take advantage of programs designed to support work/life needs have access to career-furthering opportunities.
TA K E A C T I O N
• Introduce executives to the power of internal women’s networks as new channels of business.
• Train managers to guide employees through leave and return to work.
• Encourage men as well as women to take advantage of parental leave policies.
• Provide unconscious bias training to managers.
• Encourage more men to join and co-lead D&I groups as members of the full diversity spectrum and not solely as supporters of “other” diverse groups.
W O M E N T H R I V E W H E N M E N A R E E N G A G E D — A N D S E E G E N D E R D I V E R S I T Y A S A W I N - W I N
P E R S O N A L C O M M I T M E N T
• US/Canada and Australia/New Zealand have the highest male engagement, with 43% and 41% of organizations, respectively, saying men are engaged in diversity efforts (see Figure 12).
• Asia trails other regions, with only 28% of organizations agreeing men are engaged (see Figure 12).
• Organizations in which men were actively engaged in D&I efforts had greater participation of women across all career levels.
K E Y F I N D I N G S
Engagement matters. Our research finds that organizations in which male workers actively support diversity and inclusion have higher female representation than those organizations in which men are not personally engaged.
Just 38% of organizations say their male employees are engaged in gender diversity efforts.
• Men are beneficiaries of change. Men in the workforce increasingly value the same things that women do — flexible work structures, extended leave to care for their families, innovative work/life experiences, challenging opportunities, and options for joining and leaving the workforce at different points in their life cycles. Greater gender equity in the workplace can improve equity in the household and afford opportunities to both men and women.
38% O F O R G A N I Z AT I O N S S AY T H E I R M A L E E M P L O Y E E S
A R E E N G A G E D I N G E N D E R D I V E R S I T Y E F F O R T S .
43E X E C U T I V E R E P O R T 2 0 1 6
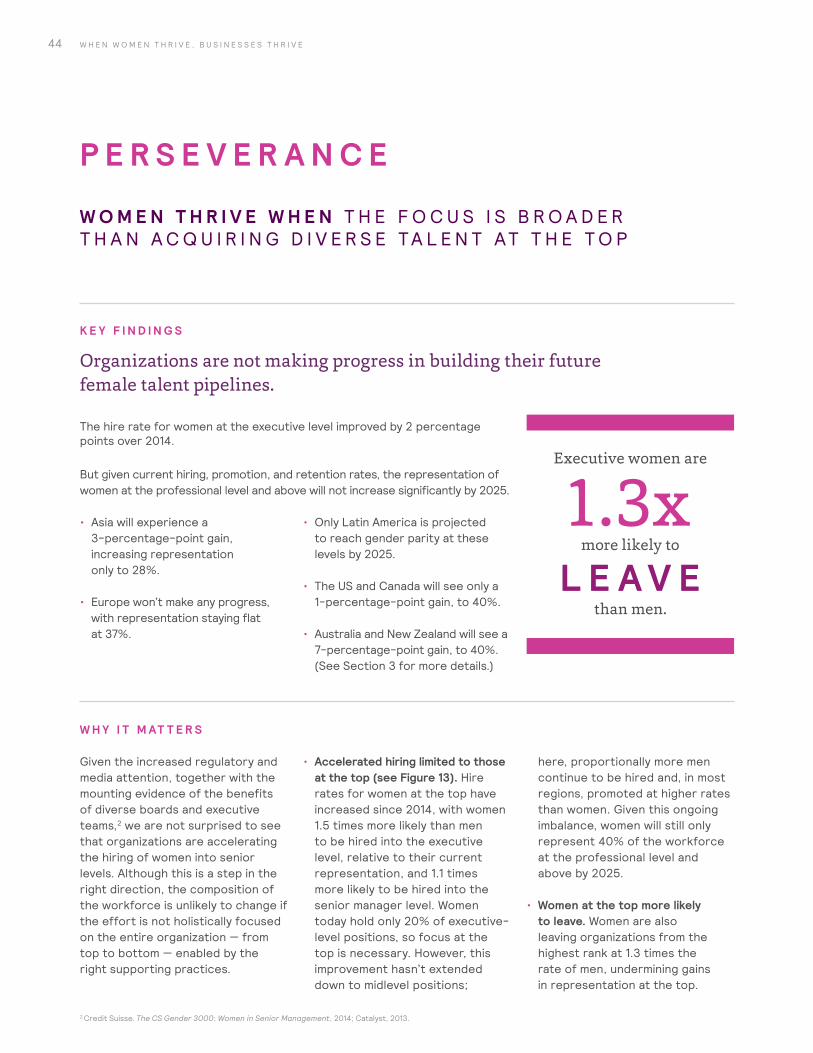
F I G U R E 1 2 . P E R C E N TA G E O F O R G A N I Z AT I O N S T H AT A G R E E T H E I R M E N A R E E N G A G E D I N D & I E F F O R T S , I N O R D E R O F R E G I O N A L R A N K I N G
M A L E E N G A G E M E N T I N D & I E F F O R T S
RANK
US and Canada 43% 1
Australia and New Zealand 41% 2
Global 38%
Latin America 37% 3
Europe 37% 4
Asia 28% 5
Our data shows that organizations must make considerable improvements in the engagement of men. We commend the great work and resources organizations like HeforShe, Catalyst’s MARC (Men Advocating Real Change), and LeanIn Together are promoting to emphasize, encourage, and support more active participation of men in advancing gender equality.
44 W H E N W O M E N T H R I V E , B U S I N E S S E S T H R I V E
W O M E N T H R I V E W H E N T H E F O C U S I S B R O A D E R T H A N A C Q U I R I N G D I V E R S E TA L E N T AT T H E T O P
P E R S E V E R A N C E
W H Y I T M AT T E R S
Given the increased regulatory and media attention, together with the mounting evidence of the benefits of diverse boards and executive teams,2 we are not surprised to see that organizations are accelerating the hiring of women into senior levels. Although this is a step in the right direction, the composition of the workforce is unlikely to change if the effort is not holistically focused on the entire organization — from top to bottom — enabled by the right supporting practices.
• Accelerated hiring limited to those at the top (see Figure 13). Hire rates for women at the top have increased since 2014, with women 1.5 times more likely than men to be hired into the executive level, relative to their current representation, and 1.1 times more likely to be hired into the senior manager level. Women today hold only 20% of executive-level positions, so focus at the top is necessary. However, this improvement hasn’t extended down to midlevel positions;
here, proportionally more men continue to be hired and, in most regions, promoted at higher rates than women. Given this ongoing imbalance, women will still only represent 40% of the workforce at the professional level and above by 2025.
• Women at the top more likely to leave. Women are also leaving organizations from the highest rank at 1.3 times the rate of men, undermining gains in representation at the top.
2 Credit Suisse. The CS Gender 3000: Women in Senior Management, 2014; Catalyst, 2013.
• Asia will experience a 3-percentage-point gain, increasing representation only to 28%.
• Europe won’t make any progress, with representation staying flat at 37%.
• Only Latin America is projected to reach gender parity at these levels by 2025.
• The US and Canada will see only a 1-percentage-point gain, to 40%.
• Australia and New Zealand will see a 7-percentage-point gain, to 40%. (See Section 3 for more details.)
K E Y F I N D I N G S
Organizations are not making progress in building their future female talent pipelines.
The hire rate for women at the executive level improved by 2 percentage points over 2014.
But given current hiring, promotion, and retention rates, the representation of women at the professional level and above will not increase significantly by 2025.
Executive women are
more likely to
than men.
45
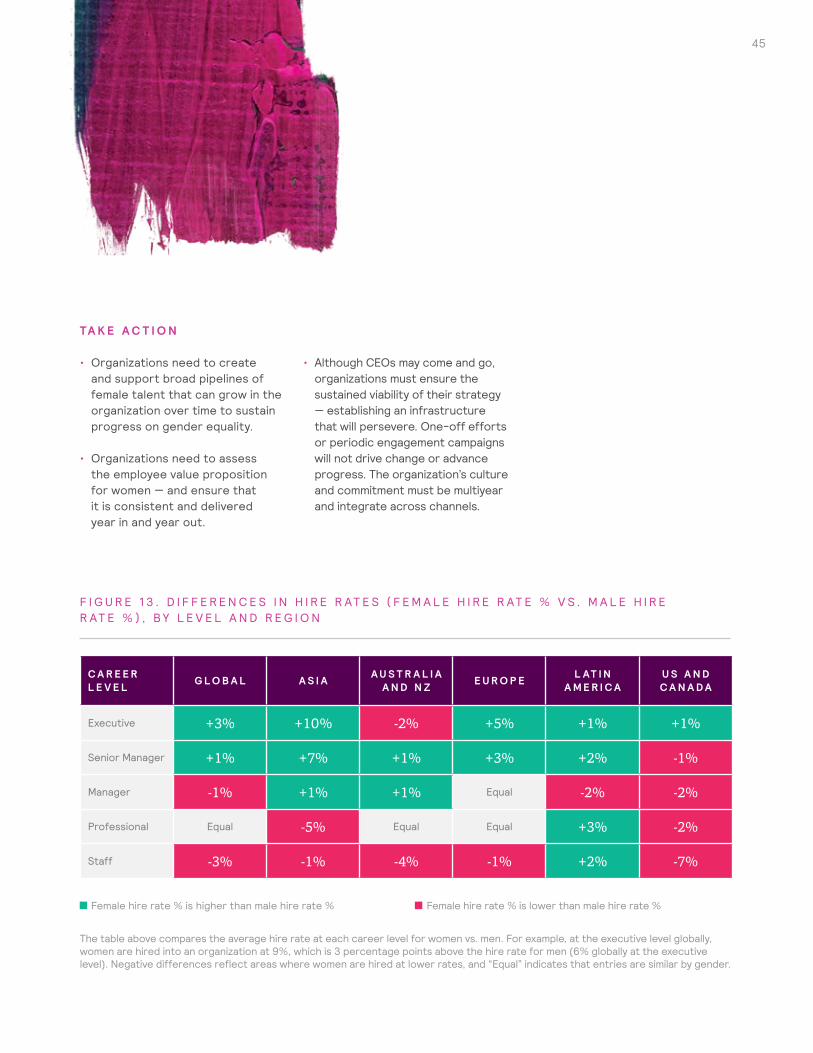
F I G U R E 1 3 . D I F F E R E N C E S I N H I R E R AT E S ( F E M A L E H I R E R AT E % V S . M A L E H I R E R AT E % ) , B Y L E V E L A N D R E G I O N
C A R E E R L E V E L G L O B A L A S I A A U S T R A L I A
A N D N Z E U R O P E L AT I N A M E R I C A
U S A N D C A N A D A
Executive +3% +10% -2% +5% +1% +1%
Senior Manager +1% +7% +1% +3% +2% -1%
Manager -1% +1% +1% Equal -2% -2%
Professional Equal -5% Equal Equal +3% -2%
Staff -3% -1% -4% -1% +2% -7%
Female hire rate % is higher than male hire rate % Female hire rate % is lower than male hire rate %
TA K E A C T I O N
• Organizations need to create and support broad pipelines of female talent that can grow in the organization over time to sustain progress on gender equality.
• Organizations need to assess the employee value proposition for women — and ensure that it is consistent and delivered year in and year out.
• Although CEOs may come and go, organizations must ensure the sustained viability of their strategy — establishing an infrastructure that will persevere. One-off efforts or periodic engagement campaigns will not drive change or advance progress. The organization’s culture and commitment must be multiyear and integrate across channels.
The table above compares the average hire rate at each career level for women vs. men. For example, at the executive level globally, women are hired into an organization at 9%, which is 3 percentage points above the hire rate for men (6% globally at the executive level). Negative differences reflect areas where women are hired at lower rates, and “Equal” indicates that entries are similar by gender.
46 W H E N W O M E N T H R I V E , B U S I N E S S E S T H R I V E
W O M E N T H R I V E W H E N L E A V E A N D F L E X I B I L I T Y P R O G R A M S A R E A C T I V E LY M A N A G E D
P R O O F A B O U T W H AT I S H E L P I N G A N D W H AT I S H U R T I N G
K E Y F I N D I N G S
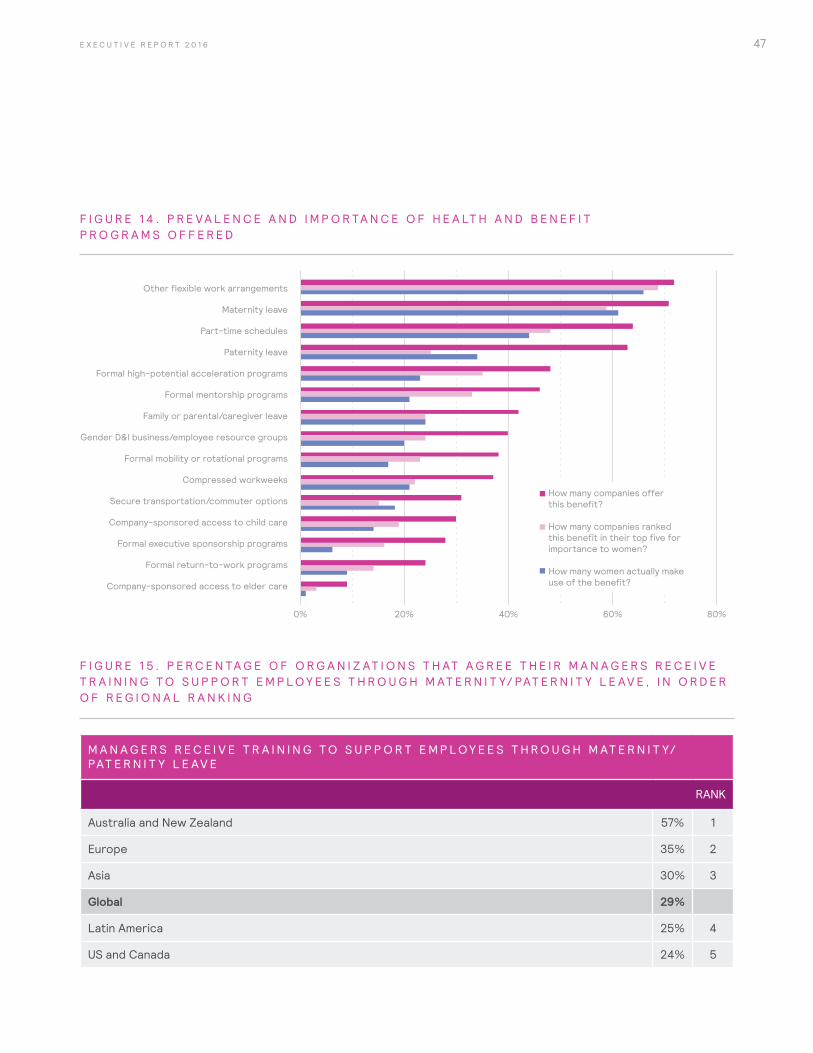
Flexible work options and maternity leave are the benefits most valued by women — 65% and 61% of organizations rank them, respectively, among their most used programs (see Figure 14).
• Simply having a commitment or policy does not correlate with greater female representation.
• When both men and women use leave programs, organizations exhibit higher female representation.
• Flexible work is least popular in Asia, where only 33% rank it as highly used.
• Although 79% of organizations in Australia/New Zealand and 72% in the US/Canada rank maternity leave among their most used programs, only 55% in Asia and 48% in Latin America do.
Despite heavy usage of flexible work options and maternity leave, only 29% of organizations agree they give their managers training so they can effectively support employees through maternity/paternity leave and their return to work (see Figure 15).
• 57% of organizations in Australia/New Zealand actively manage leave and flexibility programs, whereas only 35% in Europe, 30% in Asia, and a quarter or less in Latin America and the US/Canada actively manage such programs.
Organizations that actually value maternity leave and part-time schedules as critical to their gender strategies — as opposed to those that simply offer the benefits — tend to have better representation of women today, and better future trajectories.
O N LY 29%
O F O R G A N I Z AT I O N S P R O V I D E T R A I N I N G T O M A N A G E R S T O
S U P P O R T E M P L O Y E E S T H R O U G H M AT E R N I T Y/
PAT E R N I T Y L E AV E A N D T H E I R R E T U R N
T O W O R K .
47E X E C U T I V E R E P O R T 2 0 1 6
Other flexible work arrangements
Maternity leave
Part-time schedules
Paternity leave
Formal high-potential acceleration programs
Formal mentorship programs
Family or parental/caregiver leave
Gender D&l business/employee resource groups
Formal mobility or rotational programs
Compressed workweeks
Secure transportation/commuter options
Company-sponsored access to child care
Formal executive sponsorship programs
Formal return-to-work programs
Company-sponsored access to elder care
0% 20% 40% 60% 80%
How many companies offer this benefit?
How many companies ranked this benefit in their top five for importance to women?
How many women actually make use of the benefit?
F I G U R E 1 4 . P R E VA L E N C E A N D I M P O R TA N C E O F H E A LT H A N D B E N E F I T P R O G R A M S O F F E R E D
F I G U R E 1 5 . P E R C E N TA G E O F O R G A N I Z AT I O N S T H AT A G R E E T H E I R M A N A G E R S R E C E I V E T R A I N I N G T O S U P P O R T E M P L O Y E E S T H R O U G H M AT E R N I T Y/ PAT E R N I T Y L E AV E , I N O R D E R O F R E G I O N A L R A N K I N G
M A N A G E R S R E C E I V E T R A I N I N G T O S U P P O R T E M P L O Y E E S T H R O U G H M AT E R N I T Y/PAT E R N I T Y L E AV E
RANK
Australia and New Zealand 57% 1
Europe 35% 2
Asia 30% 3
Global 29%
Latin America 25% 4
US and Canada 24% 5
48
W H Y I T M AT T E R S
• Leave and flexibility programs can help or hurt gender diversity. Our research found that the impact of these programs on gender diversity depends on who uses them and how well those who take advantage of them are managed. If taking advantage of a leave program, for example, is frowned upon or is acceptable only for women and not for men, its existence will tend to undermine the attraction, advancement, and retention of women.
• Benefits or programs without manager awareness, training, and support of these programs minimizes value and impact. Although organizations have sought to attract and retain more women by adding new programs and benefits intended to provide greater support and flexibility, our research makes clear that is no longer enough, and may even lull organizations into complacency.
• Higher female representation when men and women both use leave programs. Organizations in which men are equally likely to take advantage of such programs are better situated to improve representation of women.
TA K E A C T I O N
• Don’t just implement “check the box” or “off the shelf” benefits or programs to improve gender diversity.
• Instead, rigorously assess the impact of policies and programs on the progression of women — and implement supporting measures to ensure ultimate success.
• Include an assessment of how unspoken attitudes and customs impact the use of leave and flexibility programs by both genders.
• Provide training to managers so they can effectively support and manage their employees as they take advantage of the programs offered. For example, provide direct training on how to have the right conversations with women before, during, and when they return from leave.
• Support men and women taking advantage of benefits and programs offered.
49E X E C U T I V E R E P O R T 2 0 1 6
W O M E N T H R I V E W H E N T H E I R U N I Q U E C O M P E T E N C I E S A R E L E V E R A G E D I N H I G H B U S I N E S S I M P A C T R O L E S
P R O O F A B O U T W H AT I S H E L P I N G A N D W H AT I S H U R T I N G
K E Y F I N D I N G S
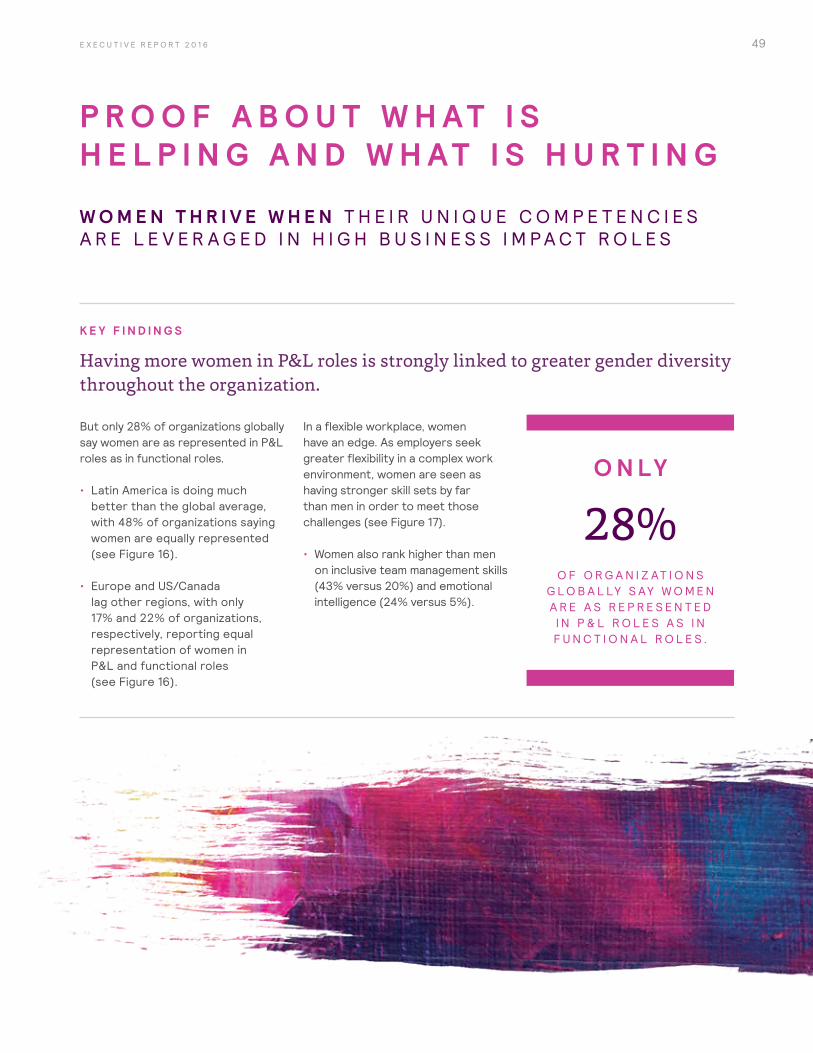
Having more women in P&L roles is strongly linked to greater gender diversity throughout the organization.
But only 28% of organizations globally say women are as represented in P&L roles as in functional roles.
• Latin America is doing much better than the global average, with 48% of organizations saying women are equally represented (see Figure 16).
• Europe and US/Canada lag other regions, with only 17% and 22% of organizations, respectively, reporting equal representation of women in P&L and functional roles (see Figure 16).
In a flexible workplace, women have an edge. As employers seek greater flexibility in a complex work environment, women are seen as having stronger skill sets by far than men in order to meet those challenges (see Figure 17).
• Women also rank higher than men on inclusive team management skills (43% versus 20%) and emotional intelligence (24% versus 5%).
O N LY 28%
O F O R G A N I Z AT I O N S G L O B A L LY S AY W O M E N A R E A S R E P R E S E N T E D
I N P & L R O L E S A S I N F U N C T I O N A L R O L E S .
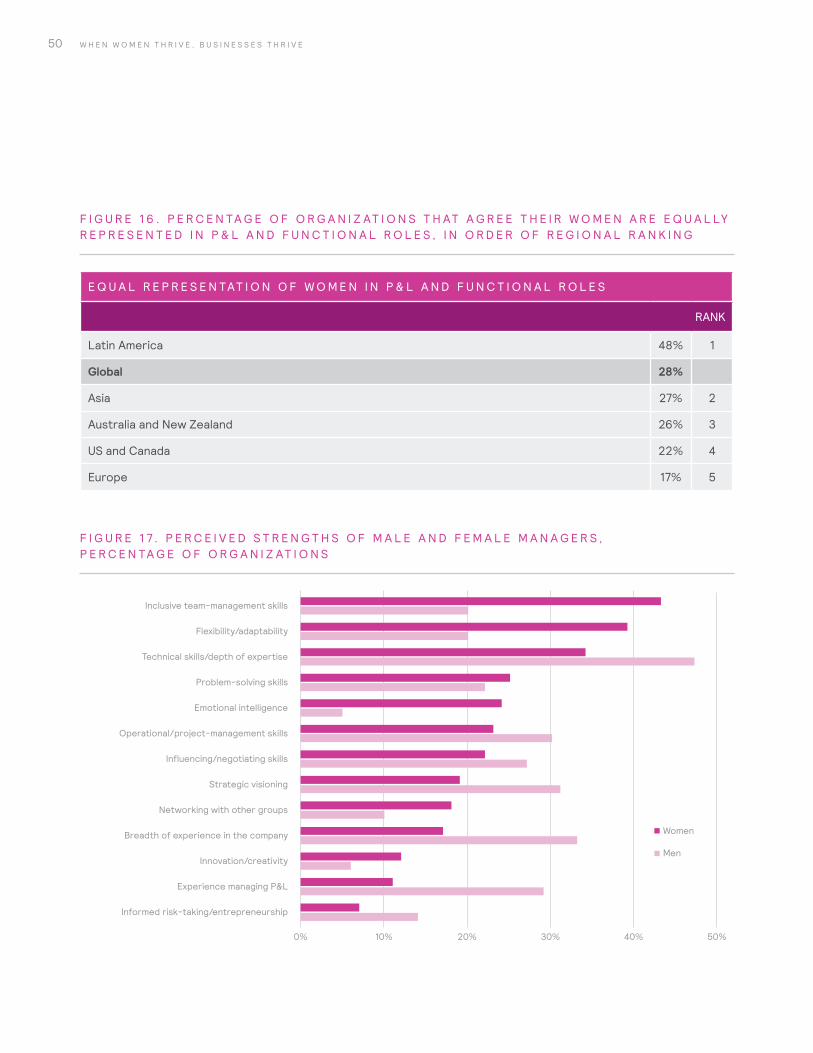
F I G U R E 1 6 . P E R C E N TA G E O F O R G A N I Z AT I O N S T H AT A G R E E T H E I R W O M E N A R E E Q U A L LY R E P R E S E N T E D I N P & L A N D F U N C T I O N A L R O L E S , I N O R D E R O F R E G I O N A L R A N K I N G
E Q U A L R E P R E S E N TAT I O N O F W O M E N I N P & L A N D F U N C T I O N A L R O L E S
RANK
Latin America 48% 1
Global 28%
Asia 27% 2
Australia and New Zealand 26% 3
US and Canada 22% 4
Europe 17% 5
F I G U R E 1 7 . P E R C E I V E D S T R E N G T H S O F M A L E A N D F E M A L E M A N A G E R S , P E R C E N TA G E O F O R G A N I Z AT I O N S
0% 10% 20% 30% 50%40%
Women
Men
Flexibility/adaptability
Problem-solving skills
Strategic visioning
Influencing/negotiating skills
Inclusive team-management skills
Technical skills/depth of expertise
Operational/project-management skills
Innovation/creativity
Informed risk-taking/entrepreneurship
Emotional intelligence
Networking with other groups
Breadth of experience in the company
Experience managing P&L
50 W H E N W O M E N T H R I V E , B U S I N E S S E S T H R I V E
51E X E C U T I V E R E P O R T 2 0 1 6
W H Y I T M AT T E R S
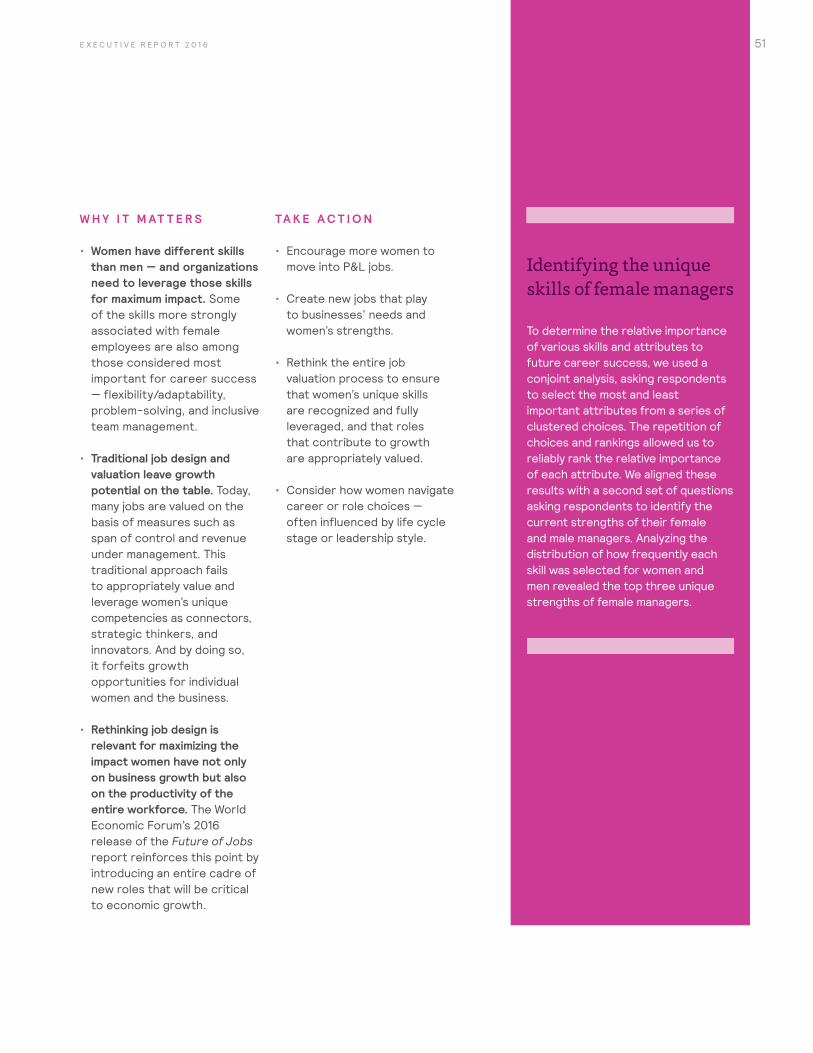
• Women have different skills than men — and organizations need to leverage those skills for maximum impact. Some of the skills more strongly associated with female employees are also among those considered most important for career success — flexibility/adaptability, problem-solving, and inclusive team management.
• Traditional job design and valuation leave growth potential on the table. Today, many jobs are valued on the basis of measures such as span of control and revenue under management. This traditional approach fails to appropriately value and leverage women’s unique competencies as connectors, strategic thinkers, and innovators. And by doing so, it forfeits growth opportunities for individual women and the business.
• Rethinking job design is relevant for maximizing the impact women have not only on business growth but also on the productivity of the entire workforce. The World Economic Forum’s 2016 release of the Future of Jobs report reinforces this point by introducing an entire cadre of new roles that will be critical to economic growth.
TA K E A C T I O N
• Encourage more women to move into P&L jobs.
• Create new jobs that play to businesses’ needs and women’s strengths.
• Rethink the entire job valuation process to ensure that women’s unique skills are recognized and fully leveraged, and that roles that contribute to growth are appropriately valued.
• Consider how women navigate career or role choices — often influenced by life cycle stage or leadership style.
Identifying the unique skills of female managers To determine the relative importance of various skills and attributes to future career success, we used a conjoint analysis, asking respondents to select the most and least important attributes from a series of clustered choices. The repetition of choices and rankings allowed us to reliably rank the relative importance of each attribute. We aligned these results with a second set of questions asking respondents to identify the current strengths of their female and male managers. Analyzing the distribution of how frequently each skill was selected for women and men revealed the top three unique strengths of female managers.
52 W H E N W O M E N T H R I V E , B U S I N E S S E S T H R I V E
W O M E N T H R I V E W H E N T H E R E I S A D I L I G E N T P A Y E Q U I T Y P R O C E S S
P R O C E S S E S T H AT A C T I V E LY S U P P O R T W O M E N
K E Y F I N D I N G S
Having a robust pay equity process matters — particularly for the broader talent pool, and not just for executives.
Simply having a commitment or policy does not drive greater female representation.
• Only 35% of organizations have a pay equity analysis process built on a robust statistical approach. Thirty-four percent have a formalized remediation process to address identified pay equity risks.
- North America is ahead of other regions, with 40% reporting a formal remediation process (see Figure 18).
- Europe and Asia lag, with 28% and 25%, respectively, reporting a formal remediation process (see Figure 18).
41%
O F O R G A N I Z AT I O N S M A K E PAY E Q U I T Y A D J U S T M E N T S
A S PA R T O F T H E A N N U A L C O M P E N S AT I O N
R E V I E W P R O C E S S .
53E X E C U T I V E R E P O R T 2 0 1 6
W H Y I T M AT T E R S
• Formal pay equity processes drive gender diversity. Our research reveals that having a protocol for conducting pay equity analyses is a significant driver of greater gender equality in organizations. For greatest impact, these processes should rely on statistical analysis, clearly identify process owners, and include formal remediation protocols. Far too few organizations currently have such a process.
TA K E A C T I O N
• Conduct annual data-driven pay equity analysis.
• Implement formal, global pay equity processes.
• Implement transparent compensation programs so that all employees understand why they are paid and what they are paid, and they will be less likely to leave because of uncertainty.
• Focus managers on equity, leading with a rigorous pay evaluation.
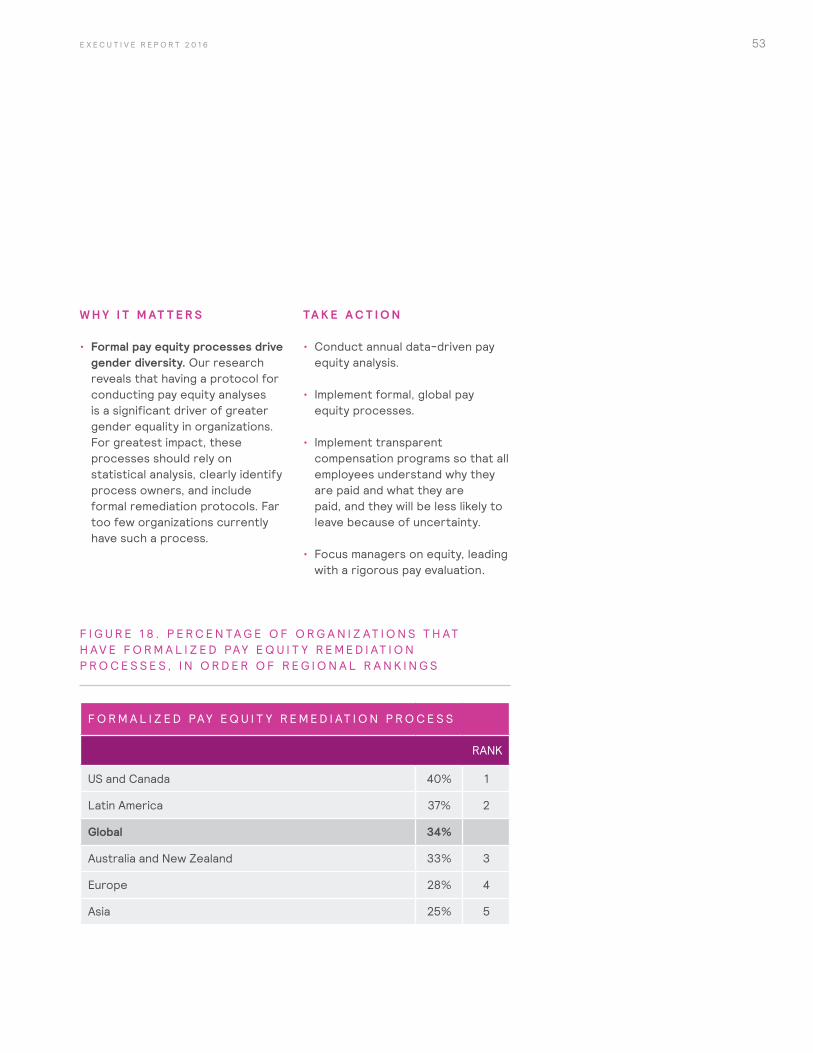
F I G U R E 1 8 . P E R C E N TA G E O F O R G A N I Z AT I O N S T H AT H AV E F O R M A L I Z E D PAY E Q U I T Y R E M E D I AT I O N P R O C E S S E S , I N O R D E R O F R E G I O N A L R A N K I N G S
F O R M A L I Z E D PAY E Q U I T Y R E M E D I AT I O N P R O C E S S
RANK
US and Canada 40% 1
Latin America 37% 2
Global 34%
Australia and New Zealand 33% 3
Europe 28% 4
Asia 25% 5
54 W H E N W O M E N T H R I V E , B U S I N E S S E S T H R I V E
W O M E N T H R I V E W H E N P R O M O T I O N A N D P E R F O R M A N C E - M A N A G E M E N T P R O C E S S E S I N C L U D E A G E N D E R L E N S
P R O C E S S E S T H AT A C T I V E LY S U P P O R T W O M E N
K E Y F I N D I N G S
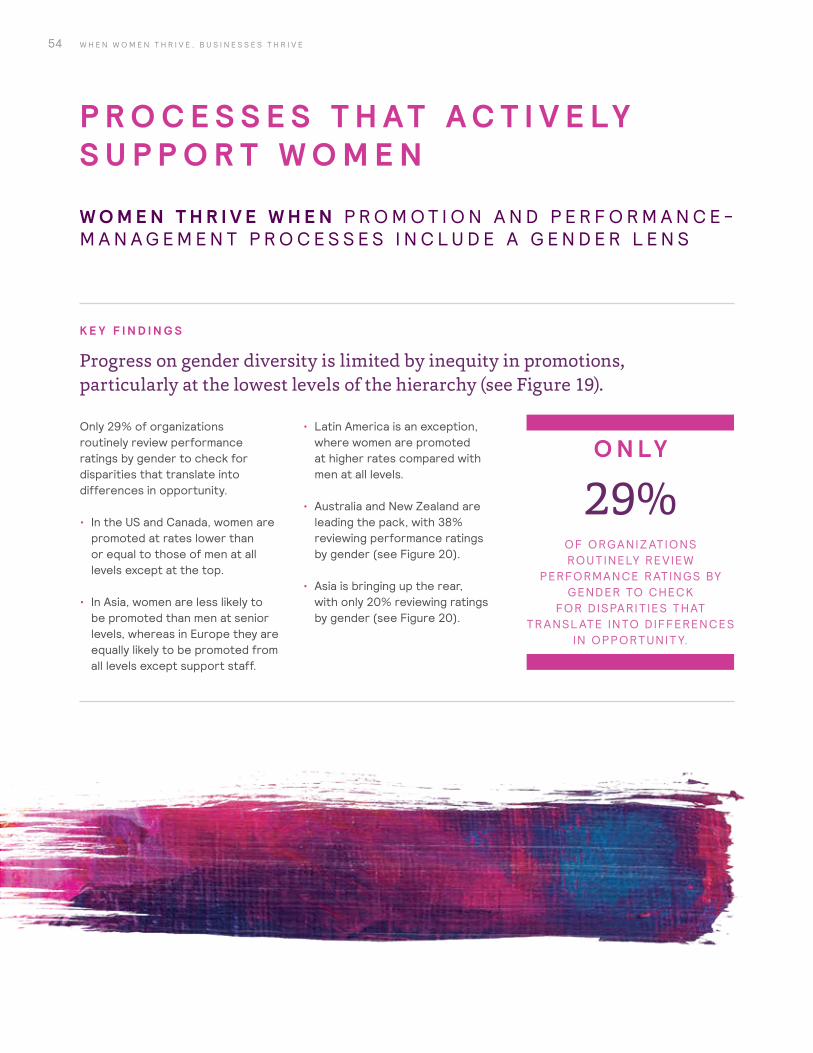
Progress on gender diversity is limited by inequity in promotions, particularly at the lowest levels of the hierarchy (see Figure 19).
Only 29% of organizations routinely review performance ratings by gender to check for disparities that translate into differences in opportunity.
• In the US and Canada, women are promoted at rates lower than or equal to those of men at all levels except at the top.
• In Asia, women are less likely to be promoted than men at senior levels, whereas in Europe they are equally likely to be promoted from all levels except support staff.
• Latin America is an exception, where women are promoted at higher rates compared with men at all levels.
• Australia and New Zealand are leading the pack, with 38% reviewing performance ratings by gender (see Figure 20).
• Asia is bringing up the rear, with only 20% reviewing ratings by gender (see Figure 20).
O N LY
29%
OF ORGANIZ ATIONS ROUTINELY REVIEW
PERFORMANCE RATINGS BY GENDER TO CHECK
FOR DISPARIT IES THAT TRANSL ATE INTO DIFFERENCES
IN OPPORTUNIT Y.

55E X E C U T I V E R E P O R T 2 0 1 6
F I G U R E 1 9 . D I F F E R E N C E S I N P R O M O T I O N R AT E S ( F E M A L E P R O M O T I O N R AT E % V S . M A L E P R O M O T I O N R AT E % ) , B Y L E V E L A N D R E G I O N
C A R E E R L E V E L
G L O B A L A S I AA U S T R A L I A
A N D N ZE U R O P E
L AT I N A M E R I C A
U S A N D C A N A D A
Senior Manager +1% -1% Equal Equal +5% +1%
Manager +1% -2% +6% Equal +1% -1%
Professional +1% Equal Equal Equal +2% Equal
Staff Equal Equal -2% -2% +2% -2%
F I G U R E 2 0 . P E R C E N TA G E O F O R G A N I Z AT I O N S T H AT A G R E E T H E Y R E V I E W P E R F O R M A N C E R AT I N G S B Y G E N D E R , I N O R D E R O F R E G I O N A L R A N K I N G
R E V I E W P E R F O R M A N C E R AT I N G S B Y G E N D E R
RANK
Australia and New Zealand 38% 1
Latin America 31% 2
US and Canada 30% 3
Global 29%
Europe 29% 4
Asia 20% 5
The table above compares the average promotion rate at each career level for women vs. men. For example, in Asia, the female senior manager promotion rate is 1 percentage point lower than the male promotion rate. Negative differences reflect areas where women are promoted at the lower rates, and “Equal” indicates that entries are similar by gender.
Female promotion rate % is higher than male promotion rate % Female promotion rate % is lower than male promotion rate %
56 W H E N W O M E N T H R I V E , B U S I N E S S E S T H R I V E
W H Y I T M AT T E R S
• Hiring more women is, in some sense, the easiest lever to pull in order to increase the representation of women. And in fact, this is where we see most organizations concentrating their efforts.
• A focus on building the female talent pipeline matters. Our data make clear that most organizations globally are not doing enough to promote women up through the organization — or to retain women at the top. Moreover, when organizations do focus on building diversity through promotions, they tend to focus that effort at the top. There is ample opportunity to consider equitable use of female talent from all levels of the hierarchy in building gender diversity.
TA K E A C T I O N
• Apply a gender lens to performance and developmental processes.
• Design development and leadership programs that are not limited to management and executive-level employees. Offer opportunities to more junior employees as well, preparing them to move up the career ladder.
• Consider what it takes to advance in your organization — ensure that all have opportunities to develop critical skills and rethink the “rules” associated with progression.
57E X E C U T I V E R E P O R T 2 0 1 6
W O M E N T H R I V E W H E N T H E I R U N I Q U E H E A LT H N E E D S A R E S U P P O R T E D
P R O G R A M S T H AT S U P P O R T W O M E N ’ S U N I Q U E N E E D S
K E Y F I N D I N G S
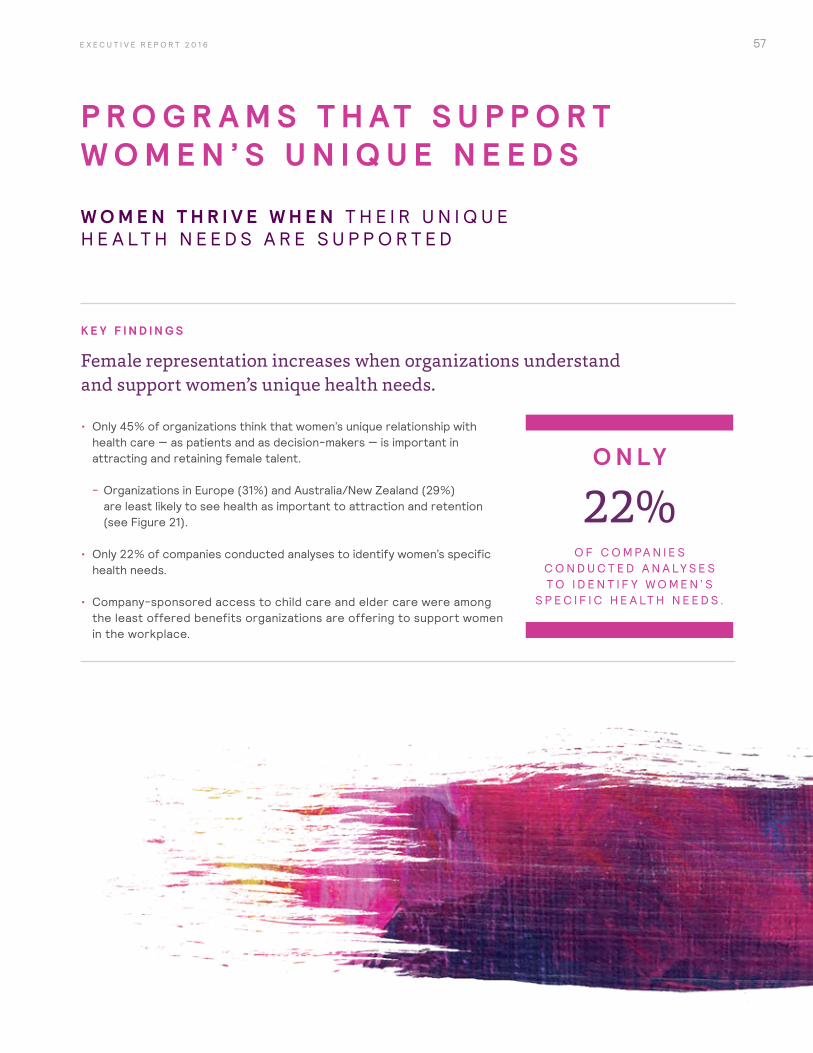
Female representation increases when organizations understand and support women’s unique health needs.
• Only 45% of organizations think that women’s unique relationship with health care — as patients and as decision-makers — is important in attracting and retaining female talent.
- Organizations in Europe (31%) and Australia/New Zealand (29%) are least likely to see health as important to attraction and retention (see Figure 21).
• Only 22% of companies conducted analyses to identify women’s specific health needs.
• Company-sponsored access to child care and elder care were among the least offered benefits organizations are offering to support women in the workplace.
O N LY
22%
O F C O M PA N I E S C O N D U C T E D A N A LY S E S T O I D E N T I F Y W O M E N ’ S
S P E C I F I C H E A LT H N E E D S .
58 W H E N W O M E N T H R I V E , B U S I N E S S E S T H R I V E
W H Y I T M AT T E R S
• Health is a critical driver of engagement and productivity. Poor physical and mental health can force an individual out of the workforce entirely or greatly diminish his or her ability to focus and perform. A 2013 Gallup report found that employees who are engaged in their jobs are generally in better health than employees who are not engaged.3 Employers have an enormous ability to influence how well-equipped women are to care for themselves and for others — and ultimately, on how healthy, productive, and engaged they are at work.
• Women have different health needs than men. Women are affected by different health issues and illnesses than men. They experience and use the health care system differently than men and are more likely than men to be caregivers for others.
• Women are significantly underdiagnosed and undertreated in important areas. For example, for the past 30 years, cardiovascular disease (CVD) has killed more
women than men in the US,4 and in low- and middle-income countries, women have experienced a higher proportion of deaths from CVD than men.5 Yet the misconception persists that heart attacks are more prevalent in men, and education on heart disease generally focuses on the symptoms that tend to present in men rather than those more commonly experienced by women. Likewise, women are more frequently affected than men by conditions such as autoimmune diseases and depressive disorders.6 Women also manifest diseases such as diabetes and lung cancer very differently from men, requiring that they understand their different risk factors, presenting symptoms, and indicated treatments.7
• Women as health care consumers and “decision-makers-in-chief.” In addition to being patients, women play primary roles as health care consumers and caretakers for their families — roles that require them to sort through a tremendous amount of health information and
misinformation and to make often stressful choices about spending and care. Women account for 80% of all health care consumer purchases8 and spend a greater share of their income on health care than men do. Data for one company with over 14,000 employees revealed that women spend roughly two to three times the share of their pay on health care that men do. Only 30% of organizations in our survey research are offering company-sponsored access to child care, and less than 15% are offering access to elder care (see Figure 14).9
• Women are typically in charge of arranging for the health care of, and for coping with, their family members’ illnesses. According to the Kaiser Family Foundation, 85% of mothers select their young children’s doctor, and 48% of full-time working women have to take time off work when their child is sick.10 Many late-career women care for older children as well as spouses and elderly parents.11
3 Gallup. State of the Global Workplace: Employee Engagement Insights for Business Leaders Worldwide, 2013.
4 American Heart Association. “Heart Disease Statistics at a Glance,” 2012, available at www.goredforwomen.org.
5 World Heart Foundation. “Cardiovascular Disease in Women,” 2012, available at www.world-heart-federation.org.
6 Jayasuriya A, MD, PhD. The Business Case for Women’s Health.
7 Ibid.
8 She-conomy.com. “Women and Spending,” available at http://she-conomy.com/report/marketing-to-women-quick-facts.
9 To protect client confidentiality, we are unable to disclose the source.
10 The Henry J. Kaiser Family Foundation. “Women’s Health Care Chartbook: Key Findings From the Kaiser Women’s Health Survey,” 2011, available at https://kaiserfamilyfoundation.files.wordpress.com/2013/01/8164.pdf.
11 Ibid.
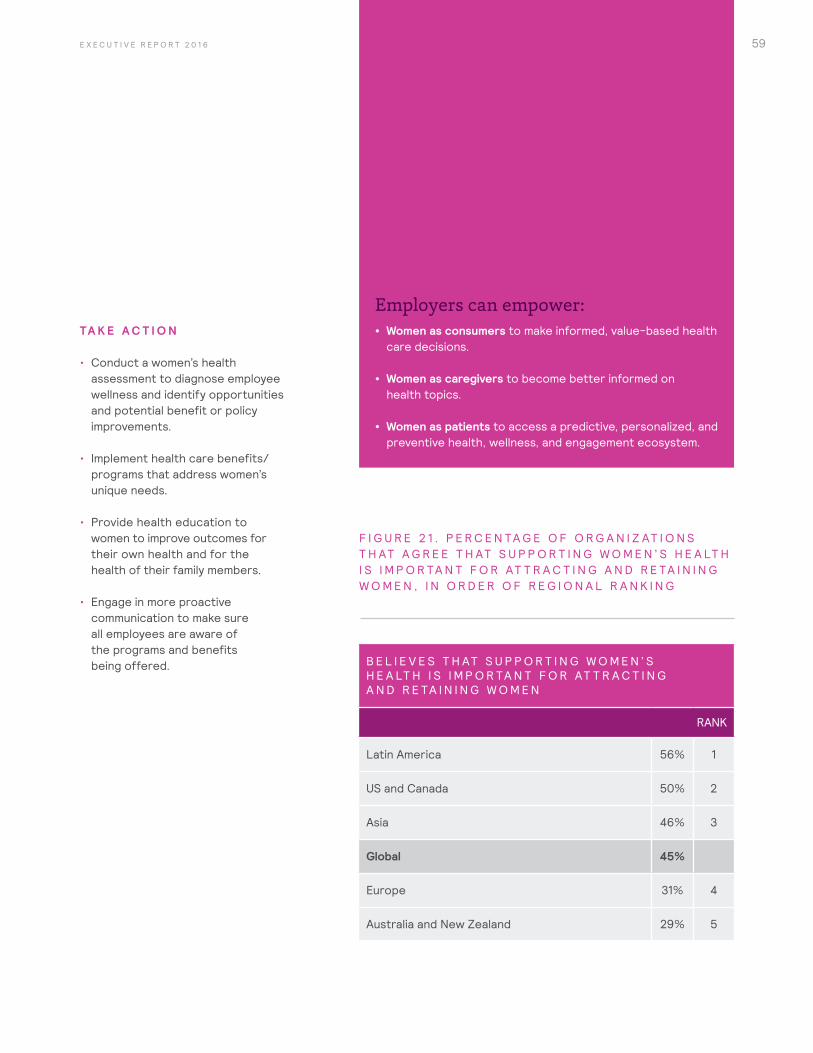
59E X E C U T I V E R E P O R T 2 0 1 6
TA K E A C T I O N
• Conduct a women’s health assessment to diagnose employee wellness and identify opportunities and potential benefit or policy improvements.
• Implement health care benefits/programs that address women’s unique needs.
• Provide health education to women to improve outcomes for their own health and for the health of their family members.
• Engage in more proactive communication to make sure all employees are aware of the programs and benefits being offered.
Employers can empower: • Women as consumers to make informed, value-based health
care decisions.
• Women as caregivers to become better informed on health topics.
• Women as patients to access a predictive, personalized, and preventive health, wellness, and engagement ecosystem.
F I G U R E 2 1 . P E R C E N TA G E O F O R G A N I Z AT I O N S T H AT A G R E E T H AT S U P P O R T I N G W O M E N ’ S H E A LT H I S I M P O R TA N T F O R AT T R A C T I N G A N D R E TA I N I N G W O M E N , I N O R D E R O F R E G I O N A L R A N K I N G
B E L I E V E S T H AT S U P P O R T I N G W O M E N ’ S H E A LT H I S I M P O R TA N T F O R AT T R A C T I N G A N D R E TA I N I N G W O M E N
RANK
Latin America 56% 1
US and Canada 50% 2
Asia 46% 3
Global 45%
Europe 31% 4
Australia and New Zealand 29% 5

60 W H E N W O M E N T H R I V E , B U S I N E S S E S T H R I V E
W O M E N T H R I V E W H E N T H E I R U N I Q U E F I N A N C I A L N E E D S A R E S U P P O R T E D
P R O G R A M S T H AT S U P P O R T W O M E N ’ S U N I Q U E N E E D S
K E Y F I N D I N G S
Gender-specific financial wellness practices drive better future representation of women.
But most organizations fail to implement these high-impact solutions:
• Less than 10% of organizations offer retirement, savings, and education programs that are customized for different genders, or monitor savings ratios and investment choices by gender.
- Organizations in Asia (5%) and Australia/New Zealand (4%) are least likely to customize retirement and savings programs for different genders’ needs and behaviors (see Figure 22).
• Only 27% of organizations say their main retirement/savings program addresses different work options such as part-time work or gaps in service.
O N LY
29%
OF ORGANIZATIONS SAY THEIR MAIN RETIREMENT/SAVINGS
PROGRAM HELPS EMPLOYEES MANAGE THE FINANCIAL WELL-BEING OF THEIR DEPENDENTS.

Using Business Resource Groups to Improve Financial Outcomes for WomenOur own Women@Mercer is leading the way through offering employee meetings devoted to financial topics. These meetings have increased women’s awareness of benefits offered and have positively influenced savings and investment behaviors.
F I G U R E 2 2 . P E R C E N TA G E O F O R G A N I Z AT I O N S T H AT C U S T O M I Z E R E T I R E M E N T A N D S AV I N G S P R O G R A M S B Y G E N D E R , I N O R D E R O F R E G I O N A L R A N K I N G
C U S T O M I Z E R E T I R E M E N T/ S AV I N G S P R O G R A M S B Y G E N D E R
RANK
US and Canada 14% 1
Global 9%
Latin America 9% 2
Europe 7% 3
Asia 5% 4
Australia and New Zealand 4% 5
61
12 UN Women. Progress of the World’s Women 2015–2016 Summary, 2015, available at http://progress.unwomen.org/en/2015/pdf/SUMMARY.pdf.
13 Nasdaq, 2013.
62
W H Y I T M AT T E R S
• Women face a “perfect storm” financially. On average, women work in lower-paid employment with more gaps in service and more part-time employment than men. Globally, the gender pay gap stands at 24%, varying from 19% in Latin America to 23% in the developed world and 33% in South Asia.12 At the same time, women are more risk-averse investors,13 impacting the amount of money they are able to accumulate for retirement, which typically lasts longer than men’s.
• Most retirement products are designed for men and don’t reflect women’s divergent needs. When designing plans, companies make assumptions about the typical employee’s work history and earnings — assumptions that turn out to be based on the average male employee and don’t represent the more heterogeneous experiences of women.
• When financial education is available, women are more likely than men to engage and to share what they learn with others. Better education can not only improve financial outcomes for women and their families, but also increase employee engagement and retention by offering something that women value.
TA K E A C T I O N
• Conduct a comprehensive financial wellness assessment through a gender lens.
• Apply a gender lens in segmenting the workforce to look for discrepancies in retirement plan participation rates, funds selected, and fund balances.
• Develop retirement solutions geared toward different genders’ behaviors, attitudes, and needs.
• Design and deliver tailored financial education to women to help them make the right investment decisions.
• Provide hands-on training on available technology and tools.
• Leverage business resource groups to bring women together so they can share information about how they’re using benefits.
W H E N W O M E N T H R I V E , B U S I N E S S E S T H R I V E
63E X E C U T I V E R E P O R T 2 0 1 6
64 W H E N W O M E N T H R I V E , B U S I N E S S E S T H R I V E
S E C T I O N 3 : W H E N W I L L W O M E N T H R I V E ? P R O G R E S S A N D O P P O R T U N I T E S B Y R E G I O N
65E X E C U T I V E R E P O R T 2 0 1 6
A R E W O M E N T H R I V I N G I N A S I A ?
A focus on increasing representation at the top will not help Asia move out of last place when it comes to overall female representation in 2025.
G O O D N E W S
• Hire rates for women at the top of the organization are over double the rates for men (see Figure 23).
• Retention rates for women at the top of the organization are also strong, with women two to three times more likely to stay than men (see Figure 23).
O P P O R T U N I T I E S F O R I M P R O V E M E N T
• Female representation at all career levels is below the global average (see Figures 8 and 23).
• In the average company, women make up only 25% of those at the professional level and above (see Figure 25).
• Women are less likely than men to be promoted up through the organization (see Figure 23).
• If current hiring, promotion, and retention rates stay constant, female representation will reach only 28% at both the executive level and the professional level and above by 2025 (see Figures 24 and 25).
• Organizations in Asia are much less likely than in other regions to review performance rating by gender (see Figure 26).
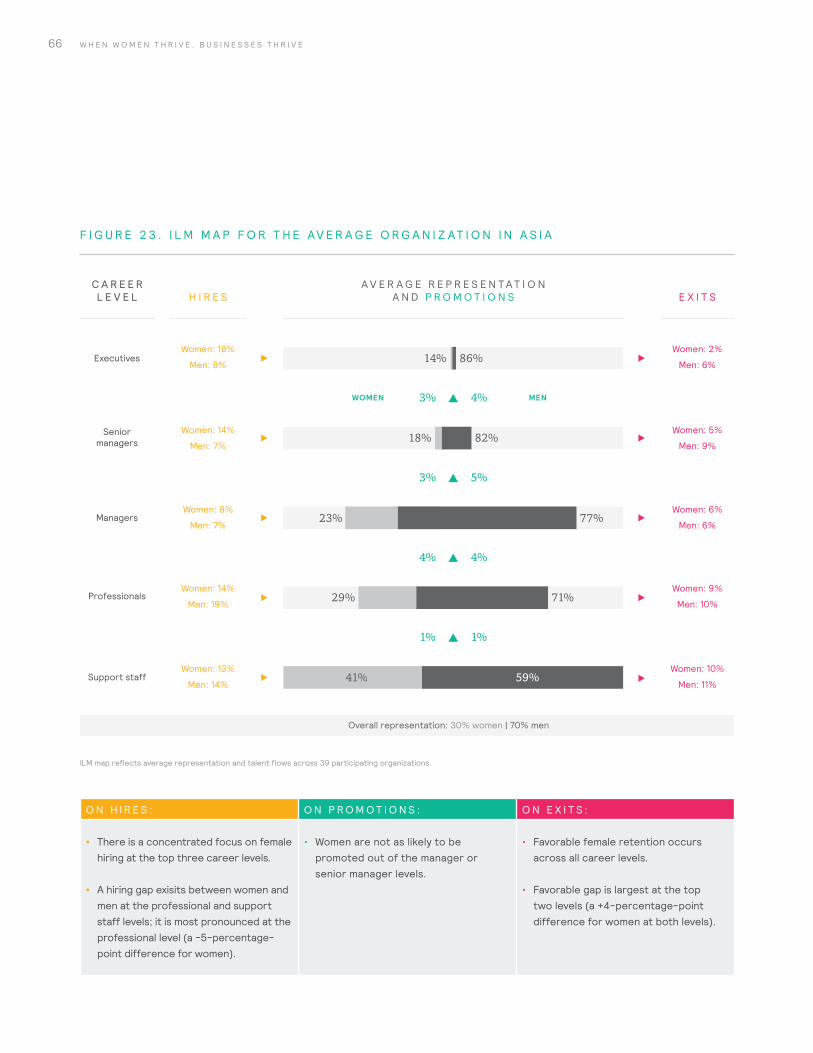
66 W H E N W O M E N T H R I V E , B U S I N E S S E S T H R I V E
O N H I R E S : O N P R O M O T I O N S : O N E X I T S :
• There is a concentrated focus on female hiring at the top three career levels.
• A hiring gap exisits between women and men at the professional and support staff levels; it is most pronounced at the professional level (a -5-percentage-point difference for women).
• Women are not as likely to be promoted out of the manager or senior manager levels.
• Favorable female retention occurs across all career levels.
• Favorable gap is largest at the top two levels (a +4-percentage-point difference for women at both levels).
F I G U R E 2 3 . I L M M A P F O R T H E AV E R A G E O R G A N I Z AT I O N I N A S I A
Seniormanagers
Support staff
Professionals
Managers
Executives
H I R E S
C A R E E R L E V E L
Overall representation: 30% women | 70% men
Women: 18%
Men: 8%
Women: 14%
Men: 7%
Women: 8%
Men: 7%
Women: 14%
Men: 19%
Women: 13%
Men: 14%
Women: 2%
Men: 6%
Women: 5%
Men: 9%
Women: 6%
Men: 6%
Women: 9%
Men: 10%
Women: 10%
Men: 11%
14% 86%
18%
23%
82%
77%
29% 71%
41% 59%
3% 5%
4% 4%
1% 1%
3% 4%WOMEN MEN
E X I T S
A V E R A G E R E P R E S E N T A T I O N A N D P R O M O T I O N S
ILM map reflects average representation and talent flows across 39 participating organizations.
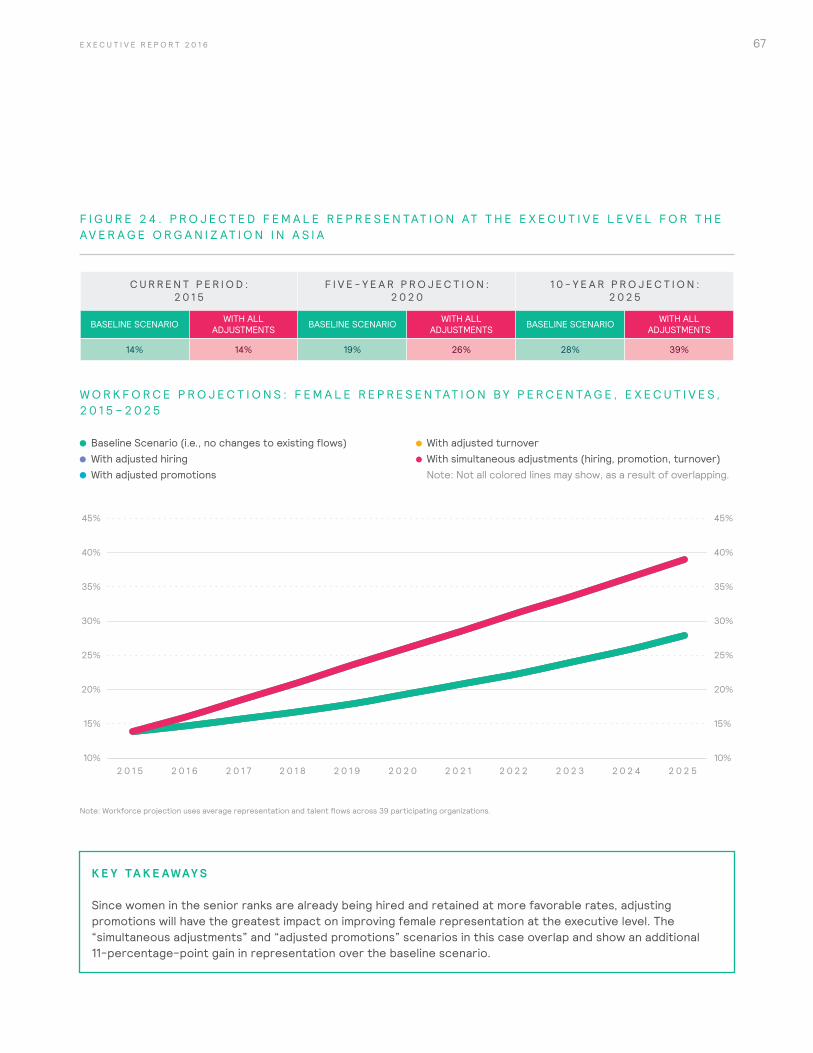
67E X E C U T I V E R E P O R T 2 0 1 6
F I G U R E 2 4 . P R O J E C T E D F E M A L E R E P R E S E N TAT I O N AT T H E E X E C U T I V E L E V E L F O R T H E AV E R A G E O R G A N I Z AT I O N I N A S I A
W O R K F O R C E P R O J E C T I O N S : F E M A L E R E P R E S E N TAT I O N B Y P E R C E N TA G E , E X E C U T I V E S , 2 0 1 5 – 2 0 2 5
10%
20%
15%
25%
35%
45%
30%
40%
Note: Workforce projection uses average representation and talent flows across 350 participating organizations.
10%
20%
15%
25%
35%
45%
30%
40%
2 0 1 5 2 0 1 6 2 0 1 7 2 0 1 8 2 0 1 9 2 0 2 0 2 0 2 1 2 0 2 2 2 0 2 3 2 0 2 4 2 0 2 5
C U R R E N T P E R I O D : 2 0 1 5
F I V E - Y E A R P R O J E C T I O N : 2 0 2 0
1 0 - Y E A R P R O J E C T I O N : 2 0 2 5
BASELINE SCENARIO WITH ALL ADJUSTMENTS BASELINE SCENARIO WITH ALL
ADJUSTMENTS BASELINE SCENARIO WITH ALL ADJUSTMENTS
14% 14% 19% 26% 28% 39%
Note: Workforce projection uses average representation and talent flows across 39 participating organizations.
Baseline Scenario (i.e., no changes to existing flows) With adjusted hiring With adjusted promotions
With adjusted turnover With simultaneous adjustments (hiring, promotion, turnover) Note: Not all colored lines may show, as a result of overlapping.
K E Y TA K E AWAY S
Since women in the senior ranks are already being hired and retained at more favorable rates, adjusting promotions will have the greatest impact on improving female representation at the executive level. The “simultaneous adjustments” and “adjusted promotions” scenarios in this case overlap and show an additional 11-percentage-point gain in representation over the baseline scenario.

68 W H E N W O M E N T H R I V E , B U S I N E S S E S T H R I V E
F I G U R E 2 5 . P R O J E C T E D F E M A L E R E P R E S E N TAT I O N AT T H E P R O F E S S I O N A L L E V E L A N D A B O V E F O R T H E AV E R A G E O R G A N I Z AT I O N I N A S I A
W O R K F O R C E P R O J E C T I O N S : F E M A L E R E P R E S E N TAT I O N B Y P E R C E N TA G E , P R O F E S S I O N A L L E V E L A N D A B O V E , 2 0 1 5 – 2 0 2 5
C U R R E N T P E R I O D : 2 0 1 5
F I V E - Y E A R P R O J E C T I O N : 2 0 2 0
1 0 - Y E A R P R O J E C T I O N : 2 0 2 5
BASELINE SCENARIO WITH ALL ADJUSTMENTS BASELINE SCENARIO WITH ALL
ADJUSTMENTS BASELINE SCENARIO WITH ALL ADJUSTMENTS
25% 25% 26% 29% 28% 33%
20%
25%
35%
30%
20%
25%
30%
35%
2 0 1 5 2 0 1 6 2 0 1 7 2 0 1 8 2 0 1 9 2 0 2 0 2 0 2 1 2 0 2 2 2 0 2 3 2 0 2 4 2 0 2 5
Note: Workforce projection uses average representation and talent flows across 39 participating organizations.
Baseline Scenario (i.e., no changes to existing flows) With adjusted hiring With adjusted promotions
With adjusted turnover With simultaneous adjustments (hiring, promotion, turnover) Note: Not all colored lines may show, as a result of overlapping.
K E Y TA K E AWAY S
More broadly across career levels, the scenario with greatest impact appears to be adjusting hires — improving the attraction of female talent into the professional level and above.
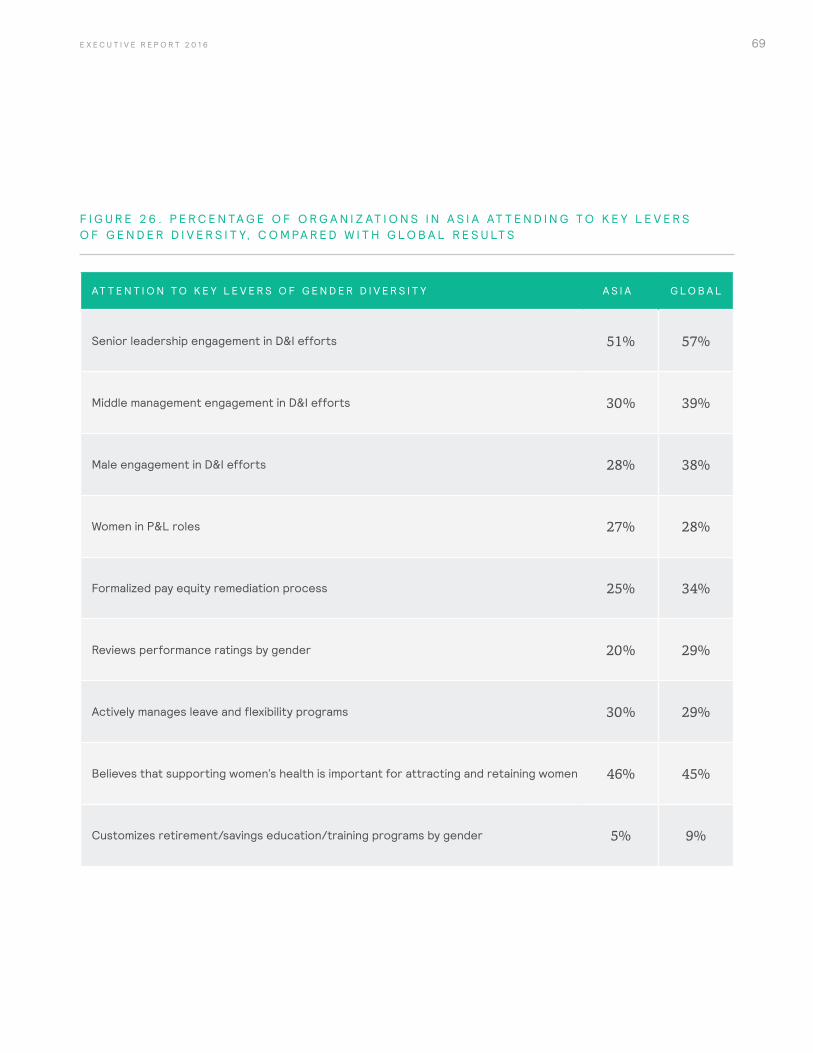
69E X E C U T I V E R E P O R T 2 0 1 6
F I G U R E 2 6 . P E R C E N TA G E O F O R G A N I Z AT I O N S I N A S I A AT T E N D I N G T O K E Y L E V E R S O F G E N D E R D I V E R S I T Y, C O M PA R E D W I T H G L O B A L R E S U LT S
AT T E N T I O N T O K E Y L E V E R S O F G E N D E R D I V E R S I T Y A S I A G L O B A L
Senior leadership engagement in D&I efforts 51% 57%
Middle management engagement in D&I efforts 30% 39%
Male engagement in D&I efforts 28% 38%
Women in P&L roles 27% 28%
Formalized pay equity remediation process 25% 34%
Reviews performance ratings by gender 20% 29%
Actively manages leave and flexibility programs 30% 29%
Believes that supporting women’s health is important for attracting and retaining women 46% 45%
Customizes retirement/savings education/training programs by gender 5% 9%
70 W H E N W O M E N T H R I V E , B U S I N E S S E S T H R I V E
A R E W O M E N T H R I V I N G I N E U R O P E ?
Despite growth in female representation at top levels, European organizations are not on track to improve female representation over the next decade.
G O O D N E W S
• The future trajectory for female executives in Europe has improved over 2014 data.
• Hire rates for women at the top of the organization are almost double those for men (see Figure 27).
• Thought it is still very low, at 21%, European organizations have one of the highest representations of women at the executive level (see Figure 27).
O P P O R T U N I T I E S F O R I M P R O V E M E N T
• The focus on boosting female representation at top levels has not extended to lower levels of the career hierarchy, and women in the senior ranks are more likely to quit.
• If current hiring, promotion, and retention rates stay constant, women will account for only 33% of executives in the average European organization by 2025 (see Figure 28).
• Women at the top of the organization are leaving at a higher rate than men (see Figure 27).
• If talent flows stay constant, projections show no improvement in female representation at the professional level and above by 2025 (see Figure 29).
• Women in Europe are much less likely than in other regions to be as well-represented in P&L roles as in functional ones (see Figure 30).
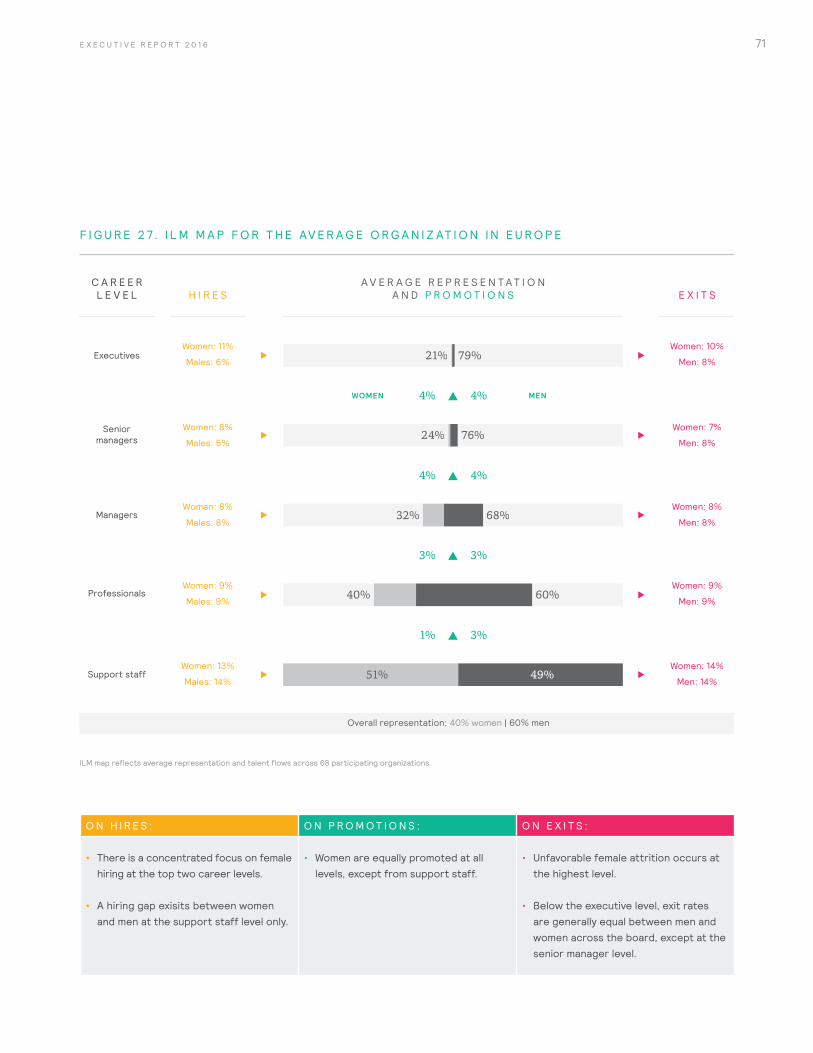
71E X E C U T I V E R E P O R T 2 0 1 6
O N H I R E S : O N P R O M O T I O N S : O N E X I T S :
• There is a concentrated focus on female hiring at the top two career levels.
• A hiring gap exisits between women and men at the support staff level only.
• Women are equally promoted at all levels, except from support staff.
• Unfavorable female attrition occurs at the highest level.
• Below the executive level, exit rates are generally equal between men and women across the board, except at the senior manager level.
F I G U R E 2 7 . I L M M A P F O R T H E AV E R A G E O R G A N I Z AT I O N I N E U R O P E
Overall representation: 40% women | 60% men
Women: 11%
Males: 6%
Women: 8%
Males: 5%
Women: 8%
Males: 8%
Women: 9%
Males: 9%
Women: 13%
Males: 14%
Women: 10%
Men: 8%
Women: 7%
Men: 8%
Women: 8%
Men: 8%
Women: 9%
Men: 9%
Women: 14%
Men: 14%
21% 79%
24%
32%
76%
68%
40% 60%
51% 49%
4% 4%
3% 3%
1% 3%
4% 4%
Seniormanagers
Support staff
Professionals
Managers
Executives
H I R E SC A R E E R L E V E L
WOMEN MEN
E X I T SA V E R A G E R E P R E S E N T A T I O N
A N D P R O M O T I O N S
ILM map reflects average representation and talent flows across 68 participating organizations.
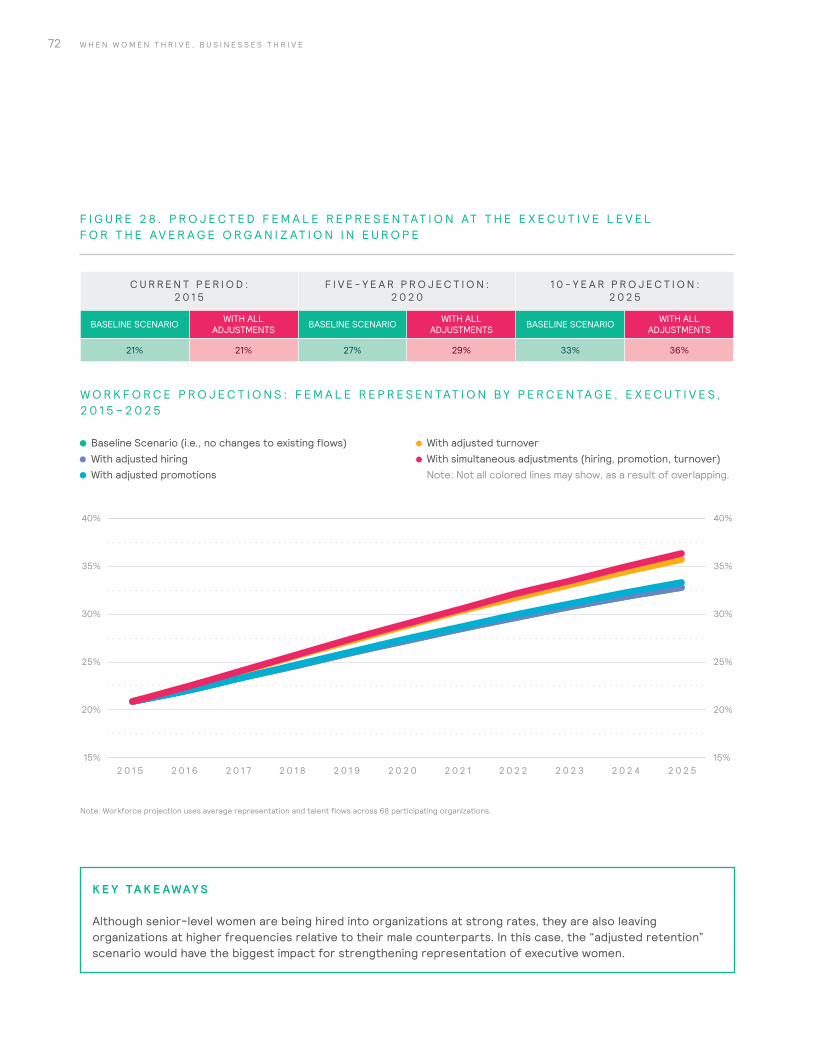
72 W H E N W O M E N T H R I V E , B U S I N E S S E S T H R I V E
C U R R E N T P E R I O D : 2 0 1 5
F I V E - Y E A R P R O J E C T I O N : 2 0 2 0
1 0 - Y E A R P R O J E C T I O N : 2 0 2 5
BASELINE SCENARIO WITH ALL ADJUSTMENTS BASELINE SCENARIO WITH ALL
ADJUSTMENTS BASELINE SCENARIO WITH ALL ADJUSTMENTS
21% 21% 27% 29% 33% 36%
F I G U R E 2 8 . P R O J E C T E D F E M A L E R E P R E S E N TAT I O N AT T H E E X E C U T I V E L E V E L F O R T H E AV E R A G E O R G A N I Z AT I O N I N E U R O P E
W O R K F O R C E P R O J E C T I O N S : F E M A L E R E P R E S E N TAT I O N B Y P E R C E N TA G E , E X E C U T I V E S , 2 0 1 5 – 2 0 2 5
Note: Workforce projection uses average representation and talent flows across 68 participating organizations.
15%
20%
25%
35%
30%
40%
15%
20%
25%
35%
30%
40%
2 0 1 5 2 0 1 6 2 0 1 7 2 0 1 8 2 0 1 9 2 0 2 0 2 0 2 1 2 0 2 2 2 0 2 3 2 0 2 4 2 0 2 5
Baseline Scenario (i.e., no changes to existing flows) With adjusted hiring With adjusted promotions
With adjusted turnover With simultaneous adjustments (hiring, promotion, turnover) Note: Not all colored lines may show, as a result of overlapping.
K E Y TA K E AWAY S
Although senior-level women are being hired into organizations at strong rates, they are also leaving organizations at higher frequencies relative to their male counterparts. In this case, the “adjusted retention” scenario would have the biggest impact for strengthening representation of executive women.
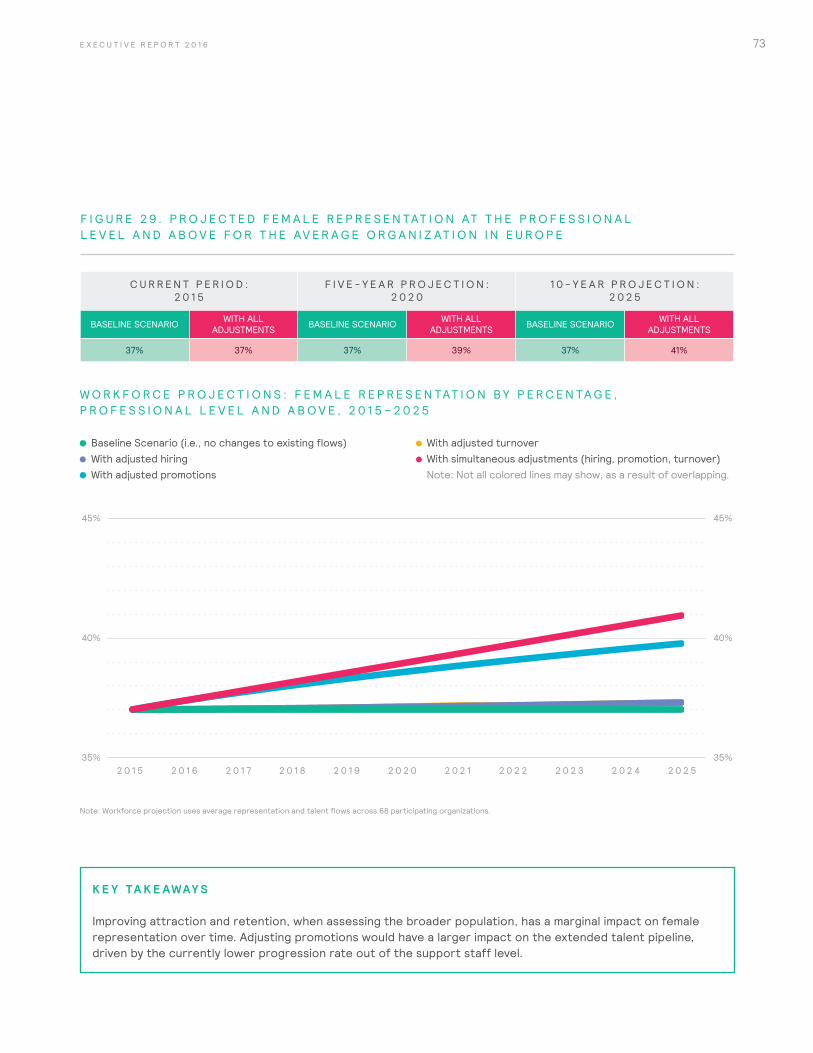
73E X E C U T I V E R E P O R T 2 0 1 6
C U R R E N T P E R I O D : 2 0 1 5
F I V E - Y E A R P R O J E C T I O N : 2 0 2 0
1 0 - Y E A R P R O J E C T I O N : 2 0 2 5
BASELINE SCENARIO WITH ALL ADJUSTMENTS BASELINE SCENARIO WITH ALL
ADJUSTMENTS BASELINE SCENARIO WITH ALL ADJUSTMENTS
37% 37% 37% 39% 37% 41%
35%
40%
45%
35%
40%
45%
2 0 1 5 2 0 1 6 2 0 1 7 2 0 1 8 2 0 1 9 2 0 2 0 2 0 2 1 2 0 2 2 2 0 2 3 2 0 2 4 2 0 2 5
F I G U R E 2 9 . P R O J E C T E D F E M A L E R E P R E S E N TAT I O N AT T H E P R O F E S S I O N A L L E V E L A N D A B O V E F O R T H E AV E R A G E O R G A N I Z AT I O N I N E U R O P E
W O R K F O R C E P R O J E C T I O N S : F E M A L E R E P R E S E N TAT I O N B Y P E R C E N TA G E , P R O F E S S I O N A L L E V E L A N D A B O V E , 2 0 1 5 – 2 0 2 5
Note: Workforce projection uses average representation and talent flows across 68 participating organizations.
Baseline Scenario (i.e., no changes to existing flows) With adjusted hiring With adjusted promotions
With adjusted turnover With simultaneous adjustments (hiring, promotion, turnover) Note: Not all colored lines may show, as a result of overlapping.
K E Y TA K E AWAY S
Improving attraction and retention, when assessing the broader population, has a marginal impact on female representation over time. Adjusting promotions would have a larger impact on the extended talent pipeline, driven by the currently lower progression rate out of the support staff level.
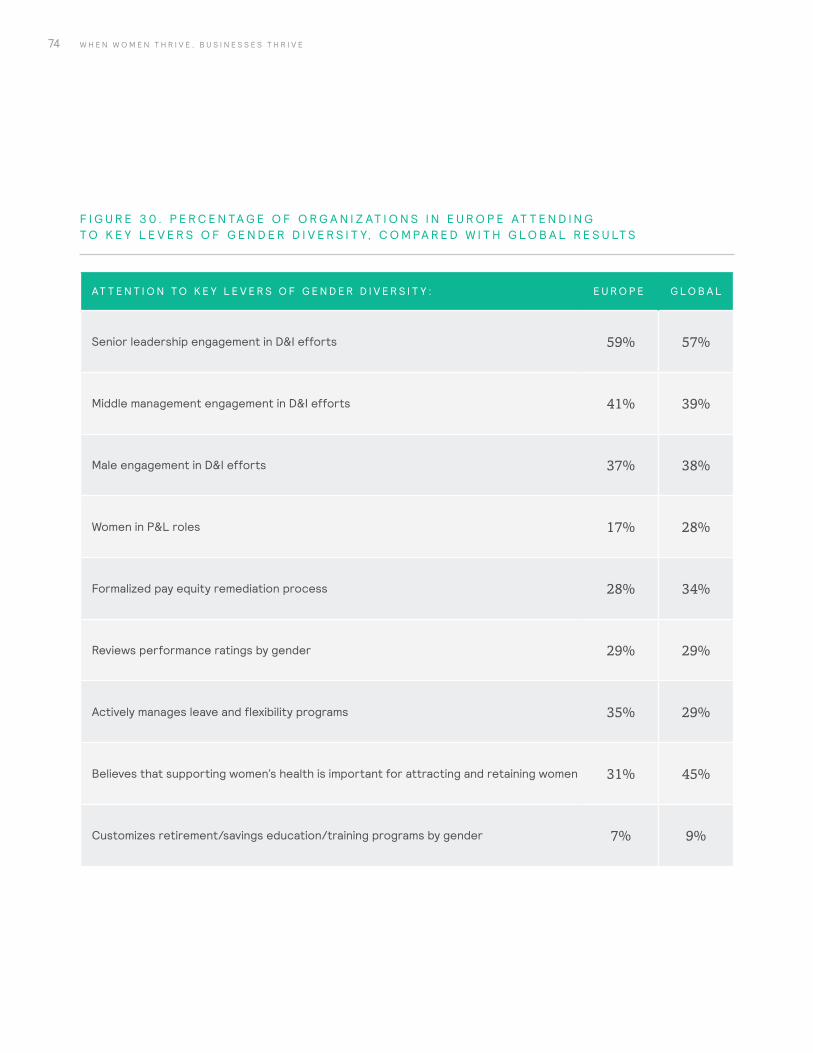
74 W H E N W O M E N T H R I V E , B U S I N E S S E S T H R I V E
F I G U R E 3 0 . P E R C E N TA G E O F O R G A N I Z AT I O N S I N E U R O P E AT T E N D I N G T O K E Y L E V E R S O F G E N D E R D I V E R S I T Y, C O M PA R E D W I T H G L O B A L R E S U LT S
AT T E N T I O N T O K E Y L E V E R S O F G E N D E R D I V E R S I T Y : E U R O P E G L O B A L
Senior leadership engagement in D&I efforts 59% 57%
Middle management engagement in D&I efforts 41% 39%
Male engagement in D&I efforts 37% 38%
Women in P&L roles 17% 28%
Formalized pay equity remediation process 28% 34%
Reviews performance ratings by gender 29% 29%
Actively manages leave and flexibility programs 35% 29%
Believes that supporting women’s health is important for attracting and retaining women 31% 45%
Customizes retirement/savings education/training programs by gender 7% 9%
75
A R E W O M E N T H R I V I N G I N L AT I N A M E R I C A ?
G O O D N E W S :
• Latin America is the only region on track to reach gender parity at the professional level and above by 2025 (see Figure 33).
• Though women account for 17% of executives today, they are projected to account for 44% of executives in 2025, given current patterns of hiring, promotion, and retention (see Figure 32).
• Hire rates for women are higher than for men across the organization, except at the manager level (see Figure 31).
• Women are more likely than men to be promoted from every level — and twice as likely to be promoted from the senior manager level (see Figure 31).
• Retention rates for women at all levels of the organization are equal to or higher than for men, except at the top level (see Figure 31).
• 51% of organizations report that middle management is engaged in D&I efforts — a much higher percentage than in other regions (see Figure 34).
• Organizations in Latin America agree that their women are equally represented in P&L and functional roles (48%) — higher than in any other region (see Figure 34).
O P P O R T U N I T I E S F O R I M P R O V E M E N T :
• Hire rates for women at the manager level are 2 percentage points lower than for men (see Figure 31).
• Exit rates for women at the executive level are 4 percentage points higher than for men (see Figure 31).
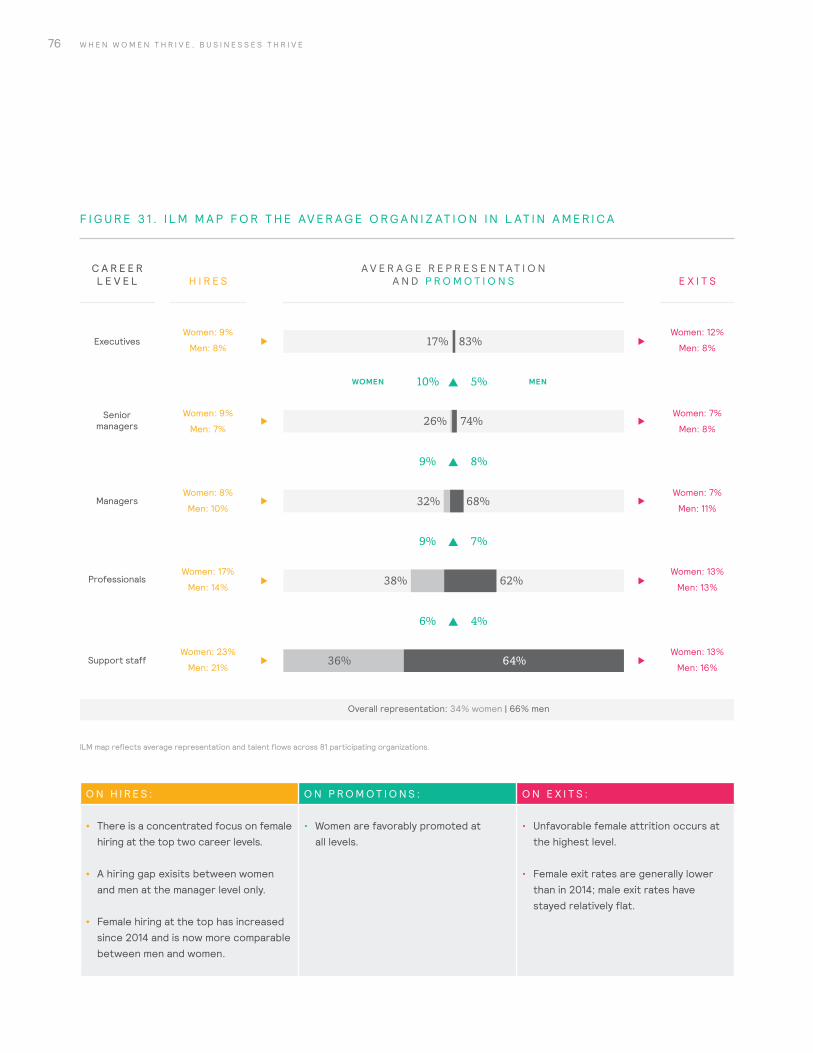
76 W H E N W O M E N T H R I V E , B U S I N E S S E S T H R I V E
O N H I R E S : O N P R O M O T I O N S : O N E X I T S :
• There is a concentrated focus on female hiring at the top two career levels.
• A hiring gap exisits between women and men at the manager level only.
• Female hiring at the top has increased since 2014 and is now more comparable between men and women.
• Women are favorably promoted at all levels.
• Unfavorable female attrition occurs at the highest level.
• Female exit rates are generally lower than in 2014; male exit rates have stayed relatively flat.
F I G U R E 3 1 . I L M M A P F O R T H E AV E R A G E O R G A N I Z AT I O N I N L AT I N A M E R I C A
Overall representation: 34% women | 66% men
Women: 9%
Men: 8%
Women: 9%
Men: 7%
Women: 8%
Men: 10%
Women: 17%
Men: 14%
Women: 23%
Men: 21%
Women: 12%
Men: 8%
Women: 7%
Men: 8%
Women: 7%
Men: 11%
Women: 13%
Men: 13%
Women: 13%
Men: 16%
17% 83%
26%
32%
74%
68%
38% 62%
36% 64%
9% 8%
9% 7%
6% 4%
10% 5%
Seniormanagers
Support staff
Professionals
Managers
Executives
H I R E S
C A R E E R L E V E L
WOMEN MEN
E X I T SA V E R A G E R E P R E S E N T A T I O N
A N D P R O M O T I O N S
ILM map reflects average representation and talent flows across 81 participating organizations.
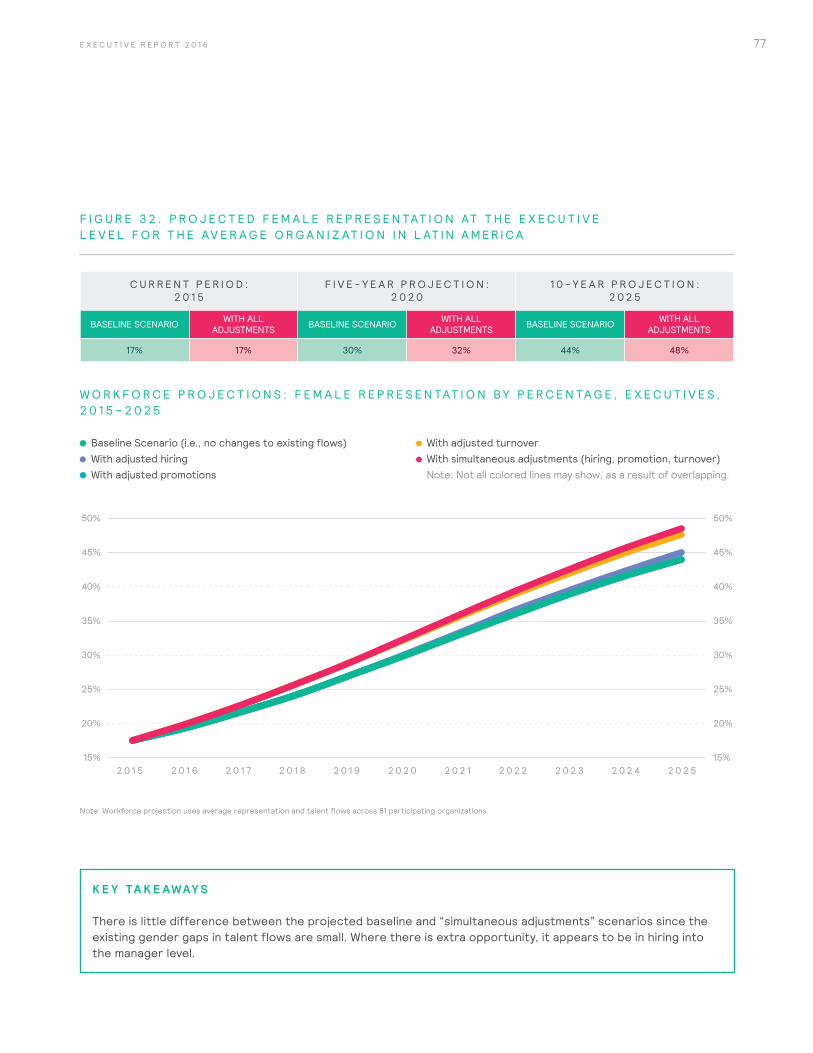
77E X E C U T I V E R E P O R T 2 0 1 6
C U R R E N T P E R I O D : 2 0 1 5
F I V E - Y E A R P R O J E C T I O N : 2 0 2 0
1 0 - Y E A R P R O J E C T I O N : 2 0 2 5
BASELINE SCENARIO WITH ALL ADJUSTMENTS BASELINE SCENARIO WITH ALL
ADJUSTMENTS BASELINE SCENARIO WITH ALL ADJUSTMENTS
17% 17% 30% 32% 44% 48%
15%
20%
25%
35%
30%
50%
45%
40%
15%
20%
25%
35%
30%
50%
45%
40%
2 0 1 5 2 0 1 6 2 0 1 7 2 0 1 8 2 0 1 9 2 0 2 0 2 0 2 1 2 0 2 2 2 0 2 3 2 0 2 4 2 0 2 5
F I G U R E 3 2 . P R O J E C T E D F E M A L E R E P R E S E N TAT I O N AT T H E E X E C U T I V E L E V E L F O R T H E AV E R A G E O R G A N I Z AT I O N I N L AT I N A M E R I C A
W O R K F O R C E P R O J E C T I O N S : F E M A L E R E P R E S E N TAT I O N B Y P E R C E N TA G E , E X E C U T I V E S , 2 0 1 5 – 2 0 2 5
Note: Workforce projection uses average representation and talent flows across 81 participating organizations.
Baseline Scenario (i.e., no changes to existing flows) With adjusted hiring With adjusted promotions
With adjusted turnover With simultaneous adjustments (hiring, promotion, turnover) Note: Not all colored lines may show, as a result of overlapping.
K E Y TA K E AWAY S
There is little difference between the projected baseline and “simultaneous adjustments” scenarios since the existing gender gaps in talent flows are small. Where there is extra opportunity, it appears to be in hiring into the manager level.
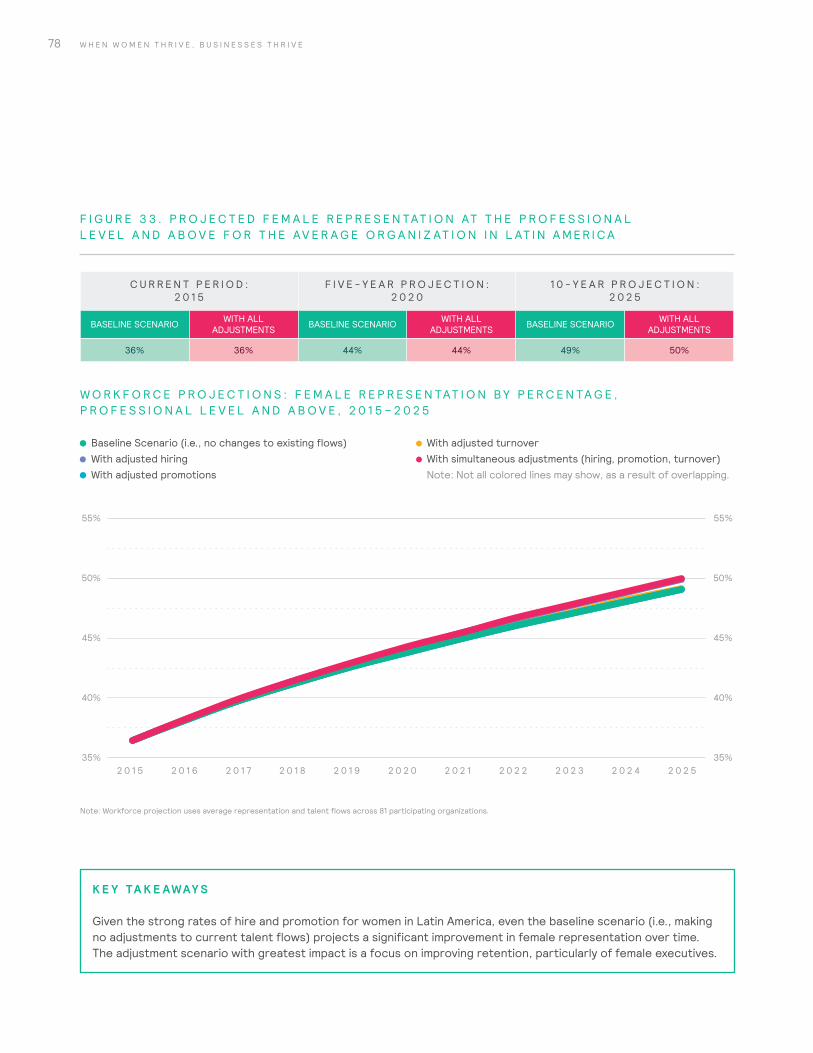
78 W H E N W O M E N T H R I V E , B U S I N E S S E S T H R I V E
C U R R E N T P E R I O D : 2 0 1 5
F I V E - Y E A R P R O J E C T I O N : 2 0 2 0
1 0 - Y E A R P R O J E C T I O N : 2 0 2 5
BASELINE SCENARIO WITH ALL ADJUSTMENTS BASELINE SCENARIO WITH ALL
ADJUSTMENTS BASELINE SCENARIO WITH ALL ADJUSTMENTS
36% 36% 44% 44% 49% 50%
35%
40%
55%
50%
45%
35%
55%
45%
50%
40%
2 0 1 5 2 0 1 6 2 0 1 7 2 0 1 8 2 0 1 9 2 0 2 0 2 0 2 1 2 0 2 2 2 0 2 3 2 0 2 4 2 0 2 5
F I G U R E 3 3 . P R O J E C T E D F E M A L E R E P R E S E N TAT I O N AT T H E P R O F E S S I O N A L L E V E L A N D A B O V E F O R T H E AV E R A G E O R G A N I Z AT I O N I N L AT I N A M E R I C A
W O R K F O R C E P R O J E C T I O N S : F E M A L E R E P R E S E N TAT I O N B Y P E R C E N TA G E , P R O F E S S I O N A L L E V E L A N D A B O V E , 2 0 1 5 – 2 0 2 5
Note: Workforce projection uses average representation and talent flows across 81 participating organizations.
Baseline Scenario (i.e., no changes to existing flows) With adjusted hiring With adjusted promotions
With adjusted turnover With simultaneous adjustments (hiring, promotion, turnover) Note: Not all colored lines may show, as a result of overlapping.
K E Y TA K E AWAY S
Given the strong rates of hire and promotion for women in Latin America, even the baseline scenario (i.e., making no adjustments to current talent flows) projects a significant improvement in female representation over time. The adjustment scenario with greatest impact is a focus on improving retention, particularly of female executives.
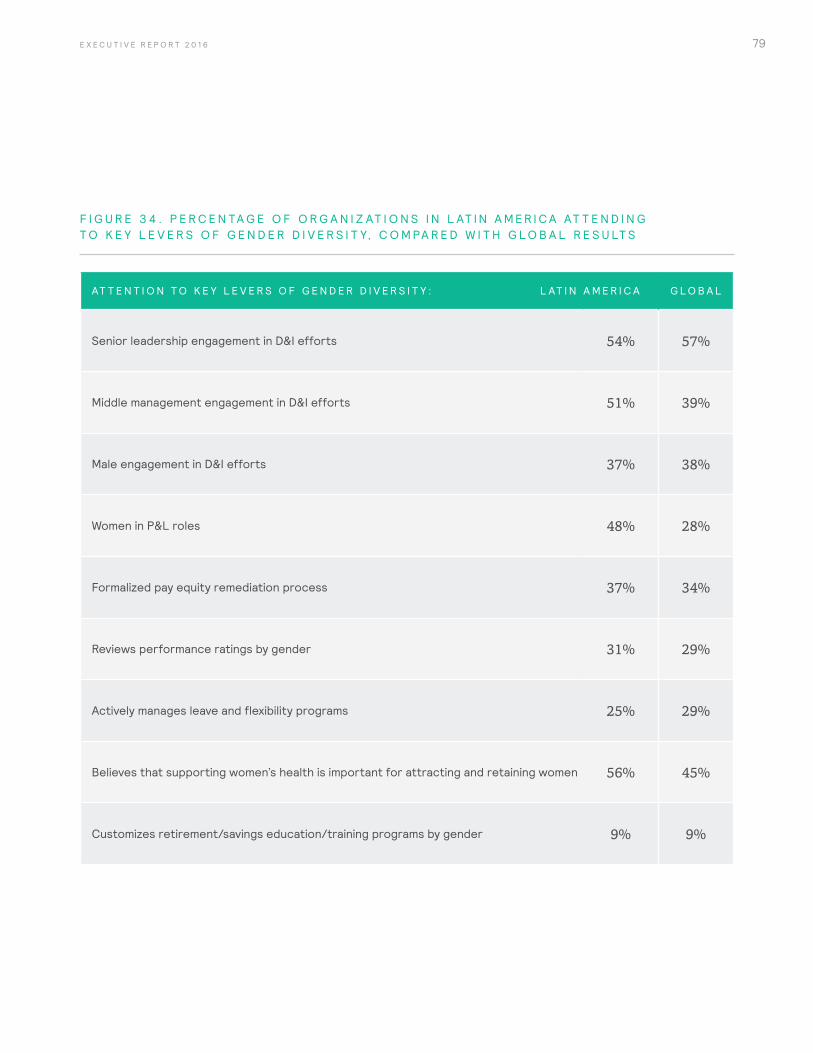
79E X E C U T I V E R E P O R T 2 0 1 6
F I G U R E 3 4 . P E R C E N TA G E O F O R G A N I Z AT I O N S I N L AT I N A M E R I C A AT T E N D I N G T O K E Y L E V E R S O F G E N D E R D I V E R S I T Y, C O M PA R E D W I T H G L O B A L R E S U LT S
AT T E N T I O N T O K E Y L E V E R S O F G E N D E R D I V E R S I T Y : L AT I N A M E R I C A G L O B A L
Senior leadership engagement in D&I efforts 54% 57%
Middle management engagement in D&I efforts 51% 39%
Male engagement in D&I efforts 37% 38%
Women in P&L roles 48% 28%
Formalized pay equity remediation process 37% 34%
Reviews performance ratings by gender 31% 29%
Actively manages leave and flexibility programs 25% 29%
Believes that supporting women’s health is important for attracting and retaining women 56% 45%
Customizes retirement/savings education/training programs by gender 9% 9%
80 W H E N W O M E N T H R I V E , B U S I N E S S E S T H R I V E
A R E W O M E N T H R I V I N G I N T H E U S A N D C A N A D A ?
Although women make up more of the mid- and senior-level workforce in North America than in any other region, virtually no gain can be expected over the next decade.
G O O D N E W S :
• Women in the US and Canada make up 39% of those at the professional level and above in the average company — a greater proportion than in any other region (see Figure 37).
• Female representation at all career levels is above the global average. Organizations in the US and Canada have the highest representation of women at the executive level at 22% (see Figure 35).
• Promotion rates for senior women have improved markedly over 2014.
• The focus on hiring women at the top is projected to increase female representation at the executive level from 22% today to 36% by 2025, given current hiring, promotion, and retention rates (see Figure 36).
O P P O R T U N I T I E S F O R I M P R O V E M E N T :
• Women are hired at lower rates compared with men at all levels of the organization, except the executive level, where women have a 1-percentage-point advantage (see Figure 35).
• Women are more likely than men to exit from senior manager and professional-level jobs (see Figure 35).
• Women are less likely than men to be promoted from support staff to professional roles and from manager to senior manager positions (see Figure 35).
• If current hiring, promotion, and retention rates stay constant, female representation at the professional level and above will increase by only 1% over the next 10 years (see Figure 37).
• Less than a quarter of organizations actively manage leave and flexibility programs (24%), or report equal representation of women in P&L and functional roles (22%) (see Figure 38).
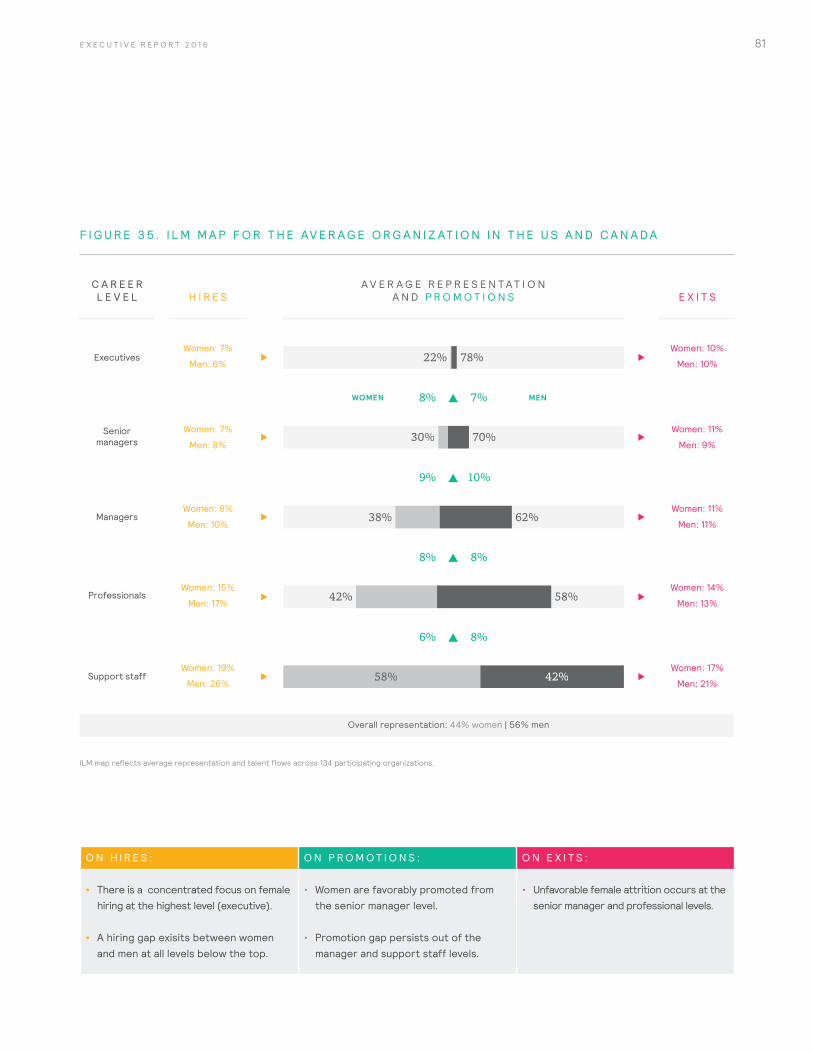
81E X E C U T I V E R E P O R T 2 0 1 6
O N H I R E S : O N P R O M O T I O N S : O N E X I T S :
• There is a concentrated focus on female hiring at the highest level (executive).
• A hiring gap exisits between women and men at all levels below the top.
• Women are favorably promoted from the senior manager level.
• Promotion gap persists out of the manager and support staff levels.
• Unfavorable female attrition occurs at the senior manager and professional levels.
F I G U R E 3 5 . I L M M A P F O R T H E AV E R A G E O R G A N I Z AT I O N I N T H E U S A N D C A N A D A
Overall representation: 44% women | 56% men
Women: 7%
Men: 6%
Women: 7%
Men: 8%
Women: 8%
Men: 10%
Women: 15%
Men: 17%
Women: 19%
Men: 26%
Women: 10%
Men: 10%
Women: 11%
Men: 9%
Women: 11%
Men: 11%
Women: 14%
Men: 13%
Women: 17%
Men: 21%
22% 78%
30%
38%
70%
62%
42% 58%
58% 42%
9% 10%
8% 8%
6% 8%
8% 7%
Seniormanagers
Support staff
Professionals
Managers
Executives
H I R E SC A R E E R L E V E L
WOMEN MEN
E X I T SA V E R A G E R E P R E S E N T A T I O N
A N D P R O M O T I O N S
ILM map reflects average representation and talent flows across 134 participating organizations.
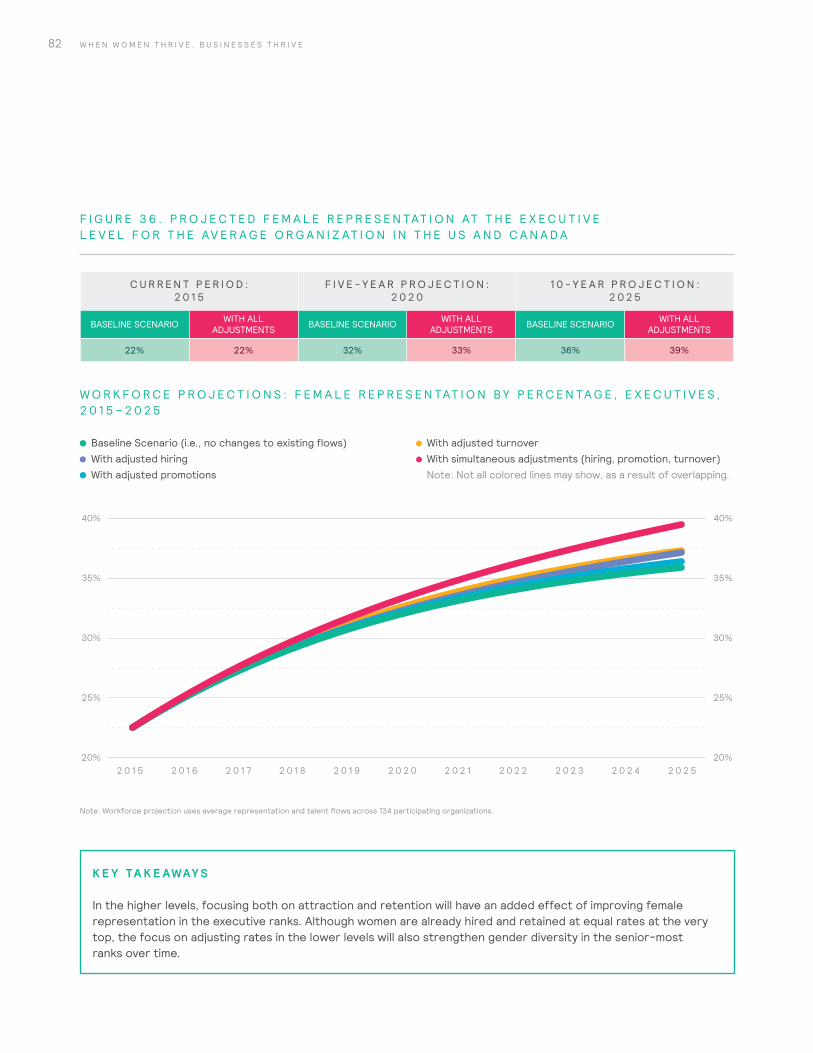
82 W H E N W O M E N T H R I V E , B U S I N E S S E S T H R I V E
C U R R E N T P E R I O D : 2 0 1 5
F I V E - Y E A R P R O J E C T I O N : 2 0 2 0
1 0 - Y E A R P R O J E C T I O N : 2 0 2 5
BASELINE SCENARIO WITH ALL ADJUSTMENTS BASELINE SCENARIO WITH ALL
ADJUSTMENTS BASELINE SCENARIO WITH ALL ADJUSTMENTS
22% 22% 32% 33% 36% 39%
20%
25%
40%
35%
30%
20%
40%
30%
35%
25%
2 0 1 5 2 0 1 6 2 0 1 7 2 0 1 8 2 0 1 9 2 0 2 0 2 0 2 1 2 0 2 2 2 0 2 3 2 0 2 4 2 0 2 5
F I G U R E 3 6 . P R O J E C T E D F E M A L E R E P R E S E N TAT I O N AT T H E E X E C U T I V E L E V E L F O R T H E AV E R A G E O R G A N I Z AT I O N I N T H E U S A N D C A N A D A
W O R K F O R C E P R O J E C T I O N S : F E M A L E R E P R E S E N TAT I O N B Y P E R C E N TA G E , E X E C U T I V E S , 2 0 1 5 – 2 0 2 5
Note: Workforce projection uses average representation and talent flows across 134 participating organizations.
Baseline Scenario (i.e., no changes to existing flows) With adjusted hiring With adjusted promotions
With adjusted turnover With simultaneous adjustments (hiring, promotion, turnover) Note: Not all colored lines may show, as a result of overlapping.
K E Y TA K E AWAY S
In the higher levels, focusing both on attraction and retention will have an added effect of improving female representation in the executive ranks. Although women are already hired and retained at equal rates at the very top, the focus on adjusting rates in the lower levels will also strengthen gender diversity in the senior-most ranks over time.
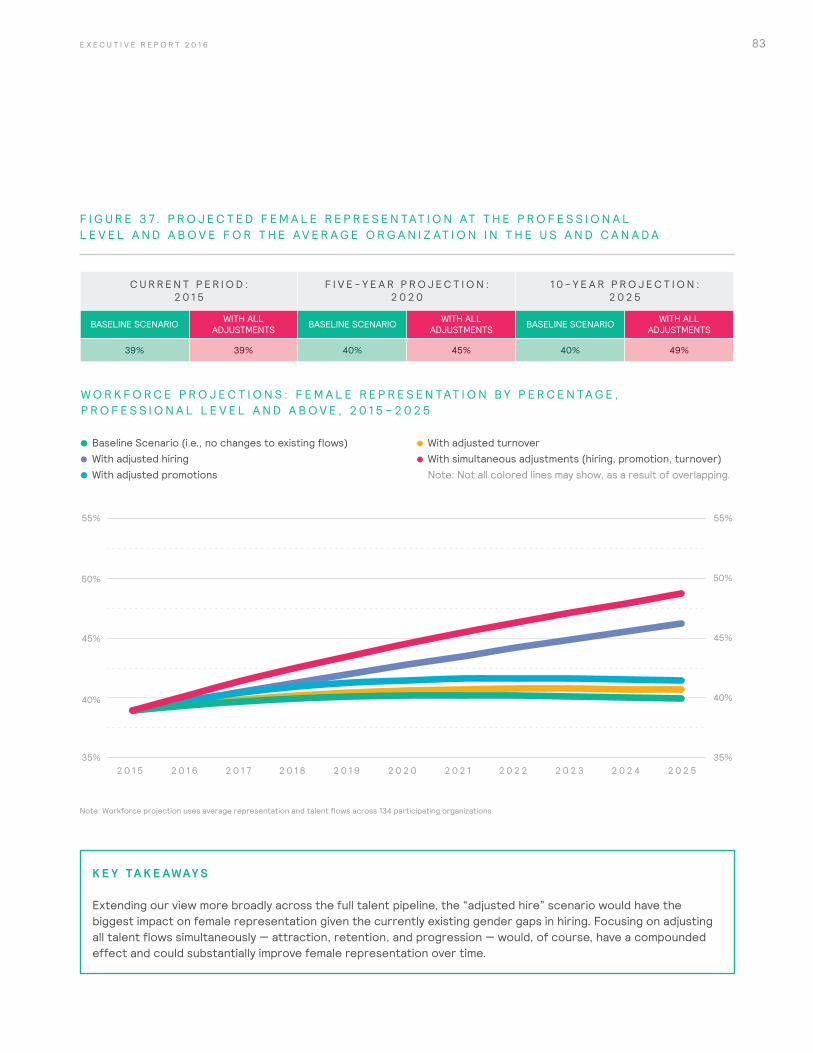
83E X E C U T I V E R E P O R T 2 0 1 6
C U R R E N T P E R I O D : 2 0 1 5
F I V E - Y E A R P R O J E C T I O N : 2 0 2 0
1 0 - Y E A R P R O J E C T I O N : 2 0 2 5
BASELINE SCENARIO WITH ALL ADJUSTMENTS BASELINE SCENARIO WITH ALL
ADJUSTMENTS BASELINE SCENARIO WITH ALL ADJUSTMENTS
39% 39% 40% 45% 40% 49%
F I G U R E 3 7 . P R O J E C T E D F E M A L E R E P R E S E N TAT I O N AT T H E P R O F E S S I O N A L L E V E L A N D A B O V E F O R T H E AV E R A G E O R G A N I Z AT I O N I N T H E U S A N D C A N A D A
W O R K F O R C E P R O J E C T I O N S : F E M A L E R E P R E S E N TAT I O N B Y P E R C E N TA G E , P R O F E S S I O N A L L E V E L A N D A B O V E , 2 0 1 5 – 2 0 2 5
35%
40%
55%
50%
45%
35%
55%
45%
50%
40%
2 0 1 5 2 0 1 6 2 0 1 7 2 0 1 8 2 0 1 9 2 0 2 0 2 0 2 1 2 0 2 2 2 0 2 3 2 0 2 4 2 0 2 5
Note: Workforce projection uses average representation and talent flows across 134 participating organizations.
Baseline Scenario (i.e., no changes to existing flows) With adjusted hiring With adjusted promotions
With adjusted turnover With simultaneous adjustments (hiring, promotion, turnover) Note: Not all colored lines may show, as a result of overlapping.
K E Y TA K E AWAY S
Extending our view more broadly across the full talent pipeline, the “adjusted hire” scenario would have the biggest impact on female representation given the currently existing gender gaps in hiring. Focusing on adjusting all talent flows simultaneously — attraction, retention, and progression — would, of course, have a compounded effect and could substantially improve female representation over time.
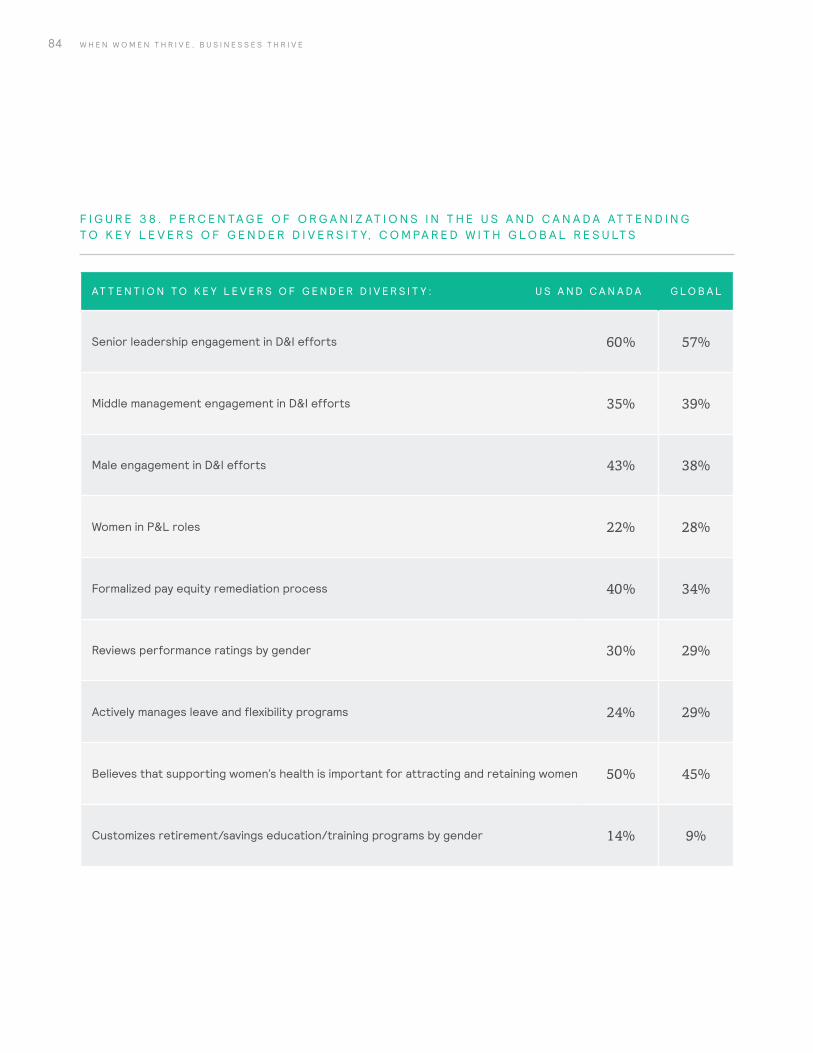
84 W H E N W O M E N T H R I V E , B U S I N E S S E S T H R I V E
F I G U R E 3 8 . P E R C E N TA G E O F O R G A N I Z AT I O N S I N T H E U S A N D C A N A D A AT T E N D I N G T O K E Y L E V E R S O F G E N D E R D I V E R S I T Y, C O M PA R E D W I T H G L O B A L R E S U LT S
AT T E N T I O N T O K E Y L E V E R S O F G E N D E R D I V E R S I T Y : U S A N D C A N A D A G L O B A L
Senior leadership engagement in D&I efforts 60% 57%
Middle management engagement in D&I efforts 35% 39%
Male engagement in D&I efforts 43% 38%
Women in P&L roles 22% 28%
Formalized pay equity remediation process 40% 34%
Reviews performance ratings by gender 30% 29%
Actively manages leave and flexibility programs 24% 29%
Believes that supporting women’s health is important for attracting and retaining women 50% 45%
Customizes retirement/savings education/training programs by gender 14% 9%
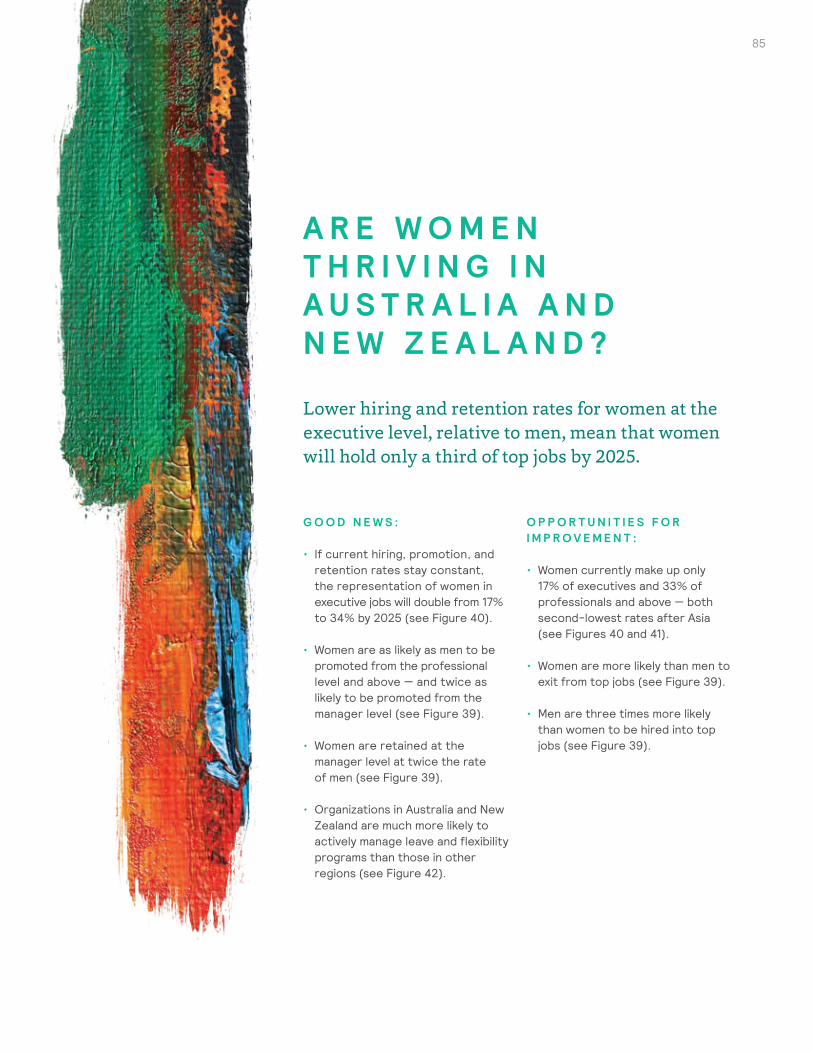
85E X E C U T I V E R E P O R T 2 0 1 6
A R E W O M E N T H R I V I N G I N A U S T R A L I A A N D N E W Z E A L A N D ?
Lower hiring and retention rates for women at the executive level, relative to men, mean that women will hold only a third of top jobs by 2025.
G O O D N E W S :
• If current hiring, promotion, and retention rates stay constant, the representation of women in executive jobs will double from 17% to 34% by 2025 (see Figure 40).
• Women are as likely as men to be promoted from the professional level and above — and twice as likely to be promoted from the manager level (see Figure 39).
• Women are retained at the manager level at twice the rate of men (see Figure 39).
• Organizations in Australia and New Zealand are much more likely to actively manage leave and flexibility programs than those in other regions (see Figure 42).
O P P O R T U N I T I E S F O R I M P R O V E M E N T :
• Women currently make up only 17% of executives and 33% of professionals and above — both second-lowest rates after Asia (see Figures 40 and 41).
• Women are more likely than men to exit from top jobs (see Figure 39).
• Men are three times more likely than women to be hired into top jobs (see Figure 39).
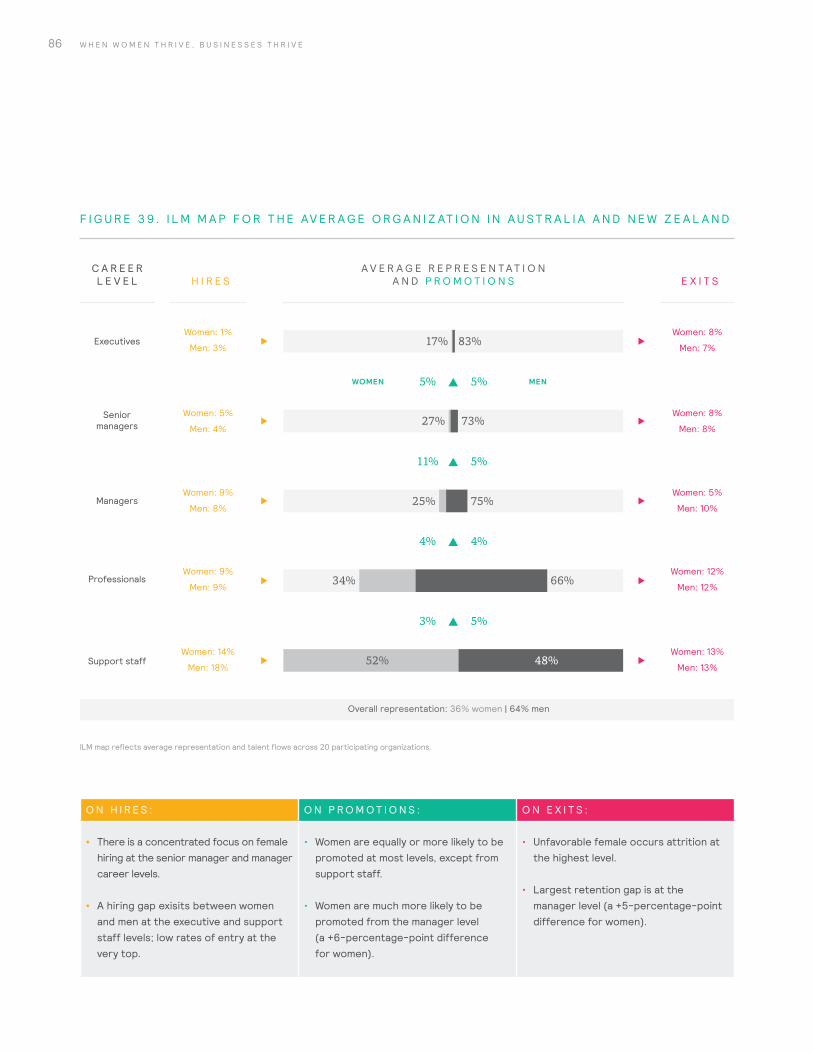
86 W H E N W O M E N T H R I V E , B U S I N E S S E S T H R I V E
O N H I R E S : O N P R O M O T I O N S : O N E X I T S :
• There is a concentrated focus on female hiring at the senior manager and manager career levels.
• A hiring gap exisits between women and men at the executive and support staff levels; low rates of entry at the very top.
• Women are equally or more likely to be promoted at most levels, except from support staff.
• Women are much more likely to be promoted from the manager level (a +6-percentage-point difference for women).
• Unfavorable female occurs attrition at the highest level.
• Largest retention gap is at the manager level (a +5-percentage-point difference for women).
F I G U R E 3 9. I L M M A P F O R T H E AV E R A G E O R G A N I Z AT I O N I N A U S T R A L I A A N D N E W Z E A L A N D
Seniormanagers
Support staff
Professionals
Managers
Executives
Overall representation: 36% women | 64% men
Women: 1%
Men: 3%
Women: 5%
Men: 4%
Women: 9%
Men: 8%
Women: 9%
Men: 9%
Women: 14%
Men: 18%
Women: 8%
Men: 7%
Women: 8%
Men: 8%
Women: 5%
Men: 10%
Women: 12%
Men: 12%
Women: 13%
Men: 13%
17% 83%
27%
25%
73%
75%
34% 66%
52% 48%
11% 5%
4% 4%
3% 5%
5% 5%
H I R E SC A R E E R L E V E L
WOMEN MEN
E X I T SA V E R A G E R E P R E S E N T A T I O N
A N D P R O M O T I O N S
ILM map reflects average representation and talent flows across 20 participating organizations.
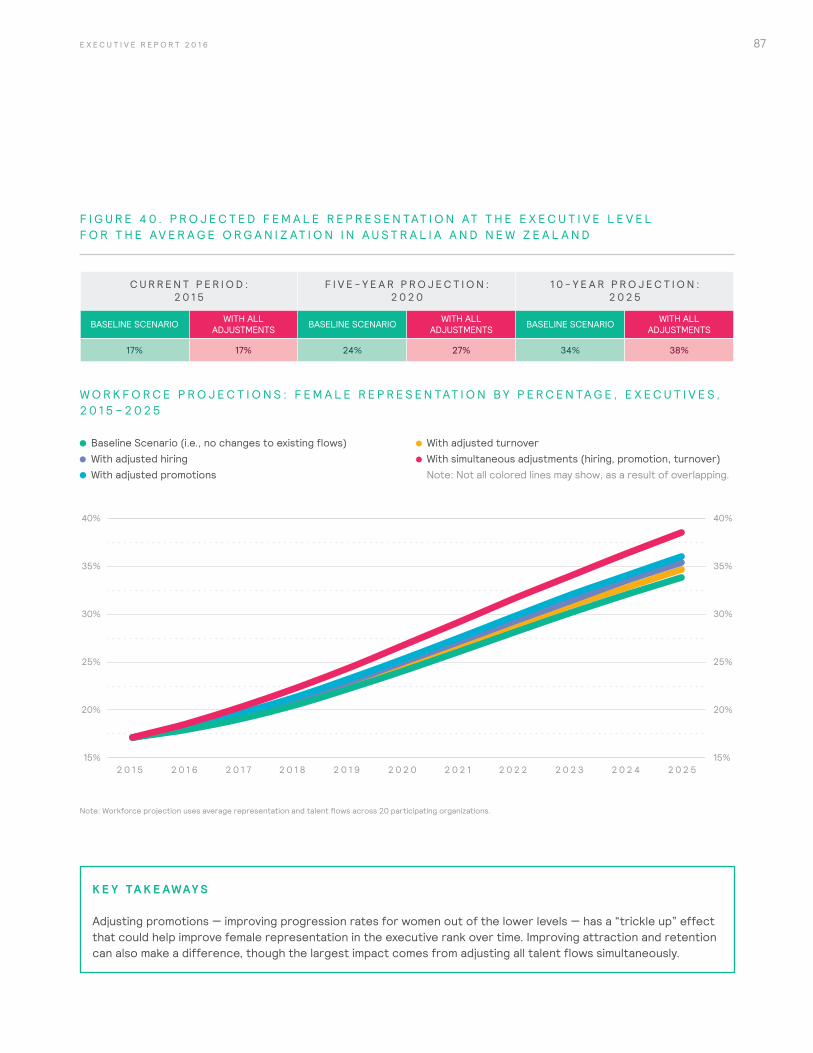
87E X E C U T I V E R E P O R T 2 0 1 6
C U R R E N T P E R I O D : 2 0 1 5
F I V E - Y E A R P R O J E C T I O N : 2 0 2 0
1 0 - Y E A R P R O J E C T I O N : 2 0 2 5
BASELINE SCENARIO WITH ALL ADJUSTMENTS BASELINE SCENARIO WITH ALL
ADJUSTMENTS BASELINE SCENARIO WITH ALL ADJUSTMENTS
17% 17% 24% 27% 34% 38%
F I G U R E 4 0 . P R O J E C T E D F E M A L E R E P R E S E N TAT I O N AT T H E E X E C U T I V E L E V E L F O R T H E AV E R A G E O R G A N I Z AT I O N I N A U S T R A L I A A N D N E W Z E A L A N D
W O R K F O R C E P R O J E C T I O N S : F E M A L E R E P R E S E N TAT I O N B Y P E R C E N TA G E , E X E C U T I V E S , 2 0 1 5 – 2 0 2 5
Note: Workforce projection uses average representation and talent flows across 20 participating organizations.
15%
20%
25%
35%
30%
Note: Workfroce projection uses average representation and talent flows across 350 participating organizations.
40%
15%
20%
25%
35%
30%
40%
2 0 1 5 2 0 1 6 2 0 1 7 2 0 1 8 2 0 1 9 2 0 2 0 2 0 2 1 2 0 2 2 2 0 2 3 2 0 2 4 2 0 2 5
Baseline Scenario (i.e., no changes to existing flows) With adjusted hiring With adjusted promotions
With adjusted turnover With simultaneous adjustments (hiring, promotion, turnover) Note: Not all colored lines may show, as a result of overlapping.
K E Y TA K E AWAY S
Adjusting promotions — improving progression rates for women out of the lower levels — has a “trickle up” effect that could help improve female representation in the executive rank over time. Improving attraction and retention can also make a difference, though the largest impact comes from adjusting all talent flows simultaneously.
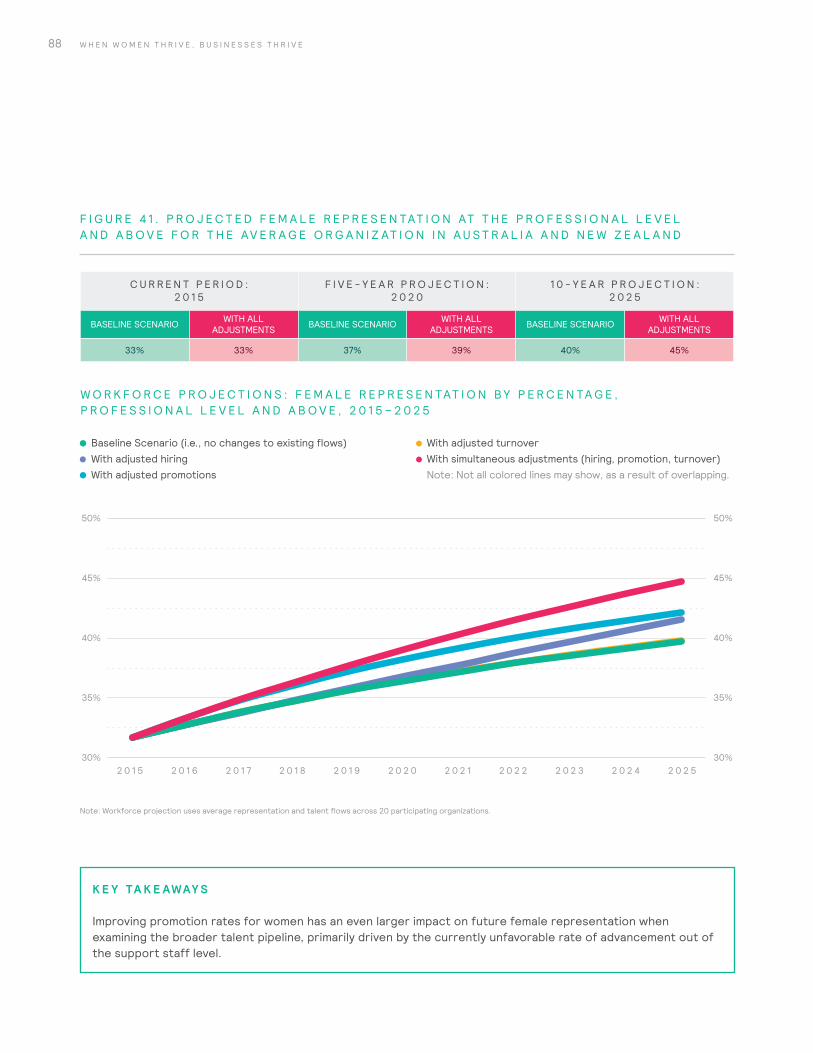
88 W H E N W O M E N T H R I V E , B U S I N E S S E S T H R I V E
C U R R E N T P E R I O D : 2 0 1 5
F I V E - Y E A R P R O J E C T I O N : 2 0 2 0
1 0 - Y E A R P R O J E C T I O N : 2 0 2 5
BASELINE SCENARIO WITH ALL ADJUSTMENTS BASELINE SCENARIO WITH ALL
ADJUSTMENTS BASELINE SCENARIO WITH ALL ADJUSTMENTS
33% 33% 37% 39% 40% 45%
F I G U R E 4 1 . P R O J E C T E D F E M A L E R E P R E S E N TAT I O N AT T H E P R O F E S S I O N A L L E V E L A N D A B O V E F O R T H E AV E R A G E O R G A N I Z AT I O N I N A U S T R A L I A A N D N E W Z E A L A N D
W O R K F O R C E P R O J E C T I O N S : F E M A L E R E P R E S E N TAT I O N B Y P E R C E N TA G E , P R O F E S S I O N A L L E V E L A N D A B O V E , 2 0 1 5 – 2 0 2 5
30%
40%
45%
35%
50%
30%
35%
45%
40%
50%
2 0 1 5 2 0 1 6 2 0 1 7 2 0 1 8 2 0 1 9 2 0 2 0 2 0 2 1 2 0 2 2 2 0 2 3 2 0 2 4 2 0 2 5
Note: Workforce projection uses average representation and talent flows across 20 participating organizations.
Baseline Scenario (i.e., no changes to existing flows) With adjusted hiring With adjusted promotions
With adjusted turnover With simultaneous adjustments (hiring, promotion, turnover) Note: Not all colored lines may show, as a result of overlapping.
K E Y TA K E AWAY S
Improving promotion rates for women has an even larger impact on future female representation when examining the broader talent pipeline, primarily driven by the currently unfavorable rate of advancement out of the support staff level.
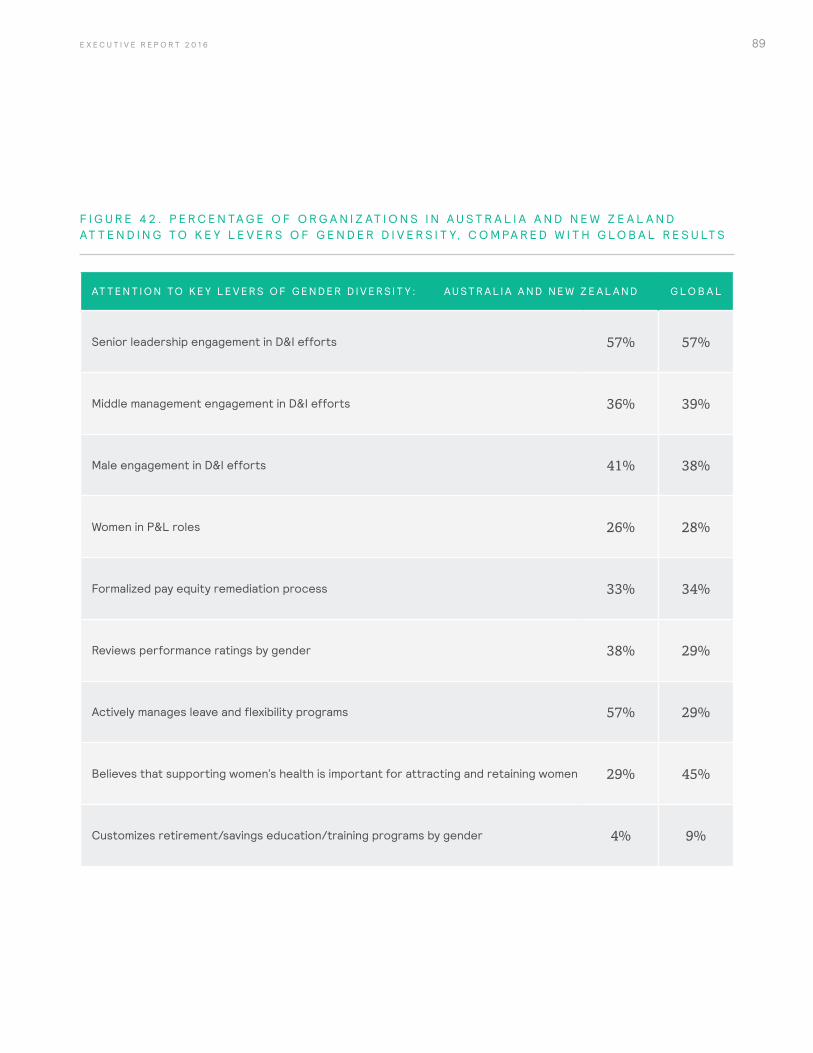
89E X E C U T I V E R E P O R T 2 0 1 6
F I G U R E 4 2 . P E R C E N TA G E O F O R G A N I Z AT I O N S I N A U S T R A L I A A N D N E W Z E A L A N D AT T E N D I N G T O K E Y L E V E R S O F G E N D E R D I V E R S I T Y, C O M PA R E D W I T H G L O B A L R E S U LT S
AT T E N T I O N TO K E Y L E V E R S O F G E N D E R D I V E R S I T Y : A U S T R A L I A A N D N E W Z E A L A N D G L O B A L
Senior leadership engagement in D&I efforts 57% 57%
Middle management engagement in D&I efforts 36% 39%
Male engagement in D&I efforts 41% 38%
Women in P&L roles 26% 28%
Formalized pay equity remediation process 33% 34%
Reviews performance ratings by gender 38% 29%
Actively manages leave and flexibility programs 57% 29%
Believes that supporting women’s health is important for attracting and retaining women 29% 45%
Customizes retirement/savings education/training programs by gender 4% 9%
90 W H E N W O M E N T H R I V E , B U S I N E S S E S T H R I V E
S E C T I O N 4 : A C C E L E R AT I N G Y O U R J O U R N E Y T O A T H R I V I N G W O R K F O R C E
91E X E C U T I V E R E P O R T 2 0 1 6
H E L P I N G W O M E N T H R I V E I N Y O U R O R G A N I Z AT I O N
The insights in this report point organizations toward the areas of focus critical to a thriving female workforce. However, during the journey to diversity, inertia is a real obstacle. By relying on the 6 P’s, companies can align their talent strategy, their leadership, and their organizational structure to create a culture that is capable of overcoming inertia and advancing gender diversity.
D R I V I N G B U S I N E S S O U T C O M E S
Moving the needle.
The global imperative for gender diversity has been heavily reported and researched; however, companies must still show executives who haven’t seen progress in their own environments that results are achievable — with their own numbers. Successful organizations base their gender-diversity strategies and priorities on robust workforce analytics. This allows them to pinpoint the policies and programs that are accelerating or slowing the progression of women in their organizations.
A L I G N I N G A N D E N G A G I N G L E A D E R S H I P
Making diversity and inclusion a business imperative.
Our research has established the clear link between strong success in gender diversity and leadership that is actively engaged in D&I. Mandating change is not enough; leaders must personally cause it. Organizations with leaders who are actively engaged in D&I have more women at the top; they hire, promote, and retain more women than men.
Successful organizations have leaders who are passionate about moving the needle. They have made it their personal mission to drive progress and have established a framework to ensure perseverance and sustainability.
E N S U R I N G O R G A N I Z AT I O N A L R E A D I N E S S
Moving from awareness to action.
In order to retain diverse talent, organizations must have, at their core, an inclusive culture that actively supports and values diversity. Both male and female workers must value the differences a diverse workforce brings and actively support moving toward an inclusive culture to sustain diversity. Programs, policies, and processes should be evaluated to ensure that any one group of employees is not unfairly advantaged or disadvantaged. Organizations can realize true business benefits when they identify the unconscious biases that penalize differences and work to create a culture that values and harnesses those differences.
T H R E E S I M U LTA N E O U S F O C U S A R E A S
We believe the path to a thriving workforce is a journey that requires focus in three simultaneous areas that ensure organizational alignment and commitment:
92 W H E N W O M E N T H R I V E , B U S I N E S S E S T H R I V E
C R E AT E M A X I M U M V E L O C I T Y
Only when organizations are making progress across all three focus areas simultaneously can they reach maximum velocity in helping women thrive.
Strategy design alone won’t take you the full distance. Some organizations have designed and implemented sophisticated programs to increase gender diversity — and then used sophisticated dashboards to measure little or no progress year after year because leadership was not passionately committed and the organization was not aligned to the goal. Others have leaders convinced of the business case for gender diversity and are determined to make progress, but they are unable to do so in the absence of a well-designed strategy built on proof and organizational alignment.
D R I V E F O C U S E D E X E C U T I O N
Although the journey toward full gender equity is a long and complex one, organizations can begin at different points in order to change their current and future female representation.
Some organizations will want to begin the journey by tackling an
issue of particular concern — perhaps a pay equity issue, a benefit, or a leave program that is having adverse consequences, or a performance management and development program that is leaving too many women behind. Others are aware that their organizations aren’t using the female workforce to the fullest but don’t have a clear sense of where to begin to change the situation.
Critical to both cases are actions based on data and evidence — not hunches. And the design, implementation, and evaluation of those actions should follow a journey that is most likely to yield the desired effect.
Also critical is attention to linking strategy with all three focus areas that make up the journey — outcomes, organizational readiness, and leadership engagement. No matter where you are in your diversity and inclusion strategy today — whether just starting out or having already designed specific solutions based on diagnostics — you must understand where your organization and your leadership are on the journey and whether they are aligned with the overall D&I strategy linked to business outcomes. Ignoring any of these paths will slow the velocity of women’s progress in your organization.
S TA R T W I T H D I A G N O S T I C S
1. PROOF
Base your gender-diversity strategy and priorities on robust workforce analytics.
2. PERSONAL and PASSIONATE
Evaluate your leadership and organizational readiness for change against all of the 6 P’s.
3. PERSEVERANCE
Regularly audit and reinforce your PROGRAMS and PROCESSES to understand whether they support the unique needs of your female workforce.
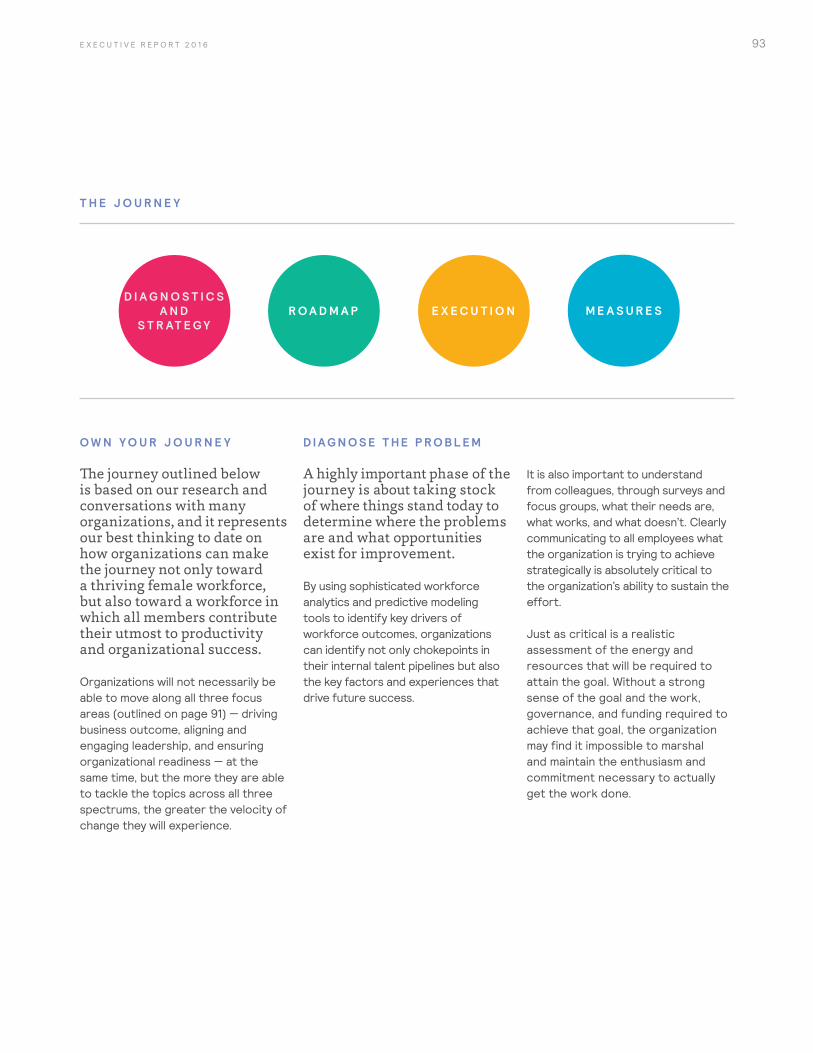
93E X E C U T I V E R E P O R T 2 0 1 6
D I A G N O S T I C S A N D
S T R AT E G YR O A D M A P E X E C U T I O N M E A S U R E S
T H E J O U R N E Y
O W N Y O U R J O U R N E Y
The journey outlined below is based on our research and conversations with many organizations, and it represents our best thinking to date on how organizations can make the journey not only toward a thriving female workforce, but also toward a workforce in which all members contribute their utmost to productivity and organizational success.
Organizations will not necessarily be able to move along all three focus areas (outlined on page 91) — driving business outcome, aligning and engaging leadership, and ensuring organizational readiness — at the same time, but the more they are able to tackle the topics across all three spectrums, the greater the velocity of change they will experience.
D I A G N O S E T H E P R O B L E M
A highly important phase of the journey is about taking stock of where things stand today to determine where the problems are and what opportunities exist for improvement.
By using sophisticated workforce analytics and predictive modeling tools to identify key drivers of workforce outcomes, organizations can identify not only chokepoints in their internal talent pipelines but also the key factors and experiences that drive future success.
It is also important to understand from colleagues, through surveys and focus groups, what their needs are, what works, and what doesn’t. Clearly communicating to all employees what the organization is trying to achieve strategically is absolutely critical to the organization’s ability to sustain the effort.
Just as critical is a realistic assessment of the energy and resources that will be required to attain the goal. Without a strong sense of the goal and the work, governance, and funding required to achieve that goal, the organization may find it impossible to marshal and maintain the enthusiasm and commitment necessary to actually get the work done.
94 W H E N W O M E N T H R I V E , B U S I N E S S E S T H R I V E
C R E AT E T H E R O A D M A P F O R C H A N G E
For greatest success, your roadmap should address the drivers of gender diversity identified through this research.
Organizations and leaders must consider the following:
• What are you doing to engage your leaders and to engage male workers internally?
• How are you building your pipeline, including diverse talent pools, internal and external to your organization?
• How are you making sure that your leave policies are actively managed, and what are you aiming to achieve through your pay equity processes?
• How are you improving your performance and promotion processes?
• How are you leveraging specific gender competencies?
• How are you supporting the unique health needs of your female employees, and what programs are you rolling out internally to address the unique financial or health needs of women?
• How are you demonstrating and “making good” on your brand in the talent marketplace?
A critical component of this phase is to engage leaders, managers, and regions globally to ensure that all colleagues are passionate about the roadmap and the change that is expected, and that they will actively support its execution.
E X E C U T E T H E S T R AT E G Y
Quite often, organizations think of the design and communication phase as the end of the process.
But deep attention to the actual execution process is absolutely critical to attaining your goal. This is the phase of your journey when you will turn plans into action, implementing what you have identified as important for your organization to achieve the business outcomes you have defined as goals.
This phase of the journey requires close attention to ensure that the strategy, the organization, and the leadership continue to be aligned. This is the time to ensure that the organization is thinking and acting differently — that it has evolved to implement holistic programs that address critical needs. If leadership is aligned, it should feel comfortable and confident in being transparent about organizational insights and the actions that are being put in place to create a more diverse and inclusive organization.
U S I N G T H E 6 P ’ S T O O V E R C O M E I N E R T I A
Many organizations have been on the journey to a diverse workforce for decades. Despite the substantial research tying gender diversity to tangible business benefits, inertia is preventing a change in the culture. Using the 6 P’s as the inspiration for change, companies can achieve gender equality with the:
1. Personal commitment of leaders at all levels.
2. Passion to create an inclusive culture.
3. Proof against what is hurting and what is helping.
4. Processes that are effectively managed.
5. Programs that are designed and implemented.
6. Perseverance to stick with and modify the strategy, culture, and employee experience over time.
95E X E C U T I V E R E P O R T 2 0 1 6
M E A S U R I N G A N D M A I N TA I N I N G M O M E N T U M
We often receive feedback from companies that they are hesitant to report on goals against their diversity and inclusion initiatives.
Although we understand the underlying concern driving this reluctance, the elementary question is: If you aren’t measuring, how do you know whether you are making progress or stalling? Regularly measuring and reporting on progress toward the goal is a crucial component of reinforcing change.
This is also the time to redeploy the diagnostic tools used earlier. Optimizing your workforce is a continuous journey. To sustain a thriving workforce, you need to plan for continual learning and adaptation. Significant progress on the journey is likely to result in your organization and leaders becoming widely respected as thought leaders on D&I.
B E B O L D W I T H P R O G R A M S A N D I N I T I AT I V E S
A majority of women’s initiatives are focused on the support and promotion of individual employees, one at a time.
Our experience indicates that solutions with a more broad and holistic focus bring energy to diversity and inclusion efforts and disrupt the status quo.
For example, if a company has determined that IT projects tend to come in on time and under budget when they have women on the project team, they should launch a holistic program to retain and attract more women to IT.
An organization with a shortage of women in the IT department might implement a bold policy that says, “No IT projects will be started until there are at least three women on the team.”
With this broad-based policy shift, the entire company is now motivated and aligned to ensure that there is an adequate number of women in IT.
96 W H E N W O M E N T H R I V E , B U S I N E S S E S T H R I V E
H O W M E R C E R C A N H E L P Y O U R G E N D E R D I V E R S I T Y S T R AT E G Y
We are here for you. For more information, contact us or visit us at www.whenwomenthrive.net.
D I A G N O S T I C S A N D S T R A T E G YB A S E Y O U R S T R AT E G Y O N R O B U S T W O R K F O R C E A N A LY T I C S A N D D ATA
Mercer has powerful predictive analytics capabilities to support effective strategy development.
E X E C U T I O NE X E C U T E O N Y O U R R O A D M A P W I T H C L A R I T Y A N D F O C U SMercer has the unique ability and experience to structure our services to meet your organization’s exact needs. We can provide resources to bolster in-house capabilities, or manage the entire project from start to finish.
M E A S U R E SC R E AT E A D A S H B O A R D F O R A L L L E V E L S O F T H E O R G A N I Z AT I O NIt is important to keep a pulse on the key measures of success to ensure that you are progressing. Mercer has a variety of tools and portals that will assist in measuring and communicating progress.
R O A D M A PI D E N T I F Y D I S R U P T E R S A N D S O L U T I O N S T O A D D R E S S Y O U R N E E D S
Mercer’s team of D&I experts can assist your company in building a roadmap focused on your priorities.
C O N TA C T S
NORTH AMERICA: Pam Jeffords, Partner [email protected] +1 303 376 5838
LATIN AMERICA Ana Maria Weisz, Principal [email protected] +54 11 4000 0942
EUROPE: Mandy Schreuder, Principal [email protected] +33 1 55 21 36 49
ASIA, MIDDLE EAST & AFRICA: Susan Haberman, Senior Partner [email protected] +1 312 917 9610
For all other inquires please email [email protected].
97E X E C U T I V E R E P O R T 2 0 1 6
W H AT ’ S N E X T ?
TA K E A C T I O N T O D AY
• Be a part of it: www.whenwomenthrive.net.
• Join the When Women Thrive LinkedIn group.
• Join the conversation: #WhenWomenThrive.
• Become a member of our global D&I networks.
• Follow us: @Mercer, @WhenWomenThrive.
• Benchmark your own responses and be part of our When Women Thrive research.
• Engage at our When Women Thrive events around the world.
• Talk to our When Women Thrive experts. Contact your local Mercer office.
J O I N U S O N T H I S J O U R N E Y
We invite organizations around the world, in all industries and from all sectors, to join the growing community of organizations that have embarked on this journey toward a thriving female workforce. Successfully moving forward will require all of us to think and act differently. But the rewards for fully using this significant workforce are sure to drive great value.
98 W H E N W O M E N T H R I V E , B U S I N E S S E S T H R I V E
C O N T R I B U T O R S
Linda Chen, Senior Associate
Erin Defoyd, Principal
Anne Hetterich, Associate
Pam Jeffords, Partner
Brian Levine, PhD, Partner
Patricia A. Milligan, Senior Partner
Jennifer Openshaw, Partner
Samantha Polovina, Principal
Mandy Schreuder, Principal
The authors wish to extend a special thank you to Margaret Chabowski, Inna Ward, and Rebecca Crisp for their editorial work; to Rich Hewitt, Amram Perez, and Paul Devlin for their support with design and production; and to Mercer’s Talent Information Solutions Online Survey team and the Data Mining & Insights team for their survey administration and support.
A B O U T W H E N W O M E N T H R I V E
Founded in 2014, When Women Thrive is Mercer’s global research initiative designed to help companies drive their growth through their female workforce.
Organizations that make women a priority may capture a portion of the reported $12 trillion economic opportunity.
It’s Mercer’s goal to help firms implement successful diversity initiatives — leveraging our unique data and predictive analytics — to realize their corporate growth goals.
A B O U T M E R C E R
Mercer is a global consulting leader in talent, health, retirement, and investments. Mercer helps clients around the world advance the health, wealth, and performance of their most vital asset — their people.
Mercer’s more than 20,000 employees are based in more than 40 countries, and the firm operates in over 130 countries.
Mercer is a wholly owned subsidiary of Marsh & McLennan Companies (NYSE: MMC), a global professional services firm offering clients advice and solutions in the areas of risk, strategy, and people. With 57,000 employees worldwide and annual revenue exceeding $13 billion, Marsh & McLennan Companies is also the parent company of Marsh, a leader in insurance broking and risk management; Guy Carpenter, a leader in providing risk and reinsurance intermediary services; and Oliver Wyman, a leader in management consulting.
For more information, visit www.mercer.com.
Follow Mercer on Twitter: @Mercer
99E X E C U T I V E R E P O R T 2 0 1 6
R E S E A R C H S U R V E Y C O N D U C T E D I N C O L L A B O R AT I O N W I T H E D G E C E R T I F I E D F O U N D AT I O N
EDGE is the only global assessment methodology and business certification standard for gender equality.
The EDGE assessment methodology was developed by the EDGE Certified Foundation and launched at the World Economic Forum in 2011. EDGE Certification has been designed to help companies not only create an optimal workplace for women and men but also to benefit from it. EDGE stands for Economic Dividends for Gender Equality and is distinguished by its rigor and focus on business impact. The methodology uses a business rather than a theoretical approach that incorporates benchmarking, metrics, and accountability into the process. It assesses policies, practices, and numbers across five areas of analysis: equal pay for equivalent work, recruitment and promotion, leadership development training and mentoring, flexible working, and company culture. EDGE Certification has received the endorsement of business, government, and academic leaders from around the world.
100 W H E N W O M E N T H R I V E , B U S I N E S S E S T H R I V E
A P P E N D I X

101E X E C U T I V E R E P O R T 2 0 1 6
P R E V A L E N C E O F B E N E F I T P R O G R A M S
P R E VA L E N C E O F B E N E F I T P R O G R A M S
Percentage of organizations identifying a characteristic as a current managerial strength
All survey responses
(global) (n=647)
US and Canada (n=201)
Latin America (n=152)
Europe (n=138)
Asia (n=94)
Australia and New Zealand (n=46)
Middle East and
Africa (n=16)
Part-time schedules 64% 86% 36% 76% 37% 87% 38%
Compressed workweeks 37% 63% 23% 31% 9% 61% 0%
Other flexible work options (e.g., work from home, job sharing) 72% 85% 62% 78% 41% 96% 50%
Maternity leave 71% 80% 62% 68% 66% 83% 63%
Paternity leave 58% 61% 45% 59% 62% 83% 38%
Family or parental/caregiver leave 43% 56% 21% 45% 37% 74% 25%
Company-sponsored access to child care 30% 36% 31% 35% 20% 9% 13%
Company-sponsored access to elder care 9% 18% 2% 6% 9% 0% 6%
Secure transportation/commuter options (e.g., transit to/from work during off hours)
31% 29% 45% 19% 36% 11% 50%
Formal mentorship programs 45% 49% 36% 51% 34% 57% 56%
Formal executive sponsorship programs 28% 33% 25% 32% 13% 39% 25%
Formal mobility or rotational programs 39% 42% 43% 37% 31% 28% 44%
Formal high-potential acceleration programs 46% 44% 51% 51% 38% 43% 50%
Formal return-to-work programs (for those who have been out of the labor force)
24% 22% 17% 28% 24% 46% 6%
Gender diversity and inclusion business/employee resource groups 40% 46% 32% 46% 30% 43% 50%

102 W H E N W O M E N T H R I V E , B U S I N E S S E S T H R I V E
P R E VA L E N C E O F B E N E F I T P R O G R A M R A N K E D I N T O P 5 F O R I M P O R TA N C E L E V E L
Percentage of organizations identifying a characteristic as a current managerial strength
All survey responses
(global) (n=647)
US and Canada (n=201)
Latin America (n=152)
Europe (n=138)
Asia (n=94)
Australia and New Zealand (n=46)
Middle East and
Africa (n=16)
Part-time schedules 47% 59% 26% 62% 24% 76% 19%
Compressed workweeks 23% 38% 18% 16% 6% 35% 0%
Other flexible work options (e.g., work from home, job sharing) 68% 82% 60% 76% 37% 89% 38%
Maternity leave 59% 70% 53% 51% 52% 70% 56%
Paternity leave 26% 23% 23% 23% 39% 28% 19%
Family or parental/caregiver leave 24% 30% 9% 22% 29% 50% 13%
Company-sponsored access to child care 19% 18% 24% 22% 16% 9% 6%
Company-sponsored access to elder care 2% 2% 0% 3% 2% 0% 0%
Secure transportation/commuter options (e.g., transit to/from work during off hours)
14% 5% 29% 6% 24% 4% 31%
Formal mentorship programs 32% 38% 24% 33% 22% 39% 50%
Formal executive sponsorship programs 17% 15% 15% 21% 12% 20% 25%
Formal mobility or rotational programs 23% 21% 33% 18% 20% 13% 25%
Formal high-potential acceleration programs 35% 32% 43% 36% 28% 28% 50%
Formal return-to-work programs (for those who have been out of the labor force)
14% 10% 13% 12% 20% 33% 6%
Gender diversity and inclusion business/employee resource groups 24% 25% 22% 30% 19% 17% 38%
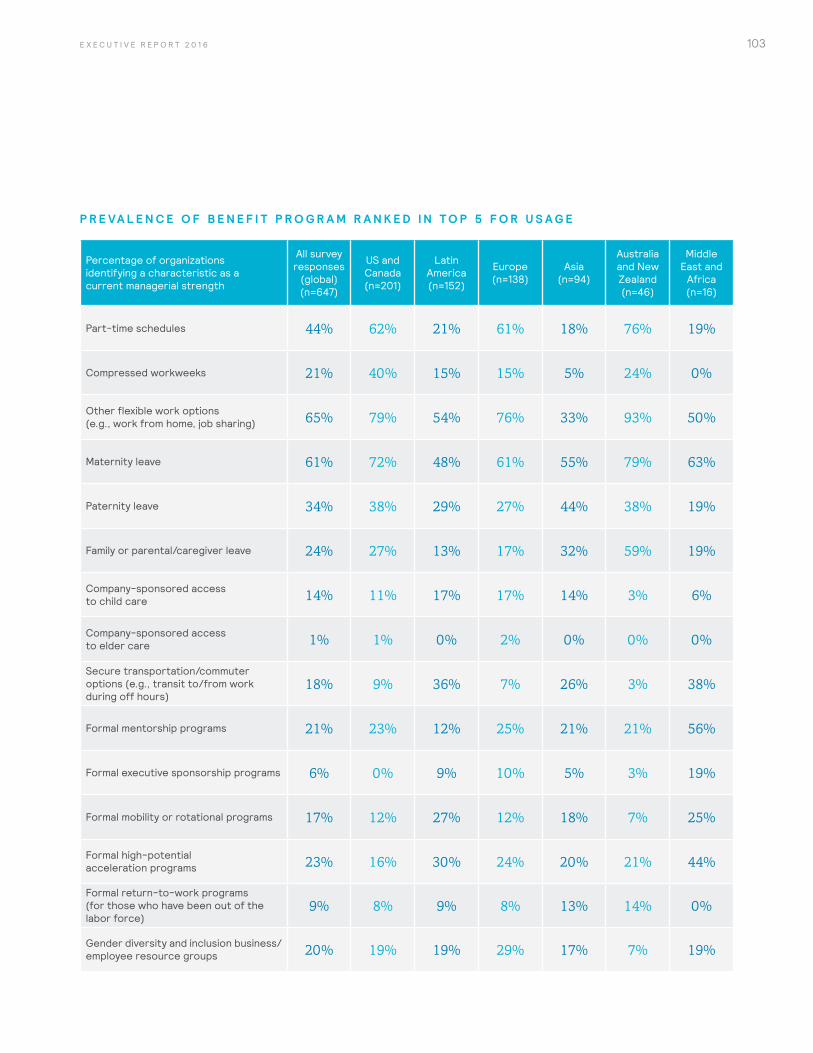
103E X E C U T I V E R E P O R T 2 0 1 6
P R E VA L E N C E O F B E N E F I T P R O G R A M R A N K E D I N T O P 5 F O R U S A G E
Percentage of organizations identifying a characteristic as a current managerial strength
All survey responses
(global) (n=647)
US and Canada (n=201)
Latin America (n=152)
Europe (n=138)
Asia (n=94)
Australia and New Zealand (n=46)
Middle East and
Africa (n=16)
Part-time schedules 44% 62% 21% 61% 18% 76% 19%
Compressed workweeks 21% 40% 15% 15% 5% 24% 0%
Other flexible work options (e.g., work from home, job sharing) 65% 79% 54% 76% 33% 93% 50%
Maternity leave 61% 72% 48% 61% 55% 79% 63%
Paternity leave 34% 38% 29% 27% 44% 38% 19%
Family or parental/caregiver leave 24% 27% 13% 17% 32% 59% 19%
Company-sponsored access to child care 14% 11% 17% 17% 14% 3% 6%
Company-sponsored access to elder care 1% 1% 0% 2% 0% 0% 0%
Secure transportation/commuter options (e.g., transit to/from work during off hours)
18% 9% 36% 7% 26% 3% 38%
Formal mentorship programs 21% 23% 12% 25% 21% 21% 56%
Formal executive sponsorship programs 6% 0% 9% 10% 5% 3% 19%
Formal mobility or rotational programs 17% 12% 27% 12% 18% 7% 25%
Formal high-potential acceleration programs 23% 16% 30% 24% 20% 21% 44%
Formal return-to-work programs (for those who have been out of the labor force)
9% 8% 9% 8% 13% 14% 0%
Gender diversity and inclusion business/employee resource groups 20% 19% 19% 29% 17% 7% 19%
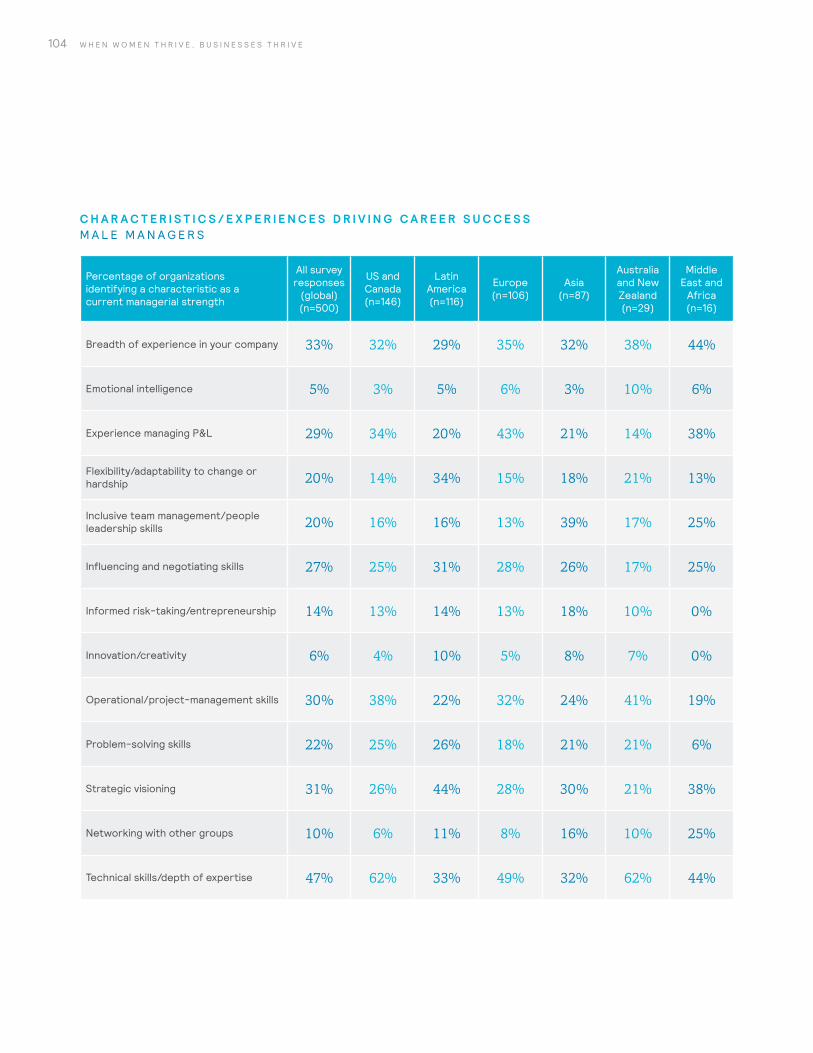
104 W H E N W O M E N T H R I V E , B U S I N E S S E S T H R I V E
C H A R A C T E R I S T I C S / E X P E R I E N C E S D R I V I N G C A R E E R S U C C E S S M A L E M A N A G E R S
Percentage of organizations identifying a characteristic as a current managerial strength
All survey responses
(global) (n=500)
US and Canada (n=146)
Latin America (n=116)
Europe (n=106)
Asia (n=87)
Australia and New Zealand (n=29)
Middle East and
Africa (n=16)
Breadth of experience in your company 33% 32% 29% 35% 32% 38% 44%
Emotional intelligence 5% 3% 5% 6% 3% 10% 6%
Experience managing P&L 29% 34% 20% 43% 21% 14% 38%
Flexibility/adaptability to change or hardship 20% 14% 34% 15% 18% 21% 13%
Inclusive team management/people leadership skills 20% 16% 16% 13% 39% 17% 25%
Influencing and negotiating skills 27% 25% 31% 28% 26% 17% 25%
Informed risk-taking/entrepreneurship 14% 13% 14% 13% 18% 10% 0%
Innovation/creativity 6% 4% 10% 5% 8% 7% 0%
Operational/project-management skills 30% 38% 22% 32% 24% 41% 19%
Problem-solving skills 22% 25% 26% 18% 21% 21% 6%
Strategic visioning 31% 26% 44% 28% 30% 21% 38%
Networking with other groups 10% 6% 11% 8% 16% 10% 25%
Technical skills/depth of expertise 47% 62% 33% 49% 32% 62% 44%
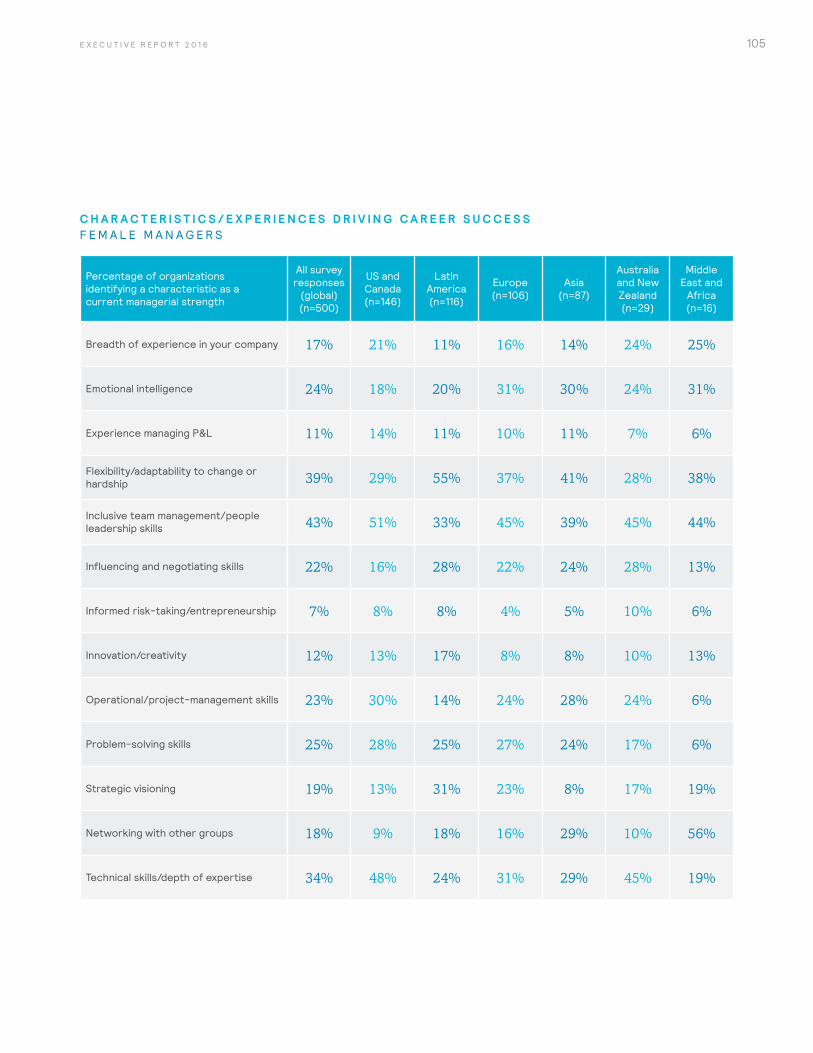
105E X E C U T I V E R E P O R T 2 0 1 6
C H A R A C T E R I S T I C S / E X P E R I E N C E S D R I V I N G C A R E E R S U C C E S S F E M A L E M A N A G E R S
Percentage of organizations identifying a characteristic as a current managerial strength
All survey responses
(global) (n=500)
US and Canada (n=146)
Latin America (n=116)
Europe (n=106)
Asia (n=87)
Australia and New Zealand (n=29)
Middle East and
Africa (n=16)
Breadth of experience in your company 17% 21% 11% 16% 14% 24% 25%
Emotional intelligence 24% 18% 20% 31% 30% 24% 31%
Experience managing P&L 11% 14% 11% 10% 11% 7% 6%
Flexibility/adaptability to change or hardship 39% 29% 55% 37% 41% 28% 38%
Inclusive team management/people leadership skills 43% 51% 33% 45% 39% 45% 44%
Influencing and negotiating skills 22% 16% 28% 22% 24% 28% 13%
Informed risk-taking/entrepreneurship 7% 8% 8% 4% 5% 10% 6%
Innovation/creativity 12% 13% 17% 8% 8% 10% 13%
Operational/project-management skills 23% 30% 14% 24% 28% 24% 6%
Problem-solving skills 25% 28% 25% 27% 24% 17% 6%
Strategic visioning 19% 13% 31% 23% 8% 17% 19%
Networking with other groups 18% 9% 18% 16% 29% 10% 56%
Technical skills/depth of expertise 34% 48% 24% 31% 29% 45% 19%
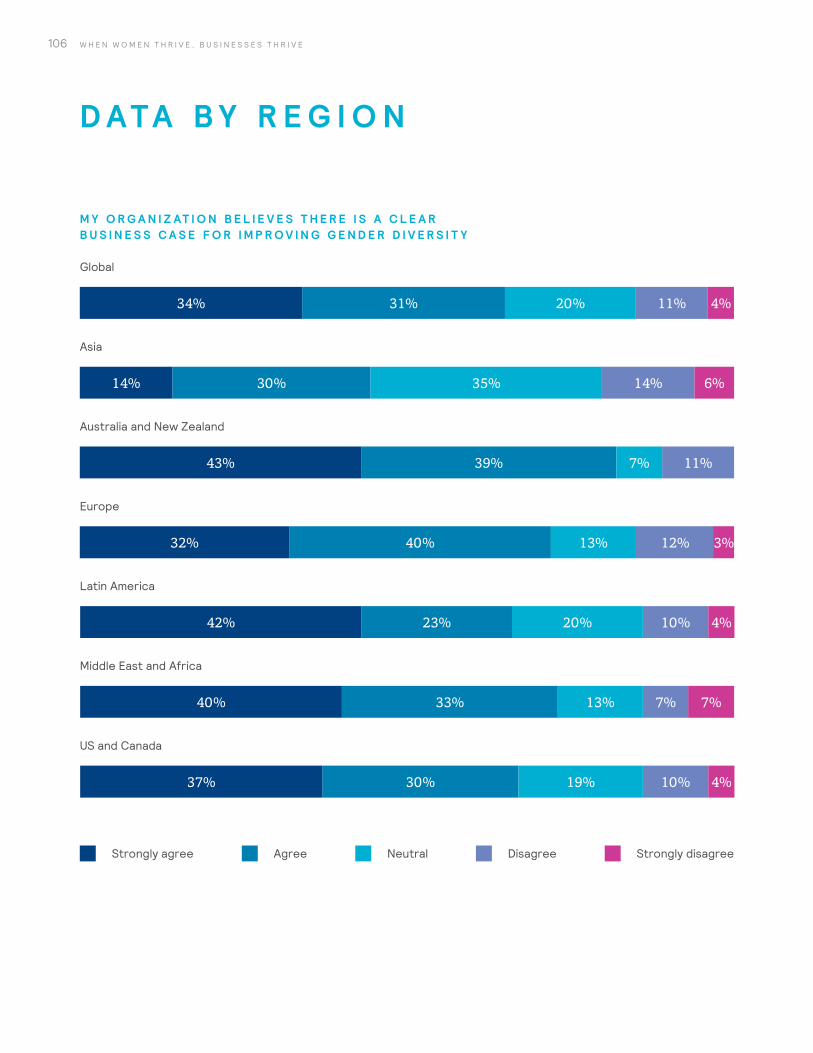
106 W H E N W O M E N T H R I V E , B U S I N E S S E S T H R I V E
US and Canada
Middle East and Africa
Europe
Australia and New Zealand
Asia
Global
Latin America
D ATA B Y R E G I O N
M Y O R G A N I Z AT I O N B E L I E V E S T H E R E I S A C L E A R B U S I N E S S C A S E F O R I M P R O V I N G G E N D E R D I V E R S I T Y
34%
30%
33%
23%
40%
39%
30%
31%
10%
7% 7%
10%
12%
11%
14%
11%
4%
4%
6%
4%
37%
40%
42%
32%
43%
14%
19%
13%
20%
13%
7%
35%
20%
Strongly agree Agree Neutral Disagree Strongly disagree
3%
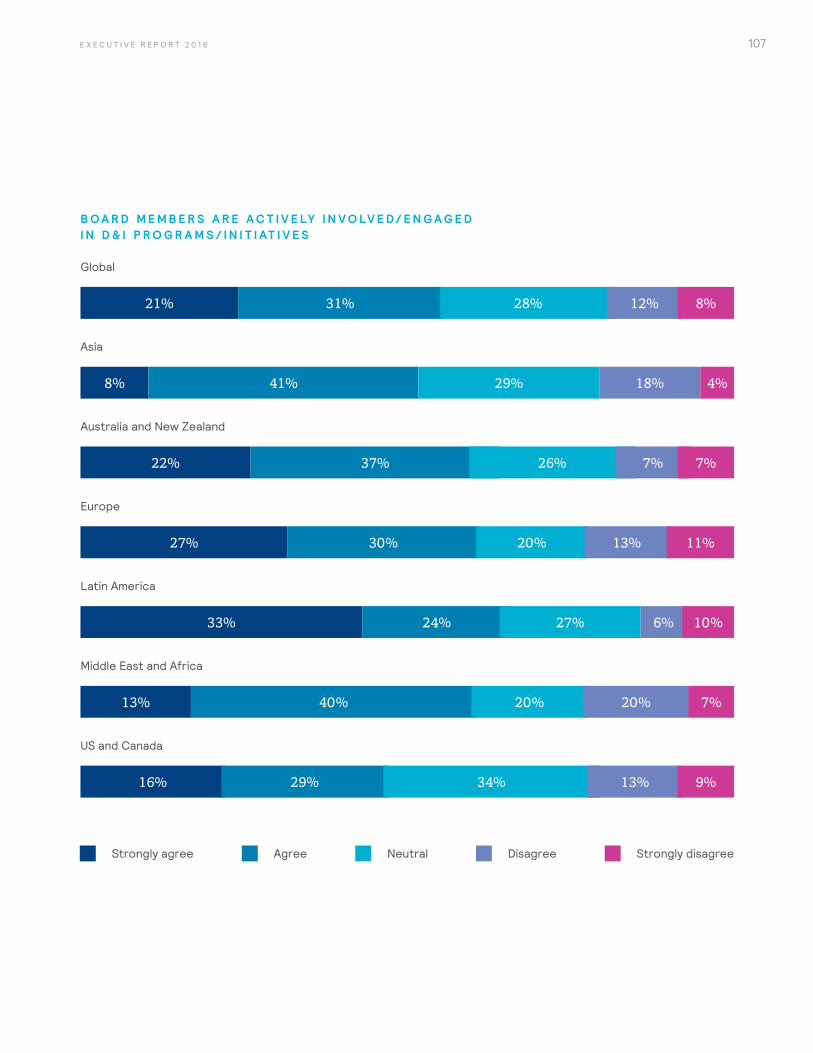
107E X E C U T I V E R E P O R T 2 0 1 6
B O A R D M E M B E R S A R E A C T I V E LY I N V O LV E D / E N G A G E D I N D & I P R O G R A M S / I N I T I AT I V E S
US and Canada
Middle East and Africa
Europe
Australia and New Zealand
Asia
Global
Latin America
16% 29% 34% 13% 9%
13% 40% 20% 20% 7%
33% 24% 27% 6% 10%
27% 30% 20% 13% 11%
8% 41% 29% 18% 4%
22% 37% 26% 7% 7%
21% 31% 28% 12% 8%
Strongly agree Agree Neutral Disagree Strongly disagree

108 W H E N W O M E N T H R I V E , B U S I N E S S E S T H R I V E
S E N I O R E X E C U T I V E S ( I . E . , C E O P L U S D I R E C T R E P O R T S ) A R E A C T I V E LY I N V O LV E D / E N G A G E D I N D & I P R O G R A M S / I N I T I AT I V E S
US and Canada
Middle East and Africa
Europe
Australia and New Zealand
Asia
Global
Latin America
22% 37% 20% 17% 3%
27% 47% 7% 13% 7%
27% 27% 30% 7% 9%
26% 33% 17% 13% 11%
10% 41% 27% 17% 5%
14% 43% 25% 7% 11%
22% 35% 23% 13% 7%
Strongly agree Agree Neutral Disagree Strongly disagree
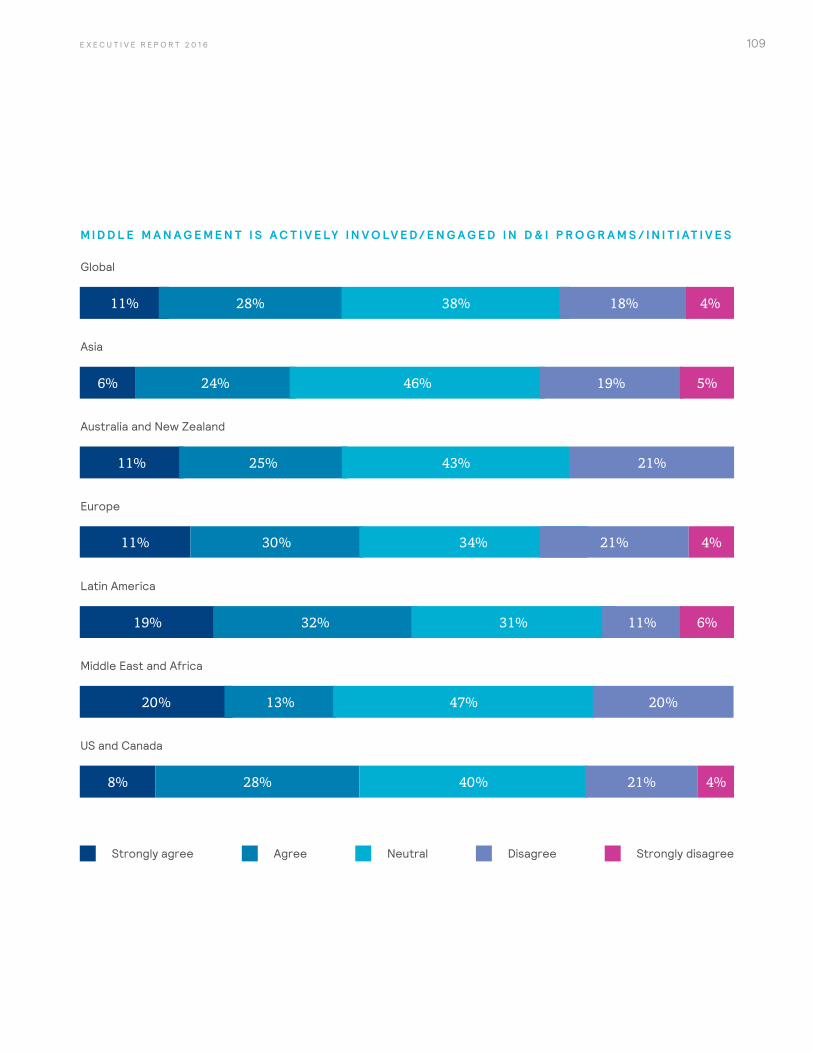
109E X E C U T I V E R E P O R T 2 0 1 6
M I D D L E M A N A G E M E N T I S A C T I V E LY I N V O LV E D / E N G A G E D I N D & I P R O G R A M S / I N I T I AT I V E S
US and Canada
Middle East and Africa
Europe
Australia and New Zealand
Asia
Global
Latin America
8% 28% 40% 21% 4%
20% 13% 47% 20%
19% 32% 31% 11% 6%
11% 30% 34% 21% 4%
11% 25% 43% 21%
6% 24% 46% 19% 5%
11% 28% 38% 18% 4%
Strongly agree Agree Neutral Disagree Strongly disagree
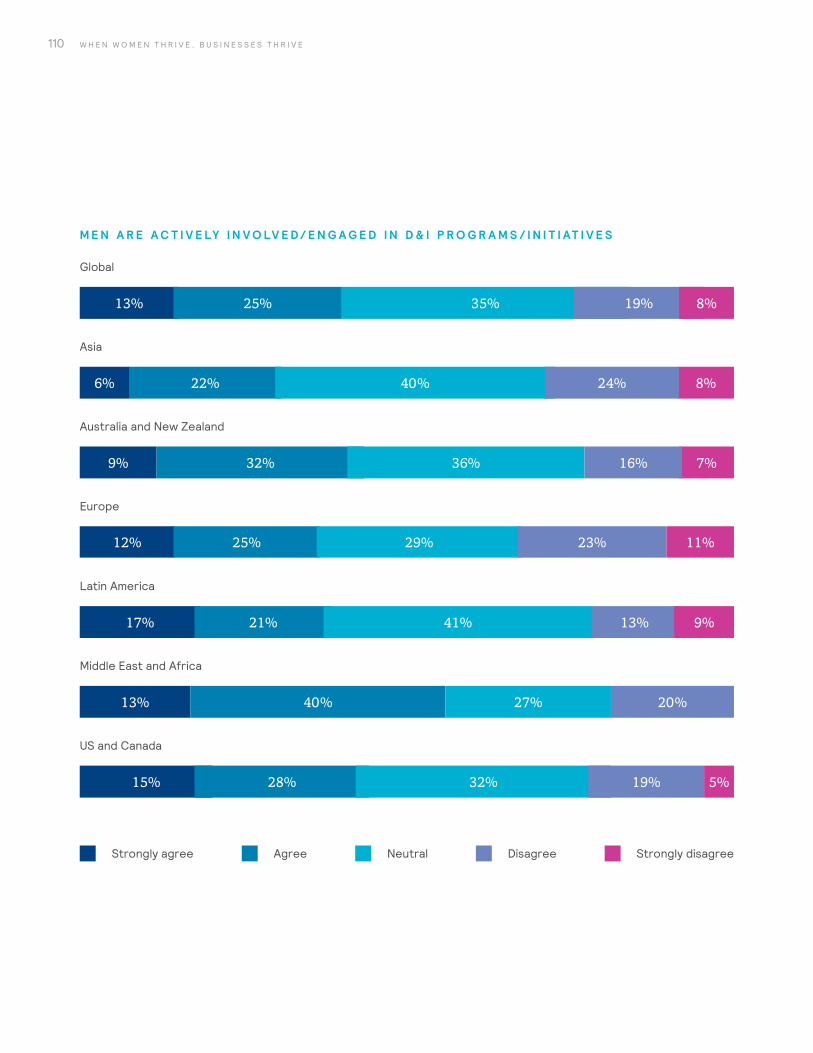
110 W H E N W O M E N T H R I V E , B U S I N E S S E S T H R I V E
M E N A R E A C T I V E LY I N V O LV E D / E N G A G E D I N D & I P R O G R A M S / I N I T I AT I V E S
US and Canada
Middle East and Africa
Europe
Australia and New Zealand
Asia
Global
Latin America
15% 28% 32% 19% 5%
13% 40% 27% 20%
17% 21% 41% 13% 9%
12% 25% 29% 23% 11%
8%6% 22% 40% 24%
9% 32% 36% 7%
13% 25% 35% 19% 8%
16%
Strongly agree Agree Neutral Disagree Strongly disagree
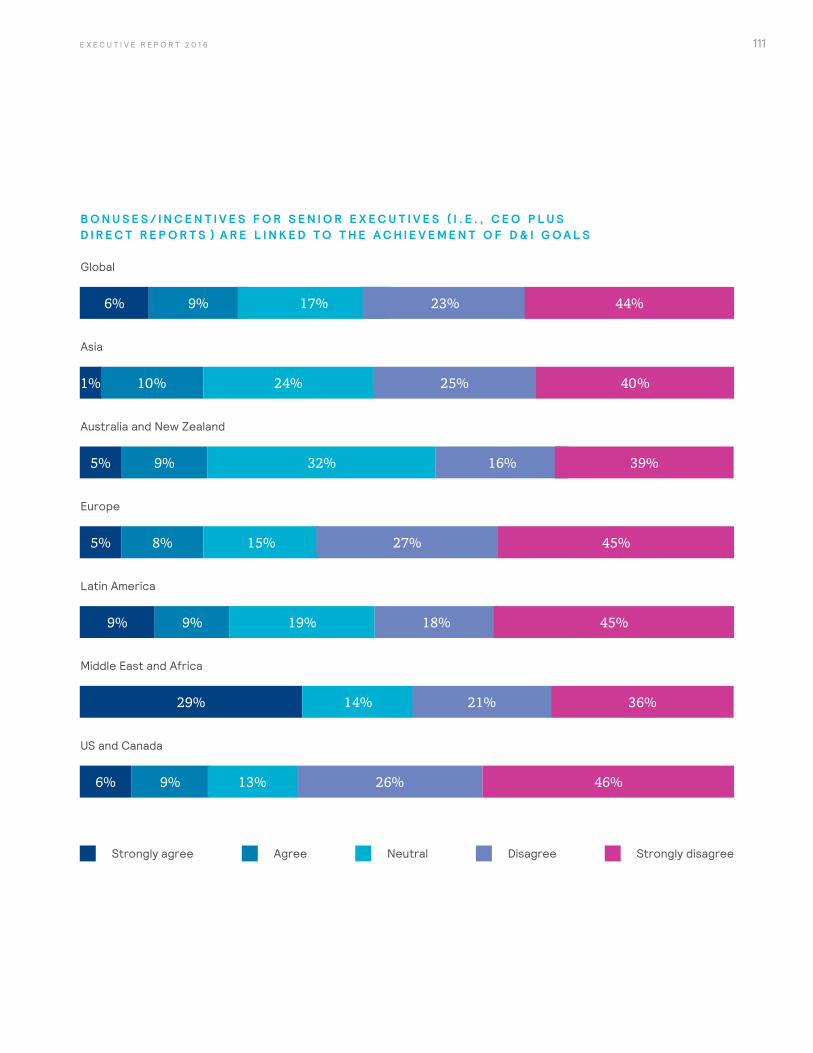
111E X E C U T I V E R E P O R T 2 0 1 6
B O N U S E S / I N C E N T I V E S F O R S E N I O R E X E C U T I V E S ( I . E . , C E O P L U S D I R E C T R E P O R T S ) A R E L I N K E D T O T H E A C H I E V E M E N T O F D & I G O A L S
US and Canada
Middle East and Africa
Europe
Australia and New Zealand
Asia
Global
Latin America
6% 9% 13% 26% 46%
29% 14% 21% 36%
9% 9% 19% 18% 45%
5% 8% 15% 27% 45%
5% 9% 32% 16% 39%
10% 24% 25% 40%
6% 9% 17% 23% 44%
Strongly agree Agree Neutral Disagree Strongly disagree
1%
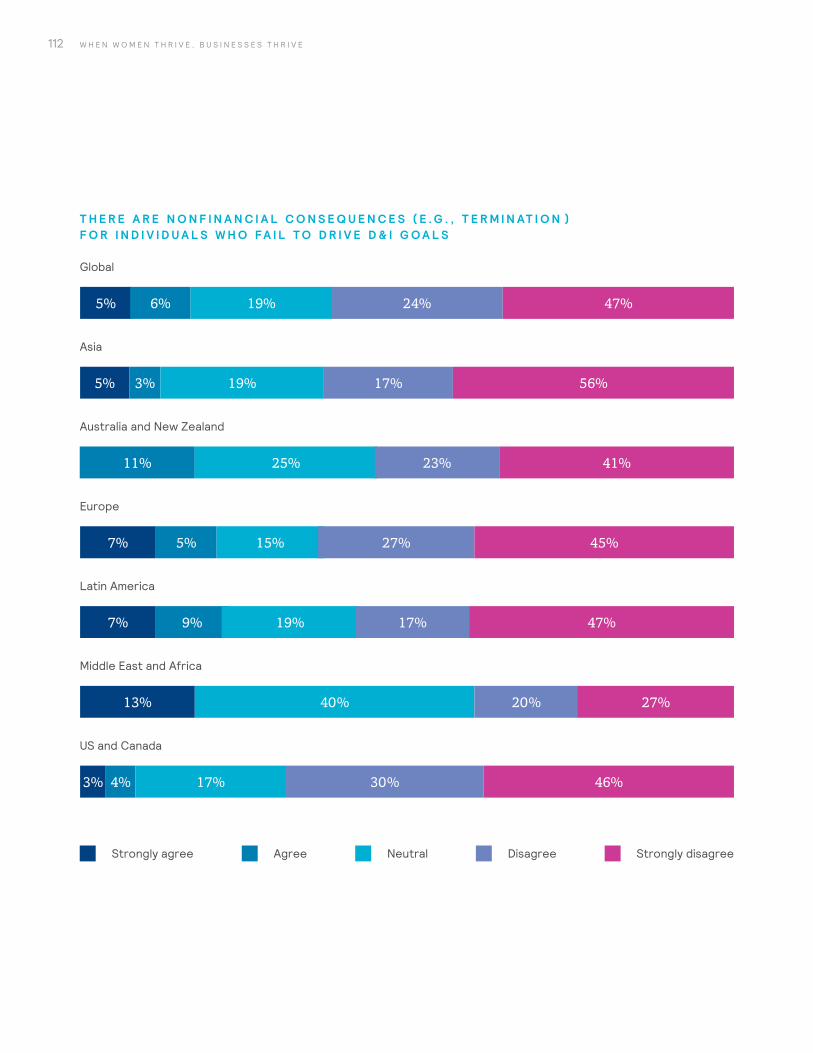
112 W H E N W O M E N T H R I V E , B U S I N E S S E S T H R I V E
T H E R E A R E N O N F I N A N C I A L C O N S E Q U E N C E S ( E . G . , T E R M I N AT I O N ) F O R I N D I V I D U A L S W H O FA I L T O D R I V E D & I G O A L S
US and Canada
Middle East and Africa
Europe
Australia and New Zealand
Asia
Global
Latin America
3% 4% 17% 30% 46%
13% 40% 20% 27%
7% 9% 19% 17% 47%
7% 5% 15% 27% 45%
5% 3% 19% 17% 56%
11% 25% 23% 41%
5% 6% 19% 24% 47%
Strongly agree Agree Neutral Disagree Strongly disagree
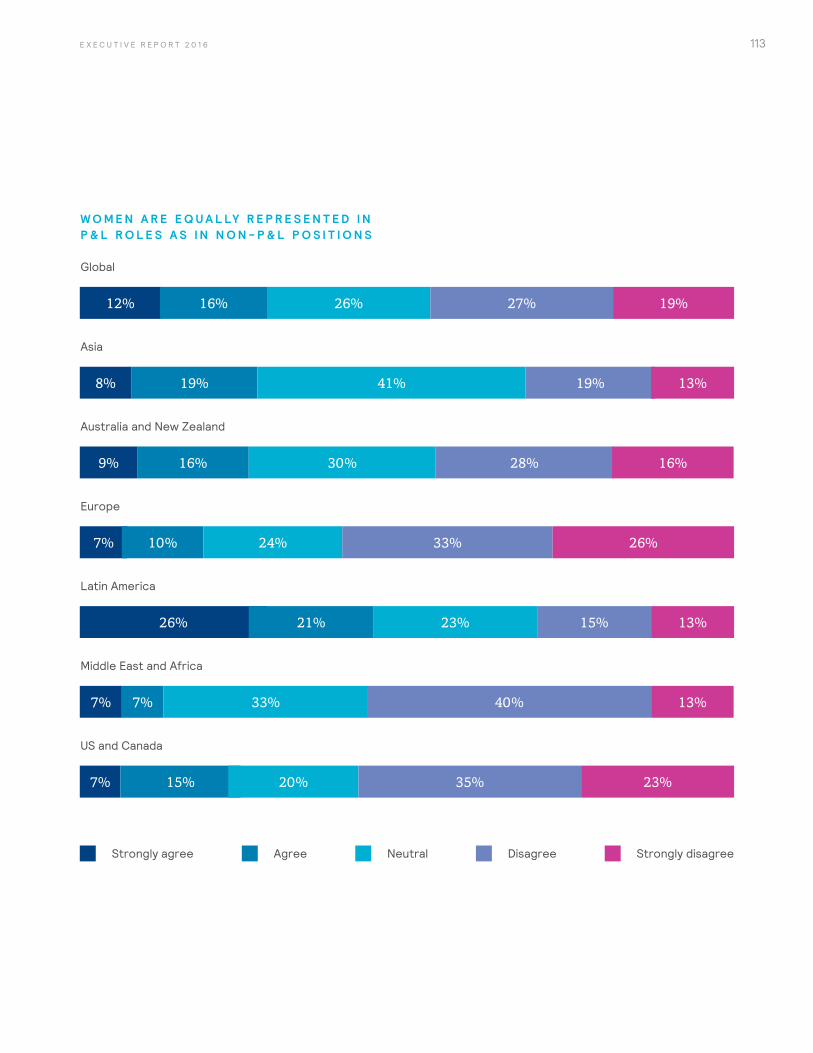
113E X E C U T I V E R E P O R T 2 0 1 6
W O M E N A R E E Q U A L LY R E P R E S E N T E D I N P & L R O L E S A S I N N O N - P & L P O S I T I O N S
US and Canada
Middle East and Africa
Europe
Australia and New Zealand
Asia
Global
Latin America
7% 15% 20% 35% 23%
7% 7% 33% 13%40%
26% 21% 23% 15% 13%
7% 10% 24% 33% 26%
9% 16% 30% 28% 16%
8% 19% 41% 19% 13%
12% 16% 26% 27% 19%
Strongly agree Agree Neutral Disagree Strongly disagree
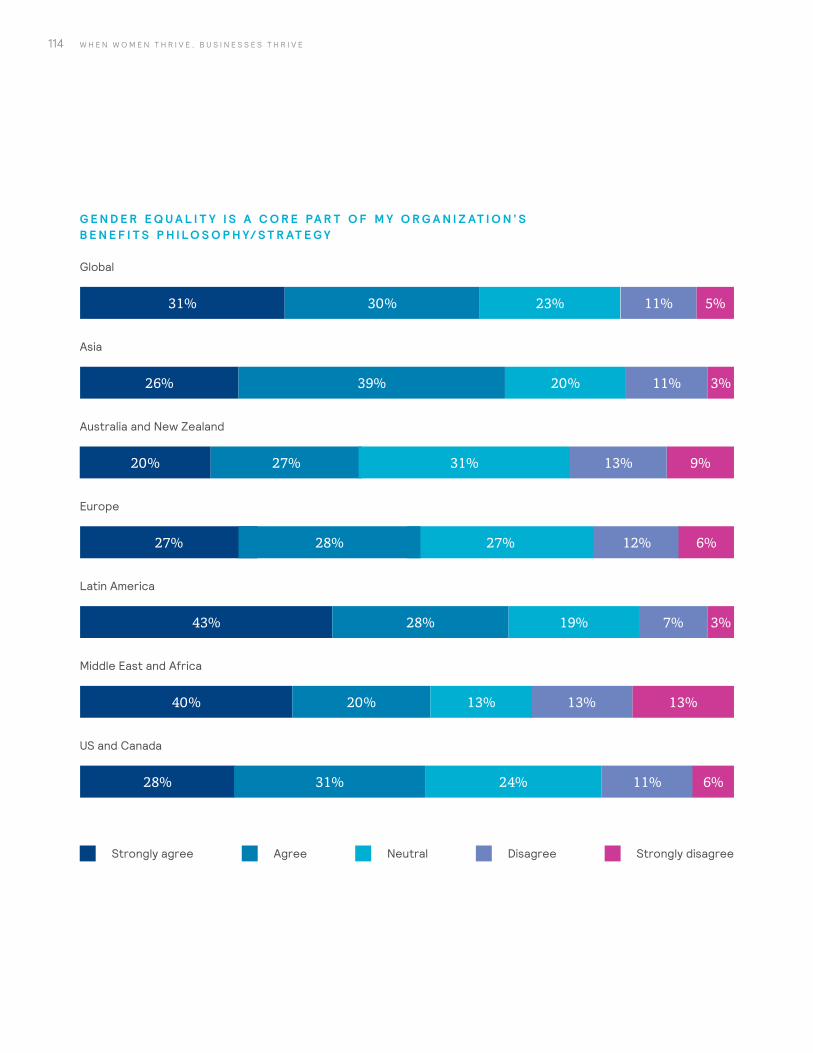
114 W H E N W O M E N T H R I V E , B U S I N E S S E S T H R I V E
G E N D E R E Q U A L I T Y I S A C O R E PA R T O F M Y O R G A N I Z AT I O N ’ S B E N E F I T S P H I L O S O P H Y/ S T R AT E G Y
US and Canada
Middle East and Africa
Europe
Australia and New Zealand
Asia
Global
Latin America
27% 27% 12% 6%28%
28% 31% 24% 11% 6%
40% 20% 13%13%13%
43% 28% 19% 7% 3%
26% 39% 20% 11% 3%
20% 27% 31% 9%13%
31% 30% 23% 5%11%
Strongly agree Agree Neutral Disagree Strongly disagree
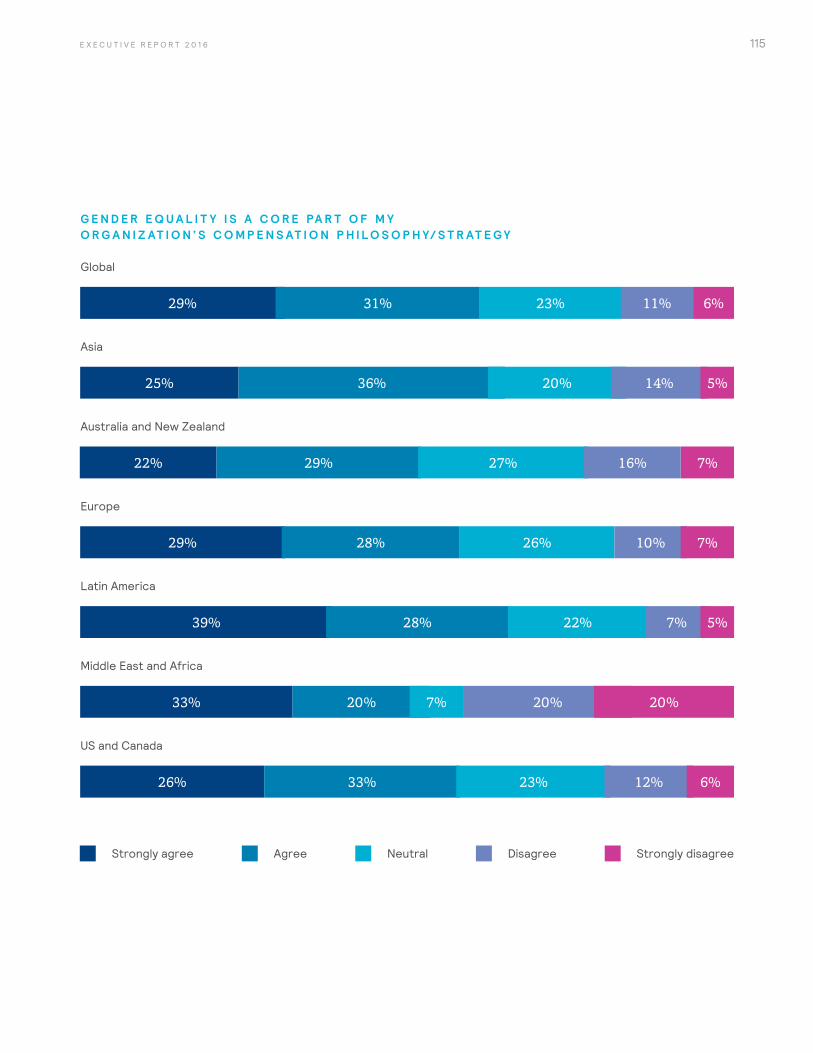
115E X E C U T I V E R E P O R T 2 0 1 6
G E N D E R E Q U A L I T Y I S A C O R E PA R T O F M Y O R G A N I Z AT I O N ’ S C O M P E N S AT I O N P H I L O S O P H Y/ S T R AT E G Y
US and Canada
Middle East and Africa
Europe
Australia and New Zealand
Asia
Global
Latin America
26% 33% 23% 12% 6%
29% 26% 10% 7%28%
20% 7%33% 20% 20%
39% 28% 22% 7% 5%
25% 36% 20% 14% 5%
22% 29% 27% 7%16%
29% 31% 23% 6%11%
Strongly agree Agree Neutral Disagree Strongly disagree
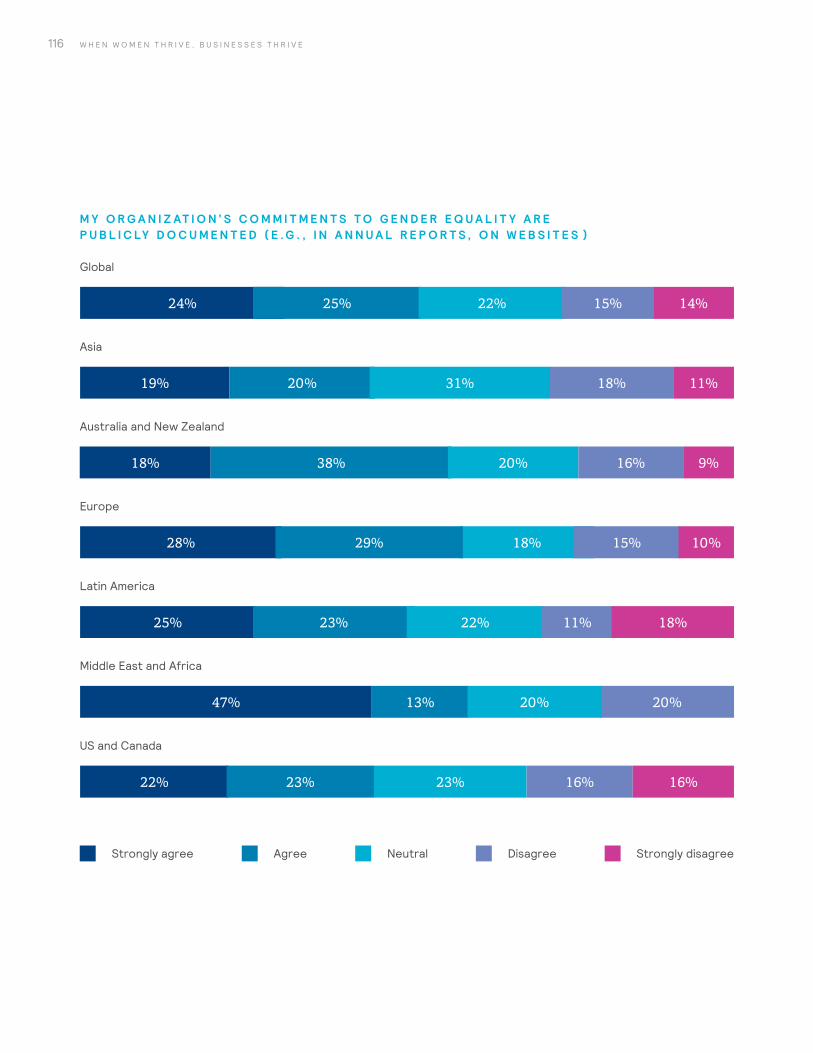
116 W H E N W O M E N T H R I V E , B U S I N E S S E S T H R I V E
M Y O R G A N I Z AT I O N ’ S C O M M I T M E N T S T O G E N D E R E Q U A L I T Y A R E P U B L I C LY D O C U M E N T E D ( E . G . , I N A N N U A L R E P O R T S , O N W E B S I T E S )
US and Canada
Middle East and Africa
Europe
Australia and New Zealand
Asia
Global
Latin America
22% 23% 23% 16% 16%
47% 13% 20%20%
25% 23% 22% 11% 18%
19% 20% 31% 18% 11%
18% 38% 20% 9%16%
24% 25% 22% 14%15%
28% 18% 15% 10%29%
Strongly agree Agree Neutral Disagree Strongly disagree
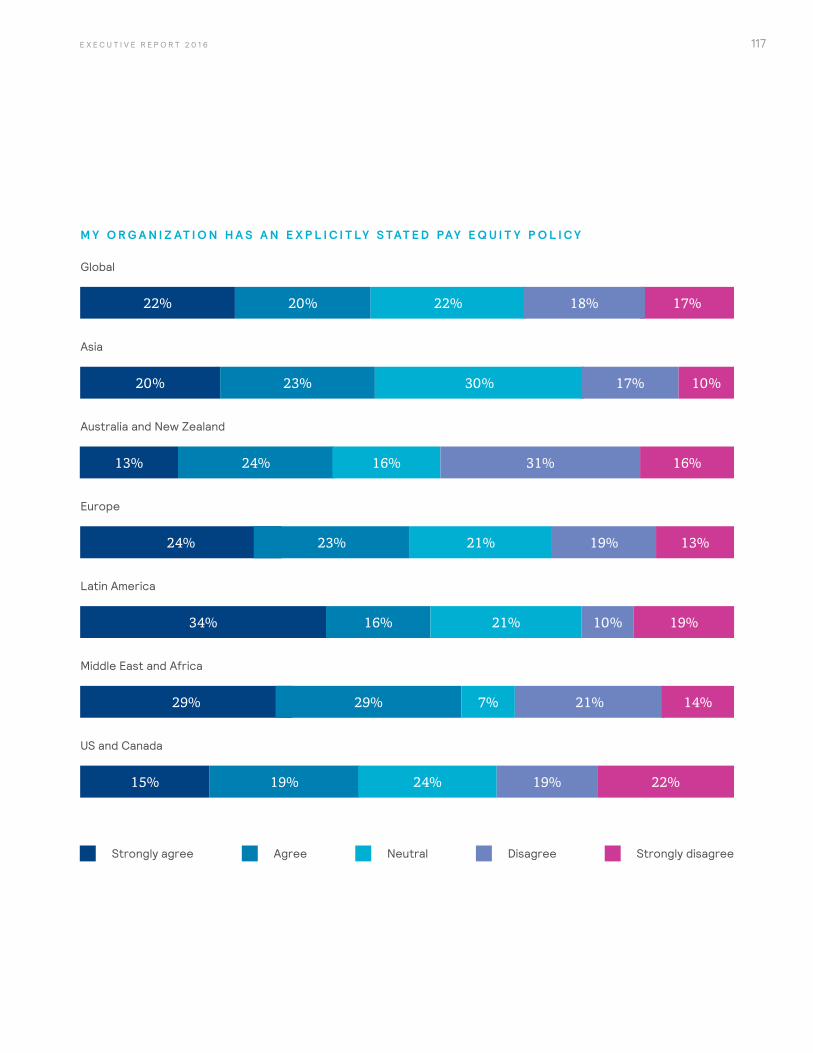
117E X E C U T I V E R E P O R T 2 0 1 6
M Y O R G A N I Z AT I O N H A S A N E X P L I C I T LY S TAT E D PAY E Q U I T Y P O L I C Y
US and Canada
Middle East and Africa
Europe
Australia and New Zealand
Asia
Global
Latin America
15% 19% 24% 19% 22%
34% 16% 21% 10% 19%
20% 23% 30% 17% 10%
13% 24% 16% 16%31%
22% 20% 22% 17%18%
24% 21% 19% 13%23%
29% 29% 7% 21% 14%
Strongly agree Agree Neutral Disagree Strongly disagree

118 W H E N W O M E N T H R I V E , B U S I N E S S E S T H R I V E
M Y O R G A N I Z AT I O N H A S A T E A M T H AT I S F O R M A L LY R E S P O N S I B L E F O R C O N D U C T I N G PAY E Q U I T Y A N A LY S I S
US and Canada
Middle East and Africa
Europe
Australia and New Zealand
Asia
Global
Latin America
23%
9% 15% 28% 23% 25%
18% 24% 18% 27%13%
23% 22% 21% 19%15%
19% 19% 14%
14%15%
24%24%
32% 17% 9% 17%25%
21%
28%
14% 14%21%
21%
29%
Strongly agree Agree Neutral Disagree Strongly disagree
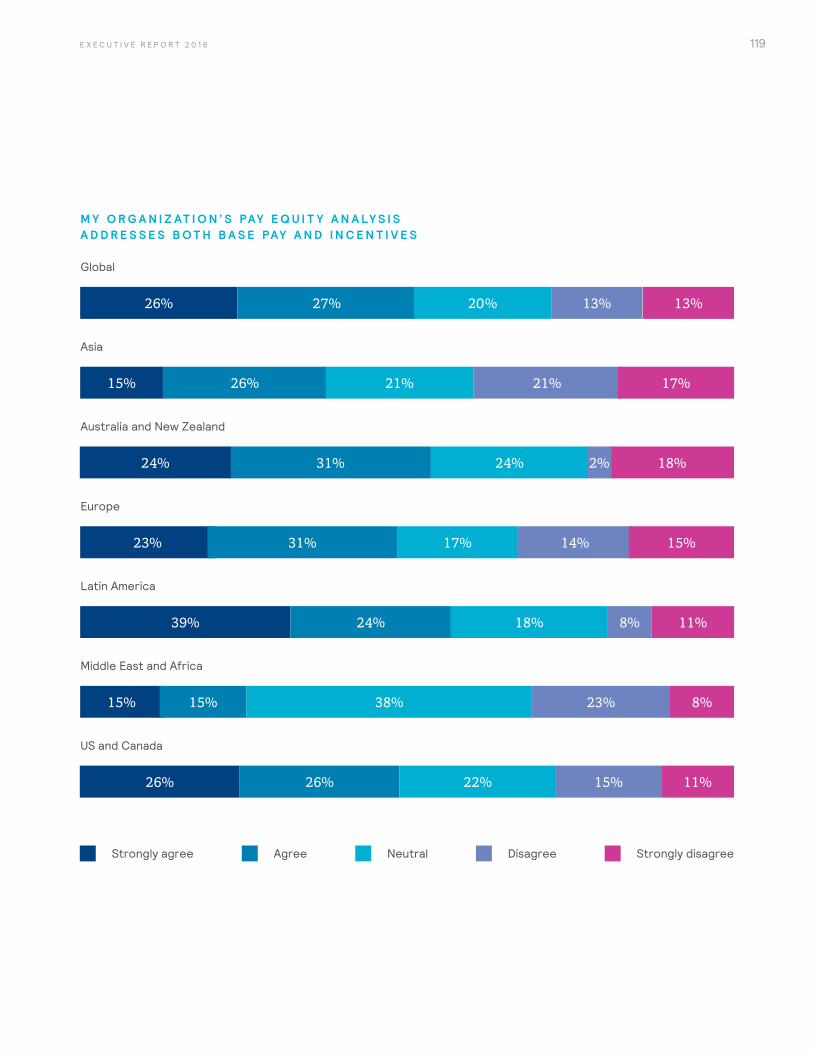
119E X E C U T I V E R E P O R T 2 0 1 6
M Y O R G A N I Z AT I O N ’ S PAY E Q U I T Y A N A LY S I S A D D R E S S E S B O T H B A S E PAY A N D I N C E N T I V E S
US and Canada
Middle East and Africa
Europe
Australia and New Zealand
Asia
Global
Latin America
15% 15% 38% 23% 8%
23% 14%17% 15%31%
26% 26% 22% 15% 11%
39% 24% 18% 8% 11%
15% 26% 21%21% 17%
31%24% 24% 18%2%
26% 27% 20% 13%13%
Strongly agree Agree Neutral Disagree Strongly disagree
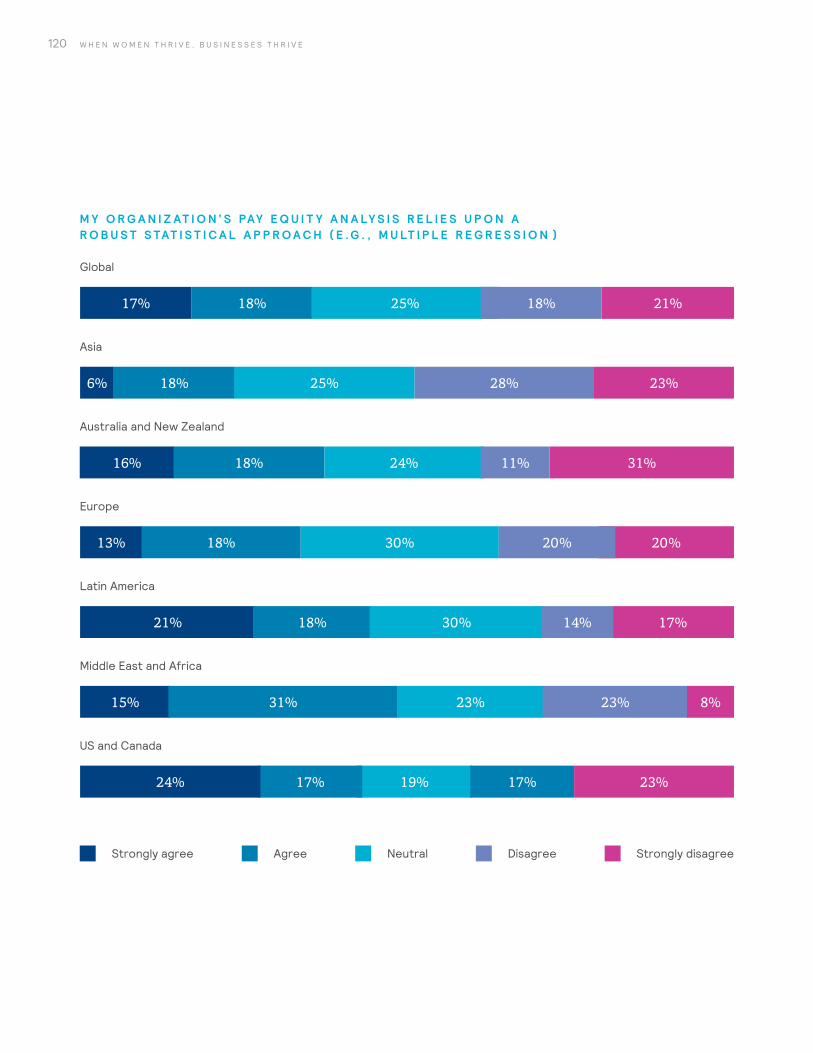
120 W H E N W O M E N T H R I V E , B U S I N E S S E S T H R I V E
M Y O R G A N I Z AT I O N ’ S PAY E Q U I T Y A N A LY S I S R E L I E S U P O N A R O B U S T S TAT I S T I C A L A P P R O A C H ( E . G . , M U LT I P L E R E G R E S S I O N )
US and Canada
Middle East and Africa
Europe
Australia and New Zealand
Asia
Global
Latin America
6% 18% 25% 28% 23%
20%13% 30% 20%18%
17% 18% 25% 21%18%
19%17% 17% 23%24%
17%21% 18% 30% 14%
15% 31% 23% 23% 8%
16% 18% 24% 31%11%
Strongly agree Agree Neutral Disagree Strongly disagree
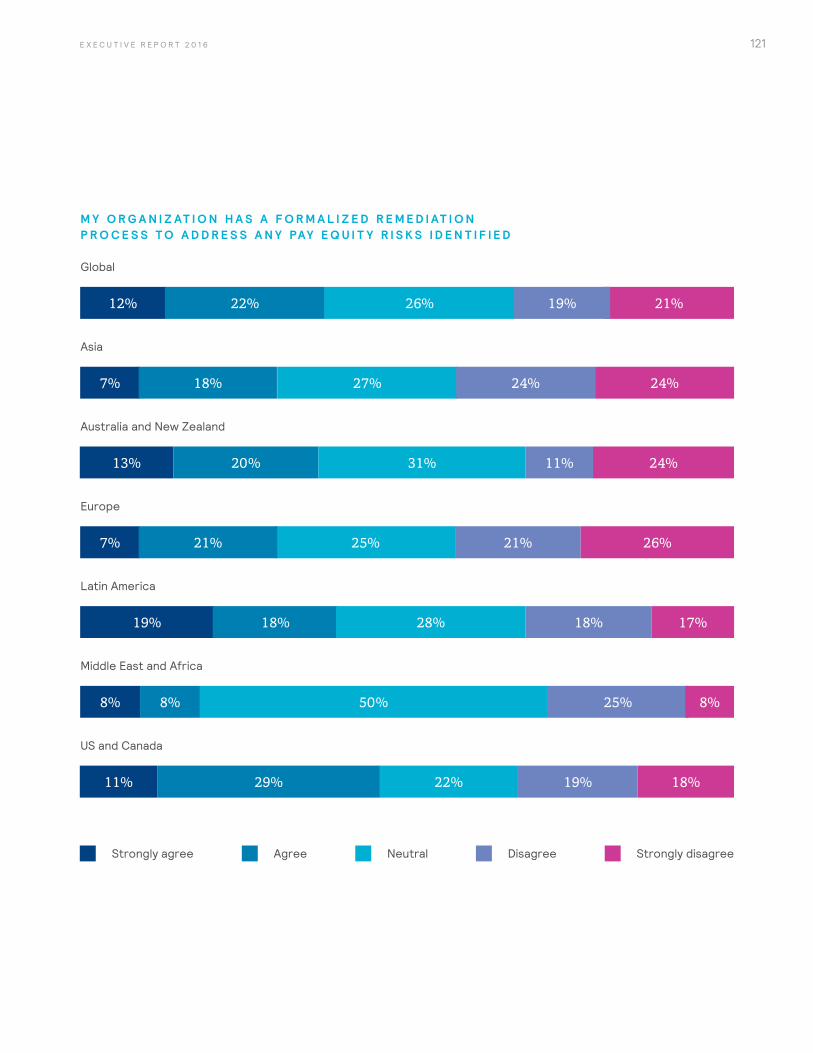
121E X E C U T I V E R E P O R T 2 0 1 6
M Y O R G A N I Z AT I O N H A S A F O R M A L I Z E D R E M E D I AT I O N P R O C E S S T O A D D R E S S A N Y PAY E Q U I T Y R I S K S I D E N T I F I E D
US and Canada
Middle East and Africa
Europe
Australia and New Zealand
Asia
Global
Latin America
7% 25% 21% 26%21%
8% 8% 50% 25% 8%
29%11% 22% 19% 18%
19% 18% 28% 18% 17%
7% 18% 27% 24% 24%
13% 20% 31% 24%11%
12% 22% 26% 21%19%
Strongly agree Agree Neutral Disagree Strongly disagree
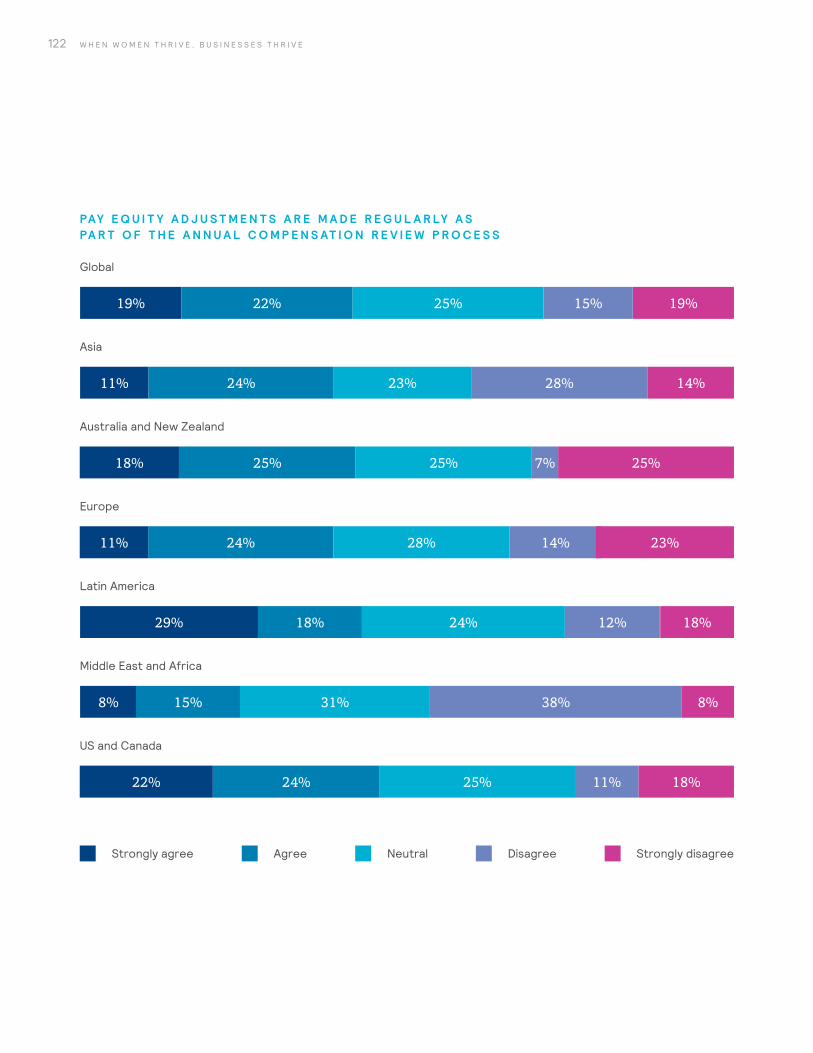
122 W H E N W O M E N T H R I V E , B U S I N E S S E S T H R I V E
PAY E Q U I T Y A D J U S T M E N T S A R E M A D E R E G U L A R LY A S PA R T O F T H E A N N U A L C O M P E N S AT I O N R E V I E W P R O C E S S
US and Canada
Middle East and Africa
Europe
Australia and New Zealand
Asia
Global
Latin America
29% 18% 24% 18%12%
8% 15% 38% 8%31%
24%11% 28% 14% 23%
11% 24% 23% 28% 14%
18% 25% 25% 25%7%
19% 22% 25% 19%15%
24%22% 25% 11% 18%
Strongly agree Agree Neutral Disagree Strongly disagree
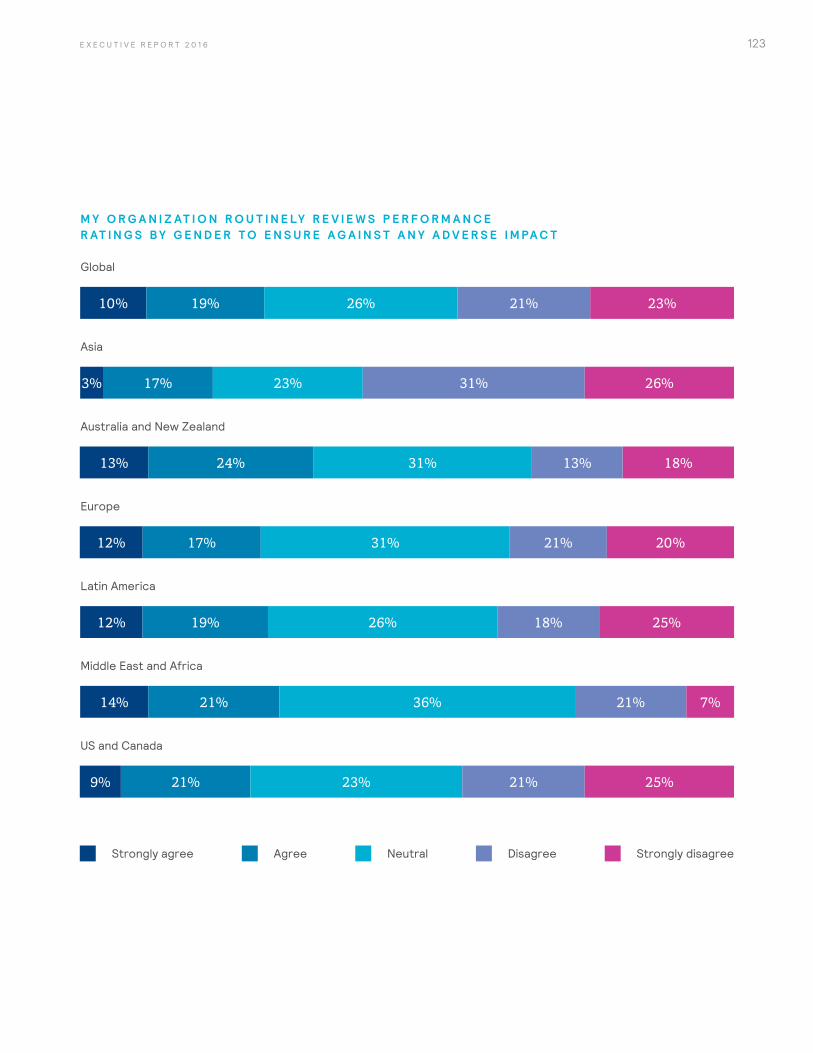
123E X E C U T I V E R E P O R T 2 0 1 6
M Y O R G A N I Z AT I O N R O U T I N E LY R E V I E W S P E R F O R M A N C E R AT I N G S B Y G E N D E R T O E N S U R E A G A I N S T A N Y A D V E R S E I M PA C T
US and Canada
Middle East and Africa
Europe
Australia and New Zealand
Asia
Global
Latin America
12% 19% 26% 25%18%
14% 21% 21% 7%36%
17%12% 31% 21% 20%
3% 17% 23% 31% 26%
13% 24% 31% 18%13%
10% 19% 26% 23%21%
21%9% 23% 21% 25%
Strongly agree Agree Neutral Disagree Strongly disagree
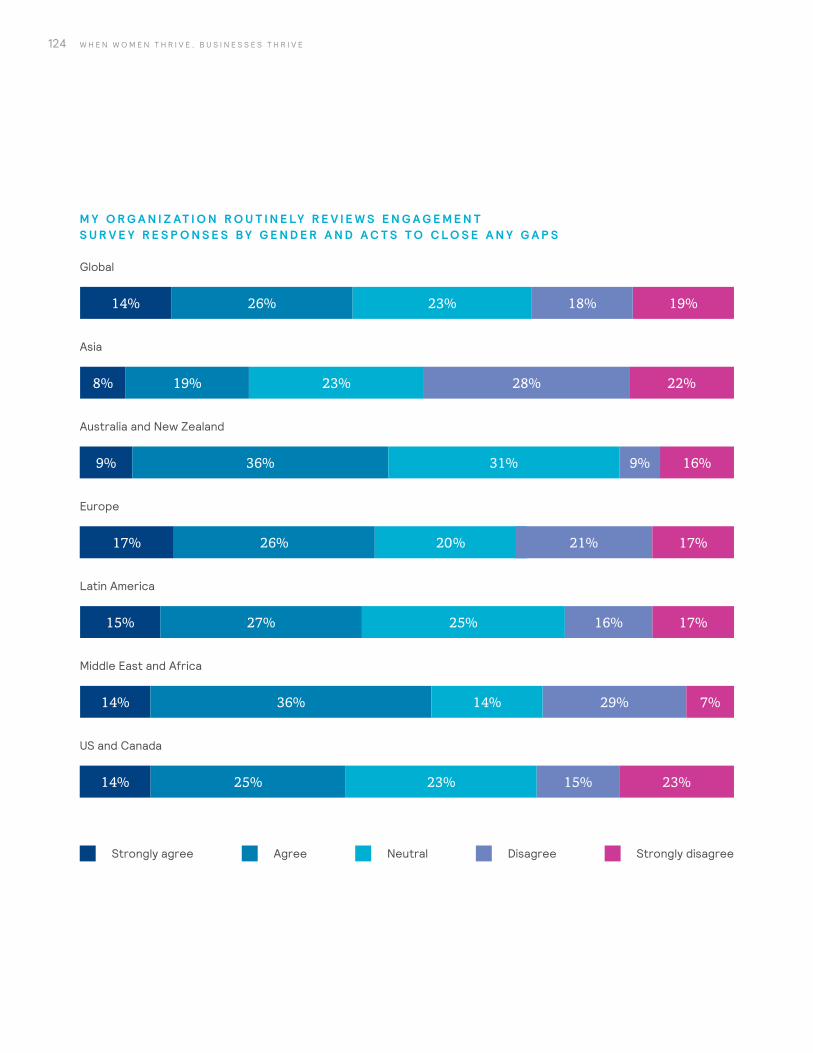
124 W H E N W O M E N T H R I V E , B U S I N E S S E S T H R I V E
M Y O R G A N I Z AT I O N R O U T I N E LY R E V I E W S E N G A G E M E N T S U R V E Y R E S P O N S E S B Y G E N D E R A N D A C T S T O C L O S E A N Y G A P S
US and Canada
Middle East and Africa
Europe
Australia and New Zealand
Asia
Global
Latin America
15% 27% 25% 17%16%
14% 36% 29% 7%14%
26%17% 20% 21% 17%
8% 19% 23% 28% 22%
9% 36% 31% 16%9%
14% 26% 23% 19%18%
25%14% 23% 15% 23%
Strongly agree Agree Neutral Disagree Strongly disagree
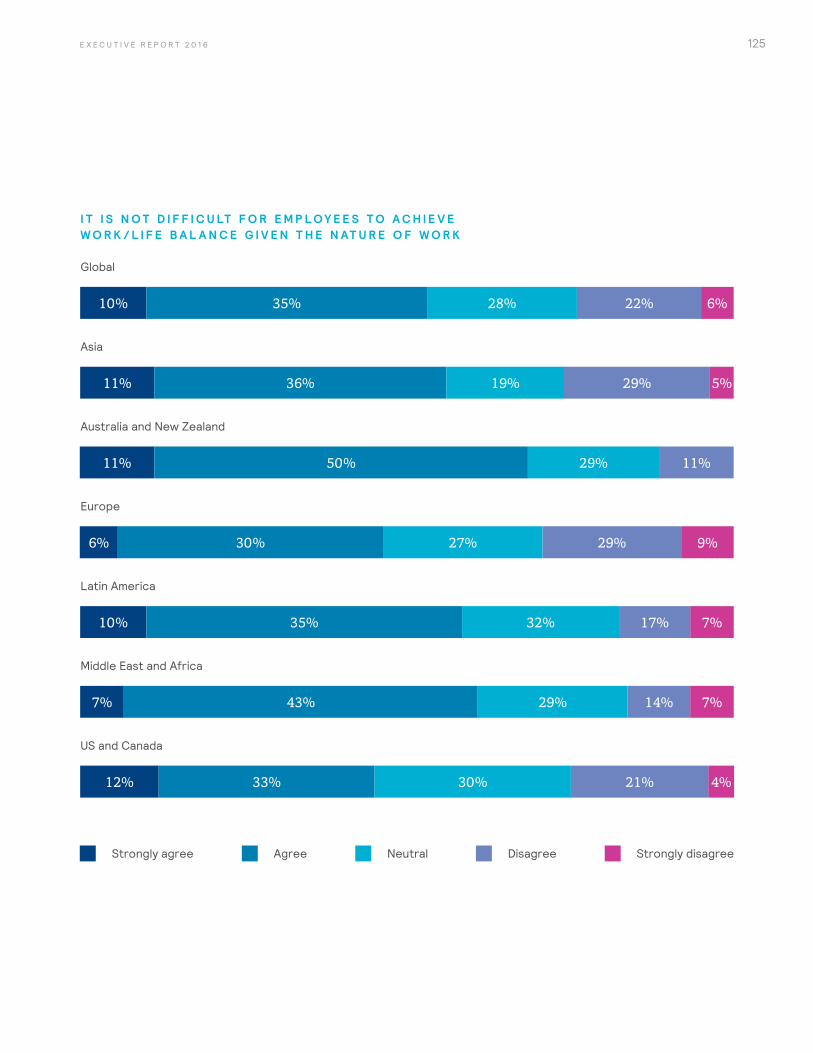
125E X E C U T I V E R E P O R T 2 0 1 6
I T I S N O T D I F F I C U LT F O R E M P L O Y E E S T O A C H I E V E W O R K / L I F E B A L A N C E G I V E N T H E N AT U R E O F W O R K
US and Canada
Middle East and Africa
Europe
Australia and New Zealand
Asia
Global
Latin America
10% 35% 32% 7%17%
7% 43% 14% 7%29%
30%6% 27% 29% 9%
11% 36% 19% 29% 5%
11% 50% 29% 11%
10% 35% 28% 6%22%
12% 4%
Strongly agree Agree Neutral Disagree Strongly disagree
33% 30% 21%
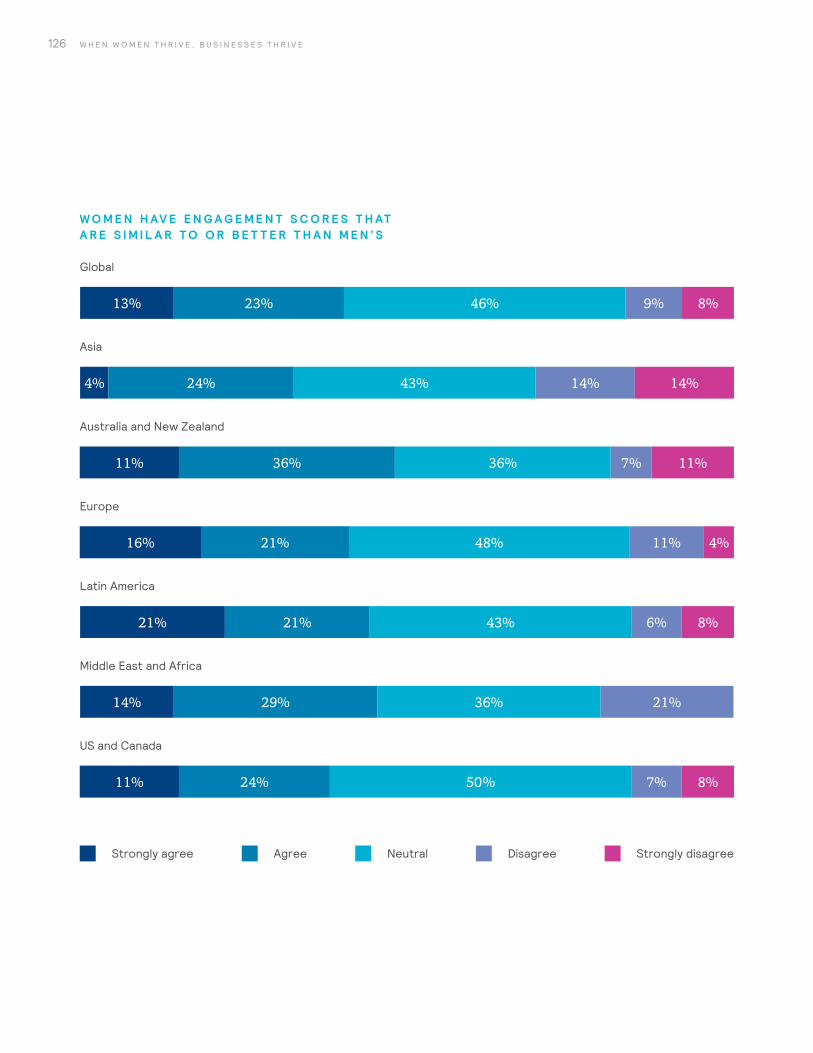
126 W H E N W O M E N T H R I V E , B U S I N E S S E S T H R I V E
W O M E N H AV E E N G A G E M E N T S C O R E S T H AT A R E S I M I L A R T O O R B E T T E R T H A N M E N ’ S
US and Canada
Middle East and Africa
Europe
Australia and New Zealand
Asia
Global
Latin America
8%11% 7%24% 50%
14% 29% 21%36%
21% 43% 8%6%21%
21%16% 48% 11% 4%
4% 24% 43% 14% 14%
11% 36%36% 11%7%
13% 23% 46% 8%9%
Strongly agree Agree Neutral Disagree Strongly disagree
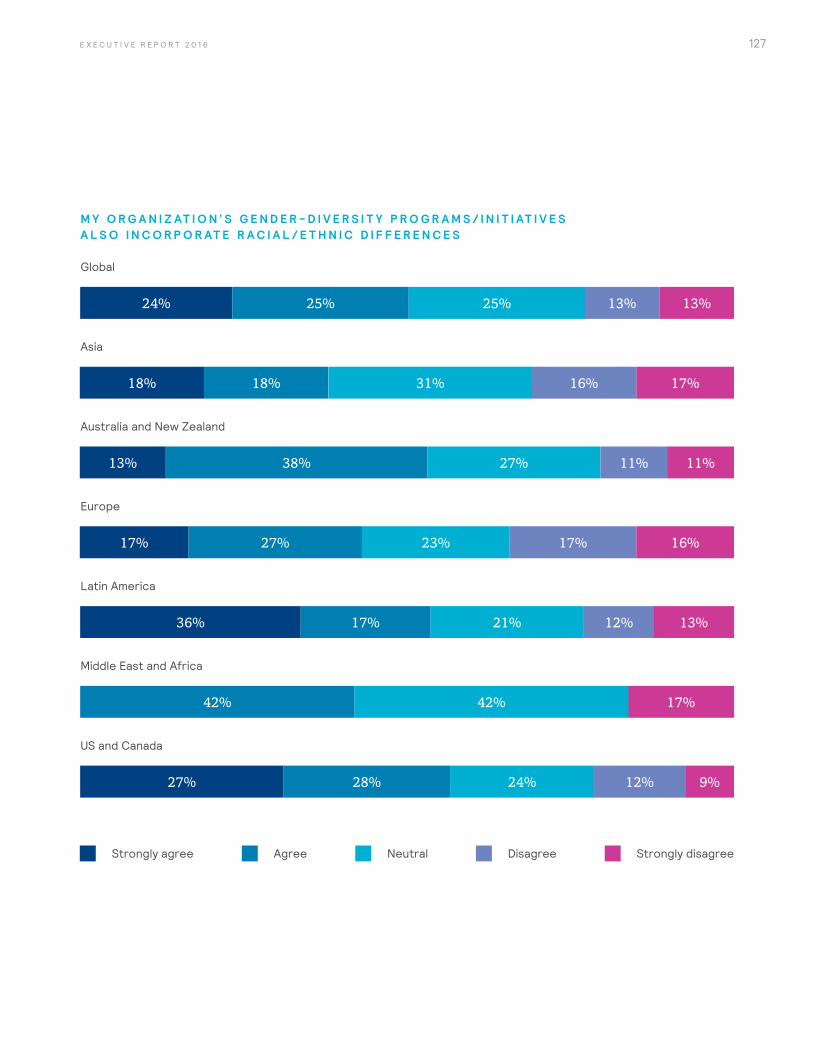
127E X E C U T I V E R E P O R T 2 0 1 6
M Y O R G A N I Z AT I O N ’ S G E N D E R - D I V E R S I T Y P R O G R A M S / I N I T I AT I V E S A L S O I N C O R P O R AT E R A C I A L / E T H N I C D I F F E R E N C E S
US and Canada
Middle East and Africa
Europe
Australia and New Zealand
Asia
Global
Latin America
36% 21%17% 13%12%
27%17% 23% 17% 16%
18%18% 31% 17%16%
13% 38% 27% 11%11%
24% 25%25% 13%13%
17%42%42%
24%28%27% 12% 9%
Strongly agree Agree Neutral Disagree Strongly disagree
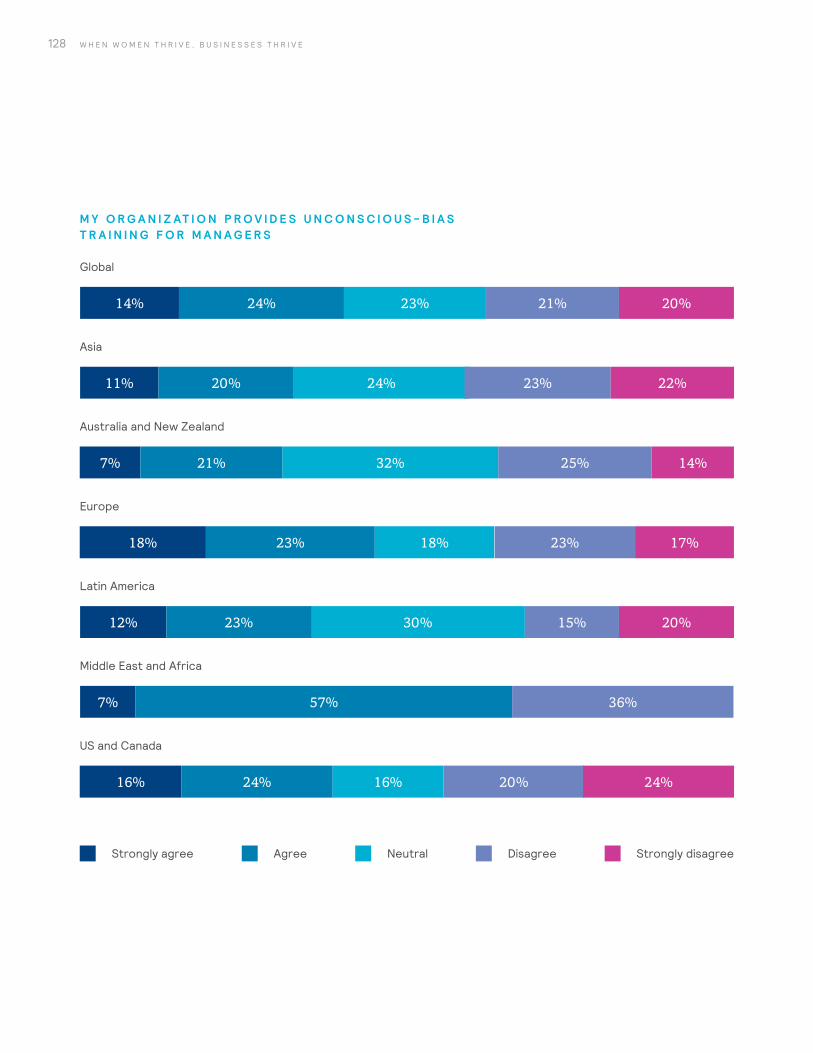
128 W H E N W O M E N T H R I V E , B U S I N E S S E S T H R I V E
M Y O R G A N I Z AT I O N P R O V I D E S U N C O N S C I O U S - B I A S T R A I N I N G F O R M A N A G E R S
US and Canada
Middle East and Africa
Europe
Australia and New Zealand
Asia
Global
Latin America
12% 30% 20%15%23%
7% 57% 36%
23%18% 18% 23% 17%
11% 20% 24% 23% 22%
7% 32%21% 14%25%
14% 24% 23% 21% 20%
16% 16%24% 20% 24%
Strongly agree Agree Neutral Disagree Strongly disagree
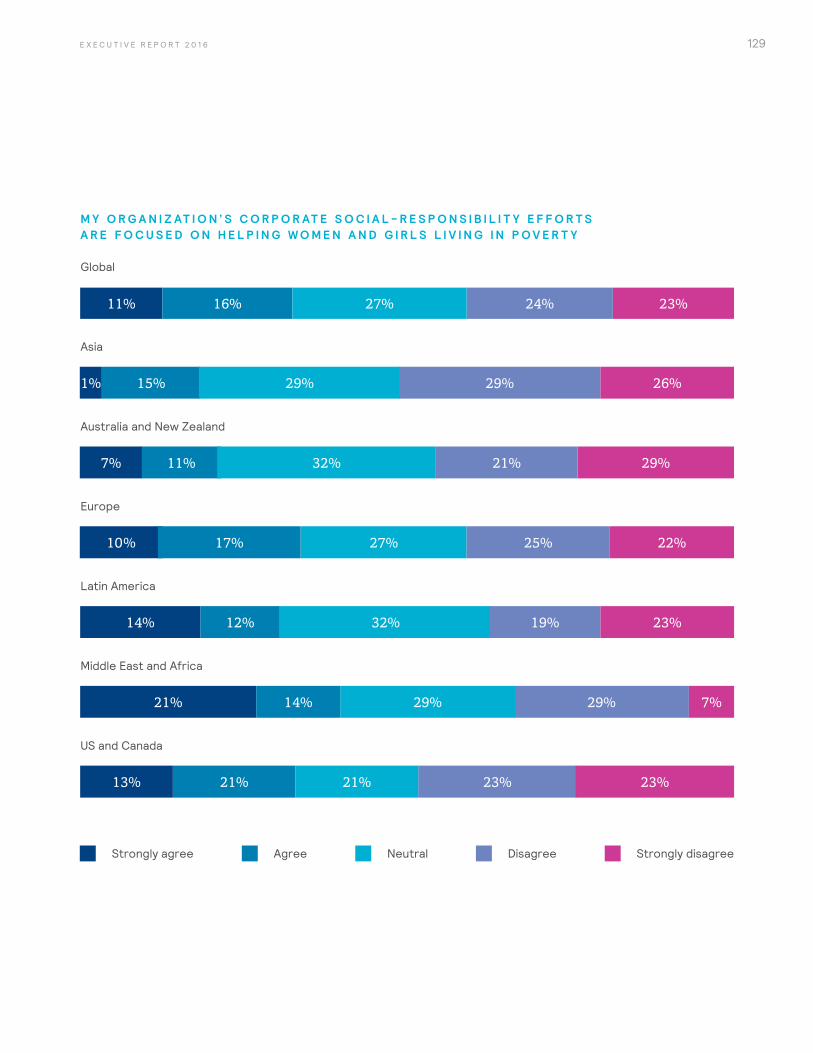
129E X E C U T I V E R E P O R T 2 0 1 6
M Y O R G A N I Z AT I O N ’ S C O R P O R AT E S O C I A L - R E S P O N S I B I L I T Y E F F O R T S A R E F O C U S E D O N H E L P I N G W O M E N A N D G I R L S L I V I N G I N P O V E R T Y
US and Canada
Middle East and Africa
Europe
Australia and New Zealand
Asia
Global
Latin America
11% 16% 23%24%27%
21% 29%29% 7%14%
14% 32% 19%12% 23%
15%1% 29% 29% 26%
7% 11% 32% 29%21%
23% 23%21% 21%13%
10% 27% 25% 22%17%
Strongly agree Agree Neutral Disagree Strongly disagree
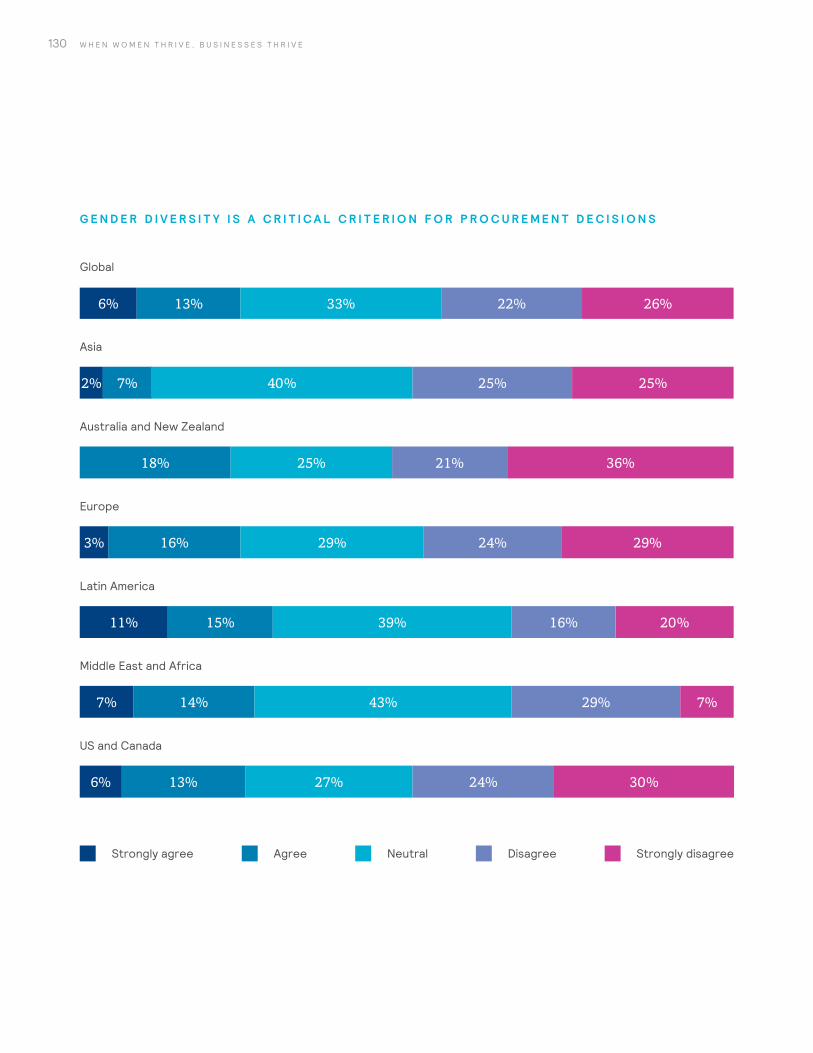
130 W H E N W O M E N T H R I V E , B U S I N E S S E S T H R I V E
G E N D E R D I V E R S I T Y I S A C R I T I C A L C R I T E R I O N F O R P R O C U R E M E N T D E C I S I O N S
US and Canada
Middle East and Africa
Europe
Australia and New Zealand
Asia
Global
Latin America
11% 15% 39% 20%16%
7% 14% 29% 7%43%
16%3% 29% 24% 29%
2% 7% 40% 25% 25%
18% 25% 36%21%
6% 13% 33% 26%22%
13%6% 27% 24% 30%
Strongly agree Agree Neutral Disagree Strongly disagree
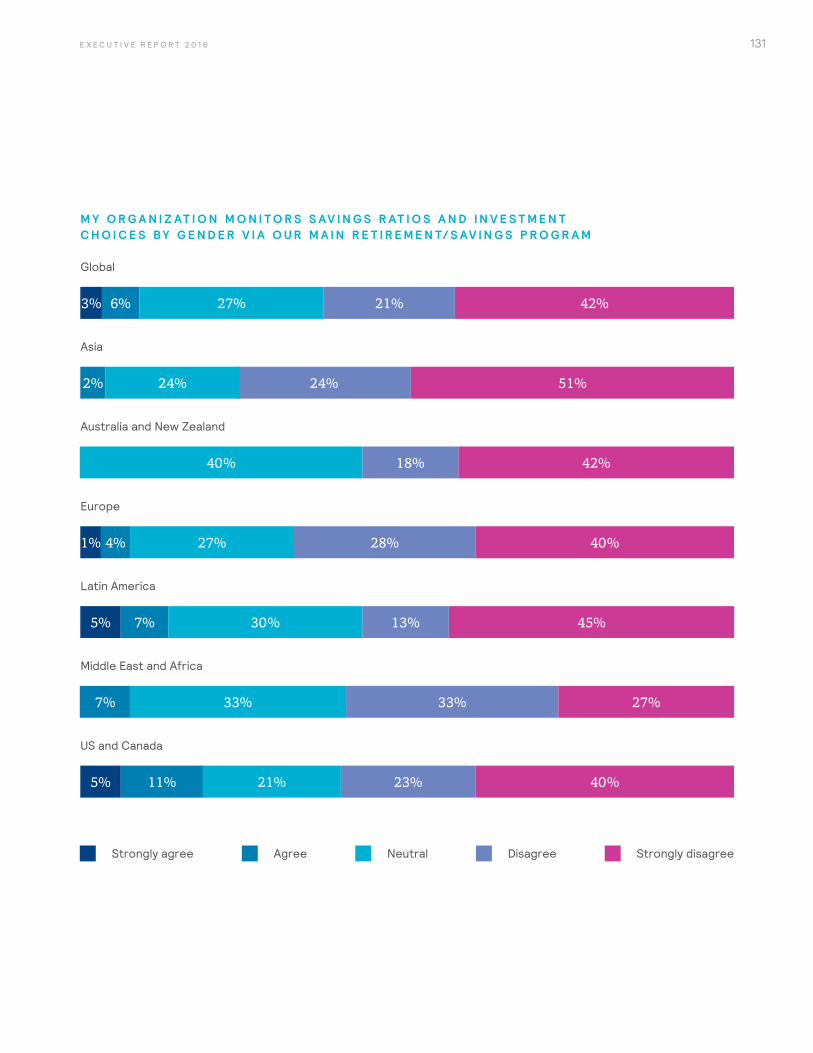
131E X E C U T I V E R E P O R T 2 0 1 6
M Y O R G A N I Z AT I O N M O N I T O R S S AV I N G S R AT I O S A N D I N V E S T M E N T C H O I C E S B Y G E N D E R V I A O U R M A I N R E T I R E M E N T/ S AV I N G S P R O G R A M
US and Canada
Middle East and Africa
Europe
Australia and New Zealand
Asia
Global
Latin America
1% 27% 28% 40%
2% 24% 51%
40% 42%18%
3% 6% 27% 42%21%
5% 7% 30% 45%13%
7% 33% 27%33%
11%5% 21% 23% 40%
4%
24%
Strongly agree Agree Neutral Disagree Strongly disagree
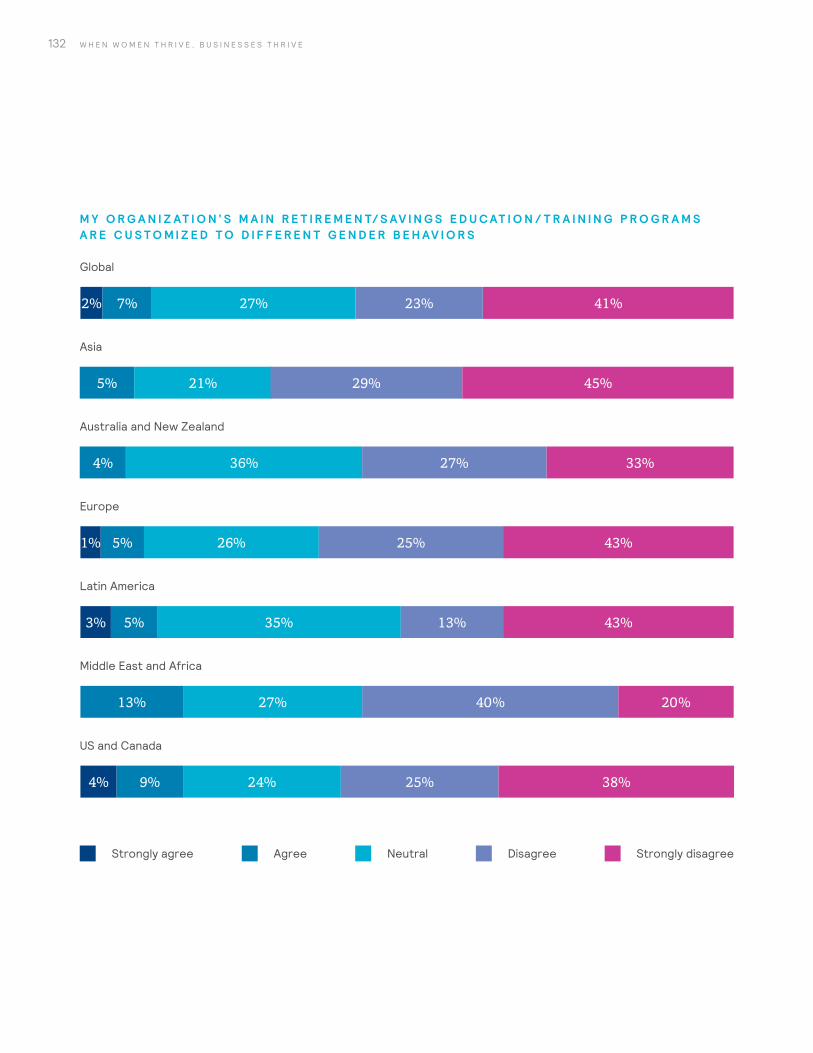
132 W H E N W O M E N T H R I V E , B U S I N E S S E S T H R I V E
M Y O R G A N I Z AT I O N ’ S M A I N R E T I R E M E N T/ S AV I N G S E D U C AT I O N / T R A I N I N G P R O G R A M S A R E C U S T O M I Z E D T O D I F F E R E N T G E N D E R B E H AV I O R S
US and Canada
Middle East and Africa
Europe
Australia and New Zealand
Asia
Global
Latin America
3% 5% 35% 43%13%
13% 40% 20%27%
5%1% 26% 25% 43%
5% 21% 29% 45%
4% 36% 33%27%
2% 7% 27% 41%23%
9%4% 24% 25% 38%
Strongly agree Agree Neutral Disagree Strongly disagree

133E X E C U T I V E R E P O R T 2 0 1 6
M Y O R G A N I Z AT I O N ’ S M A I N R E T I R E M E N T/ S AV I N G S P R O G R A M A D D R E S S E S D I F F E R E N T W O R K A R R A N G E M E N T S ( E . G . , A D A P T E D T O PA R T - T I M E R S )
US and Canada
Middle East and Africa
Europe
Australia and New Zealand
Asia
Global
Latin America
14% 6% 29% 38%13%
18%7% 32% 14% 29%
12% 29% 19% 39%
7% 13% 38% 27%16%
9% 18% 28% 30%16%
7% 20% 13% 7%53%
31%10% 19% 18% 22%
Strongly agree Agree Neutral Disagree Strongly disagree
1%
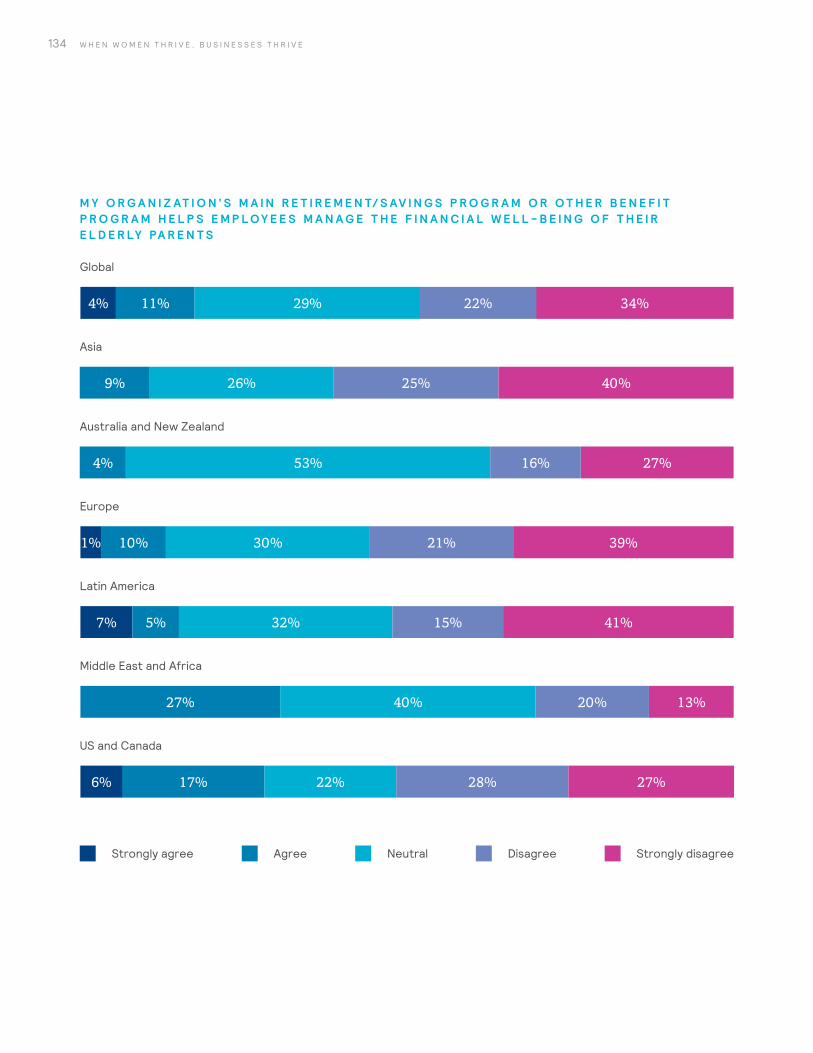
134 W H E N W O M E N T H R I V E , B U S I N E S S E S T H R I V E
M Y O R G A N I Z AT I O N ’ S M A I N R E T I R E M E N T/ S AV I N G S P R O G R A M O R O T H E R B E N E F I T P R O G R A M H E L P S E M P L O Y E E S M A N A G E T H E F I N A N C I A L W E L L - B E I N G O F T H E I R E L D E R LY PA R E N T S
US and Canada
Middle East and Africa
Europe
Australia and New Zealand
Asia
Global
Latin America
7% 5% 32% 41%15%
27% 20% 13%40%
10%1% 30% 21% 39%
9% 26% 25% 40%
4% 53% 27%16%
4% 11% 29% 34%22%
17%6% 22% 28% 27%
Strongly agree Agree Neutral Disagree Strongly disagree
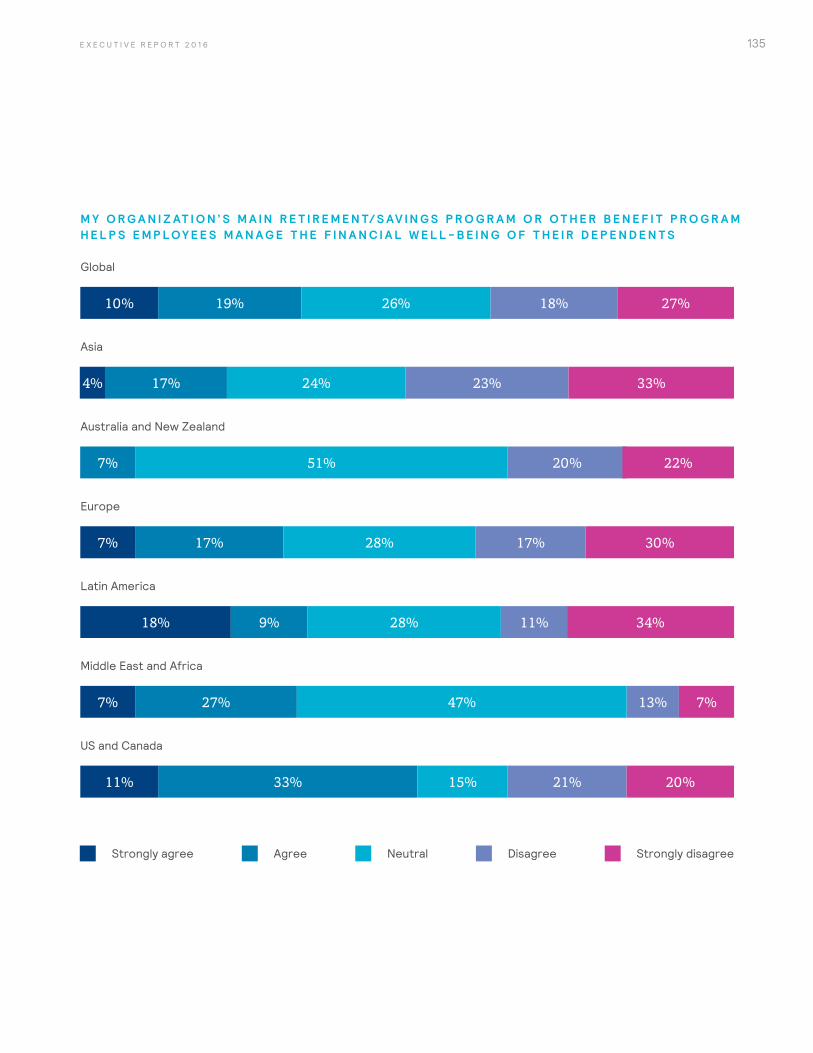
135E X E C U T I V E R E P O R T 2 0 1 6
M Y O R G A N I Z AT I O N ’ S M A I N R E T I R E M E N T/ S AV I N G S P R O G R A M O R O T H E R B E N E F I T P R O G R A M H E L P S E M P L O Y E E S M A N A G E T H E F I N A N C I A L W E L L - B E I N G O F T H E I R D E P E N D E N T S
US and Canada
Middle East and Africa
Europe
Australia and New Zealand
Asia
Global
Latin America
18% 9% 28% 34%11%
17%7% 28% 17% 30%
4% 17% 24% 23% 33%
7% 51% 20% 22%
10% 19% 26% 27%18%
7% 27% 13% 7%47%
33%11% 15% 21% 20%
Strongly agree Agree Neutral Disagree Strongly disagree
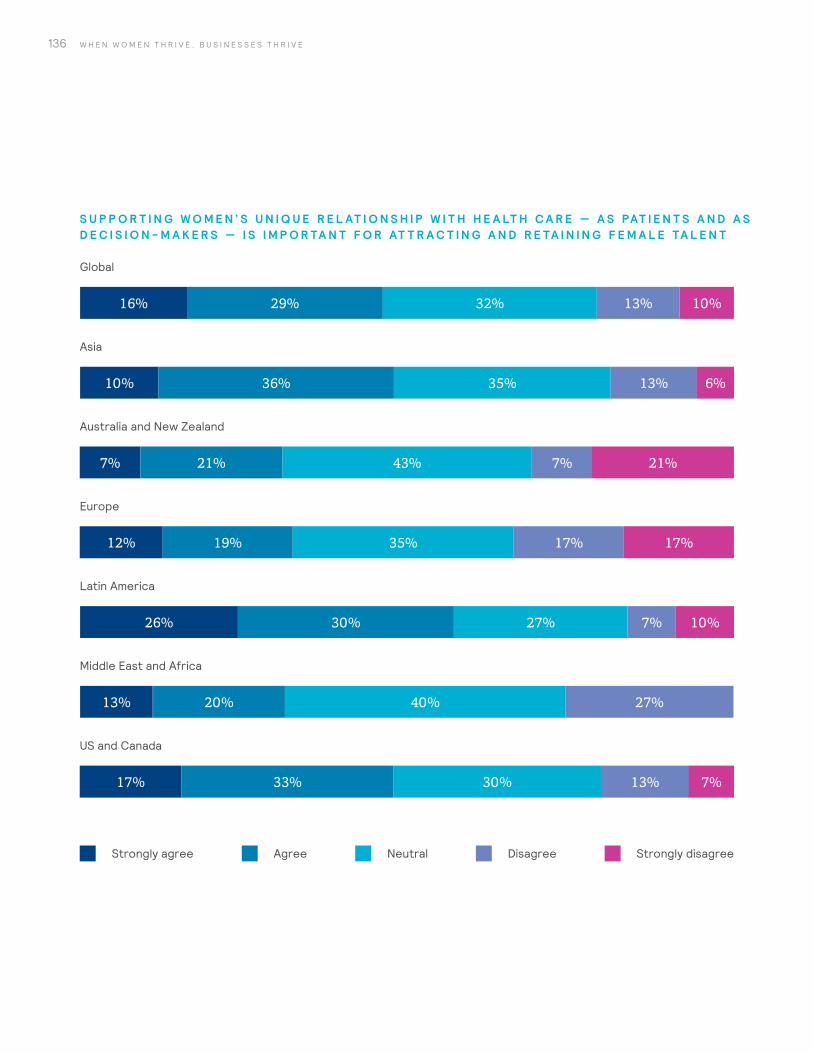
136 W H E N W O M E N T H R I V E , B U S I N E S S E S T H R I V E
S U P P O R T I N G W O M E N ’ S U N I Q U E R E L AT I O N S H I P W I T H H E A LT H C A R E — A S PAT I E N T S A N D A S D E C I S I O N - M A K E R S — I S I M P O R TA N T F O R AT T R A C T I N G A N D R E TA I N I N G F E M A L E TA L E N T
US and Canada
Middle East and Africa
Europe
Australia and New Zealand
Asia
Global
Latin America
17% 30%33% 13% 7%
13% 20% 27%40%
26% 27%30% 10%7%
19%12% 35% 17%17%
7% 7%43%21% 21%
10% 35%36% 13% 6%
16% 29% 32% 13% 10%
Strongly agree Agree Neutral Disagree Strongly disagree
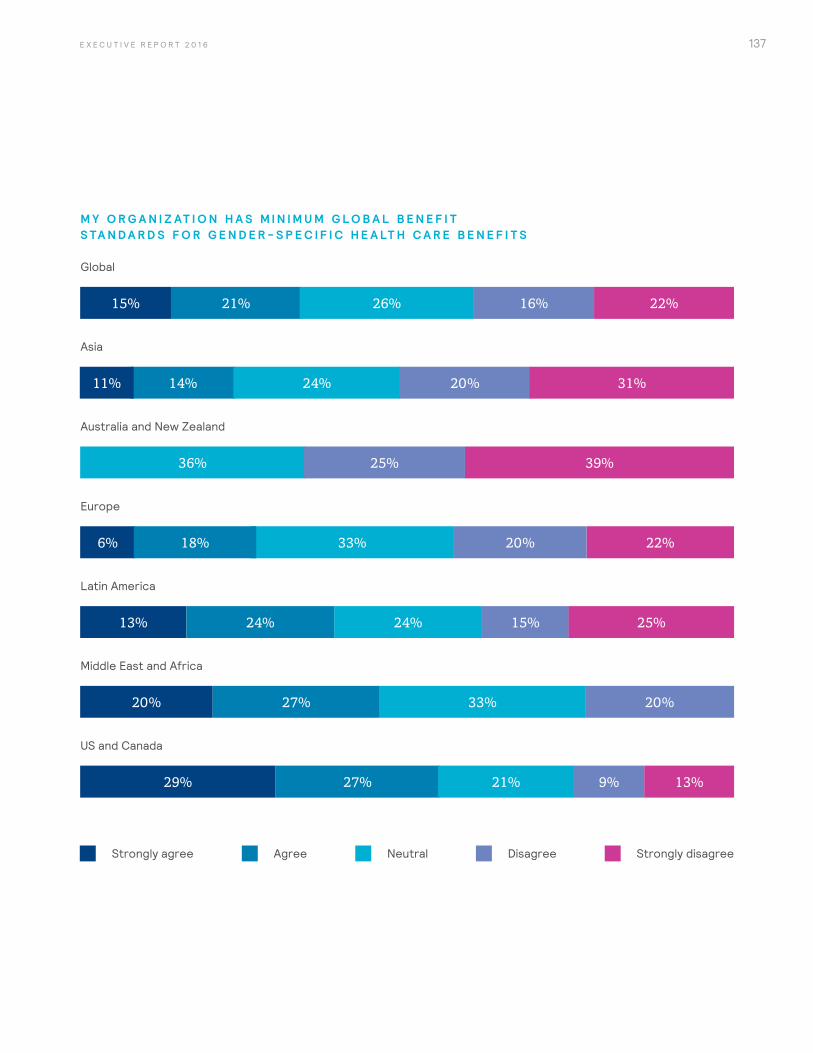
137E X E C U T I V E R E P O R T 2 0 1 6
M Y O R G A N I Z AT I O N H A S M I N I M U M G L O B A L B E N E F I T S TA N D A R D S F O R G E N D E R - S P E C I F I C H E A LT H C A R E B E N E F I T S
US and Canada
Middle East and Africa
Europe
Australia and New Zealand
Asia
Global
Latin America
15% 21% 22%16%26%
13% 24%24% 15% 25%
14%11% 24% 20% 31%
36% 39%25%
20%20% 33%27%
9% 13%27% 21%29%
6% 33% 22%20%18%
Strongly agree Agree Neutral Disagree Strongly disagree
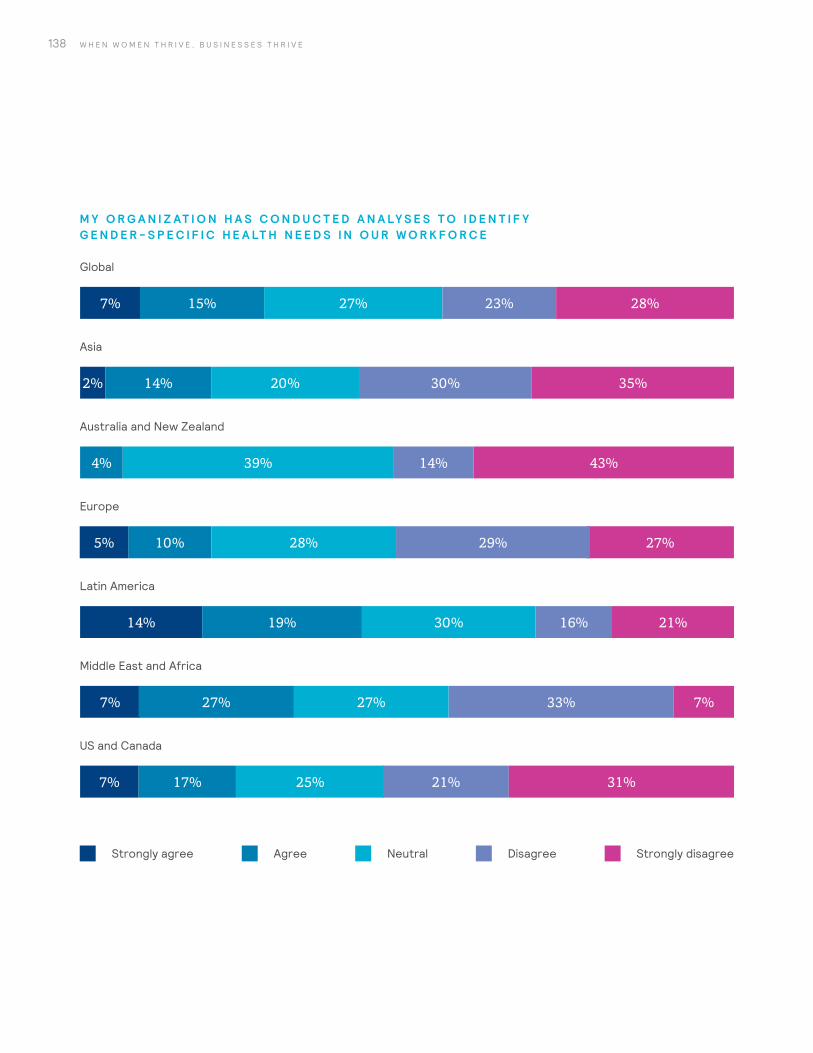
138 W H E N W O M E N T H R I V E , B U S I N E S S E S T H R I V E
M Y O R G A N I Z AT I O N H A S C O N D U C T E D A N A LY S E S T O I D E N T I F Y G E N D E R - S P E C I F I C H E A LT H N E E D S I N O U R W O R K F O R C E
US and Canada
Middle East and Africa
Europe
Australia and New Zealand
Asia
Global
Latin America
7% 25%17% 21% 31%
14% 30%19% 21%16%
10%5% 28% 27%29%
14%39%4% 43%
2% 20%14% 30% 35%
7% 33%27%27% 7%
7% 15% 27% 23% 28%
Strongly agree Agree Neutral Disagree Strongly disagree
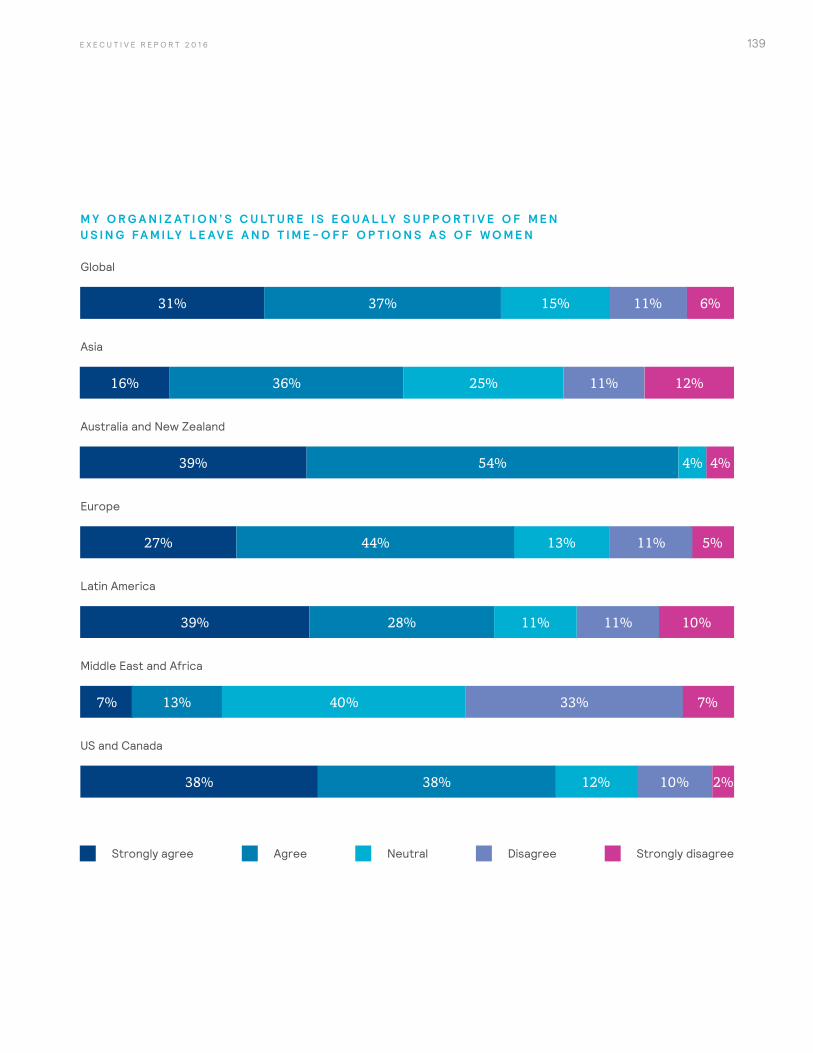
139E X E C U T I V E R E P O R T 2 0 1 6
M Y O R G A N I Z AT I O N ’ S C U LT U R E I S E Q U A L LY S U P P O R T I V E O F M E N U S I N G FA M I LY L E AV E A N D T I M E - O F F O P T I O N S A S O F W O M E N
US and Canada
Middle East and Africa
Europe
Australia and New Zealand
Asia
Global
Latin America
31% 37% 6%11%15%
27% 5%11%13%44%
39% 28% 11%11% 10%
36%16% 25% 12%11%
54%39% 4%4%
7%7% 13% 33%40%
10%12% 2%38%38%
Strongly agree Agree Neutral Disagree Strongly disagree
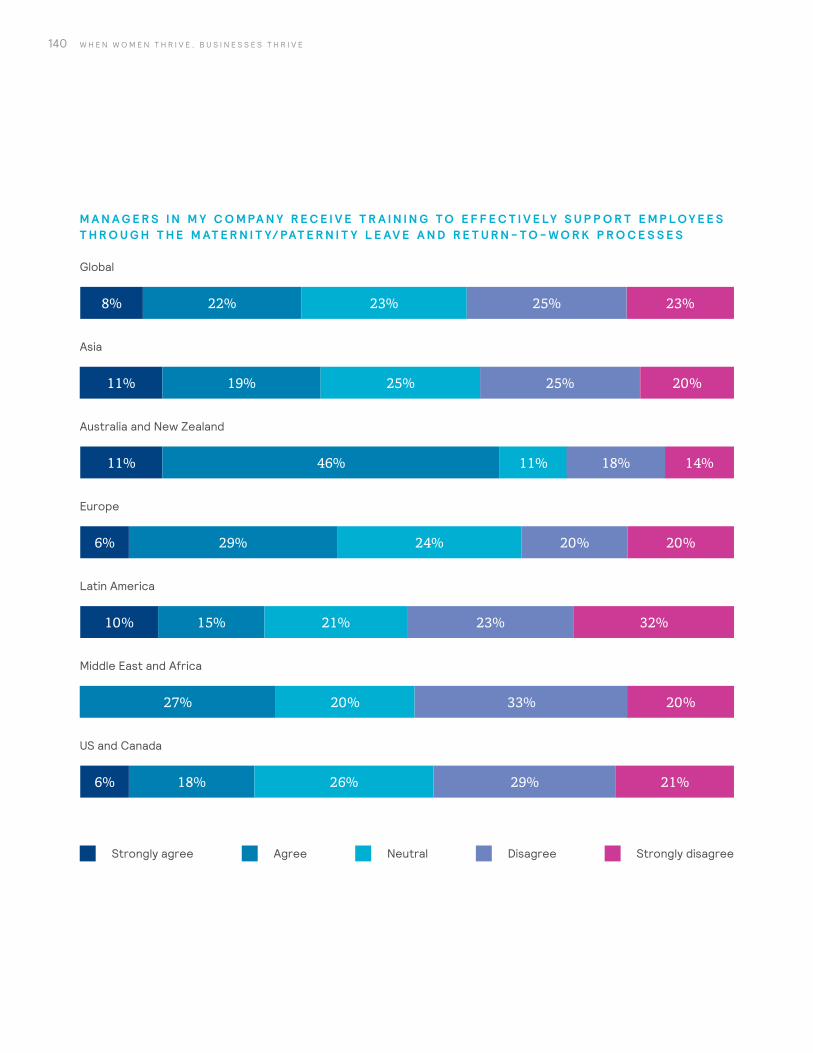
140 W H E N W O M E N T H R I V E , B U S I N E S S E S T H R I V E
M A N A G E R S I N M Y C O M PA N Y R E C E I V E T R A I N I N G T O E F F E C T I V E LY S U P P O R T E M P L O Y E E S T H R O U G H T H E M AT E R N I T Y/ PAT E R N I T Y L E AV E A N D R E T U R N - T O - W O R K P R O C E S S E S
US and Canada
Middle East and Africa
Europe
Australia and New Zealand
Asia
Global
Latin America
10% 15% 21% 32%23%
29%6% 24% 20% 20%
11% 19% 25% 25% 20%
11% 46% 11% 14%18%
8% 22% 23% 23%25%
27% 33% 20%20%
18%6% 26% 29% 21%
Strongly agree Agree Neutral Disagree Strongly disagree
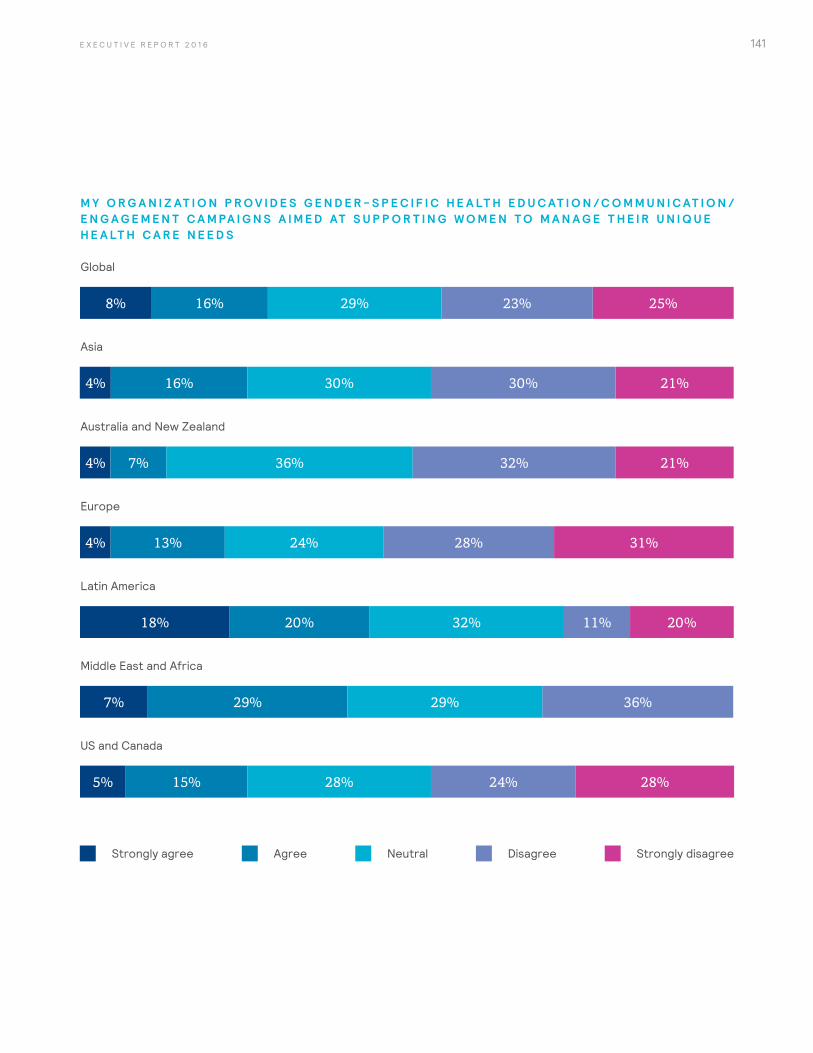
141E X E C U T I V E R E P O R T 2 0 1 6
M Y O R G A N I Z AT I O N P R O V I D E S G E N D E R - S P E C I F I C H E A LT H E D U C AT I O N / C O M M U N I C AT I O N /E N G A G E M E N T C A M PA I G N S A I M E D AT S U P P O R T I N G W O M E N T O M A N A G E T H E I R U N I Q U E H E A LT H C A R E N E E D S
US and Canada
Middle East and Africa
Europe
Australia and New Zealand
Asia
Global
Latin America
7% 29% 36%29%
18% 20% 32% 20%11%
13%4% 24% 28% 31%
4% 16% 30% 30% 21%
4% 7% 36% 21%32%
8% 16% 29% 25%23%
15%5% 28% 24% 28%
Strongly agree Agree Neutral Disagree Strongly disagree
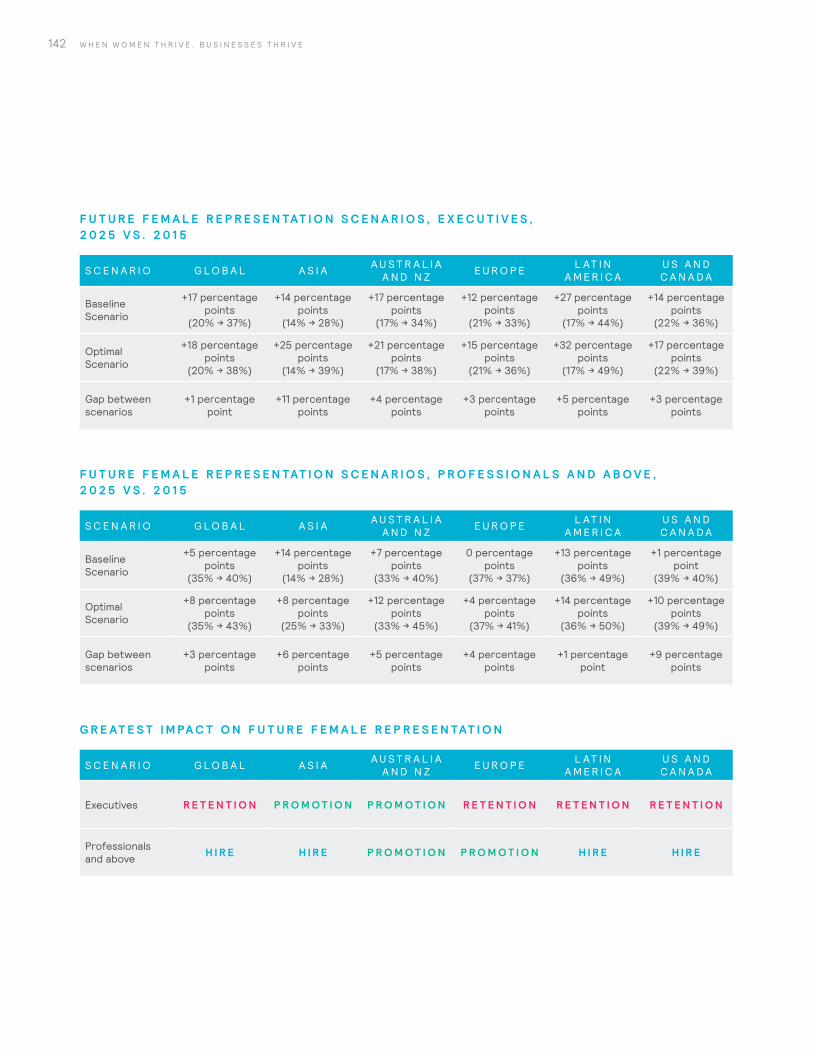
142 W H E N W O M E N T H R I V E , B U S I N E S S E S T H R I V E
F U T U R E F E M A L E R E P R E S E N TAT I O N S C E N A R I O S , E X E C U T I V E S , 2 0 2 5 V S . 2 0 1 5
F U T U R E F E M A L E R E P R E S E N TAT I O N S C E N A R I O S , P R O F E S S I O N A L S A N D A B O V E , 2 0 2 5 V S . 2 0 1 5
G R E AT E S T I M PA C T O N F U T U R E F E M A L E R E P R E S E N TAT I O N
S C E N A R I O G L O B A L A S I A A U S T R A L I A A N D N Z E U R O P E L AT I N
A M E R I C AU S A N D C A N A D A
Baseline Scenario
+17 percentage points
(20% � 37%)
+14 percentage points
(14% � 28%)
+17 percentage points
(17% � 34%)
+12 percentage points
(21% � 33%)
+27 percentage points
(17% � 44%)
+14 percentage points
(22% � 36%)
Optimal Scenario
+18 percentage points
(20% � 38%)
+25 percentage points
(14% � 39%)
+21 percentage points
(17% � 38%)
+15 percentage points
(21% � 36%)
+32 percentage points
(17% � 49%)
+17 percentage points
(22% � 39%)
Gap between scenarios
+1 percentage point
+11 percentage points
+4 percentage points
+3 percentage points
+5 percentage points
+3 percentage points
S C E N A R I O G L O B A L A S I A A U S T R A L I A A N D N Z E U R O P E L AT I N
A M E R I C AU S A N D C A N A D A
Baseline Scenario
+5 percentage points
(35% � 40%)
+14 percentage points
(14% � 28%)
+7 percentage points
(33% � 40%)
0 percentage points
(37% � 37%)
+13 percentage points
(36% � 49%)
+1 percentage point
(39% � 40%)
Optimal Scenario
+8 percentage points
(35% � 43%)
+8 percentage points
(25% � 33%)
+12 percentage points
(33% � 45%)
+4 percentage points
(37% � 41%)
+14 percentage points
(36% � 50%)
+10 percentage points
(39% � 49%)
Gap between scenarios
+3 percentage points
+6 percentage points
+5 percentage points
+4 percentage points
+1 percentage point
+9 percentage points
S C E N A R I O G L O B A L A S I A A U S T R A L I A A N D N Z E U R O P E L AT I N
A M E R I C AU S A N D C A N A D A
Executives R E T E N T I O N P R O M O T I O N P R O M O T I O N R E T E N T I O N R E T E N T I O N R E T E N T I O N
Professionals and above H I R E H I R E P R O M O T I O N P R O M O T I O N H I R E H I R E


20812-MG
Copyright 2016 Mercer LLC. All rights reserved. mercer.com