Embed Size (px)
Citation preview

Business Statistics (BUSA 3101). Dr.Lari H. Arjomand
Continus Probability
Business Statistics (BUSA 3101). Dr.Lari H. Arjomand
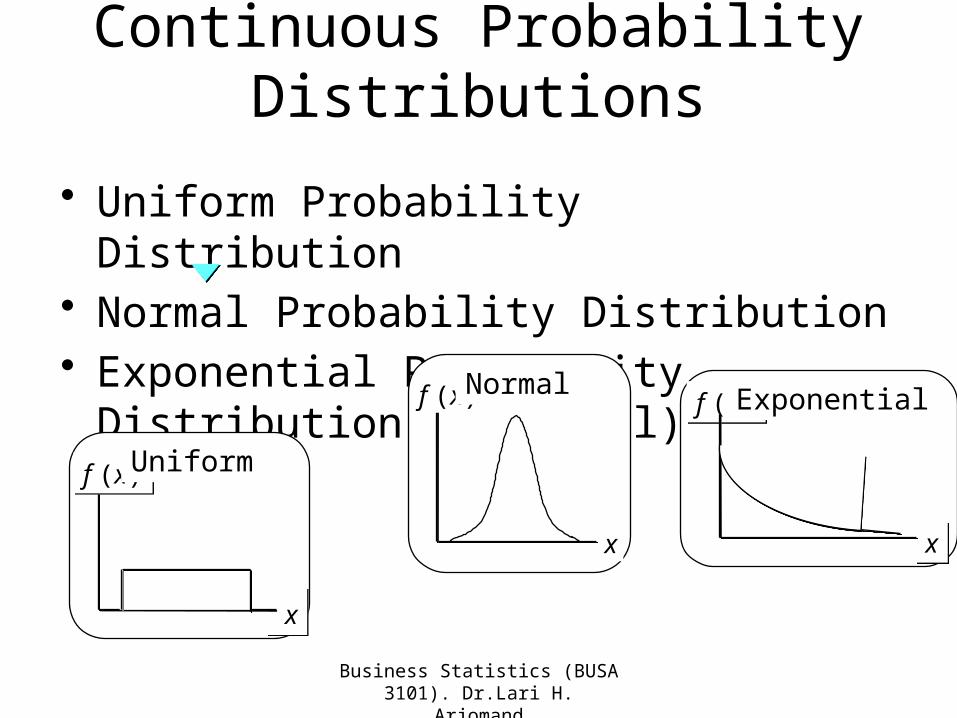
Continuous Probability Distributions
• Uniform Probability Distribution• Normal Probability Distribution• Exponential Probability Distribution
(Optional)
f (x)f (x)
x x
Uniform
x
f (x)Normal
xx
f (x)f (x)Exponential
Business Statistics (BUSA 3101). Dr.Lari H. Arjomand
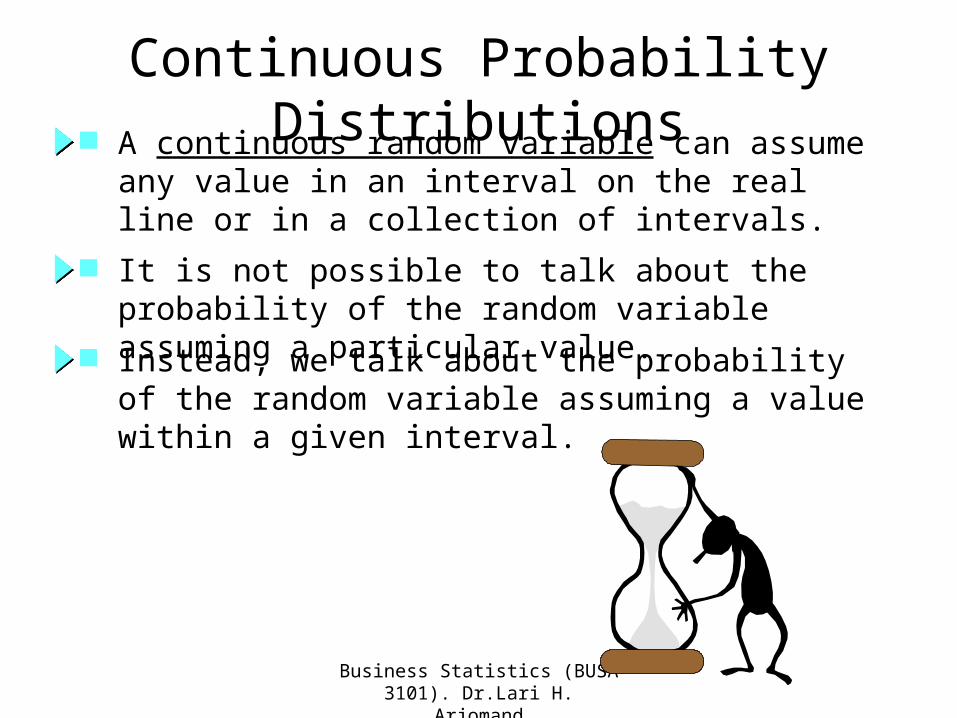
Continuous Probability Distributions A continuous random variable can assume any
value in an interval on the real line or in a collection of intervals.
It is not possible to talk about the probability of the random variable assuming a particular value. Instead, we talk about the probability of the random variable assuming a value within a given interval.

Business Statistics (BUSA 3101). Dr.Lari H. Arjomand
Data TypesData Types
Data
Numerical(Quantitative)
Categorical(Qualitative)
Discrete Continuous
Business Statistics (BUSA 3101). Dr.Lari H. Arjomand
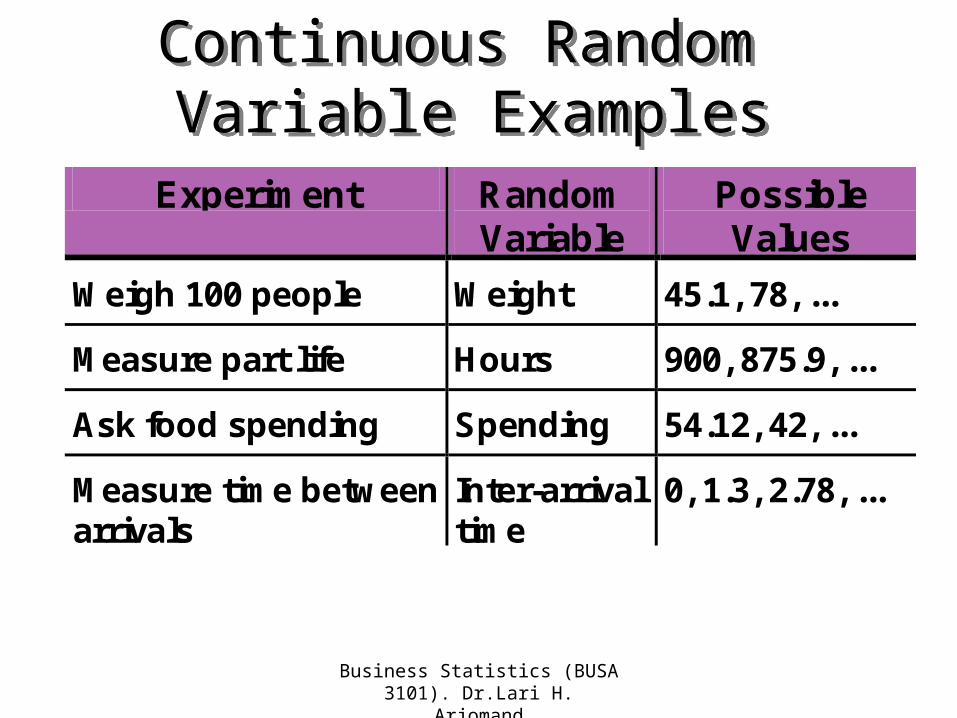
Continuous Random Variable Examples
Continuous Random Variable Examples
Experiment Random Variable
Possible Values
Weigh 100 people Weight 45.1, 78, ...
Measure part life Hours 900, 875.9, ...
Ask food spending Spending 54.12, 42, ...
Measure time between arrivals
Inter-arrival time
0, 1.3, 2.78, ...
Business Statistics (BUSA 3101). Dr.Lari H. Arjomand
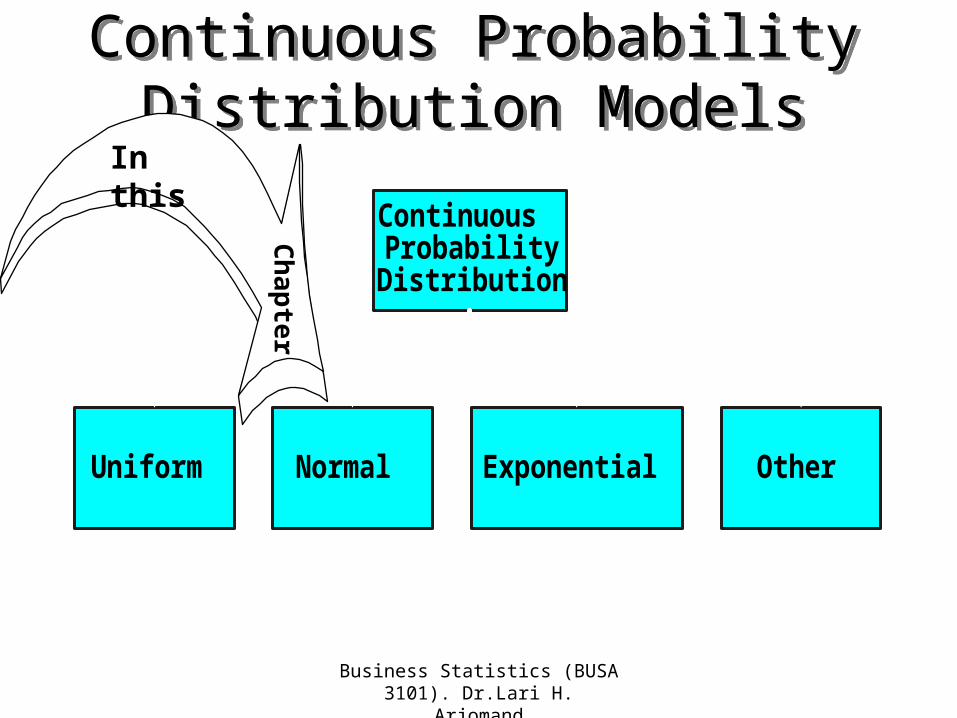
Continuous Probability Distribution Models
Continuous Probability Distribution Models
ContinuousProbabilityDistribution
Uniform Normal Exponential Other
In this
Ch
ap
ter
Business Statistics (BUSA 3101). Dr.Lari H. Arjomand
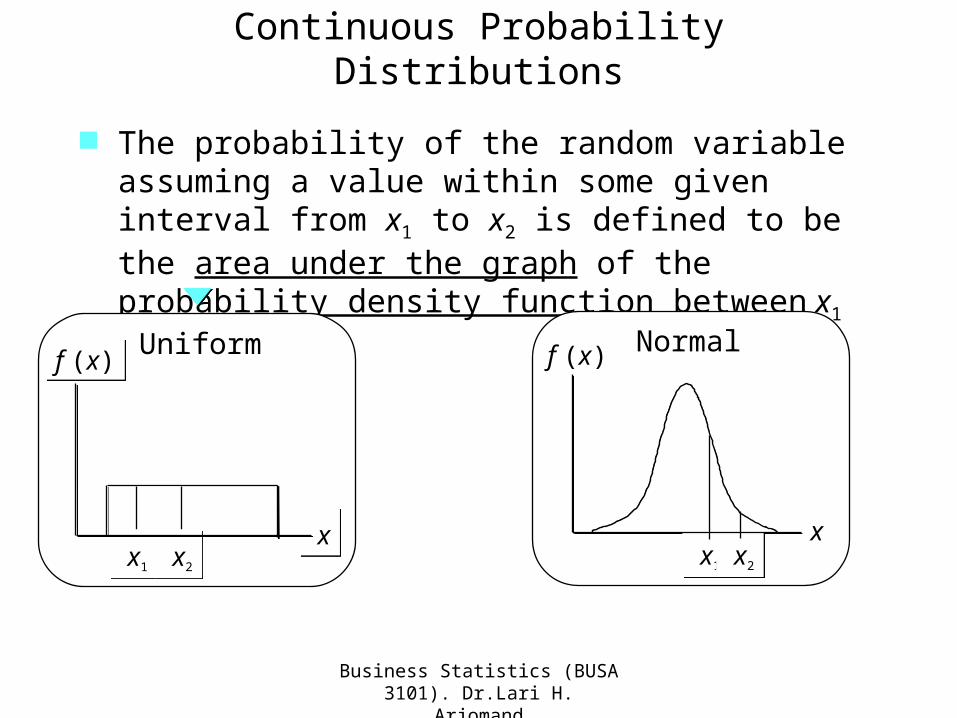
Continuous Probability Distributions
The probability of the random variable assuming a value within some given interval from x1 to x2 is defined to be the area under the graph of the probability density function between x1 and x2.
f (x)f (x)
x x
Uniform
x1 x1 x2 x2
x
f (x) Normal
x1 x1 x2 x2
Business Statistics (BUSA 3101). Dr.Lari H. Arjomand
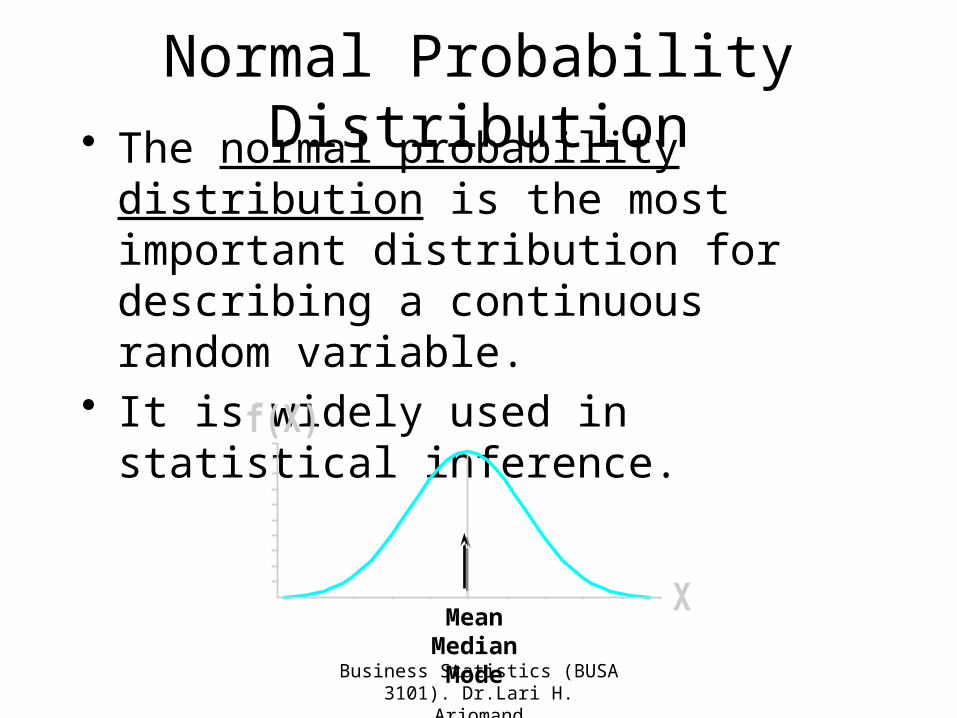
Normal Probability Distribution• The normal probability distribution is the
most important distribution for describing a continuous random variable.
• It is widely used in statistical inference.
X
f(X)
Mean Median Mode
Business Statistics (BUSA 3101). Dr.Lari H. Arjomand
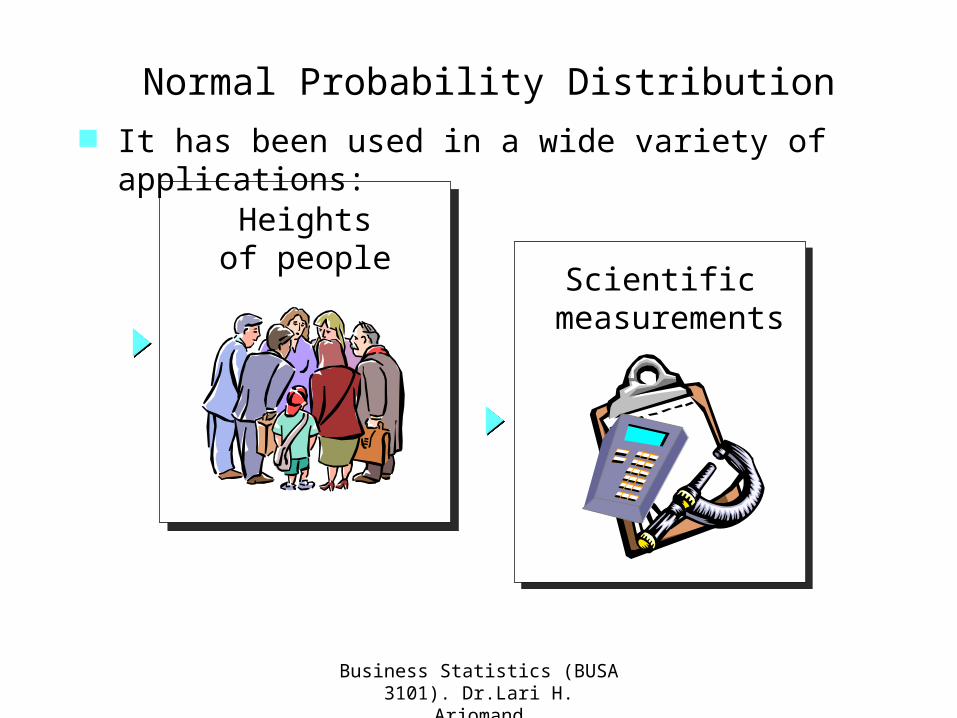
Heightsof peopleHeights
of people
Normal Probability Distribution It has been used in a wide variety of
applications:
Scientific measurements
Scientific measurements
Business Statistics (BUSA 3101). Dr.Lari H. Arjomand
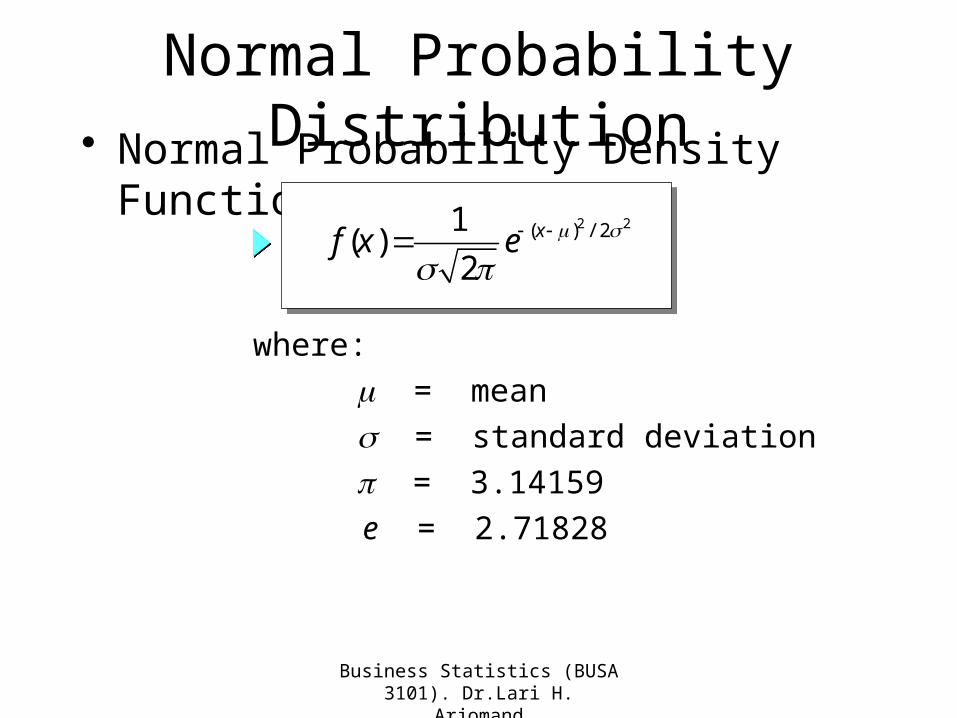
Normal Probability Distribution• Normal Probability Density Function
2 2( ) / 21( )
2xf x e
= mean = standard deviation = 3.14159e = 2.71828
where:
Business Statistics (BUSA 3101). Dr.Lari H. Arjomand
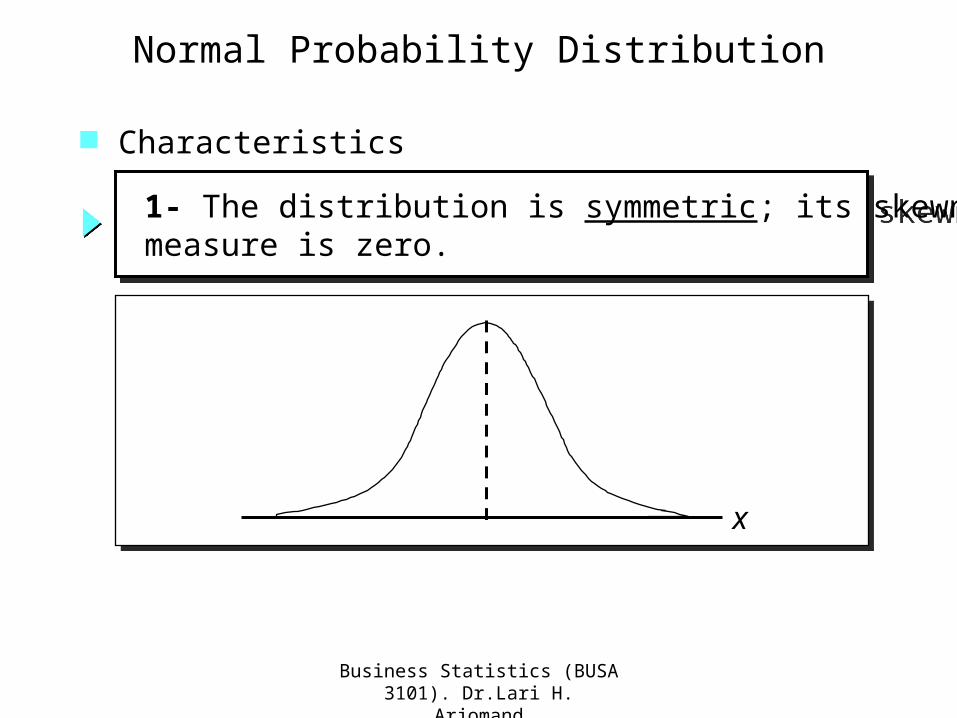
1- The distribution is symmetric; its skewness measure is zero. 1- The distribution is symmetric; its skewness measure is zero.
Normal Probability Distribution
Characteristics
x
Business Statistics (BUSA 3101). Dr.Lari H. Arjomand
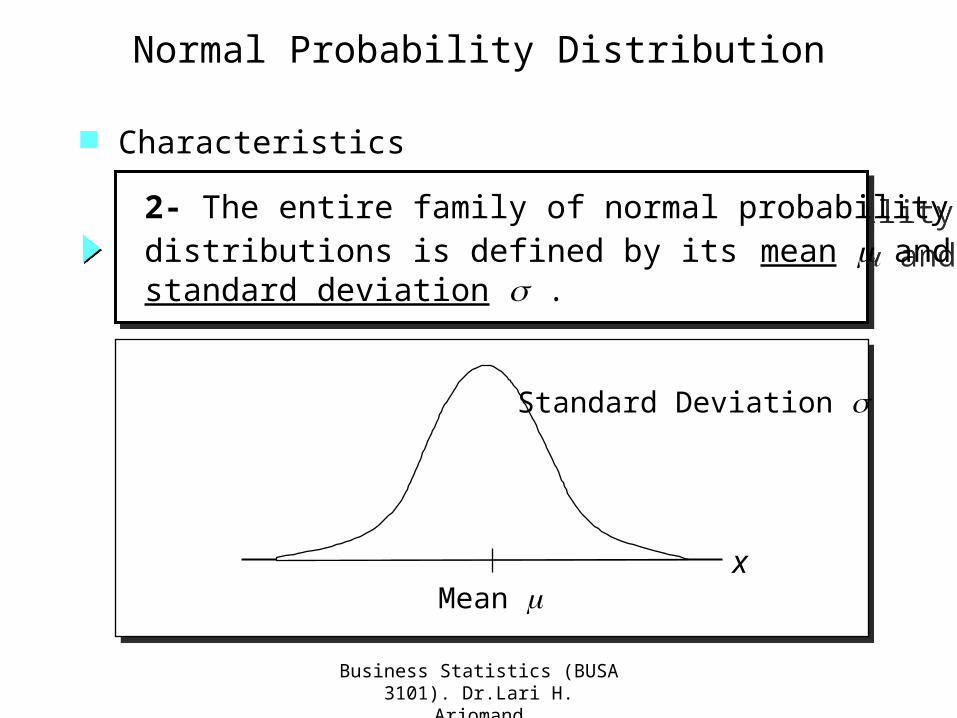
2- The entire family of normal probability distributions is defined by its mean m and its standard deviation s .
2- The entire family of normal probability distributions is defined by its mean m and its standard deviation s .
Normal Probability Distribution
Characteristics
Standard Deviation s
Mean mx

Business Statistics (BUSA 3101). Dr.Lari H. Arjomand
3- The highest point on the normal curve is at the mean, which is also the median and mode.3- The highest point on the normal curve is at the mean, which is also the median and mode.
Normal Probability Distribution
Characteristics
x

Business Statistics (BUSA 3101). Dr.Lari H. Arjomand
Normal Probability Distribution
Characteristics
-10 0 20
4- The mean can be any numerical value: negative, zero, or positive.4- The mean can be any numerical value: negative, zero, or positive.
x
Business Statistics (BUSA 3101). Dr.Lari H. Arjomand
Normal Probability Distribution
Characteristics
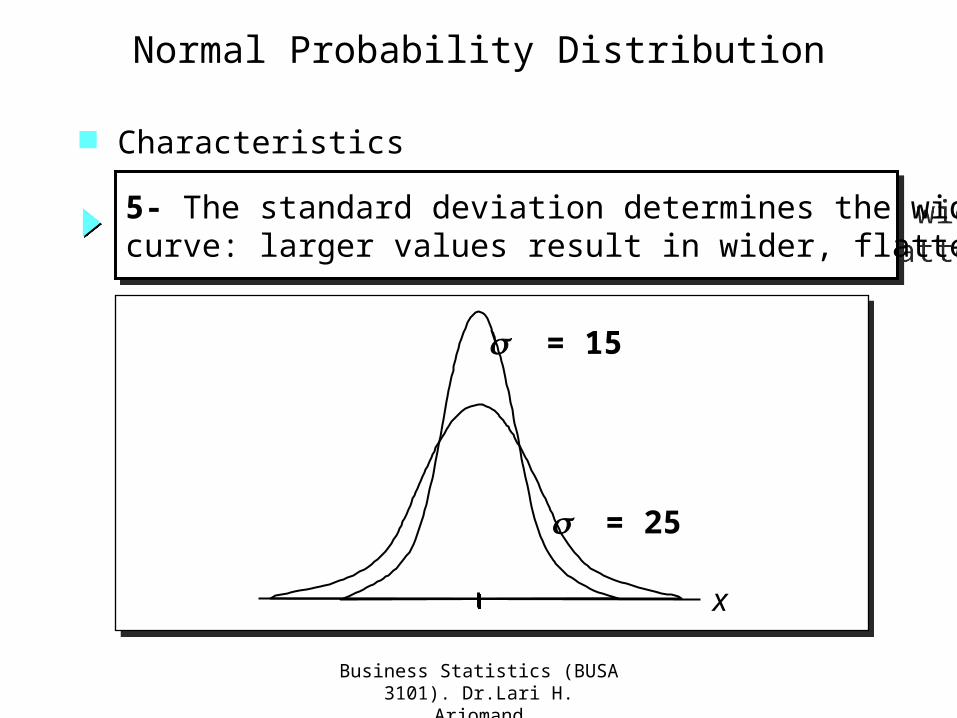
s = 15
s = 25
5- The standard deviation determines the width of thecurve: larger values result in wider, flatter curves.5- The standard deviation determines the width of thecurve: larger values result in wider, flatter curves.
x
Business Statistics (BUSA 3101). Dr.Lari H. Arjomand
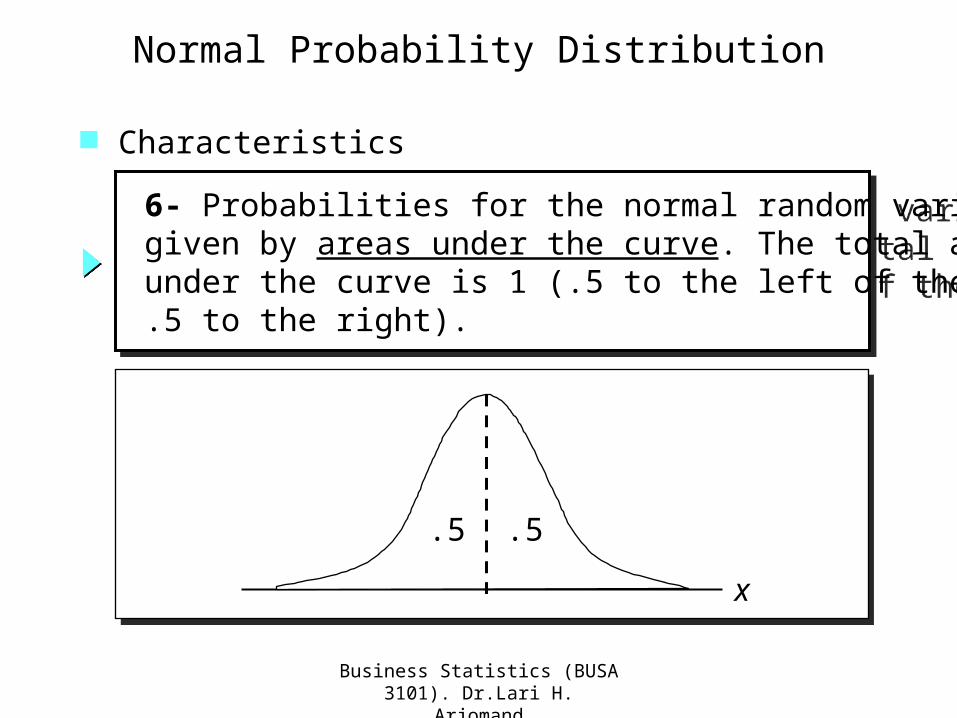
6- Probabilities for the normal random variable are given by areas under the curve. The total area under the curve is 1 (.5 to the left of the mean and .5 to the right).
6- Probabilities for the normal random variable are given by areas under the curve. The total area under the curve is 1 (.5 to the left of the mean and .5 to the right).
Normal Probability Distribution
Characteristics
.5 .5
x
Business Statistics (BUSA 3101). Dr.Lari H. Arjomand
Normal Probability Distribution
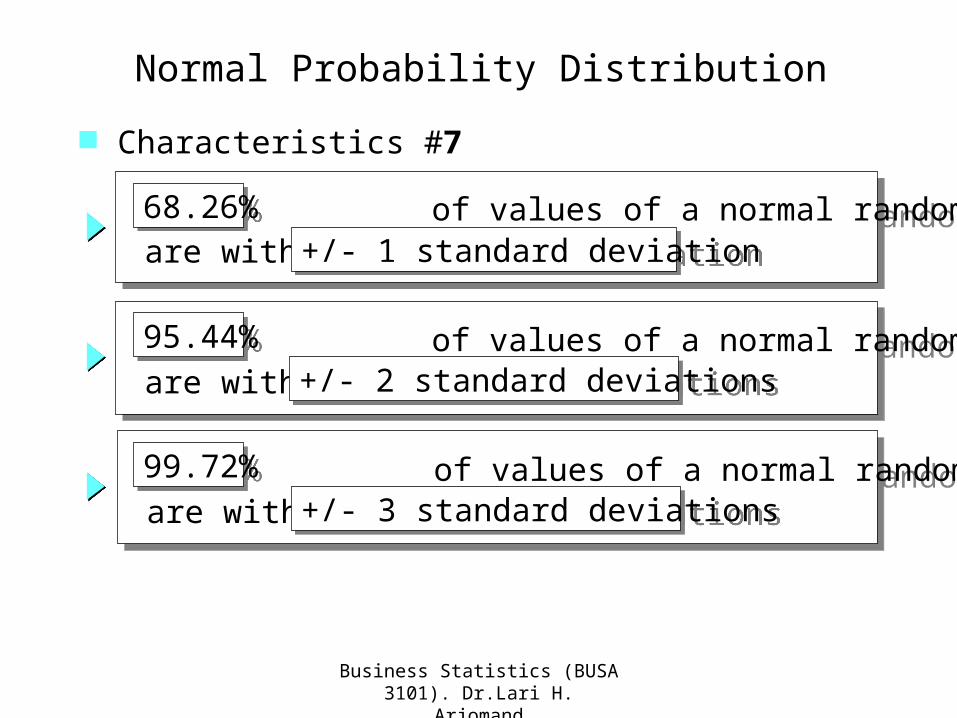
Characteristics #7
of values of a normal random variable are within of its mean.
of values of a normal random variable are within of its mean.68.26%68.26%
+/- 1 standard deviation+/- 1 standard deviation
of values of a normal random variable are within of its mean.
of values of a normal random variable are within of its mean.95.44%95.44%
+/- 2 standard deviations+/- 2 standard deviations
of values of a normal random variable are within of its mean.
of values of a normal random variable are within of its mean.99.72%99.72%
+/- 3 standard deviations+/- 3 standard deviations
Business Statistics (BUSA 3101). Dr.Lari H. Arjomand
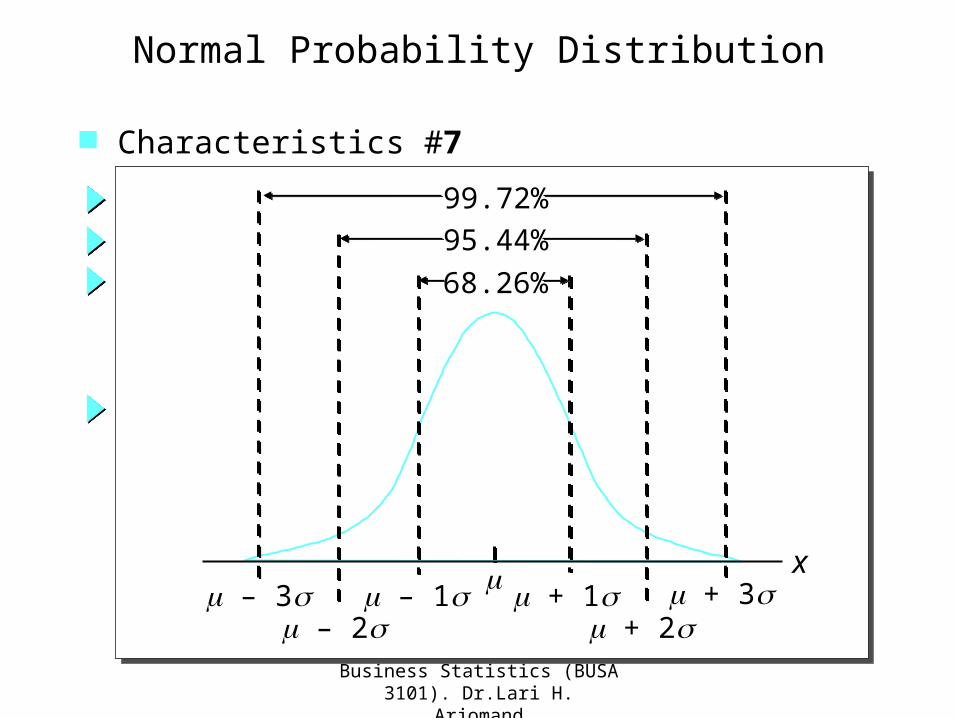
Normal Probability Distribution
Characteristics #7
xm – 3s m – 1s
m – 2sm + 1s
m + 2sm + 3sm
68.26%
95.44%99.72%