Embed Size (px)
Citation preview

Walden UniversityScholarWorks
Frank Dilley Award for Outstanding Doctoral Study University Awards
2004
Business Ethics, Corporate Social Responsibility,and Firm Value in the Oil and Gas IndustryJavier Fadul
Follow this and additional works at: http://scholarworks.waldenu.edu/dilley
This Dissertation is brought to you for free and open access by the University Awards at ScholarWorks. It has been accepted for inclusion in FrankDilley Award for Outstanding Doctoral Study by an authorized administrator of ScholarWorks. For more information, please [email protected].

NOTE TO USERS
This reproduction is the best copy available.
®UMIReproduced with permission of the copyright owner. Further reproduction prohibited without permission.

Reproduced with permission of the copyright owner. Further reproduction prohibited without permission.

Business Ethics, Corporate Social Responsibility, and Firm Value in the Oil and Gas Industry
by
Javier Fadul
Dissertation Submitted in Partial Fulfillment of the Requirement for the Degree of
Doctor of Philosophy Applied Management and Decision Sciences
Walden University November 2 004
Reproduced with permission of the copyright owner. Further reproduction prohibited without permission.

UMI Number: 3151491
Copyright 2005 by
Fadul, Javier
All rights reserved.
INFORMATION TO USERS
The quality of this reproduction is dependent upon the quality of the copy
submitted. Broken or indistinct print, colored or poor quality illustrations and
photographs, print bleed-through, substandard margins, and improper
alignment can adversely affect reproduction.
In the unlikely event that the author did not send a complete manuscript
and there are missing pages, these will be noted. Also, if unauthorized
copyright material had to be removed, a note will indicate the deletion.
®UMIUMI Microform 3151491
Copyright 2005 by ProQuest Information and Learning Company.
All rights reserved. This microform edition is protected against
unauthorized copying under Title 17, United States Code.
ProQuest Information and Learning Company 300 North Zeeb Road
P.O. Box 1346 Ann Arbor, Ml 48106-1346
Reproduced with permission of the copyright owner. Further reproduction prohibited without permission.
DOCTOR OF PHILOSOPHY DISSERTATIONOF
JAVIER FADUL
APPROVED:
PAULA E. PEINOVICH, PhDPRESIDENT
AND PROVOST
WALDEN UNIVERSITY 2004
Reproduced with permission of the copyright owner. Further reproduction prohibited without permission

Walden University
APPLIED MANAGEMENT AND DECISION SCIENCES
This is to certify that I have examined the doctoral dissertation by
Javier Fadul
and have found that it is complete and satisfactory in all respects, and that any and all revisions required by the review committee have been made.
Dr. Robert T. Aubey, Committee Chair Applied Management and Decision Sciences Faculty
7 .....Signature
7 Date '/
Reproduced with permission of the copyright owner. Further reproduction prohibited without permission.

Walden University
APPLIED MANAGEMENT AND DECISION SCIENCES
This is to certify that I have examined the doctoral dissertation by
Javier Fadul
and have found that it is complete and satisfactory in all respects.
Dr. Lilbum P. Hoehn, Committee Member Applied Management and Decision Sciences Faculty
Reproduced with permission of the copyright owner. Further reproduction prohibited without permission.

Walden University
APPLIED MANAGEMENT AND DECISION SCIENCES
This is to certify that I have examined the doctoral dissertation by
Javier Fadul
and have found that it is complete and satisfactory in all respects.
Dr. Reza Hamzaee, Committee Member Applied Management and Decision Sciences Faculty
Signature
01/0 7/0 ^ 4 t e ------
Reproduced with permission of the copyright owner. Further reproduction prohibited without permission.

Walden University
APPLIED MANAGEMENT AND DECISION SCIENCES
This is to certify that I have examined the doctoral dissertation by
Javier Fadul
and have found that it is complete and satisfactory in all respects.
Dr. Ruth Maurer, School Representative Applied Management and Decision Sciences Faculty
Signature
Date
Reproduced with permission of the copyright owner. Further reproduction prohibited without permission.

ABSTRACT
Business Ethics, Corporate Social Responsibility, and Firm Value in the Oil and Gas Industry
by
Javier Fadul
Dissertation Submitted in Partial Fulfillment of the Requirement for the Degree of
Doctor of Philosophy Applied Management and Decision Sciences
Walden University November 2004
Reproduced with permission of the copyright owner. Further reproduction prohibited without permission.

ABSTRACT
This study investigated the relationship between ethical performance, corporate social responsibility, and firm value in companies in the oil and gas industry. Ethical behavior and social responsibility were conceptualized by a series of social indexes used to carry out empirical observations. The data were collected from a sample of 55 companies drawn from the population of companies in the oil and gas industry and consisting of public documents, including proceedings of government bodies and court records, and newspapers and magazines dated from January 2000 through December 2003. The set of social indexes was analyzed statistically to establish any significant relationship with the firm's value. The results indicated that ethical performance was positively and significantly correlated with firm value, as measured by return on equity in the exploration and production sector of the industry.In addition, diversity was positively and significantly correlated with firm value, as measured by approximate Tobin's Q ratio in the equipment and services sector. The results of the study corroborated the economic importance of managers leading a socially responsible business operation by aggressively pursuing in their companies goals of zero emissions, zero environmental damage incidents, increased diversity in the workplace, and zero incidents of unethical behavior.
Reproduced with permission of the copyright owner. Further reproduction prohibited without permission.

ACKNOWLEDGMENTS
I wish to express my deep debt of gratitude to Dr. Robert Aubey (my doctoral mentor), Dr. Ruth Maurer, Dr.Reza Hamzaee, Dr. Lilburn Hoehn, and Mr. Jeff Zuckerman for their guidance, wisdom, and words of encouragement in the past 2 years and during the development of this dissertation. I also want to thank Mr. Santiago Estefania, who spent his valuable time teaching me about sustainable development and other environmental issues. Lastly, I wish to thank my lovely wife Patricia and my sons Javi and Chris, who patiently and stoically were willing to sacrifice our family time together while I was pursuing my PhD dream.
Reproduced with permission of the copyright owner. Further reproduction prohibited without permission.

TABLE OF CONTENTS
LIST OF TABLES . ..................... vLIST OF FIGURES.................... viiCHAPTER 1: INTRODUCTION TO THE STUDY.................. 1Introduction...................... 1Background of the Problem ...... 2Statement of the Problem ........ 7Research Questions .............. . 8Conceptual Framework .......... 8Purpose ............................... 10Assumptions................................................11Scope and Delimitations................................... 11Limitations............................................... 12Definitions of Terms ..................................... 13Significance of the Study................................. 14Summary........................ 15CHAPTER 2 : LITERATURE REVIEW . ............ 18Business Ethics and Corporate Social Responsibility ..... 18Socially Responsible Investing........... 25Diversity .............................................. 29Environmental Regulation and Ethics ...................... 37Firm Value................................................ 40Summary....................................................54CHAPTER 3: METHODOLOGY ................................... 55Description of the Research Design ....... 55Target Population ...... 56Sampling ........... 56Instrumentation ...... 58Data Collection Procedures .......... 64Data Analysis .............. 65CHAPTER 4 : RESULTS............. 69Introduction .......... 69Oil and Gas Industry Analysis ............. 71Test of Differences of Means: Industry Sectors .......... 79Exploration & Production Sector Analysis ................. 82Equipment & Services Sector Analysis ....... 86
iii
Reproduced with permission of the copyright owner. Further reproduction prohibited without permission.

CHAPTER 5: SUMMARY, CONCLUSION, AND RECOMMENDATIONS ...... 94Summary ..... 94Conclusion ............. 96Recommendations ......................................... 101REFERENCES........ 107APPENDIXES......... 115APPENDIX A-SEARCHING, SCREENING, AND SCORING METHODOLOGY 115APPENDIX B-SCREENING CRITERIA....... 122APPENDIX C-SOCIAL INDEXES SCORING EXAMPLES...... 127APPENDIX D-LIST OF COMPANIES IN THE SAMPLE .............. 131Curriculum Vitae........ . 133
iv
Reproduced with permission of the copyright owner. Further reproduction prohibited without permission.

LIST OF TABLES
Table 1. Comparison of Corporate Social Performance Criteria. .................... 63
Table 2. Descriptive Statistics for all Sample Firms~"Oil and Gas Industry" (n=55)............................... .. 71
Table 3. ANOVA Table-All Independent Variables; -"Oil and Gas Industry" (n=55) ; Y=ROE............................... 73
Table 4. ANOVA Table-All Independent Variables; -"Oil and Gas Industry" (n=55); Y=ATQ. . . . . ................... 75
Table 5. Correlation Matrix. ..............76
Table 6. Multiple Regression Results-MS, CR Vs ROE-"Oil and Gas Industry" (n=55)................................... .77
Table 7. Multiple Regression-Selected Variables; -"Oil and Gas Industry" (n=55); Y=ATQ............................. 78
Table 8. Test of Difference of Means for E&P And Equip. & Svcs ................ 80
Table 9. Descriptive Statistics-Oil & Gas Exploration & Production Sector; n=33. . . . . . . . . . 82
Table 10. Multiple Regression Results-All Independent Variables; Y=ROE-E&P Companies. . . . . . . . . . . . . . 83
Table 11. Multiple Regression Results-All Independent Variables; Y=ATQ-E&P. . . . . . . . . . . . . . . . . . . 84
Table 12. Multiple Regression-Selected Independent Variables; Y=ROE-E&P. . . . . . . . . . . . . . . . . . . 85
Table 13. Descriptive Statistics-Oil & Gas Equipment & Services Sector; n=18....................................87
Table 14. Multiple Regression -All Independent Variables; Y=ROE-Equip & Svcs. .88
v
Reproduced with permission of the copyright owner. Further reproduction prohibited without permission.

Table 15. Multiple Regression Results-All Independent Variables; Y=ATQ-Equip. & Svcs.......... . . . . . . . . 89
Table 16. Multiple Regression Results-BV-DI; Y=ATQ-Equip. & Svcs ............ . . . . 90
Table 17. Regression Resuits-Summary. . . . . . . . . .92
vi
Reproduced with permission of the copyright owner. Further reproduction prohibited without permission.

LIST OF FIGURES
Figure 1. Conceptual model-Corporate social performance and firm value. . . . . . . . . . . . . . . . . . . 9
vii
Reproduced with permission of the copyright owner. Further reproduction prohibited without permission.

CHAPTER 1: INTRODUCTION TO THE STUDY Introduction
The year 2002 will be remembered for its astonishing corporate admissions of fraud and accounting wrongdoings. Enron, WorldCom, and other companies shocked the equity markets and sent many investors looking for safer places to invest their money. Furthermore, trusted brokers made immense profits from using confidential or insider's information to make investments in shares or to get rid of such investments. Economics was accused of leaving out ethical considerations and focusing on pure technology at the expense of human values. Economic theory was blamed for influencing business to focus on profit maximization in a very narrow sense. All these recent events have brought a higher public awareness to business ethics and corporate social responsibility issues.
The mass media often report on instances of deficiencies in business ethics. Disclosures of these unethical behaviors have placed ethical issues higher on the agenda and have contributed to creating new awareness of these issues. Although much progress has been accomplished to date to address business ethics issues, much work remains. This dissertation examined the relationship between ethical behavior, corporate social responsibility, and firm value in companies in the oil and gas industry. The considerable social impact of the
Reproduced with permission of the copyright owner. Further reproduction prohibited without permission.

2behaviors and actions of oil and gas companies and their undeniable weight in the overall economy drove the research.
Ethical behavior and social responsibility of the sampled oil and gas companies were conceptualized by a series of ethical and social indexes used to carry out empirical observations representing those concepts. The set of social indexes were analyzed using a multiple regression model to establish if they showed any significant relationship with the firm's value.
This study expanded the knowledge base of business ethics theories and the corporate social responsibility (CSR) construct. The research presented empirical evidence examining whether, along with other standard factors, corporate social responsibility is associated with firm value of companies in the oil and gas industry.
Background of the ProblemThe energy industry is a vast and highly diversified
global industry with aggregated revenues of more than $2.5 trillion a year. There are many classifications or subsectors of the industry based on different criteria such as type of energy source (nuclear, coal, oil, gas, etc.); service or manufacturing; upstream or downstream; and so forth. This study focused on a sample of U.S. companies within the oil and gas extraction sector of the energy
Reproduced with permission of the copyright owner. Further reproduction prohibited without permission.

3industry (SIC Code 13), commonly known as the "oil and gas industry." This industry provides employment to more than 400,000 people, and its annual aggregated revenues are more than $400 billion in the United States alone (D&B Sales & Marketing Solutions, 2003).
The economics of the oil and gas industry is mainly driven by the price of crude oil. In the late 1990s, mainly driven by the Asian economic downturn, oil prices dropped to $10 a barrel. The slump drove many companies into bankruptcy and some larger oil companies into mergers. Oil prices soared to as much as $30 a barrel in 2000, and the industry rebounded. The recovery came after the OPEC cartel restricted production until world demand caused a spike in prices. Leading this change were the world's largest integrated oil companies: Exxon Mobil, Royal Dutch/Shell, and BP. The industry momentum was slowed down by a weak global economy and reduced industrial and consumer demand, especially after the September 11, 2001, events. This caused deflated oil prices and led to oil surpluses worldwide. Early in 2003, market panic related to the impending war with Iraq and a prolonged strike by oil workers in Venezuela spiked the price of oil to more than $30 a barrel again (Energy Industry Profile, 2003).
The oil and gas industry will continue playing an important role in the worldwide geopolitical showground until an alternative and economically feasible energy
Reproduced with permission of the copyright owner. Further reproduction prohibited without permission.

4source is developed. According to Cleveland, Costanza,Hall, and Kaufmann (1984), "If one considers the last one hundred years of the U.S. experience, fuel use and economic output are highly correlated.... Energy quality is by far the dominant factor" (p. 891). Campbell (2003, para. 1) affirmed that "the fundamental driver of the 20th Century's economic prosperity has been an abundant supply of cheap oil." Unfortunately, this supply is becoming depleted and no renewable energy systems have the potential to generate more than a very small fraction of the power currently being generated by fossil fuels (oil, gas, and coal).Because of extraction of the world's oil reserves, oil production will be peaking (around 2010 or so) and then declining. At the same time, demand continues to increase by around 2% a year. According to Campbell, the likely result is an eventual worldwide economic crisis.
Besides facing a very complex geopolitical and economic environment, companies in the energy industry face significant challenges related to business ethics and how socially responsible their actions are. These actions may sometimes have a significant impact on financial performance, as illustrated by the following highly publicized cases.
The Exxon Valdez tanker departed from the Trans Alaska Pipeline terminal at 9:12 pm March 23, 1989 (Exxon Valdez Oil Spill Council, 2003). As a result of a crash with a
Reproduced with permission of the copyright owner. Further reproduction prohibited without permission.

5rock, the tanker spilled approximately 11 million gallons, or 257,000 barrels, of oil in the Gulf of Alaska. Even though the spill is not the largest ever, it is still widely considered the number one spill worldwide in terms of damage to the environment. This environmental disaster went way beyond the scope of other spills because of the remote location, accessible only by boat and helicopter, the thousands of miles of wild beaches, and the abundance of wildlife in the region. Approximately 1,300 miles of coastline were impacted by oil and Exxon spent about $2.1 billion on the cleanup effort alone.
Although nobody knows how many animals died directly from the oil spill, the carcasses of more than 35,000 birds and 1,000 sea otters were found after the spill. Since mostcarcasses sink, this was likely a small fraction of theactual death toll. The best estimates are 250,000 seabirds, 2,800 sea otters, 300 harbor seals, 250 bald eagles, up to 22 killer whales, and billions of salmon and herring eggs (Exxon Valdez Oil Spill Council, 2003).
The consequences for Exxon from this disaster were enormous. The spill costs were around $7 billion, including $2.1 billion of clean up costs and $5 billion to pay for the largest punitive fines ever handed out to a company forcorporate irresponsibility. The damage to the company'sreputation was even more important, and more difficult to quantify (Exxon Valdez Oil Spill Council, 2003).
Reproduced with permission of the copyright owner. Further reproduction prohibited without permission.

6In March 26, 1997, a race discrimination lawsuit
against Texaco Inc., was officially settled for an historic $176 million, becoming the largest race discrimination settlement in U.S. history. The agreement was reached after the disclosure earlier of secret tape recordings on which Texaco executives allegedly belittled black employees and plotted the destruction of evidence. The class-action lawsuit claimed Texaco had a racist corporate culture and discriminated against blacks in pay, promotions, and workplace behavior. The damage to the company went beyond the lawsuit settlement as Texaco was later on hit with a civil-rights boycott that caused additional financial troubles.
A company's socially irresponsible actions not only may have a short-term financial implication but also can put at risk long-term firm value. According to a study released by Claros Consulting of London, England (Ceres, 2003), ExxonMobil stance on climate change jeopardizes billions of dollars in firm value. The report was commissioned by shareholder activist Robert A.G. Monks, the Coalition for Environmentally Responsible Economies (CERES) and Campaign Exxon Mobil. The report concludes:
While ExxonMobil continues to gain respect in many quarters for its financials, it also has marched into a potential minefield of reputational risk, future shareholder losses, exposure to litigation, and policy costs on the issue of climate change... We find real and
Reproduced with permission of the copyright owner. Further reproduction prohibited without permission.

increasingly serious risks to shareholders have arisen from the way ExxonMobil has stood out from the crowd and let itself become the obvious chief "climate change villain." (Ceres, 2003, p. 1)
The study concluded that ExxonMobil's current strategy on global warming endangers shareholder value and identifies the following unnecessary risks and missed opportunities: (a) reputational risk; (b) litigation risk;(c) risks from sudden policy changes (e.g., increased risks from sudden changes in policy on fossil fuel use); and (d) missed opportunities (e.g., lack of support to a mandatory framework to reduce greenhouse gas emissions).
Statement of the Problem The problem addressed in this study was to determine
the extent to which business ethical behavior and corporate social responsibility impact firm value in companies in the "Oil and Gas Extraction" industry. Firm value in this study is defined as Return on Equity (ROE) or approximate Tobin's Q ratio (ATQ) in the year 2003. Although definitions of corporate social responsibility vary, they all imply that a corporation has responsibilities to society that transcend the production of products and services at a profit. As Frederick (1999) argued, companies are more than economic institutions and they have a responsibility to help society to solve pressing social problems by devoting resources to
Reproduced with permission of the copyright owner. Further reproduction prohibited without permission.

8the solution of these problems. The concept of social responsibility is basically an ethical concept.
Research Questions1. What is the relationship between ethical behavior
and firm value in companies in the oil and gas industry?2. What is the relationship between companies' efforts
to minimize their negative impact on the environment and firm value in companies in the oil and gas industry?
3. What is the relationship between companies' efforts to embrace diversity and firm value in companies in the oil and gas industry?
4. What is the relationship between companies' community service efforts and firm value in companies in the oil and gas industry?
Conceptual FrameworkFigure 1 below presents a conceptual model used in
this study to provide a theoretical linkage between the corporate performance and firm value. Corporate performance has two components: social performance and financial performance. The corporate social performance is measured using four social indexes reflecting corporate behavior specifically related to the research questions. The four social indexes are environmental, diversity, community, and ethical indexes. The financial performance has three
Reproduced with permission of the copyright owner. Further reproduction prohibited without permission.

components: book value, market share, and cash reserves in 2003. The three financial variables and the four social performance indexes are inputs to the multiple regression model to determine their impact on firm value.
CommunityIndex
EthicalIndex
EnvironmentalIndex
DiversityIndex
Q.
C l
tuu_ c■S ? o p
s.
^ sfQ C‘G c c t
£
SP
Return on Equity
BookVaiue
MarketShare
CashReserves
Approx. Tobin's Q
Independent Variables Dependent Variables
Figure 1. Conceptual model-Corporate social performance and firm value.
The measurement of firm value in the conceptual model is based on two distinct variables: Return on Equity (ROE) and approximate Tobin's Q ratio (ATQ). ROE, or the rate of return on stockholder's investment, is an accounting-based measure and a rather static look at past financial performance to determine the value of the firm. The
Reproduced with permission of the copyright owner. Further reproduction prohibited without permission.

10approximate Tobin'’s Q ratio is a market-based measure and a more dynamic and forward looking at the value of the firm based on past performance as well as future expectations.
The researcher explored links and relationships between financial variables, social indexes, and firm value, but not causation. In order to do the latter, the researcher would have needed to rule out all other possible causes of good and poor firm value, which was beyond the scope of this study. A more detailed discussion on the development of the social indexes and the statistical data analysis techniques used to establish a relationship with firm value is presented in chapter 3 of this dissertation.
PurposeThe purpose of this study was to raise visibility and
awareness of business ethics and corporate social responsibility issues. The researcher has more than 23 years of experience in the oil and gas industry. His goals with this study were (a) to make a scholarly contribution to the body of knowledge of corporate social responsibility and to societal change in general, and (b) to advocate positive and responsible social behavior in companies in the oil and gas industry.
Reproduced with permission of the copyright owner. Further reproduction prohibited without permission.

11Assumptions
The researcher assumed the following:1. The fewer relatively big companies preselected
for the study have a much bigger overall social impact than the larger number of small companies in the industry. This assumption seems intuitively correct as it was expected that decisions from a company with 1,000 employees would have a larger social impact than decisions from a company with only 20 employees, just by looking at the impact on the employees alone.
2. Related to the assumption mentioned above, the expectation was that the companies selected in the sample were truly representative of all the companies in the oil and gas industry.
3. The availability and accuracy of the data used for this research truly reflect the companies' ethical and social behavior and actions.
Scope and DelimitationsThis study includes a random sample of 55 companies in
the oil and gas extraction subsector of the energy industry only. The duration of the study was approximately 3 months.
The study used available data from public documents, official records, and mass media dated from January 2000 to December 2003. The researcher used content analysis techniques to analyze the available data. The study sought
Reproduced with permission of the copyright owner. Further reproduction prohibited without permission.

12to reduce the total content of a communication to a set of categories that represent some characteristic of research interest. Using these categories, the researcher created a series of social indexes reflecting the positive or negative social behavior or actions of the sample companies.
For the purpose of the study of the socially responsible behavior, the research focused on four specific categories, which in turn drove the development of the social indexes: (a) environment, (b) diversity, (c)standards of business ethics, and (d) community service. Therefore, any other categories of socially responsible behavior was included in this study (e.g., adopting other aspects of corporate governance such as executive compensation or stakeholder consultation, adopting specific human rights standards for international operations and practices, etc.)
LimitationsThe companies in this study were selected by a random
sample of companies in the Oil and Gas Extraction subsector of the energy industry. The biggest limitation of this study is inherently related to the research methodology of using available data. The main potential source of error using this methodology is the availability and accuracy of the data themselves. The researcher attempted to minimize
Reproduced with permission of the copyright owner. Further reproduction prohibited without permission.

13this source of potential error by exploring records from more than 1,000 mass media, mainly newspapers and magazines.
Definitions of TermsEthical Standards Index (ESI): Index to measure if the
company has available a code of business conduct and seems to operate within a framework that consistently holds on to that code. A higher value of this index reflects a higher positive ethical behavior or actions of the sample company and vice versa.
Community Service Index (CSI): Index to measure if the company makes investments of money and other resources to aid the communities in which it operates. A higher value of this index reflects a higher positive community related behavior or actions of the sample company and vice versa.
Diversity Index (DI): Index to measure if the company advocates and builds a workforce that represents society at large and provides equal opportunity employment. A higher value of this index reflects a higher positive diversity related behavior or actions of the sample company and vice versa.
Environmental Index (El): Index to measure if the company makes every effort to do business in a manner that minimizes the negative impact on the environment. A higher value of this index reflects a higher positive environment
Reproduced with permission of the copyright owner. Further reproduction prohibited without permission.

14related behavior or actions of the sample company and vice
versa.Firm value: Determined by one of two variables, Return
on Equity (ROE) or Approximate Tobin's Q ratio (ATQ).Return on equity (ROE): Return on common equity (ROE)
in the year 2003, or the rate of return on stockholder's investment.
Approximate Tobin's Q ratio (ATQ): Chung and Pruitt's(1994) alternative formula for approximating Tobin's Q. The ratio is a function of the market value of common stock (or market capitalization), the book value of preferred stock, the book value of long term debt, and the book value of total assets
Minorities: women, African Americans, Asians, and Hispanics or Latinos.
Significance of the StudyThe findings of this study should contribute
significantly to both researchers and practitioners in the area of corporate social responsibility. Existing ethical standards and corporate social responsibility programs tend to focus on teaching managers about the different needs and expectations of the company's stakeholders. If managers are committed to promoting these programs, the basis for that commitment and the value it might bring needs to be better understood.
Reproduced with permission of the copyright owner. Further reproduction prohibited without permission.

15Little research has been performed on socially
responsible behavior and its impact on firm value specifically related to the oil and gas industry. The knowledge provided by this study can establish a roadmap to guide managers to behave ethically and help them avoid common socially irresponsible pitfalls. The knowledge and awareness of these issues should compel managers in the industry to lead a positive social change process by aggressively pursuing in their companies goals of no emissions, no environmental damage incidents, increased diversity in the workplace, and no incidents of unethical behavior.
SummaryChapter 1 of this dissertation provided an
introduction to the study highlighting instances of deficiencies in business ethics or corporate social responsibility issues reported by the mass media. The disclosures of these unethical behaviors have recently placed ethical issues higher on the agenda and have contributed to creating new awareness of these issues. The problem to be addressed in this study is to determine whether business ethical behavior and corporate social responsibility have a relationship with firm value in companies in the oil and gas extraction subsector of the energy industry. Companies in this industry face
Reproduced with permission of the copyright owner. Further reproduction prohibited without permission.

16significant challenges, not only facing a very complex geopolitical and economic environment but also facing multiple business ethics and social responsibility issues. Some of these issues and actions have significantly impacted financial performance in the past, as illustrated by highly publicized cases, such as Exxon's Valdez environmental disaster and Texaco's $176 million racial discrimination lawsuit.
A conceptual model was proposed in this study to provide a theoretical linkage between corporate social performance and firm value. The corporate social performance was measured using four social indexes reflecting corporate behavior specifically related to the research questions: environmental, diversity, community, and ethical indexes. The measurement of firm value in the conceptual model was based on two distinct variables:Return on Equity (ROE) and Approximate Tobin's Q ratio (ATQ).
The next chapter of this dissertation reviews research on the subjects of business ethics theories, corporate social responsibility construct, socially responsible investing, and their effect on financial performance. Existing literature regarding the different categories and variables of social responsibility and firm value established in the study is reviewed.
Reproduced with permission of the copyright owner. Further reproduction prohibited without permission.

17The following section, chapter 3, encompasses the
methodology used in this research to determine the empirical relationship between social performance and firm value. Chapter 4 presents the findings of the study and chapter 5 presents a summary, conclusion, and recommendations for further research.
Reproduced with permission of the copyright owner. Further reproduction prohibited without permission.

CHAPTER 2: LITERATURE REVIEWThis chapter includes reviewed literature and is
organized into four sections. The first is a review of business ethics theories, with particular emphasis on the main approaches to normative ethics. This section also includes a description of the corporate social responsibility construct and the current controversy on the extent of corporate obligations to society. The second section summarizes research on socially responsible investing and an account of its substantial growth in the 1990s. The third section is a review of literature and research studies regarding diversity, environmental regulation, and environmental ethics, which are categories of socially responsible actions established in the methodology used to conduct this research. The fourth and final section provides reviews of literature regarding firm valuation. This section also provides a literature review on return on equity and approximate Tobin's Q ratio, which are the variables used to measure firm value in the study.
Business Ethics and Corporate Social Responsibility There are two fundamentally distinct methods of
ethical decision making (each of which is well represented in the history of philosophy), and most theories developed by ethicists fall into these two categories. Deontological theories use the concept of their inherent rightness in
Reproduced with permission of the copyright owner. Further reproduction prohibited without permission.

19establishing ethical standards, while teleological theories (also called consequentialism) consider the goodness or value brought by actions as the principal criterion of their ethical value. A deontological approach calls for doing certain things on principle or because they are inherently right, whereas a teleological approach promotes that certain kinds of actions are right because of the goodness of their consequences (Donaldson, Werhane &Cording, 2002) .
Inmmanuel Kant's method (as described in Frederick, 1999) of deontological ethics is probably the most influential approach to ethical reasoning. Indeed, Kant's influence on that branch of ethical theory is so strong that some writers simply refer to deontology as Kantianism. His approach focuses on duty and universal rules to determine right actions. He argued that the highest good was the good will and to act from a good will is to act from duty.
According to Frederick (1999), Kant referred to the fundamental principle of ethics as the categorical imperative. He formulated it in many ways, but most analysis has been focused on the following three formulations:
1. Act only on maxims which you can will to beuniversal laws of nature.
Reproduced with permission of the copyright owner. Further reproduction prohibited without permission.

202. Always treat the humanity in a person as an end, and never as a means merely.3. So act as if you were a member of an ideal kingdom of ends in which you were both subject and sovereign at the same time. (Frederick, 1999, p. 4)
Kant's ethics is therefore an ethics of duty as opposed to an ethics of consequences. For Kant, it is the intention of the action rather than its consequences that make that action good. The ethical person is therefore the person who acts from the right intentions. One is able to act in this way because one has free will.
Probably the most influential proponents of consequentialism ethics were the late 18th and 19th century English philosophers and economists Jeremy Bentham and John Stuart Mill and their development of utilitarianism theories. Utilitarianism is a consequentialist ethical theory because it declares that "an act's rightness or wrongness is determined solely by the act's consequences and not by any feature of the act itself" (Frederick, 1999, p. 17). Utilitarianism states that an action is right if it tends to promote happiness and wrong if it tends to produce the reverse of happiness; not just the happiness of the performer of the action but also that of everyone affected by it. The idea behind utilitarianism is that we should act to bring about the best consequences. Consequently, whether an act is morally right or wrong depends on whether the act does or does not bring about the best consequences.
Reproduced with permission of the copyright owner. Further reproduction prohibited without permission.
21According to the utilitarian, it is therefore possible for the right thing to be done from a bad motive.
The intention of this brief summary of the main approaches to normative ethics is not, by far, a substitute for a thorough study of traditional ethical theories. The objective was merely to introduce these modes of ethical reasoning as a foundation to further discussions of ethical issues in business covered in this study.
The biggest controversy in the field of business ethics is the extent of corporate obligations to society. Friedman (1970) affirmed that businesses do not have obligations to society beyond their obligation to their shareholders, which usually requires making a profit, as long as they obey the laws. According to Friedman, in a free market economy, corporate executives are employees of the owners of the business and as such they have direct responsibility to their employers. Their responsibility is to be their agents and conduct the business in accordance with the employers' desires, which generally will be to make as much money as possible while conforming to the basic rules of the society. However, when the executives decide to spend money in general social interests, they are in fact spending someone else's money and reducing the returns to the stockholders. In this sense, they are in effect imposing taxes to the firm as well as deciding how the taxes should be spent. Friedman affirmed that this fact
Reproduced with permission of the copyright owner. Further reproduction prohibited without permission.

22is the main reason why "the doctrine of 'social responsibility' involves the acceptance of the socialist view that political mechanisms, not market mechanisms, are the appropriate way to determine the allocation of scarce resources to alternative uses" (Friedman, 1970, para. 15).
Freeman (1984) developed the now popular stakeholder theory, which was originally a theory of management. The theory held that effective corporate management required consideration to the interests of all appropriate stakeholders and not only the stockholders. He distinguished two types of stakeholders. The narrow definition includes only the groups that are vital to the survival of the corporation, and the wide definition includes any group that can affect or is affected by the corporation. According to the stakeholder theory, corporations' financial success could best be achieved by giving the interests of all stakeholders equal consideration and adopting corporate policies which produce the optimal balance among them. Every corporation and every business has an ethical responsibility to each of its constituencies: shareholders, employees, customers, suppliers, and the community in general. The organization affects each of these constituencies and is in turn affected by them. Each constituency therefore becomes a stakeholder in the enterprise, and each one in turn has
Reproduced with permission of the copyright owner. Further reproduction prohibited without permission.
23specific expectations as to what the enterprise should do and how it should do it.
Stockholders usually expect a reasonable return on their investment. Consequently, business executives have an ethical responsibility to pursue profitable management of the owners' investment. Business managers also have an ethical duty to employees, which should be based on the respect for the worth and dignity of persons who devote their energies, knowledge and skills to the business and who depend on the business for their economic well-being. Manager's employee-related decisions therefore must be made equitably and compassionately, and their actions should advocate and promote several employee interests such as career opportunities and growth, job security, and adequate overall working conditions. The corporation also has an ethical responsibility with customers, which arises out of expectations regarding the purchase of goods and services. Failure to act appropriately brings about product liability issues and the advent of multiple of regulatory agencies created to protect consumers. The company's ethical duty to its suppliers takes place out of the market relationship that exists between them. The corporation expects a high quality of suppliers' parts or services which in turn affects the quality of the company's own product. The supplier expects a reasonable price and profit associated with its products or services (Freeman, 1984).
Reproduced with permission of the copyright owner. Further reproduction prohibited without permission.

24A company's ethical duty to society comes from the
expectation that it will be a good citizen, pay its share of taxes, and strive to conduct business in a way that minimizes negative impact on the environment and on the communities in which they operate (Freeman, 1984).
The corporate social responsibility (CSR) construct attempts to describe the relationship between business and the larger society. An exact definition of CSR is difficult because the perceptions and attitudes regarding the character of this association change with time and depends on the relevant issues of the day. Consequently, points of view about the definition of CSR have varied over time.Kok, Weile, McKenna, and Brown (2001) defined social responsibility of business in general terms as "the obligation of the firm to use its resources in ways to benefit society, through committed participation as a member of society, taking into account the society at large and improving welfare of society at large independent of direct gains of the company" (p. 288).
Carroll (1999) distinguished four elements of CSR: economic, legal, ethical, and discretionary or philanthropic. The economic component is business's fundamental responsibility of growing and making profits.The legal element is the business obligation to obey the law. The ethical component is its obligation to follow the norms placed on them by society. Finally, the discretionary
Reproduced with permission of the copyright owner. Further reproduction prohibited without permission.

25element involves philanthropic activities that support the broader community.
Socially Responsible Investing Closely related to the theories of business ethics and
the corporate social responsibility construct is the subject of socially responsible investing (SRI). In this approach, investors may attempt to shape the ethical and discretionary components of corporate social responsibility in keeping with their own beliefs and values. Spencer (2001) stated that socially responsible investing increased by nearly 200% in the late 1990s. Sauer (1997) affirmed that SRI represents 10% of all investment dollars in the United States.
Hamilton, Jo, and Statman (1993) defined SRI as a way for individual investors to integrate "money into one's self and into the self one wishes to become" (p. 63). Socially responsible investors tend to select stocks or mutual funds that are in concordance with their core values. They hope that by doing this, they will send a positive signal to socially responsible organizations and a concerned signal to companies out of compliance.
The Social Investment Forum (2003) defined SRI as the integration of personal values and societal concerns with investment decisions. Consequently, SRI considers not only the investor's financial needs but also the investment's
Reproduced with permission of the copyright owner. Further reproduction prohibited without permission.

26impact on society. SRI is based on the premise that money can be put to work to build a better tomorrow while still earning competitive returns today.
According to the Social Investment Forum (2003), three key SRI strategies have evolved over the years: (a)screening, (b) shareholder advocacy, and (c) community investment. Screening is the process to include or exclude corporate securities in investment portfolios based on social or environmental criteria. Socially concerned investors generally try to own profitable companies with good history of employee relations, good records of community involvement, excellent environmental impact policies and practices, and safe and useful products. On the other hand, they frequently avoid investments in those firms with problems in these areas.
Shareholder advocacy is a way to support social responsibility by mean of shareholder resolutions which address issues like company policies and practices regarding health and safety, the environment, discrimination, labor abuses, and protection of other human rights. Community investment implies investment that supports development initiatives in low-income communities both in the United States and in developing countries with the objective to provide affordable housing and the creation of jobs (Social Investment Forum, 2003).
Reproduced with permission of the copyright owner. Further reproduction prohibited without permission.

27Independently of the type of company and its social
responsibility actions, investors in general still demand an acceptable return on their investments over time (Hill, Stephens & Smith, 2003). Many studies have been undertaken to determine whether there is a connection between social performance and financial performance. Reviews of these studies are included in Arlow and Gannon (1982), Frooman(1994), Reyes and Grieb (1998), Ullman (1985), and Wood and Jones (1995). Although individual studies have found significant positive and negative relationships, the reviewers have concluded that, in general, there has been no finding of improved economic performance for companies with better social performance, but neither has there been worse economic performance. There is remarkable consistency, however, in finding negative returns following the announcement of a socially irresponsible event. This fact was documented by 8 out of 9 studies as reviewed by Frooman (1994) and 10 out of 11 studies in Wood and Jones(1995).
The studies of social responsibility funds have given mixed results. Many authors have pointed to examples of social funds that outperformed the stock market and other mutual funds at certain periods (Bruyn, 1987; Hylton, 1992; Kinder, 1993; Stoval, 1992). Others have found weaker returns provided by social funds (Galen, 1994; Teper,1991). In studies controlling for risk, Hamilton, Jo, and
Reproduced with permission of the copyright owner. Further reproduction prohibited without permission.

Statman (1993) and Reyes and Grieb (1998) found no significant difference in performance between risk-adjusted returns of socially screened mutual funds and funds which do not follow socially investment principles. Luck (1998) analyzed the Domini Social Index's returns since inception, and found that, after adjusting for market risk, style, and industry, there is still some unexplained outperformance.He stated the possibility that the performance advantage might be a result of the social screens. Dibartolomeo and Kurtz (1999), on the other hand, analyzed the Domini Index using models similar to Luck's. They agreed with Luck that industry effects are important, but their model did not find significant unexplained performance. Hickman, Teets, and Kohls (1999) discussed possible effects of social investing and their implications for investors in the context of modern portfolio theory. They found that socially responsible funds may be valuable contributions to reduction of portfolio risk.
The Social Investment Forum (2003) tracks the performance of socially screened funds. In its 2003 annual trend report it states that for the third quarter of 2002, 12 of the 18 screened funds with $100 million or more in assets received top marks for performance from either Morningstar or Lipper or both for the 1 or 3-year periods ended September 30, 2002.
Reproduced with permission of the copyright owner. Further reproduction prohibited without permission.

291. The socially responsible mutual funds tracked by Morningstar received that company's highest rankings (four or five stars) more often than the overall universe of mutual funds.
2. Assets in socially screened separate accounts grew by nearly 40%, to $1.87 trillion, from 1999 to 2001.
3. Some 230 mutual funds with $153 billion in assets, currently incorporate social screening into their investment process.
4. Socially screened mutual funds retain investor loyalty. Through the first nine months of 2002, when investors put 94% less money into mutual funds, socially screened funds dropped only 54%. (Social Investment Forum, 2003, p. 11)
The number of socially responsible mutual funds in the United States has grown from 8 in the mid-1980s to 175 in 1999. More than $2 trillion dollars in assets are currently involved in socially and environmentally responsible investing in the U.S. (Social Investment Forum, 2003).
DiversityThe population of the United States is forecast to
grow steadily over the next few decades mainly because of immigration. This growth will bring about significant changes such as increased aging in the overall population, health care challenges, uncertainty on the financial viability of the Social Security Administration and Medicare, and so on. Population aging is a major trend as the number of elderly in the United States is expected to
Reproduced with permission of the copyright owner. Further reproduction prohibited without permission.

30leap to 52 million in 2020 and 65.5 million in 2030, by which time there will be more elderly people than children (Kennedy, 1993).
One of the most significant challenges and a highly sensitive issue is the changing demographics and what is happening in the racial and ethnic diversification dimensions. The results of the 2000 census 2000 (U.S.Census Bureau, 2000) showed that Hispanics (or Latinos) of any race make up 12.5% of the U.S. population while in 1990 they made up 10.1% of the total population. The Hispanic or Latino has been the fastest growing minority group in the past decade. The group's 57.9% growth outweighs by far the non-Hispanic 8.7% population growth during the decade.Whites grew only 3.4% while Black or African Americans grew 16.2% over the same 10-year period. These changes in the mix of the diversity dimension bring about many challenges and research opportunities for social scientists, politicians, and scholars, as well as business managers in general.
Developing and successfully managing a workforce of individuals with different cultural backgrounds will become more important in the near future. The U.S. Census Bureau has estimated that approximately 31% of the total population will be comprised of nonwhites by 2005. Only about 15% of those entering the workforce in the next decade will be white males. Orndoff (2003), however, points
Reproduced with permission of the copyright owner. Further reproduction prohibited without permission.

31out that diversity is not occurring everywhere in the United States, or at least not to a degree that would alter the demography of every region in the country. According to Orndoff, many parts of the United States are truly becoming more diverse, while others are essentially remaining the same in terms of race, age, and religion.
All these demographic changes have also caused different and sometimes polarized reactions among members of the Congress, the government, and the population in general: On one side there are those that advocate increased immigration and on the other side, those that advocate blocking the door for more immigration. As a subsystem within the larger social system, corporateAmerica has been forced to develop its own set of responsesto these changes in the population.
Although it is generally accepted that fulldiversification and equal opportunity have not yet been achieved in corporate America, some companies and some industries are more successful than others in promoting these concepts. However, success promoting corporate diversity programs does not necessarily mean that the company is increasing its value. Developing comprehensive programs for hiring, coaching, mentoring, and training a diverse workforce can be very costly and there is very little empirical evidence to establish whether or not those additional costs are offset by increased firm value.
Reproduced with permission of the copyright owner. Further reproduction prohibited without permission.

32Disclosures of fraud and accounting irregularities at
Enron, WorldCom, and other companies shocked the equity markets in 2002. Enron''s collapse resulted in the largest bankruptcy in U.S. history and caused widespread distress among equity shareholders, as a company with an equity market capitalization of over $70 billion became worthless in just over a year. The collapse was also a catastrophe to many of its employees, who not only lost their jobs, but saw the value of their 401(K) pension plans invested in Enron stock disappear. These recent corporate events have brought a higher public awareness to corporate governance issues. Although much work has been accomplished to date, more remains. Human resource theorists have supported expectations for improved performance and increased value for companies providing programs that integrate diversity initiatives since at least the early 1990s. Given the emphasis being placed on corporate diversity as a part of good corporate management, the relationship between diversity and shareholder value creation deserves both theoretical and empirical investigation.
D'Netto and Sohal (1999) provided an empirical assessment of the extent to which human resource management practices were being used by organizations in Australia to manage workforce diversity. The study was based on data collected from a sample of 500 large organizations in Australia. The study also assessed the perceived challenges
Reproduced with permission of the copyright owner. Further reproduction prohibited without permission.

33and benefits of diversity in the workforce. The goal of the study was to determine if organizations in Australia adequately use effective practices for managing workforce diversity. The findings of this study indicated that overall, management of workforce diversity is only mediocre in the sampled organizations. In particular, inadequate diversity management practices were found in the areas of recruitment, selection, and training and development.
According to Cox and Blake (1991), firms that lag in developing a diverse workforce may jeopardize market share and productivity. Cox and Blake's expectation is that firms which promote diversity achieve competitive advantages in six areas: cost, resource acquisition, marketing, creativity, problem-solving, and organizational flexibility. However, whether these competitive advantages (if they really exist), result in increased firm value remains an empirical issue yet to be resolved. Cox and Blake also argued that substantial costs exist for firms that do a poor job of integrating their diverse workforce. These costs are related to turnover and absenteeism of women and minorities that are dissatisfied with their careers and prospects for advancement. Firms that deal with diversity-related issues should therefore have cost advantages over firms that do not.
The business case for a positive correlation between diversity and firm value was studied by Robinson and
Reproduced with permission of the copyright owner. Further reproduction prohibited without permission.

34Dechant (1997). Although the study was based on limited empirical evidence and no single theoretical framework, it provided good intuitive examples to support each proposition. The authors argued that diversity affects a firm's long-term and short-term financial value in several
ways.1. Corporate diversity promotes a better understanding
of the marketplace by providing a better match with the company''s diversified customers and suppliers. This also increases the company's ability to penetrate new markets.
2. Diversity increases creativity and innovation.3. Diversity produces more effective problem-solving
as the variety of perspectives allows the decision makers to evaluate more alternatives and more carefully explore the consequences of these alternatives.
4. Diversity enhances the effectiveness of corporate leadership. Diverse top managers take a broader view while homogeneity at the top of a company is believed to result in a narrow perspective. The result of diversity at the top is a better understanding of the complexities of the environment and more astute decisions.
5. Diversity promotes more effective global relationships. Cultural sensitivity is critical in an international environment and ethno-cultural diversity makes corporate leaders more sensitive to cultures not in North America (Robinson & Dechant, 1997, pp. 26-27).
Reproduced with permission of the copyright owner. Further reproduction prohibited without permission.

Carter, Simkins, and Simpson (1999) conducted a study to empirically examine the relationship between board of directors' diversity and shareholder value creation by studying Fortune 1000 firms. The researchers described statistically significant positive relationships between the presence of women or minorities on the board and firm value. They also found that the fraction of women and minorities directors increases with firm size but decreases as the number of insiders increases. Keys, Turner, and Friday (2002) compared firms ranked by Fortune as being among the "diversity elite" with firms not ranked as such to assess the impact of diversity on firm performance. They found that diversity promoters add more value to shareholders than non diversity promoters.
Jones (2000) investigated the caring morality perspective of managers in a corporation recognized as being a champion of promoting diversity and equal opportunity. Results of this research revealed that the female managers were significantly more caring than the male managers. The study also showed that European American managers were found to lean significantly more toward a caring morality perspective than African American managers.
Keys, Turner, and Friday (2002) used a sample of firms characterized as diversity promoters in a study to provide empirical evidence consistent with resource-based theories of competitive advantage. In the period following diversity
Reproduced with permission of the copyright owner. Further reproduction prohibited without permission.

36ranking, firms categorized as diversity promoters exhibited significantly greater return on equity than an operating performance-based control sample of peer firms, and their buy-and-hold returns are significantly different from zero after being adjusted for buy-and-hold returns of the performance-based control sample. According to the study, top diversity promoters add more shareholder wealth than firms that are not classified among top promoters. The wealth impact was positively related to the proportion of diversity among top-level managers.
Hamlet (2000) examined the factors and attributes that caused black professionals to be excluded from policymaking positions in corporate America. The study findings indicated that mentorship was the prime factor that would assist black professionals in their rise to the executive suite. Racism and doubts by those in power and their peers about black professionals' capability of excellent performance can hold them back from achieving their goal.All of the chief executive officers who responded in Hamlet's survey indicated that they wanted their organizations to be diversified because it made business sense—that is, diversity increased competitiveness and organizational effectiveness by maximizing talent and creativity and fostering innovation, which ultimately leads to increase profits.
Reproduced with permission of the copyright owner. Further reproduction prohibited without permission.

37Environmental Regulation and Ethics
Environmental issues raise a series of difficult ethical questions, including the ancient one of the nature of intrinsic value. Many deontological philosophers in the past have agreed that human experiences have intrinsic value. In deontological ethics an action is considered morally good because of some characteristic of the action itself, not because the product of the action is good (utilitarianism). Deontological ethics holds that at least some acts are morally obligatory regardless of their consequences for human welfare (Donaldson, Werhane, & Cording, 2002) .
The utilitarians at least have always accepted that the pleasures and pains of nonhuman animals are of some intrinsic significance. However, this does not show why it is so bad if some animals become extinct or a rain forest is damaged. The question is whether these things should be regretted only because of their consequences to human welfare or because of their consequences to other creatures.
Another important question raised by our concern with the environment is our obligations to future generations. Most ethical theories give weight to the interests of coming generations. Utilitarians, for example, give members of future generations the same consideration to their interests than we give to our own. A good example of this
Reproduced with permission of the copyright owner. Further reproduction prohibited without permission.

38issue is the storage of radioactive wastes which clearly will indeed affect the interests of generations to come.
Environmental regulation in the United States has been accused in the past of causing a wide array of adverse economic consequences. In many circles, there is the perception that environmental regulation is "too expensive, reduces economic growth, hurts international competitiveness, and causes widespread layoffs and plant closures... it even forces businesses to flee to more accommodating countries" (Arnold, Forrest, & Dujack, 1999). According to the Environmental Protection Agency's report "Environmental investments: The Cost of a Clean Environment" (U.S. EPA, 1990), the cost to comply with federal environmental regulations was 2.1% of gross domestic product in 1990, and a projected 2.6% of GDP in 1997. This works out to about $210 billion in 1997 dollars. Some researchers believe that the $210 billion figure is too low (Jaffe, Peterson, Portney, & Stavins, 1995; Schmalensee, 1995). According to them, the estimated costs of cleaning omit a number of more understated environmental regulatory costs, such as reductions in agricultural yields that arise due to restrictions on pesticide, the costs of complying with noise restrictions at airports, legal, other transaction costs, and so on.
Arnold, Forrest, and Dujack (1999) studied whether the costs of environmental protection is money well spent. They
Reproduced with permission of the copyright owner. Further reproduction prohibited without permission.
39also studied the effect of costs on unemployment, plant closures, reduced international competitiveness, and economic growth. They concluded that there is indeed room for improvement in environmental protection, but in the end, although environmental regulation may not be perfect, it does not cause the widespread negative economic effects that are so often alleged.
Environmental ethics is a relatively young academic field. It started in the early 1970s when environmentalists urged philosophers who were involved with environmental groups to do something about environmental ethics (Center for Environmental Philosophy, 2003). White (1967) published a brief but influential article titled "The Historical Roots of our Ecologic Crisis." White argued that in order to successfully address the emerging environmental crises, humans must first examine and critique their attitudes toward nature which in turn are rooted in our religious beliefs. Hardin (1968) stated that there is a subset of problems, such as population, atomic war, and environmental corruption, for which there are no possible technical solutions. He suggested that the solution for these problems must come from the political and social fields and identified these issues as the most critical problems that threaten the existence of humankind.
Reproduced with permission of the copyright owner. Further reproduction prohibited without permission.

40Firm Value
The word value is a subjective term that means different things to different people. Even to the same person, value might mean different things in different contexts. Therefore, it is important to carefully define what is meant by value, so the conclusions reached in the valuation process have meaning. Sometimes the standard of value is legally mandated, either by law or by binding legal documents or contracts while in other cases, it is a function of the wishes of the parties involved. They usually reflect an assumption as to who will be the buyer and who will be the seller in the hypothetical or actual sales transaction. The standard of value addresses the questions: "Value to whom?" and "Under what circumstances?" The following section of this dissertation provides a discussion on some of the main types of value standards.
Standards of Value
In the United States the most widely recognized and accepted standard of value related to business valuations is the fair market value. With regard to business valuations, this standard applies to virtually all federal and state tax matters, such as estate taxes, gift taxes, inheritance taxes, income taxes, and ad valorem taxes. It is also the legal standard of value in many other valuation situations. Fair market value is defined by the ASA
Reproduced with permission of the copyright owner. Further reproduction prohibited without permission.
41(American Society of Appraisers) as "the amount at which property would change hands between a willing seller and a willing buyer when neither is acting under compulsion and when both have reasonable knowledge of the relevant facts" (Pratt, Reilly, & Schweihs, 2000, p. 28). The willing buyer and willing seller are hypothetical persons, rather than any particular buyer or seller. In other words, if the valuation is influenced by special motivations not characteristic of a typical buyer or seller, then it would not be considered representative of fair market value. The definition also implies that the parties have the ability as well as the willingness to buy or to sell. InvestorWords.com (2003) defines fair market value as "The price that an interested but not desperate buyer would be willing to pay and an interested but not desperate seller would be willing to accept on the open market assuming a reasonable period of time for an agreement to arise."
Investment value is defined in the Dictionary of Real Estate Appraisal as "the specific value of an investment to a particular investor or class of investors based on individual investment requirements; distinguished from market value, which is impersonal and detached" (Shea- Joyce, 1993, p. 190). Business appraisal terminology holds the same distinction in most circumstances. In the case of mergers and acquisition, investment value is equivalent to the "acquisition value" of a company, which is the price at
Reproduced with permission of the copyright owner. Further reproduction prohibited without permission.
42which the company would trade in the "market for corporate" control (Rock, Rock, & Sikora, 1994, p. 181).
Market value and investment value are different concepts and the values estimated for each may or may not be numerically equal depending on the circumstances. While investment value is the specific value of goods or services to a particular investor based on individual investment requirements, market value can be called "the value of the marketplace." While market value estimates are commonly made without reference to investment value, investment value estimates are commonly coming together with a market value estimate to facilitate decision making (Pratt,Reilly, & Schweihs, 2000).
Intrinsic or fundamental value is characterized by an analytical judgment of value based on the perceived characteristics inherent in the investment, not influenced by characteristics peculiar to any one investor, but rather moderated by how these perceived characteristics are interpreted by one analyst versus another. The concept is applicable to the analysis of stock, in which intrinsic value is generally considered the appropriate price for a stock according to a security analyst who has completed a fundamental analysis of the company's assets, earning power, and other factors. A fundamental analysis is an approach which assumes that a security has an "intrinsic value" that can be determined through a thorough evaluation
Reproduced with permission of the copyright owner. Further reproduction prohibited without permission.

43of relevant variables such as expected earnings, dividends, capital structure, management quality, and so on. An analyst estimates the "intrinsic value" of a security on the basis of those fundamental variables and compares this value with the current market price of this security to arrive at an investment decision.
Pratt, Reilly, and Schweihs (2000) define intrinsic value as the amount that an investor considers, to be the "true" or "real" worth of an equity security on the basis of an evaluation of available facts. InvestorWords.com (2003) defines intrinsic value as "the perceived actual value of a security, as opposed to its market price or book value." This value can become a market value if other investors reach the same conclusion on the "true" value of the item. The difference between the market value of a security and its intrinsic value is used by the analyst to conclude whether to recommend a "buy" if the market value is below what the analyst concludes is the intrinsic value or a "sell" if the market value is above the assumed intrinsic value.
Similar to the investment value, the concept of intrinsic value cannot be entirely separated from the concept of fair market value. The activity between buyers and sellers based on their specific perceptions of intrinsic value eventually lead to the general consensus market value and to the dynamic changes in market value
Reproduced with permission of the copyright owner. Further reproduction prohibited without permission.

44over time (Pratt, Reilly, & Schweihs, 2000). The measurement of firm value in this dissertation was based on two distinct variables: Return on Equity (ROE) as an indicator of fair market value of the firm, and approximate Tobin's Q ratio (ATQ) as an indicator of intrinsic value.ROE is a rather static look at past financial performance to determine the value of the firm. ATQ is a more dynamic and forward looking at the value of the firm based on past performance as well as future expectations.
Equity Valuation
The task of equity valuation is normally performed by financial analysts, whose goal is to predict a future stock price, or target price. In this sense, the result of the analysis is simply an opinion or a position from the analyst supported by financial and non financial information. Individuals and institutional investors take into consideration the positions of a number of analysts to make a range of possible decisions such as buying, selling, or holding the stocks.
The analyst usually predicts the target price of the stock by multiplying a projected measure of future financial performance such as earnings, by an estimated capitalization factor, like the price per earnings ratio. Estimating the capitalization factor is a relatively simple process and is based on existing data. However, estimating
Reproduced with permission of the copyright owner. Further reproduction prohibited without permission.

45future financial performance is a difficult and elaborate process which consists of the following main elements: (a)analyzing the firm's external and internal environment, (b) reading and analyzing financial statements, and (c) developing a financial model. The analysis of the competitive environment and the firm strategy provides the foundation for equity analysis and valuation. This analysis is complemented by the reading of the firm's financial statements and the analysis of the firm's financial ratios. The analysis of the competitive environment and the historical financial analysis provide the data for a financial model to predict future performance. The results of the model are then used by the analyst to arrive at an opinion or position about the stock value.
The analysis of historical financial statements could be a lengthy and frustrated process due to the amount of detailed information provided in the statements. To help with this process, English (2001) recommends a focus on the "accuracy, sustainability, and predictability of the firm's financial information; the composition of its returns; and its capacity for continued investment" (p. 1 2 ).
To determine a quantitative prediction of future performance based on inaccurate historical performance financial is obviously difficult and might bring about incorrect valuation and wrong stock recommendations. Many times, the generally accepted accounting principles (GAAP)
Reproduced with permission of the copyright owner. Further reproduction prohibited without permission.

46itself might be the cause of these distortions of the accounting records. The management opinions in the financial statements sometimes can be inaccurate and misleading. The analyst should also be aware of one-time events in the firm, such as acquisitions, and account for these facts appropriately in the projections.
Besides accuracy, it is also important to study the sustainability and predictability of the firm's income sources. The goal is to determine whether the income generators are clearly observable or whether they have been obscured by the numbers in the statement. The analyst should then tie these new findings back to the firmf s competitive position analysis.
An important factor to be considered is the firm's composition of returns or to determine how the company earns the money. According to English (2001), asking this question leads the analyst to study the three basic components of financial returns: the firm's operational, investment, and financial decision making:
Operational decisions drive the price and margin positioning of the company's products. Investment decisions involve the company's use of both current and capital assets. Finally, financial decisions determine the company's financial leverage and dividend policy, the third cornerstone of the return analysis process... It ought to be, when the analysis of returns is finished, that the results are consistent with the analyst's basic notions about the firm's competitive position. Competitive positioning should
Reproduced with permission of the copyright owner. Further reproduction prohibited without permission.

4be mirrored in return composition. If the numbers tell a different story than the competitive analysis, something is wrong, (p. 13)
Another important consideration in equity valuation is the firm's capacity for continued investment. The analyst studies the internal and external sources of cash to better understand the firm's investment capacity. The company's stage of development often determines its sources of financing. Start-ups or early-stage companies usually do not generate enough positive cash flow to finance their operations and therefore are often dependent on external financing sources. On the other hand, established companies can generate substantial cash flow to finance both the operation and the payment of dividends.
An important step in the process of equity valuation is the development of a financial model, which is a projection of the firm's income statement, balance sheet, and statement of cash flow. To develop the model, the analyst sets a series of base case assumptions by taking a position or opinion about the company's future prospects. The analyst opinion should be consistent with an understanding of the firm's strategy and competitive challenges, the company's historical performance, and the economic reality.
The discounted-cash-flow (DCF) technique is the most complete, rigorous, and commonly used technique for
Reproduced with permission of the copyright owner. Further reproduction prohibited without permission.

48financial valuation in general. However, the DCF model has a number of serious limitations when used to value equity. Among these limitations, the DCF model is not appropriate to perform comparative valuations, which are important to do when the analyst wants to compare the company with other firms in the industry. Another limitation of the DCF model, according to English (2001), is that the model is subject to the difficulties the capital asset pricing model (CAPM) itself may have. One of the biggest limitations of the DCF technique is that it relies heavily on the investment assumptions in free-cash flow. The technique is based on determining three main variables: the cash flows, the discount rate, and the terminal value. The problem with cash flow projection is to maintain consistency between the operational and the investment assumptions made.Operational assumptions are variables such as revenues, margins, and growth, while investment assumptions are mainly working capital and fixed investments. Another inherent problem with this technique is the determination of the discount rate, which is usually done by applying capital asset pricing model (CAPM). However, according to English (2001), not always the CAPM technique captures all the variables that might affect equity valuation.
Return on Equity
Reproduced with permission of the copyright owner. Further reproduction prohibited without permission.

49The ratio of net income to common equity measures the
return on common equity (ROE), or the rate of return on stockholder's investment. ROE is usually used to determine the composition of the company's returns and provides an indication of the firm value. ROE was used as one of the variables to measure firm value in this dissertation.
It is intuitively obvious that the higher a firm's ROE, the higher its stock price, other things held constant. Management can indeed influence the company's ROE, thus its stock price. Donaldson Brown, Dupont's chief financial officer, developed the now famous Du Pont equation several years ago (Brigham & Gapenski, 1997).Brown noted that ROE depends on three factors: (a) theprofit margin on sales, (b) the total assets turnover ratio, and (c) the use of debt or balance sheet leverage. Each component is in turn associated with a family of financial ratios. The profit margin on sales ratio family provides the mean to question the company's revenue and expense decisions. It consists of ratios such as gross margin on revenues, selling, general, and administrative (SGA) expense percentages, and net margin. The assets turnover ratio is concerned with the company's short-term and long-term investment decisions. Assets turnover ratios focus on the physical assets of the business. How efficiently the company uses its physical assets (e.g., equipment, material inventory, etc.) as well as how fast
Reproduced with permission of the copyright owner. Further reproduction prohibited without permission.
50the company collects cash (i.e., accounts receivables) have a strong impact on the company's returns. The use of debt or balance sheet leverage focuses on the firm's corporate financial management. Its family includes the debt/equity, interest and cash flow coverage ratios. The leverage ratio analysis allows the analyst to determine the composition of the company's capital structure as well as to estimate the ability of the company to service that capital structure.The coverage ratios such as interest and cash flow coverage ratios are used to determine the company's ability to service debt as well as its capacity for continued investment in the future (Brigham & Gapenski, 1997).
Approximate Tobin's Q
Probably due to the limitations and difficulties of the discounted cash flows technique, other methods are frequently used by financial analysts to value firms. Financial measures of firm value fit into two key categories, accounting-based measures and market-based measures. Accounting based measures of performance are historical and therefore experience a more backward looking focus. They are developed as a reporting mechanism and represent the impact of many factors and action in the past. They are the traditional foundation of corporate performance measures. Examples used in the literature include return on assets, earnings per share, and return on
Reproduced with permission of the copyright owner. Further reproduction prohibited without permission.

51equity. Market-based measures of firm performance, on the other hand, relate to the overall value placed on the firm by the market and may not have any relationship to asset valuations, current operations or even the firm's historical profitability. These valuations emphasize the expected future earnings of the firm and so are considered a forward-looking indicator that reflects current plans and strategies. Measures in this category include market to book ratio and Tobin's Q, the predominant approach (Kiel & Nicholson, 2003).
Tobin's Q is a ratio developed by James Tobin of Yale University, Nobel laureate in economics. Tobin hypothesized that the combined market value of all the companies on the stock market should be about equal to their replacement costs. Tobin's Q for a firm was defined by Lindenberg and Ross (1981) as the ratio of the market value of a firm to the replacement cost of its assets. It has been employed in the past to explain many diverse corporate phenomena such as cross-sectional differences in investment and diversification decisions, the relationship between managerial equity ownership and firm value, the relationship between managerial performance and tender offer gains, investment opportunities and tender offer responses, and financing, dividend, and compensation policies (Chung & Pruitt, 1994).
Reproduced with permission of the copyright owner. Further reproduction prohibited without permission.

52The procedures typically employed in the calculation
of Tobin''s Q values are complex and cumbersome. Tobin's Q is a function of the liquidating value of a firm's preferred stock, the price of the firm's common stock multiplied by the number of shares outstanding, the value of the firm's long-term debt adjusted for its age structure, the book value of the firm's current liabilities, the value of the firm's net short-term assets, the book value of the firm's total assets, the book value of the firm's net capital stock, and the firm's inflation- adjusted net capital stock. In addition to the complexity, the only available source of Q input data is the Manufacturing Sector Master File compiled at the National Bureau of Economic Research. Unfortunately, it only encompasses a time series up to 1987. To address these computational difficulties, Chung and Pruitt (1994) developed a simple formula for approximating Tobin's Q, which requires only basic financial and accounting information. The results of a series of regressions comparing the approximate Q values with those obtained via Lindenberg and Ross's (1981) model indicated that at least 96.6% of the variability of Tobin's Q is explained by approximate Tobin's Q.
Chung and Pruitt's (1994) alternative formula for approximating Tobin's Q is,
Reproduced with permission of the copyright owner. Further reproduction prohibited without permission.

53Approximate Tobin's Q (ATQ)= (MVE + PS + DEBT)/TA (1)
Where,MVE = Market value of common stock or market
capitalization. Product of a firm's share price and the number of common stock shares outstanding.
PS = Book value of preferred stockDEBT = Book value of long term debtTA = Book value of total assets
As stated above, all of these required inputs are readily obtainable from a firm's basic financial and accounting information. The numerator of the formula contains the market capitalization variable, which is a reflection of the overall value placed on the firm by the market. The theoretical foundation of this study is based on the assumption of strong market efficiency in the U.S. stock market, in which any positive or negative social behavior or action from the firm would be readily apparent to market participants and so reflected in its market capitalization (Fama, 1998).
Of course, the simplified procedures involved in the calculation of ATQ represent a compromise between precision and computational effort, but the researcher considered that using the approximation of Tobin's Q was adequate for the purpose of this dissertation.
Reproduced with permission of the copyright owner. Further reproduction prohibited without permission.

54
SummaryThis literature review focused on comparing and
contrasting different studies and points of view related to the most important aspects of the conceptual model to be examined in this research. Specifically, the literature review covered (a) description and analysis of the social research variables used in the study (i.e., business ethics, diversity, environmental regulation and ethics);(b) description and analysis of the financial variables representing firm value (i.e., return on equity and approximate Tobin's Q ratio); (c) definition and current research on the concept that ties all the social performance together, the corporate social responsibility construct; and (d) current research on socially responsible investing and its impact on financial performance.
Reproduced with permission of the copyright owner. Further reproduction prohibited without permission.

CHAPTER 3: METHODOLOGY The following section presents the research
methodology used in the study. It includes the following main elements: (a) description of the research design, (b)definition of the target population, (c) sampling, (d) instrumentation, (e) data collection procedures, and (f) data analysis.
Description of the Research Design The goal of this research was to determine whether,
along with other standard factors, there is a significant relationship between business ethical behavior, corporate social responsibility, and firm value in companies in the oil and gas industry. After considering several methodologies, the researcher determined that the most appropriate method for the study was a quantitative research using a non experimental, associational approach. Associational is "an approach to research where the independent variable is usually continuous" (Gliner & Morgan, 2000, p. 71). The approach can be used to study attribute independent variables in which the investigator does not use random assignment and does not have control over the independent variables.
The analysis used multiple regression as the general type of statistics making use of available data as input variables. The data to measure social behavior and actions
Reproduced with permission of the copyright owner. Further reproduction prohibited without permission.
56were searched from public documents, official records, and mass media dated from January 2000 through December 2003.The financial data were searched from Multex Fundamentals- ProVestor Plus Company Report (Multex.com Inc., 2004).
Target Population The target population for this study is the 27,682
companies belonging to the oil and gas extraction industry (Standard Industrial Classifications Index, SIC Code 13), commonly known as the oil and gas Industry. This industry is one of several subsectors of the energy industry. Companies in this segment are focused on oil or gas as an energy source, as opposed to other sources such as coal, hydroelectric, and nuclear reactors. They perform tasks such as exploration, evaluation, drilling, development, and maintenance of oil and gas fields. These companies extract the oil or gas from downhole reservoirs to commercialize it as a source of energy on a worldwide basis.
SamplingThe oil and gas extraction subsector of the energy
industry (SIC Code 13) has 27,682 companies registered, which constitutes the population for this research. To narrow the scope of the project to a more manageable number of firms, the researcher performed a two-stage sampling process. In the first stage, a purposive sample was used to
Reproduced with permission of the copyright owner. Further reproduction prohibited without permission.

57identify companies meeting the following two criteria: more than 1 0 0 employees and more than $ 1 0 million of revenues in the year 2003. These companies constitute the sampling frame of the study. The assumption is that the fewer number of relatively big companies have a much bigger overall social impact than the larger number of small companies.This assumption seems intuitively correct as decisions from a company with 1 , 0 0 0 employees likely have a bigger overall social impact than decisions from a company with only 2 0
employees, just by looking at the employees'' impact alone.To do the purposive sample, the researcher used
research and filtering tools available from the TD Waterhouse website (www.tdwaterhouse.com). Using these tools, companies from a universe of companies or a specific industry can be selected using multiple criteria, which include number of employees as well as total revenue.
The second stage in the sampling process was to use random sampling to select 55 companies chosen from the already preselected companies in the purposive sampling process. The sample size was slightly higher than 10% the size of the sampling frame. According to Singleton and Straits (1999), probability sampling is scientifically more acceptable than nonprobability sampling, and simple random sampling was chosen as the design for this study because it removes the possibility that investigator biases will affect the selection of cases (p. 141). The random sampling
Reproduced with permission of the copyright owner. Further reproduction prohibited without permission.
58was done by assigning consecutive numbers to the companies in the sampling frame (approximately 500 firms) in a spreadsheet, and then randomly choosing 55 of them by using the RAND function in Microsoft Excel, which returns an evenly distributed random number.
The researcher wishes to generalize all the findings from the study to the target population (the entire oil and gas industry), but in reality, the inferences should only be made about the population represented by the sampling frame (medium to large companies in the industry). However, if the assumption made holds true (expected bigger social impact from big companies than from small companies), the researcher was confident that the results from this study could be generalized to the entire population.
Instrumentation There are no internationally accepted corporate social
performance standards, and rigorous empirical research directed at socially responsible investment screening itself is nonexistent. Consequently, numerous categorization possibilities have been used in the past to measure the corporate social responsibility construct both by researchers and practitioners.
Stone (2001) conducted a study to formulate a new taxonomy that represents an empirically derived framework to help future research on developing internationally
Reproduced with permission of the copyright owner. Further reproduction prohibited without permission.

59accepted corporate social performance reporting standards. The study population consisted of socially responsiblemutual funds with assets invested according to at least one formal social screen. The primary units of observation werethe respective fund managers. The sampling frame wascomprised of 144 funds referenced as being sociallyresponsible in the Social Investment Forum's 1997 Report.The results from the study showed that although the social objectives of the mutual funds differ, there appears to be a consensus on the primary characteristics of social performance desired in portfolio companies. The resulting categories of corporate social performance information from this study included abortion, affordable housing, alcohol/tobacco/gaming, animal rights, charitable giving, community, contraception, defense/weapons/firearms, environment, ethical practices, human rights/equality, labor issues, lending as a primary business, nuclear power, pornography, and product or services.
Rockness and Williams (1988) conducted a descriptive study of the socially responsible mutual funds existing in the United States and the procedures used by fund managers to evaluate firms with social criteria. They also described variation in sources of social information used.
KLD Research & Analytics, Inc. ("KLD") is a social research firm that created and maintains the Domini 400 Social Index. The Domini Index is the established benchmark
Reproduced with permission of the copyright owner. Further reproduction prohibited without permission.

for socially screened portfolio performance. The index is market capitalization-weighted common stock index modeled on the Standard & Poor's 500 (S&P 500). It monitors the financial performance of 400 corporations that pass multiple, broad-based social screens. To develop the index KLD applies a set of exclusionary screens, eliminating companies involved in alcohol, tobacco, gambling, military contracting, nuclear power, adult entertainment and firearms. Next, KLD applies qualitative screens in the areas of community, diversity, employee relations, environment, and product safety (KLD's Domini 400 Social Index, 2003) .
The Calvert Social Index is another broad-based, rigorously constructed benchmark for measuring the performance of large, U.S.-based socially responsible companies (Calvert Online, 2003). The firm performs a social analysis of every company in its portfolio drawing upon information from a wide variety of sources, including public records, government regulatory agencies, and advocacy organizations. Calvert's researchers analyze the company's performance in six broad areas: environment, workplace, product safety and impact, international operations and human rights, community relations, and indigenous people's rights.
Citizens Funds (2003) takes a similar approach by screening every security in their portfolios using
Reproduced with permission of the copyright owner. Further reproduction prohibited without permission.
61proprietary research, which revolves around a comprehensive, integrated analysis of all the fundamental and social factors that they believe affect a company's stock performance over time. Citizens Funds avoids companies that produce alcohol or tobacco, have material involvement in the production of weapons, produce nuclear power, do not engage in effective management of their use of the environment, do not promote diversity and equal opportunity, have gambling as their main line of business, or engage in unnecessary animal testing. The firm's researchers also look for companies they believe that have good and useful products, treat their employees fairly, and are involved in their communities.
A company's socially responsible behavior is ultimately demonstrated by the way it exhibits high ethical standards, supports community service activities and encourages employees to participate in those activities, accepts responsibility for overcoming environmental pollution, and relates to regulatory bodies. Companies also have an ethical duty with the owners to generate reasonable returns on their investments.
To accomplish the objective of this study, the researcher created a measurement based on a series of indexes to assess different categories of social responsibility relevant to the oil and gas industry.Content validity started with the definition of the
Reproduced with permission of the copyright owner. Further reproduction prohibited without permission.

62concepts that the investigator was attempting to measure as follows:
1. Ethical Standards Index (ESI): Index to measure if the company has available a code of business conduct and seems to operate within a framework that consistently hold on to that code. A higher value of this index will reflect a higher positive ethical behavior or actions of the sample company and vice versa.
2. Community Service Index (CSI): Index to measure if the company makes investments of money and other resources to aid the communities in which it operates. A higher value of this index will reflect a higher positive community related behavior or actions of the sample company and vice versa.
3. Diversity Index (DI): Index to measure if the company advocates and builds a workforce that represents society at large and provides equal opportunity employment.A higher value of this index will reflect a higher positive diversity related behavior or actions of the sample company and vice versa.
4. Environmental Index (El): Index to measure if the company makes every effort to do business in a manner that minimizes the negative impact on the environment. A higher value of this index will reflect a higher positive environment related behavior or actions of the sample company and vice versa.
Reproduced with permission of the copyright owner. Further reproduction prohibited without permission.
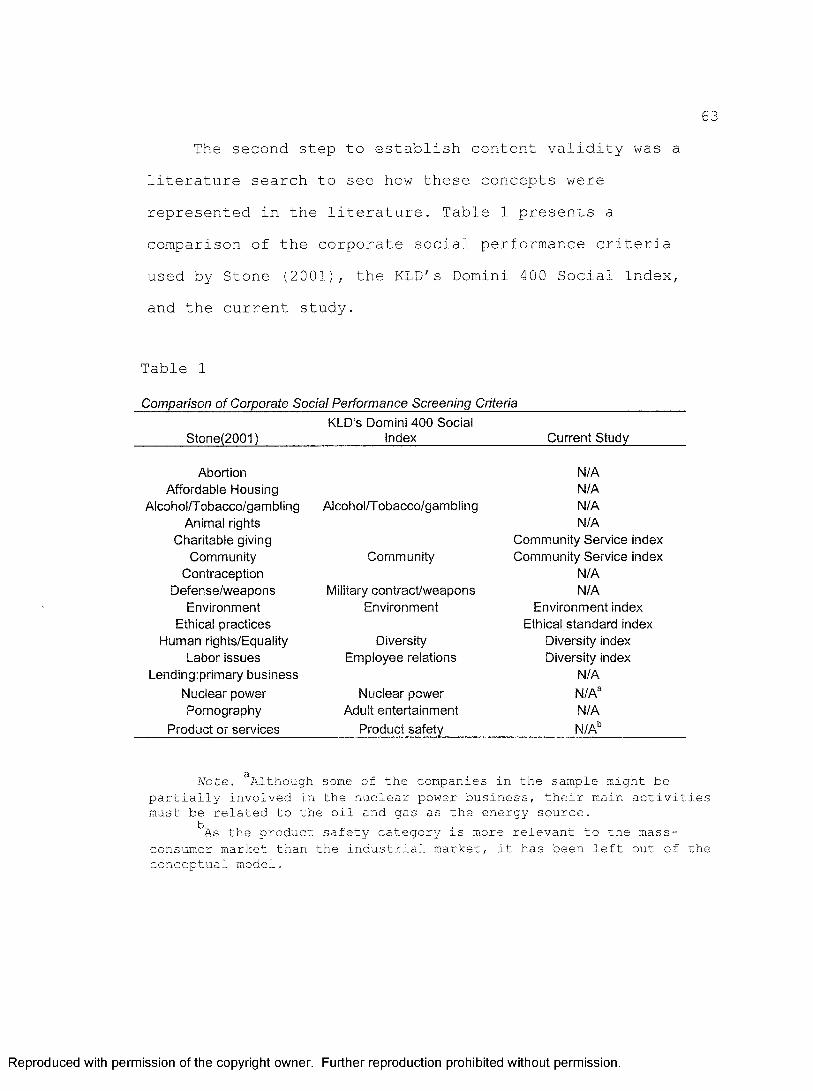
63The second step to establish content validity was a
literature search to see how these concepts were represented in the literature. Table 1 presents a comparison of the corporate social performance criteria used by Stone (2001), the KLD's Domini 400 Social Index, and the current study.
Table 1
Comparison o f Corporate Social Performance Screening Criteria
Stone(2Q01)KLD's Domini 400 Social
Index Current Study
Abortion N/AAffordable Housing N/A
Alcohol/Tobacco/gambling Alcohol/T obacco/gambling N/AAnimal rights N/A
Charitable giving Community Service indexCommunity Community Community Service index
Contraception N/ADefense/weapons Military contract/weapons N/A
Environment Environment Environment indexEthical practices Ethical standard index
Human rights/Equality Diversity Diversity indexLabor issues Employee relations Diversity index
Lendingiprimary business N/ANuclear power Nuclear power N/AaPornography Adult entertainment N/A
Product or services Product safety N/Ab
Note. aAlthough some of the companies in the sample might be partially involved in the nuclear power business, their main activities must be related to the oil and gas as the energy source.
k&s the product safety category is more relevant to the mass- consumer market than the industrial market, it has been left out of the conceptual model.
Reproduced with permission of the copyright owner. Further reproduction prohibited without permission.

64The table confirms that this study indeed covered all
the social performance criteria that are applicable to the oil and gas industry.
The next step was to generate a series of questions to measure these concepts consistently and reliably. Appendix B presents a list of the screening criteria used to evaluate the company's socially responsible behavior for each specific social index. The list of questions was adapted from Stone's (2001) empirically derived taxonomy and they are used to enhance the reliability, reproducibility, and overall usefulness of the results from this study.
Data Collection ProceduresThe researcher searched each sampled company's
available data from public documents, including the company's website, official records, and mass media dated from January 2000 through December 2003, and performed a social analysis on the data using content analysis techniques. The basic idea was to reduce the total content of a communication event to a set of categories that represent some characteristic of research interest specifically related to ethical behavior or social responsibility. Each social-impact event was scored and stored in a spreadsheet in the appropriate social index
Reproduced with permission of the copyright owner. Further reproduction prohibited without permission.

65field. The score reflects the social behavior or actions of the sample company and was done as follows:
+4 = Tangible positive contribution+3 = Relatively small positive contribution+2 = No tangible event+1 = Relatively small breach or problem 0 = Tangible or substantial breach or problem Adding and averaging all the scores from all the
social events in the 4-year period for a specific index provides the overall score for the social index for a particular company.
Data Analysis Once all the data were collected and analyzed for
social content and the appropriate scores were included ina spreadsheet for each company, the researcher developed acomprehensive spreadsheet containing all the variables for all the sampled companies. These data were used as the input for two multiple regression models-one for each dependent variable-as described below.
The two equations in the model were,
ROE = a0 + ai BV + a2 MS + a3 CR + a4 SP (2)ATQ = a0' + ai' BV + a2' MS + a3' CR + a4' SP (3)
Where
Reproduced with permission of the copyright owner. Further reproduction prohibited without permission.

66ROE = Return on EquityATQ = Approximate Tobin's Q ratioBV = Book ValueMS = Market ShareCR = Cash Reserves (industry ratio)SP = Social Performance
The social performance variable is in turn calculated by the following equation:
SP = b0 + b x El + b2 DI + b3 ESI + b4 CSI (4)
WhereEl = Environmental IndexDI = Diversity IndexESI = Ethical Standard IndexCSI = Community Service Index
Replacing equation (4) in equation (2)
ROE = a0 + ai BV + a2 MS + a3 CR + a4 (b0 + bx El + b2 DI + b3 ESI + b4 CSI) (5)
Equation (5) can be written as follows
Reproduced with permission of the copyright owner. Further reproduction prohibited without permission.

67
ROE = Ho + BV + 3.2 MS + a.3 CR + a4 El + 3 5 DI + 3g ESI + a7 CSI (6 )
Equation (6 ) contains a total of seven variables and is the final regression equation for the case of ROE as dependent variable.
The same mathematics is applied to develop the following equation for the case of Approximate Tobin's Q as dependent variable,
ATQ = a0' + ai' BV + a2' MS + a3' CR + a4' El + a5' DI + a6' ESI + a7' CSI (7)
A statistical hypothesis F test for the existence of a linear relationship between ROE and any of the independent variables is
Ho: a7 = a2 = a3 = a4 = as = ag = a7 = 0
Hi: Not all the a± (i = 1, 2, 3, 4, 5, 6 , and 7) arezero
The researcher established a level of significance a = 1 0 % which means that the null hypothesis was rejected if the calculated p value from the statistical test was less than a (or less than 0.1). If the null hypothesis were true, there would be no linear relationship between the
Reproduced with permission of the copyright owner. Further reproduction prohibited without permission.

68firm value and any of the independent variables in the proposed regression equation. If, on the other hand, the null hypothesis were rejected, there would be statistical evidence to conclude that there was a regression relationship between firm value and at least one of the independent variables in the model. If such a regression relationship existed, the investigator then would conduct separate tests to determine which of the coefficients (ai, azr 3 3 ,..., a:' , a2 ', a3',...), were different from zero. There would be, therefore, seven t tests necessary for determining which variables help explain the variation in the values of the dependent variable ROE, and seven further t tests for the case of the dependent variable ATQ. The variables having no explanatory power would be eliminated from the regression model.
Reproduced with permission of the copyright owner. Further reproduction prohibited without permission.

CHAPTER 4: RESULTS Introduction
The findings of this study are presented in this chapter. Descriptive statistics indicate data about the sample companies. The results were measured and analyzed using inferential statistics, mainly multiple regression and t tests. Further analysis is done in relation to the research questions.
Each sampled company was analyzed using available data from the company's website, public records, and mass media dated from January 2000 to December 2003. The source of financial data for the study was ProVestor Plus Company Report from Multex Fundamentals (2004). The sources of social event information were well-known databases such as Academic Search Premier, Business Source Premier, as well as several databases provided by LexisNexis, a leading provider of information to corporate, legal, government, and academic markets. The company's annual reports and SEC reports such as 10-K and 8 -K reports were also used as sources of socially related events. A detailed description of the methodology used to search, screen, validate, and score the relevant information for the study is presented in Appendix A. The screening criteria used in the research to score the social events are shown in Appendix B.
Reproduced with permission of the copyright owner. Further reproduction prohibited without permission.

70The sample companies in the study belong to the oil
and gas extraction sector of the energy industry (SIC Code 13). This sector is commonly known as the "oil and gas industry." The industry comprises three main sectors: (a)Oil and Gas Exploration & Production, (b) Oil and Gas Equipment & Services, and (c) Oil and Gas Drilling.
The oil and gas exploration & production ("E&P") companies are engaged in the exploration, production, refinement, and distribution of oil and gas products. The sample contains 33 of these companies (or 60% of the entire sample). The oil and gas equipment & services ("Equip. & Svcs") companies are manufacturers of equipment and providers of services to the oil and gas industry, including companies providing seismic data collection services. The sample contains 18 (32.7%) of these companies. The oil and gas drilling companies are manufacturers of oil rigs and drilling equipment and providers of drilling services. The sample contains 4 (7.3%) drilling companies. Appendix D lists all the companies in the sample.
The results chapter is divided into four sections. The first focuses on descriptive and inferential statistical analysis using all the companies in the sample ("Oil and Gas Industry"). The second section presents statistical analysis comparing the population means of the two main sectors in the industry (E&P and Equip. & Svcs.). The third
Reproduced with permission of the copyright owner. Further reproduction prohibited without permission.

71section presents descriptive and inferential statistical analysis for the companies in the exploration & production sector. The fourth section presents descriptive and inferential statistical analysis for the companies in the equipment & services sector.
Oil and Gas Industry Analysis The oil and gas Industry sample contains a total of 55
companies. Table 2 presents a summary of the basic statistics for these companies.
Table 2
Descriptive Statistics for all Sample Firms-“Oil And Gas Industry” (£>=55)
MeanStandardDeviation
Market Cap. (million US$) Dec/31/03 19,164 45,964Revenues-2003 (million US$) 19,125 50,511Net Margin-2003 (%) 13.2 9.9BV Total Assets-2003 (million US$) 45,736 168,119Cash Reserves-2003 (million US$) 727 1,654El Index 2.120 0.9DI Index 2.219 0.8ESI Index 2.039 0.9CSI Index 2.173 1.0ROA (%) 2003 7.3 5.2ROE (%) 2003 17.10 12.0Approx. Tobin's Q 1.306 0.6
The average market capitalization of the sample is more than $19 billion, indicating a sample comprised of large companies. The standard deviation, however, is very high, indicating a big swing in market capitalization. The
Reproduced with permission of the copyright owner. Further reproduction prohibited without permission.

72company with the largest market capitalization in the sample is ExxonMobil with more than $277 billion followed by BP-Amoco with more than $177 billion. The company with the smallest market cap in the sample is Sunoco Logistics Partners, with $912 million, or only 0.3% of ExxonMobil's market cap.
The industry is characterized by a business cycle of around 3-4 years. The year 2003 was a good year in the industry, as reflected by the healthy profitability average of 13.2%. Average return on equity was a respectable 17.1%.
The regression equation for the case of return on equity as dependent variable is
ROE = ao + a BV + 3.2 MS + 3 3 CR + 3 4 El + 3 5 DI + a§ ESI + a7 CSI
WhereROE = Return on Equity BV = Book Value MS = Market ShareCR = Cash Reserves (industry ratio)El = Environmental IndexDI = Diversity IndexESI = Ethical Standard IndexCSI = Community Service Index
Reproduced with permission of the copyright owner. Further reproduction prohibited without permission.
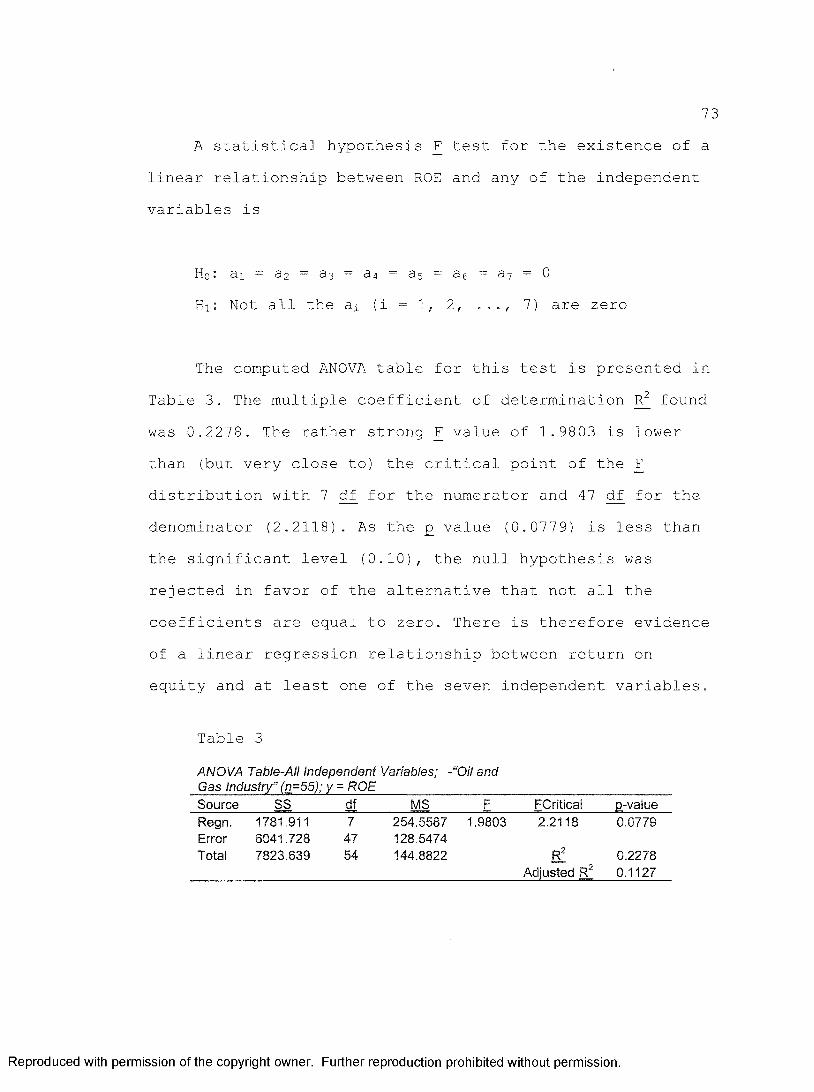
73A statistical hypothesis F test for the existence of a
linear relationship between ROE and any of the independent variables is
Ho: ax = a2 = a3 = a4 = as = ae = a7 = 0Hi: Not all the ax (i = 1, 2, ..., 7) are zero
The computed ANOVA table for this test is presented in Table 3. The multiple coefficient of determination found was 0.2278. The rather strong F value of 1.9803 is lower than (but very close to) the critical point of the F distribution with 7 df for the numerator and 47 df for the denominator (2.2118). As the £ value (0.0779) is less than the significant level (0 .1 0 ), the null hypothesis was rejected in favor of the alternative that not all the coefficients are equal to zero. There is therefore evidence of a linear regression relationship between return on equity and at least one of the seven independent variables.
Table 3
ANOVA Table-All Independent Variables; - “Oil and Gas Industry” (n=55); y = ROE_______________________Source SS df MS F FCritical p-vaiueRegn. 1781.911 7 254.5587 1.9803 2.2118 0.0779Error 6041.728 47 128.5474Total 7823.639 54 144.8822 R2 0.2278
Adjusted R^ 0.1127
Reproduced with permission of the copyright owner. Further reproduction prohibited without permission.

74The regression equation for the case of Approximate
Tobin's Q (ATQ) as dependent variable is
ATQ = a0' + ai' BV + a2' MS + a3' CR + a4' El + a5' DI + a6' ESI + a7' CSI
WhereATQ = Approximate Tobin's Q ratio BV = Book Value MS = Market ShareCR = Cash Reserves (industry ratio)El = Environmental IndexDI = Diversity IndexESI = Ethical Standard IndexCSI = Community Service Index
A statistical hypothesis F test for the existence of a linear relationship between ATQ and any of the independent variables is
Ho: a7' = a2' = a3' = a4' = as' = — a7' = 0Hi: Not all the a2' (i = 1, 2, 3, 4, 5, 6, and 7) are
zero
The computed ANOVA table for this test is presented inTable 4. The multiple coefficient of determination R is
Reproduced with permission of the copyright owner. Further reproduction prohibited without permission.

equal to 0.3030, which means that 30.3% of the variation in ATQ is explained by the combination of the independent variables in the multiple regression model. The computed F ratio (2.919) is higher than the critical point of the F distribution (2.2118) with 7 df for the numerator and 47 df for the denominator. As the computed F value is in the rejection region of the distribution and the p value (0.0128) is less than the significance level (0.10), the null hypothesis is rejected in favor of the alternative that not all the coefficients are equal to zero. There is therefore evidence of a linear regression relationship between Approximate Tobin's Q and at least one of the seven independent variables.
Table 4
ANOVA Table-All Independent Variables; - “Oil and Gas Industry” (n=55); y = ATQ_______Source SS df MS F FCritical B-valueRegn. 4.489668 7 0.6414 2.9190 2.2118 0.0128Error 10.32722 47 0.2197Total 14.81689 54 0.2744 b !
AdjustedR2
0.3030
0.1992
Table 5 below presents a correlation matrix of all the estimated pairwise correlations among the independent variables Xj.. The correlation matrix shows that some of the explanatory variables may have a significant correlation with one another, causing the problem of multicollinearity
Reproduced with permission of the copyright owner. Further reproduction prohibited without permission.

76when they are included together in the final regression equations using ROE or ATQ as dependent variables. The solution to this problem was to drop collinear variables from the regression equation. A decision on which of the two independent variables to drop was made by comparing the R2 and the adjusted of different regressions with and without one of the variables. The objective was to maintain a high R2 and therefore drop a variable if R2 was not reduced much when the variable was removed from the equation. Of course, if the adjusted R increased when the variable was deleted, the variable was dropped from the equation. The goal was to develop the most parsimonious model with the highest relative predictive power, while addressing the problem of multicollinearity.
Table 5
CorrelationMatrix-
BV MS CR El DI ESI CSIBV 1MS -0.0869 1CR -0.0101 0.3886 1El -0.2854 -0.1628 -0.3727 1Di 0.0166 -0.0611 -0.3398 0.3318 1
ESI 0.0215 -0.1141 -0.3010 0.7598 0.5689 1CSI 0.4051 0.1763 0.2424 -0.2692 -0.1522 0.1367 1
To meet this goal, the researcher used a stepwise regression method using alternative forward and backward steps. First, the regressor that most improved the fit was
Reproduced with permission of the copyright owner. Further reproduction prohibited without permission.

77included in the model, given that the term was significant at a pre specified level set to 0.25, and then the least significant term was removed satisfying a probability to leave the model of less than 0.10. The researcher continued removing terms until the remaining terms were significant and then changed to the forward direction including additional regressors.
The results of the stepwise regression for the case of ROE as dependent variable are shown in Table 6. The multiple regression equation is ROE = 18.4040 - 102.5046*MS + 0.0025*CR.
Table 6
Multiple Regression Results-MS, CR vs. ROE-“Oil and Gas Industry” (n=55)
Intercept MS CRb 18.4040 -102.5046 0.0025s(b) 1.8008 33.7742 0.0010t 10.2199 -3.0350 2.4841g-value 0.0000 0.0038 0.0162
ANOVA Table
Source SS df MS F FCriticalQz
valueRegn. 1388.1239 2 694.0620 5.6081 3.1751 0.0062Error 6435.5154 52 123.7599Total 7823.6393 54 144.8822 Rf
AdjustedR2
0.1774
0.1458
The results showed that market share has a significant (albeit negative) relationship with ROE. Cash reserves showed a positive significant relationship with firm value.
Reproduced with permission of the copyright owner. Further reproduction prohibited without permission.

78Of note, none of the social indexes showed a significant relationship in this model. The computed F ratio (5.6081) is higher than the critical point of the F distribution (3.1751). The p value found was 0.0062 (much lower than the significance level) but the multiple coefficient of determination was equal to 0.1774, which means that only17.74% of the variation in ROE is explained by thecombination of market share and cash reserves as the independent variables in the multiple regression model.
The results of the stepwise regression for the case ofATQ as dependent variable appear in Table 7.
Table 7
Multiple Regression-Selected Variables; y = ATQ; “Oil and Gas Industry” (n=55)________
Intercept BV DIb 1.3625 -0.0204 0.1552s(b) 0.2151 0.0058 0.0800t 6.3347 -3.5037 1.9407j>vaiue 0.0000 0.0010 0.0577
ANOVA TableSource SS df MS F FCritical p-valueRegn. 3.4564 2 1.7282 7.9106 3.1751 0.0010Error 11.3605 52 0.2185Total 14.8169 54 0.2744 r !
AdjustedR2
0.2333
0.2038
The computed F ratio (7.9106) is higher than the critical point of the F distribution (3.1751). The p value found was 0.0010. The multiple coefficient of determination
Reproduced with permission of the copyright owner. Further reproduction prohibited without permission.

79is a relatively low value of 0.2333, and the multiple
regression equation is ATQ = 1.3625 - 0.0204*BV +0 .1552*DI.
The results indicate a positive significant relationship between diversity and firm value, as measured by approximate Tobin's Q ratio. The results also show a significant (although negative) relationship between book value and firm value. A plausible explanation for this result might be that companies with considerable book values or asset bases find it more difficult to produce relatively high stock prices (a factor in ATQ) compared to smaller companies. Another possible explanation for this result might be the relatively low sample size.
Test of Differences of Means: Industry SectorsBecause differences in firm value and social indexes
may be related to company size and specific sectors in the industry, the researcher created two subsets of the original sample, the E&P companies and the Equip. & Svcs. companies.
Table 8 presents tests of differences in means for several variables between E&P and Equip. & Svcs. firms. On examination of this table, it is readily apparent that significant differences exist in the two sectors for several variables, confirming the researchers' conjecture
Reproduced with permission of the copyright owner. Further reproduction prohibited without permission.

80that it is worthwhile to treat the two sectors separately in the study.
Table 8
Test o f Difference o f Means for E&P and Equip. & Svcs.
Variable E&PEquip. &
Svcst
statistics
Statistical significance (a = 10%)
Market Cap. (million US$) 28,123 6,011 1.6117 Yes(57,589) (8,728)
Revenues-2003 (million US$) 29,865 3,383 1.7666 Yes(63,219) (4,547)
Total Assets (million US$) 73,438 4,411 1.8538 Yes(213,776) (5,463)
Cash Reserves (million US$) 1,041 261 1.5772 Yes(2,058) (481)
Net Margin (%) 17.1 8.0 3.4525 Yes(10.0) (6.6)
Return on Equity (%) 20.99 13.26 1.8622 Yes(6.27) (16.98)
Approximate Tobin's Q 1.14 1.73 -4.4415 Yes(0.44) (0.50)
Environmental Index 1.85 2.57 -2.8692 Yes(0.98) (0.57)
Diversity Index 2.17 2.29 -0.5062 No(0.83) (0.75)
Ethical Standard Index 2.11 1.87 0.8809 No0.85 1.06
Community Service Index 2.49 1.72 2.8627 Yes(0.95) (0.90)
Note. Standard Error in Parentheses.
E&P firms are significantly larger than Equip. & Svcs. firms (average of $28.1 billion in market capitalization versus $6.0 billion). This fact is confirmed by other financial variables (average of $29.8 billion in revenues
Reproduced with permission of the copyright owner. Further reproduction prohibited without permission.

81versus $3.3 billion; $73.4 billion in total assets versus $4.4 billion; and $1.0 billion in cash reserves versus $261 million). Profitability was also higher for the E&P firms in 2003 (17.1% in net margin versus 8.0%).
Regarding the variables chosen to measure firm value, E&P firms' ROE is significantly higher than Equip. & Svcs. firms' ROE (20.9% versus 13.2%). However, Approximate Tobin's Q is significantly higher for the case of Equip. & Svcs. firms (1.65 versus 1.14). This is an important finding as it reflects that the market is somehow penalizing the stock price of E&P companies, even though they showed excellent returns in 2003. This fact also shows that there seems to be an increase in expectations for improved financial performance in the future for the Equip.& Svcs. group as reflected in their stock prices.
Environmental performance, as measured by the index, is significantly lower for the case of E&P companies (1.85 versus 2.57). This result is somehow expected as E&P companies are regularly exposed to higher environmental risks than the Equip. & Svcs. companies. Community service performance, as measured by the index, is significantly higher for the E&P companies, indicating a higher commitment to community involvement, donations, and other aspects of community services. No significant differences were found for the cases of diversity and ethical standards indexes between the two sectors.
Reproduced with permission of the copyright owner. Further reproduction prohibited without permission.

82The following sections in this paper describe
statistical data analysis performed to establish relationship between social performance and firm value for the two sectors independently.
Exploration & Production Sector Analysis Table 9 shows basic statistics for the E&P companies
in the sample (n=33). The regression equations for the cases of Return on Equity and Approximate Tobin's Q as dependent variable are the same as in the case of all the sample companies in this study.
Table 9
Descriptive Statistics-Oil & Gas Exploration & Production Sector; n=33
Average Standard DeviationMarket Cap. (million US$) Dec/31/03 28,123 57,589Revenues-2003 (millions) 29,865 63,219Net Margin-2003 (%) 17.1 10.0BV Total Assets-2003 (million US$) 73,438 213,776Cash Reserves-2003 (million US$) 1,041 2,058El Index 1.85 0.98DI Index 2.17 0.83ESI Index 2.11 0.85CSI Index 2.49 0.95ROA (%) 2003 8.8 3.4ROE (%) 2003 21.0 6.3Approx. Tobin's Q 1.14 0.44
The multiple regression results and the computed ANOVA table to test the statistical hypothesis F test for the
Reproduced with permission of the copyright owner. Further reproduction prohibited without permission.

83existence of a linear relationship between ROE and any of the independent variables are presented in Table 10.
Table 10
Multiple Regression Results-AII Independent Variables; y=ROE-E&P companies; n=33Intercept BV MS CR El Di ESI CSI
b 15.8017 -0.2351 -59.5689 0.0014 -0.7142 -0.8886 5.1300 0.8733sib) 4.5700 0.0862 40.9195 0.0007 2.4893 1.6834 4.5086 1.4280t 3.4577 -2.7259 -1.4558 2.0000 -0.2869 -0.5278 1.1378 0.6116Bzvalue 0.0020 0.0115 0.1579 0.0565 0.7765 0.6023 0.2660 0.5463
ANOVA TableSource SS df MS F FCritical p-valueRegn. 574.3738 7 82.0534 2.9942 2.4047 0.0200Error 685.1014 25 27.4041Total 1259.4752 32 39.3586 Rf
AdjustedR2
0.4560
0.3037
The multiple coefficient of determination R is a noteworthy 0.456, which means that 45.6% of the variation in ROE is explained by the combination of all the independent variables in the multiple regression model. As the p value (0.020) is less than a, the null hypothesis is rejected in favor of the alternative that not all the coefficients are equal to zero. There is therefore evidence of a linear regression relationship between return on equity and at least one of the seven independent variables.
The multiple regression results and the computed ANOVA table to test the statistical hypothesis F test for the
Reproduced with permission of the copyright owner. Further reproduction prohibited without permission.

84existence of a linear relationship between ATQ and any of the independent variables is presented in Table 11.
Table 11
Multiple Regression Results-AII Independent Variables; y=ATQ-E&P; n=33Intercept BV MS CR El Dl ESI CSI
B 0.7137 0.0125 1.8657 0.0001 0.0881 0.1736 0.1145 0.1371s(b) 0.3696 0.0070 3.3096 0.0001 0.2013 0.1362 0.3647 0.1155
T 1.9309 1.7956 0.5637 1.4598 0.4378 1.2753 0.3141 1.1871Szvalue 0.0649 0.0847 0.5780 0.1568 0.6653 0.2139 0.7560 0.2464
ANOVA Table
Source SS df MS F FCriticalBz
valueRegn. 1.592 7 0.227 1.268 2.405 0.305Error 4.482 25 0.179Total 6.073 32 0.190 e !
AdjustedR2
0.262
0.055
The multiple coefficient of determination Ft) is equal to 0.262, but the adjusted Ft) is very low (0.055). As the computed F ratio (1.268) is lower than the critical point of the F distribution (2.405) and the p value (0.305) is greater than the significance level, the null hypothesis cannot be rejected, thus there is no significant evidence of a linear regression relationship between approximate Tobin'' Q and at least one of the seven independent variables in the exploration and production sample. No further analysis is needed for the case of this dependent variable (ATQ).
Reproduced with permission of the copyright owner. Further reproduction prohibited without permission.

85The next step in the process was to establish which
variables to include in the regression model for the case of ROE using the same stepwise regression methodology described in the previous section of this paper. The multiple regression results and ANOVA table are presented in Table 12.
Table 12
Multiple Regression-Selected Independent Variables; y=ROE-E&P; n=33
Intercept BV MS CR ESIb 16.403 -0.195 -55.309 0.002 3.813§ M 4.026 0.075 37.906 0.001 1.606t 4.074 -2.616 -1.459 2.403 2.374j>value 0.000 0.014 0.156 0.023 0.025
ANOVA TableSource SS df MS F FCritical p-valueRegn. 531.826 4 132.957 5.116 2.714 0.003Error 727.649 28 25.987Total 1259.475 32 39.359 b!
AdjustedR2
0.422
0.340
The computed F ratio (5.116) is higher than the critical point of the F distribution (2.714). The p value found was 0.003. The multiple coefficient of determination R2 is relatively low (0.422) because not all of the dependent variable's variations are explained by the only four explanatory variables included in the model. Other significant variables are not explored in this research.The F value, though, confirms that the model is fit (all of
Reproduced with permission of the copyright owner. Further reproduction prohibited without permission.

86the included variables are justified to have significant contribution to the dependent variable) and their coefficients are not (at least simultaneously) equal to zero.
The multiple regression equation is ROE = 16.403 -0.195*BV - 55.309*MS + 0.002*CR + 3.813*ESI. The book value and the market share regressors showed negative statistically significant relationships with ROE. A plausible explanation for this result might be that larger companies, by asset size, find it difficult to produce a strong percentage return (ROA) on those assets, as compared to smaller companies.
Cash reserves and ethical performance index showed a positive significant relationship. These results provide strong evidence of the association between ethical performance and firm value, as measured by Return on Equity, in companies in the E&P sector.
Equipment & Services Sector AnalysisTable 13 presents basic statistics for Equipment and
Services companies (n=18). The companies in the sample are relatively large companies, as shown by the average market capitalization of more than $6 billion and revenues of more than $3 billion in 2003. Although the mean net margin (7.97%), return on assets (5.76%), and return on equity (13.26%) were lower than in the case of the E&P companies,
Reproduced with permission of the copyright owner. Further reproduction prohibited without permission.

still these are respectable numbers typically associated with a peak in the business cycle of the industry.
Table 13
Descriptive Statistics-Oil & Gas Equipment & Services Sector; n=18
MeanStandardDeviation
Market Cap. (million US$) Dec/31/03 6,011 8,728Revenues-2003 (millions) 3,383 4,547Net Margin-2003 (%) 7.97 6.61BV Total Assets-2003 (million US$) 3,940 5,312Cash Reserves-2003 (million US$) 261 481El Index 2.57 0.57Dl Index 2.29 0.75ESI Index 2.19 0.48CSI Index 1.72 0.90ROA (%) 2003 5.76 6.97ROE (%) 2003 13.26 16.98Approx. Tobin's Q 1.733 0.50
The multiple regression results and the computed ANOVA table to test the statistical hypothesis F test for the existence of a linear relationship between ROE and any of the independent variables is presented in Table 14.
The multiple coefficient of determination is equal to 0.2015, but the adjusted Rj) is equal to -0.357. As the p value (0.9056) is greater than the significance level (0.10), the null hypothesis cannot be rejected, thus there is no significant evidence of a linear regression relationship between return on equity and at least one of the seven independent variables in the equipment and
Reproduced with permission of the copyright owner. Further reproduction prohibited without permission.

services sector. No further analysis is needed for the case of this dependent variable (ROE).
Table 14T
Multiple Regression -All Independent Variables; y=ROE-Equip & Svcs ; n=18
h Intercept BV MS CR El Dl ESI CSIB 32.033 -0.097 -17.510 -0.001 6.094 10.046 -28.061 3.615
«3(b) 31.206 0.938 181.891 0.016 13.890 10.318 21.697 9.188T 1.026 -0.104 -0.096 -0.081 0.439 0.974 -1.293 0.393
value 0.329 0.919 0.925 0.937 0.670 0.353 0.225 0.702hANOVA Table
Source ss df MS F FCritical 2-valueRegn. 988.0457 7 141.1494 0.3605 3.1355 0.9056Error 3914.9571 10 391.4957Total 4903.0028 17 288.4119 r! 0.2015
------------X-
AdjustedR2 -0.3574
The multiple regression results and the computed ANOVA table to test the statistical hypothesis F test for the existence of a linear relationship between ATQ and any of the independent variables is presented in Table 15. The multiple coefficient of determination is equal to 0.6527. As the p value is less than a, the null hypothesis is rejected in favor of the alternative that not all the coefficients are equal to zero. There is therefore evidence of a linear regression relationship between approximate Tobin's Q and at least one of the seven independent variables for the case of equipment and services companies.
Reproduced with permission of the copyright owner. Further reproduction prohibited without permission.

89Table 15
Multiple Regression Results-AII Independent Variables; y=ATQ-Equip. & S vcs.; n=18Intercept BV MS CR El Dl ESI CSI
B 0.9437 -0.0163 -4.6513 0.0004 0.0186 0.6688 -0.5064 0.3332S(b) 0.5591 0.0168 3.2590 0.0003 0.2489 0.1849 0.3888 0.1646T 1.6877 -0.9690 -1.4272 1.4914 0.0748 3.6179 -1.3027 2.0239fiivalue 0.1224 0.3554 0.1840 0.1667 0.9418 0.0047 0.2219 0.0705
ANOVA Table
Source SS df MS F FCriticalQz
valueRegn. 2.3622 7 0.3375 2.6850 3.1355 0.0763Error 1.2568 10 0.1257Total 3.6191 17 0.2129 b !
AdjustedR2
0.6527
0.4096
The next step in the process was to establish which variables to include in the regression model for the case of ATQ using the same stepwise regression methodology described in the previous sections of this paper. The multiple regression results and ANOVA table are presented in Table 16. The computed F ratio (4.4278) is higher than the critical point of the F distribution (3.6823).The p value found was 0.0308. The multiple regression equation is ATQ = 1.2878 - 0.0276*BV + 0.3498*DI. The multiple coefficient of determination Ft) is relatively low (0.3712) due to the fact that not all of the dependent variable's variations are explained by the only two explanatory variables included in the model.
Reproduced with permission of the copyright owner. Further reproduction prohibited without permission.
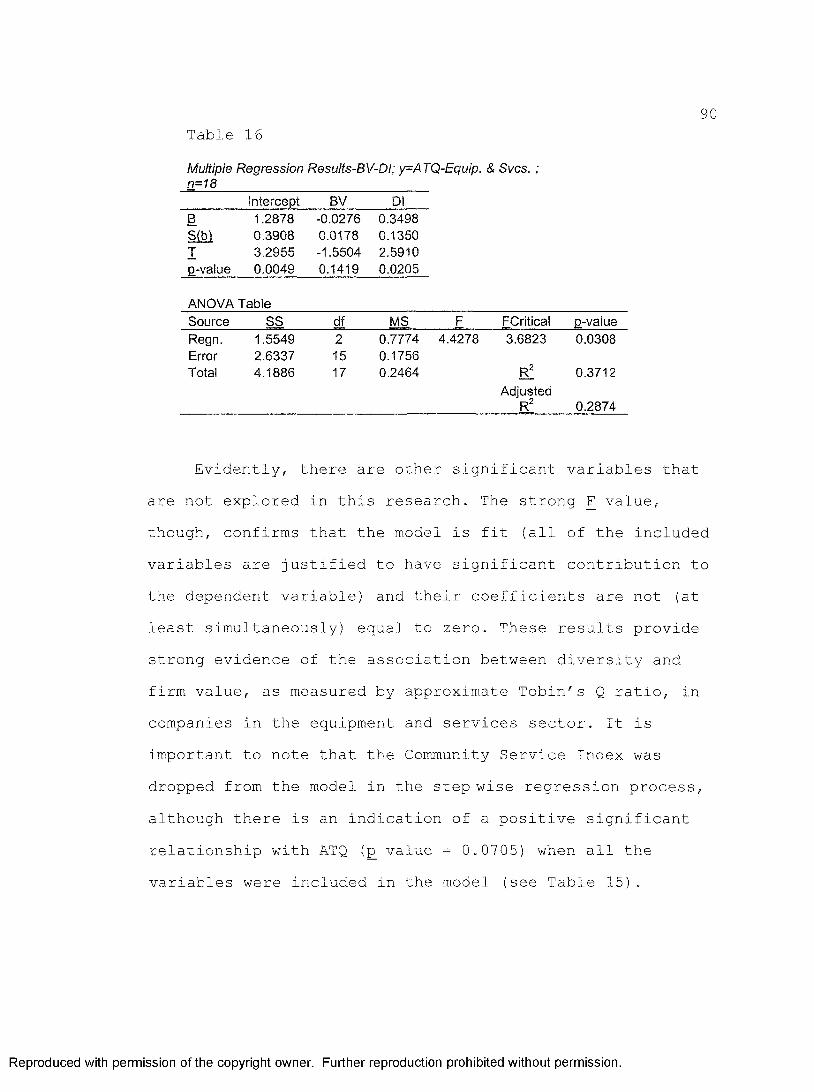
90Table 16
Multiple Regression Results-BV-DI; y=ATQ-Equip. & Svcs. ; n=18
Intercept BV DlB 1.2878 -0.0276 0.3498S M 0.3908 0.0178 0.1350T 3.2955 -1.5504 2.5910fi-value 0.0049 0.1419 0.0205
ANOVA TableSource SS df MS F FCritical j>valueRegn. 1.5549 2 0.7774 4.4278 3.6823 0.0308Error 2.6337 15 0.1756Total 4.1886 17 0.2464 b! 0.3712
AdjustedR2 0.2874
Evidently, there are other significant variablare not explored in this research. The strong F value, though, confirms that the model is fit (all of the included variables are justified to have significant contribution to the dependent variable) and their coefficients are not (at least simultaneously) equal to zero. These results provide strong evidence of the association between diversity and firm value, as measured by approximate Tobin's Q ratio, in companies in the equipment and services sector. It is important to note that the Community Service Index was dropped from the model in the stepwise regression process, although there is an indication of a positive significant relationship with ATQ (p value = 0.0705) when all the variables were included in the model (see Table 15).
Reproduced with permission of the copyright owner. Further reproduction prohibited without permission.

91Conclusion
The results of this study showed that corporate social responsibility has a significant impact in firm value in companies in the industry. The impact is found at different degrees and levels as summarized in Table 17 below.
1. A positive significant relationship was found in the oil and gas sample between diversity and firm value, as measured by approximate Tobin's Q ratio. The results also showed a significant (although negative) relationship between book value and firm value.
2. No significant relationship was found in the oil and gas sample between any of the social indexes and firm value, as measured by ROE.
3. Significant differences in size and social indexes exist between two sectors in the industry, the exploration & production and the equipment & services sectors. These differences justified the treatment of the two sectors separately in the study.
4. Environmental performance was found to be significantly lower for the case of E&P companies, reflecting the fact that these companies are regularly exposed to higher environmental risks than the Equip. &Svcs. companies. Nevertheless, there was no significant evidence of the relationship between the environmental index and firm value in any of the regression models.
Reproduced with permission of the copyright owner. Further reproduction prohibited without permission.

92Table 17
Regression Results - SummaryOil & Gas E&P Sector Equip. & Svcs.
Variable Dep. Var.= ROE
Dep. Var.= ATQ
Dep. Var.= ROE
Dep. Var.= ATQ
Constant
Book Value
Market Share
Cash Reserves
Environment Index
18.4040(1.8008)
-102.505(33.7742)
0.0025(0.0010)
1.3625 (0.2151) -0.0204
(0.0058)
16.4029(4.0264)
-0.195(0.0746)-55.309
(37.9058)0.0016
(0.0007)
1.2878 (0.3908)
-0.028 (0.0178)
Diversity Index
Ethical Index
Community Index
0.1552(0.0800)
3.813(1.6063)
0.3498(0.1350)
nAdjusted FT; F Statistics3
550.14585.6081
550.20387.9106
330.34005.1162
180.28744.4278
Note. Standard Error in Parentheses, indicates statistical significance at the 0.10 level
5. Community service performance was significantly higher for the E&P companies, indicating a higher commitment to community engagement. Nevertheless, there was no significant evidence of the relationship between the community service index and firm value in any of the regression models.
6. No significant differences between the two sectors were found for the cases of diversity and ethical standards
indexes.
Reproduced with permission of the copyright owner. Further reproduction prohibited without permission.

937. The book value and the market share regressors
showed negative statistically significant relationships with ROE in the case of E&P companies. Cash reserves and ethical performance index showed a positive significant relationship with ROE, which provides strong evidence of the association between ethical performance and firm value in this sector.
8. In companies in the equipment and services sector, the results provided strong evidence of the association between diversity and firm value, as measured by approximate Tobin's Q ratio.
9. None of the social indexes showed negative significant relationship with firm value in any of the regression models.
Reproduced with permission of the copyright owner. Further reproduction prohibited without permission.

CHAPTER 5: SUMMARY, CONCLUSION, AND RECOMMENDATIONS
SummaryThe recent corporate admissions of fraud and
accounting irregularities have placed ethical issues higher on the agenda and have contributed to creating new awareness of these issues. This research explored and compared different theories, approaches, and perspectives to the field of business ethics and the corporate social responsibility (CSR) construct and applied them to examine the relationship between ethical behavior, corporate social responsibility, and firm value in companies in the oil and gas industry. The assessment of these factors in this industry is warranted due to the industry's considerable social impact and substantial weight in the overall economy. A company's socially responsible behavior is demonstrated by the way it exhibits high ethical standards, supports community service activities and encourages employees to participate in those activities, accepts responsibility for overcoming environmental pollution, and relates to regulatory bodies. Companies also have an ethical duty with the owners to generate reasonable returns on their investments and to increase the value of the firm. Examining the relationship between these two factors was the objective of this dissertation.
Reproduced with permission of the copyright owner. Further reproduction prohibited without permission.

95A two-stage sampling process was performed to select
55 companies from a universe of more than 23,000 companies in the oil and gas industry (SIC Code 13). A series of ethical and social indexes was used to measure ethical behavior and social responsibility of the 55 companies. Although there are no internationally accepted corporate social performance standards, the researcher used Stone's (2001) proposed empirical taxonomy to evaluate the companies'’ social responsibility performance in a systematic, organized, and consistent manner. The specific social and ethical dimensions used in the conceptual model to measure social performance were (a) environment, (b) diversity, (c) ethical standards, and (d) community service. The research questions attempted to establish relationship between these dimensions and firm value. The social indexes, in combination with other standard financial factors, were analyzed using statistical data analysis techniques to establish if there was any significant relationship with firm value, as measured by Return on Equity or Approximate Tobin's Q ratio.
The results from the study indicated that the ethical performance index is positively and significantly correlated with firm value, as measured by return on equity in the exploration and production sector of the industry.In addition, the results indicated that the diversity index is positively and significantly correlated with firm value,
Reproduced with permission of the copyright owner. Further reproduction prohibited without permission.

96as measured by approximate Tobin's Q ratio in the equipment and services sector.
Although integrity, ethics, good will, and good reputation are values and principles difficult to quantify in economic terms, they indeed bring value to firms as shown in this study.
ConclusionThis study was based on the following research
questions:1. What is the relationship between ethical behavior
and firm value in companies in the oil and gas industry?2. What is the relationship between companies' efforts
to minimize their negative impact on the environment and firm value in companies in the oil and gas industry?
3. What is the relationship between companies' efforts to embrace diversity and firm value in companies in the oil and gas industry?
4. What is the relationship between companies' community service efforts and firm value in companies in the oil and gas industry?
To test these relationships, the researcher developed a conceptual model to provide a theoretical linkage between corporate social performance, a series of financial indicators, and firm value. The next step was to perform statistical hypothesis F tests for the existence of a
Reproduced with permission of the copyright owner. Further reproduction prohibited without permission.

97linear relationship between firm value (as measured by ROE or ATQ) and any of the independent variables. Considering that any differences in firm value and social indexes may be related to company size and specific sectors in the industry, the researcher created two subsets of the original sample (the E&P companies and the Equip. & Svcs. companies) and then ran statistical hypothesis F tests for the existence of a linear relationship between firm value and any of the independent variables for each subset.
For Research Question 1, the results showed that the ethical performance index had a positive significant relationship with ROE, providing strong evidence of the association between ethical performance and firm value in the Exploration & Production sector. Corruption is probably the biggest ethical issue the oil and gas industry is facing and is regularly featured in the international press. There is now greater awareness of the damage that corruption causes both on companies' reputations and on national economies. The uncertainty about the scale of corruption, the bribery problem, and the oil and gas companies' response is evident in the findings in this research. There were relatively few corruption-related events covered by the media in the 4 years of history chosen for this research. Typically, once an unethical behavior is revealed, large amounts of follow-up news coverage related to the subject materializes. This is an
Reproduced with permission of the copyright owner. Further reproduction prohibited without permission.
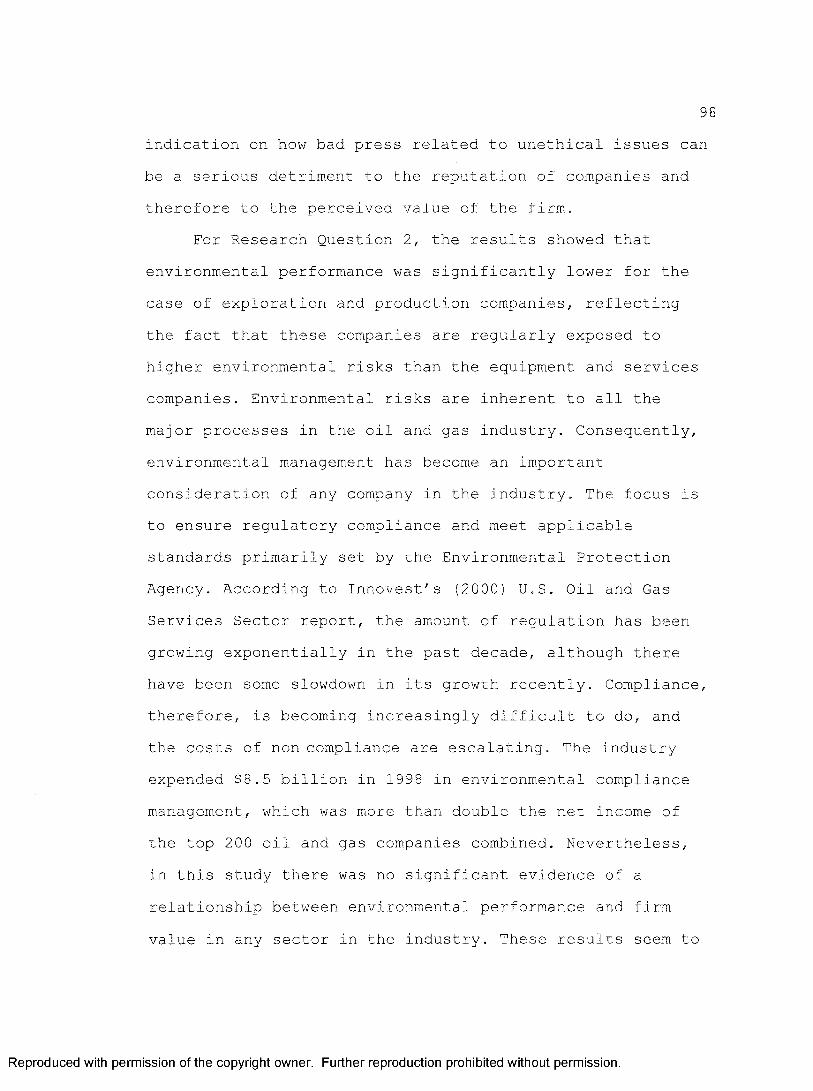
98indication on how bad press related to unethical issues can be a serious detriment to the reputation of companies and therefore to the perceived value of the firm.
For Research Question 2, the results showed that environmental performance was significantly lower for the case of exploration and production companies, reflecting the fact that these companies are regularly exposed to higher environmental risks than the equipment and services companies. Environmental risks are inherent to all the major processes in the oil and gas industry. Consequently, environmental management has become an important consideration of any company in the industry. The focus is to ensure regulatory compliance and meet applicable standards primarily set by the Environmental Protection Agency. According to Innovest's (2000) U.S. Oil and Gas Services Sector report, the amount of regulation has been growing exponentially in the past decade, although there have been some slowdown in its growth recently. Compliance, therefore, is becoming increasingly difficult to do, and the costs of non compliance are escalating. The industry expended $8.5 billion in 1998 in environmental compliance management, which was more than double the net income of the top 200 oil and gas companies combined. Nevertheless, in this study there was no significant evidence of a relationship between environmental performance and firm value in any sector in the industry. These results seem to
Reproduced with permission of the copyright owner. Further reproduction prohibited without permission.

99indicate that environmental risks and incidents are hopelessly interpreted by the market as a "fact of life" in the industry, and therefore do not cause tangible effects in firm value, as measured by ROE or ATQ.
For Research Question 3, the results provided strong evidence of the association between diversity and firm value, as measured by approximate Tobin's Q ratio in the Equipment & Services sector. Many documented instances of lawsuits regarding labor law (mainly gender and race discrimination court cases) were found in this study. Surprisingly, the great majority of those cases were dismissed, and only an insignificant number of the verdicts were in favor of the employee. The large amount of cases might be an indication of employees abusing the system and seeing lawsuits as an opportunity to make money quickly at the expense of a wealthy oil company. The large number of dismissals and verdicts in favor of the oil and gas firms might be an indication of their ability to secure highly capable (and expensive) legal expertise to defend their interests. The entire employer-labor relationship in the industry is likely affected by a combination of both factors. Unfortunately, there is no value created to society from this situation. Neither the companies nor the employees benefit, and only the law firms and the legal system as a whole realize substantial economic benefits.
Reproduced with permission of the copyright owner. Further reproduction prohibited without permission.

100For Research Question 4, the results showed that
community service performance was significantly higher for the Exploration & Production companies, indicating a higher commitment to community engagement than companies in the Equipment & Services sector. Nevertheless, there was no significant evidence of the relationship between the community index and firm value in any sector in the industry. Many of the sample companies in this study consider that developing and maintaining strong relations with the communities and countries in which they operate is critical to their continuing success. However, their strategies to develop these relations vary widely. Some of the main strategies and areas of focus of community engagement found in the study were education, literacy programs, environmental research, basic health and sanitation infrastructures, medical research, and arts and culture.
Although community services efforts are usually perceived positively by the affected people, they have inherently some ethical risks. Sometimes the oil companies used these engagements as a means to advertise their services, and in this sense they can become a powerful institutional marketing tool. Contributions, especially those done in cash, can be a useful means of building popular support and making friends who may be useful in time of need. The ethical dilemma arises when the
Reproduced with permission of the copyright owner. Further reproduction prohibited without permission.

101contributions are used to support political campaigns as it is obvious that many of them are used with the expectation that they will help realize some gains in the future through favorable legislation or regulation issued by the winning party or politician. The danger is that these contributions can be seen as an alternative to bribery.
RecommendationsOil and gas companies are ethically high risk
companies. Environmental accidents, oil spills, chemical explosions, fatalities, labor litigations, product safety litigations, and management scandals have been inherent in the industry for a long time. The oil and gas companies are investing considerably to improve their ethics in many areas. Training has been the focus of a large portion of those investments, as the companies realize that accidents largely result from poor training. In addition to the training focused on incident prevention, there is an increase in spending focused on making sure employees understand the importance of being ethically responsible. Much has been achieved as a result of these investments.Big oil spills worldwide have substantially declined in the past decade. Fatalities in the industry are declining, although they are still high compared to other industries.
Progress has been made on diversifying the workforce in the industry. More women and minorities work in the
Reproduced with permission of the copyright owner. Further reproduction prohibited without permission.

102industry and a higher percentage of them occupy top management positions in the industry, including director positions. Oil and gas companies are investing more on community services in the locations they operate. Through grants, donations, volunteerism, humanitarian aid, and allocation of resources, these companies are demonstrating their commitment to help solving pressing needs in society in different areas such as education, health, and local economic development.
Although much progress has been made in corporate social responsibility in the recent past, much work remains. Oil contamination persists through exploration, production, refining, transportation, and the final stages of manufacturing products for consumers. More progress is needed in developing and commercializing renewable energy sources. The industry's investment in this area is extremely small in comparison to its hydrocarbon operations.
Regarding the diversity dimension, there is room for improvement despite recent advancements. Carter, Simkins, and Simpson (1999), who examined the relationship between board diversity and firm value for Fortune 1000 firms, presented a breakdown of the women and minorities on boards of directors for the sample firms belonging to eight industries. The "Mining & Construction" category (SIC Code 1), of which the oil and gas industry is a subset, was by
Reproduced with permission of the copyright owner. Further reproduction prohibited without permission.
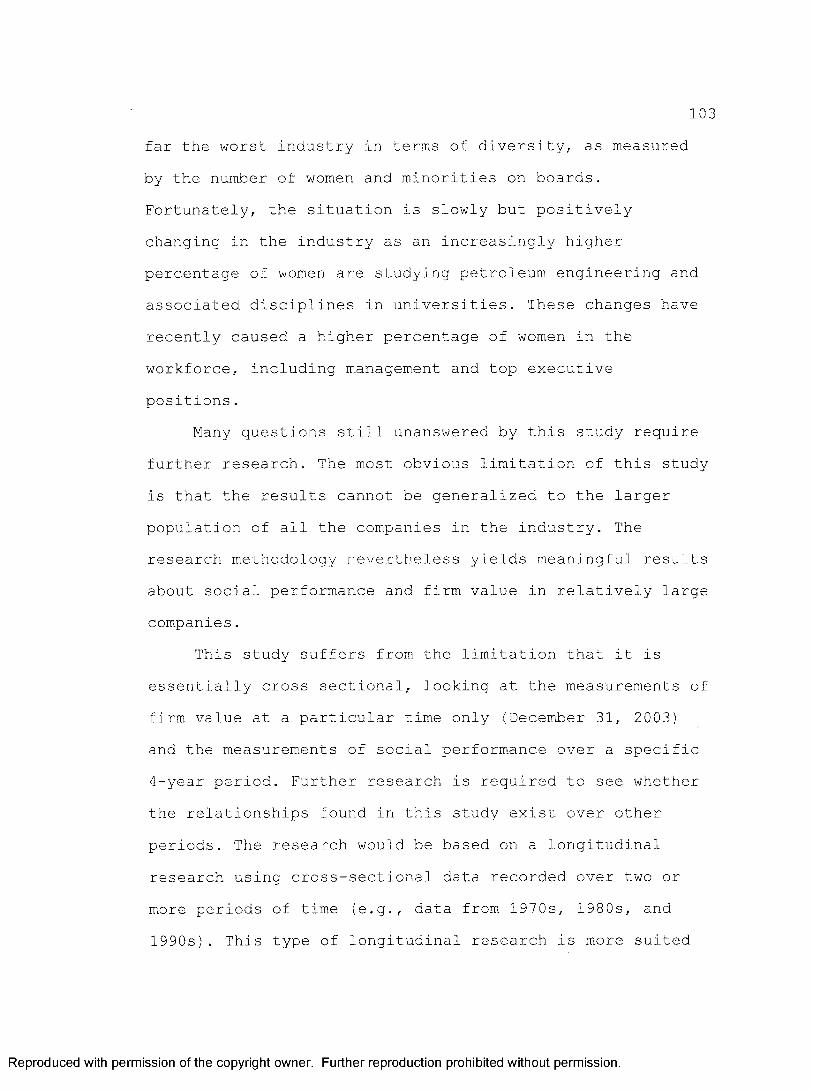
103far the worst industry in terms of diversity, as measured by the number of women and minorities on boards.Fortunately, the situation is slowly but positively changing in the industry as an increasingly higher percentage of women are studying petroleum engineering and associated disciplines in universities. These changes have recently caused a higher percentage of women in the workforce, including management and top executive positions.
Many questions still unanswered by this study require further research. The most obvious limitation of this study is that the results cannot be generalized to the larger population of all the companies in the industry. The research methodology nevertheless yields meaningful results about social performance and firm value in relatively large companies.
This study suffers from the limitation that it is essentially cross sectional, looking at the measurements of firm value at a particular time only (December 31, 2003) and the measurements of social performance over a specific 4-year period. Further research is required to see whether the relationships found in this study exist over other periods. The research would be based on a longitudinal research using cross-sectional data recorded over two or more periods of time (e.g., data from 1970s, 1980s, and 1990s). This type of longitudinal research is more suited
Reproduced with permission of the copyright owner. Further reproduction prohibited without permission.

104for the study of social change and it would be possible to incorporate a time trend into the analysis.
This study used only available public data to account and assess the oil companies' social behaviors and actions. Using such data has some inherent weakness. There might be instances of unethical or irresponsible behavior in the companies that have not found their way to the media or to the public view, and many of them will probably never do. Instances of labor discrimination and harassments, environmental violations, and unethical behavior will probably remain hidden forever as internal issues in these companies. A recommendation for further research in this area would be to use other research methodologies such as surveys and interviews to complement the information on social and ethical events publicly available. However, the researcher taking this approach should be aware of the expected difficulties to access reliable data using these methods due to the sensitivity of the subject. If possible, companies and their employees try to maintain private and off the records unethical issues (or at least minimize their effect) in order to avoid bad reputation and to stay away from costly legal actions.
Lack of information might also create other limitations in the research design. The lack of information regarding a given item (for instance, no published code of business conduct found) was interpreted to mean that the
Reproduced with permission of the copyright owner. Further reproduction prohibited without permission.

105company did not possess a certain attribute, although this may not have been so in reality, something only some other sources of information could have revealed.
Although there seems to be substantial agreement and consistency oh the way the major sources of socially responsible information formulate their reports and profile of companies' social performance, still there is some inherent subjectivity in the way each considers to be the most relevant data. There is therefore no guarantee that there is a direct correlation between the data the researcher believe to be relevant and what is actually relevant. Nevertheless, the researcher strongly believes that, on the whole, social and ethical performance of the firms were properly measured and graded in the study. In actuality, after a certain threshold of knowledge is gained, additional evidence in support of certain aspects of a firm's social performance may be redundant.
Finally, future studies would probably need to include many more variables for a true predictive model. It may also be necessary to explore individual variable components as separate constructs if the model fails to perform as well in future validation studies.
The purpose of this study was to raise visibility and awareness of business ethics and corporate social responsibility issues in the oil and gas industry. One of the researcher's goals with this study was to advocate
Reproduced with permission of the copyright owner. Further reproduction prohibited without permission.

106responsible social behavior in the industry and to make a contribution for positive social change. The goals of corporate management should be to continue aggressively pursuing targets of zero emissions, zero environmental damage incidents, increased diversity in the workplace, and zero incidents of unethical behavior. These managers should pay attention to the results of this study. They can play a significant role not only in their companies' future financial performance but also in their social performance. Managers in the industry have a very important moral obligation to make this significant contribution to society.
Reproduced with permission of the copyright owner. Further reproduction prohibited without permission.

REFERENCES
Aczel, A.D.& Sounderpandian, J. (2002). Complete Business Statistics. New York: McGraw-Hill Irwin
Arlow P., & Gannon, M. J. (1982). Social responsiveness,corporate structure, and economic performance. Academy of Management Review, 7, 235-241.
Arnold, F. S., Forrest, A. S., & Dujack, S. R. (1999).Environmental protection: Is it bad for the economy?. Retrieved November 25, 2003 fromhttp://yosemitel.epa.gov/ee/epa/eermfile.nsf/vwAN/EE- 0422-01 . doc/$ file/EE-0422-01 . doc
Brigham E. F. & Gapenski L. C. (1997). FinancialManagement: Theory and Practice. 8th Edition. Ft. Worth, TX: The Dryden Press.
Bruyn, S. T., (1987). The field of social investment. NewYork: Cambridge University Press.
Calvert Online (2003). Retrieved November 17, 2003, from http://www.calvert.com/sri_64 7.html
Campbell (2003). Peak oil: A turning point for humankind. Retrieved December 28, 2003, from http://www.culturechange.org/issuel9/peakoil.htm
Carroll, A. (1999). Corporate Social Responsibility:evolution of a definitional construct. Business and Societyr 38{3), 268-295.
Carter, D., Simkins, B ., & Simpson, W. (1999). CorporateGovernance, Board Diversity, and Firm Value. Financial Review, 38(1), 33-54.
Catalyst (2004). Women in corporate leadership: Progress & Prospects. Retrieved February 13, 2004, from http://www.catalystwomen.org/publications/overview.htm
Reproduced with permission of the copyright owner. Further reproduction prohibited without permission.

108Center for Environmental Philosophy (2003). About
Environmental Ethics as an Academic Field. RetrievedOctober 30, 2003 fromhttp://www.cep.unt.edu/novice.html
Ceres (2003). Retrieved Nov. 17, 2003, from CERES-Network for change website:http://www.ceres.org/newsroom/press/exxon.pdf
Chen, S.J. & Hwang C.L. (1992). Fuzzy Multiple Attribute Decision Making: Methods and Applications. Lecture Notes in Economics and Mathematical Systems. Berlin, Germany: Sringer-Verlag.
Chung, K.H., & Pruitt, S.W. (1994): A simple approximation of Tobin's Q. Financial Management, 23(3), 70-74
Citizens Funds (2003). Investment Philosophy. Retrieved from Citizens Funds website: http://www.efund.com/
Cleveland, C.J., Costanza, R, Hall, C. A. S., & Kaufmann,R. (1984). Energy and the United States economy: A biophysical perspective. Science, 225, 890-897.
CNN's Judge approves historic Texaco discriminationsettlement (1997). Retrieved November 24, 2003, from http://www.cnn.com/US/9703/26/texaco.settle/
Cox, T.H., & Blake, S., (1991). Managing culturaldiversity: Implications for organizational competitiveness. Academy of Management Executive, 5, 45-56.
Control Risks Group (2002). Facing up to corruption. Retrieved February 13, 2004, fromhttp : / /www. erg. com/html/service__levell. php?service_lev el=4 &service_path=8
DiBartolomeo, D., & Kurtz, L., (1999). Explaining andControlling the Returns of Socially Screened Portfolios. Northfield Working Paper.
D&B Sales & Marketing Solutions (2003). Industry reports. Retrieved November 24, 2003, fromhttp://www.zapdata.com/IndustryReports/SicDivForm.do
Reproduced with permission of the copyright owner. Further reproduction prohibited without permission.
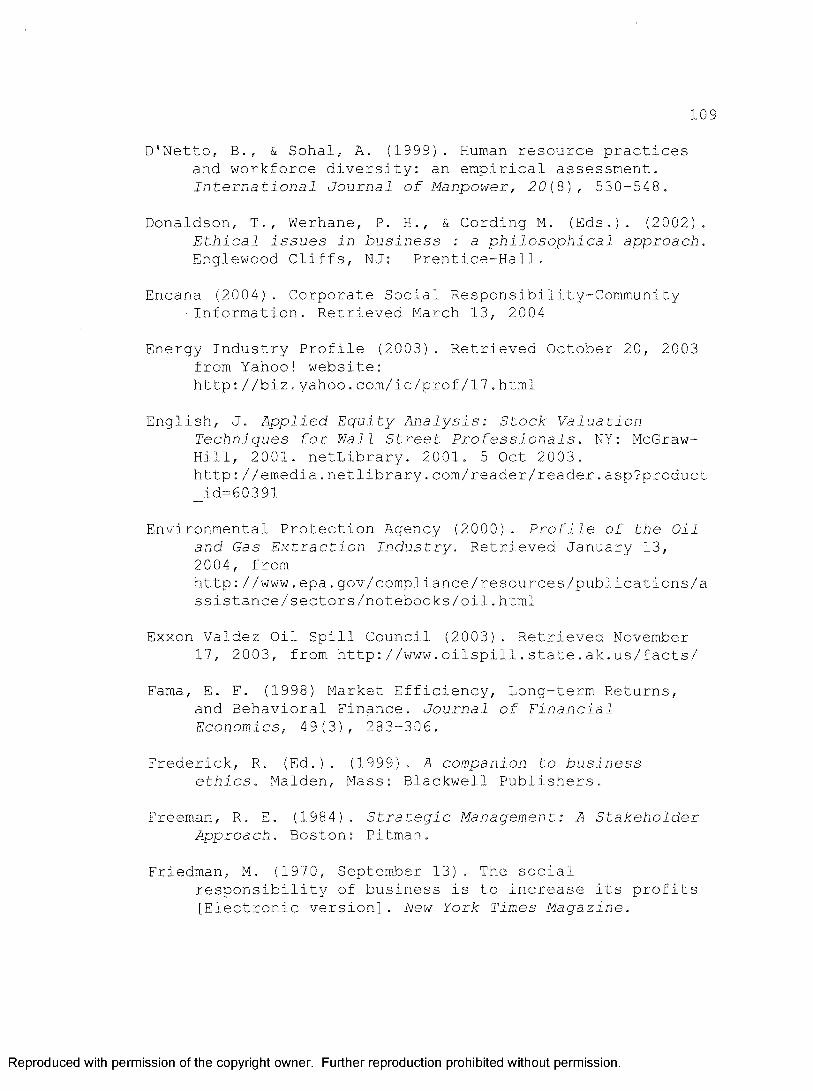
109
D'Netto, B., & Sohal, A. (1999). Human resource practices and workforce diversity: an empirical assessment. International Journal of Manpower, 20(8), 530-548.
Donaldson, T., Werhane, P. H., & Cording M. (Eds.). (2002).Ethical issues in business : a philosophical approach. Englewood Cliffs, NJ: Prentice-Hall.
Encana (2004). Corporate Social Responsibility-Community -Information. Retrieved March 13, 2004
Energy Industry Profile (2003). Retrieved October 20, 2003 from Yahoo! website:http://biz.yahoo.com/ic/prof/17.html
English, J. Applied Equity Analysis: Stock ValuationTechniques for Wall Street Professionals. NY: McGraw- Hill, 2001. netLibrary. 2001. 5 Oct 2003. http://emedia.netlibrary.com/reader/reader.asp?product _id=603 91
Environmental Protection Agency (2000). Profile of the Oil and Gas Extraction Industry. Retrieved January 13, 2004, fromhttp://www.epa.gov/compliance/resources/publications/a ssistance/sectors/notebooks/oil.html
Exxon Valdez Oil Spill Council (2003). Retrieved November 17, 2003, from http://www.oilspill.state.ak.us/facts/
Fama, E. F. (1998) Market Efficiency, Long-term Returns, and Behavioral Finance. Journal of Financial Economics, 49(3), 283-306.
Frederick, R. (Ed.). (1999). A companion to businessethics. Malden, Mass: Blackwell Publishers.
Freeman, R. E. (1984). Strategic Management: A Stakeholder Approach. Boston: Pitman.
Friedman, M. (1970, September 13) . The socialresponsibility of business is to increase its profits [Electronic version]. New York Times Magazine.
Reproduced with permission of the copyright owner. Further reproduction prohibited without permission.

110Frooman, J. S., (1994). Does the market penalize firms for
socially irresponsible behavior? IABS Proceedings, 402-412.
Galen, M. (1994). Sin does a number on saintliness.Business Week, 12, 8.
Gliner, J.A. & Morgan, G. A. (2000) . Research Methods in Applied Settings : An Integrated Approach to Design and Analysis. Mahwah, N.J.: Lawrence Erlbaum Associates, Inc.
Hamilton, S., Jo, H., & Statman, M. (1993). Doing well while doing good? The investment performance of socially responsible mutual funds. Financial Analysts Journal, 49, 62-66.
Hamlet, M. P. (2000). The underrepresentation of blacks in the executive suite in corporate America. Unpublished doctoral dissertation, Walden University.
Hardin, G. (1968). The tragedy of the Commons. Science, 162(12), 1243-1948.
Hickman, K. A., Teets, W. R., & Kohls, J. J. (1999). Social investing and modern portfolio theory. American Business Review. 72-78.
Hill, R. P., Stephens, D., & Smith, I. (2003). Corporate Social Responsibility: an examination of individual firm behavior. Business and Society Review. 108(3), 339-364.
Hylton, M. 0. (1992). Socially responsible investing: Doinggood versus doing well in an inefficient market. American University Law Review, 42, 1-52.
Hwang, C.L., & Masud, A.S.M. (1979). Multiple ObjectiveDecision Making: Methods and Applications. New York: Springer-Verlag.
Hwang, C.L., & Yoon, K. (1981). Multiple Attribute Decision Making: Methods and Applications. New York: Springer- Verlag .
Reproduced with permission of the copyright owner. Further reproduction prohibited without permission.

IllInnovest Strategic Value Advisors (2000). U.S. Oil and Gas
Services Sector: Uncovering Hidden Value Potential for Strategic Investors. Retrieved on January 2, 2004 from www.innovestgroup.com
Jaffe, A. B., Peterson, S. R., Portney, P. R., & Stavins,R. N. (1995). Environmental Regulation and the Competitiveness of U.S. Manufacturing: What Does the Evidence Tell Us? Journal of Economic Literature,33(3), 132-163.
Johnson, L. D., Neave, E. H., & Pazderka, B. (2002).Knowledge, innovation and share value. International Journal of Management Reviews, 4(2), 101-135.
Jones, N. (2000). Diversity in the workplace: an assessment of the caring morality of managers in a corporation that promotes diversity and equal opportunity. Unpublished doctoral dissertation, Walden University.
Kennedy, P. (1993). Preparing for the 21st century. New York: Random House.
Keys, P., Turner, P., & Friday, S. (2002). Shareholderbenefits of diversity. Working paper. Department of Finance. College of Business and Economics. University of Delaware. Newark, DE.
Kiel, G.C., & Nicholson, G.J. (2003) Board Composition and Corporate Performance: how the Australian experience informs contrasting theories of corporate governance. Corporate Governance: An International Review. 11(3), 189-205.
Kinder, P. D. (1993). Social investing's strength lies in readiness to deal with world's tough questions.Pension World, 29(4), 10-12.
KLD's Domini 400 Social Index. Composition of the Index.(2003). Retrieved October 23, 2003 from KLD Research & Analytics, Inc website:http://www.kid.com/benchmarks/dsicomposition.html
Reproduced with permission of the copyright owner. Further reproduction prohibited without permission.

112Kok, P., Weile, T. V. D., McKenna, R., & Brown, A. (2001).
A Corporate Social Responsibility audit within a quality management Framework. Journal of Business Ethics 31(4), 285-297.
Lindenberg, E. B. and Ross, S. A. (1981) Tobin's q Ratio and Industrial Organization. Journal of Business,54(1), 1-32.
Luck, C. (1998). Domini Social Index Performance. The Investment Research Guide to Socially Responsible Investing. The Colloquium on Socially Responsible Investing.
Multex.com Inc. (2004). Multex Fundamentals/ProVestor Plus Company Report. Retrieved February 14, 2004, from http://www.tdwaterhouse.com
Orndoff, K. (2003). Assessing American Diversity. Futurist, 37(1), 22.
RFC Energy Services (2003). Energy Sector Corruption,Transparency, and Risk to Reputation. Retrieved on Jan 5, 2004 fromhttp://www.pfcenergy.com/alerts/Risks_of_Corruption.pd f
Pratt, S., Reilly, P., & Schweihs, R. (2000). Valuing aBusiness: The Analysis and Appraisal of Closely Held Companies (5th ed.). NY: McGraw-Hill.
Reilly, R. & Schweihs, R. (2000). The Handbook of Advanced Business Valuation. NY: McGraw-Hill.
Reyes, M. G., & Grieb, T. (1998). The external performance of socially responsible mutual funds. American Business Review. 16(1), 1-7.
Robinson, G., & Dechant. K. (1997). Building a businesscase for diversity. Academy of Management Executive,11, 21-30.
Rockness, J., & Williams, P. F., (1988). A DescriptiveStudy Of Social Responsibility Mutual Funds.Accounting, Organizations & Society. 23(4), 397-412.
Reproduced with permission of the copyright owner. Further reproduction prohibited without permission.

113
Rock,. M. L . , Rock, R. H . , & Sikora, M. (Eds.)- (1994). TheMergers & Acquisition Handbook (2nd ed.). NY: McGraw- Hill.
Sauer, D. A. (1997). The impact of socially responsiblescreens on investment performance: evidence from the Domini 400 Social Index and the Domini equity mutual fund. Review of Financial Economics 6(2), 137-149.
Shea-Joyce, S. (Ed.). (1993). The Dictionary of Real EstateAppraisal (4th ed.). NY: Appraisal Institute.
Schmalensee, R. (1995). The Costs of Environmental Protection in Balancing Economic Growth and Environmental Goals. Journal of Economic Literature, 33(3), 132-163.
Singleton, R. A., and Straits, B. C. (1999). Approaches to Social Research. New York: Oxford University Press,Inc.
Social Investment Forum (2003). 2003 Report on SociallyResponsible Investing Trends. Retrieved on October 23, 2003 from Social Investment Forum website: http://www.socialinvest.org/Areas/SRIGuide/
Spencer, R. C. (2001). Assets in socially screenedinvestments grew by 183%. Employee Benefit Plan Review, 56, 30-32.
Stone, B. A. (2001). A special-purpose taxonomy ofcorporate social performance concepts. Accounting & the Public Interest. 1, 42-73.
Stoval, R. H. (1992). When do-gooders do good. Financial World, 161, 68-7 0.
Teper, J. A. (1991). The cost of social criteria. Pensions and Investments, 5, 34.
U.S. Census Bureau. (2000). United States Census 2000. Retrieved April 12, 2003, from http://www.census.gov/main/www/cen2 000.html
Reproduced with permission of the copyright owner. Further reproduction prohibited without permission.

114U.S. EPA (1990). Environmental investments: the cost of a
clean environment. Retrieved November 14, 2003 from U.S. Environmental Protection Agency website: http://yosemite.epa.gov/EE/epa/eerm.nsf/vwRepNumLookup /EE-02 94B?OpenDocument
Ullman, A. (1985). Data in search of a theory: A critical examination of the relationship among social performance, social disclosure, and economic performance. Academy of Management Review, 64(1), 19- 24 .
WebFinance Inc. (2003). InvestorWords.com. Retrieved September 12, 2003, fromhttp://www.investorwords.com/cgi-bin/getword.cgi?1878
White, L. Jr. (1967). The Historical Roots of Our Ecologic Crisis. Science, 155(3), 1203-1206.
Wood, D. J., & Jones, R. E. (1995). Stakeholdermismatching: A theoretical problem in empirical research on corporate social performance.International Journal of Organizational Analysis,3(3), 229-267.
Reproduced with permission of the copyright owner. Further reproduction prohibited without permission.

115
APPENDIXESAPPENDIX A-SEARCHING, SCREENING, AND SCORING METHODOLOGY
This appendix presents in detail the methodology used to search, screen, and score the ethical and social events in the study. The main sources of information used to search for the records for each sample company were the companies' websites and the databases described next.
1. LexisNexis-"Legal-Environment-Federal & State Environmental Cases" database: federal and state case law on environmental related matters, including U.S. Supreme Court, U.S. Courts of Appeals, Federal District Courts and state courts.
2. LexisNexis-"Legal-Labor & Employment-Labor Cases,Federal and State" database: U.S. Supreme Court, U.S. Court of Appeals, Federal District Courts and State Case law for all 50 States plus the District of Columbia, Puerto Rico, Virgin Islands and other U.S. territories. Also included are specialty courts such as Military Appeals, Customs, Patents, Tax, Trade, Commerce, Veteran Appeals and Bankruptcy.
Reproduced with permission of the copyright owner. Further reproduction prohibited without permission.

1163. LexisNexis-"News & Business-News, All (English, Full text)" database: contains English language, full-text news from 1864 sources, primarily magazines and newspaper.
4. Academic Search Premier: the world's largest academic multi-disciplinary database providing full text for nearly 4,600 scholarly publications, including full text for more than 3,500 peer-reviewed journals.
5. Business Source Premier: the world's largest full text business database, Business Source Premier provides full text for nearly 3,800 scholarly business journals, including full text for more than 1,100 peer-reviewed business publications.
The following is the process used to search for information specifically related to the social indexes:
A) Environmental Index1. Reviewed company's website and determined existence and quality of written policies on environmental protection.2. Searched LexisNexis, "Legal-Environment-Federal & State Environmental Cases" database.3. Searched LexisNexis, "News & Business-News, All (English, Full text)" database and filter search using
keywords.
Reproduced with permission of the copyright owner. Further reproduction prohibited without permission.

1174. Searched "Academic Search Premier" and "Business Source Premier" databases and filter search using keywords.5. Reviewed all collected events to avoid duplication.6. Determined relevance using screening criteria established in Appendix B.7. Scored the event applying the following criteria:
(a) Only tangible events were scored.(b) If there were no negative news such as spills or
excessive emissions reported by the media in the four years established in the study, the company was rewarded with a score of +3 for this index (relatively small positive contribution).
(c) If there were no environmental legal cases found in the four years established in the study, the company was rewarded with a score of +3 for this index (relatively small positive contribution).8. Calculated the social index by adding all the scores and dividing the result by the total number of tangible events.
KEYWORDSEnvironment; Environmental Protection Agency; EPA; Environmental Compliance; Environmental Laws; Environmental Regulations; Air Pollution; Water Pollution; Pollution; Pollution Remediation; Remediation Liabilities; Asbestos; Energy Conservation; Natural Resources; Environmental Performance; Water Conservation; Environmental Policies; Recycling; Emission; Spill; Environmental Statutes; EPA Violations
Reproduced with permission of the copyright owner. Further reproduction prohibited without permission.
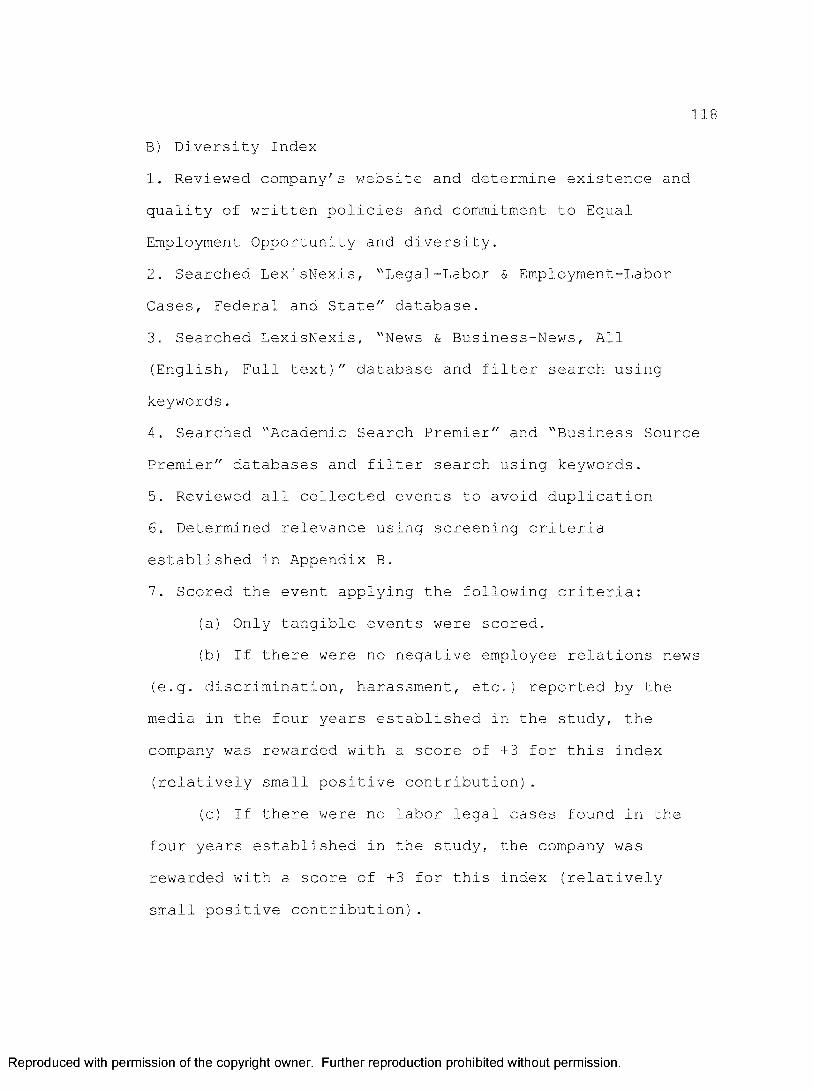
118B) Diversity Index1. Reviewed company's website and determine existence and quality of written policies and commitment to Equal Employment Opportunity and diversity.2. Searched LexisNexis, "Legal-Labor & Employment-Labor Cases, Federal and State" database.3. Searched LexisNexis, "News & Business-News, All (English, Full text)" database and filter search using keywords.4. Searched "Academic Search Premier" and "Business Source Premier" databases and filter search using keywords.5. Reviewed all collected events to avoid duplication6. Determined relevance using screening criteria established in Appendix B.7. Scored the event applying the following criteria:
(a) Only tangible events were scored.(b) If there were no negative employee relations news
(e.g. discrimination, harassment, etc.) reported by the media in the four years established in the study, the company was rewarded with a score of +3 for this index (relatively small positive contribution).
(c) If there were no labor legal cases found in thefour years established in the study, the company wasrewarded with a score of +3 for this index (relatively small positive contribution).
Reproduced with permission of the copyright owner. Further reproduction prohibited without permission.

1198. Calculated the social index by adding all the scores anddividing the result by the total number of tangible events.
KEYWORDSDiversity; Minorities; Women; Disabled; Flextime; Job Sharing; Child Care; Elder Care; Equal Employment Opportunity Commission; EEOC; Equal Employment Opportunity; EEO; Affirmative Action; Sexual Orientation; Gender Equity; Discrimination
C) Ethical Standard Index1. Reviewed company's website and determine the existence and quality of written code of business conduct.2. Searched LexisNexis, "News & Business-News, All (English, Full text)" database and filter search using keywords.3. Searched "Academic Search Premier" and "Business Source Premier" databases and filter search using keywords.4. Reviewed all collected events to avoid duplication.5. Determined relevance using screening criteria established in Appendix B.6. Scored the event applying the following criteria:
(a) Only tangible events were scored.(b) If there were no negative ethical behavior by the
media in the four years established in the study, the company was rewarded with a score of +3 for this index (relatively small positive contribution).
Reproduced with permission of the copyright owner. Further reproduction prohibited without permission.

1207. Calculated the social index by adding all the scores anddividing the result by the total number of tangible events.
KEYWORDSEthics; Code of Business Conduct; Equal Employment Opportunity; EEO; Conflicts Of Interest; Bribery; International Business Relationships; Inside Information; Confidential Information; Proprietary Information; Export Compliance; Economic Sanctions; Political Contributions; Antitrust; Competition Laws; Health, Safety And Environment; Harassment; Kickback; Corruption
D) Community Service Index1. Reviewed company's website and determine the existence and quality of written commitment to community service.2. Searched LexisNexis, "News & Business-News, All (English, Full text)" database and filter search by keywords.3. Searched "Academic Search Premier" and "Business Source Premier" databases and filter search using keywords.4. Reviewed all collected events to avoid duplication.5. Determined relevance using screening criteria established in Appendix B.6. Scored the event applying the following criteria:
(a) Only tangible events were scored.(b) If there were no news on community engagement
reported by the media in the four years established in the study, the company was penalized with a score of +1 for this index (relatively small breach or problem).
Reproduced with permission of the copyright owner. Further reproduction prohibited without permission.

1217. Calculated the social index by adding all the scores anddividing the result by the total number of tangible events.
KEYWORDSCommunity service; charitable giving; donations; Corporate giving; foundation giving; Matching gifts; Charity; Charitable foundation; Charitable organizations; Giving program; Grants; Community activism; Volunteer programs; Children's programs; School system; Community programs; Employee volunteer programs; Voluntarism; Education; Urban revitalization; Local schools; Community based groups; Outreach programs; Community Reinvestment Act
Reproduced with permission of the copyright owner. Further reproduction prohibited without permission.
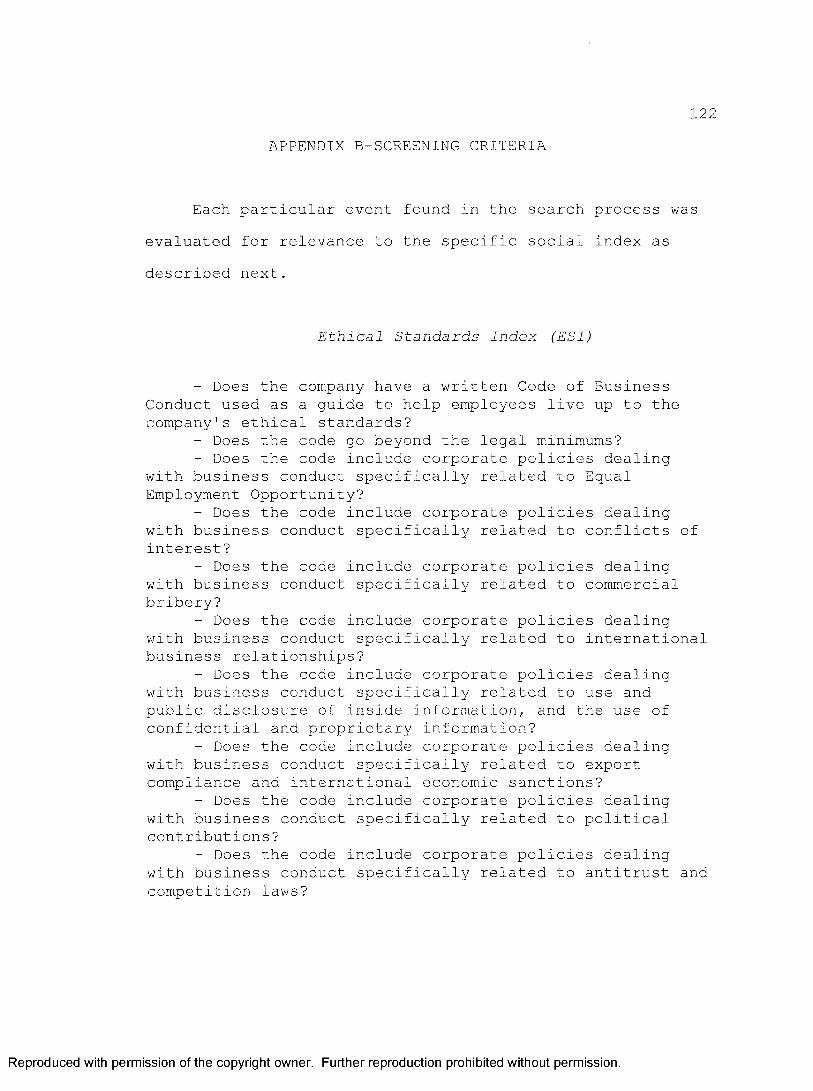
122APPENDIX B-SCREENING CRITERIA
Each particular event found in the search process was evaluated for relevance to the specific social index as described next.
Ethical Standards Index (ESI)
- Does the company have a written Code of Business Conduct used as a guide to help employees live up to the company's ethical standards?
- Does the code go beyond the legal minimums?- Does the code include corporate policies dealing
with business conduct specifically related to Equal Employment Opportunity?
- Does the code include corporate policies dealing with business conduct specifically related to conflicts of interest?
- Does the code include corporate policies dealing with business conduct specifically related to commercial bribery?
- Does the code include corporate policies dealing with business conduct specifically related to international business relationships?
- Does the code include corporate policies dealing with business conduct specifically related to use and public disclosure of inside information, and the use of confidential and proprietary information?
- Does the code include corporate policies dealing with business conduct specifically related to export compliance and international economic sanctions?
- Does the code include corporate policies dealing with business conduct specifically related to political contributions?
- Does the code include corporate policies dealing with business conduct specifically related to antitrust and competition laws?
Reproduced with permission of the copyright owner. Further reproduction prohibited without permission.

123- Does the code include corporate policies dealing
with business conduct specifically related to health, safety and environment?
- Does the code include corporate policies dealing with business conduct specifically related to harassment?
- Has the company, its executives, managers, and employees consistently operated within the framework provided by the Code of Business Conduct in the past three years?
Community Service Index (CSI)
- Does the company have a charitable foundation and if so, how much was given during the most recent fiscal year?
- Does the company have exceptional or particularly innovative charitable-giving programs?
- Is the company an industry leader with respect to its performance in Community activism?
- Does the company have exceptional volunteer programs?
- Is there evidence of new initiatives implemented by or awards given to the company with respect to its performance in this category?
- What community programs does the company have in place?
- Does the company have employee volunteer programs?- Do the company's volunteer programs involve a large
portion of the company's current and former workforce?- Does the company participate in public/private
partnerships related to education, job training, or urban revitalization and if so, what is the nature of the company's commitment to them?
- Does the company have partnerships with local schools or community-based groups?
- Does the company have a corporate giving program and if so, how much was given during the most recent fiscal year?
- Is the company committed to donating a given percentage of its pretax profits to charitable organizations and if so, what percentage is the target goal?
Reproduced with permission of the copyright owner. Further reproduction prohibited without permission.

124Environmental Index (El)
- Is the company in compliance with environmental laws and regulations?
- What civil lawsuits, particularly those covering overseas issues, has the company been subject to, with respect to its environmental performance in the past three years?
- What assets has the company accrued for pollution remediation?
- Does the company have environmental remediation liabilities?
- Does the company have current substantial liabilities for the remediation of asbestos?
- Is the company dedicated to the conservation of energy and natural resources, with emphasis on the impact of operations on the local community?
- Is the company proactive in its environmental efforts?
- Has the company demonstrated a commitment to change, with respect to its environmental performance?
- Has the company developed new products and/or processes that will reduce or minimize environmental impact?
- Has the company adopted new technologies and/or redesigned products to conserve the use of energy, water, materials, and/or land?
- Is the company involved with the new development or use of clean energy, sustainable renewable energy, or natural foods?
- Is the company perceived as an industry leader, with respect to its performance in this category?
- What is the effectiveness of the company's environmental policies; specifically, are the company's established programs and/or goals actually improving its environmental performance?
- Has the company taken positive steps toward preserving our environment?
- Does the company have environmental policies in effect with measurable goals, companywide responsibility, and quantitative accountability?
- Does the company have voluntary programs in place, including recycling?
Reproduced with permission of the copyright owner. Further reproduction prohibited without permission.

125- Does the company have specific environmental
policies and if so, what are they?- What are the company's major policies to prevent air
and water pollution?- Does the company have an environmental report,
including quantitative data on emissions/pollution? What are the company's levels of emission? What are the company's levels of environmental data, e.g., TRI, spills, etc. ?
- What are the company's recycling efforts?- Are all company operations (including those abroad)
in compliance with environmental statutes?- What is the nature and amount of EPA violations and
fines paid?
Diversity Index (DI)
- Has the company demonstrated a commitment to workforce diversity?
- Does the company actively hire and promote minorities and women?
- Has the company demonstrated its commitment to diversity through strong representation of women, minorities, and the disabled on boards of directors, in top management, and/or among the company's highest paid employees?
- Has the company demonstrated its commitment to diversity through its training and advancement programs (e.g., support networks, management reviews, mentoring)?
- Has the company demonstrated its commitment to diversity through participation in women and minority vendor and banking programs?
- Has the company demonstrated its commitment to diversity through implementation of innovative work/life programs (e.g., flextime, job sharing, child care, elder care)?
- Does the company have programs to train woman for advancement?
- Does the company conduct diversity training for its employees?
- Does the company have a history of violations in the area of abusive labor conditions?
Reproduced with permission of the copyright owner. Further reproduction prohibited without permission.

126- Does the company have a poor Equal Employment
Opportunity Commission (EEOC) record?- Does the company's record in this area show a
systematic or repeated disregard for the need to foster an open and diverse work environment?
- Does the company have affirmative action programs pertaining to recruitment and promotion?
- Does the company, at a minimum, have in place specifically stated policies against discrimination in hiring and promotion based upon sexual orientation?
- Does the company have a set of standards for its overseas operations and non-U.S. contractors and suppliers?
- Does the company have a board or staff task force or committee set up to address diversity related issues?
- Does the company clearly exclude women from positions in operating top management?
- Does the company have women and minorities serving in positions with substantial profit and loss responsibilities ?
- Does the company have gender equity in wages?- How does the company portray woman in advertising
and marketing materials?- What is the nature and extent of any civil
discrimination lawsuits brought against the company?- Does the company have an understanding of the need
for minority constituencies to have more of a voice in business?
(Adapted from Stone, 2001).
Reproduced with permission of the copyright owner. Further reproduction prohibited without permission.

127APPENDIX C-SOCIAL INDEXES SCORING EXAMPLES
SOURCE EVENT INDEX SCORE
The Legal Intelligencer, March 7, 2001 Wednesday Copyright 2001 American Lawyer Media The Legal Intelligencer March 7, 2001 Wednesday SECTION: REGIONAL NEWS ; sun; Pg. 3HEADLINE: Sunoco Hit with Class Action Suit BYLINE: By Shannon P. Duffy, U.S. Courthouse Correspondent
Employees Allege Race Discrimination Is Common Sunoco Inc. has been hit with a class-action race discrimination suit in U.S. District Court by a group of black workers who say the company keeps them in lower paying jobs by preventing or discouraging them from getting training that would lead to promotions."The majority of blacks that have been employed by Sunoco are limited to staff positions and denied key management positions that instead go to whites," the suit alleges. In addition to the "glass ceiling" allegations, the suit also says black workers at Sunoco are forced to toil in a "hostile environment" in which their white supervisors and coworkers routinely make racially derogatory remarks and otherwise harass black workers. Attorneys Robert T. Vance, Adrian J. Moody and Isaac H. Green filed the suit along with a team of class-action specialists from Kohn Swift & Graf Joseph C. Kohn, Martin J. D'Urso, Robert J. LaRocca and Neil Glazer.The suit says Sunoco is one of the largest independent petroleum...i
Dl 0
Africa Energy Intelligence, October 29, 2003SECTION: FINANCIAL OPERATIONS ; / NIGERIA;N. 356 HEADLINE: Lawsuit Settled
Alan Fergusson, former manager of the Baker Hugues oil services company in Nigeria, has reached an out-of-court settlement with his former employer and dropped a lawsuit against the group. Last year he accused Baker Hughes of firing him for refusing to pay a bribe to a Nigerian go- between. According to Ferguson, an executive of Western Geco, an affiliate of Baker Hughes at the time, put Baker Hughes into contact in 1999 with an official from RoyalDutch/Shell who was ready to give the American services company a $ 70 million contract to drill on the EA field in return for a kickback. Fergusson turned down the deal and was dismissed in October, 2001. The case triggered an investigation by the U.S. Securities and Exchange Commission into Baker Hughes' business practices in Nigeria. The SEC probe was expanded in August to include the company's dealings in Angola and Kazakhstan. Despite the settlement between Fergusson and Baker Hughes, the SEC investigation is reportedly still proceeding.
ESI 0
Reproduced with permission of the copyright owner. Further reproduction prohibited without permission.

128Energy Compass August 14, 2003HEADLINE:US authorities broaden probe into Company A
The US Securities and Exchange Commission (SEC) has broadened its investigation into Baker Hughes' business practices in Nigeria to include Angola and Kazakhstan. The US oilfield services giant says it will cooperate fully, and will conduct its own investigations, too.
The probe stems from a March 2002 complaint by former employee Alan Ferguson, who claimed he was fired for not going along with a bribery scheme to win a contract with Shell Nigeria in 1999 (EC Apr.5'02,p10). Fergusonsued Baker Hughes, seeking back pay and damages.
In 2001, Baker Hughes settled with the SEC in connection with allegations it authorized a $75,000 bribe to an Indonesian tax official in 1999 and improper payments of $15,000 and $10,000 to agents in India and Brazil. It did not admit or deny the charges.
ESI 0
ASBURYSQUARE,L.L.C.,Plaintiff, vs. AMOCO OIL COMPANY, n/k/a BP PRODUCTS NORTH AMERICA, INC.,Defendant.UNITEDSTATESDISTRICTCOURT FORTHESOUTHERN DISTRICT OF IOWA, CENTRAL DIVISION October 7, 2003, Decided October 7, 2003, Filed
PROCEDURAL POSTURE: Plaintiff property owner filed suit against defendant company and alleged two claims, breach of contract and fraud, arising out of the company's alleged failure to fulfill contractual duties in cleaning up hydrocarbon contamination. The company moved to dismiss the fraud claim under Fed. R. Civ. P. 12(b)(6) and alleged that the owner failed to plead fraud with particularity. The owner sought to amend.OVERVIEW: The fraud claim alleged the company had no intention of honoring its commitment to pay the costs of cleaning up the contamination on the property at the time it made the promises in a 1998 letter. It further alleged the company made the promises in bad faith and with the motive of using the remediation and clean-up promises to influence the jury, the judge, and the owner's predecessor in interest and that they did in fact rely on the 1998 letter in arriving at an amount of damages at trial, ordering remittitur following trial, and entering into a subsequent settlement with the comp
El 0
U.S.Newswire, July 26, 2001 Thursday, National Desk, 386 words,
BP Amoco And International Truck And Engine Recognized By EPA For Cleaner Technology
El 4
Reproduced with permission of the copyright owner. Further reproduction prohibited without permission.

129PR Newswire, October 25, 2000,Wednesday, FINANCIAL NEWS, 558 words,
BP Awards Princeton University $15 Million to Study Reduction of Carbon DioxideRelease Into the Atmosphere; BP Expands Its Partnerships With Key Universities,Now Totaling $85 Million, Through an Agreement With Princeton AddressingEnvironmental and Energy Issues, NEW YORK, Oct. 25 Sir John Browne, BP Group Chief Executive, and ...... Shapiro announced today that BP is providing Princeton University with ...... mitigating carbon dioxide emissions from fossil fuels. It is the ...... Princeton University has ever received. BP is now giving an ...... million over this period. "Bp's commitment to the environment is demonstrated ...... energy use. The Princeton Environmental Institute is a leader in researchon environmental issues and we are proud to be their partner
... emerging partnership between BP and Ford to address climate ...... concerns. "This farsighted grant from BP to launch the Carbon Mitigation
... Company has joined with us and BP, affirming both the critical ...
El 4
Platt's Oilgram News, February 7, 2000, Vol. 78, No. 25; Pg. 2, 267 words,
BP ALASKA TO PAY FINES OF $ 15.5-MIL IN EPA SUIT, Rose Ragsdale, Anchorage ... federal judge accepted BP Exploration Alaska's agreement with the USEnvironmental Protection Agency Feb 1 to commit $ ...... provide for improved environmental management on Alaska's ...... James Singleton also sentenced BP Alaska to five years of ...... being cited by EPA for failing to immediately ...
El 0
Canada NewsWire, August 7, 2002
HEADLINE: Suncor Energy Products Opens Unique Solar Thermal Car Wash in Markham, Ont.;System is Intended to Reduce Natural Gas Consumption and Carbon Dioxide EmissionsToday, Suncor Energy Products Inc. officially opened the first car wash of its kind to use solar pool heating technology to help heat its water. The solar panel installation is designed to reduce the car wash's use of natural gas for water heating by an estimated 16,000 cubic metres per year. This is expected to result in reduced carbon dioxide emissions of 30 metric tons annually at the facility. The car wash is located at Suncor Energy Product's Sunoco station at 7750 McCowan Rd. in Markham, Ont (McCowan and 14th.)
El 3
Reproduced with permission of the copyright owner. Further reproduction prohibited without permission.

130The Houston Chronicle, December 03, 2003,Wednesday, 3
Exxon Mobil biggest donor to United Way, RON NISSIMOV Exxon Mobil donated $ 9.6 million ...... area's largest contributor to the charity. "The greatest gift you can ...... Gulf Coast, told Exxon Mobil executives and employees .
CSI 4
FranchisingWorld,January, 2003, Vol. 35, No. 1; Pg. 54; ISSN: 10417311, 277473821, 351 words,
Franchise Foundation receives donation from Exxon Mobil, Anonymous... foundation has received a donation of $25,000 from the Exxon MobilFoundation to support minority outreach programs."Exxon Mobil's donation to the foundation will help ...
CSI 3
TheWashingtonPost,November 17, 2000Friday, Final
Edition SECTION: METRO; Pg. B02LENGTH: 246 words
HEADLINE: Fuel Leaks From Tank Truck At Silver SpringGas StationBODY:Up to 2,000 gallons of unleaded gasoline leaked from a tank truck at a Silver Spring gas station yesterday afternoon, trickling down streets and storm drains and snarling rush- hour traffic, authorities said.The spill, which occurred at the Sunoco station in the 8500 block of Second Avenue about 5 p.m., also forced the evacuation of several office buildings, including two high- rises, said Capt. John Kinsley, spokesman for Montgomery County Fire and Rescue.A three-block area was cordoned off as the Montgomery fire department and private commercial crews spread sand and other absorption materials. Commercial trucks were called in to vacuum the materials.The cleanup was expected to be completed by morning rush hour, authorities said.
El 0
United States of America, Plaintiff- Appellee, v.BP Amoco Oil PLC; BP Amoco PLC; ... UNITED STATES COURTOF APPEALS FOR THE EIGHTH CIRCUIT June 13, 2001, Submitted January 24, 2002, Filed
Plaintiff United States sued defendant former customers, seeking reimbursement of costs in cleaning up a site contaminated with hazardous substances. The United States District Court for the Southern District of Iowa granted the government's motion to enter a proposed consent decree and denied the request for an evidentiary hearing by the intervenor, the successor to the chemical business.
El 0
Reproduced with permission of the copyright owner. Further reproduction prohibited without permission.

131
APPENDIX D-LIST OF COMPANIES IN THE SAMPLE
List of sample companies and tickerCompany Name(Ticker) SubsectorGrant Prideco, Inc. (GRP) 0 1 & Gas Equipment & ServicesCal Dive International, 1 (CDIS) 0 1 & Gas Equipment & ServicesBJ Services Company (BJS) O 1 & Gas Equipment & ServicesAnadarko Petroleum Corpor (APC) 0 1 & Gas Exploration & ProductionPogo Producing Company (PPP) O 1 & Gas Exploration & ProductionUnocal Corporation (UCL) 0 1 & Gas Exploration & ProductionEnbridge Inc. (ENB) 0 1 & Gas Equipment & ServicesEnsco International Incor (ESV) 0 1 & Gas DrillingNabors Industries Ltd. (NBR) 0 1 & Gas Equipment & ServicesBP p.I.e. (ADR) (BP) 0 1 & Gas Exploration & ProductionNewfield Exploration Co. (NFX) 0 1 & Gas Exploration & ProductionPatterson-UTI Energy, Inc (PTEN) 0 1 & Gas Equipment & ServicesPrecision Drilling Corpor (PDS) 0 1 & Gas Equipment & ServicesBaker Hughes Incorporated (BHI) O 1 & Gas Equipment & ServicesSmith International, Inc. (Sll) 0 1 & Gas Equipment & ServicesPetroKazakhstan Inc. (PKZ) O 1 & Gas Equipment & ServicesTidewater Inc. (TDW) 0 1 & Gas Equipment & ServicesBuckeye Partners, L.P. (BPL) 0 1 & Gas Equipment & ServicesCNOOC Limited (ADR) (CEO) 0 1 & Gas Exploration & ProductionHalliburton Company (HAL) 0 1 & Gas Equipment & ServicesChevronTexaco Corporation (CVX) 0 1 & Gas Exploration & ProductionEnCana Corporation (ECA) 0 1 & Gas Exploration & ProductionKerr-McGee Corporation (KMG) 0 1 & Gas Exploration & ProductionSinopec Shanghai Petroche (SHI) o 1 & Gas Exploration & ProductionMurphy Oil Corp. (MUR) 0 1 & Gas Exploration & ProductionPengrowth Energy Trust (PGH) 0 1 & Gas Exploration & ProductionOccidental Petroleum Corp (OXY) 0 1 & Gas Exploration & ProductionSunoco, Inc. (SUN) 0 1 & Gas Exploration & ProductionPatina Oil & Gas Corp. (POG) o 1 & Gas Exploration & ProductionTEPPCO Partners, L.P. (TPP) 0 1 & Gas Equipment & ServicesRoyal Dutch Petroleum Com (RD) 0 1 & Gas Exploration & ProductionPetroleo Brasileiro S.A. (PBR) 0 1 & Gas Exploration & ProductionGulfTerra Energy Partners (GTM) 0 1 & Gas Exploration & ProductionSchlumberger Limited (SLB) o 1 & Gas Equipment & ServicesImperial Oil Limited (IMO) 0 1 & Gas Exploration & ProductionEOG Resources, Inc. (EOG) 0 1 & Gas Exploration & ProductionTransocean Inc. (RIG) 0 1 & Gas DrillingKey Energy Services, Inc. (KEG) 0 1 & Gas Equipment & ServicesXTO Energy Inc. (XTO) 0 1 & Gas Exploration & ProductionHelmerich & Payne, Inc. (HP) 0 1 & Gas Drilling
Reproduced with permission of the copyright owner. Further reproduction prohibited without permission.

132Talisman Energy Inc. (TLM)Devon Energy Corporation (DVN) Exxon Mobil Corporation (XOM) Amerada Hess Corporation (AHC) Burlington Resources Inc (BR) Pioneer Natural Resources (PXD) Ultra Petroleum Corp. (UPL) Canadian Natural Resource (CNQ) Santos, Ltd. (ADR) (STOSY) Petro-Canada (PCZ) ConocoPhillips (COP)Nexen Inc. (NXY)Magellan Midstream Partne (MMP) Sunoco Logistics Partners (SXL) Pride International, Inc. (PDE)
Oil & Gas Exploration & ProductionOil & Gas Exploration & ProductionOil & Gas Exploration & ProductionOil & Gas Exploration & ProductionOil & Gas Exploration & ProductionOil & Gas Exploration & ProductionOil & Gas Exploration & ProductionOil & Gas Exploration & ProductionOil & Gas Exploration & ProductionOil & Gas Exploration & ProductionOil & Gas Exploration & ProductionOil & Gas Exploration & ProductionOil & Gas Equipment & ServicesOil & Gas Equipment & ServicesOil & Gas Drilling
Reproduced with permission of the copyright owner. Further reproduction prohibited without permission.
Curriculum Vitae133
Javier Fadul 13222 White Cliff Dr Houston, TX 77065
email: [email protected]
EDUCATION
- Master of Business Administration - Le Tourneau University, Houston - 1999
- Graduate courses in Economics - Louisiana State University - Baton Rouge - 1998
- Graduate courses in Computer Science - University of Southern Mississippi, Hattiesburg, - 1980
- Bachelor's Degree in Electronics Engineering - Universidad Javeriana, Bogota, Colombia - 1979
PROFESSIONAL EXPERIENCE
2003-2004. Marketing & Business Analyst, Principal - Logging business unit - Halliburton
Responsible for analysis of the market and business environment. Responsible for execution of the marketing communication plan for the Logging business unit.
2001-2003. Product Manager, Acoustic and Seismic Product Family, Logging Business unit - Halliburton
Responsible for the supply chain and product life cycle management of the Logging family of acoustic and seismic products. Leader of cross-functional teams responsible for the development, manufacturing, and global marketing of acoustic and seismic products.
1999-2001. Product Manager, Open Hole and Cased Hole Logging Services - Halliburton
Responsible for the portfolio of new products. Ensured the proper functioning of the new product development process. Responsible for the integration of the business
Reproduced with permission of the copyright owner. Further reproduction prohibited without permission.

134strategy on a global basis. One of the leaders of the business unit's strategic planning process. Established relationships with strategic suppliers to support the business strategy.
1997-1999. Global Marketing Manager, Logging Business unit - Halliburton
Developed plans for commercialization of Logging products and services worldwide. Introduction of new products and services. Performed business development and marketing duties: market intelligence, market analysis, pricing strategy, promotion, advertisement, and account management.
1996-1997. Marketing Manager, Latin America Region - Halliburton
Responsible for the marketing management activities for a business that totaled more than $400 million in 1997. Working in conjunction with country managers in Latin America to develop marketing programs and promotion campaigns. Worked in conjunction with the Marketing and Business Analysis Group to perform market research and market intelligence on customers and competitors.
1987-1996. Business Development Manager - Halliburton Colombia Branch
Provided leadership to plan, organize, manage, and continuously improve the business development process for all Halliburton Business Units. Responsible for maintaining relationships with existing clients and developing new client contacts. Developed and implemented tactical plans to achieve revenue objectives of the business plan. Recruiting, training and supervising sales representatives.
Previous experience from 1980 to 1987 includes:- Systems Engineer - Occidental Petroleum de Colombia-
Bogota.- Logging field engineer, Maintenance Engineer, Log
Analyst, Computer Center Manager - Gearhart Industries - Venezuela, Colombia, Ecuador, New Orleans.
Reproduced with permission of the copyright owner. Further reproduction prohibited without permission.