Embed Size (px)
Citation preview
BUILDING TRANSIT ORIENTED
DEVELOPMENT IN ESTABLISHED COMMUNITIES
Julie Goodwill Graduate Student Assistant
Principal Investigator
Sara J. Hendricks, AICP Co-Principal Investigator
November 2002
i
CENTER FOR URBAN TRANSPORTATION RESEARCH
University of South Florida 4202 E. Fowler Avenue, CUT100
Tampa, FL 33620-5375 (813) 974-3120,
SunCom 574-3120, Fax (813) 974-5168
Edward Mierzejewski, Ph.D., P.E., CUTR Director Joel Volinski, NCTR Director
Dennis Hinebaugh, Transit Program Director
The contents of this report reflect the views of the author, who is responsible for the facts and the accuracy of the information presented herein. This document is disseminated under the sponsorship of the Department of Transportation, University Research Institute Program, in the interest of information exchange. The U.S. Government assumes no liability for the contents or use thereof.
ii
TECHNICAL REPORT STANDARD TITLE PAGE 1. Report No.
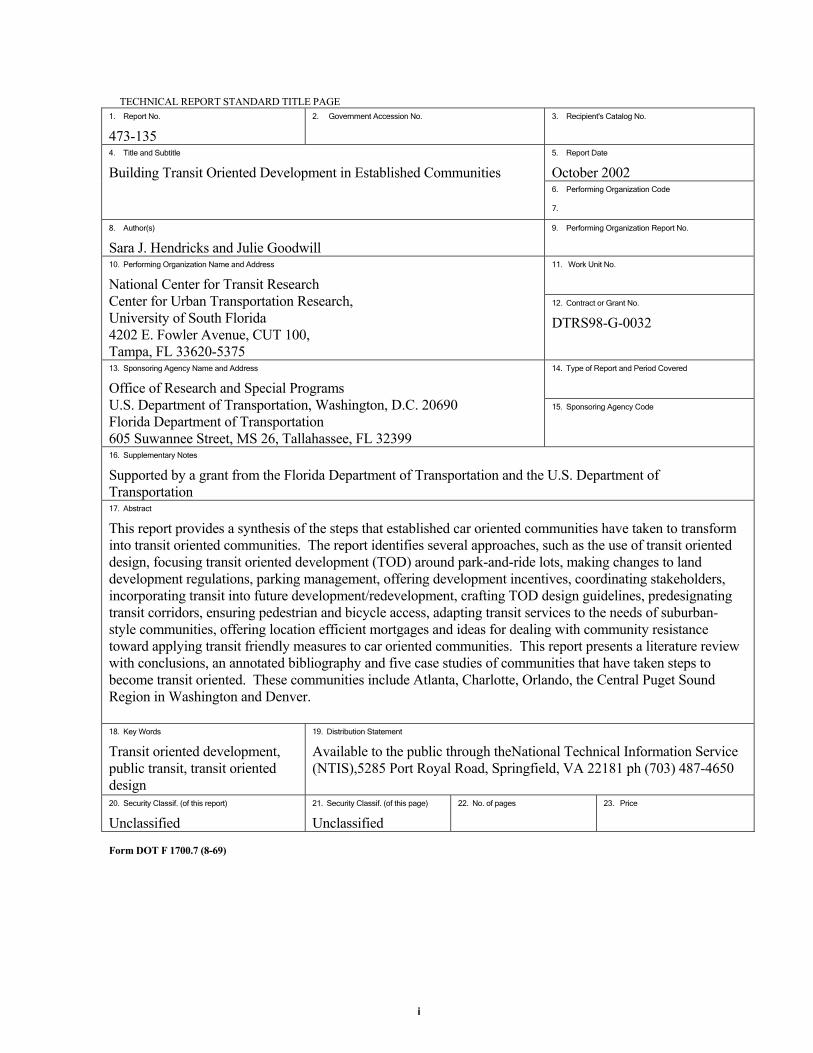
473-135 2. Government Accession No. 3. Recipient's Catalog No.
5. Report Date
October 2002 4. Title and Subtitle
Building Transit Oriented Development in Established Communities 6. Performing Organization Code
7.
8. Author(s)
Sara J. Hendricks and Julie Goodwill 9. Performing Organization Report No.
11. Work Unit No. 10. Performing Organization Name and Address
National Center for Transit Research Center for Urban Transportation Research, University of South Florida 4202 E. Fowler Avenue, CUT 100, Tampa, FL 33620-5375
12. Contract or Grant No.
DTRS98-G-0032
14. Type of Report and Period Covered 13. Sponsoring Agency Name and Address
Office of Research and Special Programs U.S. Department of Transportation, Washington, D.C. 20690 Florida Department of Transportation 605 Suwannee Street, MS 26, Tallahassee, FL 32399
15. Sponsoring Agency Code
16. Supplementary Notes
Supported by a grant from the Florida Department of Transportation and the U.S. Department of Transportation 17. Abstract
This report provides a synthesis of the steps that established car oriented communities have taken to transform into transit oriented communities. The report identifies several approaches, such as the use of transit oriented design, focusing transit oriented development (TOD) around park-and-ride lots, making changes to land development regulations, parking management, offering development incentives, coordinating stakeholders, incorporating transit into future development/redevelopment, crafting TOD design guidelines, predesignating transit corridors, ensuring pedestrian and bicycle access, adapting transit services to the needs of suburban-style communities, offering location efficient mortgages and ideas for dealing with community resistance toward applying transit friendly measures to car oriented communities. This report presents a literature review with conclusions, an annotated bibliography and five case studies of communities that have taken steps to become transit oriented. These communities include Atlanta, Charlotte, Orlando, the Central Puget Sound Region in Washington and Denver. 18. Key Words
Transit oriented development, public transit, transit oriented design
19. Distribution Statement
Available to the public through theNational Technical Information Service (NTIS),5285 Port Royal Road, Springfield, VA 22181 ph (703) 487-4650
20. Security Classif. (of this report)
Unclassified 21. Security Classif. (of this page)
Unclassified 22. No. of pages 23. Price
Form DOT F 1700.7 (8-69)
i
Table of Contents
Executive Summary...................................................................................................................i
Introduction ...............................................................................................................................1
The Emergence of Suburbia .....................................................................................................3
Characteristics of Suburban Land Development.........................................................4 Implications of Suburban Development for Transit....................................................6
The Reestablishment of Transit Oriented Communities..........................................................7
Reinstituting Transit Oriented Design .........................................................................7 Trends Supporting Transit Oriented Development .....................................................7 Perceived Benefits of Transit Oriented Development.................................................8 Typical Transit Oriented Development Design Features............................................9 Performance Criteria for Successful Transit Oriented Development .......................10 Challenges To Transit Oriented Development ..........................................................11
Financial Risk To Developer ..............................................................................12 High Initial Public Investment Costs..................................................................12 Unsupportive Regulatory Framework................................................................12 Community Resistance .......................................................................................12
Community Approaches to Becoming Transit Friendly........................................................14
Applying Financing Methods for Transit Oriented Development............................14 Offering Incentives.....................................................................................................14 Coordinating Stakeholders .........................................................................................15 Tailoring Land Use Regulations To Promote Transit Oriented Design ...................16 Crafting Transit Supportive Design Guidelines ........................................................17 Providing Effective Pedestrian and Bicycle Access..................................................17 Managing Parking ......................................................................................................18 Building Transit Oriented Development At Park-And-Ride Lots ............................19 Predesignating Transit Corridors ...............................................................................20 Incorporating Transit Service Into Future Development/Redevelopment................20 Adapting Transit Services to Suburbia ......................................................................21 Offering Location Efficient Mortgage®....................................................................23 Offering Car Sharing Programs .................................................................................24 Overcoming Community Resistance Through Public Education .............................24
Conclusions .............................................................................................................................27
Appendix A: Case Studies ......................................................................................................30
Charlotte, North Carolina...........................................................................................31 Public Support.....................................................................................................31 Corridor Transit Planning ...................................................................................31 South Corridor.....................................................................................................32 Transit Station Area Principles...........................................................................32
i
Joint Development Principles.............................................................................33 Pedestrian Overlay Districts ...............................................................................33 Recent Transit Improvements.............................................................................33 Conclusion...........................................................................................................34
Denver, Colorado .......................................................................................................35 Blueprint Denver.................................................................................................35 FasTracks ............................................................................................................35 The T-REX Project .............................................................................................35 Examples of Transit-Oriented Development .....................................................36
The Point Project....................................................................................................... 36 I-25 and Broadway.................................................................................................... 36 Union Station ............................................................................................................ 37
Conclusion...........................................................................................................37 Atlanta, Georgia..........................................................................................................38
Georgia Regional Transportation Authority (GRTA) .......................................38 Atlanta Regional Commission Initiatives ..........................................................39 Metropolitan Atlanta Rapid Transit Authority TOD .........................................39
Lindbergh City Center .............................................................................................. 39 Medical Center.......................................................................................................... 40
Conclusion...........................................................................................................40 Orlando, Florida..........................................................................................................41
Land Development Code ....................................................................................41 Bicycle Plan.........................................................................................................42 Central Florida Mobility Design Manual ...........................................................42 Lymmo ................................................................................................................42 Examples of Transit-Oriented Development .....................................................43
Naval Training Center Redevelopment.................................................................... 43 Southeast Orlando Sector Plan ................................................................................. 43 Other Examples......................................................................................................... 44
Conclusion...........................................................................................................44 The Central Puget Sound Region, Washington.........................................................45
Central Puget Sound Regional Transit Authority ..............................................45 King County Transit Oriented Development Program......................................46
The Village at Overlake Station ............................................................................... 46 Metropolitan Place .................................................................................................... 46
Station Area Planning .........................................................................................47 Location Efficient Mortgage® Program ............................................................48 The Ave Street Project ........................................................................................48 Conclusion...........................................................................................................49
Appendix B: Annotated Bibliography...................................................................................50
Endnotes ..................................................................................................................................57
ii

E X E C U T I V E S U M M A RY
This is a synthesis of the actions and processes undertaken by car oriented communities that desire to transform into transit oriented communities. This report is part of the Public Transportation Syntheses Series, prepared by the National Center for Transit Research through the sponsorship of the Florida Department of Transportation and the U.S. Department of Transportation. This topic addresses the fact that the majority of American communities developed after 1950 are oriented to be served by private automobile transportation rather than transit. Such orientation, as characterized by factors like location, land use mix, and site design, have made it difficult for transit to successfully serve these communities. Some ongoing efforts exist that serve as examples of the growing interest to retrofit older communities to promote alternative modes of travel. This study has summarized information from available written sources, but with special emphasis upon direct contact with transit agencies and planning and land development departments of selected local governments. In addition to illustrative examples of community efforts provided throughout the report, five detailed case study examples were developed describing progress toward transit orientation in Charlotte, Denver, Atlanta, Orlando, and the Central Puget Sound Region in Washington State. The report describes the characteristics of suburban land development, the trends that reinforce suburbanization, the benefits of suburbia as perceived by those who choose to live there, and the implications of suburban development upon the delivery of transit service. However, the perceived benefits of transit oriented development (TOD) and shifting public policy and demographic trends that lend support to TOD have helped to make it a favored model for land development by land use planners and transit professionals. Reestablishing transit orientation includes a transportation system that is designed and constructed to enable transit vehicles to navigate easily through communities and allow transit patrons to safely and conveniently access transit service. Reestablishing transit orientation also includes transit oriented design concepts applied to the residential and commercial land development that is served by the transportation system. However, the major challenges to implementing transit oriented development include the real and perceived financial risk to the developer, higher initial public investment costs, an unsupportive land regulatory framework in many cities, and community resistance to changing the existing nature of suburban neighborhoods. While financial return on investment to the developer is usually a deciding factor whether TOD is built, other criteria have been identified in the review of literature to measure the performance and success of TOD. A noticeably absent criterion from consideration by transit professionals and land use planners is the market appeal of TOD to homebuyers. The individual homebuyer is the single most powerful decision making unit in shaping suburban land development. Those who support the application of TOD cite more mobility choices, less traffic congestion, and improved air quality as benefits to residents of TOD; however, it is not clear that these benefits are motivating factors for suburban homebuyers and apartment lessees to relocate to a TOD. While it is the work of marketing professionals in the land development arena to assess and develop communities that appeal to the home buyer market, these professionals do not share the same motivation as the land planning and transit service community to influence society to embrace TOD development patterns. Therefore, this report suggests that it is up to the professionals who support the use of TOD to more proactively and carefully consider the perspective of the individual homebuyer in order to better accomplish TOD.
i
This report also suggests that good transit oriented design alone is not enough to make TOD work. It must be supported by some combination of other tools as described in this report, including:
Developing financing methods Offering financial incentives to land developers Coordinating stakeholders Careful tailoring of land development regulations Crafting transit supportive design guidelines Providing effective access by alternative transportation modes Managing parking Predesignating transit corridors and incorporating transit service into future
development Adapting transit services to suburban areas Providing home loan incentives to homebuyers Addressing and overcoming community resistance through public education
This study has found that TOD approaches can differ significantly from place to place, depending upon circumstances such as differences in land development regulations, zoning ordinances, market forces, development opportunities, available transit services, and the regional economy. It is also observed that some physical design features of TOD may be critical, depending on the particular goals of the development. For that reason, it is important that goals of the TOD be defined early in its development. While the acceptance and adoption of TOD in established communities is an incremental process that may take decades to come to fruition, new technologies such as hybrid electric vehicles and hydrogen fuel cells add some degree of optimism for the future of transit to better serve suburbia as it exists today.
Society has found certain positive benefits from suburban life, which have lessened the capacity of traditional transit systems to serve the public. The forces and trends that reinforce suburbanization and thwart transit would not necessarily be a problem—some would argue that the suburban lifestyle, as chosen by many people through their home buying decision, should not be altered to accommodate transit, but rather transit should reinvent itself to serve the suburbs or stay out of the suburbs altogether. However, this report also has identified the perceived problems of suburban development that are created for individuals as well as society as a whole. Additionally, private automobile transportation is available and affordable to the majority of us, not all of us. Those not served by automobile transportation are sorely disadvantaged. The solution must include efforts in both directions. This includes transit agencies maximizing their ability to extend effective services to suburbia. It must also include attracting people back to urban life, through the creation of transit oriented development, in order to enable transit to better serve the public.
ii
I N T R O D U C T I O N
There is a growing concern in the United States about traffic congestion, long commutes, air pollution, green house gas emissions, foreign and domestic oil prices and availability, farmland and open space depletion, and various other problems that have been attributed partly to the nation's favored suburban development style of the last 50 years. While more empirical evidence is needed to verify cause and effect, transit oriented development (TOD) patterns and major investments in transit are seen as ways to combat or alleviate these problems of the past half century. This report provides a synthesis of the steps that established car oriented communities have taken to transform into more transit oriented communities. The majority of American communities, developed after 1950, have been designed for service by the private automobile rather than public transportation. This sustained emphasis on design, public policy, and investment favoring private auto travel has made it difficult for transit to serve these communities. While new communities increasingly are considering features to improve transit access, this report focuses more upon how older, established communities have begun to take steps to retrofit their land development to encourage the use of alternative modes of transportation.
This synthesis was developed through a literature review of professional and research journals, searches of Internet resources and the Transportation Research Information Services (TRIS), a review of studies conducted by other research agencies and direct contact with transit agencies and municipal transportation and land use planning departments through telephone conversations and email correspondence. This report begins with a brief presentation about the dominant suburban land development pattern of the last 50 years. It is recognized that society has found certain positive benefits from suburban life while lessening the capacity of traditional transit systems to serve the public. Understanding the forces behind the growth of suburbia sheds some light on those main areas to focus upon. This enables us to consider ways to reverse the forces that have contributed to transit’s deterioration. These include the considerations listed in Table 1. After a discussion about suburban land development, the report describes what has been done to “take back” the suburbs and reestablish a transit orientation. This begins not only with the incorporation of transit friendly design features to the transportation system to allow transit vehicle circulation within communities, but also the incorporation of transit oriented development. Determining the success of TOD goes beyond good physical design to other criteria that measure project outcomes. Belzer and Autler propose six criteria summarized here, including financial return on investment, location efficiency, value recapture, livability, choice, and efficient regional land use patterns. This report suggests that an additional important consideration that will determine a successful outcome of TOD is its appeal to individual homebuyers who would otherwise invest in property in the suburbs.
1
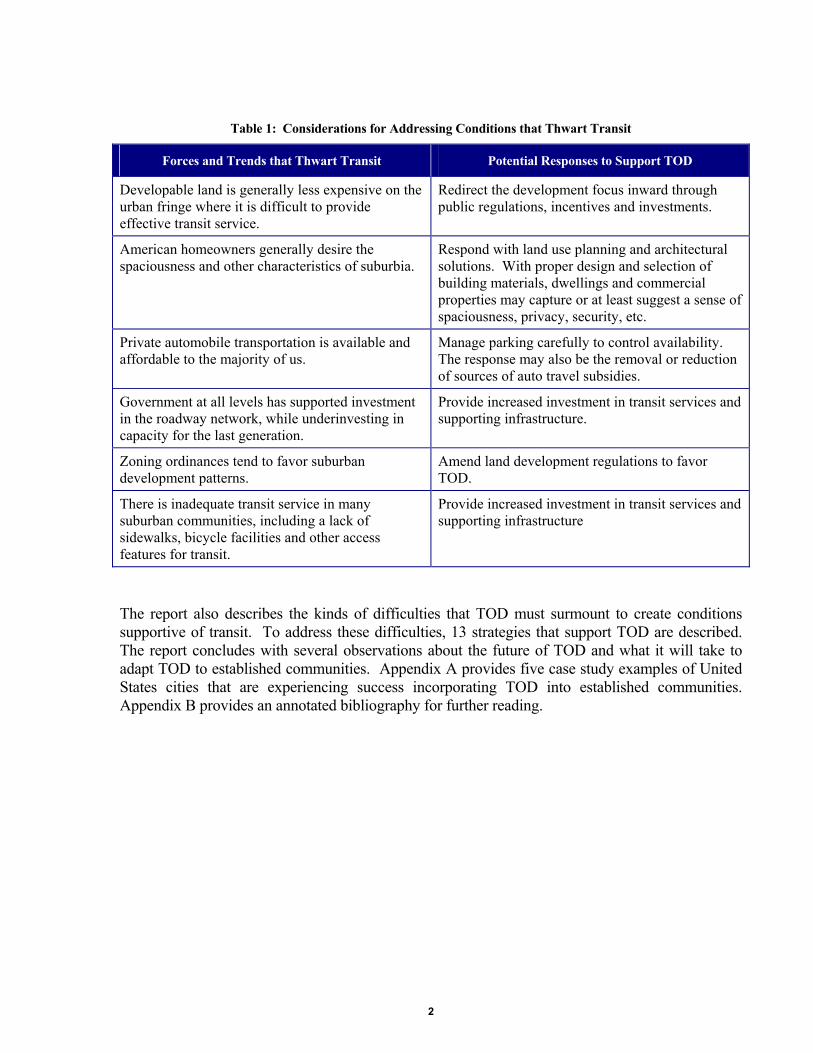
Table 1: Considerations for Addressing Conditions that Thwart Transit
Forces and Trends that Thwart Transit Potential Responses to Support TOD
Developable land is generally less expensive on the urban fringe where it is difficult to provide effective transit service.
Redirect the development focus inward through public regulations, incentives and investments.
American homeowners generally desire the spaciousness and other characteristics of suburbia.
Respond with land use planning and architectural solutions. With proper design and selection of building materials, dwellings and commercial properties may capture or at least suggest a sense of spaciousness, privacy, security, etc.
Private automobile transportation is available and affordable to the majority of us.
Manage parking carefully to control availability. The response may also be the removal or reduction of sources of auto travel subsidies.
Government at all levels has supported investment in the roadway network, while underinvesting in capacity for the last generation.
Provide increased investment in transit services and supporting infrastructure.
Zoning ordinances tend to favor suburban development patterns.
Amend land development regulations to favor TOD.
There is inadequate transit service in many suburban communities, including a lack of sidewalks, bicycle facilities and other access features for transit.
Provide increased investment in transit services and supporting infrastructure
The report also describes the kinds of difficulties that TOD must surmount to create conditions supportive of transit. To address these difficulties, 13 strategies that support TOD are described. The report concludes with several observations about the future of TOD and what it will take to adapt TOD to established communities. Appendix A provides five case study examples of United States cities that are experiencing success incorporating TOD into established communities. Appendix B provides an annotated bibliography for further reading.
2

T H E E M E R G E N C E O F S U B U R B I A
It is useful to briefly consider how land development patterns developed in such a way that did not favor transit service. Understanding the causes of development that are unfavorable to transit service may provide clues about how to reverse such trends.
In the early part of the 20th century, streetcar suburbs emerged. Typically, one owner built the streetcar lines and the residential neighborhoods around them.1 Privately owned mass transit was built to provide a link between the urban employment center and housing at the edges of communities. Essentially, the street railways “extended the boundaries of the 19th century walking city.”2 Small retail clusters often popped up around streetcar stops to conveniently serve commuters and residents and are thought to be a precursor to today’s version of transit oriented development.3 In the 1930s, the interdependence among housing, jobs, and transit started to deteriorate as travel on highways became more popular than rail. Following World War II, there was a major decline in transit use, and many rail systems closed down. Buses became the primary mode of the transit services still in operation. It was also in the post World War II era that the land development patterns took on the low-density, spread-out suburban style that is so common today.
There were three major waves of growth for American suburbs.4 Initially, families with middle and upper class incomes started moving from the city to the suburbs. Retail businesses followed their customer base out into the suburbs and located along commercial strips and regional shopping malls. The first two waves occurred in the post-war years. The third wave occurred in the 1980s, with the decentralization of jobs out of the central city.
There were several factors present in the post-war years that encouraged suburban development instead of urban development and led to the decline in transit.5 The late 1940s and 1950s was a time of post-war housing shortages, low gasoline prices, and major federal investment in the interstate highway system for national security and defense purposes. Housing and commercial development followed the new highways. Building increased on suburban parcels of land, as lower property taxes and federal and state mortgage interests in response to housing shortages gave people incentives to buy bigger homes on bigger lots. As a result, housing was built farther and farther away from transit routes. The environmental policies of the 1970s also supported suburban development. Much urban land is contaminated by hazardous waste, and the remediation of the land that is required before any redevelopment can occur is very expensive. This makes suburban land less expensive and more attractive to developers.
A new generation of publicly funded transit systems took form in the 1970s. Prior to this time, private companies were the primary owners of transit systems. But in the 1970s, the federal government stepped in to keep transit afloat as systems went out of business. While private
3
streetcar companies of the previous century typically built residential neighborhoods around streetcar lines, government-funded transit agencies in the 1970s did not purchase additional adjacent land to tie future development patterns to current transit investments. The primary emphases of these public systems were relieving traffic congestion and serving trips from the suburbs to the central city.6 Funding for land acquisition was limited to meeting transit right-of-way needs only. The stations, characterized by large parking lots or structures, were designed around cars because it was assumed that people would drive to the suburban stations to use transit.
Policies and conditions are now beginning to change, and more focus is being placed upon issues regarding growth management and quality of life. Despite recent favorable attitudes toward transit friendly development, a 50-year history of suburban development has challenged transit to serve development effectively.
Characteristics of Suburban Land Development
After World War II, there was a mass exodus of new families leaving the city to buy homes in the suburbs. Many of the next generation who grew up in the suburbs continue to choose to live there. Each homebuyer constitutes a powerful decision making unit that has, more than any other single influence, shaped the built environment. Although suburbia comes with many costs discussed later, it also has positive attributes that make it attractive to homebuyers. These include a sense of open space and fresh air, privacy, safety and security—attributes especially important to families with young children. Alan Voorhees, engineer and founder of one of the largest international transportation planning firms, observed during his work in cities all over the world the tendency of people, regardless of culture, to gravitate toward and live among others of the same socio-economic status.7 This is clearly observed by the way families move “upward,” not just financially but physically. They purchase a house and move to the suburbs, where there is both solid middle-class respectability and socio-economic homogeneity. Families also strive to move from an older suburb to a newer or more affluent one. This powerful status symbol of American society is generally not duplicated to the same degree by residential development in the city. Many people also tend to prefer new homes and bigger homes, which are more commonly found in the newest suburbs at the urban fringe than in older suburbs or downtown residential areas. Homebuyers perceive the suburbs as a better investment where the separation of homes from other land uses protects them from perceived threats of noise, litter, crime and blight. For many people, long commutes from their suburban homes, high automobile expenses, and lack of pedestrian and transit access are acceptable trade offs for the amenities suburbia has to offer. While a house in the suburbs may be the dream of the majority of American homebuyers, this collective vote to live in the suburbs challenges public facilities providers to extend services farther from the urban core. At its worst, transportation and land use professionals describe suburban land development on a large scale as “sprawl.” Sprawl refers to “development that expands in an unlimited and noncontiguous (leapfrog) way outward from the solidly built-up core of a metropolitan area.”8 The most defining characteristic of sprawl is low-density development spread out over large areas of land.9 The least expensive land for development, from the developer’s
4
point of view, tends to be that which is located on the periphery of existing development, where there are no hazardous wastes to mitigate and no existing development to raze, but for which there is also no established or planned transit services. Suburban land development is characterized by the segregation of land uses from one another into zoning districts in which only one type of use is permitted, such as single-family residential, shopping centers and strip commercial, industrial, or office parks. The initial reasoning behind zoning was to shield any particular type of land use from the noxious or unpleasant impacts of other land uses. In contrast to the concentrated downtowns and smaller town centers, where transit can easily serve development, suburbia is distinguished by its subdivisions, office parks, and malls spread over the landscape in a relatively even manner. There are generally fewer homes per acre and all types of development tend to be more dispersed as opposed to the more compact development patterns of urban areas. Suburban residents are usually completely dependent on the automobile for travel, since they lack adequate bus service and must travel greater distances between dispersed destinations. The lack of continuous sidewalks and bike lanes often prevents walking and bicycling, which might otherwise allow access to transit services. It is argued by some that suburban land development patterns have significant financial costs to both individuals and communities.10 Commonly cited negative effects that are experienced by individuals include air pollution, traffic congestion, and long commutes to work.11 Another negative byproduct is a feeling of cultural isolation.12 Without a downtown or a town square, there are few common places in suburban communities for people to congregate, encounter one another and develop a sense of community. Individuals also absorb costs of a suburban land development pattern that inadequately supports transit. For most Americans, transportation is the second highest expense, after housing.13 The average American household spends 18 cents out of every dollar spent on transportation, 98 percent of which goes to the purchase, operation, and maintenance of cars. Most households have no choice but to own a number of cars. Greater traveling distances result in higher spending on gas and maintenance. Families struggling financially in communities with inadequate transit service spend the highest proportion of their incomes on automobile transportation, rather than on investments that appreciate over time and can raise a family’s standard of living, such as homeownership. The financial cost of suburban land development is also borne by communities. The population growth rate in suburban communities is more than twice as high as in central cities.14 Between 1990 and 1997, the growth rate was 9.6 percent in the suburbs and only 4.2 percent in urban cores. This rapid growth in suburban communities requires expensive new infrastructure such as schools, sewers and waterlines, libraries, fire stations and roads, as well as the need for financing their long term operation. Local municipalities are challenged to meet the continuing costs and often must lower standards and the quality of life they can offer. These costs to both individuals and communities point to potential alternatives that might be offered by transit oriented development so property owners can begin favoring such change in their established car oriented communities. These alternatives include cleaner air, reduced traffic congestion, shorter commutes, a renewed sense of community, reduced transportation expenses, and cost savings to municipalities as a result of more efficient development of public facilities. Transit oriented development should also
5
attempt to match or duplicate the perceived benefits of suburbia to effectively compete for investment by homebuyers. These include a sense of spaciousness, privacy, safety, security, child-friendliness, quiet, cleanliness, and a sense of social respectability.
Implications of Suburban Development for Transit
Historically, transit routes were provided on radial networks designed to effectively serve downtowns and concentrated urban centers by connecting to outlying residential areas.15 Now the trip origins and destinations of travelers are widely dispersed over lower density development. Travel paths that go in all directions (radial, cross-town, lateral, and reverse-direction travel) have replaced traditional commuting paths. Both trip origin and destination are in the suburbs. Rather than the traditional grid pattern of interconnecting streets found in older communities, there are more origin/destination pairs served by a hierarchical street system. This system is characterized by a residential neighborhood street with a cul-de-sac at its terminus and a connection on the other end to a collector street that carries local traffic only. The traffic volumes increase as they approach minor, then major arterial roadways of increasing width and lanes. Hierarchical street systems are often preferred by homebuyers because it eliminates noisy through traffic from their neighborhoods. These characteristics of suburban style development and travel patterns have a number of major implications on the provision of transit services. First, suburban areas have much lower densities and cover far more land area than traditional urban cities. The lack of interconnected streets, greater distances traveled, and fewer origins and destinations within walking distance of transit routes mean less direct routing and more vehicle miles traveled per passenger for transit. Second, in suburban style development, buildings are set back farther from roads, requiring transit service to stray off the main route more often. Third, in contrast to a traditional urban city in which a mix of activity (employment, retail, and service) in one place puts even demand on the same routes throughout the day, peak travel times in suburban areas vary in different places (office parks, shopping centers, etc.) at different times of the day. This may require transit providers to operate different routes and service patterns at different times of the day. Fourth, there are often several agencies providing transit in suburban communities, such as a regional bus service, local suburban area bus services, and sometimes a rail operator.16 The ability of these agencies to coordinate services and policies is an important issue that must be addressed.
6
T H E R E E S TA B L I S H M E N T O F T R A N S I T O R I E N T E D C O M M U N I T I E S
There are many consequences of suburban land development to the provision of transit service, as discussed previously. The previous section also described how suburbia emerged, its characteristics, the disadvantages of suburbia that TOD might be able to overcome, and the advantages of suburbia that TOD should try to emulate in order for TOD to catch on in established communities. Because of the challenges that suburban development patterns pose for public transportation, many communities have initiated efforts to become more transit friendly. This section presents several identified approaches that have been used to accomplish this change. These include reinstituting transit oriented design, policies and investments; amending land development regulations; managing parking supply; strengthening transportation modes that are supportive to transit usage, such as pedestrian and bicycle transportation; maximizing coordination opportunities; and adapting transit services to the needs of existing suburban communities. While illustrative examples are provided throughout this report, five detailed case study examples of urban areas nationwide that have used one or more of these approaches are featured in Appendix A.
Reinstituting Transit Oriented Design
The most common approach to making established car oriented communities more transit friendly is the use of physical design features. Addressing street design as well as the physical arrangement and proximity of land uses is perhaps the keystone of transit orientation. Some refer to “transit friendly design” as those street features within the public right-of-way that can apply just about anywhere and with far less cost than transit oriented development strategies. Transit friendly design includes an interconnected street system for vehicular circulation, the location of transit stops on streets, and intersection design for transit vehicles. Transit friendly design also includes the design of bus stops to functional standards, the provision of bus stop amenities for pedestrians and transit service and route signage for patrons. It includes safe and convenient pedestrian access to the street and curb cuts as well as bicycle lanes, paths and parking. Transit oriented development (TOD) refers to development activity located along or within walking distance to transit routes that “mixes residential, retail, office, and public uses in a walkable environment, making it convenient for residents and employees to travel by transit, bicycle, or foot.”17 The main purpose of TOD is enhancing mobility by decreasing reliance on the automobile and by encouraging use of alternate modes of transportation such as transit, walking, and biking.
Trends Supporting Transit Oriented Development
Many of the reasons for the exodus of residents from city life years ago are issues no longer. New technologies allow architects, planners, engineers and builders to create an urban residential environment that offers a far better standard of living than that offered by the city of 100 years ago. This includes improved sanitation, noise buffering, stricter building codes, and better building
7
materials. Since the beginning of the flight out of the city during the days of the streetcar, people now no longer burn coal, wood, and kerosene for light and heat. As a result, urban air quality has improved. Over the years, stricter federal standards on motor fuels and vehicles have reduced emissions. With the exception of carbon dioxide, technology changes have more than offset the effects of degrading air quality from increasing vehicle miles traveled. In addition, new hope is on the horizon from promising new technologies, such as hydrogen fuel cells and hybrid vehicles. Four major trends identified by Cervero and Duncan have pushed the TOD movement forward.18 First, today's public policy environment has become more receptive to the integration of transportation and land use planning with laws such as the Intermodal Surface Transportation Efficiency Act (ISTEA) of 1991, followed by the Transportation Equity Act for the 21st Century (TEA-21). The "New Starts" funding by the Federal Transit Administration under TEA-21 has criteria that favorably reward transit-supportive local government policies and the attention projects give to transit and land use coordination. The second trend is a shift in demographics. Young single adults, childless couples, “empty nesters” wanting smaller homes, and immigrants are emerging as new markets for transit-based housing. Third, due to the ever-increasing problem of traffic congestion, some people are choosing to live near transit to make their commutes easier. And fourth, companies are starting to relocate around transit station areas to provide employees with additional commuting and housing choices. Over the last 10 years, TOD has become one of the leading urban planning models in the United States. It is unlikely that transit oriented development is a universally appropriate development pattern for all car oriented communities. However, criteria for choosing car oriented communities might include:
1. those with the most promising initial circumstances such as the availability of desirable transit service characteristics, some threshold levels of adjacent development, and proximity to other major concentrations of activity.
2. those whose residents desire transit service. 3. those that are located within a larger comprehensive redevelopment strategy for an area. 4. those that require redevelopment for other reasons.
Perceived Benefits of Transit Oriented Development
It is widely believed that the benefits of transit oriented development accrue to the transit system, the local host government, society, and individuals who live and work there. More research is still needed to build supporting empirical evidence for this belief.19 Nonetheless, many assert that TOD has significant benefits for transit, including more efficiency in transit service and increased transit ridership. Well-connected streets and destinations that are closer together can help achieve improved efficiency in the form of more direct routes and frequent service. According to one source, people living near a transit station are up to six times more likely to commute to work by transit than other people living in the same region.20 Increased ridership will result in higher transit revenues.
8
It is believed that local governments benefit financially from TOD. First, compact development lowers the infrastructure costs associated with dispersed development, such as roads, parking facilities, schools, sewer and water lines, and fire stations. Second, properties close to transit stations and TOD often have increased property value.21 Higher property values, plus the increase in economic activity caused by TOD, create a larger tax base for local governments. 22 It is believed that society benefits from TOD due to compact development, integrated land uses, and a pedestrian friendly environment that all contribute to a balanced transportation system. Clustering commercial, public, and recreational services near transit stations and within walking distance of where people live and work reduces the need to drive automobiles and shortens travel time and distances, reducing overall traffic congestion. For example, residential development near the Pleasant Hill BART station in suburban San Francisco generates 52 percent fewer peak period auto trips than typical residential development and office development generates 25 percent fewer trips than typical office development.23 In addition, a reduction in automobile use by reducing the need to travel beyond the TOD community leads to decreased pollution and improved air quality. Other goals include supporting local growth management objectives, maximizing use of existing transit service, and improving quality of life. These goals are societal goals—ones that appeal to the sensibilities of local government staff, whose job it is to guide development in a way that is best for society as a whole. Making TOD successful will depend on how it can be effectively marketed to the individual homebuyer and business owner. Lastly, many assert that individuals do benefit from TOD due to the increase in accessibility and transportation choice it provides to the businesses and residents within the TOD. While suburban residents might not perceive these as valuable benefits, increased transportation choice translates into more mobility, especially for low-income and transit-dependent people.24 The benefit of increased accessibility is not limited to the area around the TOD. Having transit facilities nearby connects residents and workers to the rest of the region. TOD may make having a car an option, not a necessity. Some households are able to reduce the number of cars owned as walking, bicycling and transit become effective means of travel, translating into significant savings in transportation costs. Additionally, TOD typically reestablishes places that serve as town squares, where people can congregate and develop a sense of community.
Typical Transit Oriented Development Design Features
TOD involves a mix of land uses, including commercial/retail, business, residential housing (various types and prices), and community amenities, such as childcare centers, schools, libraries, public services, local government offices, and community parks.25 Quite often a transit station is central to TOD with high-density development surrounding the stations while getting progressively less dense as it spreads outward. The development is compact, and the streets are built in an interconnected urban grid pattern (similar to the street design of the downtown areas in older U.S. cities). Auto-oriented land uses, such as gas stations or restaurants with drive-through windows, are discouraged.
9
A key element of TOD is making streets attractive, convenient, and safe for pedestrians and bicyclists.26 People are more likely to walk or bicycle in an attractive environment they feel comfortable and safe in. Streetscape enhancements used to make streets more attractive involve trees, lighting, benches, building awnings, weather protection, and other amenities. Added convenience is given to pedestrians by having smaller blocks, buildings that are located close to the street with entrances directly connected to the public walkway, retail located on the ground level with businesses and housing above, and easily accessible transit stops with comfortable waiting areas. Narrow streets with wide sidewalks, traffic calming measures such as speed bumps or roundabouts, cross walks, and continuous walking and bicycling routes create a safe environment for pedestrians and bicyclists. To balance the needs of automobiles with the needs of other transportation modes, parking and access management is also an important component of TOD.27 TOD typically has a lower parking-to-occupant ratio compared to conventional suburban development. Shared parking is utilized, and parking is placed on the street (on-street parking takes up much less land area than off-street parking), behind buildings, underground, and in carefully designed and located parking structures rather than large surface lots. While these are the traditional TOD characteristics found in a general literature review, TOD approaches can differ significantly across regions due to various circumstances, such as differences in land development regulations and zoning ordinances, market factors, development/redevelopment opportunities, public transit services, resources, and the state of the present and future regional economy.28 These can determine whether a community can build large scale TOD projects or gradually implement smaller projects over time, whether TOD is built on vacant land or utilizes existing structures for redevelopment, or whether TOD is based around bus or rail stations. Every TOD project may not incorporate all of the design characteristics described above, but some features may be critical depending on the particular goals of that development. For that reason, it is important that the particular goals to be achieved by the TOD be defined early in the development of the TOD.
Performance Criteria for Successful Transit Oriented Development
Definitions of TOD success often focus on the physical characteristics of its built form. Belzer and Autler list six performance criteria for use in evaluating project outcomes, with relative importance of the criteria to be based on the major goals the TOD sets out to accomplish. Belzer and Autler suggest that, while physical characteristics are a “necessary element,” focusing instead on project outcomes as a benchmark of success allows a framework for tradeoffs that most projects must make.29 These six criteria are summarized below. The first performance criterion is financial return on investment for both public and private investors. TOD projects must be financially feasible to become a reality and be successful. Financial goals include a larger tax base for local governments due to increased property values, increased retail sales, and a larger number of taxpayers as a result of more property owners living in denser development. Other financial goals include higher transit revenues from fare boxes and ground leases, higher return on investment for the developer, shorter commute times and easier employee access for employers. The estimation of financial return is often the deciding factor whether or not to proceed with TOD. However, the use of a community-wide planning approach
10

with all the necessary stakeholders represented at the negotiation table encourages TOD evaluation not only on its financial return but also on other important criteria. The second performance criterion is location efficiency. A location efficient TOD neighborhood is designed to be pedestrian friendly, provide proximity to high-quality transit, and to have a mix of uses and access to community amenities. In essence, location efficiency gives people mobility choices and makes driving an automobile optional instead of necessary. The third performance criterion is value recapture. The benefits of location efficiency result in direct savings for individuals and households, such as fewer automobile and parking expenses. This would be of greatest benefit to low and middle-income households. Savings would also be realized on a regional and national level, through the need to build fewer roads, parking facilities, and other related infrastructure. The capture of these savings by households, developers, and local governments could result in measurable outcomes, such as increased homeownership rates (first-time homebuyers using more location efficient mortgages) or more adequate housing stock, and reduced individual and community spending on transportation, which means greater discretionary spending. The fourth performance criterion to be evaluated is livability, or quality of life. TOD-related measures of livability listed by Belzer and Autler include better regional air quality, lower gas consumption, increased mobility choices, less congestion, personal time savings through shorter commutes, improved pedestrian access (to retail, public services, recreation, culture, and public parks), improved public health and safety, and better economic health. The fifth performance criterion to evaluate is choice. TOD should provide people with a greater diversity of types and price ranges of housing to choose from, a large range of retail and commercial businesses within walking distance, and a balance of transportation options. One of the basic core problems of suburban style development is the lack of options it provides residents. This is most limiting to low and middle income residents. The sixth performance criterion is efficient regional land use patterns, which involves channeling growth to where it can best be handled. Results of efficient regional land use include less loss of farmland and open space, a better balance between jobs and housing, shorter commutes, less congestion and pollution, and more efficient delivery of essential community services. While it is unlikely that any single project will excel in all the performance areas discussed, these criteria offer a more comprehensive definition of what TOD should offer, may help identify the challenges and necessary tradeoffs of TOD, and help form recommendations for future TOD.
Challenges To Transit Oriented Development
While TOD has gained popularity over the last decade, it is still not commonly practiced. For example, New Urban News reported that, for every one dollar spent in TOD, over $1,400 is invested in conventional suburban development.30 With so many benefits believed to be associated with TOD, why hasn’t it become a more common form of development? A review of the literature and contact with local planning and transit agencies identified several challenges faced.
11

Financial Risk To Developer
Although TOD is gradually gaining more acceptance in the development community, it is still often hard to convince developers and financiers that TOD can be profitable.31 Many developers and investors believe that TOD involves higher risks and costs than other types of development. Some conservative lending institutions require the facilities they invest in to have automobile oriented design features because they believe it will ensure a higher financial return.32
High Initial Public Investment Costs
It is widely viewed that TOD can lower infrastructure costs in the long run but the initial TOD infrastructure needs can be considerable and can require extensive public investment. There is no single source of funds for TOD; instead, a number of funding sources are needed. Other municipal infrastructure development often competes with TOD for the same funding sources.
Unsupportive Regulatory Framework
One of the biggest challenges is that the regulatory framework of most municipalities is not supportive of TOD. It is common for cities to have zoning ordinances and land development codes designed for automobile oriented, single-purpose, suburban-scale development.33 The physical requirements of zoning ordinances often restrict the necessary development density for TOD, through such provisions as maximums on floor area ratio (building floor area divided by lot area), height limitations, minimum front setback of buildings, landscaping requirements, lot coverage maximums, and minimum parking requirements. An incentive to use transit is removed when high minimum parking requirements create conditions where parking is plentiful. Many zoning districts require one stall per 200-250 square feet of commercial space and 1.5-2 stalls per housing unit.34 Land use restrictions in established suburban communities commonly segregate land use into single use districts, preventing the mix of land uses integral to TOD. In many cases, the segregation of land uses also prohibits offering a full range of housing types, such as apartments and townhouses, in addition to detached single-family units. All of these provisions prevent or discourage TOD and have contributed to the existing land use patterns that are not transit friendly.
Community Resistance
Resistance from the local neighborhood can pose a challenge to the implementation of TOD. Such resistance comes from residents of existing neighborhoods that may be targeted for transit improvements. Residents often have concerns that TOD will take away from the character of the neighborhood, create localized traffic congestion or lower property values.35 The resistance also comes from new residents, as expressed by choices made to buy homes in the suburbs rather than in TOD.
Belzer and Autler’s performance criteria described above outline a host of expected benefits that TOD must aspire to provide homebuyers in order to be successful. These include greater mobility and housing choices, greater household savings, better livability and quality of life. Why, then, aren’t homebuyers clamoring to buy property within a TOD?
12

The performance criteria recognize abstract societal benefits to homebuyers collectively (which transportation professionals appreciate), rather than the practical benefits that each individual homebuyer will carefully calculate for himself before he makes a home down payment and takes out a mortgage. Conceptually, a homebuyer in a TOD should experience less traffic congestion and a shorter commute. For example, large numbers of people moving into TOD might reduce regional traffic congestion and improve air quality but might practically amount to some small increment of travel time savings for the individual homebuyer. The individual monetary savings to a suburban homebuyer might be several thousand dollars per year. Are these benefits worth the perceived trade-offs? What may initially be a shorter commute may not stay that way the next time the homebuyer changes jobs. The several thousand dollars may seem like pocket change, considering the anticipation of waiting daily for a bus that may be running late. Can the homebuyer afford to be late for work? While TOD might provide a host of benefits experienced by the community as a whole, each person will make the homebuying decision based upon the specific benefits he or she will individually attain. The homebuyer’s personal circumstances may reflect much more complicated considerations that are not captured by the generalized benefits of “reduced traffic congestion” and “increased mobility choices.”
The lack of transportation choice is truly a problem for lower-income persons. This group has the most to gain individually from transit oriented development, especially if it results in more effective transit service. For middle class persons with the affluence to own cars and afford suburban living, a desire for mobility choices may be less valued, considering that the transportation system serves single-occupant vehicle traffic quite well. Private auto travel allows access to the vast assortment of retail services (including goods, services, restaurants, and recreation) available, moving from one destination to another using any route at any time desired. This is not so with transit. The customer must conform shopping plans to what the transit route and schedule allows. If someone already has purchased a car, he or she will be less likely to consider a second mode unless private auto travel cannot reach the desired destination. Middle class persons who have bought a home in suburbia have already chosen their preferred transportation mode. Suburbanites generally do not perceive lack of transportation options as a problem.
Suburbia is where many of today’s homebuyers grew up. Homebuyers seek the separateness and space that low density development affords, where neighbors are close by but not “too close.” For TOD to compete with suburbanization, it must appeal to the individual homebuyer. Yet living in a TOD is nothing less than a major change of lifestyle.
13
C O M M U N I T Y A P P R O A C H E S TO B E C O M I N G T R A N S I T F R I E N D LY
Many of the approaches discussed here can serve as examples of solutions to the challenges described above. The implementation of large scale TOD takes a considerable amount of time, planning, and investment. While TOD projects may not be feasible in all locations, there are many things communities can do to gradually put the needed elements for TOD into place and adapt transit services to better fit the needs of the community. The following describes several approaches communities are taking to become more transit friendly.
Applying Financing Methods for Transit Oriented Development
Municipalities have used TOD financing methods such as local improvement districts, tax increment financing, sales tax increases, public-private partnerships, and grants (federal, state, and local). In “Creating Transit Station Communities in the Central Puget Sound Region: A Transit Oriented Development Workbook,” the Puget Sound Regional Council provides a useful list of federal funding sources for capital infrastructure that can be targeted for TOD purposes.36 In “Land Developer Participation in Providing for Bus Transit Facilities/Operations,” the Center for Urban Transportation Research provides an inventory of mechanisms for engaging the private sector in financing transit improvements.37
Offering Incentives
Most developers believe that TOD entails higher risks and costs than typical suburban style development. Local governments can demonstrate public support for TOD by providing incentives to entice developers to engage in TOD.38 Incentives such as tax exemptions, an expedited permit review process, density bonuses, or a reduction or waiver of certain development fees may tip the scale for a developer when deciding between TOD and some other development design.
Tax exemptions are one of the most powerful incentives used to encourage TOD. The state of Oregon passed legislation that allows local governments to offer a 10-year property tax exemption on eligible projects that include new multiple-unit housing or mixed-use developments located within walking distance of a light rail station or transit route.39 Similarly, projects in targeted areas of Seattle are eligible for a 10-year property tax exemption on the value of housing construction or rehabilitation.40 To qualify for the tax abatement, a project must create at least four new housing units through new construction, redevelopment of a vacant building, or adding on to existing buildings, and a minimum of 25 percent of the new housing units must be reserved for households at or below 60 percent of the median income. The incentive has been popular among apartment developers in Seattle.
An expedited permit review process is also an effective incentive. The approval turnaround time for planned development in many cities can take up to two years.41 Streamlining the permit review
14
process for projects that meet specific TOD related standards provides developers with strong encouragement to pursue TOD. The expedited review incentive has helped TOD around the Metro stations in Washington, D.C. In Bethesda, Maryland, when projects meet the requirements of the optional zoning standard around a Metro station, they are put on the fast track for permit approval.42 The qualifying requirements include high quality construction, pedestrian friendly design factors, and the incorporation of public amenities such as open space and public art. The Puget Sound Regional Council suggests five ways to make the review process easier on developers:
• review or consolidate steps in the process
• simplify the process by making sure the applicable regulations are organized and easily accessible
• review previous appeals to identify regulatory difficulties and opportunities
• allow for flexibility in the permit process
• conduct some of the permit steps in advance of the development proposals43
Reducing or waiving certain development fees is another incentive technique. In Bellevue, Washington, traffic impact fees for new development are based on location, type of development, and availability of alternate modes of travel.44 Traffic impact fees are reduced where there is a high level of transit service.
Coordinating Stakeholders
TOD requires a coordinated effort among all participants, including local government agencies, transit agencies, property owners, developers, institutional investors, businesses, special interest groups, residents, and the general public. With many stakeholders involved, individual agendas can easily conflict. Coordinated and continuous communication during every stage of the TOD process can set realistic expectations, leading to mutually beneficial outcomes.
The Main Street Coalition in Houston, Texas, serves as an excellent model of coordination among stakeholders.45 Houston’s Main Street Revitalization Project is a collaborative effort whose goal is to transform the 8.5-mile Main Street Corridor into a transit and pedestrian oriented corridor, complete with light rail. The Main Street Coalition, a public-private partnership of over 75 stakeholders, including several state and local government agencies, leads the project. The coalition functions to facilitate communication, gather input from stakeholders, leverage funding through several public-private partnerships within the coalition, prevent duplication of efforts, and coordinate plans of all the participants involved. A Master Plan was created to incorporate the goals and plans of each stakeholder.
15

Tailoring Land Use Regulations To Promote Transit Oriented Design
When zoning and land use regulations are not conducive to TOD, there are ways to amend them to better suit TOD needs.46 A solution to an unsupportive regulatory framework is to tailor regulations to better suit TOD needs through methods such as overlay zoning, creating distinctly new zone classifications that constitute TOD districts and establishing more of these districts that favor TOD.47
The first method of amending regulations is overlay zoning. An overlay zone applies supplemental provisions to a specific area within a basic use zoning district, without disturbing requirements of the basic use district. If the overlay requirements conflict with the basic use requirements, the stricter requirements apply. For example, the City of Seattle passed its Station Area Overlay legislation in 2001, which created Station Area Overlay Districts around eight future light rail stations.48 The provisions of the Station Area Overlay Districts, which came from neighborhood plan recommendations, aim to encourage housing development and discourage automobile oriented development near the planned light rail stations. In addition to Station Area Overlay Districts, Seattle also has two pedestrian overlay zones with provisions that lower parking requirements, limit parking lot development, and call for ground level uses to be pedestrian oriented.49
The creation of a new zoning classification is another technique used, in which land use regulations and development standards can be specifically customized to achieve TOD objectives. For example, in Gresham, Oregon, four new zones were created around a light rail station.50 While each of the four zones encouraged a certain type of development, they all allowed an intermixing of uses. The new zones also were required to comply with transit-supportive development standards. The city of Denver, Colorado, is in the process of adopting a transit mixed-use zone which allows more floor area per unit of land than is generally typical of urban development.51 This zone also provides for parking reductions, requires a general development plan, and requires each TOD site to be no less than 10 acres. Design guidelines are given for structures and surface areas. While overlay districts are the addition of regulations over and above the underlying zone, an advantage of creating new zoning districts is to “wipe the slate clean” of earlier regulation. They can be drafted more simply than overlay districts.
Another option involving land use regulations to support transit oriented development and the use of transit service is the adoption of trip reduction ordinances. Trip reduction ordinances are regulations passed by a local government, which require developers, property owners and/or employers to participate or assist in financing transportation management efforts. Ordinances may specify a target reduction in the number of vehicle trips expected from a development based on the standardized trip generation rates. Trip reduction ordinances may also establish peak periods for travel reduction, establish time tables for compliance, and penalties for noncompliance.52
Trip reduction activities specified in ordinances can encompass a wide range of actions, including public transit promotion. There is generally no limit to what activities are conducted, as long as those activities produce trip reduction results. Because the use of transit service is increased where persons rely less on private automobile travel, other efforts to release people from their reliance on cars may also bolster use of transit. Such efforts may include property manager or employer provision of ridematching services for carpooling, provision of vanpool programs (which might
16
also be a service offered by the public transit agency), and offering a guaranteed ride home program for employees of businesses located within transit oriented development and who use commute alternatives. A local government could develop a trip reduction ordinance with requirements to identify and examine potential bus transit development efforts and implement them if they are deemed feasible as a means to mitigate traffic congestion.
Crafting Transit Supportive Design Guidelines
Transit supportive design guidelines are another proactive approach communities are taking to encourage transit considerations in future development plans. A 1993 survey showed that approximately 25 percent of the transit agencies in the United States have some type of transit supportive design guidelines,53 a percentage that has likely increased over the last nine years. Transit supportive guidelines are to be used during a project's design and development review stages by the architects, planners, landscape architects, engineers, local officials, and developers involved. They are a way of letting the involved parties know the needs of transit. Included in the guidelines should be a transit checklist, which can be used as an aid to developers or adopted officially into a municipality’s development review process.54
One of the most effective and nationally known sets of transit supportive guidelines comes from Snohomish County, north of Seattle, Washington.55 “A Guide to Land Use and Public Transportation,” developed by Snohomish County Transit (SNO-TRANS), uses graphics and illustrations in its guidelines for designing transit-friendly projects. The guidelines not only address new development but provide suggestions on how to retrofit car-oriented suburban development over time to become more mixed-use and transit-oriented. The Central Florida Regional Transportation Authority, also known as LYNX, took a proactive approach to transit friendly development by creating the “Central Florida Mobility Design Manual,” a book of explicit and detailed guidelines for integrating a balanced transportation system into the physical design of new growth and redevelopment.56 Based on the comprehensive plans of the 26 cities and three counties in the Central Florida region, the manual includes a mobility design checklist and covers such topics as pedestrian, bicycle, vehicular and transit circulation; transit stops and terminals; and building location and design.
Providing Effective Pedestrian and Bicycle Access
Another key element of building TOD in established communities is making communities more pedestrian and bicycle friendly. For TOD to be successful and for residents to truly rely less on automobiles, it must be feasible to make most routine personal trips by foot. There will have to be a sufficient variety of retail establishments within walking distance of the TOD to meet resident needs. The suburban style development of most established communities is not conducive to other modes of transportation besides the automobile. A number of communities are attempting to change this with street improvements aimed at making walking and bicycling viable modes of transportation. As alternative travel modes are improved, this reinforces the establishment of a transit orientation. Improvements require having pedestrian, transit, and bicycle linkages that are attractive, continuous, direct, and convenient.57
17
In its attempts to become more pedestrian oriented, Charlotte, North Carolina adopted a new zoning category called the Pedestrian Overlay District (referred to as PED). The PED provisions aim to improve accessibility to pedestrians and transit users, increase development potential, encourage a mixture of uses, and encourage the reuse of existing buildings and development that complement adjacent neighborhoods.58 Fourteen corridors have been identified as potential PEDs. Individual Pedscape Plans must be developed for each area before it is zoned as a PED overlay district. The first of these plans to be developed, the East Boulevard Pedscape Plan, sets requirements for new development and calls for improvements such as wider sidewalks, cross walks, landscaping, planting strips, planters, pedestrian lighting, medians, and bike lanes.59 Orlando, Florida, is a community whose focus on bicyclists has gone hand-in-hand with building TOD in established communities.60 In 1990, Bicycle magazine ranked Orlando as the second worst city for bicycling in the country. The ranking inspired City officials to develop a long-range bicycle plan, with the goal of increasing bicycling as a mode of transportation by “implementing a system of safe, economical and efficient bikeway facilities and by supporting bicycle-related programs.”61 Since the plan was completed in 1994, the City has built over 150 miles of bikeways. The 2001 Plan update calls for the construction of an additional 79 miles by 2006 and another 100 miles by 2010. Orlando also placed 94 bicycle racks at public facilities throughout the city and now requires all new developments to provide bicycle parking close to the main entrance. The city's bicycle facilities had improved so much by the year 2000 that the League of American Bicyclists designated Orlando as one of 52 “Bicycle Friendly Communities" in the United States.
Managing Parking
Parking management programs that encourage parking maximums, reduce parking requirements, utilize shared parking, and carefully design and locate parking structures are another way to make policies more supportive of TOD. Parking management can be used to tip the balance toward making conditions more favorable to transit and less favorable to auto travel. For example, Portland, Oregon, does not have minimum parking requirements, but rather sets parking maximums in the downtown area and allows less parking near its MAX light rail stations.62 In Florida, the City of Orlando sets the maximum number of parking spaces for retail at four spaces per 1000 square feet of gross floor area and has a lower than normal minimum parking requirement of 2.5 spaces per 1000 square feet of gross floor area.63 Edward Beimborn et al. suggest that local governments require each proposed development project to explore the feasibility of shared parking on all adjacent parking facilities.64 In San Francisco, the San Francisco Municipal Railway (MUNI) worked with residents and businesses around the 3rd Street light rail project to develop parking recommendations that resulted in more on-street and shared parking.65 Houston’s Main Street Revitalization Project has a parking management plan that will concentrate parking at the southern end of the transit corridor and will integrate parking facilities into mixed-use commercial/residential development rather than stand alone parking structures.66 People will be able to park in the southern end and ride light rail up and down the corridor.
To complement the reduction of parking supply in transit oriented development, a recent change in the federal tax code now allows more employers to use a strategy called “parking cash-out.” Under this strategy, an employer gives employees a choice either to keep a parking space at work or accept a cash payment and give up the parking space. Any employer that makes subsidized
18
parking available for employees in off-street lots and garages can offer parking cash-out.67 Before 1998, federal tax law prohibited an employer from providing an option of cash income or a tax-exempt parking benefit to employees. If an employer chose to give an employee the option of cash in lieu of a parking space, then all parking provided by the employer lost its tax exempt status causing the employer and employee to be required to pay taxes on the value of the parking subsidy. That quirk in the legislation has been remedied so employers now can offer employees a broader choice of commute options without affecting those who opt to keep the parking benefit. As a result of parking cash-out, a significant number of employees will take the cash and choose to ride transit, walk, bike or carpool to work, thus reducing parking demand. According to case studies and research, parking cash out reduces driving to work by 20 percent or more. Benefits from reducing parking demand accrue to individuals, businesses and communities. Individuals benefit by receiving more equitable choices in how they choose to commute. Current federal tax law allows most employers to provide up to $180 per month per employee for parking and up to $100 per month for transit and vanpool co-payments to employees. Businesses, especially small employers who must lease parking spaces, may be able to reduce parking costs. Parking cash-out works best for employers who lease, rather than own, parking although any employer who pays for parking can implement parking cash-out. If employers were to negotiate lease agreements that itemized the cost of parking, then employers would gain better control over the number of parking spaces they chose to lease. This can result in more competitive rents that may attract more employers to the transit oriented development. Employers can reduce their site parking requirements and save on payroll taxes by offering the parking qualified transportation fringe benefit and offering to cash it out. Redeveloping areas in cities, such as transit oriented developments, can lessen their parking requirements if employers participate in this program. This will result in the use of city real estate for higher, more profitable uses that support redevelopment success.
Building Transit Oriented Development At Park-And-Ride Lots
Locating development around park-and-ride lots is a way for transit agencies and local governments to focus development around transit and make more efficient use of the land they already own. King County's Transit Oriented Development Program began in 1998 and is based on the redevelopment of transit centers and/or park-and-ride lots.68 The aim of the program is to control urban sprawl by building housing and other amenities on and around park-and-ride lots. King County hired Economics Research Associates to rank their park-and-ride lots from a private development perspective, then scheduled TOD projects based on that ranking. The Village at Overlook Station, a redevelopment of a five-acre park-and-ride lot, was one of the first pilot projects. The station development, which operates as a park-and-ride lot and a major bus facility, includes two levels of covered parking with over 500 parking stalls to be shared by residents and park-and-ride users, 308 rental housing units, and a 2,400 square foot child care facility for residents and park-and-ride users. This project is the nation's first housing development to be built over a transit station.
In Denver, Colorado, the Regional Transportation District (RTD) works with local communities and developers to redevelop park-and-ride lots and surrounding areas into “transit villages.”69
19

RTD’s function is to help local municipalities create a development plan, make sure the land is available for the right kind of development, and help developers “bring the vision to life.”
Predesignating Transit Corridors
Beimborn et al. suggest that community planning efforts should determine where future major transit services should exist and then predesignate a future system of transit corridors.70 Future core transit routes should be mapped out prior to approving development. Charlotte, North Carolina, provides an illustrative example of this approach.71 The widespread traffic congestion caused by the area’s low density and suburban land development patterns compelled the City of Charlotte and Mecklenburg County to develop the “Centers and Corridors Concepts Plan” in 1994. This long-term growth management guide addressed traffic congestion, new development patterns, and creating new transit options. The major focus of the plan was to integrate transit and land use by concentrating transit supportive development and redevelopment along the five major transportation corridors (the North, Northeast, South, Southeast, and West Corridors). A few years later, the 2025 Integrated Transit/Land Use Plan was developed, which provides the framework for developing rapid transit and transit supportive land use plans for the five corridors, in addition to transit improvements outside the corridor areas. The designs for a new light rail line are currently underway for the South Corridor.
Incorporating Transit Service Into Future Development/Redevelopment
Some communities are proactively incorporating transit into the design phase of future development. For example, in Arlington County, Virginia, transportation demand management (TDM) strategies are required for all new development site plans.72 TDM is a set of specific strategies that foster increased efficiency of the transportation system by influencing travel behavior by mode, time, frequency, trip length, regulation, route or cost. TDM discourages drive-alone commuting through better management of existing transportation infrastructure, services and resources.73 TDM strategies can include both transit-related facilities and service improvements in addition to promotional efforts. TDM strategies also commonly include actions that support the use of transit, such as provision of an emergency guaranteed ride home program and provision of other commute alternatives (carpooling, vanpooling, telecommuting, bicycling) that reduce the need for private auto ownership.
The City of Orlando provides two examples of future development and redevelopment projects that incorporate transit planning as a fundamental design component.74 Orlando is currently in the process of redeveloping its old Naval Training Center (NTC) into a traditional neighborhood community called Lake Baldwin. The Lake Baldwin plan incorporates transit planning aimed at reducing automobile dependence. Transit plans for the redevelopment include timely bus routes linking the community to downtown Orlando, the possibility of rubber wheel trolleys or buses to connect neighborhood centers to the Village Center and the nearby business park, and provisions for a future light rail system which could connect the Village Center with Orlando’s major activity centers.
20
Another example is the Southeast Orlando Sector Plan. The City of Orlando has identified the 19,300 acres of Southeast Orlando as a Future Growth Center, with the Orlando International Airport providing the primary employment base. The proposed uses for the area include a Town Center to serve as the downtown, village and neighborhood centers, and Airport Support Districts. The plan includes a dense, well-connected street system to promote a balanced transportation system. The street system will be designed to allow transit to route directly through the communities or town centers to transit stations, which will be located in the center of mixed-use commercial and residential areas. Pedestrian and bicycle facilities connect all developments in the Southeast Area Plan.
Adapting Transit Services to Suburbia
In addition to retrofitting the physical environment and planning policy framework that will enable transit to effectively operate in its traditional manner, transit systems also are attempting the converse approach, by reworking traditional services to function better in a suburban environment. Suburban style development has had major impacts on the provision of transit services. The traditional radial network of transit routes alone cannot effectively serve suburban communities. To better serve communities, transit agencies are taking various steps to adapt public transportation services to enhance and supplement the radial networks. “Guidelines for Enhancing Suburban Mobility Using Public Transportation,” issued by the Transit Cooperative Research Program, provides a useful description of different types of services that transit agencies are implementing such as express bus services, local area circulators, shuttles, and subscription vans and buses.75 Higher speed express bus service for longer commutes to and from suburbs or between suburbs, often using HOV lanes, has become popular with transit agencies as a means to compete with the automobile in terms of comfort, convenience, and travel time. For example, in Pittsburgh, Pennsylvania, express bus service operates on private bus rights-of-way called busways, allowing buses to bypass traffic congestion.76 Local area circulators and shuttles are designed to supplement and, in some cases, to substitute for major line-haul routes. Such service approaches come in the form of fixed-route, route deviation, and demand-response (often called dial-a-ride). Circulators and shuttles can be a more effective form of service in areas with discontinuous roadways, low-density development, or other factors that make line-haul service difficult. For example, in Allentown, Pennsylvania, the LANTA WhirleyBird Mall Express circulator provides a link between popular shopping destinations and connects to LANTA’s regular route network. Charlotte Area Transit System (CATS) in North Carolina provides another example.77 CATS recently launched smaller neighborhood shuttles in suburban communities that transport customers to and from destinations within the neighborhoods. They stop at neighborhood “hubs” where customers can connect free of charge to CATS line-haul routes that service downtown. In some communities, employers and other sponsors are contracting with transit agencies (public and private) for subscription bus or van services. In this type of arrangement, express bus or van service is offered to a closed group of riders. The sponsor determines the route and pays a set rate. In Texas, Dallas Area Rapid Transit (DART) teamed up with Campbell Centre Management to provide “E/Shuttle,” which transports employees between Lovers Lane Rail Station and the
21

Campbell Centre.78 The shuttle is provided by DART, and the Campbell Centre provides the shuttle operator.
The Suburban Mobility Authority for Regional Transportation (SMART), the transit provider for suburban Detroit, serves as an excellent example of a transit agency adapting its services to better meet the needs of the community. In order to enhance employment-related transportation in the mid-1990’s, SMART changed its focus from fixed route transit to a more flexible system that offered such services as employee shuttles, suburban-to-suburban park and ride routes, demand-response, and flexible routing.79 SMART also designed three programs aimed at helping individuals move from welfare to work. The “Get a Job, Get a Ride!” program provides new employees with a free one-month bus pass. SMART’s Jobline is an automated telephone system that advertises job openings along SMART bus routes. The Job Express program uses small buses to take passengers from the line-haul route directly to the door of their work sites. Advancements in technology also have played an integral role in helping transit, particularly bus service, more effectively serve suburban communities. David Freedman provides a description of bus transit technology advances in the United States, particularly in Montgomery County, Maryland.80 Freedman observes the common perception is that while buses are “old, smelly, noisy, bone-shaking, always late, and stuck in the same … traffic as everyone else,” buses are becoming much more sophisticated and efficient through "high-tech" makeovers. As an alternative to major transportation infrastructure projects that cost billions of dollars, Montgomery County decided to improve its bus system in the early 1990s at a cost of about $4.5 million. The improvements included installing global positioning receivers and communications gear on 250 buses, setting up transmitters, and adapting the county's traffic control center to handle a new bus dispatch system. The global positioning system (GPS) constantly transmits bus locations to dispatchers at the traffic control center. If there are any problems, the dispatchers can relay instructions to the bus drivers through a small screen next to the bus dashboard. For example, if a bus is running late, a dispatcher can direct the driver to skip stops or tell a bus behind it to jump ahead. If a bus runs into traffic problems, a dispatcher can give the driver rerouting directions to avoid congestion. The traffic control center can also remotely operate the county's 800 traffic signals to ease traffic jams, or extend a green light for a bus that is behind schedule. Bus ridership went up 20 percent between 1996 and 2001. The ability to constantly track bus locations and timeliness through GPS is helping transit agencies come up with more efficient routes and schedules. Many buses are also being equipped with “people trackers” that allow buses to count each new rider through a tripped light beam or pressure on a floorboard. This further aids transit agencies in implementing the most appropriate route frequencies and bus sizes for each route based on the different passenger loads throughout the day. Transmitted GPS data is also being used for “smart signs” at bus stops that display how long it will be until the next bus arrives. Smart signs are currently being used in Montgomery County, Maryland; King County, Washington; and Minneapolis/St. Paul, Minnesota. Similar GPS advancements include King County's BusView system that allows riders to access minute-by-minute locations of buses over the Internet. They also include the MyBus system that allows riders to access bus arrival times over the Internet or web enabled cell phones and hand held computers.
22

Another advancement to bus service is the development of bus rapid transit (BRT) systems. A BRT is an express bus with limited and widely spaced stops that has its own travel lane, allowing it to bypass traffic. Riding BRT can be compared to riding commuter or light rail. Because BRT offers a small number of stops, smaller feeder buses usually supplement them. Cities that have recently implemented BRT systems include Washington, Los Angeles, and Pittsburgh. Continually advancing technology holds great potential for what transit systems will be able to do in the future. Freedman writes,
Imagine, then, calling a transit company that sends a bus 15 minutes later to the corner near your home, from which you're whisked to a BRT that takes you the 20 miles to downtown in just 25 minutes, even in rush hour. Eventually the system may be smart enough to automatically track your location by cell phone, so that all you need to do is say into the phone, “I'd like a bus to the Williamstown Mall,” and then wait a few seconds to hear how soon your custom-programmed bus will pull up beside you.81
Considering how rapidly bus technology is changing, that scenario may actually come true. For now, many transit agencies have strived to make their services more user friendly by creating comprehensive websites where users can access information such as routes, schedules, trip planners, service changes, and transit news.
Commuter assistance programs also play a part in promoting transit usage. For example, the Commuter Assistance Program in Arlington County, Virginia, provides a website called CommuterPage.com designed to encourage alternate modes of transportation.82 CommuterPage.com offers a vast array of alternative transportation services such as daily commuter news, complete information on all the public transit systems and several private systems in the Washington, D.C. area, information about carpool and vanpool services, weather conditions, air quality reports, traffic alerts, and online ordering for transit passes. The site recently introduced CommuterPage.com Mobile Services, which allows users to access commuter news and schedules for Arlington Transit and Arlington Metrobus from mobile devices such as Palms, Pocket PCs and web enabled cell-phones. CommuterPage.com receives approximately 72,000 visits per month.83
Offering Location Efficient Mortgage®
In addition to physical design, regulation, and transit service approaches to creating transit friendliness in established car oriented communities, another approach uses monetary incentives for homebuyers to purchase homes near transit. Known as a Location Efficient Mortgage (LEM)® program, it encourages the development of efficient, environmentally progressive communities to reduce urban sprawl and dependence on the automobile.84 This program grants homebuyers larger loans and lower down payments than those for which they would normally qualify when they choose to live in close proximity to public transit and major retail and employment centers. LEM® takes into account how much money households can save each year by using public transit and applies that to their buying power, resulting in a potential increase in credit extension of several thousand dollars. The “Location Efficient Value” of a home is calculated by a computerized mapping tool that assigns values based on residential density, automobile ownership,
23
annual income, and access to public transportation and major retail and employment centers.85 The LEM® is an example of a tool that addresses the power inherent in the home purchasing decision made by individuals. While TOD is touted for the good it does for society, the LEM® creates a reason why it makes good sense for the individual to choose transit. It creates a personal benefit. Seattle, Washington, was the first city to team up with Fannie Mae to offer LEM®. In order to participate in the program, homebuyers must agree to owning no more than one car and live within one quarter mile of a bus line or one half mile of a train or light rail system.86 As an added benefit and an incentive to use transit, participants in the program automatically qualify to receive a 25 percent discount on an annual one-zone bus pass for two years.87 They also receive free membership and discounted fees for the car-sharing Flexcar program. The LEM® Program was developed by the Center for Neighborhood Technology, the Natural Resources Defense Council, and the Surface Transportation Policy Project, with support from Fannie Mae, with an aim of linking home ownership and public transit.88 The program has also been launched in Los Angeles, San Francisco, and Chicago. Similarly, the Metropolitan Atlanta Rapid Transit Authority (MARTA) is providing marketing support and transit passes for borrowers of the Fannie Mae Atlanta Smart Commute housing initiative.
Offering Car Sharing Programs
A service strategy that shows promise in supporting the mobility of persons choosing to live in transit oriented development is car sharing programs. These are short term auto rental programs, either private businesses or cooperatives, that make sense to persons who do not need a car to commute to and from work and who do not drive more than about 7,500 miles per year. Car sharing programs enable persons to do away with private auto ownership by making available rental cars, vans and trucks. Some survey data show that transit trip making of persons increases to 53 percent of total trips after joining a car sharing program, up from 35 percent of total trips prior to joining.89 Members of car sharing programs can reserve a vehicle by phone or by Internet, usually 24 hours per day, seven days per week, and rent it for as little as an hour, or as much as a week or more. Members no longer have to be involved with repairs, insurance or parking. There are at least 46 cities in the United States and Canada that currently have car sharing programs.90
Overcoming Community Resistance Through Public Education
While progress has been made on many fronts in the areas of physical design, public policy, transit service improvements, and technology to build transit oriented development in established communities, perhaps the most difficult challenge is addressing resistance from the communities themselves. Many suburban residents do not want transit services brought onto their streets. Their concerns are about safety, noise, fumes, and litter and a general fear that public transportation will bring an undesirable social element into their neighborhoods. Transit agencies have taken steps to make transit more acceptable to suburban communities. For example, employing public
24
involvement processes in planning the TOD allows leaders to address community concerns and gather valuable input from citizens. Such input can result in design guidelines for both the land development as well as the transit service itself, to preserve the distinct character of each neighborhood. To address community concerns, transit agencies have provided smaller transit vehicles, clean-fuel or electric vehicles, and improved bus stop maintenance. For example, Arlington Transit (ART) in Virginia supplements the regional Metrobus system with smaller, quieter, neighborhood-friendly vehicles that operate on clean-burning natural gas.91 ART works with neighborhood civic associations to identify where the transit needs are and to address any resident concerns. Charlotte, North Carolina, implemented an extensive public involvement plan when alternative transit options were being explored for Charlotte’s South Corridor. During each phase of the Major Investment Study, residents and stakeholders were educated about the transit opportunities and challenges in the corridor, and their input was gathered to identify community needs, issues, and concerns.92 Similarly, Seattle’s Station Area Planning Program also included a successful community outreach program. The outreach involved citizens in the station area planning process through the establishment of Station Area Advisory Committees in the area of each proposed light rail station.93 A more extreme approach was taken in the Atlanta metropolitan area. The Atlanta region is well known for the massive population growth and suburban sprawl it experienced in the 1980s and 1990s, resulting in some of the worst traffic conditions and air quality in the nation. In the past, the 12 counties surrounding Atlanta put up strong resistance to creating a regional bus system, expressing fear that transit would bring city crime to their communities.94 In 1998, Georgia Governor Roy Barnes created the Georgia Regional Transportation Authority (GRTA), giving it broad powers to deal with local governments. GRTA quickly proposed a regional express bus system and used a “carrot and stick” approach by making road money available to counties willing to participate. By April 2002, 11 of the 12 suburban counties had adopted the proposal. Upon review of the performance criteria of Belzer and Autler, what seems missing is a measure of the broad appeal that TOD should deliver to homebuyers who otherwise move to the suburbs. The existing criteria frame the issues according to outcomes enjoyed by society as a whole rather than specific value to the individual. Criteria assessing positive societal outcomes are useful for government planners in order to decide the best actions for the region. However, these actions should be complemented with a criterion for assessing how the individual homebuyer or commuter will make locational and transportation decisions based upon what is best for him or herself. This is a perspective that has not been well explored by the literature addressing transit oriented development. Developers will continue to build large homes with three-car garages on one half-acre lots until there is some indication that more homebuyers are willing to buy or lease into TOD.
To compete with suburbia, TOD must offer suburban amenities—the sense of spaciousness, peacefulness, newness, privacy, exclusivity, etc., that suburbanites desire, and at the same time be dense enough to offer what suburbia cannot. That is, for example, the variety of land uses to
25
enable comparison shopping on foot, as well as lively night life, and a stimulating arts and cultural scene. TOD may even be able to trump the image of suburbia being child friendly, as more suburban parents question the lack of sidewalks for children to safely walk and bicycle to school. The North Natomas Transportation Management Association in Sacramento, California, describes a community that is using an extensive collaborative process to create a child friendly transit oriented development:
The City of Sacramento envisions a new urban form for North Natomas consisting of a well-integrated mixture of land uses, interdependent on quality transit service. Fourteen neighborhoods surround the Town Center. The Town Center will be the heart of the community. Each of the surrounding neighborhoods has an elementary school as its focal point….”95
Achieving such dual appeal would attract newcomers to TOD and quell resistance from existing suburban residents.
While it has taken more than 50 years of suburban development patterns to create the challenges of building transit oriented development in established communities, it is probably realistic to expect that progress will be slow and incremental as existing communities undergo redevelopment. It may take at least several decades, if not another 50 years to turn around the adverse impacts that suburbanization has made upon transit. On the other hand, ever quickening access to reliable information in this age of telecommunications may serve to accelerate changes in cultural attitudes if not only to change investment decisions. Over the 50 years of suburban development, homebuyers have attempted to buy larger homes, as can be found in the suburbs, even though family/household size has continued to shrink. However, real estate is not necessarily always the best investment vehicle, and the common financial advice to purchase “as much house as you can afford” may be a myth that has run its course. While storage warehouses have sprung up all across suburbia to contain possessions that no longer fit in people’s homes, a countertrend has emerged in which there is a renewed interest in simplified living. If this countertrend prevails, more homebuyers and tenants may consider anew the personal advantages of living in a TOD. Considering that, for every $1 spent on TOD, another $1,400 is spent on conventional suburban development, the general public also may simply lack basic knowledge about what TOD is and what it looks like. A TOD may not yet have been built in their urban area. As more TOD is built and advertised and more homebuyers are exposed to this option, the market may gain momentum with increased awareness spurring more TOD home purchases. Regardless of how these trends play out, the resistance of established car oriented communities to adopt TOD features suggests that there is a general lack of understanding of the suburban home buying and leasing market that transit visionaries hope to persuade. This lack of knowledge can be initially addressed through focused market research to determine how TOD can be provided to maximize its appeal.
26

C O N C L U S I O N S
This report provides a synthesis of the major steps that established car oriented communities have taken to transform themselves into more transit oriented communities. The majority of American communities that developed after World War II are served by private automobile transportation rather than public transportation. Several communities have begun retrofitting efforts to encourage the use of alternative modes of transportation. Based upon this synthesis of conceptual information about TOD as well as the experience and insights offered by municipal planners, transit professionals and other practitioners, several observations and conclusions can be drawn:
1) The acceptance and adoption of TOD in established communities is an incremental process that may take decades to come to fruition.
2) Developing transit oriented communities will have a greater chance of success when a combination of tools are used together, including regulations such as zoning and parking ordinances, together with incentives such as tax exemptions, an expedited permit review process, density bonuses, or a reduction or waiver of certain development fees.
3) For TOD projects to be successful, they must strive to capture most of the traditional suburban amenities that are so valued by suburbanites, such as the perception of quiet, spaciousness, light, privacy, safety, and security, while capitalizing on its unique strengths not shared with suburbia. These strengths include more stimulating commercial opportunities within walking distance and a cohesive sense of community.
4) TOD has the capacity to break ground in our culture. While suburbia offers socio-economic homogeneity, TOD offers the opportunity to arrange cultural and socio-economic diversity that is appealing. For example, TOD can be designed to increase livability for children, the elderly, and persons with disabilities. Development policies in TOD to intersperse affordable housing with middle-income and affluent housing can soften the demarcation between “us” and “them” and alleviate the desire to find socio-economic sanctuary in suburbia. Social programs, education, and services that elevate low-income persons from poverty and revitalize urban neighborhoods, have the potential to slow suburbanization.
5) For TOD to be successful and for residents to truly rely less on automobiles, residents must be able to make most routine personal trips by foot. There will have to be a sufficient variety of retail establishments to meet resident needs, within walking distance from home or by uncomplicated transit trips. This suggests finding a workable balance between providing sufficient development density while preserving other elements of suburban appeal.
6) TOD retrofitting has the best current chance of success in areas with initially amenable markets, such as high concentrations of single adults, “empty nesters,” childless couples, and immigrants.
7) TOD approaches can differ significantly from place to place depending upon factors and
27
circumstances such as land development regulations, zoning ordinances, market factors, development opportunities, available public transportation services, resources, and the regional economy. For example, Atlanta’s Lindbergh City Center covers 47 acres, is based around a rail station, and includes major housing, retail, and office space. King County’s Village at Overlook Station, on the other hand, covers five acres, is built over a bus station, and includes rental housing units, a park and ride, and a child care facility.
8) New technologies add some degree of optimism for the future of transit to better serve suburbia as it exists today.
This report included a brief presentation about the dominant suburban land development pattern of the last 50 years. This recognizes that society has found certain positive benefits from suburban life while lessening the capacity of traditional transit systems to serve the public. Understanding the forces behind the growth of suburbia sheds some light on those main areas to focus upon. This enables us to consider ways to reverse the forces that have contributed to transit’s deterioration. The forces and trends that reinforce suburbanization and thwart transit would not necessarily be a problem—some would argue that the suburban lifestyle, as chosen by many people through their home buying decision, should not be altered to accommodate transit, but rather transit should reinvent itself to serve the suburbs or stay out of the suburbs altogether. However, this report has also identified concerns that suburban development may have created problems for individuals as well as society as a whole. Additionally, private automobile transportation is available and affordable to the majority of us, but not all of us. Those not served by automobile transportation are sorely disadvantaged. And so it would seem that the solution must include efforts in both directions. This includes transit agencies maximizing their ability to extend effective services to suburbia. It must also include attracting people back to urban life through the creation of transit oriented development to enable transit to better serve the public.
28

APPENDICES
29

A P P E N D I X A : C A S E S T U D I E S
30
Charlotte, North Carolina
Charlotte, North Carolina, serves as a prime example of an automobile dominated community committed to moving towards transit oriented development and growth management. Over the past several decades, Charlotte and its surrounding areas in Mecklenburg County have experienced massive growth. Charlotte was designated as the second fastest growing American city in the 1990s.96 Its low density, suburban style land development patterns over the years have resulted in a classic case of suburban sprawl, with widespread traffic congestion throughout Mecklenburg County. The projected 50 percent increase in population over the next 25 years and the steadily increasing traffic congestion compelled the City of Charlotte and Mecklenburg County to develop the “Centers and Corridors Concepts Plan” in 1994.97 This long-term growth management guide addressed traffic congestion, new development patterns, and creating new transit options. The major focus of the plan was to integrate transit and land use by concentrating transit supportive development and redevelopment along five major transportation corridors. These are the North, Northeast, South, Southeast, and West corridors. The Charlotte/Mecklenburg area has a radial, corridor structure that originates in the City Center and goes out to the corners of Mecklenburg County and into adjacent counties. Sixty percent of Charlotte's jobs fall within the five corridors.98 In 1998, the City of Charlotte and Mecklenburg County developed the 2025 Integrated Transit/Land Use Plan, a long-range plan that provides the framework for developing rapid transit and transit supportive land use plans for all five major corridors, in addition to transit improvements outside the corridor areas.99 This plan directs future high-density residential and employment growth around transit stations and major activity centers, where the growth can best be supported by transit services.100
Public Support
Once the necessary agencies and governments endorsed the 2025 Plan, the state gave permission to place the half-cent sales tax referendum on the ballot to fund the plan. Since the city cannot officially endorse bonds, the Charlotte Chamber kicked off a campaign in support of the sales tax.101 In addition, a public education campaign to explain the components and goals of the 2025 Plan was led by Corporate Communications. Since citizens were already aware of the traffic congestion problem, it did not take much convincing. Public support of the Charlotte/Mecklenburg County initiative was made evident in November 1998 when citizens of Mecklenburg County passed the sales tax referendum to fund the implementation of a long-range plan that integrated land use and transportation. The sales tax generates about $1 million a week for expanded transit service and other transportation improvements.
Corridor Transit Planning
After the 1998 passage of the referendum, the Metropolitan Transit Commission (MTC) was created to manage the revenue brought in by the new tax and oversee transit service.102 The first step the MTC took in the planning process was to initiate Major Investment Studies (MIS) in all of the five major transportation corridors to choose a Locally Preferred Alternative (LPA) for each
31
corridor. The LPA defines the mode of transit (commuter rail, light rail, or bus rapid transit) chosen for a corridor and the route it will take. The MIS process was a collaborative effort that involved the Charlotte Area Transit System, the Charlotte-Mecklenburg Planning Commission, the Charlotte Department of Transportation, a program advisor, and corridor consultant teams.
South Corridor
The South Corridor was the first corridor for which the MTC completed a Major Investment Study and started the preliminary engineering stage.103 The other four corridors are still being studied. A light rail route that extends 11 miles from Charlotte’s Uptown to the Town of Pineville was selected for the South Corridor. The new light rail line will make use of an existing rail bed.104 The City of Charlotte owns part of the necessary right-of-way and is negotiating with Norfolk Southern for the rest. The South Corridor Project is expected to cost $350 million, with a proposed combination of federal, state, and local funding.105 The line is expected to begin operating in 2006. An extensive public involvement plan was developed to educate citizens about the opportunities and challenges for transit development in the South Corridor, gain input from the various stakeholders involved, and to identify community needs, issues, and concerns.106 During each major phase of the MIS study (scoping phase, definition of alternatives, evaluation of alternatives, and recommendation of the LPA), public meetings were held to “explain findings and solicit input.” Other outreach efforts included, among other things, direct mail, newsletters, press releases, advertising, a video run on the local government television channel, and MTC and Planning Commission staff appearances on a live call-in show. The MIS identified 19 potential station locations.107 To narrow that number down, a series of public meetings was held to gather citizen input on such matters as land use, station area planning, urban design, station location evaluation criteria, and the PE/EIS process. The end result was the selection of locations for 15 full-time stations and one special events station. The public’s response to the chosen station locations was positive. So far, draft station area plans have been completed for seven of the locations.108 The goal of the plans is to ensure the successful integration of the transit stations into the surrounding communities. The business community has also been supportive of the South Corridor Light Rail Project. Over $250 million in private business investments have already been made in the project area, and more are underway.109 At this time, however, there are no financial incentives for businesses to invest in the South Corridor.110
Transit Station Area Principles
In November of 2001, Charlotte City Council adopted the Transit Station Area Principles, and included them as a section of the General Development Policies. The Transit Station Area Principles address land use and development, mobility, and community design.111 The principles serve as a guide for the development and redevelopment of areas around transit stations to permit increased land use density and encourage people to use transit. The policies will be applied within a half mile of identified rapid transit stations, and will promote a mixture of complementary transit supportive land uses, increased land use intensity, pedestrian and bicycle systems, interconnected
32
street networks, reduced parking requirements, shared parking, pedestrian oriented streetscape and site design, and open spaces to serve as activity centers.112 More specific land use and urban design plans will be developed for each station area throughout the five rapid transit corridors. Each station area will have different characteristics.
Joint Development Principles
In addition to the Transit Station Area Principles, the MTC and the Charlotte City Council also adopted Transit Station Area Joint Development Principles. The purpose of the principles is to provide a framework for local governments to encourage transit supportive development at the transit stations.113 The principles, which were developed by CATS in conjunction with the Charlotte Mecklenburg Planning Commission and other City departments,114 encourage placing public facilities at or near transit stations, providing basic public infrastructure in station areas, developing a variety of affordable housing near stations, developing public/private partnerships aimed at encouraging TOD, providing TOD incentives to the private sector, removing barriers to TOD, and promoting a healthy mix of business development around the stations.115
Pedestrian Overlay Districts
In its attempts to become more pedestrian-oriented, Charlotte adopted a new zoning category called the Pedestrian Overlay District (referred to as PED). The PED provisions aim to improve accessibility to pedestrians and transit users; increase development potential; and, encourage a mixture of uses, the reuse of existing buildings, and development which complements adjacent neighborhoods.116 Fourteen corridors have been identified as potential PEDs. Individual Pedscape Plans must be developed for each area before it is zoned as a PED overlay district. The first of these plans to be developed, the East Boulevard Pedscape Plan, sets requirements for new development and calls for improvements such as wider sidewalks, cross-walks, landscaping, planting strips, planters, pedestrian lighting, medians, and bike lanes.117
Recent Transit Improvements
The first line of rapid transit (the South Corridor Light Rail) will not open until 2006. In the meantime, CATS has taken other steps to expand and enhance transit service in suburban areas. CATS recently launched smaller, neighborhood shuttles in suburban communities that transport customers to and from destinations within the neighborhoods and stop at neighborhood “hubs” where customers can connect free of charge to CATS Line-Haul routes that service downtown.118 The neighborhood shuttles include fixed route and demand-response (similar to taxi) services. Five of these routes were started in October 2001, one was started in June 2002, and eight more are planned to start in October 2002. So far the response to this new service has been positive. Ridership along these routes has been steadily growing and customers are urging CATS to expand the service to more places. CATS has also improved transit service in suburban areas by increasing the frequency of the Express Bus service from the suburbs into downtown Charlotte.119 They increased the headway of one route from 30 minutes at its peak to 12 minutes, and another route from every 25 minutes to every 15 minutes.
33
The initiative to create new services and enhance existing services came about through customer requests, bus overcrowding (on Express Bus routes), and a Countywide Transit Service Study that took place in 2000. These services are funded through revenues generated by fare boxes and the half-cent sales tax.120
Conclusion
It is clear Charlotte is taking proactive steps to become more transit-friendly through its corridor transit planning, pedestrian overlay districts, and transit service improvements. Charlotte's 2025 Integrated Transit/Land Use Plan is a major undertaking and the first leg of the plan, the South Corridor, seems to be running smoothly. While it is too soon to gauge the results of Charlotte's TOD efforts, there is much promise for future success.
34

Denver, Colorado
The City of Denver, Colorado’s “Mile High City,” is a vibrant business community that ranks among the nation’s most livable cities. Denver also has the distinction of being the ninth most congested city in the country. With forecasts calling for an additional one million people to move to the Denver metropolitan area over the next twenty years, the overall population growth of over 38 percent will place a severe strain on the regional transportation networks.121 The Regional Transportation District (RTD), a public agency created by the Colorado General Assembly in 1969, operates as the public transportation system for the seven-county service area in the Denver metropolitan area.122 With annual boardings of close to 82 million passengers, RTD provides public transportation service to 38 municipalities plus two city/county jurisdictions. In addition to a large regional system of 180 fixed bus routes and other services, RTD also operates a 14-mile light rail transit system.123
Blueprint Denver
The Denver City Council approved Blueprint Denver, the city's first integrated land-use and transportation plan, in March 2002.124 A supplemental plan to the City’s Comprehensive Plan 2000, Blueprint Denver was developed to create a framework for a more effective and predictable land use code, a coordinated and multimodal transportation system, and the development of design principals for neighborhoods and residential areas. Six guiding directives of Blueprint Denver include: rewriting the zoning code; directing growth to Areas of Change; maintaining the character and quality of life in most residential areas; encouraging mixed land uses to reduce the number and length of auto trips; focusing on moving people rather than autos through neighborhoods; and investing in public infrastructure to support Blueprint Denver.125
FasTracks
The RTD in cooperation with local communities undertook detailed studies in eight major transportation corridors in the Denver metropolitan region. From these efforts, a proactive plan called FasTracks was developed in an attempt to balance public transportation needs with the anticipated future population growth. The FasTracks plan calls for improved rapid transit (i.e., light rail, commuter rail, bus rapid transit and bus/carpool lanes), expanded park-and-ride service; and enhanced pedestrian and bicycle access to transit stations.126 Implementation of the FasTracks plan would be funded by a proposed 0.4 percent RTD sales tax increase, which would bring the total RTD tax to one percent.
The T-REX Project
The Denver metropolitan region is also the site of “a unique, landmark collaboration between the Colorado Department of Transportation (CDOT), the RTD, the Federal Highway Administration (FHWA) and the Federal Transit Administration (FTA).”127 Initiated by the Southeast Corridor Project Team, this project is now officially called the Transportation Expansion Project, also known as T-REX.
35
The Southeast Corridor of I-25 and I-225 in Denver connects two major employment centers, the Denver Central Business District and the Southeast Business District, which includes the Denver Tech Center, Greenwood Village, Inverness Business Park, Meridian Business Park, and the new city of Centennial. This corridor currently has 180,000 employees and is expected to add an additional 150,000+ during the next 20 years. Similar statistics are found on the residential side as well, with southeast Denver being one of the fastest growing areas in the country.128 The findings of a 1992 Denver Regional Council of Governments (DRCOG) congestion study revealed that expected growth in the corridor had already been surpassed and the I-25 highway had surpassed its estimated maximum capacity. The DRCOG study also revealed a pattern where traffic volumes were rising even faster than increases in population and employment in the corridor. The study conclusion was that further expansion of the corridor’s highway would not be adequate, that some form of mass transit element, such as light rail, should also be included. The result was a collaborative effort between CDOT and RTD that included funding partners from FHWA and FTA, with support by two locally approved bond issues. The final project, a modern integrated network of highway and light rail options totaling $1.67 billion, was funded without any new or increased taxes.129
Examples of Transit-Oriented Development
The RTD is currently working on several transit oriented development projects. The following three are representative of RTD’s efforts.130
The Point Project Denver’s Five Points neighborhood has become a showplace for TOD with its combination of distinct land use patterns and urban design to create transit villages at light rail stops. The Five Points residential and business community was plagued by economic hardship for several decades. Since the introduction of Light Rail in 1994, Five Points has been experiencing new development. One example is The Point Project currently under construction. The Point consists of 68 residential units, half rental and half for sale, with some offered at affordable rates, 16,000 square feet of office space and 6,100 square feet of retail.
I-25 and Broadway The I-25 and Broadway Light Rail station is a busy station along RTD’s Southeast Corridor. It is also the terminus of a new light rail extension currently under construction. Due to this light rail investment, a private developer has initiated a master plan for a dense transit village for the 50+ acres of land acquired adjacent to the light rail station formerly owned by the Gates Rubber Company. Although in its formative stages, plans call for over 4,000 residential units and 2 million square feet of commercial space.
36
Union Station The Denver Union Station is currently the subject of a study to transform it to become the premier transit and transportation hub for the metropolitan Denver area. Among the elements included in the master plan are the addition of several regional light rail lines, several high speed commuter rail lines, regional and local bus service, taxis and bicycles. The potential for private development opportunities for the surrounding parcels is also being examined.
Conclusion
The Denver metropolitan area has taken proactive steps to manage the transportation issues and challenges that result in being one of the country’s most desirable and livable areas. The RTD was created to provide a regional framework to address public transportation needs. The metropolitan area has taken a comprehensive and balanced approach by developing an integrated land-use and transportation plan. A unique, collaborative approach between highway and transit agencies has been undertaken to address the long-range transportation needs of regional corridors. RTD’s light rail projects have spurred transit-oriented development near its stations.
37
Atlanta, Georgia
The Atlanta metropolitan area, an economic hub of the Southeast, is famous for the explosive population growth and suburban sprawl it experienced in the 1980s and 1990s. Land development occurred at a much faster rate than population growth. Between 1990 and 1996 the Atlanta region’s population grew by 16 percent, while the amount of developed land grew by 47 percent.131 The lack of geographic barriers, such as mountains, lakes, or oceans has been a primary contributor toward the sprawling development pattern.132 Due to this dispersed development Atlanta has a car-centered culture, earning the dubious rankings of the highest vehicle miles traveled (almost 35 miles per day per capita)133 and longest daily commutes in the nation.134 The development pattern and resultant automobile use has had a severe impact on the region’s air and water quality and green space.135 Due to having some of the worst traffic congestion and air quality in the country in the mid 1990s, the Atlanta Metropolitan Area governments, including the Metropolitan Atlanta Rapid Transit Authority (MARTA), were pressured to do something.136 MARTA, however, was limited to serving only those municipalities in its tax base—Fulton and DeKalb Counties and the City of Atlanta. Attempts to create a regional transportation system to serve the entire Atlanta regional area to help alleviate traffic congestion were met with strong resistance from the suburban counties surrounding Atlanta. The counties voiced fear that transit would bring city crime to their communities.
Georgia Regional Transportation Authority (GRTA)
The 13 counties in the metropolitan area were issued a serious non-attainment air quality rating by the U.S. Environmental Protection Agency (EPA).137 As a result of the poor air quality rating, the federal funding for new highway projects was cut off for the Atlanta metropolitan area due to failure to attain Clean Air Act standards. The EPA action prompted Georgia’s governor to create the Georgia Regional Transportation Authority (GRTA) in 1998. GRTA's mission was to reduce traffic congestion, improve air quality, and direct new growth.138 The State granted GRTA broad powers to deal with local governments and the authority to finance mass transit and other projects that aim to alleviate air pollution. GRTA approval became required for all land transportation plans and major developments that affect the Atlanta region’s transportation system, although local governments can overrule a GRTA veto with a three-fourths majority vote.139 After its inception, GRTA quickly proposed a regional express bus system and used a “carrot and stick” approach by making road money available to participating counties. By April 2002, 11 of the suburban counties had adopted the proposal.140 GRTA's preliminary Regional Express Bus Plan consists of 37 routes serving major activity centers, connecting to MARTA and local bus service. 141 Where available, most of the routes will originate at park-and-ride lots and operate on high-occupancy vehicle (HOV) lanes. The majority of the routes will be implemented between 2003 and 2005. To pay for the new regional transit system, the counties will cover bus operating costs and GRTA will give each county bond funds provided by the State Road and Tollway Authority (SRTA) for road improvements. The program will include 48 arterial road improvement projects valued at over $260 million, which were selected and prioritized by the individual counties.142
38

Atlanta Regional Commission Initiatives
The Atlanta Regional Commission (ARC) is the regional planning agency for metropolitan Atlanta. Through its Community Choices program, ARC has created several initiatives aimed at promoting quality growth.143 One of the most notable of these is the Livable Centers Initiative (LCI). LCI, part of ARC’s 25 year Regional Transportation Plan, began in 1999 and awards $1 million per year for five years to local governments and nonprofit agencies to fund land use and transportation planning studies. ARC funding is awarded to studies that demonstrate the following concepts:144
• connecting homes, shops, and offices; • enhancing streetscape and sidewalks; • emphasizing the pedestrian; • improving access to transit and other transportation options; and • expanding housing options.
ARC has an additional $350 million to help implement the more promising findings of these studies. The Quality Growth Toolkit, created by ARC for local governments and the public, is important to the Community Choices Program. The toolkit offers techniques that address such topics as developing conservation districts, corridor redevelopment, transit-oriented development, infill development, mixed-income housing, overlay districts, and traditional neighborhood development.145 The toolkit was developed from the best practices at work both locally and nationally and attempts to create a set of strategies that make sense for the Atlanta Region.
Metropolitan Atlanta Rapid Transit Authority TOD
In its role as the primary regional transit provider, MARTA has embraced the TOD approach. MARTA currently has six TOD projects either being planned, in the negotiation stages, or under construction around its stations.146 Two major MARTA TOD projects include the Lindbergh City Center and the Medical Center TOD.
Lindbergh City Center The Lindbergh City Center, developed by Carter & Associates, is the largest TOD project under construction in Atlanta. The 47-acre master planned development surrounds MARTA’s Lindbergh station, and upon completion will include a twin tower office complex; retail space; and hotel, apartment, and condominium development.147 The land for the project was made available by MARTA from excess land originally acquired for the station and its park-and-ride lot.148 The TOD will feature a Main Street above the underground train station with dining, shopping, a movie theater, and a hotel.149 MARTA has already invested approximately $100 million in the project, mostly for station improvements, but forecasts a significant return on its investment.150 According to Nat Ford, MARTA’s General Manager and CEO, MARTA expects to bring in up to $10 million each year in ground leases and fare revenue from estimated ridership increases.151 Completion of the Lindbergh City Center is scheduled for 2005.
39
MARTA partnered with Bell South to build and occupy the twin tower office complex.152 As part of its Metro Plan, the communications services company is consolidating 23 of its suburban and urban offices into three business centers located along MARTA’s rail line within easy walking distance of stations.153 A key goal of Bell South's Metro Plan is to help alleviate traffic congestion and air pollution in Atlanta. Bell South is also constructing parking decks at MARTA’s end-of-line stations for its employees.154 As an added incentive to use public transit, Bell South gives its employees MARTA passes.155
Medical Center The Medical Center TOD, which is currently under construction, is a 17-acre mixed-use development located between MARTA’s Medical Center Station and Saint Joseph’s Health System campus.156 Plans call for a three-building medical office complex, multi-family housing, an expanded pedestrian plaza with retail potential, direct access to MARTA’s Medical Center Station and Saint Joseph’s campus, and an underground circulation corridor for physicians and employees. The project is a public/private partnership between MARTA, St. Joseph’s Health System, Carter & Associates, and the Harold A. Dawson Company.
Conclusion
The Atlanta Metropolitan Area offers an illustrative example of how unplanned and unrestrained development creates transportation problems. While the threat of loss of federal highway funding provided the impetus to create GRTA, the resulting regional approach has already provided positive outcomes. MARTA aggressively pursued public-private partnerships in TOD projects.
40

Orlando, Florida
The City of Orlando, the heart of the Central Florida Region, is located in Orange County, Florida. Orlando holds the region’s largest concentration of employment and population and serves as the hub of government, financial, legal and corporate businesses. The Central Florida Regional Transportation Authority, also known as LYNX, provides transit service to Orange County as well as Seminole and Osceola Counties. LYNX provides over 70,000 rides each day, and has been recognized as the fastest growing transportation system in the United States.157 One of the challenges LYNX faces is that because it serves a tri-county area it has no dedicated funding source.158 Annually, it is up to each individual jurisdiction within the service area to provide funding for transit service. The City of Orlando commits 50 percent of it Gas Tax Revenue (about $3.5 million) per year to LYNX for transit service.159 The City of Orlando has attempted to take a multi-modal approach to transportation. Through its land use codes, transportation planning and strong transit system, Orlando is working hard to encourage walking, bicycling, and public transit as viable modes of transportation.
Land Development Code
Through the City of Orlando's Land Development Code, efforts are being made to encourage a mix of land uses and higher development densities.160 Instead of having straight commercial zoning districts, Orlando has Activity Center Districts that promote a mixture of commercial, office, and residential uses. Some zoning districts also require minimum densities (for example, 12 dwelling units per acre) to encourage higher intensity development. The City's Land Development Code also promotes the use of alternate modes of transportation. While most cities only require a minimum number of parking spaces for development, Orlando sets the maximum number of parking spaces for retail at four spaces per 1000 square feet of gross floor area and the minimum number of spaces at 2.5 spaces per 1000 square feet of gross floor area. The City also limits the addition of new long-term parking spaces in the downtown core. To encourage bicycling, all new development or redevelopment is required to install bicycle racks and lockers. In addition, the City of Orlando's Bicycle Advisory Council and LYNX are working together to incorporate bicycle racks into bus stop designs. To enhance pedestrian safety, the City’s approximately 500 miles of sidewalks are required to be at least five feet wide along all development and wider in high pedestrian areas and along major roadways. In order to maintain the pre World War II development patterns within Orlando’s Traditional City (the part of the city built before 1945), the Land Development Code places special requirements on this area of the city. In the commercial areas there are maximum setback standards of either 5 feet for streets designated as “Main” streets or 15 feet for streets designated as “Town” streets. Businesses are required to have defined walkways from the street to the building, and automobile uses are only allowed on the side or rear of the buildings. The Land Development Code includes a bonus system, in which new development is permitted to have higher densities/intensities if it meets certain standards that promote mixed land use, balanced
41
transportation, and pedestrian friendly design. These standards include, among other things, the requirement for at least two land uses; direct accommodations for public transit, bicycles, and pedestrians; mid-block pedestrian accessibility; and shared parking.
Bicycle Plan
Orlando's Bicycle Plan has played a key role in Orlando's multi-modal approach to transportation.161 In 1990, Bicycle Magazine ranked Orlando as the second worst city for bicycling in the country. The ranking inspired City officials to develop a long-range bicycle plan, with the goal of increasing bicycling as a mode of transportation by "implementing a system of safe, economical and efficient bikeway facilities and by supporting bicycle-related programs."162 Since the plan was completed in 1994, the City has built over 150 miles of bikeways, and the 2001 Plan update calls for the construction of an additional 79 miles by 2006 and another 100 miles by 2010. Orlando has placed 94 bicycle racks at public facilities throughout the city, and now requires all new developments to provide bicycle parking close to the main entrance. The city's bicycle facilities had improved so much by the year 2000 that the League of American Bicyclists designated Orlando as one of 52 “Bicycle Friendly Communities” in the U.S.
Central Florida Mobility Design Manual
LYNX took a proactive approach toward transit friendly development by creating the Central Florida Mobility Design Manual, a book of explicit and detailed guidelines for integrating a balanced transportation system into the physical design of new growth and redevelopment. 163 These guidelines are meant to be used during a project's design and development review stages by the architects, planners, landscape architects, engineers, local officials, and developers involved. The manual includes a mobility design checklist and covers such topics as pedestrian, bicycle, vehicular and transit circulation; transit stops and terminals; and building location and design. The Mobility Design Guidelines are based on the goals, objectives, and policies of the comprehensive plans of the 26 cities and counties in Central Florida. Although LYNX often coordinates with the jurisdictions in its three-county service area for development review and provides guidelines, it has no development authority. The goal is to get the jurisdictions to adopt LYNX's Mobility Design Guidelines into their own land development codes and transit oriented development guidelines, so they will be ready when transit service extends into their communities. None of the jurisdictions have officially adopted the guidelines yet.164
Lymmo
To encourage transit use in downtown Orlando, LYNX, in partnership with the City of Orlando, provides a free bus rapid transit service called Lymmo that runs along a three-mile circuit through downtown.165 The Lymmo fleet consists of 11 low floor compressed natural gas buses that have their own dedicated lanes, and control their own traffic signals. A Lymmo comes by one of the 11 stations and 8 stops every five minutes during normal office hours, and every 10 minutes after
42
hours. Lymmo is advertised as being able to deliver passengers within a block of any location downtown in 10 minutes or less. A Tax Increment Trust Fund of the Orlando Community Redevelopment Agency funds this service.166
Examples of Transit-Oriented Development
Naval Training Center Redevelopment
Orlando is currently in the process of redeveloping the old Naval Training Center (NTC).167 When the final decision came to close down the NTC, the City of Orlando proactively initiated a Reuse Plan to guide redevelopment of the base and its facilities in a way that would support local economic and community development. An important part of the design process was citizen input. A Visual Preference Survey was administered at three public meetings to find out what type of development the citizens preferred, and an all-day workshop was held for citizens to brainstorm and put their ideas for the redevelopment down on paper. The resulting Concept Plan that was created included a mixed-use (retail, office, and residential), pedestrian-oriented village center surrounded by high-density residential areas, and open space parks. A traditional neighborhood community called Lake Baldwin is the planned redevelopment for the main base, which is 1,093 acres in total area and located approximately three miles east of downtown Orlando and next to the City of Winter Park. According to the City of Orlando Transportation Planning Bureau, the development "presents the City and developers with a rare opportunity to not only redefine a major in-town site, but to also create a model for Orlando's future."168 The Lake Baldwin plan incorporates an effective transit plan aimed at reducing automobile dependence. Transit plans for the redevelopment include timely bus routes through the community that will link to downtown Orlando, the possibility of rubber wheel trolleys or buses to connect neighborhood centers to the Village Center and the nearby business park, and provisions for a future light rail system which could connect the Village Center with Orlando’s major activity centers.
Southeast Orlando Sector Plan The City of Orlando has identified the area of Southeast Orlando as a Future Growth Center, with the Orlando International Airport being the primary economic and employment base.169 The area is more than 19,300 acres in total area and within 10 to 20 minutes driving distance from downtown Orlando and adjacent to the Orlando International Airport. The Southeast Orlando area, which is the size of a mid-size town, could have a population of 50,000 to 60,000 people upon build out. The proposed uses for the area include a Town Center to serve as the downtown, village and neighborhood centers, and Airport Support Districts. A dense, well-connected street system is part of the plan in order to promote a balanced transportation system. The street system will allow transit to route directly through the communities or town centers to transit stations, which will be located in the center of mixed-use commercial and residential areas. Pedestrian and bicycle access will also be available between all the developments in the Southeast Area Plan.
43
Other Examples
In addition to the Naval Training Center Redevelopment and the Southeast Sector Plan there are a traditional planned neighborhood and several urban villages that have been developed or planned.170 The traditional planned neighborhood, Hampton Park, provides good connections to surrounding streets, high density development, and encourages multi-modal transportation. The mixed-use and high-density development of the urban villages is supportive of transit.
Conclusion
The City of Orlando has taken a multi-faceted approach to establishing transit oriented development. While the results of these initiatives will not be realized for years to come, the seeds for a transit supportive community infrastructure are being sown.
44
The Central Puget Sound Region, Washington
The Central Puget Sound region, in the state of Washington, provides an excellent example of a region making efforts to become more transit friendly. Home of Seattle, the Central Puget Sound region has some of the worst traffic congestion in the nation and is facing significant population growth. The following case study provides a description of what is being done on a regional, county, and city level to alleviate traffic congestion and become more transit oriented.
Central Puget Sound Regional Transit Authority
Traffic congestion led the Washington Legislature to pass legislation in 1993 that allowed the creation the Central Puget Sound Regional Transit Authority (RTA), also known as Sound Transit.171 Sound Transit was given the responsibility of planning, building, and operating a high-capacity regional transit system. In 1996 voters in King, Pierce, and Snohomish counties approved Sound Transit’s 10-year “Sound Move” plan, which called for bringing express buses, commuter trains, and light rail into the region. In approving the Sound Move plan, the three counties agreed to tax themselves to construct this new mass transit system. Under the plan, the express buses, commuter trains, light rail, and local community buses are meant to operate in a “seamless” transportation network. There are currently several express bus routes that link the major activity centers of Bellevue, Everett, Seattle, and Tacoma with other communities in the Central Puget Sound Region with more service to be implemented in the future as ridership grows.172 At this time there are two commuter trains traveling in the morning and evening between Tacoma and Seattle. Several more trains will be added once track and signal improvements are made. Upon completion, commuter trains will service 82 miles of track between Everett and Lakewood. The third important component of Sound Transit’s regional transportation system is Link light rail, which is planned to be 24 miles in length at completion, running from Northgate to Sea Tac. The initial 14 mile central Link light rail line will serve downtown Seattle down to Sea Tac and is expected to start service by 2009. Early on, Sound Transit made TOD an important element of its regional transit system. In 1997, Sound Transit created the Transit Oriented Development Taskforce, made up of the agency's board members, giving it the duty of clarifying Sound Transit's role and responsibilities in achieving TOD while working with local jurisdictions.173 Sound Transit also had a working subcommittee in place for a few years to lay the groundwork for future TOD in the region through educational outreach and to address real estate and TOD issues as they emerged.174 So far, Sound Transit’s TOD work has had a more suburban focus on park-and-ride lots and transit centers for their bus program, and around stations for their commuter rail services.175 At this point, Sound Transit’s TOD staff has mostly done feasibility studies. The next step is implementation. They are now starting to look at real projects and hope to have development agreements within the next year or so.
45
King County Transit Oriented Development Program
King County's Transit Oriented Development Program began in 1998 and is based on the redevelopment of bus transit centers and/or park-and-ride lots.176 The aim of the program is to control urban sprawl by building housing and other amenities on and around park-and-ride lots. In 1999, King County hired Economics Research Associates to create a ranking of the county's park-and-ride lots from a private development perspective, which King County TOD projects have subsequently been based upon. According to the TOD Project Status Update of April 2002, “Three projects are completed, one is under construction, developers have been selected for five, feasibility studies are under way for 11 projects and initial discussions are going on for five.”177 The following is a highlight of two of the completed projects.
The Village at Overlake Station The Village at Overlake Station, one of the first pilot projects for King County's Transit Oriented Development Program, is a joint development project between King County, the King County Housing Development Authority and a private developer.178 This project is the nation's first housing development to be built over a transit station. The station development, which operates as a park-and-ride lot and a major transit facility, includes two levels of covered parking with over 500 parking stalls available to residents and park-and-ride users, 308 rental housing units, and a 2,400 square foot child-care facility for residents and park-and-ride users. The majority of the funding for the $38 million dollar complex was provided by the King County Housing Authority ($21.5 million in tax-exempt bonds) and Columbia Housing and Fannie Mae ($13.5 million in equity investments). The City of Redmond waived $1.7 million in development fees and additional funding was provided by the King County Department of Transportation and the Washington State Convention and Trade Center.179 This helped keep rental rates affordable to households earning 60 percent ($35,000 to $40,000) or less of the median income. To top it off, a free bus pass is given to each household to encourage use of public transit. One of the major challenges to the project came from the Federal Transit Administration (FTA).180 Under the terms in which the FTA contributed funds to develop the original five-acre park-and-ride lot, King County had to get the FTA's approval for any incidental or non-transit use of the property or else reimburse the money to the federal government. The FTA was initially hesitant to give approval because a project like this had never been done before. The Overlake commercial area in Redmond, Washington, is a major employment center with approximately 600 firms and 22,600 employees. The Village at Overlake Station, located in the center of the area, is within walking distance of the main campus of Microsoft and several other employers, restaurants, and stores. Combining affordable housing, childcare, and public transit allows workers to live near their place of employment and be less automobile dependent. According to Ron Sims of King County, “By locating the transit center with housing, and near jobs, more Redmond residents can take advantage of our countywide bus system.”181
Metropolitan Place The second project completed under King County's Transit Oriented Development Program was Metropolitan Place, located in downtown Renton.182 Metropolitan Place is across the street from the Renton Transit Center, and includes 4,000 square feet of ground floor retail space and 90
46
apartments above a two-story, 240 parking stall garage. In an agreement with King County, development owner Dally Homes agreed to provide mixed-use affordable housing (half of the apartments are to be reserved for households earning 80 percent or less of the median income183) and King County agreed to lease 150 of the stalls for park-and-ride over the next 30 years. Dally Homes also agreed to buy bus passes for residents in the 90 apartments.184 In addition to Metropolitan Place, Dally Homes recently developed two other apartment complexes within close walking distance to the Renton Transit Station. Along with the Metropolitan Place transit oriented development, King County Metro, in partnership with the City of Renton, also renovated and expanded the Renton Transit Center.185 The renovations include additional parking, a plaza, and several pedestrian improvements, such as new bus layover and loading areas, street intersection improvements, new paving, shelters, and landscaping. The renovation/expansion project cost approximately $4.4 million.
Station Area Planning
The Station Area Planning (SAP) Program was a three year (1998-2001) effort led by the City of Seattle and funded by Sound Transit, in which city departments, community representatives, and partner agencies worked together to do land use planning and TOD policy development for the quarter mile area around each of Sound Transit’s proposed light rail stations throughout Seattle.186 The Seattle neighborhood plans, developed shortly after Seattle’s Comprehensive Plan was adopted in 1994, laid the foundation for the SAP efforts. The program built on these plans “to ensure that investments in light rail would move neighborhood plan visions forward.” A major focus of the program was public outreach. To involve citizens in station area planning and in Sound Transit's light rail design process, City staff established Station Area Advisory Committees (SAACs) in each station area.187 The SAACs were involved in developing the Station Area Concept-Level Recommendations, took part in a series of design workshops, and made sure the goals of the neighborhood plans were adequately addressed. Program staff also held SAP open houses, conducted over 150 interviews and focus groups with community stakeholders, and held focus groups with over 40 members of the development and financial community to help identify TOD opportunities and obstacles.188 The SAP process came to a close in July of 2001 when the City of Seattle passed its Station Area Overlay legislation, creating Station Area Overlay Districts and rezones around eight future light rail stations.189 The provisions of the Station Area Overlay Districts, which came from neighborhood plan recommendations, aim to encourage housing development and pedestrian activity and discourage automobile oriented development near the planned light rail stations. While there is interest from the development community, it is still too soon to see major results from the SAP program.190 It is expected that once light rail construction actually begins, a net result will start to be seen in the station areas. The SAP team took some valuable lessons away from the three-year planning experience.191 First, definitive information on light rail alignment, station locations and property impacts is needed for the station area planning process to be most effective. Due to unexpected schedule changes, Sound Transit often finalized alignment and station location decisions after SAP work in neighborhoods had already started. This level of uncertainty limited the amount of TOD implementation that
47

could be accomplished during the SAP process. Second, it is important for partnering agencies to have clearly defined roles and good lines of communication from the beginning. Sound Transit and the SAP team were necessarily focused on different things—Sound Transit on the engineering project and the SAP team on “making the most of light rail investment” for Seattle neighborhoods. But there was a lack of clear expectations about the responsibilities each agency would take on, and the SAP team felt they took on an unexpected amount of the community outreach and involvement work. Third, the SAP team learned the value of having a neighborhood planning process to build on. Because the neighborhood groups had been working on plans for four years, the SAP process could go beyond creating a vision and goals for the area to “identifying specific urban design strategies, rezones or capital projects needs.”
Location Efficient Mortgage® Program
In 1999, the City of Seattle and the Fannie Mae Foundation teamed up to launch a pilot program called the Location Efficient Mortgage Initiative.192 Through this program, Fannie Mae and the City grant homebuyers larger loans and lower down payments than those for which they would normally qualify. In exchange, homebuyers agree to own no more than one car and to live within one quarter mile of a bus line or one half mile of a train or light rail system. The program takes into account how much money households can save each year by using public transit and applies that to their buying power, resulting in a potential increase in credit extension of several thousand dollars. As an added benefit and an incentive to use transit, participants in the program automatically qualify to receive a 25 percent discount on an annual one-zone bus pass for two years.193 They also receive free membership and discounted fees for the car-sharing Flexcar program.
The Ave Street Project
The Ave Street project provides an example of what Seattle is doing to make streets more pedestrian and transit friendly.194 University Way Northeast, more commonly known as “The Ave,” is one block away from the University of Washington and is the main pedestrian corridor of Seattle’s University District. The project is an attempt to revitalize the corridor’s deteriorating retail community. Improvements that will be made along The Ave include street resurfacing, wider sidewalks, consolidated bus zones, construction of bus curb bulbs for passenger loading, new bus shelters, new street lighting and signal systems, pedestrian lighting, a new water main, improved drainage and landscaping, a better urban design and added art work. The main goals of The Ave Street Project are “to improve pedestrian safety and mobility, to improve transit speed and reliability, to upgrade the street character through urban design and art enhancements,” and to improve economic vitality of the corridor.
The Ave Project is unique in that the community led the effort. The initiative to make streetscape improvements along The Ave got started in 1994, when a community group called The Ave Planning Group formed and started lobbying the local government for improvements in the University District.195 The group secured a grant from the city to hire a developer to create a street design plan. A successful pilot project using bus-bulbs resulted in 1998. Construction for the project began in June of 2002 and is scheduled to last approximately 15 months. The nine million dollar project is being funded through a combination of federal, state, and local money.196
48
Involving businesses along the corridor has been an important focus of the project.197 The city and its community partners are working with local businesses to minimize negative impacts of project construction.198
Conclusion
This case study provides an example of a region making efforts at various levels of government to become more transit friendly. King County already has a number of TOD projects completed or underway. While it is too early to see the results of transit and land use planning by Sound Transit and the City of Seattle, the region aims high for becoming truly transit oriented.
49

A P P E N D I X B : A N N O TAT E D B I B L I O G R A P H Y
50
Beimborn, Edward, Harvey Rabinowitz, Peter Gugliotta. “Implementation Issues for Transit Sensitive Suburban Land Use Design.” The Center for Urban Transportation Studies, University of Wisconsin Milwaukee. Prepared for the World Conference on Transportation Research, Sydney Australia, July 1995.
This paper addresses the issues involved in implementing transit friendly suburban land use approaches such as traditional neighborhood development projects, pedestrian pockets, and corridor based design. It provides guidelines “that can be used to create situations where transit/pedestrian and bicycle facilities are used as a basis for land use design,” (pg 2). The guidelines are placed into three categories: administration and policy, systems planning, and the design of transit corridor districts. The paper also includes specific implementation strategies.
Belzer, Dena and Gerald Autler. “Transit Oriented Development: Moving From Rhetoric to Reality.” Prepared for the Brookings Institution, Center on Urban and Metropolitan Policy and the Great American Station Foundation, June 2002.
This paper provides a good general overview of TOD. The paper starts out with a discussion of TOD's history and where it is headed in the future; followed by TOD performance criteria; challenges to TOD; and recommended actions for transit agencies, local governments, developers and lending institutions, and community organizations.
“Building a Community Vision: Transit-Oriented Development Case Studies.” City of Seattle Station Area Planning Program, currently found at http://www.cityofseattle.net/td/plan_sap_todstudies.asp.
This report is a collection of detailed case studies from ten cities that have had a variety of TOD experiences: Atlanta, Denver, Los Angeles, Portland, Sacramento, San Diego, San Francisco, San Jose, Vancouver, and Washington, D.C. A discussion of when TOD works best is provided, based on the findings of the case studies. Implications of the findings for Seattle are examined.
“The Costs of Sprawl—Revisited.” Transit Cooperative Research Program Report 39. Transportation Research Board, Washington, D.C., 1998.
This report provides a working definition of sprawl and its associated costs, a historical overview of sprawl dating back to the 1920’s, and a review of the existing literature that addresses sprawl.
51
“Creating Transit Station Communities in the Central Puget Sound Region: A Transit-Oriented Development Workbook.” Puget Sound Regional Council. June 1999.
This workbook defines transit station communities, describes the elements that make up a transit station community, and discusses the benefits of and obstacles to TOD. The workbook concentrates on the pragmatic implementation steps needed to achieve successful TOD. The three main sections focus on guiding principles for creating transit station communities, how to assess the market for TOD, and implementation tools for creating transit station communities.
Freedman, David. “Magic Bus.” Business 2.0. August 2001. Currently found at http://www.business2.com/articles/mag/0,1640,16664,FF.html.
This article provides a good description of bus transit technology advances in the United States, particularly in Montgomery County, Maryland. The discussion centers on global positioning system (GPS) technology. The author also addresses the advantages bus transit holds over rail transit.
Freilich, R.H., “The Land-Use Implications of Transit-Oriented Development: Controlling the Demand Side of Transportation Congestion and Urban Sprawl,” Urban Lawyer, American Bar Association, Chicago, Volume 30, Issue 3, August 1998, pp. 547-572.
This article summarizes the results of a comprehensive survey of transit agencies throughout the United States, as well as a survey of case law and state statutes on transit oriented development (TOD). While the concept of TOD has a sound legal and constitutional basis, it raises some legal issues with regard to implementation.
“Guidelines for Enhancing Suburban Mobility Using Public Transportation.” Transit Cooperative Research Program Report 55. Transportation Research Board, Washington, D.C., 1999.
This report discusses the implications suburban style development has had on transit and identifies the current practices transit agencies are using to better serve suburban travel needs. Some of the various practices discussed include land-use strategies, enhancing line-haul services, local area circulators and shuttles, and subscription buses and vanpools.
Katz, Bruce and Jennifer Bradley. “Sprawl: The Equal Opportunity Menace.” In Transition, Volume 6, New Jersey Transportation Planning Authority. Currently found at http://njtpa.njit.edu/public_affairs/intrans/spraw_vol_6_final.htm.
This article provides a discussion of how suburban style development became the preferred form of land development and the consequences that come with suburban sprawl. The authors promote metropolitanism as a means for addressing the problems of sprawl and supporting TOD.
52
Konsoulis, Mary and Kathy Franz. “On Track: Transit and the American City,” TDM Review, Association for Commuter Transportation, Washington, D.C., Issue 1- 2002, UrbTrans Consultants, pg 10-12.
This article provides an overview of an exhibit from the National Building Museum in Washington, D.C., called On Track: Transit and the American City. The authors provide an overview of the history of relationship between transit and urban form in the United States, from the electric streetcar suburbs of the early 20th century to today’s transit/land use trends.
McCann, Barbara. “Driven to Spend: The Impact of Sprawl on Household Transportation Expenses.” Surface Transportation Policy Project and the Center for Neighborhood Technology.
This study examines the rising cost of transportation for American households, and concludes, “a major factor driving up transportation costs is sprawling development.” (executive summary) The study found that in the average American household, 18 cents out of every dollar spent goes to transportation expenses—98 percent of which goes to the purchase, operation, and maintenance of automobiles. It was found that transportation expenses are highest in communities characterized by sprawling development. The author provides recommendations to address this problem and improve transportation choices.
Millard-Ball, Adam. “Putting on Their Parking Caps; Affordable Housing, Transit-Oriented Development, Smart Growth, Better Water Quality, Reduced Congestion, and More Walkable, Livable Communitie,” Planning, Vol. 68, 4. The American Planning Association, April 2002.
This article describes how several communities have been adapting parking policies in recent years to tackle the issues listed in the title of the article. Eugene, Oregon, Cambridge Massachusetts, and Gainesville, Florida are a few of the many cities discussed.
Morris, Marya. “Creating Transit-Supportive Land-Use Regulations: A Compendium of Codes, Standards, and Guidelines.” Planning Advisory Service, Report Number 468. American Planning Association, 1996.
This report discusses land-use regulation guidelines concerning transit and pedestrian friendly site design, parking, mixed-use development, and increasing density to support transit. It contains sample code provisions from communities that have used creative and effective approaches to achieving a more balanced or multi-modal transportation system.
Nelson, Dick, John Niles. “Measuring Success of Transit-Oriented Development: Retail Market Dynamics and Other Key Determinants.” Prepared for the 1999 American Planning Association National Planning Conference.
This paper provides a summary of recent empirical and modeling studies of TOD, and discusses how TOD success should be measured. Important factors to be considered before major transit investments are made are also outlined.
53
Nelson, Dick, John Niles, Aharon Hibshoosh. “A New Planning Template for Transit-Oriented Development.” Mineta Transportation Institute, San Jose State University, San Jose, CA, September 2001.
The major focus of this report is the growing significance of nonwork travel and the implications it has for TOD, and suggests the need for a new regional planning process. The report includes a general discussion of what TOD is, what led to its increased popularity, and how to measure its success.
Porter, Douglas R. “Transit-Focused Development: A Synthesis of Transit Practice,” TCRP Synthesis 20, Transit Cooperative Research Program, sponsored by The Federal Transit Administration, Transportation Research Board, National Research Council, National Academy Press, Washington D.C., 1997.
While not focused on applying transit oriented development concepts to established communities, this synthesis provides useful information regarding the more traditional application of TOD to the development of rail station areas.
Siembab, Walter, Stephen Graham, Malu Roldan. “Using Fiber Networks to Stimulate Transit Oriented Development: Prospects, Barriers and Best Practices.” Mineta Transportation Institute, San Jose State University, San Jose, CA, October 2001.
This report examines the relationship between rail transit, land development, and telecommunications. The researchers conducted a study to assess the level of interest of the development community in specific network based incentives that transit agencies and rail authorities could offer through telecommunications policies, as well as current and best practices using networks as development incentives, and what the prospects and barriers are for providing network incentives to TOD. The report includes a discussion of the definition of TOD, reasons TOD is important, impediments to TOD, and ways governments can stimulate TOD.
“Transit-Friendly Streets: Design and Traffic Management Strategies to Support Livable Communities.” Transit Cooperative Research Program Report 39. Transportation Research Board, Washington, D.C., 1998.
This research report defines transit-friendly streets and discusses techniques that have been used to balance street uses. Methods and strategies for designing and managing more transit friendly streets are provided. Case studies are presented of five communities that have achieved transit friendly streets.
“Transit Oriented Development: Using Transit to Create More Accessible and Livable Neighborhoods.” TDM Encyclopedia. Victoria Transport Policy Institute. Currently found at http://www.vtpi.org/tdm45.htm
The TOD section of the TDM Encyclopedia provides a description of what TOD is and how it can be implemented. Its subtopics include travel impacts, benefits and costs, equity impacts, applications, relationships with other TDM strategies, stakeholder roles, TOD barriers, best practices, and several TOD examples and case studies.
54
“Transit-Supportive Development Guidebook.” Mid-America Regional Council. 2001.
This guidebook provides an overview of transit supportive development principles, scenarios of different types of transit supportive design that incorporate the principles discussed in the overview, obstacles to success, and strategies to deal with the obstacles. While the guidebook is specifically designed for the Kansas City region, many of the principles discussed may be applied to other regions or communities.
“Transportation Alternatives.” From the King County, Washington Department of Transportation. Currently found at http://www.metrokc.gov/kcdot/alts/tod
This web site defines TOD, explains its purpose, and describes the typical make-up of a TOD. The site provides links to TOD resources, such as case studies, research reports, newspaper articles, web sites, financial incentives programs, books and other documents. It also provides information on King County’s TOD program.
Trischler, Thomas. “In Transit Gloria: How the Mass Transportation Connection Works.” Development Magazine Online. Summer 2000. Currently found at http://www.naiop.org/development/summer00/story10.htm
This article is written from the private developer’s viewpoint. The author defines the concept of TOD and TOJD (Transit Oriented Joint Development); discusses recent federal legislation regarding TOJD policies; addresses the pros, cons, and pitfalls of TOD/TOJD; and looks at where TOJD is headed in the future. Also listed are areas that have TOD projects and provides detailed description of Portland’s Cascade Station TOJD project as a successful example of TOJD.
Wambalaba, Francis. “Smarter Commuting: Fundamentals About Applications of a Location Efficient Mortgage® Strategy.” Center for Urban Transportation Research, University of South Florida.
This paper provides an in depth explanation of the Location Efficient Mortgage (LEM®) program and its alternative implementation strategies. Emphasis is placed on the potential role TDM might play in the LEM® program.
“The Zoning and Real Estate Implications of Transit-Oriented Development,” TCRP Legal Research Digest, Issue 12, Transportation Research Board, Washington, D.C., January, 1999.
This digest is from the report of the same title that was written by Mark S. White and prepared under TCRP Project J-5, “Legal Aspects of Transit and Intermodal Transportation Programs.” It provides information on legal and other issues associated with implementing transit oriented development. The report describes the key elements of local land use and zoning controls that are used to promote TOD. The report includes a description of the terms, tools, and techniques that are typically part of TOD regulations, and the results of a survey about how TOD has been implemented in other jurisdictions.
55

Zykofsky, Paul. “Building Livable Communities with Transit.” Transit California. California Transit Association, May 1999. Currently found at http://www.lgc.org/freepub/land_use/articles/buildcomm.html.
This article provides a useful description of the elements of good TOD. Land use mix and density, site design, pedestrian orientation, parking, enhanced streetscape, and transit amenities are among the many TOD components discussed.
56
E N D N O T E S
1 Dena Belzer and Gerald Autler, “Transit Oriented Development: Moving From Rhetoric to Reality,” Prepared for the Brookings Institution Center on Urban and Metropolitan Policy and the Great American Station Foundation, June 2002, p. 4. 2 Mary Konsoulis and Kathy Franz. “On Track: Transit and the American City,” TDM Review, Issue 1- 2002, UrbTrans Consultants, p. 11. 3 Dena Belzer and Gerald Autler, p. 4. 4 “Guidelines for Enhancing Suburban Mobility Using Public Transportation,” Transit Cooperative Research Program Report 55, Federal Transit Administration, Transportation Research Board, National Research Council, Washington, D.C., 1999, p. 4. 5 Bruce Katz and Jennifer Bradley, “Sprawl: The Equal Opportunity Menace,” In Transition, Volume 6, New Jersey Transportation Planning Authority, p. 3, currently found at http://njtpa.njit.edu/public_affairs/intrans/spraw_vol_6_final.htm. 6 Dena Belzer and Gerald Autler, p. 5. 7 Alan M. Voorhees, guest lecture on Transportation and Urban Structure, sponsored by the Institute of Transportation Engineers, Student Chapter at the Center for Urban Transportation Research, University of South Florida, July 22, 2002. 8 “The Costs of Sprawl—Revisited,” Transit Cooperative Research Program Report 39, Federal Transit Administration, Transportation Research Board, National Research Council, Washington, D.C., 1998, p. 6. 9 Barbara McCann, “Driven to Spend: The Impact of Sprawl on Household Transportation Expenses,” Surface Transportation Policy Project and the Center for Neighborhood Technology, Chapter Three. See also “The Costs of Sprawl—Revisited,” pp. 6-7. 10 For a more complete review of the issue of “sprawl”, refer to these sources:
Burchell et al. “Costs of Sprawl—2000,” conducted by Rutgers University, New Brunswick, Center for Urban Policy Research, New Brunswick, NJ, TCRP Report, Issue #74, Transportation Research Board, Washington, D.C., January 2002.
Calthorpe, Peter, and William B. Fulton, The Regional City: Planning for the End of Sprawl, University of California, Berkeley, Institute for Transportation Studies, January 2001.
Merlin, P., “Urban Density, Transport and Quality of Life,” Public Transport International, Volume 50, International Union of Public Transport, Brussels, pp. 40-44.
57
58
Pollard, T. “Greening the American Dream? If Sprawl is the Problem, Is New Urbanism the Solution?” Planning, Volume 67, Issue 10, American Planning Association, October 2001, pp. 10-15. 11 Dena Belzer and Gerald Autler, p. 1. 12 Bruce Katz and Jennifer Bradley, p. 5. 13 Barbara McCann, Chapter One. 14 Bruce Katz and Jennifer Bradley, p. 1. 15 “Guidelines for Enhancing Suburban Mobility Using Public Transportation,” p. 4. 16 “Guidelines for Enhancing Suburban Mobility Using Public Transportation,” pp. 4-5. 17 Michael Davidson and Fay Dolnick, “A Glossary of Zoning, Development, and Planning Terms,” American Planning Association, Planning Advisory Service Report Number 491/492. Other definitions of TOD were found in several sources. See Appendix B for an annotated bibliography of the sources used in the literature review. 18 Robert Cervero and Michael Duncan, “Rail Transit's Value-Added: Effects of Proximity to Light and Commuter Rail Transit on Commercial Land Values in Santa Clara County, California,” Institute of Urban and Regional Development, University of California, Berkeley, prepared for the Urban Land Institute and the National Association of Realtors, June 2001, pg 1. 19 For a more complete review of the impact of transit oriented development on travel behavior, refer to these sources:
Bae, C., “Orenco Station, Portland, Oregon: A Successful Transit Oriented Development Experiment?” Eno Transportation Foundation, Inc., Washington, D.C., Transportation Quarterly, Volume 56, Issue 3, January 2002, pp. 9-18.
Boarnet, M.G. and R. Crane, “Public Finance and Transit-Oriented Planning: New Evidence From Southern California,” working paper, University of California Transportation Center, November 1995.
Brod, D., “Accounting for Multimodal System Performance in Benefit-Cost Analysis of Transit Investment,” Conference proceedings, “Seventh National Conference on Light Rail Transit: Building on Success—Learning from Experience,” Baltimore, MD, Transportation Research Board and the American Public Transit Association, November 1995, pp. 184-190.
Cervero, R., Texas Transportation Institute, “Urban Design Issues Related to Transportation Modes, Designs and Services for Neo-Traditional Developments,” presented at Urban Design, Telecommuting and Travel Forecasting Conference, Federal Highway Administration, Federal Transit Administration, Environmental Protection Agency. Williamsburg, VA, October, 1996.
Crane, R. “On Form Versus Function: Will the New Urbanism Reduce Traffic, or Increase It?” Journal of Planning Education and Research, Issue 15, January 1996, pp. 117-126.
59
Dueker, K.J., “Ideas in Motion: A Critique of the Urban Transportation Planning Process: The Performance of Portland’s 2000 Regional Transportation Plan”, Eno Transportation Foundation, Inc., Washington, D.C., Transportation Quarterly, Volume 56, Issue 2, January 2002, pp. 15-21.
Higgins, T.J., “Parking Requirements for Transit-Oriented Developments,” Transportation Research Record, Issue 1404, Transportation Research Board, Washington, D.C., pp. 50-54.
Messenger, T. and R. Ewing, “Transit-Oriented Development in the Sun Belt,” Transportation Research Record, Issue 1552, Transportation Research Board, Washington, D.C., January 1996, pp. 145-153.
Miller, M.A., and S.M. Buckley, “Bus Rapid Transit Institutional Issues: The Route from Research to Experience,” Transportation Research Record, Issue 1760, Transportation Research Board, Washington, D.C., January 2001, pp. 34-41.
Niles, J. and D. Nelson, “Enhancing Understanding of Non-Work Trip Making: Data Needs for the Determination of TOD Benefits,” Transportation Research Circular, Transportation Research Board Committee on Travel Survey Methods (A1D10) and the Committee on National Transportation Data Requirements and Programs (A5016). March 2001, pp. 537-548.
Thompson, G.L and J.E. Frank, “Evaluating Land Use Methods for Altering Travel Behavior” Final Report for Task 1B: Transit Patronage as a Product of Land Use Potential and Connectivity: The Sacramento Case. Center for Urban Transportation Research, University of South Florida, January 1995. 20 “Creating Transit Station Communities in the Central Puget Sound Region: A Transit-Oriented Development Workbook,” p. 3. 21 “Commercial Property Benefits of Transit: Final Report,” Federal Transit Administration, June 2002, p. v, currently found at http://www.rtd-denver/Projects/TOD/Commercial_Property_Benefits_of_Transit.pdf. See also “The Effect of Rail Transit on Property Values: A Summary of Studies,” (draft) prepared by Parsons Brinckerhoff for NEORail II, Cleveland, Ohio, February 2001, pp. 3-6, currently found at http://www.rtd-denver.com/Projects/TOD/The_effect_of_Rail_Transit_on_Property_Values_Summary_of _studies.pdf . See also
Robert Cervero and Michael Duncan, pg 19. See also “Creating Transit Station Communities in the Central Puget Sound Region: A Transit-Oriented Development Workbook,” p. 3. See also “Transit Oriented Development: Using Transit to Create More Accessible and Livable Neighborhoods,” TDM Encyclopedia, Victoria Transport Policy Institute, p. 1, currently found at http://www.vtpi.org/tdm/tdm45.htm 22 “Creating Transit Station Communities in the Central Puget Sound Region: A Transit-Oriented Development Workbook,” p. 3. 23 Dena Belzer and Gerald Autler, p. 16.
60
24 “Transit Oriented Development: Using Transit to Create More Accessible and Livable Neighborhoods,” pp. 2-3. 25 Unless specified, the design features described in this section come from a general composite of literature findings. See Appendix B for an annotated bibliography of the sources used in the literature review. 26 “Creating Transit Station Communities in the Central Puget Sound Region: A Transit-Oriented Development Workbook,” Puget Sound Regional Council, June 1999, pp. 29-33. See also “Transit Oriented Development: Using Transit to Create More Accessible and Livable Neighborhoods,” TDM Encyclopedia, Victoria Transport Policy Institute, p. 1, currently found at http://www.vtpi.org/tdm/tdm45.htm 27 King County Department of Transportation’s Transportation Alternatives website, “What is Transit Oriented Development?” currently found at http://www.metrokc.gov/kcdot/alts/tod/whatistod.htm. See also “Creating Transit Station Communities in the Central Puget Sound Region: A Transit-Oriented Development Workbook,” pg 34-40. See also “Transit Oriented Development: Using Transit to Create More Accessible and Livable Neighborhoods.” 28 “Creating Transit Station Communities in the Central Puget Sound Region: A Transit-Oriented Development Workbook,” pp. 43-44. 29 Dena Belzer and Gerald Autler, pp. 6-17. 30 “Creating Transit Station Communities in the Central Puget Sound Region: A Transit-Oriented Development Workbook,” p. 66. 31 Dena Belzer and Gerald Autler, p. 18. See also “Creating Transit Station Communities in the Central Puget Sound Region: A Transit-Oriented Development Workbook,” pp. 10-11. 32 “Creating Transit Station Communities in the Central Puget Sound Region: A Transit-Oriented Development Workbook,” pp. 10-11. 33 Dena Belzer and Gerald Autler, p. 18. See also “Creating Transit Station Communities in the Central Puget Sound Region: A Transit-Oriented Development Workbook,” p. 67. 34 “Creating Transit Station Communities in the Central Puget Sound Region: A Transit-Oriented Development Workbook,” p. 120. 35 Dena Belzer and Gerald Autler, p. 18. 36 “Creating Transit Station Communities in the Central Puget Sound Region: A Transit-Oriented Development Workbook,” pp. 75-82. 37 “Land Developer Participation in Providing for Bus Transit Facilities/Operations,” National Center for Transit Research at the Center for Urban Transportation Research, University of South Florida, Tampa, sponsored by Florida Department of Transportation and the U.S. Department of Transportation, March 2002, currently found at http://www.nctr.usf.edu/publications.htm.
61
38 “Creating Transit Station Communities in the Central Puget Sound Region: A Transit-Oriented Development Workbook,” pp. 69, 73-74, 93-95. 39 “Creating Transit Station Communities in the Central Puget Sound Region: A Transit-Oriented Development Workbook,” p. 97. 40 “City’s Property Tax Exemption Program Begins,” City of Seattle news release, 1/27/99, currently found at http://www.ci.seattle.wa.us/news/detail.asp?ID=211. See also City of Seattle’s Department of Housing web site, “Property Tax Exemption for Multifamily Housing,” currently found at http://www.cityofseattle.net/housing/PropertyExemptions.htm. 41 Shane Largent, City of Orlando Transportation Planning Bureau, email correspondence, 6/21/02. 42 “Building a Community Vision: Transit-Oriented Development Case Studies,” City of Seattle Station Area Planning Program, 5/17/02, p. 6, currently found at http://www.cityofseattle.net/td/plan_sap_todstudies.asp. 43 “Creating Transit Station Communities in the Central Puget Sound Region: A Transit-Oriented Development Workbook,” pp. 73-74. 44 “Creating Transit Station Communities in the Central Puget Sound Region: A Transit-Oriented Development Workbook,” p. 95. 45 City of Houston’s Main Street Revitalization Project website, 7/6/02, currently found at http://www.ci.houston.tx.us/departme/planning/projects/mainstreet/framec.html. See also Patricia Rincon-Kallman, Asst. Director Planning & Development Department, City of Houston, phone conversation, 7/19/02. 46Methods for amending regulations were found in “Creating Transit Station Communities in the Central Puget Sound Region: A Transit-Oriented Development Workbook,” pp. 69-70. 47 Walter Siembab, Stephen Graham, and Malu Roldan, “Using Fiber Networks to Stimulate Transit Oriented Development: Prospects, Barriers, and Best Practices,” MTI Report 01-16, Mineta Transportation Institute, San Jose State University, October 2001, p. 15. See also “Creating Transit Station Communities in the Central Puget Sound Region: A Transit-Oriented Development Workbook,” pp. 69-70. 48 Station Area Planning Closeout Report, City of Seattle, August 2001, p. 15, currently found at http://www.cityofseattle.net/td/SAP/SAP%20Closeout%20Report.pdf. 49 “Creating Transit Station Communities in the Central Puget Sound Region: A Transit-Oriented Development Workbook,” p. 69. 50 “Creating Transit Station Communities in the Central Puget Sound Region: A Transit-Oriented Development Workbook,” p. 69. 51 Chris Coble, TOD Specialist, Regional Transportation District (RTD) Denver, e-mail correspondence, 7/25/02.

62
52 “Managing Our Way Through Congestion,” Florida’s Commute Alternatives System Handbook. Prepared for the Florida Department of Transportation, Public Transit Office. Prepared by the Center for Urban Transportation Research, University of South Florida, Tampa, May 1996. 53 “Guidelines for Enhancing Suburban Mobility Using Public Transportation,” p. 19. 54 Edward Beimborn, Harvey Rabinowitz, and Peter Gugliotta, “Implementation Issues for Transit Sensitive Suburban Land Use Design,” Center for Urban Transportation Studies, University of Wisconsin Milwaukee, 1995, p. 9. 55 “Guidelines for Enhancing Suburban Mobility Using Public Transportation,” p. 19. 56 Central Florida Mobility Design Manual, Central Florida Regional Transportation Authority (LYNX), prepared by Glatting Jackson Kercher Anglin Lopez Rinehart, Inc. in association with Herbert Halback and Associates, Inc, revised edition, 2000. 57 Marya Morris, “Creating Transit-Supportive Land-Use Regulations: A Compendium of Codes, Standards, and Guidelines,” American Planning Association, Planning Advisory Service Report Number 468, 1996, p. 3. 58 Executive Summary of the Proposed East Boulevard Pedscape Plan, November 27, 2001, currently found on Char-Meck Planning home page, http://www.ci.charlotte.nc.us/planning. 59 John Cock, Charlotte-Mecklenburg Planning Commission, phone conversation, 6/28/02; Sandra Montgomery, Charlotte-Mecklenburg Planning Commission, e-mail correspondence, 7/1/02. 60 See Appendix A for a more detailed case study of Orlando. 61 Orlando Bikeways website, 6/3/02, currently found at http://www.cityoforlando.net/planning/Transportaiton/bikeways/default.htm 62 “Building a Community Vision: Transit-Oriented Development Case Studies,” p. 6. 63 Shane Largent, City of Orlando Transportation Planning Bureau, email correspondence, 6/21/02. 64 Edward Beimborn, Harvey Rabinowitz, and Peter Gugliotta, p. 11. 65 “Building a Community Vision: Transit-Oriented Development Case Studies,” p. 6. 66 Patricia Rincon-Kallman, Asst. Director Planning & Development Department, City of Houston, phone conversation, 7/19/02. 67 “Parking Cash Out: Implementing Commuter Benefits Under the Commuter Choice Leadership Initiative,” found at http://www.commuterchoice.gov/pdf/parkingcash.pdf. 68 See Appendix A for a more detailed case study of Seattle/King County. 69 Regional Transportation District (RTD) website, "Transit Oriented Development," currently found at http://www.rtd-denver.com. 70 See Edward Beimborn, Harvey Rabinowitz, and Peter Gugliotta, p. 10.
63
71 See Appendix A for a more detailed case study of Charlotte. 72 Chris Hamilton, Program Manager, Arlington County Commuter Assistance Program, phone conversation, 7/18/02. 73 “Strategies for Increasing the Effectiveness of Commuter Choice,” TCRP H-25 Final Report, prepared by ICF Consulting et al., prepared for the Transit Cooperative Research Program, Transportation Research Board, National Research Council, July, 2002, p.6. 74 See Appendix A for a more detailed case study of Orlando. 75 See "Guidelines for Enhancing Suburban Mobility Using Public Transportation," pp. 30-66. 76 Port Authority of Allegheny County website, 8/26/02, currently found at http://www.portauthority.org. 77 See Appendix A for a more detailed case study of Charlotte. 78 DART website, 7/24/02, currently found at http://www.dart.org. 79 “Suburban Mobility Authority for Regional Transportation (SMART)—Welfare to Work.” Welfare Information Network Promising Practices, August 2000, currently found at http://www.welfareinfo.org/suburbanmobility.htm. 80 David H. Freedman, “Magic Bus,” Business 2.0, August 2001, currently found at http://www.business2.com/articles/mag/0,1640,16664,FF.html. 81 David H. Freedman, “Magic Bus”. 82 Commuter Page.com website, 7/9/02, currently found at http://www.commuterpage.com. 83 Chris Hamilton, 7/18/02. 84 Francis Wambalaba, “Smarter Commuting: Fundamentals About Applications of a Location Efficient Mortgage® Strategy,” Center for Urban Transportation Research, University of South Florida. 85 “Mayor Schell, County Executive Ron Sims and Housing Leaders Welcome First Homebuyer into New Home Under Innovative Transit-Housing Initiative,” Fannie Mae news release, 8/1/00, currently found at http://www.fanniemae.com/newsreleases/2000/0874.jhtml. 86 Sam Bennett, “Program’s Goal is More Homeowners and Fewer Drivers,” Seattle Daily Journal of Commerce Online Edition, 11/10/99, currently found at http://www.djc.com/news/re/10060559.html?cgi. 87 Seattle Office of Housing website, “Location Efficient Mortgage®,” 7/3/02, currently found at http://www.ci.seattle.wa.us/housing/LEM®. 88 “Mayor Schell, County Executive Ron Sims and Housing Leaders Welcome First Homebuyer into New Home Under Innovative Transit-Housing Initiative.”
64
89 S. Shaheen. University of California, Berkeley. 90 For more information about carsharing, go to the Car Sharing Network at http://www.carsharing.net/. 91 Kelley MacKinnon, Arlington Transit, phone conversation, 7/18/02. 92 See Appendix A for a more detailed case study of Charlotte. 93 See Appendix A for a more detailed case study of Seattle. 94 Jim Duffy, “Back to Basics at MARTA,” Mass Transit, Vol. 28, No. 4, Cygnus Business Media, June 2002, p. 8. 95 North Natomas Transportation Management Association, Sacramento, California, description of child-centered TOD, currently found at http://www.neighborhoodlink.com/org/nntma 96 Richard Maschal, “Charlotte, N.C., Embraces Prosperity and Builds a New Identity,” Architectural Record, May 1, 2002. 97 David Leard, David Taylor, and Troy Russ, “Reshaping a Community Through the Integration of Transit and Land Use: Success in a Southern City?” pg 1, currently found at www.ci.charlotte.nc.us/citransit/planning/south/pdfs/leard.pdf. 98 Uri Avin, Robert Cervero, and Boyd Cauble, “The Transit/Land Use Plan for Charlotte-Mecklenburg, Session Series: Integrating Land Use and Transportation Planning: A Case Study of Charlotte-Mecklenburg”, prepared for the 1999 American Planning Association National Planning Conference. 99 David Leard et al, pp. 2-3. 100 Charlotte-Mecklenburg Planning Commission’s Transit Station Area Principles Brochure, currently found at http://www.ridetransit.org/planning/south/brochure.htm. 101 Jennifer Green, South Corridor Community Relations Specialist, Charlotte Area Transit System (CATS), e-mail correspondence, 7/15/02. 102 David Leard et al, p. 3. 103 David Leard et al, p. 7. 104 Jennifer Green, 7/15/02. 105 CATS South Corridor Light Rail Project website, “Charlotte’s First Proposed Light Rail Project On Track,” 6/28/02, currently found at http://www.ridetransit.org/planning/south/corr_des.htm. 106 City of Charlotte, South Corridor Major Investment Study Report, currently found at http://www.ci.charlotte.nc.us/citransit/planning/south/pdfs/mis1-7.pdf. See also “South Corridor Preliminary Engineering/Environmental Impact Statement Development Public Involvement Plan,” Charlotte Area Transit System, provided by Jennifer Green of CATS.

65
107 Jennifer Green, 7/15/02. 108 The draft Station Area Plans may currently be viewed at http://www.ridetransit.org/planning/south/draftsta.htm. 109 David Leard et al, p. 11. 110 Jennifer Green, 7/15/02. 111 Jennifer Green, e-mail correspondence, 6/18/02. 112 Charlotte-Mecklenburg Planning Commission’s Transit Station Area Principles Brochure. 113 Jennifer Green, 6/18/02. 114 Wade Carroll, AICP, Post Buckley Schuh & Jernigan, e-mail correspondence, 7/22/02. 115 Charlotte Region Transit Station Area Joint Development Principles, provided by Wade Carroll. 116 Executive Summary of the Proposed East Boulevard Pedscape Plan. 117 John Cock, Charlotte-Mecklenburg Planning Commission, phone conversation, 6/28/02; Sandra Montgomery, Charlotte-Mecklenburg Planning Commission, e-mail correspondence, 7/1/02. 118 CATS website, currently found at http://www.ci.charlotte.nc.us/citransit. See also Jennifer Green, 6/18/02. 119 Jennifer Green, 6/18/02. 120 Jennifer Green, 6/18/02. 121 Regional Transportation District website “FasTracks” section, 7/26/02, currently found at http://www.rtd-denver.com/Fastracks/index.html 122 Regional Transportation District website “Facts and Figures” section, 6/25/02, currently found at http://www.rtd-denver.com/Business/facts_figures.html 123 Center for Transportation Excellence website, 8/17/02, currently found at http://www.cfte.org/images/success_denver.pdf 124 Jennifer Moulton and Bill Hornby, “Blueprint Denver Plan for the future Melds Land Use, Transportation,” The Denver Post, currently found on the City and County of Denver website at http://198.202.202.66/Land_Use_and_Transportation_Plan/1323news.asp 125 “About Blueprint Denver”, an informational brochure developed by the City and County of Denver’s Community Planning and Development Agency. 126 Regional Transportation District website “FasTracks” section. 127 Tranportation Expansion Project (T-REX Project) website, Metro Denver, 8/17/02, currently found at http://www.trexproject.com/site_channels/project_desc
66
128 T-REX Project website. 129 T-REX Project website. 130 Detailed in August 19, 2002 email correspondence from RTD TOD Planner Chris Coble. 131 Georgia Regional Transportation website, “About Us” section, 7/1/02, currently found at www.grta.org/about_us/about_us_background.htm. 132 “Moving Beyond Sprawl: The Challenge for Metropolitan Atlanta,” The Brookings Institute, 2000, Chapter IV, currently found at http://www.brookings.edu/dybdocroot/es/urban/atlanta/executivesummary.htm. 133 “Moving Beyond Sprawl: The Challenge for Metropolitan Atlanta,” Chapter III. 134 Metropolitan Atlanta Rapid Transit Authority website, “Clean Air Act,” 7/1/02, currently found at http://www.itsmarta.com/newroom/cleanair.htm. 135 “Moving Beyond Sprawl: The Challenge for Metropolitan Atlanta,” Executive Summary. 136 Jim Duffy, “Back to Basics at MARTA,” Mass Transit, Vol. 28, No. 4, Cygnus Business Media, June 2002, p. 8. 137Georgia Regional Transportation website, “About Us,” section, 8/9/02, last updated May 2, 2000, currently found at http://www.grta.org/rtap/intro.htm 138 “Moving Beyond Sprawl: The Challenge for Metropolitan Atlanta,” Chapter VI, see endnote #2. 139 Georgia Regional Transportation website, “About Us.” 140 Jim Duffy, “Back to Basics at MARTA,” p. 8. 141 Georgia Regional Transportation website, “Regional Transportation Action.” 142 “Counties Make 1st Payments for Express Bus System,” Georgia Regional Transportation Authority press release, August 9, 2002, currently found at http://www.grta.org/new_section/current_articles/first_payments_080902.htm. 143 Atlanta Regional Council website, “Community Building,” 8/9/02, currently found at http://www.atlantaregional.com/communitybuilding/communitychoices.html. 144 Atlanta Regional Council website, “Community Building.” 145 Atlanta Regional Council website, “Community Building.” 146 Jim Duffy, “Transit-Oriented Development in Atlanta,” Mass Transit, Vol. 28, No. 4, Cygnus Business Media, June 2002, p. 21.

67
147“ARC Announces 2nd Annual Developments of Excellence Awards.” Atlanta Regional Council press release, 2000, currently found at http://www.atlantaregional.com. 148 “Building a Community Vision: Transit-Oriented Development Case Studies,” City of Seattle Station Area Planning Program, p. 22. 149 Jim Duffy, “Transit-Oriented Development” p. 20. 150 Jim Duffy, “Transit-Oriented Development” p. 21. 151 Jim Duffy, “Transit-Oriented Development” p. 21. 152 Jim Duffy, “Transit-Oriented Development” p. 20. 153 “Bell South Employees Begin Move In of First Metro Plan Building,” Bell South press release, March 15, 2001, currently found at http://bellsouthcorp.com/proactive/newsroom/release.vtml?id=35622. (August 12, 2002). 154 Jim Duffy, “Transit-Oriented Development” p. 21. 155 Jim Duffy, “Transit-Oriented Development” p. 23. 156 “MARTA and Saint Joseph’s Health System Break Ground on Medical Center Station Transit-Oriented Development.” Carter & Associates press release, April 2, 2002, currently found at http://www.carterusa.com/news/pr_020402_a.htm. 157 LYNX website, 7/10/2002, currently found at http://www.golynx.com. 158 Tiffany Homler, Central Florida Regional Transportation Authority (LYNX), phone conversation, 6/24/02. 159 Shane Largent, City of Orlando Transportation Planning Bureau, email correspondence, 6/21/02. 160 Shane Largent, 6/21/02. 161 Shane Largent, 6/21/02. See also Orlando Bikeways website, 6/3/02, currently found at http://www.cityoforlando.net/planning/Transportation/bikeways/default.htm. 162 Orlando Bikeways website. 163 Central Florida Mobility Design Manual. 164 Tiffany Homler, 6/24/02. 165 LYNX website. 166 “Land Developer Participation in Providing for Bus Transit Facilities/Operations.” 167 Orlando Naval Training Center Redevelopment website, 7/10/02, currently found at http://www.cityoforlando.net/planning/ntc/ntcclos.htm. See also Shane Largent, 6/21/02.
68
168 Shane Largent, 6/21/02. 169 Southeast Orlando Sector Plan website, 7/10/02, currently found at http://www.cityoforlando.net/planning/deptpage/sesp/sespvisi.htm; See also Shane Largent, 6/21/02. 170 Shane Largent, 6/21/02. 171 Sound Transit website, 7/05/02, currently found at http://www.soundtransit.org. 172 Sound Transit website. 173 “Creating Transit Station Communities in the Central Puget Sound Region: A Transit-Oriented Development Workbook,” Puget Sound Regional Council, June 1999, p. 104. 174 Ken Robertson, TOD Project Coordinator, Sound Transit, phone conversation, 8/5/02. 175 Ken Robertson. 176 Henry Markus, King County Department of Transportation, Transit Oriented Development Section, email correspondence, 7/9/02. See also King County Transit-Oriented Development website, 7/3/02, currently found at http://www.metrokc.gov/kcdot/alts/tod. 177 King County Transit-Oriented Development website. 178 King County Transit-Oriented Development website. 179 David Jackson, “All TOD, It's a Unique New Project,” Daily Journal of Commerce, 10/19/2000, currently found at http://www.djc.com/cust/pfriend.php?id=11115075. 180 David Jackson. 181 Herbert Atienza, “Apartments to Go Up at Overlake Park & Ride; Plan is to Combine Affordable Housing, Commuter Parking in $40 Million Project,” Eastside Journal Online, 10/19/2000, currently found at http://www.eastsidejournal.com/sited/retr_story.pl/31952. 182 King County Transit-Oriented Development website. 183 “Downtown Renton to get Transit Oriented Development,” King County new release, 7/19/99, currently found at http://www.metrokc.gov/exec/news/1999/0719992.htm. 184 Chris McGann, “Combined-use Sector Aimed at Revitalizing Downtown Renton,” Seattlepi.com. 7/25/2000, currently found at http://seattlepi.nwsource.com/local/rent25.shtml. 185 King County Transit-Oriented Development website. 186 Seattle Department of Transportation, Station Area Planning website, 7/5/02, currently found at http://www.cityofseattle.net/td/plan_sap_home.asp.
69
187 Station Area Planning Closeout Report, City of Seattle, August 2001, p. 19, currently found at http://www.cityofseattle.net/td/SAP/SAP%20Closeout%20Report.pdf. 188 Station Area Planning Closeout Report, p. 19. 189 Station Area Planning Closeout Report, p. 15. 190 Ken Robertson, 8/5/02. 191 Station Area Planning Closeout Report, pp. 20-22. 192 Sam Bennett, “Program’s Goal is More Homeowners and Fewer Drivers,” Seattle Daily Journal of Commerce Online Edition. 11/10/99, currently found at http://www.djc.com/news/re/10060559.html?cgi. For a more detailed explanation of the Location Efficient Mortgage® Program, see the section of the literature review entitled “Other Community Approaches to Becoming Transit Friendly.” 193Seattle Office of Housing website, “Location Efficient Mortgage®,” 7/3/02, currently found at http://www.ci.seattle.wa.us/housing/LEM. 194 The Ave Street Project website, Seattle Department of Transportation, 8/15/02, currently found at http://www.cityofseattle.net/td/avemulti.asp. 195 Rob Gorman, Project Manager, Seattle Department of Transportation, phone conversation, 7/26/02. 196 Rob Gorman. 197 Rob Gorman. 198 The Ave Street Project website.