Embed Size (px)
Citation preview
Annual Report and Accounts 2011Annual Report and Accounts 2011
Building the foundation for sustainable and profitable growth
Scapa Group plc
Contents
OverviewIntroduction 01Chairman’s Statement 04Highlights 06Business review 08Governance Board of Directors 20Leadership Team 21Report of the Directors 22Directors’ Remuneration Report 25Corporate Governance 30
Financial StatementsStatement of Directors’ Responsibilities 35Independent Auditors’ Report 36Consolidated Income Statement 37Consolidated Statement of Comprehensive Income 37Consolidated Balance Sheet 38Consolidated Statement of Changes in Equity 39 Consolidated Cash Flow Statement 40Group Accounting Policies 41Notes on the Accounts 48Five Year Summaries 71Parent Company Financial Statements 72Independent Auditors’ Report 73Company Balance Sheet 74Statement of Total Recognised Gains and Losses 74 Statement of Accounting Policies 75Notes on the Accounts 76
Revenue £m
Net cash balance £m*
Earnings per share p
Financial highlights Operating profit £m
Profit before tax £m
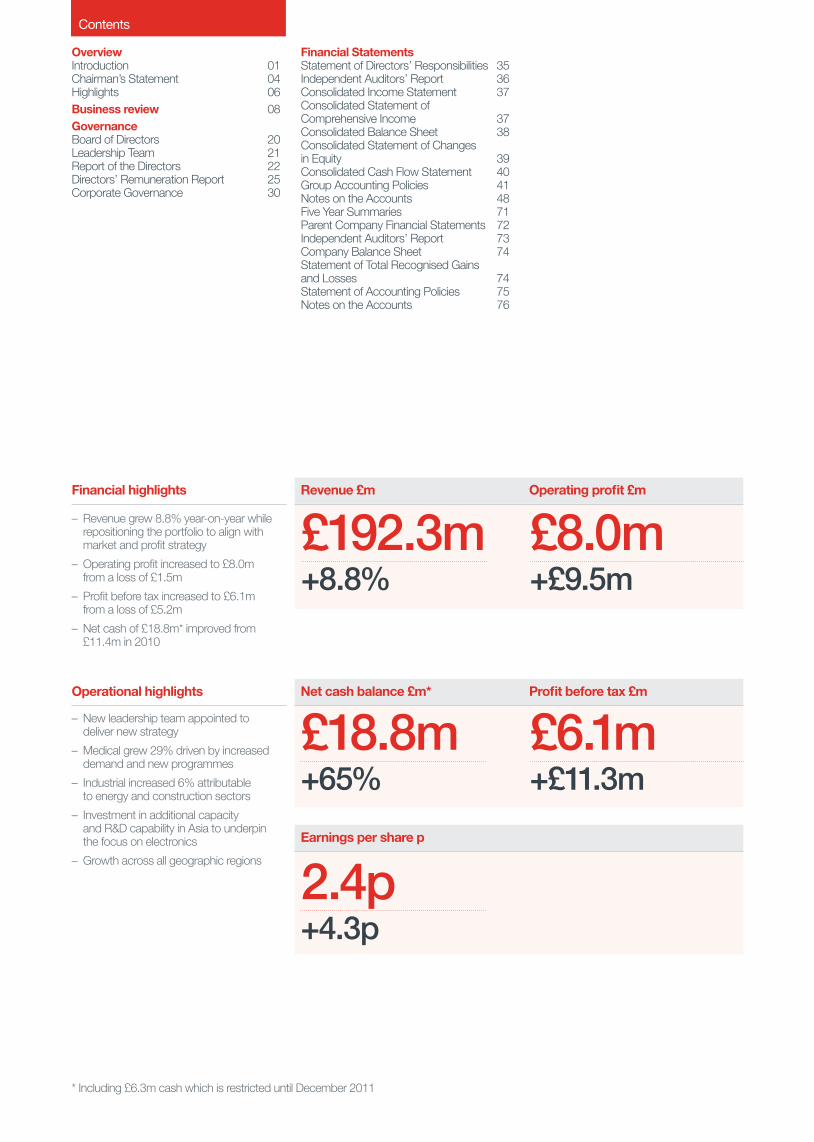
£192.3m+8.8%
£18.8m+65%
2.4p+4.3p
£8.0m+£9.5m
£6.1m+£11.3m
– Revenue grew 8.8% year-on-year while repositioning the portfolio to align with market and profit strategy
– Operating profit increased to £8.0m from a loss of £1.5m
– Profit before tax increased to £6.1m from a loss of £5.2m
– Net cash of £18.8m* improved from £11.4m in 2010
– New leadership team appointed to deliver new strategy
– Medical grew 29% driven by increased demand and new programmes
– Industrial increased 6% attributable to energy and construction sectors
– Investment in additional capacity and R&D capability in Asia to underpin the focus on electronics
– Growth across all geographic regions
Operational highlights
* Including £6.3m cash which is restricted until December 2011

Introduction
Who we are Scapa is a worldwide leading manufacturer of bonding solutions and adhesive components for applications in the medical, electronics, industrial and transportation markets.
What we do We help medical, industrial, electronics and transportation customers create better products by providing adhesive solutions and components. We design our offering around the requirements of global OEMs, distributors and consumers.
Our transition towards application-specific opportunities leveraging our global footprint and technologies is driving our portfolio towards value-added solutions from commodity products. Our aim is to accelerate the transition while continuing to deliver our financial expectations and value to shareholders.
Financial Statements
Governance
Business R
eviewO
verview
Scapa Group plc Annual Report and Accounts 2011 1

Introduction
IndustrialIndustrial is the largest segment of our business and represents a wide range of markets and applications. Reflecting the overall market, construction is the biggest portion of Industrial. We have a broad range of products that cover virtually every requirement needed in buildings. Our products are also used in many energy-related applications such as solar panels, oil and gas pipelines, and power and fibre cables. The increasing requirements for both traditional and alternative energy are driving the need and advancement of new bonding technology. The wide range
of applications for our products enables us to identify attractive emerging segments and position ourselves to benefit from increasing demand.
Scapa’s unrivalled product range and application knowledge, combined with our global footprint, ensure that customers in any market will consider us as their source for bonding materials and solutions. We sell our products through our own sales force as well as through our channel partners and distributors worldwide.
Scapa is a market leading developer and manufacturer of bonding materials and solutions. Our products are used extensively in a wide range of markets around the world. The applications range from plasters for minor cuts to optically clear adhesives in the latest smart phone. Our focus is to work with our customers to develop application-specific solutions for complex applications, which are continuously evolving.
More than tape
2 Scapa Group plc Annual Report and Accounts 2011

TransportationThe use of electronic components for the safety and comfort of passengers in cars, airplanes and trains is increasing. To help these electronic components communicate with each other, Scapa provides bonding solutions to wire harness manufacturers, meeting the highest OEM specifications, as well as logistic and support requirements of this industry, leveraging Scapa’s global footprint.
Global production platforms need global supply. With Scapa’s global manufacturing footprint we offer supply and local support to transportation customers. Function integration and focus on value-adding design systems help transportation customers to meet their customer and legislation demands.
ElectronicsThe requirements and needs of bonding solutions for the Electronics sector are increasingly demanding, driven by the innovation cycles of the market and global requirements of customers. As electronic products are becoming thinner and lighter, our products are replacing conventional fixings such as screws and connectors. Furthermore, our products are used as more than tape. We are working with our customers to incorporate other functionalities into
our products to address other needs such as heat dispersion and electro magnetic interference (EMI).
Scapa’s range of acrylic foam films and PU foam tapes ensures a lightweight and thin adhesive solution. Our range of thermal film pads, heat sinks and EMI tapes also incorporates functionality beyond tape.
MedicalIn receiving medical aids, whether it is a small plaster or life-saving surgery, the patient’s experience is initially defined by the sensation of the skin. As many medical applications and solutions are applied to the skin through adhesion, a bonding solution that is skin-friendly is a critical consideration in the medical products. We work with
global leaders in the medical industry to develop the next generation of skin-friendly products always with the patient’s comfort in mind.
Our products are used in a broad range of medical applications including medical devices, wound care and consumer products. The products include wound dressings, foams, films, drapes, ECG, pulse oximetry and MRI applications.
Financial Statements
Governance
Business R
eviewO
verview
Scapa Group plc Annual Report and Accounts 2011 3

Chairman’s Statement
James Wallace, Chairman
‘We are building the foundation for sustainable and profitable growth.’
4 Scapa Group plc Annual Report and Accounts 2011

In the fiscal year 2011, Scapa Group took significant steps towards sustainable and profitable growth, achieving results ahead of earlier expectations. Whilst we recognise that we are at the beginning of the journey, we are very pleased with our progress this year. We have reorganised the business around the four strategic markets of Medical, Industrial, Electronics and Transportation and strengthened the management team to deliver our expectations. We have focused our efforts on improving the quality of our business portfolio toward higher value, application-specific products rather than high volume commodities. We have improved our operational execution and efficiency to deliver and exceed our customers’ expectations. We have made investments, both in capital and people, to lay the foundations for our future and vision.
Financial highlightsRevenue increased 8.8% to £192.3m and operating profit significantly increased to £8.0m (2010: £1.5m loss) with no exceptional items charged during the year (2010: £3.1m). The operating margin improved progressively throughout the year.
The strong focus on working capital improved our net cash balance to £18.8m (2010: £11.4m) even after incurring a cash outflow of £6.1m relating to legacy issues.
No dividend is proposed for the year. The future recommendation of dividends will stay under review as the Group continues to make progress towards sustainable profitability and cash generation.
Business performanceMedical performance was strong, growing sales by 29%. The reorganisation around the market enabled us to properly allocate the resources and focus to maximise our position at our customers who are global leaders. Given our current market share at these customers and our long-standing relationships, we believe that our potential is significant.
Industrial grew 6% after concentrating on improved product mix. The focus on a higher quality portfolio resulted in a rationalisation of our product range and pricing strategy. As a consequence, we closed our Carlstadt facility in the USA and implemented a series of price adjustments to pass on the increases in input costs. The energy-related accounts, which we identified as strategic segments within Industrial, contributed to the increase in growth.
Electronics/Asia increased 3.2% as we re-profiled the portfolio from cash-consumptive trading business to locally manufactured products for the electronics market. During the year, we made significant investment to address the electronics market. We invested in new production capacity, opened a new R&D laboratory close to our strategic customers and built a team with significant experience in the sector. The focus this year has been to ensure that the investments are properly deployed and enable us to fully engage in this fast-growing and dynamic market.
Transportation grew 2.7% benefiting from improved second half performance. The recovery of the automotive industry during the year has continued into the current financial year.
Legacy issuesThe deficit on the Group defined benefit retirement plans now stands at £35.0m (2010: £38.6m), its lowest point in nine years. The Group deficit post tax is £25.6m (2010: £27.7m). The reduction in the deficit was the result of asset increases of £3.7m and a marginal increase in liabilities of £0.1m. The change in assumption in the UK to CPI from RPI to calculate deferred member pensions helped reduce the pension liabilities by around £3.2m.
We are now entering year two of our three-year contributions agreement with the UK pension trustees. During 2011/12 our UK and overseas contributions will be approximately £5.1m (2010: £4.4m) including £0.5m of PPF catch-up payments from
governance best practice. The exercise demonstrated that the current mix of talents and experience of the Board as a whole are appropriate to carry the Group into the next challenging phase of its development.
PeopleDuring the year we have assembled a team of experienced and capable executives to implement our strategy and the Board is confident that the new Leadership Team will deliver the short-term expectations as well as establish a platform of entrepreneurialism and accountability to drive sustainable and profitable growth. The quality of our people continues to be our core strength and I am delighted that we have further enhanced our capabilities in so many parts of the business and that cultural change is being embraced. On behalf of the Board, I would like to thank all our employees around the world for their commitment, hard work and continuing support over the last year.
OutlookOur focus for the coming year will continue to be profits and cash generation to further cement the foundation for the future. Much work will be done to generate greater return from our asset base through improved operational efficiencies and supply chain management. We will continue to prioritise profitable growth in strategic sectors over commodity volume business. We will also continue to invest in Medical and Electronics where we are confident of our strategy and competitive position. Within the Industrial market we are identifying and focusing on attractive segments with high potential that provide improved returns on our investment. The strategic management of our business portfolio will enable us to better respond to the many uncertainties in the current macro environment, particularly rising input costs.
As we build on the progress made last year, we are in a strong position to take advantage of market opportunities and we are confident that we will continue to improve and make further progress in the new financial year.
J A S Wallace Chairman
‘ Whilst we recognise that we are at the beginning of the journey, we are very pleased with our progress this year.’
2010/11 and £0.5m of performance-related top-ups, owing to the Group’s strong cash performance in this financial year. Going forward the Group is developing a road map to pursue all liability and administration cost-reduction initiatives that are in the interests of both pension scheme members and the Company.
During the previous financial year the Group undertook an actuarial and legal review of the outcome of all current and future potential asbestos-related claims against the Group. That review has been revalidated in respect of the current financial year. We remain confident that there will be no impact of these historic product liability claims on the Group’s profitability and there is adequate provision in the accounts for the continuing costs of defending against any claims.
BoardWe welcomed Paul Edwards as the new Finance Director during the year. Having been appointed since the last AGM, Paul will be proposed for election at the next AGM in July 2011. Richard Perry and Mike Buzzacott, the Non-Executive Directors who retire by rotation, will also be proposed for re-election at the AGM.
We believe that good governance adds value and reduces risk to the business and as such we continually develop and improve our governance structures. This year, as in previous years, the Board has carried out a rigorous exercise of self-assessment to ensure that its performance meets the needs of both the Company and corporate
Financial Statements
Governance
Business R
eviewO
verview
Scapa Group plc Annual Report and Accounts 2011 5

Highlights
Revenue by market
Medical £33.8m17.6%
Industrial £126.3m65.7%
Electronics £12.9m6.7%
Transportation £19.3m10%
Total £192.3m
IndustrialIndustrial represents a wide range of markets and applications, including construction, foam fabrication, military, printing & graphics and our energy markets of solar, cable and pipeline. Our range covers a larger portfolio of product types than virtually any other manufacturer in our markets.
Financial highlights 3-year trading historyMarkets
Revenue
£126.3m +6%% of Total Revenue
65%
TransportationTransportation is a world leader in the design and manufacture of speciality adhesive films and tapes for automotive production. We are engaged with the OEMs and their supply chain partners.
Revenue
£19.3m +2.7%% of Total Revenue
10%
‘Focused on attractive markets where we have a competitive position.’
121.8
119.2
126.3
2008/09 2009/10 2010/11
£m
£m
£m
£m
£m
£m
17.6
18.8
19.3
2008/09 2009/10 2010/11
MedicalMedical is a fully integrated, worldwide supplier of customised medical adhesive solutions, component materials and converted products for the medical device, wound care, hospital, transdermal and consumer industries.
Revenue
£33.8m +29% % of Total Revenue
18% 25.1
26.2
33.8
2008/09 2009/10 2010/11
£m
£m
£m
ElectronicsElectronics has strong partnerships across the world with top tier electronics OEMs, including consumer electronics, telecommunications devices and equipment manufacturers. Our products are application-specific and incorporate functionalities beyond tape and bonding.
Revenue
£12.9m +3.2%% of Total Revenue
7%£m
£m
£m
£m
9.5
12.5
12.9
2008/09 2009/10 2010/11
6 Scapa Group plc Annual Report and Accounts 2011

North America – Revenue of £72.7m (2010: £63.1m) growth of 15.2% as we continue to expand our service offering to our customers
– Operating profit significantly increased to £5.3m (2010: £1.3m) improving operating margin to 7.5%
Financial highlights 3-year trading historyRegional highlights
Revenue
£72.7m +15.2%Operating profit
£5.3m +308%
Region locations
Europe North America
Asia
France Canada ChinaGermany USA Hong KongItaly KoreaSwitzerland IndiaUK Malaysia
Revenue by region
Europe £106.7m55.5%
North America
£72.7m37.8%
Asia £12.9m6.7%
Operating profit by region
Europe £3.3m
North America
£5.3m
Asia £0.4m
Global presence
Europe – Revenue of £106.7m (2010: £101.1m) growth of 5.5% following market restocking and improving macro
– Operating profit significantly increased to £3.3m (2010: £0.3m) as we have improved profits and margins through strong control of costs
– Improved operational performance through centralisation and closure of Barcelona warehouse
Revenue
£106.7m +5.5% Operating profit
£3.3m +1000% 100.2
101.1
106.7
2008/09 2009/10 2010/11
£m
£m
£m
64.3
63.1
72.7
2008/09 2009/10 2010/11
£m
£m
£m
£m
£m
£m
9.5
12.5
12.9
2008/09 2009/10 2010/11
Asia – Investing £1.2m in new line and research and development laboratory to effectively service demanding high growth Electronics industry
– Stepping away from low margin commodity products to more application-specific product portfolio
– Appointed a strong team to deliver the strategy
Revenue
£12.9m +3.2%Operating profit
£0.4m -43%
Financial Statements
Governance
Business R
eviewO
verview
Scapa Group plc Annual Report and Accounts 2011 7

Business Review
Heejae Chae, Group Chief Executive
‘In the past year we have deliveredagainst the core objectives.’
8 Scapa Group plc Annual Report and Accounts 2011

Our strategic objectivesOur strategy remains to align ourselves with the requirements of our global customers and focus on high growth and high margin markets.
The key markets are:
– Medical
– Industrial
– Electronics
– Transportation
We will continue to work closely with our global partners in our target markets to develop bonding materials and solutions. Our extensive technical knowledge and global footprint will enable us to increase our market share with existing customers, many of whom are market leaders.
In the past year we have delivered against the following core objectives:
– Focused on increasing cash through efficient utilisation of working capital
– Increasing margins through targeted price increases, operational efficiency and control of costs
– Significantly increased the strength and depth of the operational management team across the Group
These core objectives remain key to the success of Scapa. Cash generation and improved margins through the transition from manufacturing commodity-based products to developing and producing more application-specific tapes, films and foams will continue to be the focus of Scapa building a sustainable foundation from which we can grow further.
ResultsA summary of the financial results is set out in the table below:
2011 £m
2010 £m
Revenue 192.3 176.7
Operating profit/(loss) 8.0 (1.5)
Net finance costs (1.9) (3.7)
Profit/(loss) on ordinary activities before tax 6.1 (5.2)
Basic earnings/(loss) per share(p) 2.4 (1.9)
Revenue for the year was £192.3m (2010: £176.7m) generating operating profit of £8.0m (2010: £1.5m operating loss) with trading improving throughout the financial year. There was no material movement in revenue for the effects of exchange rates year-on-year.
The first half of the financial year accounted for 51% of revenue. Conversely the split for operating profit was 45% for the first half and 55% for the second half, reflecting the move away from low margin volume business to more application-specific higher margin product.
While the objective has been to concentrate on margins and cash generation, the Group has seen strong year-on-year growth in revenue across all markets, specifically Medical with growth of 29%. The exception is Asia where the strategy has been to delist commodity-based lower margin products while investing in research and development capability and a new production line to increase capacity and develop and drive the Electronics business forward in the coming years.
During the financial year the Group has seen cost pressures in most raw materials but has protected and built margins not only through the change in mix but also through the implementation of price increases across all product sectors and markets.
‘Our focus remains on further improving our margin and cash. We will continue to drive the business towards higher value-added products in growth markets and geographies.’
Scapa Group plc Annual Report and Accounts 2011 9
Overview
Business R
eviewG
overnanceFinancial Statem
ents
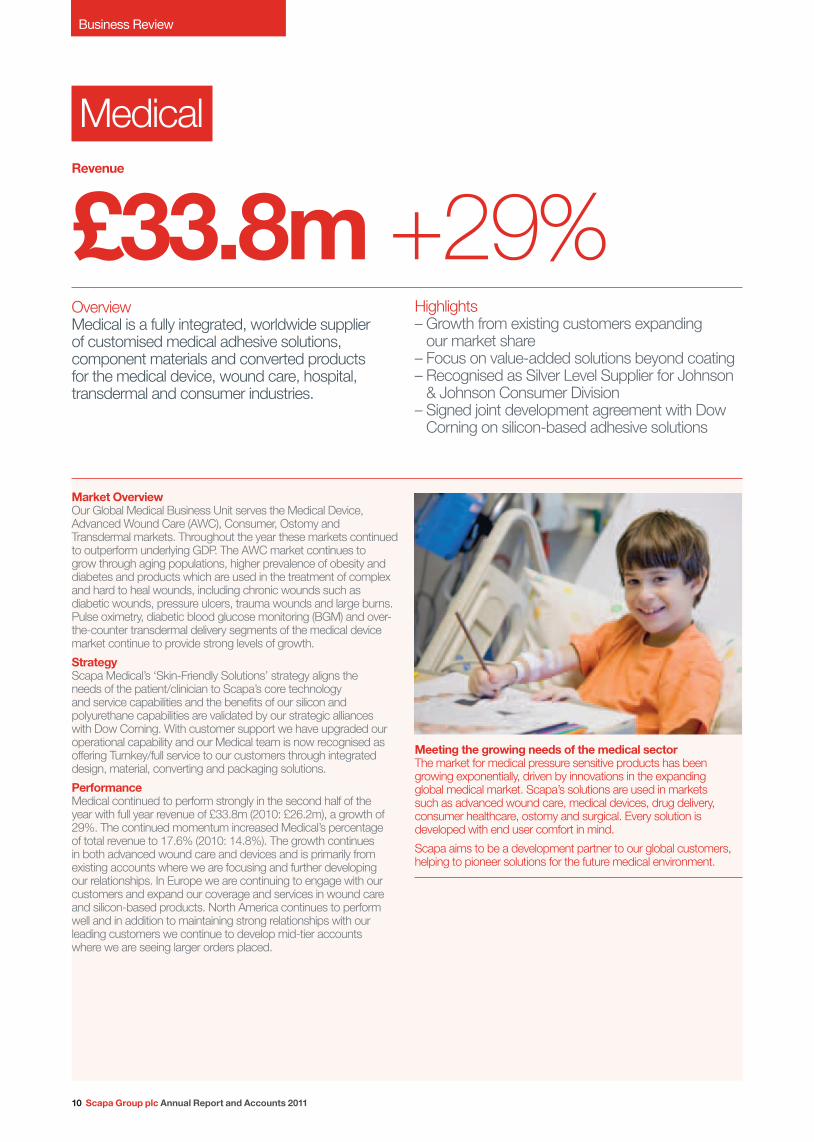
Market OverviewOur Global Medical Business Unit serves the Medical Device, Advanced Wound Care (AWC), Consumer, Ostomy and Transdermal markets. Throughout the year these markets continued to outperform underlying GDP. The AWC market continues to grow through aging populations, higher prevalence of obesity and diabetes and products which are used in the treatment of complex and hard to heal wounds, including chronic wounds such as diabetic wounds, pressure ulcers, trauma wounds and large burns. Pulse oximetry, diabetic blood glucose monitoring (BGM) and over-the-counter transdermal delivery segments of the medical device market continue to provide strong levels of growth.
Strategy Scapa Medical’s ‘Skin-Friendly Solutions’ strategy aligns the needs of the patient/clinician to Scapa’s core technology and service capabilities and the benefits of our silicon and polyurethane capabilities are validated by our strategic alliances with Dow Corning. With customer support we have upgraded our operational capability and our Medical team is now recognised as offering Turnkey/full service to our customers through integrated design, material, converting and packaging solutions.
PerformanceMedical continued to perform strongly in the second half of the year with full year revenue of £33.8m (2010: £26.2m), a growth of 29%. The continued momentum increased Medical’s percentage of total revenue to 17.6% (2010: 14.8%). The growth continues in both advanced wound care and devices and is primarily from existing accounts where we are focusing and further developing our relationships. In Europe we are continuing to engage with our customers and expand our coverage and services in wound care and silicon-based products. North America continues to perform well and in addition to maintaining strong relationships with our leading customers we continue to develop mid-tier accounts where we are seeing larger orders placed.
Meeting the growing needs of the medical sectorThe market for medical pressure sensitive products has been growing exponentially, driven by innovations in the expanding global medical market. Scapa’s solutions are used in markets such as advanced wound care, medical devices, drug delivery, consumer healthcare, ostomy and surgical. Every solution is developed with end user comfort in mind.
Scapa aims to be a development partner to our global customers, helping to pioneer solutions for the future medical environment.
OverviewMedical is a fully integrated, worldwide supplier of customised medical adhesive solutions, component materials and converted products for the medical device, wound care, hospital, transdermal and consumer industries.
Highlights– Growth from existing customers expanding
our market share– Focus on value-added solutions beyond coating – Recognised as Silver Level Supplier for Johnson
& Johnson Consumer Division– Signed joint development agreement with Dow
Corning on silicon-based adhesive solutions
Revenue
£33.8m +29%Medical
Business Review
10 Scapa Group plc Annual Report and Accounts 2011
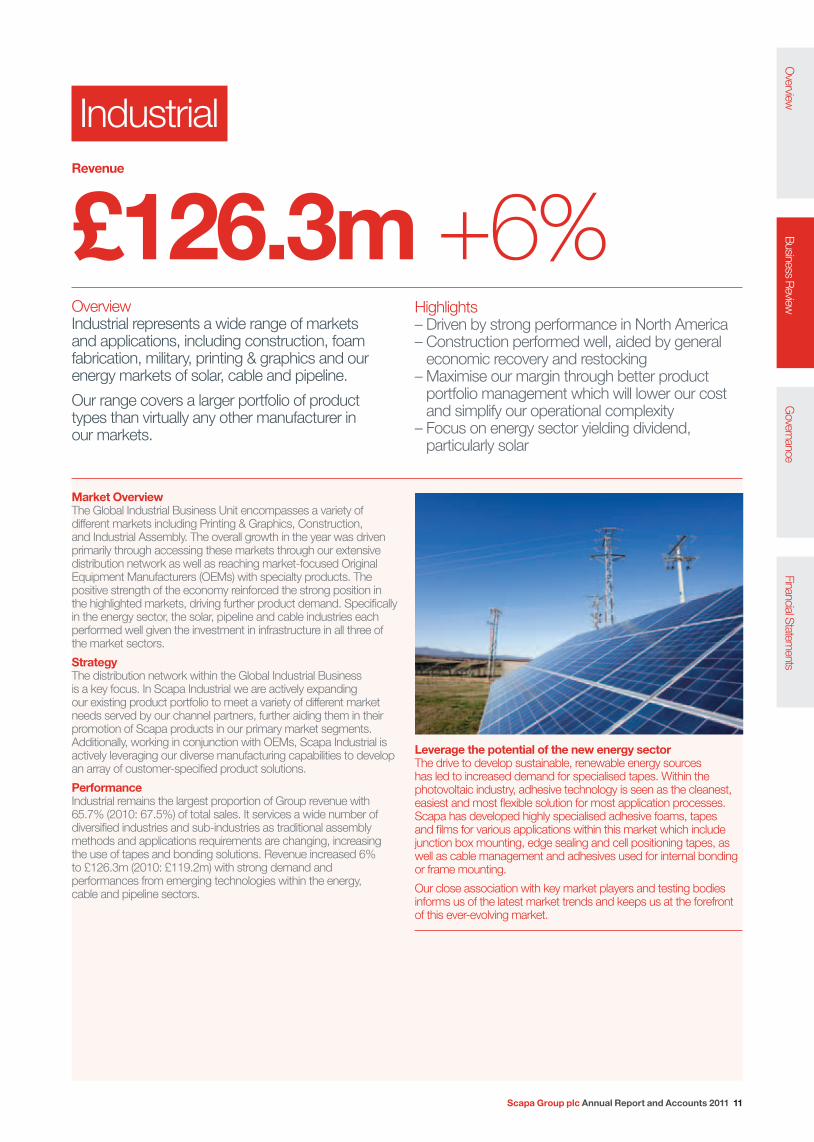
Market OverviewThe Global Industrial Business Unit encompasses a variety of different markets including Printing & Graphics, Construction, and Industrial Assembly. The overall growth in the year was driven primarily through accessing these markets through our extensive distribution network as well as reaching market-focused Original Equipment Manufacturers (OEMs) with specialty products. The positive strength of the economy reinforced the strong position in the highlighted markets, driving further product demand. Specifically in the energy sector, the solar, pipeline and cable industries each performed well given the investment in infrastructure in all three of the market sectors.
Strategy The distribution network within the Global Industrial Business is a key focus. In Scapa Industrial we are actively expanding our existing product portfolio to meet a variety of different market needs served by our channel partners, further aiding them in their promotion of Scapa products in our primary market segments. Additionally, working in conjunction with OEMs, Scapa Industrial is actively leveraging our diverse manufacturing capabilities to develop an array of customer-specified product solutions.
PerformanceIndustrial remains the largest proportion of Group revenue with 65.7% (2010: 67.5%) of total sales. It services a wide number of diversified industries and sub-industries as traditional assembly methods and applications requirements are changing, increasing the use of tapes and bonding solutions. Revenue increased 6% to £126.3m (2010: £119.2m) with strong demand and performances from emerging technologies within the energy, cable and pipeline sectors.
Leverage the potential of the new energy sectorThe drive to develop sustainable, renewable energy sources has led to increased demand for specialised tapes. Within the photovoltaic industry, adhesive technology is seen as the cleanest, easiest and most flexible solution for most application processes. Scapa has developed highly specialised adhesive foams, tapes and films for various applications within this market which include junction box mounting, edge sealing and cell positioning tapes, as well as cable management and adhesives used for internal bonding or frame mounting.
Our close association with key market players and testing bodies informs us of the latest market trends and keeps us at the forefront of this ever-evolving market.
OverviewIndustrial represents a wide range of markets and applications, including construction, foam fabrication, military, printing & graphics and our energy markets of solar, cable and pipeline.
Our range covers a larger portfolio of product types than virtually any other manufacturer in our markets.
Highlights– Driven by strong performance in North America– Construction performed well, aided by general
economic recovery and restocking– Maximise our margin through better product
portfolio management which will lower our cost and simplify our operational complexity
– Focus on energy sector yielding dividend, particularly solar
Revenue
£126.3m +6%Industrial
Scapa Group plc Annual Report and Accounts 2011 11
Overview
Business R
eviewG
overnanceFinancial Statem
ents
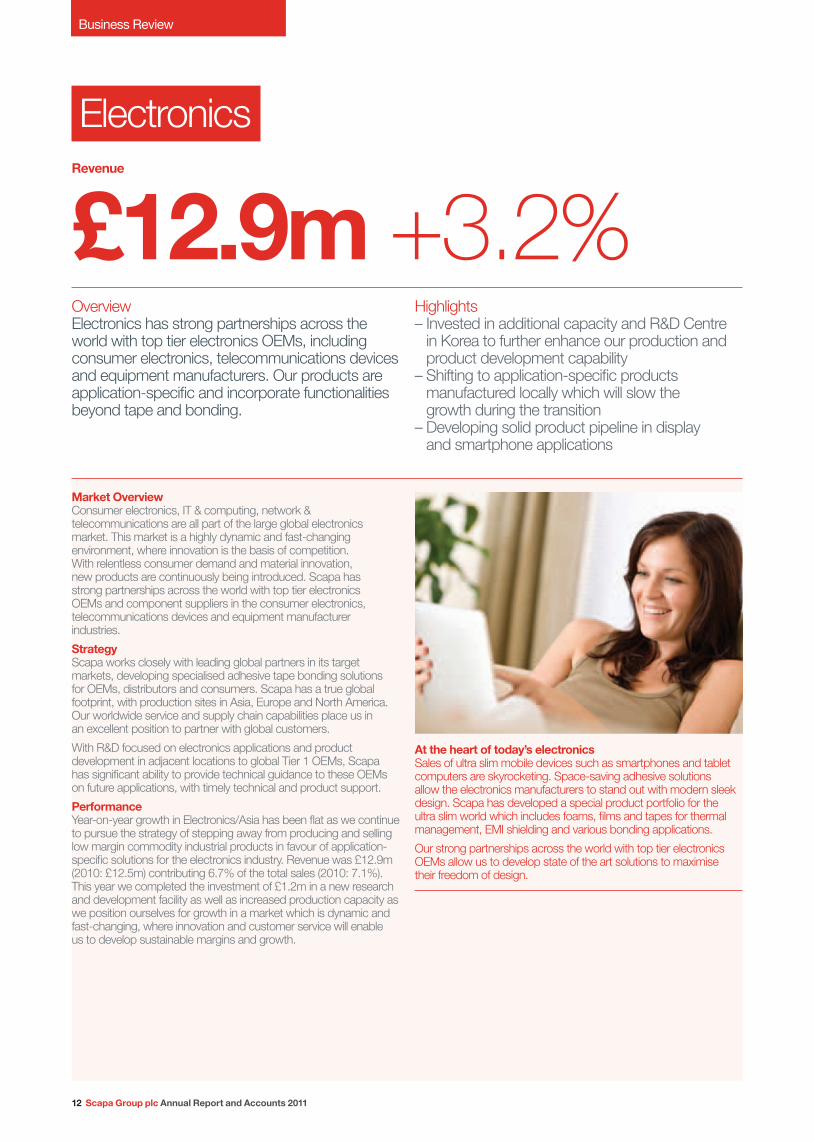
Market OverviewConsumer electronics, IT & computing, network & telecommunications are all part of the large global electronics market. This market is a highly dynamic and fast-changing environment, where innovation is the basis of competition. With relentless consumer demand and material innovation, new products are continuously being introduced. Scapa has strong partnerships across the world with top tier electronics OEMs and component suppliers in the consumer electronics, telecommunications devices and equipment manufacturer industries.
StrategyScapa works closely with leading global partners in its target markets, developing specialised adhesive tape bonding solutions for OEMs, distributors and consumers. Scapa has a true global footprint, with production sites in Asia, Europe and North America. Our worldwide service and supply chain capabilities place us in an excellent position to partner with global customers.
With R&D focused on electronics applications and product development in adjacent locations to global Tier 1 OEMs, Scapa has significant ability to provide technical guidance to these OEMs on future applications, with timely technical and product support.
PerformanceYear-on-year growth in Electronics/Asia has been flat as we continue to pursue the strategy of stepping away from producing and selling low margin commodity industrial products in favour of application-specific solutions for the electronics industry. Revenue was £12.9m (2010: £12.5m) contributing 6.7% of the total sales (2010: 7.1%). This year we completed the investment of £1.2m in a new research and development facility as well as increased production capacity as we position ourselves for growth in a market which is dynamic and fast-changing, where innovation and customer service will enable us to develop sustainable margins and growth.
At the heart of today’s electronicsSales of ultra slim mobile devices such as smartphones and tablet computers are skyrocketing. Space-saving adhesive solutions allow the electronics manufacturers to stand out with modern sleek design. Scapa has developed a special product portfolio for the ultra slim world which includes foams, films and tapes for thermal management, EMI shielding and various bonding applications.
Our strong partnerships across the world with top tier electronics OEMs allow us to develop state of the art solutions to maximise their freedom of design.
OverviewElectronics has strong partnerships across the world with top tier electronics OEMs, including consumer electronics, telecommunications devices and equipment manufacturers. Our products are application-specific and incorporate functionalities beyond tape and bonding.
Highlights– Invested in additional capacity and R&D Centre
in Korea to further enhance our production and product development capability
– Shifting to application-specific products manufactured locally which will slow the growth during the transition
– Developing solid product pipeline in display and smartphone applications
Revenue
£12.9m +3.2%Electronics
Business Review
12 Scapa Group plc Annual Report and Accounts 2011

Automotive technologyEvery year millions of vehicles are produced worldwide, with each new model requiring individual tape solutions. Scapa’s converting and die cutting capabilities offer customised solutions aimed at improving the manufacturing process whilst reducing waste material. Adhesive tapes offer many benefits during vehicle assembly, providing instant bonds that will maintain their strength throughout the vehicle’s lifetime.
Scapa’s aim is to develop adhesive solutions with transportation OEMs, utilising our converting capabilities and global footprint.
Market OverviewTransportation segments had to recover more than most industrial markets from the economic downturn of 2009. In 2010 segments grew again and, more significantly, established healthy platforms for 2011 and beyond. From aerospace and automotive to ship-building, the Scapa Transportation team delivers technical solutions for applications including electrical wire harness, noise and vibration, assembly and trim. Market product ranges utilise technically innovative materials and high performance adhesive systems to ensure full compliance to the stringent OEM specifications that drive this business and its key global customer requirements.
StrategyOur Global Transportation Business Unit continues to offer a wide range of solutions to meet the growing demands of the markets that it serves. We have established differential management of our OEM and Tier 1 customers in Europe, NA and Asia and co-ordination of customers globally where appropriate and beneficial. As a large percentage of our business is within the wire harness segment we have maintained a proactive approach to total product life cycle management, resulting in a change in the mix and profitability of our offering. We continue to leverage our global reach within the design systems segments with growth from our materials, coating and converted parts offerings.
PerformanceTransportation delivered revenue growth of 2.7% to £19.3m (2010: £18.8m) and remains 10% of the overall Group revenue. We continue to sell to OEMs and their supply chain partners and produce technically innovative products to satisfy the stringent specifications of a demanding market.
OverviewTransportation is a world leader in the design and manufacture of speciality adhesive films and tapes for automotive production. We are engaged with the OEMs and their supply chain partners.
Highlights– Demand has recovered throughout the year– Focus on margin and cost to serve– Expand beyond wire harness products– Increase market share from current global
customers
Revenue
£19.3m +2.7%Transportation
Scapa Group plc Annual Report and Accounts 2011 13
Overview
Business R
eviewG
overnanceFinancial Statem
ents

Business Review
EuropeThe trading performance in Europe improved with revenue growth to £106.7m compared to £101.1m in 2010, an increase of 5.5%. With only 10% of Group sales derived from the UK, the driver for growth was from the other main economies in Europe, specifically France and Germany as demand was driven by a mix of restocking and improving macro conditions in the Industrial and Transportation markets. Medical contributed strongly as we continue to improve and expand our relationships with our Medical customers in advanced wound care as they seek to improve their competitive position.
Operating profit was significantly ahead of the prior year at £3.3m (2010: £0.3m). As a consequence operating margins also improved to 3.1% (2010: 0.3%). In line with the rest of the business, Europe has incurred both energy-related and raw material cost pressure which was felt throughout the financial year particularly in rubber, cotton and specific resins. In the second half of the year we implemented a number of strategic price increases which contributed towards a much improved second half performance well ahead of the first, delivering £2.5m which was an operating margin of 4.6%, above the Group average of 4.2%.
The cost control initiatives and a plant closure have been completed and culminated in the closing of our warehouse in Barcelona. There has been a high level of attention to maintaining the benefits in the financial year and, coupled with improved efficiency and pricing, this has produced a solid improvement in the performance.
North AmericaRevenue in North America has increased year-on-year by 15.2% with strong performances across all segments. Medical contributed strongly with demand remaining steady throughout the year as we continue to win an increased market share from our current customers such as Johnson & Johnson and Covidien. Industrial also performed well with a strong contribution from emerging technologies and energy sectors. The growth is pleasing given the closure of our Carlstadt facility in New Jersey USA. Although loss-making in the prior financial year, the closure has removed capacity and impacted volume and therefore revenue in this financial year.
Operating profit for the region increased substantially to £5.3m (2010: £1.3m) accelerating margins to 7.3% for the year (2010: 2.1%).
‘Building a solid financialplatform for growth.’
Europe revenue £m
North America revenue £m
Asia revenue £m
£106.7m+5.5%
£72.7m+15.2%
£12.9m+3.2%
100.2
101.1
106.7
2008/09 2009/10 2010/11
£m
£m
£m
64.3
63.1
72.7
2008/09 2009/10 2010/11
£m
£m
£m
£m
£m
£m
9.5
12.5
12.9
2008/09 2009/10 2010/11
14 Scapa Group plc Annual Report and Accounts 2011

‘Strong growth driven by key markets where we have a competitive advantage.’
AsiaThis year has seen a change in strategy in our Asian operations. We are moving away from commodity low margin products and concentrating on more engineered application-specific technologies. To support this strategy in the year we completed the investment of £1.2m in a new production line and state of the art research and development facility in Anyang, South Korea, which is within a twenty mile radius of our strategic customers Samsung and LG. This ensures we can provide the close customer support and product development in line with the lifecycle of the development of our customers’ products.
As a consequence the second half of the year saw a revenue reduction of £0.9m on the first half which led to a modest increase in the level of turnover to £12.9m in 2011 compared to £12.5m in 2010.
This year has seen the Group invest in the Asia cost base to both improve our research and development capability and sales capacity throughout the region to help drive future growth in the Electronics market. As a result the operating profit was £0.4m compared to £0.7m in 2010, reducing the margin to 3.1% (2010: 5.6%).
CorporateHead office costs increased by £0.3m to £1.0m (2010: £0.7m) due to recruitment of a number of newly created senior positions within the Head Office. While cost control and value for money are fundamental building blocks in the Group’s make up, we are investing in the cost base to ensure the future development of the Group is supported and controlled. The introduction of a Group HR Director and global HR function alongside the investment in a Group business development team are two examples.
Exceptional itemsThere are no exceptional items (2010: £3.1m charge).
Finance costsNet finance costs decreased by £1.8m due to a decrease in the pension financing charge of £1.7m. The IAS 19 finance charge fell due to the increase in asset values in the previous year and reduction in the interest discount rate to 5.6% compared to 5.7% at March 2010. Although cash levels improved during the year, low interest rates have restricted returns.
TaxationThe Group tax charge of £2.6m (2010: £2.4m credit) includes £2.1m charge (2010: £1.4m credit) on operating activities and £0.5m charge owing to a change in the UK tax rate (2010: £Nil).
The operating activities charge is made up of £1.1m of deferred tax and £1.0m of current tax.
The announcement during the year of the future UK corporation tax rate reduction from 28% to 26% had a deferred tax impact of £1.2m (2010: £Nil), of which £0.5m has been charged through the profit and loss account with the residue following the pensions movement through reserves.
The effective rate of tax for the Group, excluding the impact of the future rate change in the UK, is 34.4%. This is higher than the UK standard rate of 28% owing mainly to the Group operating in territories which have a higher statutory tax rate than the UK. Despite the high effective rate, the Group’s net cash tax payment in the year was minimal, due to the utilisation of tax losses and a tax repayment in the year of £0.3m.
Cash flowThe Group ended the year with net cash of £18.8m (2010: £11.4m), an increase of £7.4m. This includes £6.3m (2010: £6.6m) of restricted cash; the restriction ends December 2011.
This is a creditable result given that it is after £4.4m (2010: £5.8m) of defined benefit pension payments, exeptional cash flows of £1.7m (2010: £5.7m) and £2.2m repayment of debt (2010: £0.2m). Effective management of working capital led to no outflow on cash despite the strong growth in sales (2010: £4.0m inflow), supported by a reduced capital expenditure programme of £1.6m (2010: £2.2m).
Scapa Group plc Annual Report and Accounts 2011 15
Overview
Business R
eviewG
overnanceFinancial Statem
ents

Business Review
‘Continued focus on margin improvementand a strong balance sheet.’
PensionsThe IAS 19 pension deficit has decreased by £3.6m to £35.0m (2010: £38.6m). The three UK defined benefit schemes, which are closed to new members and to future accrual, represent the largest portion of the deficit and that balance now stands at £28.8m (2010: £32.9m). The net movement in the UK deficits was the result of increases in asset values of £3.0m and a reduction in total liabilities of £1.1m, the latter being mainly the impact of the change in assumption from RPI to CPI.
Last year the Company concluded the negotiations with the Trustees of all three UK defined benefit pension schemes with respect to contributions for three years of which two years remain. Affordability and a strong sponsoring employer were the key shared objectives and as a result annual recurring contributions for the three years from 1 April 2010 were reduced by £0.5m per annum. During the three-year period this annual shortfall can be made good if cash flow targets are outperformed with any benefit being shared between the Company (67%) and the pension funds (33%), with the funds’ share limited to the cumulative shortfall. At the end of the three-year period contributions revert to their original level and any remaining cumulative deferred contributions are made good.
The net impact of the agreement has resulted in future UK cash pension costs of up to £3.5m per annum for the next two years. Total pension costs including UK and overseas schemes, plus PPF levy and administration expenses, will be £5.1m for 2011/12.
As noted above, the Group continues to recognise the deferred tax asset of £9.4m in respect of future pension deficit reduction payments which gain tax relief at the time of payment (as opposed to accrual). The pension deficit, net of deferred tax, is therefore £25.6m which includes a provision for future administration and PPF levy costs of around £6.5m.
Asbestos litigationDuring the previous financial year the Group undertook an actuarial and legal review of the outcome of all current and future potential claims against Scapa. That review has been revalidated in respect of the current financial year. In parallel, a similar review of the Group’s product liability insurance has been carried out.
As a result, the Group last year recognised a liability and an equal and opposite insurance asset of £20.3m. The position has been revalidated as referred to above, the only movements being foreign exchange and the unwind of the discount, giving a closing balance of £19.9m. In addition, provisions of £5.7m (2010: £7.5m) remain to pay the Group’s share of any future litigation costs.
We continue to hold the view that Scapa’s products have not been the cause of any alleged personal injury and we therefore continue to adopt the same robust stance with respect to all of the remaining personal injury claims in the USA arising from businesses sold in 1999. During the year 4,967 more plaintiff claims were dismissed and the total now stands at 8,116, a reduction of almost 26,000 since the peak of around 34,000 in 2004.
Shareholder fundsShareholder funds have increased £3.3m to £68.6m (2010: £65.3m). Contribution from income was £2.9m (2010: £3.0m), being profit after tax of £3.5m with net pension gains of £0.9m (2010: £6.1m), offset by unfavourable currency impact on overseas asset values of £0.8m (2010: £0.3m) and tax charges of £0.7m (2010: £Nil). In addition, movements in equity relating to share issues and share options have added £0.4m.
Performance summaryThe Group’s performance this financial year is pleasing with growth across all business units and in all regions. Group profits have significantly improved on the prior year and the Balance Sheet continues to strengthen. Strong operational and financial management continues to improve working capital which has contributed to the balance of £18.8m cash on the Balance Sheet. All legacy issues are well understood and controlled and the Group is on a sound footing for sustainable performance.
16 Scapa Group plc Annual Report and Accounts 2011
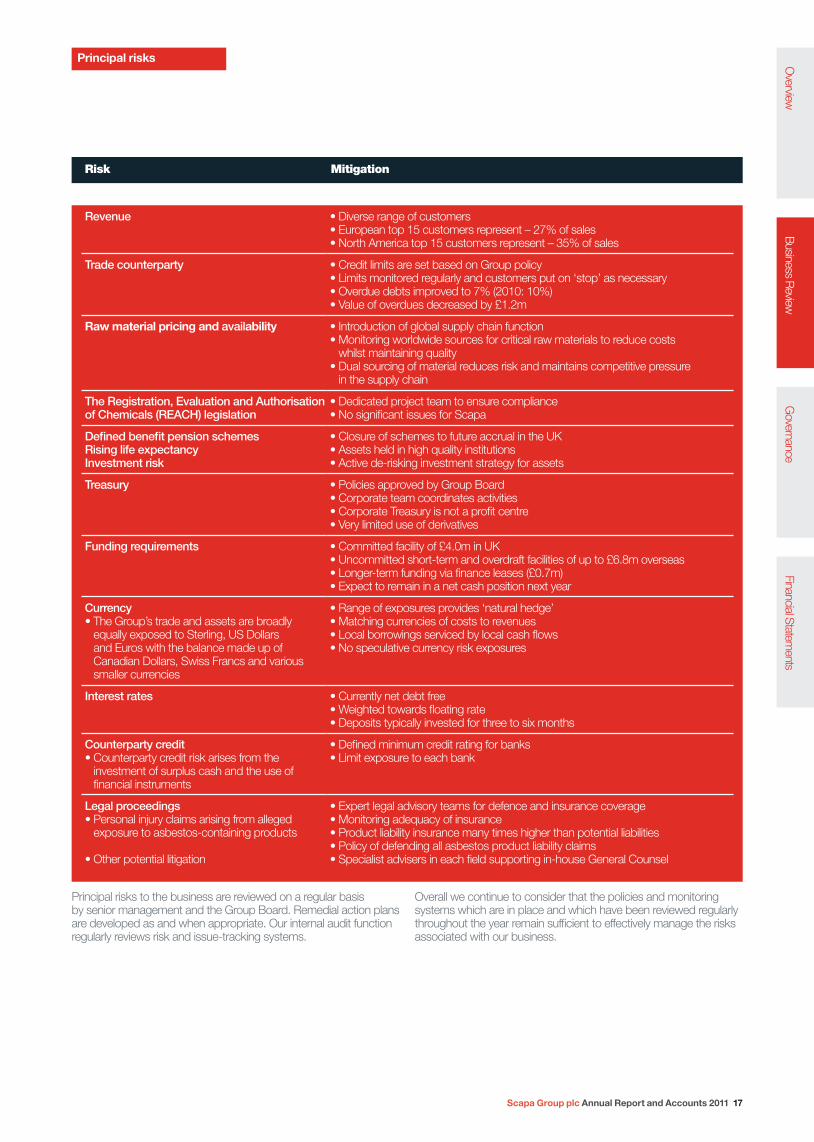
Principal risks
Risk Mitigation
Principal risks to the business are reviewed on a regular basis by senior management and the Group Board. Remedial action plans are developed as and when appropriate. Our internal audit function regularly reviews risk and issue-tracking systems.
Overall we continue to consider that the policies and monitoring systems which are in place and which have been reviewed regularly throughout the year remain sufficient to effectively manage the risks associated with our business.
Revenue • Diverse range of customers• European top 15 customers represent – 27% of sales• North America top 15 customers represent – 35% of sales
Trade counterparty • Credit limits are set based on Group policy• Limits monitored regularly and customers put on ‘stop’ as necessary • Overdue debts improved to 7% (2010: 10%)• Value of overdues decreased by £1.2m
Raw material pricing and availability • Introduction of global supply chain function• Monitoring worldwide sources for critical raw materials to reduce costs
whilst maintaining quality• Dual sourcing of material reduces risk and maintains competitive pressure
in the supply chain
The Registration, Evaluation and Authorisation of Chemicals (REACH) legislation
• Dedicated project team to ensure compliance• No significant issues for Scapa
Defined benefit pension schemes Rising life expectancyInvestment risk
• Closure of schemes to future accrual in the UK• Assets held in high quality institutions• Active de-risking investment strategy for assets
Treasury • Policies approved by Group Board• Corporate team coordinates activities• Corporate Treasury is not a profit centre• Very limited use of derivatives
Funding requirements • Committed facility of £4.0m in UK• Uncommitted short-term and overdraft facilities of up to £6.8m overseas• Longer-term funding via finance leases (£0.7m)• Expect to remain in a net cash position next year
Currency • The Group’s trade and assets are broadly
equally exposed to Sterling, US Dollars and Euros with the balance made up of Canadian Dollars, Swiss Francs and various smaller currencies
• Range of exposures provides ‘natural hedge’• Matching currencies of costs to revenues• Local borrowings serviced by local cash flows• No speculative currency risk exposures
Interest rates • Currently net debt free• Weighted towards floating rate• Deposits typically invested for three to six months
Counterparty credit• Counterparty credit risk arises from the
investment of surplus cash and the use of financial instruments
• Defined minimum credit rating for banks• Limit exposure to each bank
Legal proceedings • Personal injury claims arising from alleged
exposure to asbestos-containing products
• Other potential litigation
• Expert legal advisory teams for defence and insurance coverage• Monitoring adequacy of insurance• Product liability insurance many times higher than potential liabilities• Policy of defending all asbestos product liability claims• Specialist advisers in each field supporting in-house General Counsel
Overview
Business R
eviewG
overnanceFinancial Statem
ents
Scapa Group plc Annual Report and Accounts 2011 17
Business Review
‘We continue to implement Leanmanufacturing techniques.’
Protecting the environmentScapa Group plc continues to recognise the importance of managing the consumption of the world’s natural resources as well as providing a safe and healthy working environment for its employees, and also the neighbourhoods in which we operate. Clearly, however, the successful growth of our business will lead to the consumption of more resources, on an absolute basis. We therefore attempt to significantly reduce, or where possible eliminate, the amount of resource consumed for each unit of production. The Group routinely undertakes audits of our Environmental, Health and Safety programmes utilising both internal and external third parties where appropriate.
Air emissionsScapa actively seeks to minimise the discharge of VOCs, particulates and odour into the atmosphere. Solvent-based adhesive coating processes are used in many locations throughout Scapa. Evaporated solvents are captured and effectively destroyed using modern thermal oxidizers or condensed using solvent recovery systems. All sites using thermal oxidizers undergo strict third-party testing to ensure that all legislative requirements are met or exceeded.
Solvent consumptionWhilst Scapa utilises solvent-based adhesives in all regions, much work continues to be carried out to reduce the quantity of process solvent for environmental and cost reasons. Work continues by our Research and Development teams to develop adhesive solutions and processes to completely eliminate the use of solvents for specific applications. Within our Medical and Industrial businesses, we offer a wide range of solventless adhesive tape solutions and continue to investigate new and innovative adhesive solutions. We continue to identify opportunities where focused capital investment can help reduce solvent consumption.
Oil consumptionThere continues to be no significant direct use of oil within Scapa operations and where it is used it is predominantly for equipment lubrication. Lubrication oils are tested for maximum duration of use and disposed of through licensed disposal agents meeting all local and regional environmental standards.
Gas and electricity consumptionGas and electricity remain significant inputs to Scapa processes in all regions. Constant reduction of energy usage is a key component of the Scapa environmental programme. We continue to work to implement energy management systems at our various global sites to help reduce overall consumption.
Manufacturing wasteThe Group continues to drive its implementation of Lean manufacturing techniques across its sites. As this initiative extends and focuses upon the elimination of non-value-added activities, it will lead to reductions in manufacturing waste and our overall environmental footprint. Examples of improvement activities are:
– We continue to target the overall reduction in manufacturing waste sent to landfill at all sites
– In Valence (France) we have further optimised our coating and slitting processes to reduce ‘edge waste’ which we can then extend to other processes
– Across our North American sites the SAP System has been extended with real-time shop-floor data capture systems to provide timely data to drive significant reductions in waste
– In Windsor (USA) we have approved capital investment to upgrade the control systems on the adhesive coating lines
– For the twelfth consecutive year the Inglewood, CA site received a WRAP Award (Waste Reduction Awards Program) from the California Integrated Waste Management Board
18 Scapa Group plc Annual Report and Accounts 2011
REACHDuring 2010 a number of additional substances were added to the list of substances of very high concern (SVHCs) though none of these affect Scapa’s product portfolio. Some of the existing SVHCs are in Scapa’s product portfolio and two of these will be placed into annex XIV which means they will be banned from commercialisation unless authorisation is granted. In effect these two substances will be banned from 2015. Accordingly Scapa has notified existing customers regarding SVHCs and we have a programme of work to remove these materials from finished products which has already resulted in some reformulations. Accordingly we see no significant risk arising from current REACH legislation.
Improving safety cultureScapa considers its safety performance as a top priority. Our ultimate aim is, and must only be, to achieve a result where none of our employees comes to any harm whilst engaged in Scapa Group business. The Group realises that this is an extremely challenging goal that can only be achieved through constant vigilance and continuous improvement in the working environment and business processes, but above all through the attitude and behaviour of every single member of staff.
Scapa and its employees agree that the delivery of a safe working environment and safe systems of work is a shared responsibility. The Board believes that it is the ‘tone at the top’ that is a key driver of the Group’s safety culture. The Board is committed to reinforcing and improving health and safety activities within all sites to ensure the constant safety and wellbeing of our employees. Standards of performance are set and monitored by the Board and safety KPIs form a key part of the Group’s review process. The Leadership Team is responsible for providing guidance, focusing on best practices and overseeing auditing of our manufacturing sites and processes.
‘We continually strive to improvesafety across our processes.’
Health and Safety – Review of performanceThe Board safety targets for the year 2010/11 were increased to a minimum 20% annual improvement in all KPIs. This priority is strongly reinforced by the Board who remain directly involved in monitoring performance on a regular basis. Key focus areas include:
– Machine guarding
– Risk Assessment Review
– Material movement, handling and storage
– Proper and improved use of Personal Protective Equipment
– Employee training
– Auditing of Health and Safety policies and practices
In addition our key safety opportunities process identified more than 3,000 opportunities for potential improvement in our facilities during the year. All sites within the Group report Key Performance results monthly and are audited at least twice a year against a standard audit template to ensure a consistently high level of compliance and continuous improvement. Every serious incident or accident continues to be reviewed by the Group Operations Director, local site leadership teams and, in the most serious cases, the Board. During the year a new Group Health & Safety Leadership position was created to lead further improvements.
2011/12 Health and Safety goalsThe ultimate goal for all Scapa sites will always be zero accidents and zero lost days. Anything less would send the message that some level of injury is acceptable. We aim to make continued annual improvements to our performance and for the next financial year the Board has again targeted a 20% annual improvement in all safety KPIs. Constant vigilance and reinforcement of key messages is required from all our staff.
Underpinning this goal of improving the safety culture, bonus payments are made to Senior Managers and Directors which are, in part, dependent upon achievement of key health and safety goals.
Scapa Group plc Annual Report and Accounts 2011 19
Overview
Business R
eviewG
overnanceFinancial Statem
ents

Governance
R J PerryNon-Executive Director
Richard Perry was appointed to the Scapa Board in June 2005 and is Chairman of the Audit Committee. Richard is currently Group Finance Director of Fenner plc to which position he was appointed in 1994. He was formerly a senior audit partner with Price Waterhouse.
M C BuzzacottNon-Executive Director
Mike Buzzacott joined the Board in March 2008 and is currently Chairman of the Remuneration Committee. Mike has extensive experience of the global chemicals industry where he spent 14 years in operational roles in BP Chemicals, before retiring as Group Vice President Petrochemicals in 2004. Mike is currently Non-Executive Director at Genus PLC and Croda International Plc.
M R StirzakerCompany Secretary and General Counsel
Mark Stirzaker is a UK qualified solicitor and joined Scapa in January 2006 with responsibility for its company secretarial and legal affairs worldwide. He has extensive experience of commercial legal matters in the manufacturing industry, having previously been Head of Legal at British Vita PLC for over 20 years.
H R ChaeGroup Chief Executive
Heejae Chae joined the Board as Executive Director in September 2009 and subsequently became Group Chief Executive in November 2009. Prior to joining Scapa, Heejae was Group Chief Executive of Volex Group plc. He was previously the Group General Manager, Radio Frequency Worldwide, for Amphenol Corporation. He spent the early part of his career in finance at The Blackstone Group and Credit Suisse First Boston before moving into industry.
P EdwardsGroup Finance Director
Paul Edwards joined the Board in September 2010 as Group Finance Director. Prior to joining Scapa he was Group Finance Director of NCC Group plc. Paul is a Chartered Management Accountant and MBA and spent the earlier part of his career in manufacturing, logistics and services sectors.
J A S WallaceChairman
James Wallace joined the Board in August 2007 and became Chairman in October 2007. He is currently also Chairman of the Nominations Committee. An accountant by qualification, he spent the majority of his very successful executive career at Pifco Holdings PLC until 2001. James has held various Non-Executive Director positions and was Chairman of Bodycote plc from January 2002 until April 2008. Currently James is a Non-Executive Director of Manchester Airport Group plc and Cryptologic Ltd.
Board of Directors
20 Scapa Group plc Annual Report and Accounts 2011

G KimManaging Director – Asia
Gene Kim joined Scapa as Managing Director – Asia in February 2010. Prior to Scapa, Gene was Director of Strategic Projects at Cisco Systems. His prior experience also includes Samsung Electronics, Mercer Management Consulting and Arthur D Little.
T SheedyGroup HR Director
Tracy Sheedy joined Scapa in September 2010 as Group HR Director. Before joining the Company, Tracy was Head of Organisation and Capability Development with BAE Systems. Prior to this role Tracy held senior HR roles with ConvaTec, Georgia Pacific and Monsanto.
I R MarchantGroup Operations Director
Ian Marchant joined the Company in February 2010 as Group Operations Director. Prior to joining Scapa, Ian held a number of senior management positions with two international manufacturing businesses, Avon Rubber plc and General Electric Inc.
R SeufertGroup Commercial Director
Ralf Seufert joined Scapa as Group Commercial Director in October 2010. Before joining Scapa he was VP Sales & Marketing and member of the Board at Quadrant Plastic Composites AG in Switzerland. He has previously worked for GE Advanced Materials in senior management positions for global application development and sales.
Leadership Team
L-R: Gene Kim, Tracy Sheedy, Heejae Chae, Ian Marchant, Mark Stirzaker, Paul Edwards, Ralf Seufert
Scapa Group plc Annual Report and Accounts 2011 21
Overview
Business R
eviewG
overnanceFinancial Statem
ents
Report of the Directors
22 Scapa Group plc Annual Report and Accounts 2011
The Directors present their Annual Report and the audited financial statements for the year ended 31 March 2011.
Principal activities and business review Scapa Group plc is the holding company for a group of companies operating in the manufacture and supply of technical adhesive tapes and film. A review of the performance and future development of the Group’s business is contained on pages 4 to 19 and forms part of this report.
Results and dividends Trading profit, before tax and exceptional items, was £8.0m (2010: £1.6m), an increase of £6.4m. Exceptional items in the year were £Nil (2010: £3.1m charge). No interim dividend was paid to shareholders (2010: £Nil). The Directors do not recommend payment of a final dividend (2010: £Nil).
A profit before tax of £6.1m (2010: loss £5.2m) was recorded for the year ended 31 March 2011, with basic and diluted earnings per share of 2.4p and 2.3p respectively (2010: 1.9p loss for both basic and diluted).
Annual General Meeting The Annual General Meeting will be held on 26 July 2011 at the Village Hotel, Pamir Drive, Ashton-under-Lyne, Greater Manchester, OL7 0PG. Details of the business to be considered at the Annual General Meeting and the Notice of Meeting will be included in a separate document.
Purchase of own shares At the forthcoming Annual General Meeting the Directors will once again seek shareholders’ approval, by way of special resolution, for the grant of an authority for the Company to make market purchases of its own shares. The authority sought will relate to up to approximately 10% of the issued share capital and will continue until the Company’s next Annual General Meeting. The Directors consider that the grant of the power for the Company to make market purchases of the Company’s shares would be beneficial for the Company and accordingly they recommend this special resolution to shareholders. The Directors would only exercise the authority sought if they believed such purchase was likely to result in an increase in earnings per share and it would be in the interests of shareholders generally. The minimum price to be paid will be the shares’ nominal value of 5p and the maximum price will be no more than 5% above average middle market quotations for the shares on the five days before the shares are purchased.
Board of Directors The names of the present Directors and their biographical details are shown on page 20. Mr Tenner left the Company on 31 August 2010.
The Articles of Association require each Director to retire and offer himself for re-election by shareholders at least every three years, and also require a minimum of one-third of the Directors to retire by rotation each year.
The Directors retiring under the three-year rule are Mr Perry and Mr Buzzacott. There are no Directors retiring in satisfaction of the one-third rule. Mr Edwards was appointed as an Executive Director on 20 September 2010. Under the Articles of Association he will be required to retire as a Director at the Annual General Meeting and seek re-election by shareholders. The Board has evaluated the performance and effectiveness of Mr Perry, Mr Buzzacott and Mr Edwards and recommends them for re-election.
The interests of the Directors in the shares of the Company as at 31 March 2010 and 31 March 2011 are shown in the Directors’ Remuneration Report as are details of the Directors’ service contracts or letters of appointment. No third party indemnity provisions have been in place for any of the Directors during the year.
Employees and employment policies Scapa is committed to the principle of equal opportunity in employment and to ensuring that no applicant or employee receives less favourable treatment on the grounds of gender, marital status, age, race, colour, nationality, ethnic or national origin, religion, disability, sexuality or unrelated criminal convictions.
Scapa applies employment policies which are believed to be fair and equitable and which ensure that entry into, and progression within, the Company is determined solely by application of job criteria and personal ability and competency.
Scapa aims to give full and fair consideration to the possibility of employing disabled persons wherever suitable opportunities exist.
Employees who become disabled are given every opportunity and assistance to continue in their positions or be trained for other suitable positions.
Scapa recognises the importance of good communications with employees and acknowledges that there should be clear channels of communication and opportunities for consultation and dialogue on issues which affect both business performance and employees’ working lives. As a global business, the mechanisms for achieving this aim vary between different countries and between different businesses within the Group but include in-house newsletters, bulletins and briefing sessions.
A European Forum exists which enables employee representatives in the UK and Continental Europe to discuss overall business issues with senior management of the Group. The Forum holds at least one meeting a year, which is attended by members of the Leadership Team.

Scapa Group plc Annual Report and Accounts 2011 23
Scapa has a combination of unionised and non-unionised operations across the world and is committed to fostering positive employee relations at all of its locations. Training and links with the educational sector reinforce Scapa’s commitment to employee involvement and development.
The Sharesave share option plan gives the opportunity to all UK employees with qualifying service to participate in the equity of the Company. As at 31 March 2011, 61 employees were members of the scheme with 1,762,146 options over shares.
Supplier payment policy The Company’s policy, which is also applied by the Group, is to settle terms of payment with suppliers when agreeing the terms of each transaction, to ensure that suppliers are made aware of the terms of payment, and abide by the terms of payment.
Research and Development The Group’s spend on research and development is disclosed in note 3 and is focused on developing new derivative product applications for addressing and resolving customer and market requirements.
Health and Safety One of Scapa’s primary objectives is to achieve high standards of safety for its employees. Health and Safety is the first standing item on Group Board Meetings and Leadership Team Agendas. Appropriate senior executives, managers and supervisors have defined responsibilities for health and safety and are expected to ensure that the Company’s health and safety policy is adhered to. These responsibilities are reviewed regularly on a national and regional basis to ensure appropriate policy development.
Scapa continues to implement a programme of regular health and safety audits. These audits are undertaken across Scapa’s manufacturing sites. The purpose of the audit programme is to ensure compliance with health and safety legislation, best safety practices and to aim to secure the wellbeing of everyone affected by Scapa’s manufacturing operations.
Financial risk management The Group’s approach to managing financial risk is covered on page 46.
Business ethics The Company requires compliance by its companies and employees with the laws and standards of conduct of the countries in which it does business. This includes legislation implementing anti-corruption and competition law compliance. Employees are required to avoid conflicts of interest regarding Company business, to act lawfully and ethically, and to be responsible for communicating in good faith non-compliance issues of which they become aware.
During the year the Company adopted, and all senior employees formally subscribed to, a Code of Conduct to document and confirm such compliance.
Political and charitable donations It is not corporate policy to make any political donations and, accordingly, no political donations were made during this year. Charitable donations made during this year amounted to £12,159 (2010: £4,919). The majority of charitable donations made, on a discretionary basis, are to organisations based in the vicinity of Scapa sites, especially organisations which support health and educational causes.
Share options Details of the Company’s share capital and options over the Company’s shares under the Company’s employee share plans are given in note 22 of the accounts on page 68.
Major shareholders The Company has been notified that the following have an interest of 3% or more in the issued share capital of the Company, as at 26 May 2011:
%
Cazenove Capital Management 13.46 Rights & Issues Investment Trust 7.20 Schroders plc 6.60 Investec Asset Management 6.58 River & Mercantile Asset Management 6.23 UBS Global Asset Management 5.81 Cazenove UK Dynamic Absolute Return Fund 4.82 Royal Bank of Canada 4.54 Deutsche Bank AG 3.96 M&G Investment Management 3.57 Lowland Investment Company Plc 3.04
Overview
Business R
eviewG
overnanceFinancial Statem
ents
Report of the Directors continued
24 Scapa Group plc Annual Report and Accounts 2011
Takeover directive The Company has only one class of ordinary share and these shares have equal voting rights. The nature of individual Directors’ holdings is disclosed on page 28. There are no other significant holdings of any individual.
Auditors and disclosure of information to auditors So far as each Director is aware, there is no relevant audit information of which the Company’s auditors are unaware. Each Director has taken all the steps that he ought to have taken as a Director in order to make himself aware of any relevant audit information and to establish that the Company’s auditors are aware of that information.
The auditors, PricewaterhouseCoopers LLP, have indicated their willingness to continue in office and a resolution that they be re-appointed will be proposed at the Annual General Meeting.
Corporate governance The Company’s statement on Corporate Governance can be found in the Corporate Governance Report on pages 30 to 34 of these financial statements. The Corporate Governance Report forms part of this Directors’ Report and is incorporated into it by cross-reference.
By order of the Board Registered Office:
M R Stirzaker, BA, Solicitor Company Secretary 26 May 2011
Manchester Road Ashton-under-Lyne Greater Manchester OL7 0ED

Directors’ Remuneration Report
Scapa Group plc Annual Report and Accounts 2011 25
This report describes the role and composition of the Remuneration Committee (‘the Committee’), the Company’s remuneration policy and the arrangements currently applicable for the remuneration of Executive and Non-Executive Directors. The report has been prepared in accordance with the Directors’ Remuneration Report Regulations 2002, although the Regulations do not strictly apply to an AIM listed company. A resolution to approve the report will be proposed at the Annual General Meeting 2011.
The parts of the report which are subject to audit by PricewaterhouseCoopers LLP are indicated with an asterisk (*). All other parts of the Directors’ Remuneration Report are unaudited.
Remuneration Committee The Committee is comprised of the Non-Executive Directors of the Company, namely Mr Wallace, Mr Buzzacott (Chairman of the Committee) and Mr Perry. The members of the Committee have no personal financial interest in the Company other than as shareholders and the fees paid to them as Non-Executive Directors. The Company Secretary acts as secretary to the Committee.
The Chief Executive is not a member of the Committee but is invited to attend meetings if appropriate. The Committee liaises with the Chief Executive regarding proposals concerning the remuneration of the Group Finance Director and other specified senior executives. The Chief Executive is not present when the Committee considers issues relating to his remuneration.
The Committee determines, on behalf of the Board, the Company’s policy on the remuneration of the Executive Directors. The Committee determines the total remuneration packages for these individuals, including the recruitment terms, remuneration benefits, employment conditions, pension rights and any compensation payments on termination of office. The Committee also determines the remuneration framework for other specified senior executives. The Committee met four times in the year to 31 March 2011 and all members of the Committee attended each of the meetings.
Advisers The Committee takes professional advice from within and outside the Company when it feels it to be appropriate to do so.
Remuneration policy The Committee’s policy for the remuneration of Executive Directors aims to:
• pay basic salaries which equate with those paid by other comparator companies of similar market capitalisation and business sector;
• provide executives with opportunities to increase their remuneration by the attainment of key short-term and longer-term objectives;
• encourage the holding of shares in the Company (including the retention of shares acquired via company share-based plans); and • provide incentives which aim to align the interests of executives and shareholders and promote the creation of long-term value.
Components of remuneration The components of the remuneration packages for Executive Directors are as follows:
Basic salaries This is a fixed cash sum, payable monthly. Salaries are reviewed annually by the Committee in the light of individual performance and market comparisons for similar jobs. Factors considered for comparison purposes include company type and sector, measures of company size and degree of international scope. Changes to the Chief Executive’s salary are normally effective from 1 January, and any changes to the salaries of the other Executive Directors normally take effect from 1 April. The basic salaries of the Executive Directors for the year ending 31 March 2011 are set out in the table on page 26.
Annual bonus The Company operates a bonus scheme for the Executive Directors and senior executives based on a percentage of basic salary at the start of the financial year. Bonus payments are not pensionable. The basis of the Executive Directors’ bonus scheme and the targets to be attained are reviewed annually by the Committee.
For the year ended 31 March 2011 the Committee decided that the primary focus of the bonus scheme would be net cash flow, which the Committee felt to be important in maintaining the strength of the Company’s Balance Sheet during a continuing difficult economic climate, plus a challenging element in respect of operating profit performance (statutory profit adjusted for foreign exchange). Accordingly, 50% of the bonus related to cash flow performance and 50% to operating profit performance. 40% of the bonus was payable for achievement of the targets set out in the Group’s budget for the year, and the balance for significant outperformance in excess of the budget up to a maximum of 100% of basic salary.
In respect of 2011/12 the Committee has decided that cash flow and profit performance should remain the cornerstones of the bonus scheme but an element of personal performance would also be appropriate. Accordingly, 40% of the bonus will relate to cash flow performance, 40% to operating profit performance and 20% will relate to the achievement of pre-agreed personal objectives. Forty percent of the cash and profit elements will be payable for achievement of the targets set out in the Group’s budget for the year and the balance for significant outperformance in excess of the budget up to a potential maximum of 140% of basic salary in exceptional circumstances (inclusive of the personal performance element).
Overview
Business R
eviewG
overnanceFinancial Statem
ents
Directors’ Remuneration Report continued
26 Scapa Group plc Annual Report and Accounts 2011
Share price incentive bonus The Committee has decided to introduce a bonus scheme with the specific purpose of providing a meaningful incentive to key senior executives of the Company (including the Executive Directors) to achieve an outstanding, challenging and sustainable increase in value for the Company’s shareholders. If, in the four-year period commencing 1 July 2011, the mid-market price of the Company’s shares equals or exceeds £1.00, the scheme will reward the Executive Directors with a payment equal to 12 months’ basic salary. There will be no payment if the share price target is not maintained for a period of 30 consecutive days. If the mid-market price equals or exceeds £1.50 per share for 30 consecutive days within the four-year life of the scheme, the total payment will be equal to twice the basic salary of the relevant Executive Director.
Benefits in kind In addition to pension provisions, Executive Directors are also entitled to car allowances, private medical insurance, permanent health cover and life assurance.
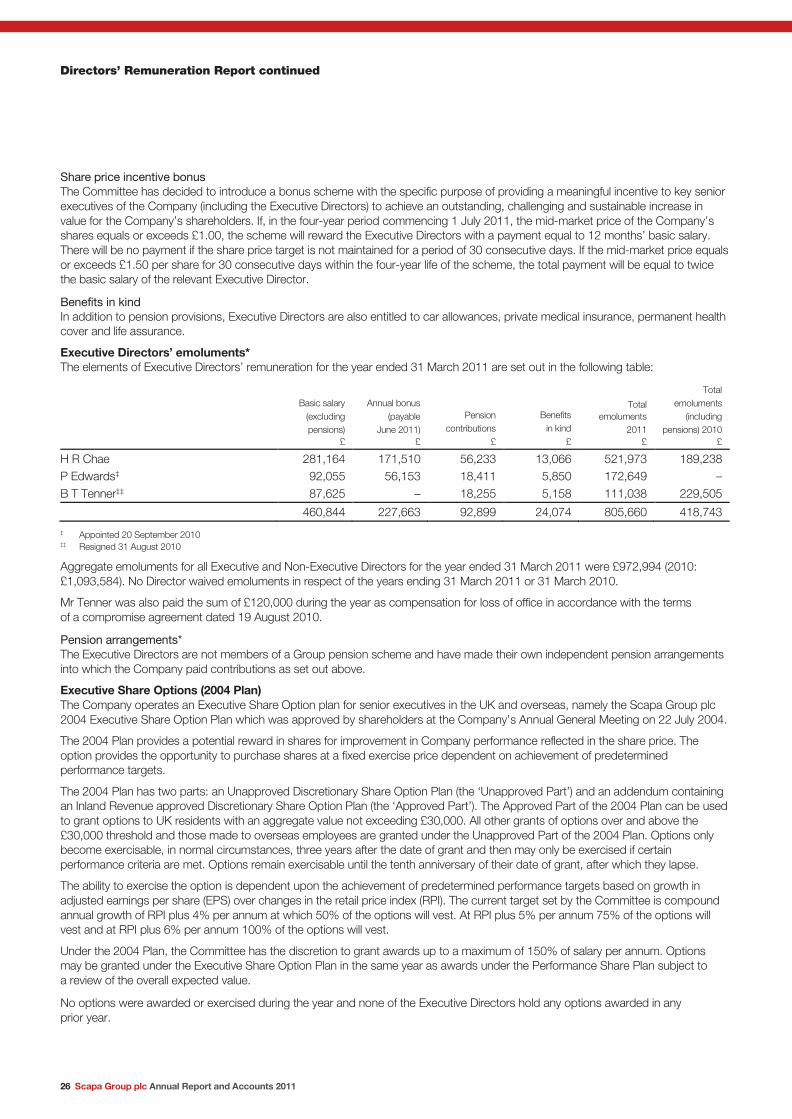
Executive Directors’ emoluments* The elements of Executive Directors’ remuneration for the year ended 31 March 2011 are set out in the following table:
Basic salary (excluding pensions)
£
Annual bonus (payable
June 2011) £
Pension contributions
£
Benefits in kind
£
Total emoluments
2011 £
Total emoluments
(including pensions) 2010
£
H R Chae 281,164 171,510 56,233 13,066 521,973 189,238 P Edwards‡ 92,055 56,153 18,411 5,850 172,649 – B T Tenner‡‡ 87,625 – 18,255 5,158 111,038 229,505
460,844 227,663 92,899 24,074 805,660 418,743
‡ Appointed 20 September 2010 ‡‡ Resigned 31 August 2010
Aggregate emoluments for all Executive and Non-Executive Directors for the year ended 31 March 2011 were £972,994 (2010: £1,093,584). No Director waived emoluments in respect of the years ending 31 March 2011 or 31 March 2010.
Mr Tenner was also paid the sum of £120,000 during the year as compensation for loss of office in accordance with the terms of a compromise agreement dated 19 August 2010.
Pension arrangements* The Executive Directors are not members of a Group pension scheme and have made their own independent pension arrangements into which the Company paid contributions as set out above.
Executive Share Options (2004 Plan) The Company operates an Executive Share Option plan for senior executives in the UK and overseas, namely the Scapa Group plc 2004 Executive Share Option Plan which was approved by shareholders at the Company’s Annual General Meeting on 22 July 2004.
The 2004 Plan provides a potential reward in shares for improvement in Company performance reflected in the share price. The option provides the opportunity to purchase shares at a fixed exercise price dependent on achievement of predetermined performance targets.
The 2004 Plan has two parts: an Unapproved Discretionary Share Option Plan (the ‘Unapproved Part’) and an addendum containing an Inland Revenue approved Discretionary Share Option Plan (the ‘Approved Part’). The Approved Part of the 2004 Plan can be used to grant options to UK residents with an aggregate value not exceeding £30,000. All other grants of options over and above the £30,000 threshold and those made to overseas employees are granted under the Unapproved Part of the 2004 Plan. Options only become exercisable, in normal circumstances, three years after the date of grant and then may only be exercised if certain performance criteria are met. Options remain exercisable until the tenth anniversary of their date of grant, after which they lapse.
The ability to exercise the option is dependent upon the achievement of predetermined performance targets based on growth in adjusted earnings per share (EPS) over changes in the retail price index (RPI). The current target set by the Committee is compound annual growth of RPI plus 4% per annum at which 50% of the options will vest. At RPI plus 5% per annum 75% of the options will vest and at RPI plus 6% per annum 100% of the options will vest.
Under the 2004 Plan, the Committee has the discretion to grant awards up to a maximum of 150% of salary per annum. Options may be granted under the Executive Share Option Plan in the same year as awards under the Performance Share Plan subject to a review of the overall expected value.
No options were awarded or exercised during the year and none of the Executive Directors hold any options awarded in any prior year.
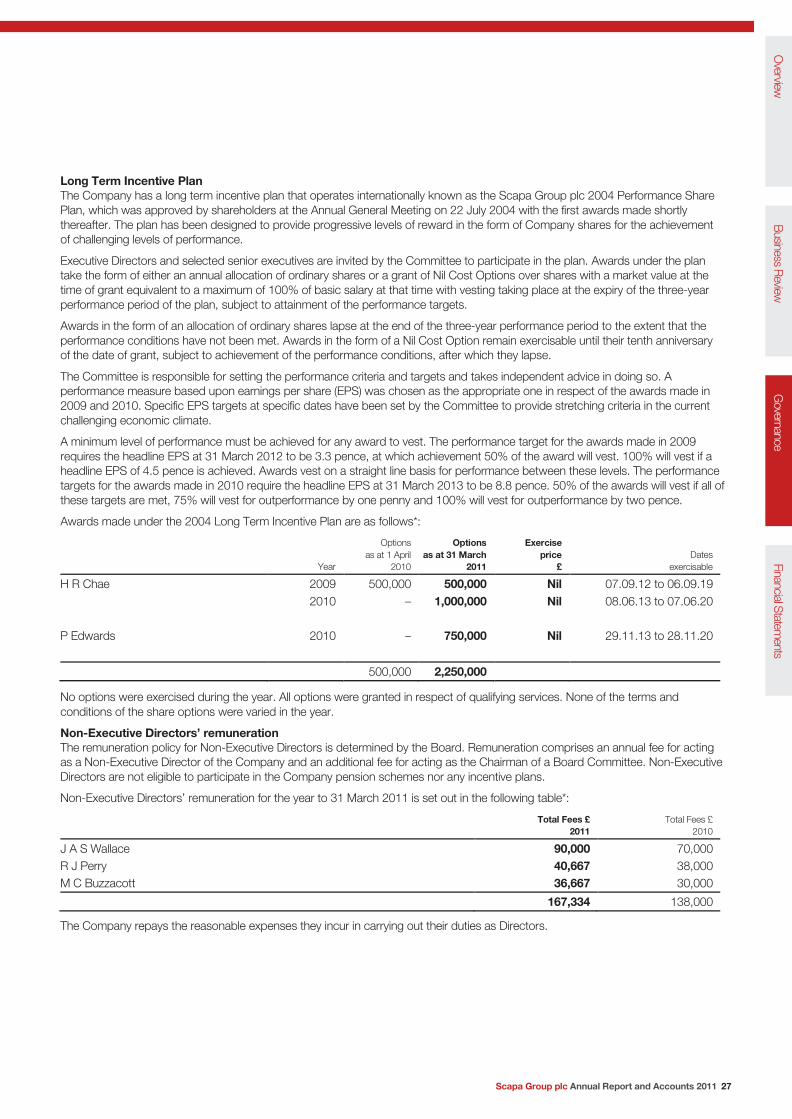
Scapa Group plc Annual Report and Accounts 2011 27
Long Term Incentive Plan The Company has a long term incentive plan that operates internationally known as the Scapa Group plc 2004 Performance Share Plan, which was approved by shareholders at the Annual General Meeting on 22 July 2004 with the first awards made shortly thereafter. The plan has been designed to provide progressive levels of reward in the form of Company shares for the achievement of challenging levels of performance.
Executive Directors and selected senior executives are invited by the Committee to participate in the plan. Awards under the plan take the form of either an annual allocation of ordinary shares or a grant of Nil Cost Options over shares with a market value at the time of grant equivalent to a maximum of 100% of basic salary at that time with vesting taking place at the expiry of the three-year performance period of the plan, subject to attainment of the performance targets.
Awards in the form of an allocation of ordinary shares lapse at the end of the three-year performance period to the extent that the performance conditions have not been met. Awards in the form of a Nil Cost Option remain exercisable until their tenth anniversary of the date of grant, subject to achievement of the performance conditions, after which they lapse.
The Committee is responsible for setting the performance criteria and targets and takes independent advice in doing so. A performance measure based upon earnings per share (EPS) was chosen as the appropriate one in respect of the awards made in 2009 and 2010. Specific EPS targets at specific dates have been set by the Committee to provide stretching criteria in the current challenging economic climate.
A minimum level of performance must be achieved for any award to vest. The performance target for the awards made in 2009 requires the headline EPS at 31 March 2012 to be 3.3 pence, at which achievement 50% of the award will vest. 100% will vest if a headline EPS of 4.5 pence is achieved. Awards vest on a straight line basis for performance between these levels. The performance targets for the awards made in 2010 require the headline EPS at 31 March 2013 to be 8.8 pence. 50% of the awards will vest if all of these targets are met, 75% will vest for outperformance by one penny and 100% will vest for outperformance by two pence.
Awards made under the 2004 Long Term Incentive Plan are as follows*:
Year
Options as at 1 April
2010
Options as at 31 March
2011
Exercise price
£ Dates
exercisable
H R Chae 2009 500,000 500,000 Nil 07.09.12 to 06.09.19 2010 – 1,000,000 Nil 08.06.13 to 07.06.20 P Edwards 2010 – 750,000 Nil 29.11.13 to 28.11.20
500,000 2,250,000
No options were exercised during the year. All options were granted in respect of qualifying services. None of the terms and conditions of the share options were varied in the year.
Non-Executive Directors’ remuneration The remuneration policy for Non-Executive Directors is determined by the Board. Remuneration comprises an annual fee for acting as a Non-Executive Director of the Company and an additional fee for acting as the Chairman of a Board Committee. Non-Executive Directors are not eligible to participate in the Company pension schemes nor any incentive plans.
Non-Executive Directors’ remuneration for the year to 31 March 2011 is set out in the following table*:
Total Fees £
2011 Total Fees £
2010
J A S Wallace 90,000 70,000 R J Perry 40,667 38,000 M C Buzzacott 36,667 30,000
167,334 138,000
The Company repays the reasonable expenses they incur in carrying out their duties as Directors.
Overview
Business R
eviewG
overnanceFinancial Statem
ents

Directors’ Remuneration Report continued
28 Scapa Group plc Annual Report and Accounts 2011
Directors’ interests As of 31 March 2011 the Directors and their immediate families had the following beneficial interests in the Company’s shares and options to subscribe for shares:
31 March 2011 31 March 2010
Shares Performance
Share Plan Shares Performance
Share Plan
H R Chae 372,335 1,500,000 – 500,000 P Edwards 250,000 750,000 – – J A S Wallace 800,000 – 600,000 – R J Perry 350,000 – 225,000 – M C Buzzacott 240,000 – 100,000 –
2,012,335 2,250,000 925,000 500,000
All of the Directors’ shareholdings in the Company derive from purchases made in the open market. No shares have been acquired by the Directors as a result of the exercise of share options or by virtue of any Company-sponsored incentive scheme.
From the end of the financial year until 26 May 2011 there have been no changes in the above interests.
The market price of the Company’s shares at the end of the financial year was 33.50p and the range of market prices during the year was between 11.50p and 40.25p.
It is the policy of the Remuneration Committee that Executive Directors should, over a reasonable period from the date of their appointment, acquire – whether by market purchase or the exercise of share options – and retain a shareholding of a value not less than 12 months’ basic salary.
Service contracts of Executive Directors Mr Chae has a service agreement with the Company on a rolling one-year basis, effective from 7 September 2009, which is terminable by twelve months’ notice in writing by either party. The Company may also terminate Mr Chae’s service agreement at any time with immediate effect on payment in lieu of notice equivalent to 12 months’ salary plus contractual entitlements, including bonus.
Mr Edwards has a service agreement with the Company on a rolling one-year basis, effective from 20 September 2010, which is terminable by twelve months’ notice in writing by the Company and by six months’ notice in writing by Mr Edwards. The Company may also terminate Mr Edward’s service agreement at any time with immediate effect on payment of 12 months’ basic salary.
There are no express provisions for compensation payable upon early termination of an Executive Director’s contract as at the date of termination other than as detailed above.
It is Company policy that all executive appointments to the Board will have contract notice periods of no longer than twelve months.
Terms of appointment of Non-Executive Directors The Chairman and Non-Executive Directors have letters of appointment for an initial term of three years subject to earlier termination by either party on written notice. In each case these terms can be extended by mutual agreement. They have no entitlement to contractual termination payments. The dates of their initial appointments and current term expiry dates are set out below:
Original appointment date Expiry date of current term
J A S Wallace 30 August 2007 29 August 2013 R J Perry 2 June 2005 1 June 2014 M C Buzzacott 1 March 2008 28 February 2014

Scapa Group plc Annual Report and Accounts 2011 29
Performance graph The graph below shows the Company’s TSR (Total Shareholder Return) compared to the FTSE AIM All Share Index over the last five years. TSR is defined as share price growth plus reinvested dividends. In the opinion of the Directors, the FTSE AIM All Share Index is the most appropriate index against which the TSR of Scapa Group plc should be measured because it is an index of similar sized companies to Scapa Group plc.
Relative Returns Analysis of Scapa versus Sector (rebased to 100)
M C Buzzacott Chairman, Remuneration Committee 26 May 2011
Overview
Business R
eviewG
overnanceFinancial Statem
ents
0
20
40
60
80
100
120
140
160
180
200
3/4/2006 02/04/2007 01/04/2008 01/04/2009 31/03/2010 31/03/2011
Scapa FTSE AIM All Share Index
VALU
E IF £100 IS IN
VESTED AT 3 APR
IL 2006
Corporate Governance
30 Scapa Group plc Annual Report and Accounts 2011
Corporate Governance The Company’s shares are traded on the Alternative Investment Market (AIM) of the London Stock Exchange. As a result, the Company is not bound to strict observance of the Combined Code. It is the Company’s policy, however, to adhere to the principles of good governance. As a minimum, the Company aims to comply with the Code of Best Practice of the Quoted Companies Alliance and, where appropriate for a company of its size and resources, with the provisions of the Combined Code.
The Board The Group is controlled through its Board of Directors. The Board’s main roles are to create value for shareholders, to provide entrepreneurial leadership of the Group, to approve the Group’s strategic objectives and to ensure that the necessary financial and other resources are made available to enable those objectives to be met. The Board, which meets at least six times in each calendar year, has a schedule of matters reserved for its approval. The full Board met six times during the 2010/11 financial year. Each member attended all of the meetings during the term of his appointment.
The specific responsibilities reserved to the Board include setting Group strategy and approving an annual budget and medium-term projections; reviewing operational and financial performance; approving major acquisitions, divestments and capital expenditure; reviewing the Group’s systems of financial control and risk management; ensuring that appropriate management development and succession plans are in place and reviewing the environmental, health and safety performance of the Group. The Board delegates matters not reserved to the Board concerning the management of the business to the Leadership Team.
The roles of the Chairman and Chief Executive The division of responsibilities between the Chairman of the Board and the Chief Executive is clearly defined. The Chairman leads the Board in the determination of its strategy and in the achievement of its objectives. The Chairman is responsible for organising the business of the Board, ensuring its effectiveness and setting its agenda. The Chairman is a Non-Executive Director and has no involvement in the day-to-day business of the Group. The Chairman facilitates the effective contribution of Non-Executive Directors and constructive relations between Executive and Non-Executive Directors, ensures Directors receive accurate, timely and clear information and facilitates effective communication with shareholders.
The Chief Executive has direct charge of the Group on a day-to-day basis and is accountable to the Board for the financial and operational performance of the Group.
Senior Independent Director Mr Perry is currently the Senior Independent Director. The Senior Independent Director is available to meet shareholders on request and to ensure that the Board is aware of shareholder concerns not resolved through the existing mechanisms for investor communication.
Directors and Directors’ independence As at 31 March 2011 the Board comprised the Non-Executive Chairman, two independent Non-Executive Directors and two Executive Directors. The names of the current Directors together with their biographical details and any other directorships are set out on page 20. All the Directors, other than Mr Edwards who was appointed on 20 September 2010 and Mr Tenner who left the Company on 31 August 2010, served throughout the period under review. The Non-Executive Directors constructively challenge and help develop proposals on strategy and bring strong, independent judgement, knowledge and experience to the Board’s deliberations.
The Non-Executive Directors meet formally, at least once a year, without the Executive Directors and also meet informally on other occasions.
The Directors are given access to independent professional advice at the Group’s expense, when the Directors deem it is necessary in order for them to carry out their responsibilities.
The Group maintains, for its Directors and officers, liability insurance for any claims or series of claims against them in that capacity.
The Board considers all its Non-Executive Directors to be independent in character and judgement. No Non-Executive Director has been an employee of the Group; has or had within the last three years a material business relationship with the Group; receives remuneration other than a Director’s fee; has close family ties with any of the Group’s advisers, Directors or senior employees; holds cross-directorships or has significant links with other Directors through involvement in other companies or bodies; or represents a significant shareholder.
Professional development On appointment each Director takes part in an induction programme when they receive comprehensive information about the Group, the role of the Board and the matters reserved for its decision, the terms of reference and membership of the Board and Committees, and the powers delegated to those Committees, the Group’s corporate governance practices and procedures, including the powers reserved to the Group’s most senior executives, and the latest financial information about the Group. This is supplemented by visits to key locations and meetings with key senior executives. Throughout their period in office the Directors are updated on the Group’s business, the competitive environments in which it operates, corporate social responsibility matters and other changes affecting the Group and the industry it operates in as a whole.
Scapa Group plc Annual Report and Accounts 2011 31
Performance evaluation The Board has established a formal process, led by the Chairman, for the annual evaluation of the performance of the Board, its Committees and individual Directors. The Directors are made aware on appointment that their performance will be subject to an evaluation.
Each year every Board member is obliged to complete a performance evaluation questionnaire. This questionnaire provides a framework for the evaluation process, and provides the Chairman with a means of making year-to-year comparisons. The questionnaire covers the Board; the Remuneration Committee; the Nominations Committee and the Audit Committee. The questionnaire includes specific references to the objectives of the Board and Committees and the effectiveness of the individual Directors. The Chairman collates the results from the completed questionnaire and the results are discussed at Board/Committee level and objectives are agreed for the following year.
Led by the Senior Independent Director the Directors meet annually, without the presence of the Chairman, to conduct a performance evaluation of the Chairman. A similar method to that described above is employed.
Re-election Subject to the Company’s Articles of Association, the Companies Acts and satisfactory performance evaluation, Non-Executive Directors are appointed for an initial period of three years. Before the third and sixth anniversary of the Non-Executive Director’s appointment, the Director discusses with the Board whether it is appropriate for a further three-year term to be served. The reappointment of Directors who have served for more than nine years (if any) is subject to annual review. The Directors who are subject to re-election at the 2011 Annual General Meeting are listed in the Board of Directors paragraph in the Report of the Directors.
The Company Secretary The Company Secretary is responsible for advising the Board through the Chairman on all governance matters. The Directors have access to the advice and services of the Company Secretary. The Company’s Articles of Association and the schedule of matters reserved to the Board for decision provide that the appointment and removal of the Company Secretary is a matter for the full Board.
Information Board reports and papers are circulated to the Directors in advance of the relevant Board or Committee meeting. These papers are supplemented by information specifically requested by the Directors from time to time. Minutes of Board and Committee meetings are circulated to all Board members.
The Non-Executive Directors receive monthly management accounts and regular management reports and information which enable them to scrutinise the Group’s and management’s performance against agreed objectives.
Relations with shareholders The Chairman gives feedback to the Board on issues raised with him by major shareholders. This is supplemented by twice-yearly feedback to the Board on meetings between management and investors, and external brokers’ reports on the Group are circulated to all Directors. The Annual General Meeting is normally attended by all Directors and shareholders are invited to ask questions during the meeting and to meet with Directors after the formal proceedings have ended.
The Group maintains a corporate web site (www.scapa.com) which contains information on company activities, financial information and published financial results. The Group has discussions with institutional shareholders on a range of issues affecting its performance. These include meetings following the announcement of the annual and interim results with the Group’s largest institutional shareholders on an individual basis. In addition, the Group responds to individual ad hoc requests for discussions from institutional shareholders. The Senior Independent Director is available to shareholders if they have concerns which contact through the normal channels of Chairman, Chief Executive or Group Finance Director has failed to resolve or for which such contact is inappropriate.
All shareholders, including private investors, have an opportunity at the Annual General Meeting to put questions to members of the Board on matters relating to the Group’s operation and performance. The Notice calling the Annual General Meeting is despatched at least 20 working days before the meeting. Separate resolutions are proposed at the Annual General Meeting on each substantially separate issue. The Chairman discloses to the meeting the number of proxy votes received for and against each resolution following the show of hands on that resolution.
Going concern In presenting the annual and interim financial statements, the Directors aim to present a balanced and understandable assessment of the Group’s position and prospects. After making enquiries, the Directors have a reasonable expectation that the Group has adequate resources to continue in operational existence for the foreseeable future. The Group continues to adopt the going concern basis in preparing the financial statements.
Overview
Business R
eviewG
overnanceFinancial Statem
ents

Corporate Governance continued
32 Scapa Group plc Annual Report and Accounts 2011
Internal control system In accordance with the Turnbull Guidance on internal control, the Board confirms that there is an ongoing process for identifying, evaluating and managing the significant risks to the achievement of the Group’s strategic objectives. The process has been reviewed regularly throughout the period by the Audit Committee up to the date of this report, and accords with the requirements of the 2008 Combined Code relating to internal control as set out in the ‘Internal Control Guidance for Directors on the Combined Code’ produced by the Institute of Chartered Accountants in England and Wales. The effectiveness of this process has been reviewed regularly throughout the period by the Audit Committee, which reports its findings for consideration by the Board.
The Board has carried out a review of the effectiveness of the system of internal controls, and that review covered all material controls (financial, operational, risk management and compliance).
The processes used by the Audit Committee to review the effectiveness of the system of internal control include:
• at least a six-monthly formal review of the Group’s Risk Profile to assess potential risk areas and action plans to address these issues, as declared by senior management;
• the review of internal and external audit plans; • a six-monthly review of the status of management actions associated with the issues arising from the risk management; and • the review of declared financial control self-assessments against minimum control standards across all locations with
a finance presence.
The Leadership Team meets regularly to review and identify potential areas of business risk, and action plans have been established to address these areas. Progress against these plans is monitored on a regular basis by the senior management team, the Audit Committee and the Board.
The Board has overall responsibility for maintaining and reviewing the effectiveness of the Group’s system of internal controls. The internal control systems are designed to meet the Group’s particular needs and the risks to which it is exposed. They are designed to manage rather than eliminate the risk to the achievement of business objectives, and can only provide reasonable and not absolute assurance against material misstatement or loss.
Control environment and risk assessment The Group operates a Risk Management Policy and support processes which ensure structured risk identification, assessment and treatment of risk outside of agreed appetite levels as the risks relate to the Group achieving its business objectives. The risk management processes are an integral part of the internal control environment. Other processes include strategic planning, the appointment of senior managers and a clear organisational structure in which levels of authority and accountability are well defined, and regularly reviewed. There is a recognition of personal responsibility and accountability by members of the management teams of the individual operating units.
Wherever practical, duties are segregated and a high degree of management control is exercised through review by executives of historical and forecast financial information. In addition, the Group has reporting systems that identify major financial and other business risks within the Group.
Financial and business performance is regularly monitored, and operating units are responsible for meeting the defined reporting timetables and compliance with the Group accounting and Treasury manuals which set out accounting policies, controls and definitions. Financial reporting follows generally accepted accounting practice in all areas.
Central review and approval procedures are in place in respect of major areas of risk such as acquisitions and disposals, major contracts, capital expenditure, litigation, treasury management, taxation and environmental issues. Compliance with legislation is closely monitored and reviewed regularly to ensure any new legislation is taken into account, including compliance with environmental legislation. High standards and defined targets are set for safety, health and environmental performance.
Information systems Comprehensive information systems are maintained at Group and operating unit levels, and are subject to scrutiny by the Board. These include:
• detailed budgeting and forecasting procedures, with an annual budget approval process; • monthly consideration of actual results compared with budgets and forecasts; and • regular review of the Group’s capital expenditure, with detailed appraisal and review procedures, defined authority levels and
post-investment performance reviews.
Regular executive and Board meetings, combined with ongoing business unit based operational reviews are held with a view to ensuring variances and discrepancies are identified and investigated on a timely basis. The Company also reports to shareholders half-yearly.

Scapa Group plc Annual Report and Accounts 2011 33
Internal audit The Group Risk and Assurance function provides an internal audit capability. Against an agreed mandate, this function performs independent internal control reviews and facilitates standardised and structured risk assessment across the Group.
Group Risk and Assurance reviews internal controls in all key activities of the Group, typically over a two-year cycle. It also acts as a service to the businesses by assisting with the continuous improvement of controls and procedures. Actions are agreed in response to its recommendations and these are reviewed by the Board and are followed up regularly to ensure that satisfactory control is maintained using a formal issues tracking process.
Against an agreed Assurance Policy, an audit programme is approved by the Audit Committee each year. This targets the most significant inherent areas of risk to provide comfort that key controls are effectively designed and operational. Audit reports are produced to convey the extent of control assurance derived from the formal testing of controls. Half-yearly summary reports are presented by the Group Risk and Assurance function to the Audit Committee to convey:
• an up-to-date view of the Group’s risk profile; • details of assurance reviews undertaken during the period; • an overall assessment of the Group’s control environment; and • the status of management actions arising from the risk management and internal and external assurance processes.
Whistle-blowing policy The Group has a whistle-blowing policy, copies of which are made available to employees, to enable and encourage employees, regardless of seniority, to bring matters which cause them concern to the attention of the Board.
Nominations Committee The Nominations Committee comprises Mr Wallace, Mr Perry and Mr Buzzacott. Mr Wallace acts as Chairman of the Committee. The Nominations Committee met three times during the year. All members of the Committee attended each meeting. When necessary, non-Committee members were also invited to attend. The Nominations Committee’s terms of reference can be found on the Group’s web site (www.scapa.com).
The Nominations Committee considers the mix of skills and experiences that the Board requires and seeks the appointment of Directors to meet its assessment of what is required to ensure that the Board is effective in discharging its responsibilities.
Remuneration Committee During the year the Remuneration Committee comprised Mr Buzzacott, Mr Perry and Mr Wallace. Mr Buzzacott acted as Chairman of the Committee throughout the year. The Remuneration Committee met four times during the year. When necessary non-Committee members were also invited to attend. All members of the Remuneration Committee attended all of the meetings.
The Committee’s principal responsibilities are:
• setting, reviewing and recommending to the Board for approval the Group’s overall remuneration policy and strategy; • setting, reviewing and approving individual remuneration packages for Executive Directors including terms and conditions
of employment and any changes to the packages; • reviewing the salary structure and terms, conditions and benefits of employment of other specified senior executives; and • approving the rules, and launch, of any Group share, share option or cash based incentive scheme and the grant, award,
allocation or issue of shares, share options or payments under such schemes.
In addition the Committee regularly reviews the Group’s remuneration policy in relation to its competitors and industry norms, compensation commitment and contract periods.
From time to time the Board employs Remuneration consultants. The Remuneration Committee’s terms of reference are available on the Group’s web site (www.scapa.com).
Audit Committee During the year the Audit Committee comprised Mr Perry, Mr Wallace and Mr Buzzacott. Mr Perry acted as Chairman of the Committee throughout the year. Mr Perry is Group Finance Director of Fenner plc, a listed company, and can therefore be considered to possess recent and relevant financial experience.
The members of the Committee are the independent Non-Executive Directors.
The Audit Committee met twice during the year and all members attended both meetings.
Overview
Business R
eviewG
overnanceFinancial Statem
ents

Corporate Governance continued
34 Scapa Group plc Annual Report and Accounts 2011
Under its terms of reference, the Audit Committee monitors the integrity of the Group’s financial statements and any formal announcements relating to the Group’s performance. The Committee is responsible for monitoring the effectiveness of the external audit process and making recommendations to the Board in relation to the appointment, re-appointment and remuneration of the external auditor. It is responsible for ensuring that an appropriate relationship between the Group and the external auditors is maintained, including reviewing non-audit services and fees. It also reviews annually the Group’s systems of internal control and the processes for monitoring and evaluating the risks facing the Group. The Committee also reviews the effectiveness of the internal audit function. The Committee reviews its terms of reference and its effectiveness annually and recommends to the Board any changes required as a result of the review.
The Committee meets with Executive Directors and management, as well as privately with both the external and internal auditors. The Committee’s terms of reference are displayed on the Group’s website (www.scapa.com).
In 2011 the Audit Committee discharged its responsibilities by: reviewing the Group’s draft annual financial statements and interim results statement prior to Board approval and reviewing the external auditor’s detailed reports thereon; reviewing the appropriateness of the Group’s accounting policies; reviewing regularly the potential impact in the Group’s financial statements of certain matters such as impairments of fixed asset values and proposed International Accounting Standards; reviewing and approving the audit fee and reviewing non-audit fees payable to the Group’s external auditors; reviewing the external auditor’s plan for the audit of the Group’s accounts, which included key areas of extended scope work, key risks on the accounts, confirmation of auditor independence and approving the terms of engagement for the audit; reviewing reports on the Group’s systems of internal control and its effectiveness, reporting to the Board on the results of the review and receiving regular updates on key risk areas of financial control; and reviewing the internal audit function, terms of reference, its work programme and reports on its work during the year.
The Audit Committee also monitors the Group’s whistle-blowing procedures, ensuring that appropriate arrangements are in place for employees to be able to raise matters of possible impropriety in confidence, with suitable subsequent follow-up action.
Auditors’ independence and objectivity PricewaterhouseCoopers LLP have been the Company’s auditors for a number of years. The Audit Committee is satisfied with their effectiveness and independence and has not considered it necessary to require an independent tender process. To help it reach this conclusion, an exercise was recently carried out, which included cost comparisons, to assure the Committee that the auditors continue to be cost-effective.
The Audit Committee monitors regularly the non-audit services being provided to the Group by its external auditors to check these services do not impair their independence or objectivity, and that the Group maintains a sufficient choice of appropriately qualified audit firms. Prior approval of the Audit Committee is required for any services provided by the external auditors where the fee is likely to be in excess of £10,000. In any case activities that may be perceived to be in conflict with the role of the external auditor must be submitted to the Committee for approval prior to engagement, regardless of the amounts involved.
The Audit Committee regularly reviews all services being provided by the external auditors in order to review the independence and objectivity of the external auditors, taking into consideration relevant professional and regulatory requirements, so that these are not impaired by the provision of permissible non-audit services.
Details of the amounts paid to the external auditors during the year for audit and other services are set out in note 3 to the financial statements.
Share capital structures Please refer to the takeover directive section in the Report of the Directors and note 22 for further details.
By order of the Board
M R Stirzaker, BA, Solicitor Company Secretary 26 May 2011

Statement of Directors’ Responsibilities in respect of the Annual Report, the Directors’ Remuneration Report and the Financial Statements
Scapa Group plc Annual Report and Accounts 2011 35
The Directors are responsible for preparing the Annual Report, the Directors’ Remuneration Report and the financial statements in accordance with applicable law and regulations.
Company law requires the Directors to prepare Group and Company financial statements for each financial year. Under that law the Directors have prepared the Group financial statements in accordance with International Financial Reporting Standards (IFRSs) as adopted by the European Union, and the Parent Company financial statements in accordance with United Kingdom Generally Accepted Accounting Practice (United Kingdom Accounting Standards and applicable law). Under company law the Directors must not approve the Group and Company financial statements unless they are satisfied that they give a true and fair view of the state of affairs of the Group and the Company and of the profit or loss of the Group and Company for that period. In preparing these financial statements, the Directors are required to:
• select suitable accounting policies and then apply them consistently; • make judgements and accounting estimates that are reasonable and prudent; • state whether IFRSs as adopted by the European Union and applicable UK Accounting Standards have been followed, subject
to any material departures disclosed and explained in the Group and Company financial statements respectively; and • prepare the financial statements on the going concern basis unless it is inappropriate to presume that the Company will continue
in business.
The Directors are responsible for keeping adequate accounting records that are sufficient to show and explain the Company’s transactions and disclose with reasonable accuracy at any time the financial position of the Company and enable them to ensure that the financial statements comply with the Companies Act 2006. They are also responsible for safeguarding the assets of the Group and the Company and hence for taking reasonable steps for the prevention and detection of fraud and other irregularities.
The Directors are responsible for the maintenance and integrity of the Company’s website. Legislation in the United Kingdom governing the preparation and dissemination of financial statements may differ from legislation in other jurisdictions.
Each of the Directors, whose names and functions are listed on page 20, confirm that, to the best of their knowledge:
• the Group and Company financial statements, which have been prepared in accordance with IFRSs as adopted by the European Union and applicable UK Accounting Standards respectively, give a true and fair view of the assets, liabilities, financial position and profit of the Group and Company; and
• the Business Review on pages 8 to 19 includes a fair review of the development and performance of the business and the position of the Group, together with a description of the principal risks and uncertainties that it faces.
By order of the Board
M R Stirzaker, BA, Solicitor Company Secretary 26 May 2011
Overview
Business R
eviewG
overnanceFinancial Statem
ents

Independent Auditors’ Report to the Members of Scapa Group plc
36 Scapa Group plc Annual Report and Accounts 2011
We have audited the Group financial statements of Scapa Group plc for the year ended 31 March 2011 which comprise the Consolidated Income Statement, the Consolidated Statement of Comprehensive Income, the Consolidated Balance Sheet, the Consolidated Statement of Changes in Equity, the Consolidated Cash Flow Statement, the Group Accounting Policies and the related notes. The financial reporting framework that has been applied in their preparation is applicable law and International Financial Reporting Standards (IFRSs) as adopted by the European Union.
Respective responsibilities of Directors and auditors As explained more fully in the Statement of Directors’ Responsibilities set out on page 35, the Directors are responsible for the preparation of the financial statements and for being satisfied that they give a true and fair view. Our responsibility is to audit and express an opinion on the financial statements in accordance with applicable law and International Standards on Auditing (UK and Ireland). Those standards require us to comply with the Auditing Practices Board’s Ethical Standards for Auditors.
This report, including the opinions, has been prepared for and only for the Company’s members as a body in accordance with Chapter 3 of Part 16 of the Companies Act 2006 and for no other purpose. We do not, in giving these opinions, accept or assume responsibility for any other purpose or to any other person to whom this report is shown or into whose hands it may come save where expressly agreed by our prior consent in writing.
Scope of the audit of the financial statements An audit involves obtaining evidence about the amounts and disclosures in the financial statements sufficient to give reasonable assurance that the financial statements are free from material misstatement, whether caused by fraud or error. This includes an assessment of: whether the accounting policies are appropriate to the Group’s circumstances and have been consistently applied and adequately disclosed; the reasonableness of significant accounting estimates made by the Directors; and the overall presentation of the financial statements. In addition, we read all the financial and non-financial information in the Annual Report and Accounts to identify material inconsistencies with the audited financial statements. If we become aware of any apparent material misstatements or inconsistencies we consider the implications for our report.
Opinion on financial statements In our opinion the Group financial statements:
• give a true and fair view of the state of the Group’s affairs as at 31 March 2011 and of its profit and cash flows for the year then ended;
• have been properly prepared in accordance with IFRSs as adopted by the European Union; and • have been prepared in accordance with the requirements of the Companies Act 2006.
Opinion on other matter prescribed by the Companies Act 2006 In our opinion the information given in the Directors’ Report for the financial year for which the Group financial statements are prepared is consistent with the Group financial statements.
Matters on which we are required to report by exception We have nothing to report in respect of the following matters where the Companies Act 2006 requires us to report to you if, in our opinion:
• certain disclosures of Directors’ remuneration specified by law are not made; or • we have not received all the information and explanations we require for our audit.
Other matter We have reported separately on the Parent Company financial statements of Scapa Group plc for the year ended 31 March 2011.
Ian Marsden (Senior Statutory Auditor) for and on behalf of PricewaterhouseCoopers LLP Chartered Accountants and Statutory Auditors Manchester
26 May 2011

Consolidated Income Statement For the year ended 31 March 2011
Scapa Group plc Annual Report and Accounts 2011 37
All on continuing operations note
Year ended 31 March
2011 £m
Year ended 31 March
2010 £m
Revenue 1 192.3 176.7 Operating profit/(loss) 1,3 8.0 (1.5) Trading profit* 8.0 1.6 Exceptional items and movements in exceptional provisions 4 – (3.1)
Operating profit/(loss) 8.0 (1.5)
Interest payable 7 (0.3) (0.3) Interest receivable 7 – 0.1
(0.3) (0.2) Net discount on provisions 7 (0.2) (0.4) IAS 19 finance costs 7 (1.4) (3.1)
Net finance costs (1.9) (3.7)
Profit/(loss) on ordinary activities before tax 6.1 (5.2) Taxation on operating activities (2.1) 1.4 Taxation on exceptional losses – 1.0 Impact of change in tax rate on deferred tax (0.5) –
Taxation (charge)/credit 8 (2.6) 2.4
Profit/(loss) for the year 3.5 (2.8)
Weighted average number of shares 22 144.8 144.8 Basic earnings/(loss) per share (p) 9 2.4 (1.9) Diluted earnings/(loss) per share (p) 2.3 (1.9) Dividend per share (p) 10 – –
Consolidated Statement of Comprehensive Income For the year ended 31 March 2011
All on continuing operations note
Year ended 31 March
2011 £m
Year ended 31 March
2010 £m
Profit/(loss) for the year 3.5 (2.8) Exchange differences on translating foreign operations (0.9) (0.7) Actuarial gains 21 1.2 8.5 Deferred tax on actuarial gains (0.3) (2.4) Effect of reduction in UK corporation tax on deferred tax (0.7) – Deferred tax on foreign exchange 0.1 0.4
Total recognised income for the year 2.9 3.0
The notes on pages 41 to 70 form part of these accounts.
* Operating profit/(loss) before exceptional items and movements in exceptional provisions.
Overview
Business R
eviewG
overnanceFinancial Statem
ents

Consolidated Balance Sheet As at 31 March 2011
38 Scapa Group plc Annual Report and Accounts 2011
note
31 March 2011
£m
31 March 2010
£m
Assets Non-current assets Goodwill 12 12.1 12.7 Property, plant and equipment 13 37.6 41.6 Deferred tax asset 8 27.6 30.7 Other receivables 16 19.1 19.4 Restricted cash 14 – 6.6
96.4 111.0 Current assets Assets held for resale 0.6 – Inventory 15 21.6 21.0 Trade and other receivables 16 34.9 36.8 Current tax asset 0.3 0.8 Restricted cash 14 6.3 – Cash and cash equivalents 17 14.7 9.4
78.4 68.0 Liabilities Current liabilities Financial liabilities: – Borrowings and other financial liabilities 19 (1.7) (3.9) – Derivative financial instruments 19 (0.1) – Trade and other payables 18 (32.0) (30.6) Current tax liabilities (0.6) (0.2) Provisions 20 (3.0) (3.9)
(37.4) (38.6)
Net current assets 41.0 29.4
Non-current liabilities Financial liabilities: – Borrowings and other financial liabilities 19 (0.5) (0.7) Trade and other payables 18 (1.2) (1.5) Deferred tax liabilities 8 (4.6) (4.8) Non-current tax liabilities (1.3) (1.3) Retirement benefit obligations 21 (35.0) (38.6) Provisions 20 (26.2) (28.2)
(68.8) (75.1)
Net assets 68.6 65.3
Shareholders’ equity Ordinary shares 22 7.3 7.2 Share premium 0.1 – Retained earnings 42.4 38.5 Translation reserve 18.8 19.6
Total shareholders’ equity 68.6 65.3
The notes on pages 41 to 70 form part of these accounts. These accounts were approved by the Directors on 26 May 2011.
H R Chae Chief Executive Officer
P Edwards Finance Director
Registered in England No. 826179
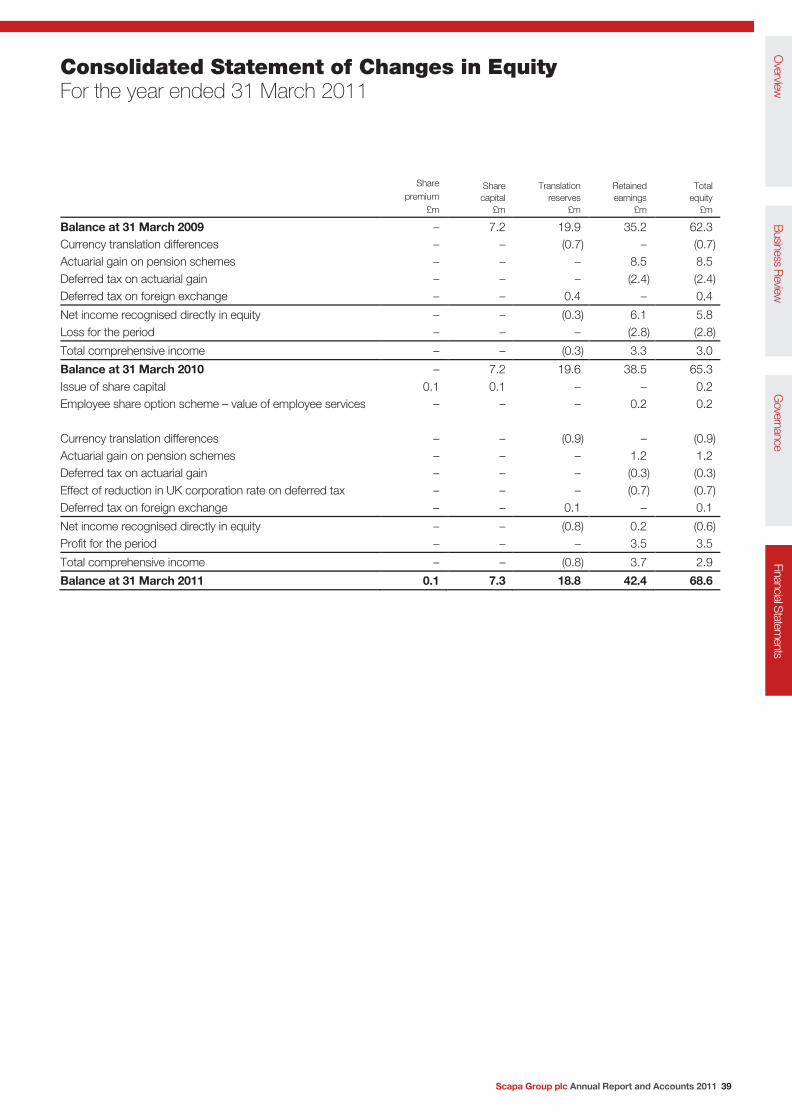
Consolidated Statement of Changes in Equity For the year ended 31 March 2011
Scapa Group plc Annual Report and Accounts 2011 39
Share premium
£m
Share capital
£m
Translation reserves
£m
Retained earnings
£m
Total equity
£m
Balance at 31 March 2009 – 7.2 19.9 35.2 62.3 Currency translation differences – – (0.7) – (0.7) Actuarial gain on pension schemes – – – 8.5 8.5 Deferred tax on actuarial gain – – – (2.4) (2.4) Deferred tax on foreign exchange – – 0.4 – 0.4
Net income recognised directly in equity – – (0.3) 6.1 5.8 Loss for the period – – – (2.8) (2.8)
Total comprehensive income – – (0.3) 3.3 3.0
Balance at 31 March 2010 – 7.2 19.6 38.5 65.3 Issue of share capital 0.1 0.1 – – 0.2 Employee share option scheme – value of employee services – – – 0.2 0.2 Currency translation differences – – (0.9) – (0.9) Actuarial gain on pension schemes – – – 1.2 1.2 Deferred tax on actuarial gain – – – (0.3) (0.3) Effect of reduction in UK corporation rate on deferred tax – – – (0.7) (0.7) Deferred tax on foreign exchange – – 0.1 – 0.1
Net income recognised directly in equity – – (0.8) 0.2 (0.6) Profit for the period – – – 3.5 3.5
Total comprehensive income – – (0.8) 3.7 2.9
Balance at 31 March 2011 0.1 7.3 18.8 42.4 68.6
Overview
Business R
eviewG
overnanceFinancial Statem
ents
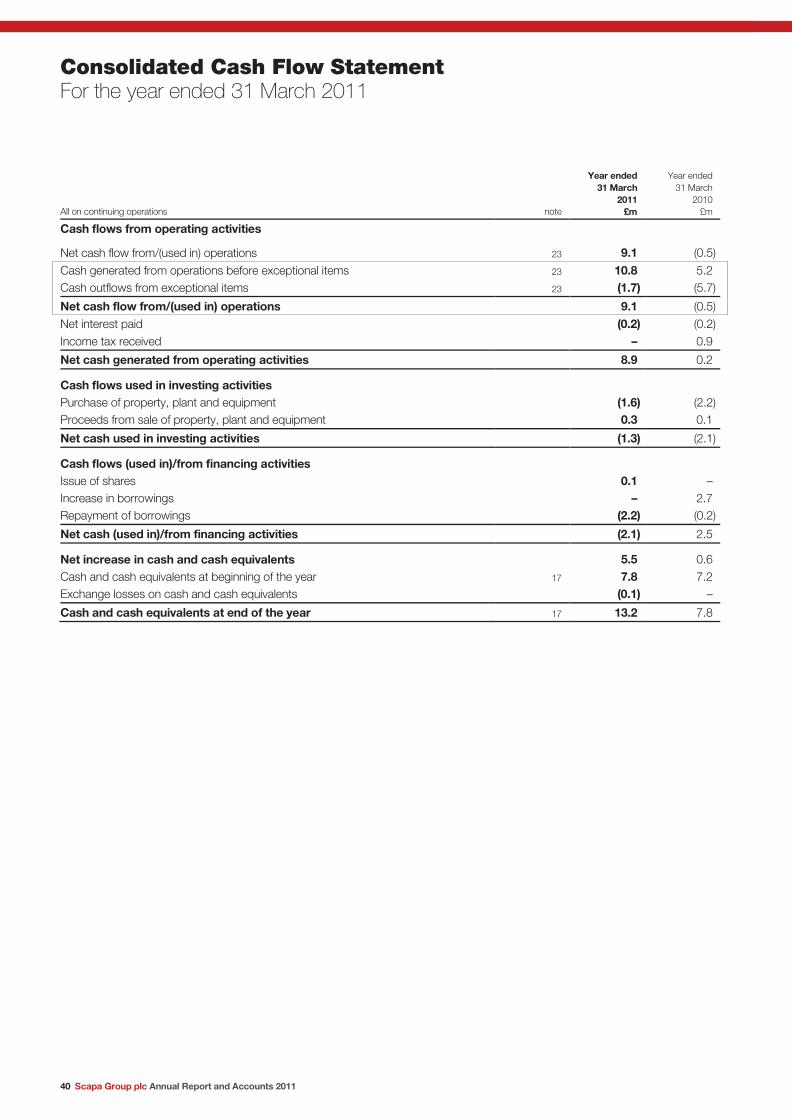
Consolidated Cash Flow Statement For the year ended 31 March 2011
40 Scapa Group plc Annual Report and Accounts 2011
All on continuing operations note
Year ended 31 March
2011 £m
Year ended 31 March
2010 £m
Cash flows from operating activities Net cash flow from/(used in) operations 23 9.1 (0.5)
Cash generated from operations before exceptional items 23 10.8 5.2 Cash outflows from exceptional items 23 (1.7) (5.7)
Net cash flow from/(used in) operations 9.1 (0.5) Net interest paid (0.2) (0.2) Income tax received – 0.9
Net cash generated from operating activities 8.9 0.2
Cash flows used in investing activities
Purchase of property, plant and equipment (1.6) (2.2) Proceeds from sale of property, plant and equipment 0.3 0.1
Net cash used in investing activities (1.3) (2.1)
Cash flows (used in)/from financing activities
Issue of shares 0.1 – Increase in borrowings – 2.7 Repayment of borrowings (2.2) (0.2)
Net cash (used in)/from financing activities (2.1) 2.5
Net increase in cash and cash equivalents 5.5 0.6
Cash and cash equivalents at beginning of the year 17 7.8 7.2 Exchange losses on cash and cash equivalents (0.1) –
Cash and cash equivalents at end of the year 17 13.2 7.8

Group Accounting Policies
Scapa Group plc Annual Report and Accounts 2011 41
Scapa Group plc (the Company) and its subsidiaries (together the Group) manufacture and sell technical adhesive tapes. The Group has manufacturing plants around the world and sells mainly in countries within Europe, North America and Asia.
The Company is a limited liability company incorporated and domiciled in the UK. The address of its registered office is 997 Manchester Road, Ashton-under-Lyne, Manchester, OL7 0ED. The Company has its listing on the Alternative Investment Market.
These consolidated financial statements have been approved for issue by the Board of Directors on 26 May 2011.
A summary of the more important Group accounting policies applied in the preparation of these consolidated financial statements is set out below.
Basis of preparation The consolidated financial statements of Scapa Group plc have been prepared in accordance with International Financial Reporting Standards as adopted by the European Union (IFRSs as adopted by the EU), IFRIC interpretations and the Companies Act 2006 applicable to companies reporting under IFRSs. The consolidated financial statements have been prepared under the historical cost convention, as modified by the revaluation of financial assets and financial liabilities (including derivative instruments) at fair value through the Income Statement.
Early adoption of standards The Group has not early adopted any standards.
New accounting standards and IFRIC interpretations The following standards and amendments to existing standards became mandatory during the year:
IAS 24, ‘Related party disclosures’ (revised 2009).
Amendment to IFRIC 14, ‘IAS 19 - The limit on defined benefit assets, minimum funding requirements and their interaction’.
IFRS 9, ‘Financial instruments’.
Amendment to IAS 32, ‘Financial instruments: Presentation - Classification of rights issues’.
IFRIC 19, ‘Extinguishing financial liabilities with equity instruments’.
Amendment to IFRS 1, ‘First-time adoption of International Financial Reporting Standards - Limited exemption from comparative IFRS 7 disclosures for first-time adopters’.
Where applicable the changes in the above standards have been reflected in the Group financial statements. The effect of these changes is not material to the Group accounts for the year ending 31 March 2011.
The following standards and amendments to existing standards have been published but are not mandatory for the Group’s financial statements in the year ending 31 March 2011:
IFRS 1, ‘First-time adoption of International Financial Reporting Standards’
IFRS 3, ‘Business combinations’
IFRS 7, ‘Financial instruments’
IAS 1, ‘Presentation of financial statements’
IAS 27, ‘Consolidated and separate financial statements’
IAS 34, ‘Interim financial reporting’
IFRIC 13, ‘Customer loyalty programmes’
Consolidation The consolidated financial statements include those of the Parent Company and its subsidiary undertakings up to 31 March in each year prepared under IFRSs. Subsidiary undertakings are entities over which the Group has the power to govern their financial and operational policies generally accompanying a shareholding of more than half of the voting rights. The results of subsidiary undertakings acquired or disposed of during the year are included from the date of acquisition or up to the date of disposal respectively, using the purchase method of accounting.
Inter-company transactions, balances and unrealised gains on transactions between Group companies are eliminated. Unrealised losses are also eliminated unless the transaction provides evidence of an impairment of the asset transferred. Accounting policies of subsidiaries have been changed where necessary to ensure consistency with the policies adopted by the Group.
Overview
Business R
eviewG
overnanceFinancial Statem
ents

Group Accounting Policies continued
42 Scapa Group plc Annual Report and Accounts 2011
Segmental reporting IFRS 8 Operating Segments requires that the segments should be reported on the same basis as the internal reporting information that is provided to the chief operating decision-maker. The Group adopts this policy and the chief operating decision-maker has been identified as the Board of Directors. The Directors consider there to be four reportable segments, being the main customer groups which the Group serves in: Medical, Industrial, Electronics and Transportation (business units).
Internal reports reviewed regularly by the Board provide information to allow the chief operating decision-maker to allocate resources and make decisions about the operations. The internal reporting focuses on these business units. The chief operating decision-maker relies primarily on turnover and trading profit to assess the performance of the Group and make decisions about resources to be allocated to the segment. Trading profit is reconciled to operating profit on the face of the Income Statement.
Revenue recognition Revenue comprises the fair value for the sale of goods, net of value-added tax, rebates and discounts and after eliminating sales within the Group. Revenue is recognised as follows:
(a) Sales of goods Sales of goods are recognised when the significant risks and rewards of ownership of the goods have been transferred to the buyer, and when the Group entity has no continuing managerial involvement nor effective control over the goods.
Where items are sold with a right of return, accumulated experience is used to estimate and provide for such returns at the time of sale.
(b) Interest income Interest income is recognised on an accruals basis within net financing costs.
Leases Leases in which a significant portion of the risks and rewards of ownership are retained by the lessor are classified as operating leases. Payments made under operating leases (net of any incentives received from the lessor) are charged to the Income Statement on a straight-line basis over the period of the lease.
Leases in which substantially all of the risks and rewards of ownership are transferred to the Group are classified as finance leases. Finance leases are recognised as assets and liabilities in the Balance Sheet at the present value of the minimum lease payments. The interest rate implicit in the lease is used as the discount rate in calculating the present value of the cash outflows. Where the Group does not obtain ownership of the asset at the end of the lease period, the asset is depreciated over the shorter of its useful life and the lease term. Where ownership does pass to the Group at the end of the lease period, the policy for depreciating the asset is consistent with that for depreciable assets that are owned.
Minimum lease payments are apportioned between the finance charge and the reduction of the outstanding liability. The finance charge is calculated based on the amount of borrowing outstanding, and is charged against profits over the primary lease period.
Government grants Grants from the government are recognised at their fair value where there is a reasonable assurance that the grant will be received and the Group will comply with all attached conditions.
Government grants relate to tangible fixed assets and are treated as deferred income and are credited to the Income Statement over the expected useful lives of the assets concerned.
Research and development expenditure Research expenditure is expensed as incurred. Costs associated with developing or enhancing existing product lines are recognised as an expense as incurred.
Development costs are assessed as to whether they meet the IAS 36 criteria for capitalisation. No costs have been incurred by the Group which meet those criteria.
Exceptional items Items which are both material and non-recurring in nature are presented as exceptional items so as to provide a better indication of the Group’s underlying business performance and are shown separately on the face of the Income Statement.

Scapa Group plc Annual Report and Accounts 2011 43
Foreign currency translation
(a) Functional and presentation currency Items included in the financial statements of each of the Group’s entities are measured using the currency of the primary economic environment in which the entity operates (‘the functional currency’). The consolidated financial statements are presented in Sterling.
(b) Transactions and balances Foreign currency transactions are translated into the functional currency using the exchange rates prevailing at the dates of the transactions. Foreign exchange gains and losses resulting from the settlement of such transactions and from the translation at year end exchange rates of monetary assets and liabilities denominated in foreign currencies are recognised in the Income Statement, except when deferred in equity as qualifying net investment hedges.
(c) Group companies The results and financial position of all the Group entities (none of which has the currency of a hyperinflationary economy) that have a functional currency different from the presentation currency are translated into the presentation currency as follows:
(i) assets and liabilities for each balance sheet presented are translated at the closing rate at the date of that balance sheet;
(ii) income and expenses for each income statement are translated at average exchange rates (unless this average is not a reasonable approximation of the cumulative effect of the rates prevailing on the transaction dates, in which case income and expenses are translated at the dates of the transactions).
On consolidation, exchange differences arising from the translation of the net investment in foreign entities, and of long-term borrowings that are considered to form part of that net investment, are taken to the translation reserve within shareholders’ equity. When a foreign operation is sold, such exchange differences are recognised in the Income Statement as part of the gain or loss on sale.
Goodwill and fair value adjustments arising on the acquisition of a foreign entity are treated as assets and liabilities of the foreign entity and translated at the closing rate.
Business combinations and goodwill The purchase method of accounting is used to account for the acquisition of subsidiaries by the Group. The cost of an acquisition is measured as the fair value of the assets given, equity instruments issued and liabilities incurred or assumed at the date of exchange, plus costs directly attributable to the acquisition. Identifiable assets acquired and liabilities and contingent liabilities assumed in a business combination are measured initially at their fair values at the acquisition date. The excess of the cost of acquisition over the fair value of the Group’s share of the identifiable net assets acquired is recorded as goodwill.
Goodwill is tested annually for impairment, or when an indication of impairment is identified, and carried at cost less accumulated impairment losses. Gains and losses on the disposal of an entity include the carrying amount of goodwill relating to the entity sold.
Goodwill is allocated to cash-generating units for the purpose of impairment testing. Each of those cash-generating units represents the Group’s investment in each site.
Property, plant and equipment (including land and buildings) Land and buildings comprise mainly factories and offices. All property, plant and equipment is stated at historical cost less accumulated depreciation and impairment. Historical cost includes expenditure directly attributable to the acquisition of the items.
Subsequent costs are included in the asset’s carrying amount or recognised as a separate asset, as appropriate, only when it is probable that future economic benefits associated with the item will flow to the Group and the cost of the item can be measured reliably. All other repairs and maintenance are charged to the Income Statement when incurred.
Land is not depreciated. Depreciation on other assets is calculated using the straight-line method to reduce their cost to their residual values over their estimated useful lives, as follows:
• Freehold buildings: 40 years • Leasehold buildings: life of the lease • Plant and machinery: 5-20 years • Furniture, fittings and equipment: 5-20 years • IT systems and software: 3-8 years
Overview
Business R
eviewG
overnanceFinancial Statem
ents

Group Accounting Policies continued
44 Scapa Group plc Annual Report and Accounts 2011
Assets held in the course of construction are not depreciated until they are brought into use.
The assets’ residual values and useful lives are reviewed, and adjusted if appropriate, at each balance sheet date. An asset’s carrying amount is written down immediately to its recoverable amount if the asset’s carrying amount is greater than its estimated recoverable amount.
Gains and losses on disposals are determined by comparing proceeds with carrying amount. These are included in the Income Statement within operating profit.
Impairment of assets Assets, such as goodwill, that have an indefinite useful life, are not subject to amortisation and instead are tested annually for impairment. Assets that are subject to amortisation or depreciation are reviewed for impairment whenever events or changes in circumstances indicate that the carrying amount may not be recoverable. An impairment loss is recognised for the amount by which the asset’s carrying amount exceeds its recoverable amount. The recoverable amount is the higher of an asset’s sale value less costs to sell and value in use. For the purposes of assessing impairment, assets are grouped at the lowest levels for which there are separately identifiable cash flows (cash-generating units).
Value in use is determined based on the estimated future cash inflows and outflows derived from the continued use of the asset and from its ultimate disposal. These forecasts form the basis of the Group’s annual budget, have been signed off by the Board and are the best estimates available to management in assessing future profitability. These cash flows are discounted using the Group’s pre-tax weighted average cost of capital of 11.2% (2010: 11%), adjusted to reflect any risks specific to the asset for which the estimated future cash flows have not already been adjusted.
Where the recoverable amount of assets (other than goodwill) subsequently materially increases, impairment losses recognised in previous periods will be reversed.
Financial instruments The Group classifies its financial instruments in the following categories: financial assets and liabilities at fair value through profit or loss and loans, receivables and payables. The classification depends on the purpose for which the instruments were acquired. Management determines the classification of its instruments at initial recognition and re-evaluates this at every reporting date.
(a) Financial assets and liabilities measured at fair value through profit and loss Financial assets and liabilities are measured at fair value. Instruments in this category are classified as current if they are either held for trading or are expected to be realised within 12 months of the Balance Sheet date. Hedge accounting is only applied for net investment hedges, with changes in fair value being taken directly to the translation reserve where hedge accounting is achieved. Changes in fair values of cash flow hedges are taken through the Income Statement.
(b) Loans, receivables and payables Loans, receivables and payables are non-derivative financial assets and liabilities with fixed or determinable payments that are not quoted in an active market. They arise when the Group provides money, goods or services directly to a debtor or creditor with no intention of trading the receivable or payable. They are included in current assets or liabilities, except for maturities greater than 12 months after the Balance Sheet date. These are classified as non-current assets or liabilities. Loans and receivables are included in trade and other receivables or trade and other payables in the Balance Sheet. Loans, receivables and payables are measured at invoice or historic cost less any impairment.
Inventories Inventories are stated at the lower of cost and net realisable value. Cost is determined using the first-in, first-out (FIFO) method. The cost of finished goods and work in progress comprises raw materials, direct labour, other direct costs and related production overheads allocated on a systematic basis (based on normal operating capacity). It excludes borrowing costs. Net realisable value is the estimated selling price in the ordinary course of business, less applicable variable selling expenses. Provision is made for obsolete, slow moving and defective inventory on a line by line basis, or by grouping similar or related items, by reference to accumulated experience.
Trade receivables Trade receivables are recognised initially at invoice value, less provision for impairment. A provision for impairment of trade receivables is established when there is objective evidence that the Group will not be able to collect all amounts due according to the original terms of receivables. The provision is recognised in the Income Statement as an operating charge.
Insurance receivables Where some or all of the cost of a provision is reimbursed by another party, the Group recognises that reimbursement when it is virtually certain it will be received.

Scapa Group plc Annual Report and Accounts 2011 45
Cash and cash equivalents Cash and cash equivalents include cash in hand, deposits held at call with banks, other short-term highly liquid investments with original maturities of three months or less, and bank overdrafts. Bank overdrafts are shown within borrowings in current liabilities on the Balance Sheet.
Share capital Ordinary shares are classified as equity.
Dividend distribution to the Company’s shareholders is recognised as a liability in the Group’s financial statements in the period in which the dividends are approved by the Company’s shareholders or in respect of interim dividends when approved by Directors.
Trade payables Trade payables are recognised at their initial fair value.
Borrowings Borrowings are recognised initially at fair value, net of transaction costs incurred and subsequently stated at amortised cost. Interest charges are recognised in the Income Statement over the period of the borrowings, using the effective interest method.
Borrowings are classified as current liabilities unless the Group has a right to defer settlement of the liability for at least 12 months after the Balance Sheet date.
Deferred taxation The charge for taxation, comprising both UK and non-UK taxation, is based on the taxable profits for the year and also takes into account deferred taxation. Deferred taxation is provided in full, using the liability method, on temporary differences arising between the tax bases of assets and liabilities and their carrying amounts in the consolidated financial statements. However, if the deferred taxation arises from initial recognition of an asset or liability in a transaction other than a business combination that at the time of the transaction affects neither accounting nor taxable profit or loss, it is not accounted for. Deferred taxation is determined using tax rates (and laws) that have been enacted or substantially enacted by the Balance Sheet date and are expected to apply when the related deferred income tax asset is realised or the deferred income tax liability is settled.
Deferred taxation assets are recognised to the extent that it is probable that future taxable profit will be available against which the temporary differences can be utilised.
Employee benefits
(a) Pension obligations Group companies operate various pension schemes. The schemes are funded through payments to trustee-administered funds, determined by periodic actuarial calculations. The Group has both defined benefit and defined contribution plans. A defined benefit plan is a pension plan that defines an amount of pension benefit that an employee will receive on retirement, usually dependent on one or more factors such as age, years of service and compensation.
The liability recognised in the Balance Sheet in respect of defined benefit pension plans is the present value of the defined benefit obligation at the Balance Sheet date less the fair value of plan assets, together with adjustments for unrecognised actuarial gains or losses and past service costs. The defined benefit obligation is calculated by independent actuaries using the projected unit credit method. The present value of the defined benefit obligation is determined by discounting the estimated future cash outflows using interest rates of high-quality corporate bonds that are denominated in the currency in which the benefits will be paid, and that have terms to maturity approximating to the terms of the related pension liability.
Actuarial gains and losses arising from experience adjustments and changes in actuarial assumptions are charged or credited to shareholders’ equity.
Past-service costs are recognised immediately in the Income Statement, unless the changes to the pension plan are conditional on the employees remaining in service for a specified period of time (the vesting period). In this case, the past-service costs are amortised on a straight-line basis over the vesting period.
A defined contribution plan is a pension plan under which the Group pays fixed contributions into a separate entity. The Group has no legal or constructive obligations to pay further contributions if the fund does not hold sufficient assets to pay all employees the benefits relating to employee service in the current and prior periods.
For defined contribution plans, the Group pays contributions to publicly or privately administered pension insurance plans on a mandatory, contractual or voluntary basis. The contributions are recognised as employee benefit expense when they are due. Prepaid contributions are recognised as an asset to the extent that a cash refund or a reduction in the future payments is available.
Overview
Business R
eviewG
overnanceFinancial Statem
ents
Group Accounting Policies continued
46 Scapa Group plc Annual Report and Accounts 2011
(b) Share-based compensation The Group operates an equity-settled, share-based compensation plan. The fair value of the employee services received in exchange for the grant of the options is calculated using appropriate valuation models and is recognised as an expense over the vesting period.
The total amount to be expensed over the vesting period is determined by reference to the fair value of the options granted. At each balance sheet date, the entity revises its estimates of the number of options that are expected to become exercisable.
It recognises the impact of the revision of original estimates, if any, in the Income Statement, and a corresponding adjustment to equity, over the remaining vesting period.
The proceeds received net of any directly attributable transaction costs are credited to share capital (nominal value) and share premium when the options are exercised.
(c) Holiday pay The Group recognises an asset or liability relating to holiday pay obligations at the Balance Sheet date. Movements in the period are taken to the Income Statement.
(d) Bonus plans The Group recognises a liability and an expense for bonuses based on a pre-determined formula for key performance indicators. The Group recognises a provision where contractually obliged or where past practice has created a constructive obligation.
Provisions Provisions for environmental restoration, restructuring costs and legal claims are recognised when the Group has a present legal or constructive obligation as a result of past events, it is more likely than not that an outflow of resources will be required to settle the obligation and the amount has been reliably estimated.
Where the effect is material, provisions are discounted in line with IAS 37 using a pre-tax nominal discount rate. The discount rate does not reflect risks for which the estimated future outflows have already been adjusted.
Financial risk management
Financial risk factors The Group’s activities expose it to a variety of financial risks: foreign exchange risk, interest-rate risk, credit risk, liquidity risk and capital risk. The Group’s overall risk management procedures focus on the unpredictability of financial markets and seek to minimise potential adverse effects on the Group’s financial performance. Risk management is carried out by the Group finance department (in close co-operation with the operating units) under policies approved by the Board of Directors.
– Foreign exchange risk The Group operates internationally and is exposed to foreign exchange risk arising from various currency exposures, primarily with respect to the US Dollar, Canadian Dollar and the Euro. Foreign exchange risk arises from future commercial transactions, recognised assets and liabilities and net investments in foreign operations. As the Group has certain investments in foreign operations, these net assets are exposed to foreign currency translation risk.
To manage its foreign exchange risk the Group uses foreign currency bank balances, and makes some use of foreign currency forward contracts to avoid short-term fluctuations in currencies. In addition, purchases of large items of capital in foreign currency are covered by forward contracts at the point of authorisation.
At the year end the Group had forward contracts to sell Canadian Dollars into US Dollars and to sell Euros into Sterling. These contracts are valued based on year end exchange rate. An analysis of the sensitivity of the year end position relative to these forward contracts is provided below.
At 31 March 2011, if the Canadian Dollar had closed 10% weaker/stronger against the US Dollar (with all other variables held constant), pre-tax profit would have been unaffected because of the low value of forward contracts in place at the year end.
At 31 March 2011, if Sterling had closed 10% weaker/stronger against the Euro (with all other variables held constant), pre-tax profit would have been reduced/increased by £0.2m owing to the effects of forward contracts in place at the year end.
– Interest-rate risk The Group has no significant exposure to interest-rate risk on borrowings. Deposit risk is managed by spreading deposits across high credit rated institutions, and capping the maximum deposit with an institution at one time.

Scapa Group plc Annual Report and Accounts 2011 47
– Credit risk The Group has no significant concentrations of credit risk. It has policies in place to ensure that sales of products are made to customers with an appropriate credit history. Derivative counterparties and cash transactions are spread across a number of financial institutions. The European business obtains third party credit insurance on its worldwide sales, subject to specific exclusions, excesses and total policy limits. The majority of sales from Europe are covered by the insurer.
– Liquidity risk The Group maintains a mixture of committed long-term and short-term facilities designed to ensure that the Group has sufficient cash funds available for operations and planned investment.
– Capital risk The Group’s primary objective when managing capital is to safeguard the Group’s ability to continue as a going concern in order to provide returns for shareholders and benefits for other stakeholders. The Group must ensure that sufficient capital resources are available for working capital requirements and meeting principal and interest payments as they fall due. Given the very low levels of debt in the Group and the high level of net cash, it is not necessary to provide a gearing ratio for the Group.
Critical accounting estimates and judgements The Group’s accounting policies have been set by management and approved by the Audit Committee. The application of these accounting policies to specific scenarios requires reasonable estimates and assumptions to be made concerning the future. These are continually evaluated based on historical experience and expectations of future events. The resulting accounting estimates will, by definition, seldom equal the related actual results.
Under IFRSs estimates or judgements are considered critical where they involve a significant risk of causing a material adjustment to the carrying amounts of assets and liabilities from period to period. This may be because the estimate or judgement involves matters which are highly uncertain, or because different estimation methods or assumptions could reasonably have been used.
Critical judgements have been made in the following areas when preparing the Group’s accounts:
1 Impairment of goodwill and property, plant and equipment – see note 11. The Group tests annually whether goodwill has suffered any impairment, and tests tangible assets where indication of impairment exists. The recoverable amounts of cash-generating units are then determined on a value-in-use basis; determining this value requires the use of estimates. The main estimates are around the forecasted cash flows, which are based on approved budgets and growth rates of 7.1% per annum in years 1-5 and no growth after, but do not include terminal values. The assumptions used are considered the best available and reasonable. Any reasonable change in the assumptions would not result in an impairment, especially given the exclusion of terminal values.
2 Calculation of provisions – the key assumptions used to calculate the Asbestos litigation provision and the sensitivity of those assumptions to change is contained within note 20. The assumptions used are considered the best available and reasonable.
3 Calculation of insurance receivable – see note 20. There is a residual level of uncertainty around any insurance policy until such time it is actually drawn down upon and therefore the actual value of all accessible insurance may differ from the evaluation in note 20. Given that the total accessible value of all relevant insurance policies is significantly in excess of any reasonable range of outcomes, the Board's view is that this will not lead to any material financial impact on Scapa.
4 Retirement benefit liabilities – the key assumptions used to calculate the pensions deficit and the sensitivity of those assumptions to change is contained within note 21. The assumptions used are considered the best available and reasonable.
5 Taxation – see note 8. The Group is subject to income taxes in numerous jurisdictions. Significant judgement is required in determining the worldwide provisions for income taxes and the recognition of deferred tax assets. The recognition of deferred tax is based on the availability of suitable future taxable profits of a specific business unit in a specific tax jurisdiction and satisfies the relevant recognition criteria. The assumptions used are considered the best available and reasonable. A significant deterioration in results would need to occur in order to result in an impairment of the deferred tax recognised.
Overview
Business
R
eviewG
overnanceFinancial
Statem
ents

Notes on the Accounts
48 Scapa Group plc Annual Report and Accounts 2011
1. Segmental reporting
Primary Reporting Format – Geographical Segments The Group operates in three main geographical areas: Europe, North America and Asia. All inter-segment transactions are made on an arms-length basis. The home country of the Company is the United Kingdom.
The chief operating decision maker relies primarily on turnover and trading profit to assess the performance of the Group and make decisions about resources to be allocated to the segment. Trading profit is reconciled to operating profit on the face of the Income Statement.
The Board reviews the performance of the business using information presented at consistent exchange rates. The prior year results have been restated as shown on the following page.
Segment results The segment results for the year ended 31 March 2011 are as follows:
Europe
£m N America
£m Asia £m
Eliminations £m
Head office £m
Group £m
External revenue 106.7 72.7 12.9 – – 192.3 Inter-segment revenue 4.5 2.7 1.2 (8.4) – –
Total revenue 111.2 75.4 14.1 (8.4) – 192.3
Operating profit/(loss) 3.3 5.3 0.4 – (1.0) 8.0 Net finance costs (1.9)
Profit on ordinary activities before tax 6.1 Tax charge (2.6)
Profit for the year 3.5
Medical
£m Industrial
£m Electronics
£m Transportation
£m Group
£m
External revenue 33.8 126.3 12.9 19.3 192.3
Revenue is allocated based on the country in which the order is received. All revenue relates to the sale of goods. The revenue analysis based on the location of the customer is as follows:
Europe
£m N America
£m Asia/Other
£m Group
£m
External revenue 94.7 66.9 30.7 192.3
The segment results for the year ended 31 March 2010 are as follows:
Europe
£m N America
£m Asia £m
Eliminations £m
Head office £m
Group £m
External revenue 101.1 63.1 12.5 – – 176.7 Inter-segment revenue 4.2 2.8 3.1 (10.1) – –
Total revenue 105.3 65.9 15.6 (10.1) – 176.7
Trading profit/(loss) 0.3 1.3 0.7 – (0.7) 1.6
Exceptional items and movements in exceptional provisions (1.1) (2.0) – – – (3.1)
Operating (loss)/profit (0.8) (0.7) 0.7 – (0.7) (1.5) Net finance costs (3.7)
Loss on ordinary activities before tax (5.2) Tax on operating activities 1.4 Tax on exceptional losses 1.0
Tax credit 2.4
Loss for the year (2.8)

Scapa Group plc Annual Report and Accounts 2011 49
1. Segmental reporting continued
Medical
£m Industrial
£m Electronics
£m Transportation
£m Group
£m
External revenue 26.2 119.2 12.5 18.8 176.7
The Board reviews the performance of the business using information presented at consistent exchange rates. The prior year results have been restated using this year’s exchange rates as follows:
Europe
£m N America
£m Asia £m
Head office £m
Group £m
External revenue 101.1 63.1 12.5 – 176.7 Foreign exchange (1.7) 2.2 0.8 – 1.3
Underlying external revenue 99.4 65.3 13.3 – 178.0
Trading profit 0.3 1.3 0.7 (0.7) 1.6 Foreign exchange 0.1 – 0.1 – 0.2
Underlying trading profit 0.4 1.3 0.8 (0.7) 1.8
Medical
£m Industrial
£m Electronics
£m Transportation
£m Group
£m
External revenue 26.2 119.2 12.5 18.8 176.7 Foreign exchange 0.3 0.7 0.8 (0.5) 1.3
Underlying external revenue 26.5 119.9 13.3 18.3 178.0
Revenue is allocated based on the country in which the order is received. All revenue relates to the sale of goods. The revenue analysis based on the location of the customer is as follows:
Europe
£m N America
£m Asia/Other
£m Group
£m
External revenue 91.0 59.6 26.1 176.7
2. Segment assets and liabilities
The segment assets and liabilities at 31 March 2011 and capital expenditure for the year then ended are as follows:
Europe
£m N America
£m Asia £m
Head office £m
Group £m
Inventory 12.5 7.2 1.9 – 21.6 Trade receivables 20.9 8.4 1.7 – 31.0 Trade payables (16.4) (3.9) (0.9) (1.1) (22.3) Cash 5.0 2.7 1.8 5.2 14.7 Additions of property, plant and equipment 0.8 0.5 0.8 – 2.1
The segment assets and liabilities at 31 March 2010 and capital expenditure for the year then ended were as follows:
Europe
£m N America
£m Asia £m
Head office £m
Group £m
Inventory 11.3 7.2 2.5 – 21.0 Trade receivables 21.8 8.8 2.1 – 32.7 Trade payables (16.9) (4.0) (1.1) (1.1) (23.1) Cash 1.8 5.7 1.1 0.8 9.4 Additions of property, plant and equipment 1.2 0.9 0.1 – 2.2
Unallocated head office items relate to assets and liabilities incurred in the normal course of business for the Parent Company.
Overview
Business R
eviewG
overnanceFinancial Statem
ents

Notes on the Accounts continued
50 Scapa Group plc Annual Report and Accounts 2011
3. Operating profit note
The operating profit for the year is stated after:
2011 Total
£m
2010 Pre exceptional
£m
2010 Exceptional
£m
2010 Total
£m
Revenue 192.3 176.7 – 176.7 Cost of goods sold – materials and overheads (93.8) (84.3) – (84.3) – labour (30.8) (30.4) – (30.4) – factory costs (16.8) (17.3) – (17.3)
(141.4) (132.0) – (132.0)
Directors and employees costs (50.9) (49.8) (0.8) (50.6) Depreciation of tangible fixed assets – owned assets (4.8) (4.7) – (4.7) – leased assets (0.1) (0.2) – (0.2) Impairment of fixed assets – – (1.1) (1.1) Operating lease rentals – land and buildings (1.6) (2.0) – (2.0) – plant, machinery and other (1.4) (1.2) – (1.2) Auditors remuneration (0.2) (0.3) – (0.3) Other fees paid to auditors (0.1) (0.1) – (0.1) Repairs and maintenance costs (2.6) (2.6) – (2.6) Research and development costs (2.5) (4.1) – (4.1) Amortisation of government grants received 0.1 0.1 – 0.1 Movement in fair value of financial instruments (0.1) – – – Recognition of asbestos liability – – (20.3) (20.3) Recognition of asbestos receivable – – 20.3 20.3
Fees payable to the Company’s auditor for other services:
Parent Company audit fee £80,000 (2010: £80,000), audit of company subsidiaries £155,000 (2010: £245,000), tax services £56,000 (2010: £99,000), other services £Nil (2010: £10,000).
The auditors are also the auditors of the UK pension schemes. They were paid a fee of £13,000 (2010: £14,000) for this audit.
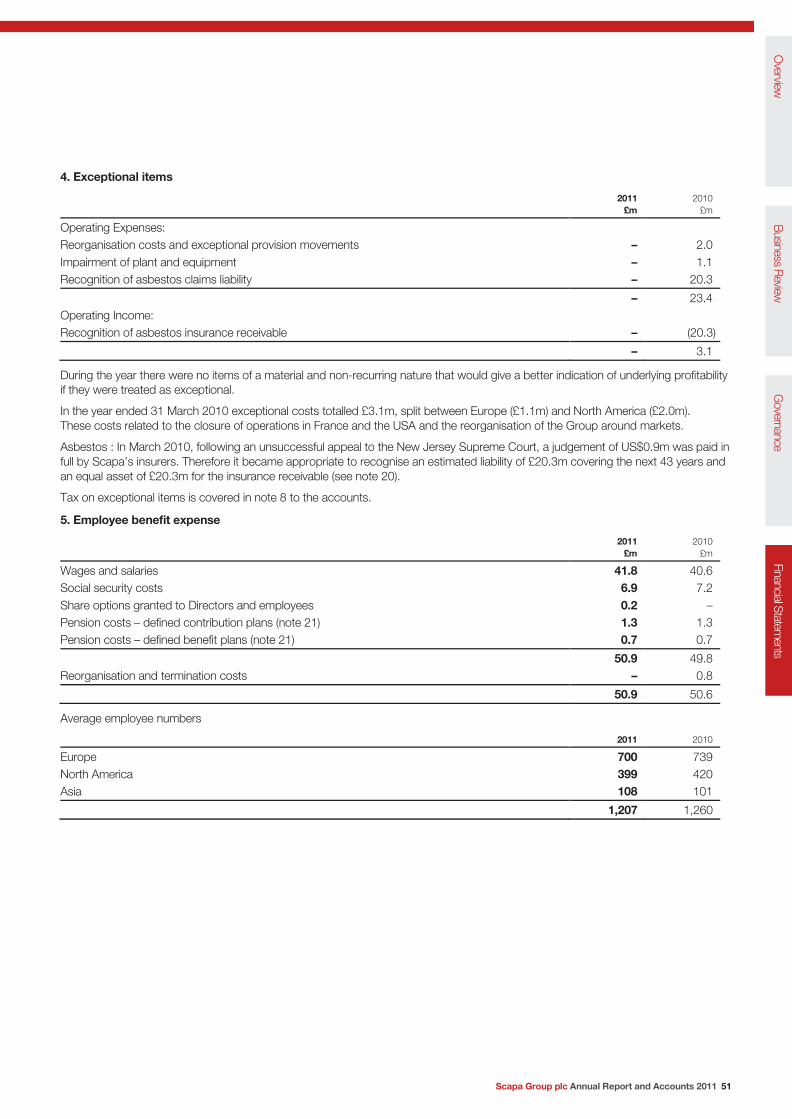
Scapa Group plc Annual Report and Accounts 2011 51
4. Exceptional items
2011
£m 2010
£m
Operating Expenses: Reorganisation costs and exceptional provision movements – 2.0 Impairment of plant and equipment – 1.1 Recognition of asbestos claims liability – 20.3
– 23.4 Operating Income: Recognition of asbestos insurance receivable – (20.3)
– 3.1
During the year there were no items of a material and non-recurring nature that would give a better indication of underlying profitability if they were treated as exceptional.
In the year ended 31 March 2010 exceptional costs totalled £3.1m, split between Europe (£1.1m) and North America (£2.0m). These costs related to the closure of operations in France and the USA and the reorganisation of the Group around markets.
Asbestos : In March 2010, following an unsuccessful appeal to the New Jersey Supreme Court, a judgement of US$0.9m was paid in full by Scapa’s insurers. Therefore it became appropriate to recognise an estimated liability of £20.3m covering the next 43 years and an equal asset of £20.3m for the insurance receivable (see note 20).
Tax on exceptional items is covered in note 8 to the accounts.
5. Employee benefit expense
2011
£m 2010
£m
Wages and salaries 41.8 40.6 Social security costs 6.9 7.2 Share options granted to Directors and employees 0.2 – Pension costs – defined contribution plans (note 21) 1.3 1.3 Pension costs – defined benefit plans (note 21) 0.7 0.7
50.9 49.8 Reorganisation and termination costs – 0.8
50.9 50.6
Average employee numbers
2011 2010
Europe 700 739 North America 399 420 Asia 108 101
1,207 1,260
Overview
Business R
eviewG
overnanceFinancial Statem
ents

Notes on the Accounts continued
52 Scapa Group plc Annual Report and Accounts 2011
6. Related parties’ key management compensation and Directors’ remuneration
2011 £m
2010 £m
Salaries and other short-term employee benefits 1.8 1.1
Key management is defined as the Leadership Team, four new members of which joined part way through the year. The parts of the report which are required by the Companies Act 2006 and which are subject to audit by PricewaterhouseCoopers LLP are indicated with an asterisk (*). This information includes the sections on Executive Directors’ emoluments, pension arrangements, executive share options, long-term incentive plans, sharesave and Non-Executive Directors’ remuneration.
7. Net finance costs
2011
£m 2010
£m
Interest payable on bank loans and overdrafts 0.3 0.3 Expected return on pension scheme assets less interest on scheme liabilities 1.4 3.1 Discount on assets (0.6) – Discount on provisions 0.8 0.4
1.9 3.8
Interest receivable and similar income – (0.1)
Net finance costs 1.9 3.7
8. Taxation
Income tax (charge)/credit
2011
£m 2010
£m
Current tax: Tax on ordinary activities – current year (0.6) – Tax on ordinary activities – prior year (0.4) –
(1.0) – Deferred tax: Tax on ordinary activities – current year (1.5) 0.9 Tax on ordinary activities – prior year 0.4 0.5 Effect of reduction in UK corporation tax rate to 26% (0.5) – Tax on exceptional items – 1.0
(1.6) 2.4
Tax (charge)/credit for the year (2.6) 2.4
The actual tax on the Group’s profit before tax differs from the theoretical amount using the UK corporation tax rate as follows:
2011
£m 2010 £m
Profit/(loss) on ordinary activities before tax 6.1 (5.2)
Theoretical tax (charge)/credit at 28% (1.7) 1.5 Effect of reduction in UK corporation tax rate to 26% (0.5) – Income not taxable and other deductions 0.5 0.4 Items not deductible for tax purposes and other taxable items (0.3) (0.2) Effect of overseas tax rates being higher than UK tax rate (0.6) 0.2 Adjustments in respect of prior years – 0.5
Actual tax (charge)/credit for the year (2.6) 2.4
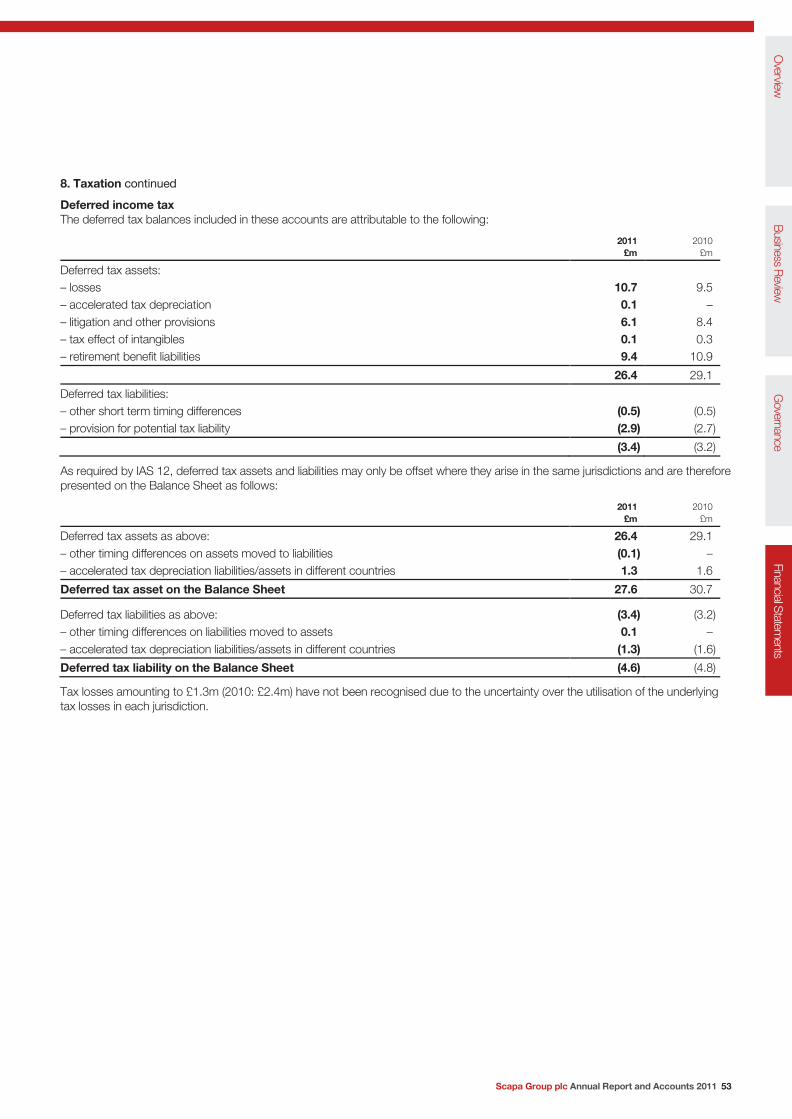
Scapa Group plc Annual Report and Accounts 2011 53
8. Taxation continued
Deferred income tax The deferred tax balances included in these accounts are attributable to the following:
2011
£m 2010
£m
Deferred tax assets: – losses 10.7 9.5 – accelerated tax depreciation 0.1 – – litigation and other provisions 6.1 8.4 – tax effect of intangibles 0.1 0.3 – retirement benefit liabilities 9.4 10.9
26.4 29.1
Deferred tax liabilities: – other short term timing differences (0.5) (0.5) – provision for potential tax liability (2.9) (2.7)
(3.4) (3.2)
As required by IAS 12, deferred tax assets and liabilities may only be offset where they arise in the same jurisdictions and are therefore presented on the Balance Sheet as follows:
2011
£m 2010
£m
Deferred tax assets as above: 26.4 29.1 – other timing differences on assets moved to liabilities (0.1) – – accelerated tax depreciation liabilities/assets in different countries 1.3 1.6
Deferred tax asset on the Balance Sheet 27.6 30.7
Deferred tax liabilities as above: (3.4) (3.2) – other timing differences on liabilities moved to assets 0.1 – – accelerated tax depreciation liabilities/assets in different countries (1.3) (1.6)
Deferred tax liability on the Balance Sheet (4.6) (4.8)
Tax losses amounting to £1.3m (2010: £2.4m) have not been recognised due to the uncertainty over the utilisation of the underlying tax losses in each jurisdiction.
Overview
Business R
eviewG
overnanceFinancial Statem
ents

Notes on the Accounts continued
54 Scapa Group plc Annual Report and Accounts 2011
8. Taxation continued
Movement in deferred tax 2011
£m 2010
£m
Beginning of the year 25.9 26.3 Income Statement (charge)/credit (1.1) 2.4 Effect of reduction in UK corporation tax rate to 26% (0.5) – Exchange differences on translating foreign operations (0.4) (0.8) Deferred tax on actuarial gains/losses (0.3) (2.4) Other comprehensive income effect of reduction in UK corporate tax rate to 26% (0.7) – Deferred tax on foreign exchange 0.1 0.4
End of year 23.0 25.9
Movement in unrecognised deferred tax 2011
£m 2010
£m
Beginning of the year 2.4 2.7 Prior year adjustments (0.2) (0.3) Current year movement (1.0) – Exchange differences on translating foreign operations 0.1 –
End of year 1.3 2.4
In addition to the change in rate of corporation tax disclosed above within the note on taxation, a number of further changes to the UK corporation tax system were announced in the March 2011 UK Budget statement. Legislation to reduce the main rate of corporation tax from 26% to 25% from 1 April 2012 is expected to be included in the Finance Act 2011. Further reductions to the main rate are proposed to reduce the rate by 1% per annum to 23% by 1 April 2014. These further changes had not been substantively enacted at the Balance Sheet date and therefore are not included in these financial statements.
The effect of the changes expected to be enacted in the Finance Act 2011 would be to reduce the deferred tax asset provided at the Balance Sheet date by £0.6m. This £0.6m decrease in the deferred tax asset would decrease profit by £0.3m and decrease other comprehensive income by £0.3m. This is due to the reduction in the corporation tax rate from 26% to 25% with effect from 1 April 2012.
The proposed reductions of the main rate of corporation tax by 1% per year to 23% by 1 April 2014 are expected to be enacted separately each year. The overall effect of the further changes from 25% to 23%, if these applied to the deferred tax balance at the Balance Sheet date, would be to reduce the deferred tax asset by £1.2m (being £0.6m recognised in 2013 and £0.6m recognised in 2014).
9. Earnings/(loss) per share
Basic Basic earnings/(loss) per share is calculated by dividing the profit/(loss) attributable to equity holders of the Company by the weighted average number of ordinary shares in issue during the year.
2011 2010
Profit/(loss) attributable to equity holders of the Company (£m) 3.5 (2.8) Weighted average number of ordinary shares in issue (m) 144.8 144.8 Basic earnings/(loss) per share (p) 2.4 (1.9) Weighted average number of shares in issue, including potentially dilutive shares (m) 148.6 144.8 Diluted earnings/(loss) per share (p) 2.3 (1.9)
Diluted Diluted earnings/(loss) per share is calculated by adjusting the weighted average number of ordinary shares outstanding to assume conversion of all potentially dilutive ordinary shares (144,818,321). Diluted earnings/(loss) per share has been calculated on share options in existence at 31 March 2011.
10. Dividend per share
No dividend is proposed for the year ended 31 March 2011 (prior year £Nil).
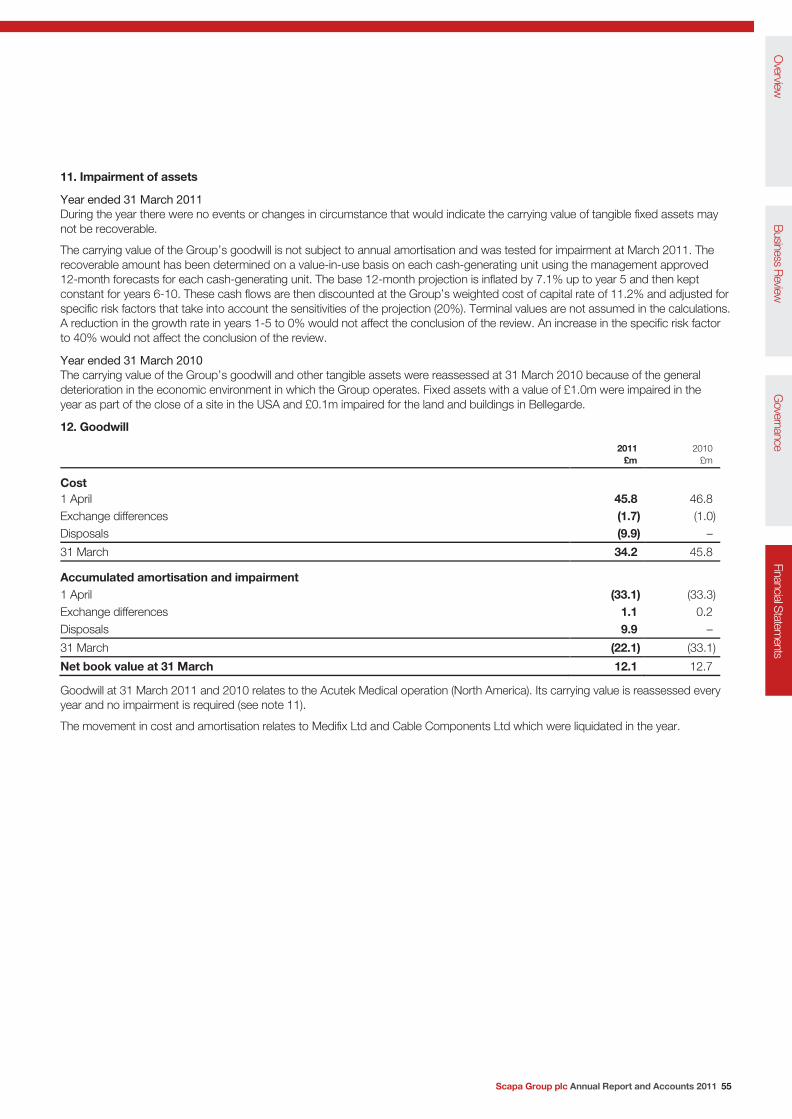
Scapa Group plc Annual Report and Accounts 2011 55
11. Impairment of assets
Year ended 31 March 2011 During the year there were no events or changes in circumstance that would indicate the carrying value of tangible fixed assets may not be recoverable.
The carrying value of the Group’s goodwill is not subject to annual amortisation and was tested for impairment at March 2011. The recoverable amount has been determined on a value-in-use basis on each cash-generating unit using the management approved 12-month forecasts for each cash-generating unit. The base 12-month projection is inflated by 7.1% up to year 5 and then kept constant for years 6-10. These cash flows are then discounted at the Group’s weighted cost of capital rate of 11.2% and adjusted for specific risk factors that take into account the sensitivities of the projection (20%). Terminal values are not assumed in the calculations. A reduction in the growth rate in years 1-5 to 0% would not affect the conclusion of the review. An increase in the specific risk factor to 40% would not affect the conclusion of the review.
Year ended 31 March 2010 The carrying value of the Group’s goodwill and other tangible assets were reassessed at 31 March 2010 because of the general deterioration in the economic environment in which the Group operates. Fixed assets with a value of £1.0m were impaired in the year as part of the close of a site in the USA and £0.1m impaired for the land and buildings in Bellegarde.
12. Goodwill
2011
£m 2010
£m
Cost 1 April 45.8 46.8 Exchange differences (1.7) (1.0) Disposals (9.9) –
31 March 34.2 45.8
Accumulated amortisation and impairment 1 April (33.1) (33.3) Exchange differences 1.1 0.2 Disposals 9.9 –
31 March (22.1) (33.1)
Net book value at 31 March 12.1 12.7
Goodwill at 31 March 2011 and 2010 relates to the Acutek Medical operation (North America). Its carrying value is reassessed every year and no impairment is required (see note 11).
The movement in cost and amortisation relates to Medifix Ltd and Cable Components Ltd which were liquidated in the year.
Overview
Business R
eviewG
overnanceFinancial Statem
ents

Notes on the Accounts continued
56 Scapa Group plc Annual Report and Accounts 2011
13. Property, plant and equipment
Freehold land and buildings
£m
Long leasehold buildings
£m
Plant and machinery
£m
Furniture, fittings and equipment
£m
IT systems
£m
Assets under construction
£m Total
£m
Cost 1 April 2009 20.1 7.9 86.1 5.5 17.6 4.8 142.0 Exchange differences 0.2 – 0.9 (0.1) 0.1 (0.1) 1.0 Additions – – 1.3 – 0.2 0.7 2.2 Disposals – – (2.9) (0.2) (0.3) – (3.4) Transfers – – 2.9 – 2.1 (5.0) –
31 March and 1 April 2010 20.3 7.9 88.3 5.2 19.7 0.4 141.8
Exchange differences 0.4 – 0.7 0.1 (0.1) – 1.1 Additions – – 0.9 0.2 0.2 0.8 2.1 Disposals (0.1) – (5.8) (0.1) (1.2) – (7.2) Transfers – – 0.4 – 0.1 (0.5) – Transfer to asset held for sale (1.1) – – – – – (1.1)
31 March 2011 19.5 7.9 84.5 5.4 18.7 0.7 136.7
Accumulated depreciation 1 April 2009 (8.5) (3.8) (65.5) (4.2) (15.2) – (97.2) Exchange differences – – (0.3) – – – (0.3) Depreciation (0.6) (0.2) (3.1) (0.2) (0.8) – (4.9) Impairment (0.2) – (0.3) (0.4) (0.2) – (1.1) Disposals – – 2.9 0.2 0.2 – 3.3
31 March and 1 April 2010 (9.3) (4.0) (66.3) (4.6) (16.0) – (100.2)
Exchange differences (0.2) – (0.7) (0.1) – – (1.0) Depreciation (0.6) (0.2) (3.1) (0.1) (0.9) – (4.9) Disposals – – 5.1 0.2 1.2 – 6.5 Transfer to asset held for sale 0.5 – – – – – 0.5
31 March 2011 (9.6) (4.2) (65.0) (4.6) (15.7) – (99.1)
Carrying amount
31 March 2011 9.9 3.7 19.5 0.8 3.0 0.7 37.6
31 March 2010 11.0 3.9 22.0 0.6 3.7 0.4 41.6
The Group has not revalued any item of property, plant and equipment.
Assets held under finance leases, capitalised and included in property, plant and equipment are as follows:
2011
£m 2010
£m
Cost 1.4 1.4 Accumulated depreciation (0.2) (0.2)
Net book amount 1.2 1.2
The transfer in the year to assets held for sale relates to the land and buildings at the Carlstadt site in the USA.

Scapa Group plc Annual Report and Accounts 2011 57
14. Restricted cash
Under the terms of the agreement for the sale of the Papermaking Products and Services business dated 1 July 1999, Scapa Dryer Fabrics Inc. (SDFI), which is party to the asbestos litigation described in note 20, made certain undertakings to the purchaser, J M Voith AG, regarding the disposition of US$40.0m of the total sale proceeds (of which approximately US$10.0m was in respect of SDFI business and net assets sold). This required that this sum be retained as cash on deposit from the date of the agreement, effectively as security against the cost of any successful asbestos claims made against the purchaser as successor to the business. In 2003 and 2006 amounts were repaid to the Group companies who had loaned the funds for the deposit totalling US$20.0m and US$10.0m respectively.
The remaining balance of US$10.0m remains in the account and this remains a restricted asset until December 2011. At 31 March 2011 the Sterling value of this fund was £6.3m (2010: £6.6m).
15. Inventory
2011
£m 2010
£m
Raw materials 7.8 7.0 Work in progress 6.0 5.6 Finished goods 7.8 8.4
21.6 21.0
The material and overhead element of inventory recognised as an expense and included in the Income Statement amounted to £93.8m (2010: £84.3m).
16. Trade and other receivables
2011
£m 2010
£m
Amounts due within one year: Trade receivables 31.6 33.2 Less: provisions for impairment (0.6) (0.5)
Trade receivables – net 31.0 32.7 Other debtors 2.6 2.9 Prepayments and accrued income 1.3 1.2
Total amounts due within one year 34.9 36.8
Amounts due after more than one year: Other debtors 19.1 19.4
Total amounts due after more than one year 19.1 19.4
Included in other debtors is an amount of £19.9m (2010: £20.3m), of which £18.8m (2010: £19.2m) is due after more than one year. This has been discounted at a risk free rate of 4.6% due to the long-term nature of the receivable (insurance receivable for asbestos claims – see note 20). All other receivables above are stated at fair value.
In addition £0.3m of other debtors is due after more than one year; this is not discounted since the impact is immaterial.
The carrying amounts of these receivables are denominated in the following currencies:
2011
£m 2010
£m
Pounds Sterling 4.0 4.5 US Dollars 28.7 29.3 Euros 17.4 18.2 Other 3.9 4.2
54.0 56.2
Management review individual receivables and provide for overdue amounts specifically.
Overview
Business R
eviewG
overnanceFinancial Statem
ents
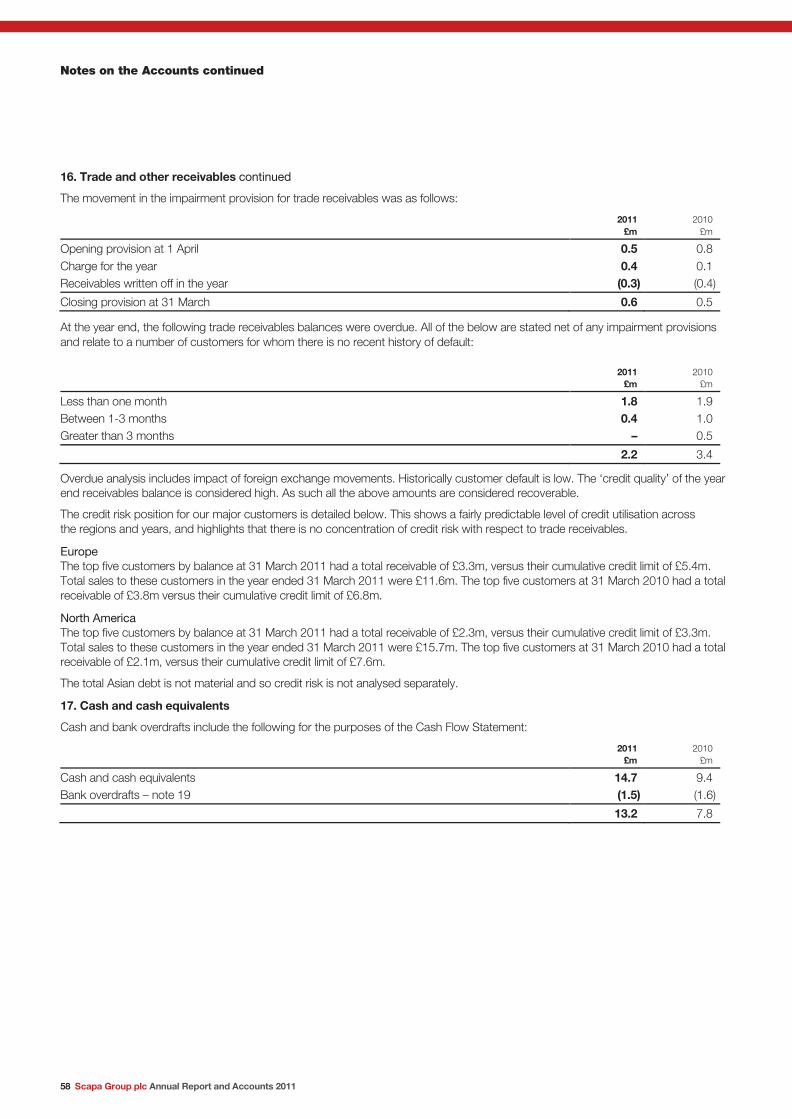
Notes on the Accounts continued
58 Scapa Group plc Annual Report and Accounts 2011
16. Trade and other receivables continued
The movement in the impairment provision for trade receivables was as follows:
2011
£m 2010
£m
Opening provision at 1 April 0.5 0.8 Charge for the year 0.4 0.1 Receivables written off in the year (0.3) (0.4)
Closing provision at 31 March 0.6 0.5
At the year end, the following trade receivables balances were overdue. All of the below are stated net of any impairment provisions and relate to a number of customers for whom there is no recent history of default:
2011
£m 2010
£m
Less than one month 1.8 1.9 Between 1-3 months 0.4 1.0 Greater than 3 months – 0.5
2.2 3.4
Overdue analysis includes impact of foreign exchange movements. Historically customer default is low. The ‘credit quality’ of the year end receivables balance is considered high. As such all the above amounts are considered recoverable.
The credit risk position for our major customers is detailed below. This shows a fairly predictable level of credit utilisation across the regions and years, and highlights that there is no concentration of credit risk with respect to trade receivables.
Europe The top five customers by balance at 31 March 2011 had a total receivable of £3.3m, versus their cumulative credit limit of £5.4m. Total sales to these customers in the year ended 31 March 2011 were £11.6m. The top five customers at 31 March 2010 had a total receivable of £3.8m versus their cumulative credit limit of £6.8m.
North America The top five customers by balance at 31 March 2011 had a total receivable of £2.3m, versus their cumulative credit limit of £3.3m. Total sales to these customers in the year ended 31 March 2011 were £15.7m. The top five customers at 31 March 2010 had a total receivable of £2.1m, versus their cumulative credit limit of £7.6m.
The total Asian debt is not material and so credit risk is not analysed separately.
17. Cash and cash equivalents
Cash and bank overdrafts include the following for the purposes of the Cash Flow Statement:
2011
£m 2010
£m
Cash and cash equivalents 14.7 9.4 Bank overdrafts – note 19 (1.5) (1.6)
13.2 7.8
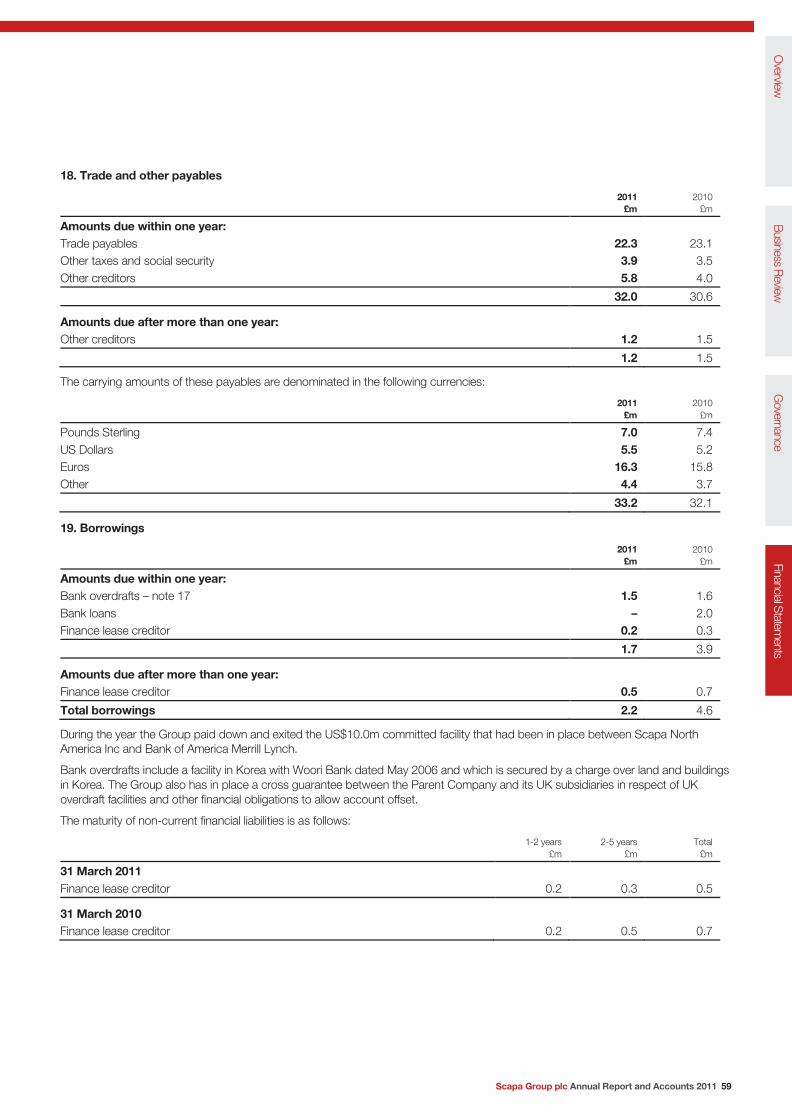
Scapa Group plc Annual Report and Accounts 2011 59
18. Trade and other payables
2011
£m 2010
£m
Amounts due within one year: Trade payables 22.3 23.1 Other taxes and social security 3.9 3.5 Other creditors 5.8 4.0
32.0 30.6
Amounts due after more than one year: Other creditors 1.2 1.5
1.2 1.5
The carrying amounts of these payables are denominated in the following currencies:
2011
£m 2010
£m
Pounds Sterling 7.0 7.4 US Dollars 5.5 5.2 Euros 16.3 15.8 Other 4.4 3.7
33.2 32.1
19. Borrowings
2011
£m 2010
£m
Amounts due within one year: Bank overdrafts – note 17 1.5 1.6 Bank loans – 2.0 Finance lease creditor 0.2 0.3
1.7 3.9
Amounts due after more than one year: Finance lease creditor 0.5 0.7
Total borrowings 2.2 4.6
During the year the Group paid down and exited the US$10.0m committed facility that had been in place between Scapa North America Inc and Bank of America Merrill Lynch.
Bank overdrafts include a facility in Korea with Woori Bank dated May 2006 and which is secured by a charge over land and buildings in Korea. The Group also has in place a cross guarantee between the Parent Company and its UK subsidiaries in respect of UK overdraft facilities and other financial obligations to allow account offset.
The maturity of non-current financial liabilities is as follows:
1-2 years
£m 2-5 years
£m Total
£m
31 March 2011 Finance lease creditor 0.2 0.3 0.5
31 March 2010 Finance lease creditor 0.2 0.5 0.7
Overview
Business R
eviewG
overnanceFinancial Statem
ents

Notes on the Accounts continued
60 Scapa Group plc Annual Report and Accounts 2011
19. Borrowings continued
The effective interest rates at the Balance Sheet date were as follows:
Sterling Euros US and
Canadian Dollars Other
currencies
31 March 2011 Bank overdrafts – 1.3% – 7.5%
31 March 2010 Bank overdrafts – 0.87%-1.25% – 6.3%
The carrying amounts of the Group’s borrowings are denominated in the following currencies:
2011
£m 2010
£m
Pounds Sterling 0.7 0.7 Euros 1.3 1.7 US Dollars – 2.0 Other currencies 0.2 0.2
2.2 4.6
Movements in forward currency contracts used to hedge against the exposure to exchange differences due to the timing of cash flows are taken through the Income Statement as it is not Group policy to hedge account for these instruments. At 31 March 2011 financial liabilities of £0.1m have been recognised in the Balance Sheet relating to the fair values of derivative financial instruments in place (2010: £Nil).
The Group has the following undrawn borrowing facilities (this includes committed and uncommitted):
2011
£m 2010
£m
Floating rate – expiring within one year 9.1 13.3
20. Provisions
Asbestos litigation claims
£m
Asbestos litigation costs
£m
Reorganisation and leasehold commitments
£m Environmental
£m Total
£m
At 1 April 2010 20.3 7.5 3.6 0.7 32.1 Exchange differences (1.0) (0.4) – – (1.4) Additions in the year – – 1.0 0.1 1.1 Unwinding of discount 0.6 0.2 – – 0.8 Utilised in the year – (1.6) (1.6) (0.2) (3.4) Released in the year – – – – –
At 31 March 2011 19.9 5.7 3.0 0.6 29.2
Analysis of provisions: Current 1.1 0.3 1.3 0.3 3.0 Non-current 18.8 5.4 1.7 0.3 26.2
At 31 March 2011 19.9 5.7 3.0 0.6 29.2
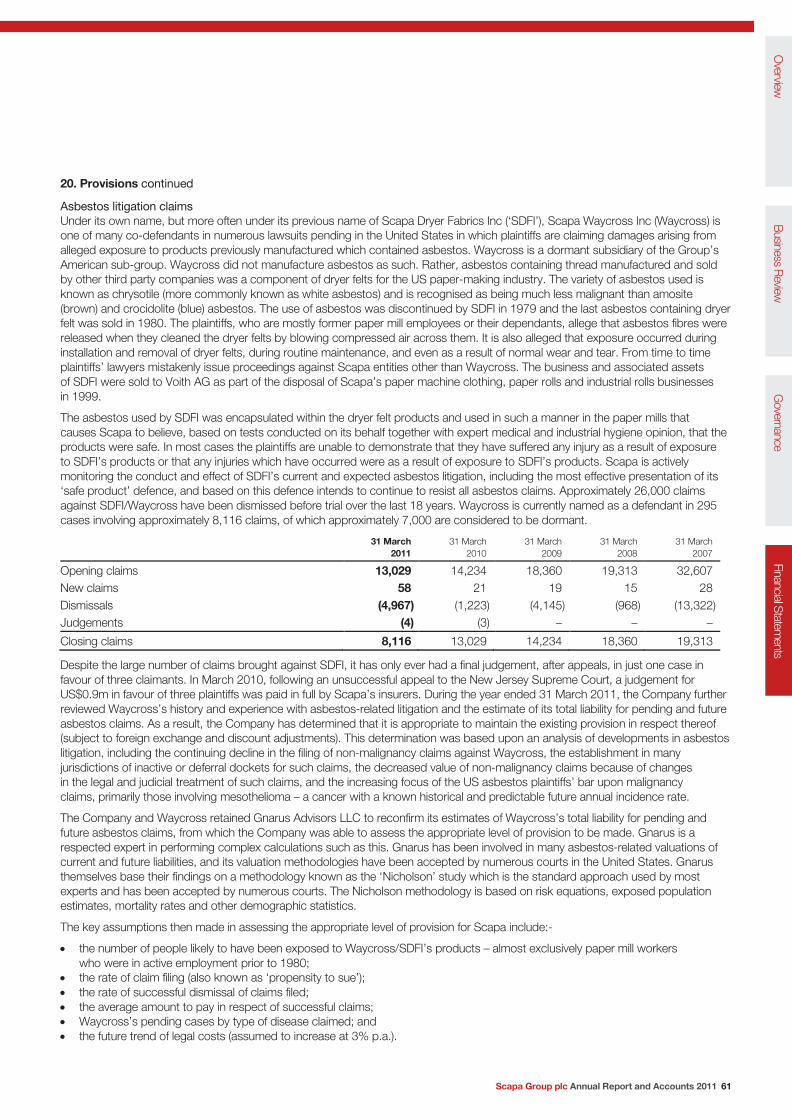
Scapa Group plc Annual Report and Accounts 2011 61
20. Provisions continued
Asbestos litigation claims Under its own name, but more often under its previous name of Scapa Dryer Fabrics Inc (‘SDFI’), Scapa Waycross Inc (Waycross) is one of many co-defendants in numerous lawsuits pending in the United States in which plaintiffs are claiming damages arising from alleged exposure to products previously manufactured which contained asbestos. Waycross is a dormant subsidiary of the Group’s American sub-group. Waycross did not manufacture asbestos as such. Rather, asbestos containing thread manufactured and sold by other third party companies was a component of dryer felts for the US paper-making industry. The variety of asbestos used is known as chrysotile (more commonly known as white asbestos) and is recognised as being much less malignant than amosite (brown) and crocidolite (blue) asbestos. The use of asbestos was discontinued by SDFI in 1979 and the last asbestos containing dryer felt was sold in 1980. The plaintiffs, who are mostly former paper mill employees or their dependants, allege that asbestos fibres were released when they cleaned the dryer felts by blowing compressed air across them. It is also alleged that exposure occurred during installation and removal of dryer felts, during routine maintenance, and even as a result of normal wear and tear. From time to time plaintiffs’ lawyers mistakenly issue proceedings against Scapa entities other than Waycross. The business and associated assets of SDFI were sold to Voith AG as part of the disposal of Scapa’s paper machine clothing, paper rolls and industrial rolls businesses in 1999.
The asbestos used by SDFI was encapsulated within the dryer felt products and used in such a manner in the paper mills that causes Scapa to believe, based on tests conducted on its behalf together with expert medical and industrial hygiene opinion, that the products were safe. In most cases the plaintiffs are unable to demonstrate that they have suffered any injury as a result of exposure to SDFI’s products or that any injuries which have occurred were as a result of exposure to SDFI’s products. Scapa is actively monitoring the conduct and effect of SDFI’s current and expected asbestos litigation, including the most effective presentation of its ‘safe product’ defence, and based on this defence intends to continue to resist all asbestos claims. Approximately 26,000 claims against SDFI/Waycross have been dismissed before trial over the last 18 years. Waycross is currently named as a defendant in 295 cases involving approximately 8,116 claims, of which approximately 7,000 are considered to be dormant.
31 March
2011 31 March
2010 31 March
2009 31 March
2008 31 March
2007
Opening claims 13,029 14,234 18,360 19,313 32,607 New claims 58 21 19 15 28 Dismissals (4,967) (1,223) (4,145) (968) (13,322) Judgements (4) (3) – – –
Closing claims 8,116 13,029 14,234 18,360 19,313
Despite the large number of claims brought against SDFI, it has only ever had a final judgement, after appeals, in just one case in favour of three claimants. In March 2010, following an unsuccessful appeal to the New Jersey Supreme Court, a judgement for US$0.9m in favour of three plaintiffs was paid in full by Scapa’s insurers. During the year ended 31 March 2011, the Company further reviewed Waycross’s history and experience with asbestos-related litigation and the estimate of its total liability for pending and future asbestos claims. As a result, the Company has determined that it is appropriate to maintain the existing provision in respect thereof (subject to foreign exchange and discount adjustments). This determination was based upon an analysis of developments in asbestos litigation, including the continuing decline in the filing of non-malignancy claims against Waycross, the establishment in many jurisdictions of inactive or deferral dockets for such claims, the decreased value of non-malignancy claims because of changes in the legal and judicial treatment of such claims, and the increasing focus of the US asbestos plaintiffs’ bar upon malignancy claims, primarily those involving mesothelioma – a cancer with a known historical and predictable future annual incidence rate.
The Company and Waycross retained Gnarus Advisors LLC to reconfirm its estimates of Waycross’s total liability for pending and future asbestos claims, from which the Company was able to assess the appropriate level of provision to be made. Gnarus is a respected expert in performing complex calculations such as this. Gnarus has been involved in many asbestos-related valuations of current and future liabilities, and its valuation methodologies have been accepted by numerous courts in the United States. Gnarus themselves base their findings on a methodology known as the ‘Nicholson’ study which is the standard approach used by most experts and has been accepted by numerous courts. The Nicholson methodology is based on risk equations, exposed population estimates, mortality rates and other demographic statistics.
The key assumptions then made in assessing the appropriate level of provision for Scapa include:-
• the number of people likely to have been exposed to Waycross/SDFI’s products – almost exclusively paper mill workers who were in active employment prior to 1980;
• the rate of claim filing (also known as ‘propensity to sue’); • the rate of successful dismissal of claims filed; • the average amount to pay in respect of successful claims; • Waycross’s pending cases by type of disease claimed; and • the future trend of legal costs (assumed to increase at 3% p.a.).
Overview
Business R
eviewG
overnanceFinancial Statem
ents

Notes on the Accounts continued
62 Scapa Group plc Annual Report and Accounts 2011
20. Provisions continued
The first of these key assumptions is very favourable for Scapa. Unlike many other companies who sold asbestos-containing products to a wide and diverse market that may have included the general population as a whole, Scapa’s products were sold to and used exclusively in a very narrow and well defined set of circumstances. Scapa also has a full record of the customers, locations and dates of sale of the product in question. The result is a very narrow relevant population and a very high evidential hurdle to overcome before even being able to pursue a valid claim.
Lifetime asbestos indemnity provision and associated insurance receivable
2011
£m 2010
£m
Discounted pre-tax provision 19.9 20.3 Insurance asset (19.9) (20.3)
Net liability – –
Provision for future legal costs 5.7 7.5
The provision is discounted using a risk free rate of 4.6%; the unwind of the discount is applied to both the assets and the liability. The provision and receivable are held in US Dollars and converted at the year end exchange rate. The provision covers the time horizon to 2053 which is the date when the Nicholson model predicts the last incidence of mesothelioma from any source at all in the USA.
As in any long term projection of this nature (42 year estimation period) there remains significant uncertainty associated with the future level of asbestos claims and the costs arising out of related litigation. There can be no guarantee that the assumptions used to estimate the provision will result in an accurate prediction of the actual costs that may be incurred and, as a result, the provision may be subject to potentially material revision from time to time if new information becomes available as a result of future events.
Following the initiation of asbestos litigation against Waycross and Group companies in the early 1990’s, strenuous efforts were made to identify all available primary and excess insurance coverage and carriers. There are various primary carriers and a number of excess/umbrella coverage carriers, all of which were put on notice of the litigation. Dickstein Shapiro LLP, a prominent Washington DC law firm with expertise in the field of evaluating insurance coverage and the likelihood of recovery for asbestos-related claims has been retained to evaluate the insurance coverage for asbestos-related claims. As a result of that evaluation the Company has established the existence of insurance coverage to a level of certainty sufficient to recognise an insurance asset equal to the provision. It should be noted that there is a residual level of uncertainty around any insurance policy until such time it is actually drawn down upon and therefore the actual value of all accessible insurance may differ from the evaluation above. Given that the value of insurance policies is significantly in excess of any reasonable range of claims outcomes, the Board’s view is that this will not lead to any material financial impact on Scapa. In addition, the Board is of the view that any potential asbestos liabilities are ring-fenced within the non-trading sub-group of the North American business. This view is based on the principle of American law that a shareholder (including a parent corporation) is generally not liable for a separate legal entity’s obligations.
Asbestos litigation costs Under the terms of a cost-sharing agreement entered into in 1996 the Group’s primary insurance carriers provided 50% of the defence costs associated with the asbestos-related claims. This share was renegotiated to 75% with effect from 1 April 2006. The litigation provision of £5.7m (2010: £7.5m) represents Scapa’s forecast share of defence costs over the lifetime of this issue and is consistent with the basis of calculation of the indemnity provision.
Reorganisation and leasehold commitments The £3.0m (2010: £3.6m) reorganisation provision relates to onerous lease commitments of £0.4m (2010: £0.7m), dilapidations for leasehold property of £0.9m (2010: £0.9m), £0.7m (2010: £0.7m) for a land value guarantee and £1.0m (2010: £1.3m) in relation to reorganisation costs.
Whilst the timing of the economic benefits relating to the non-current provisions cannot be ascertained with any degree of certainty, the leasehold commitments are expected to take place within 12 years and the reorganisation commitments within the next 1-2 years.
Environmental provisions Environmental provisions relate to expected costs required to clean up environmental contamination of a number of sites in both Europe (£0.3m) and North America (£0.3m). The Group expects the majority of the spend against the environmental provisions to be incurred over the next three years.
Scapa Group plc Annual Report and Accounts 2011 63
21. Retirement benefit liabilities
The Group operates several defined contribution and defined benefit schemes for employees in the UK and overseas.
Defined contribution schemes The Group operates a number of defined contribution schemes. Employer’s contributions are charged to the Income Statement as incurred. The total pension cost for the Group in respect of these schemes for the year ended 31 March 2011 was £1.3m (2010: £1.3m). The assets of these schemes are held in independently administered funds.
Defined benefit schemes The total amounts recognised in the Group financial statements for defined benefit schemes are summarised on pages 64 to 67.
a) UK schemes All three UK defined benefit schemes are now closed to new members and to future accrual. The schemes are now therefore wholly funded by the sponsoring employers. The assets of the schemes are held separately from Company assets under Trust.
The funding position of the three principal UK schemes, the Scapa Group Retirement Benefits Scheme, the Scapa Group Senior Retirement Benefits Scheme and Scapa Tapes UK Ltd Pension Plan, was reassessed as at April 2009 by independent qualified actuaries using the projected unit method of valuation (the ‘2009 Triennial Review’).
Following the 2009 Triennial Review the Company agreed revised cash contributions designed to repair the deficits as at 1 April 2009. The revised agreement included three years’ contribution deferrals of £0.5m per annum subject to Group cash flow performance. These contributions total £2.9m on an annualised basis, are subject to RPI indexation each year and are split as follows:
• £0.6m per annum (for three years, £0.7m thereafter to 2023 (Scapa Group Retirement Benefits Scheme); • £1.7m per annum (for three years, £2.0m thereafter to 2028 (Scapa Group Senior Retirement Benefits Scheme); and • £0.6m per annum (for three years, £0.7m thereafter to 2036 (Scapa Tapes UK Ltd Pension Plan).
The Group also pays the PPF levies and any excess administrative costs associated with each of the funds above, the payment in the current year being £0.5m (2010: £1.0m). Total annual cash contributions into the defined benefit schemes were therefore £3.4m (2010: £5.0m).
The IAS 19 Retirement Benefits valuations have been updated by the scheme actuaries, in order to assess the liabilities of the schemes at 31 March 2011. Scheme assets are stated at their market value at 31 March 2011.
b) Overseas schemes The Group operates a number of pension schemes in different countries, both of a defined benefit and defined contribution nature. In addition, in certain countries, the Group must provide for various employee termination benefits. These are accounted for as if they were defined benefit pension schemes. The total defined benefit pension charge to operating profit for the Group in respect of overseas pension schemes for the year ended 31 March 2011 was £0.7m (2010: £0.7m).
Defined benefit schemes are set up under separate trust funds and liabilities are generally assessed annually in accordance with the advice of independent actuaries. Details of the Group’s material overseas defined benefit schemes are as follows:
North America The Group operates a funded defined benefit scheme and two unfunded pension plans in North America. The disclosures are based on the most recent actuarial valuations of liabilities and asset market values at 31 March 2011.
Korea The Group operates an unfunded termination indemnity, with payments made to employees on retirement or termination of service.
France and Italy The Group operates an unfunded statutory retirement benefit scheme in France (liabilities: £2.2m), with payments made to employees on retirement, and an unfunded statutory termination indemnity plan in Italy, with payments made to employees on retirement or termination of service. The Italian scheme is closed to future accrual following changes in local legislation (liabilities: £1.0m).
Overview
Business R
eviewG
overnanceFinancial Statem
ents
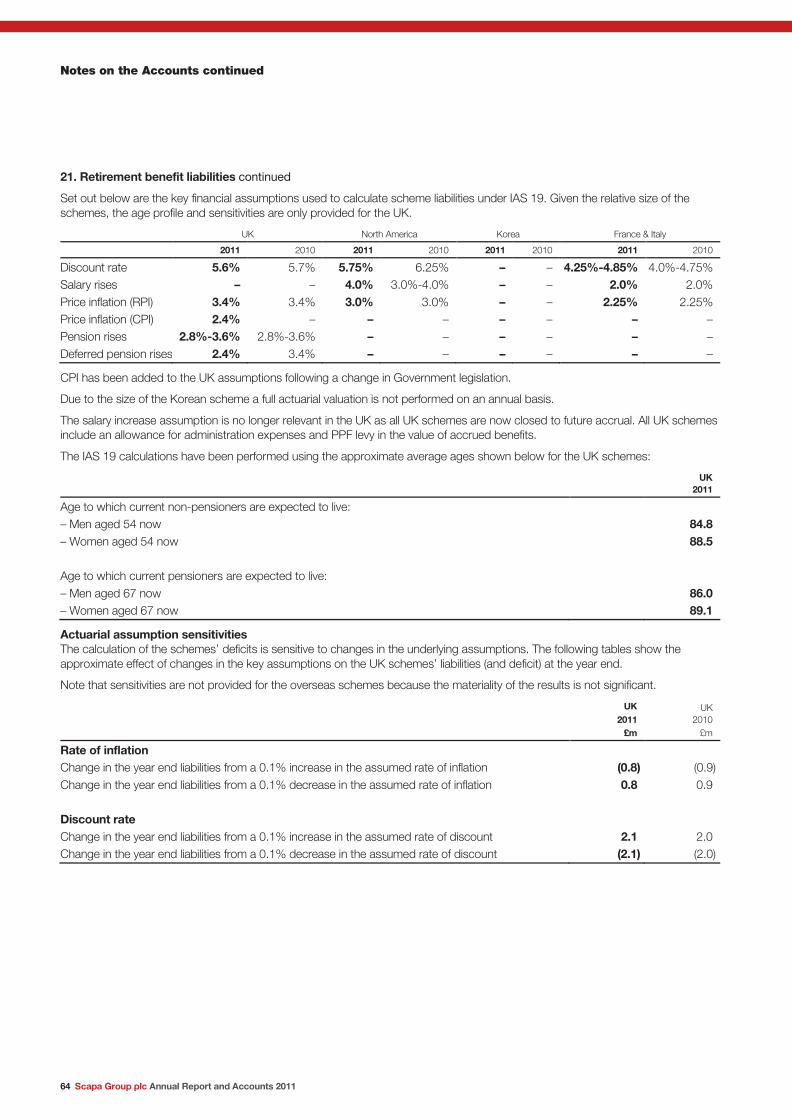
Notes on the Accounts continued
64 Scapa Group plc Annual Report and Accounts 2011
21. Retirement benefit liabilities continued
Set out below are the key financial assumptions used to calculate scheme liabilities under IAS 19. Given the relative size of the schemes, the age profile and sensitivities are only provided for the UK.
UK North America Korea France & Italy
2011 2010 2011 2010 2011 2010 2011 2010
Discount rate 5.6% 5.7% 5.75% 6.25% – – 4.25%-4.85% 4.0%-4.75% Salary rises – – 4.0% 3.0%-4.0% – – 2.0% 2.0% Price inflation (RPI) 3.4% 3.4% 3.0% 3.0% – – 2.25% 2.25% Price inflation (CPI) 2.4% – – – – – – – Pension rises 2.8%-3.6% 2.8%-3.6% – – – – – –
Deferred pension rises 2.4% 3.4% – – – – – –
CPI has been added to the UK assumptions following a change in Government legislation.
Due to the size of the Korean scheme a full actuarial valuation is not performed on an annual basis.
The salary increase assumption is no longer relevant in the UK as all UK schemes are now closed to future accrual. All UK schemes include an allowance for administration expenses and PPF levy in the value of accrued benefits.
The IAS 19 calculations have been performed using the approximate average ages shown below for the UK schemes:
UK
2011
Age to which current non-pensioners are expected to live: – Men aged 54 now 84.8 – Women aged 54 now 88.5 Age to which current pensioners are expected to live: – Men aged 67 now 86.0 – Women aged 67 now 89.1
Actuarial assumption sensitivities The calculation of the schemes’ deficits is sensitive to changes in the underlying assumptions. The following tables show the approximate effect of changes in the key assumptions on the UK schemes’ liabilities (and deficit) at the year end.
Note that sensitivities are not provided for the overseas schemes because the materiality of the results is not significant.
UK 2011
£m
UK 2010
£m
Rate of inflation Change in the year end liabilities from a 0.1% increase in the assumed rate of inflation (0.8) (0.9) Change in the year end liabilities from a 0.1% decrease in the assumed rate of inflation 0.8 0.9 Discount rate Change in the year end liabilities from a 0.1% increase in the assumed rate of discount 2.1 2.0 Change in the year end liabilities from a 0.1% decrease in the assumed rate of discount (2.1) (2.0)
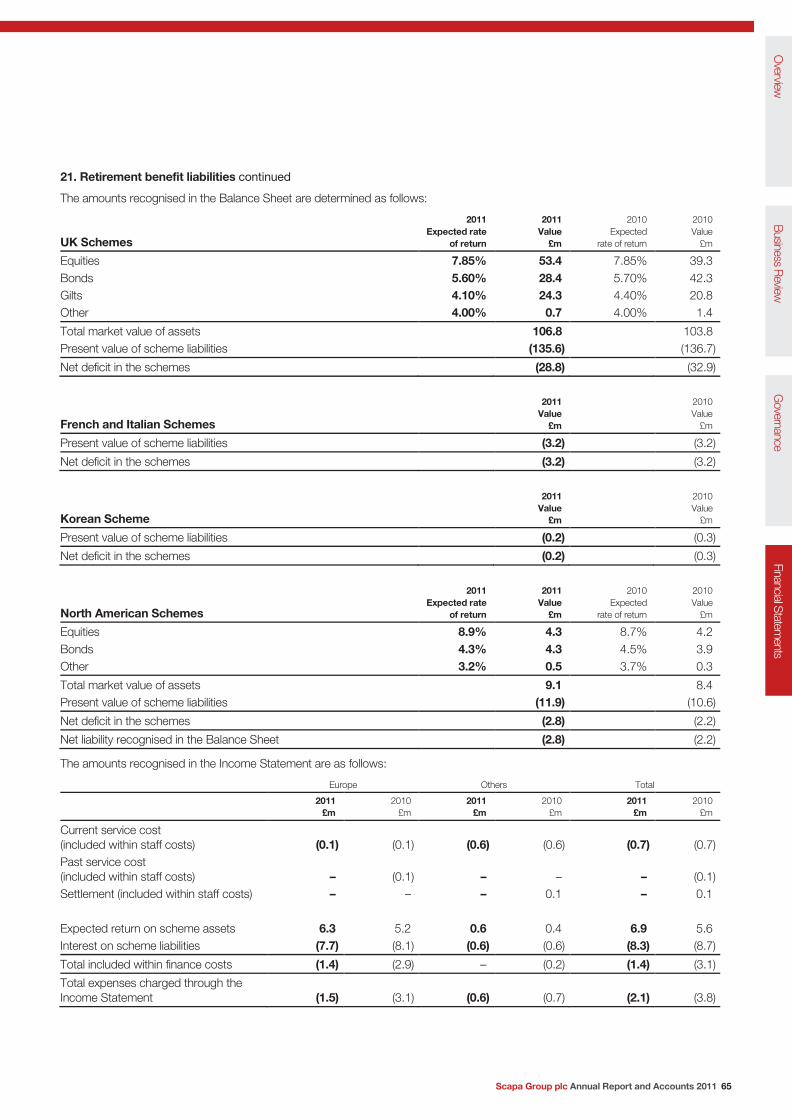
Scapa Group plc Annual Report and Accounts 2011 65
21. Retirement benefit liabilities continued
The amounts recognised in the Balance Sheet are determined as follows:
UK Schemes
2011 Expected rate
of return
2011 Value
£m
2010 Expected
rate of return
2010 Value
£m
Equities 7.85% 53.4 7.85% 39.3 Bonds 5.60% 28.4 5.70% 42.3 Gilts 4.10% 24.3 4.40% 20.8 Other 4.00% 0.7 4.00% 1.4
Total market value of assets 106.8 103.8 Present value of scheme liabilities (135.6) (136.7)
Net deficit in the schemes (28.8) (32.9)
French and Italian Schemes
2011 Value
£m
2010 Value
£m
Present value of scheme liabilities (3.2) (3.2)
Net deficit in the schemes (3.2) (3.2)
Korean Scheme
2011 Value
£m
2010 Value
£m
Present value of scheme liabilities (0.2) (0.3)
Net deficit in the schemes (0.2) (0.3)
North American Schemes
2011 Expected rate
of return
2011 Value
£m
2010 Expected
rate of return
2010 Value
£m
Equities 8.9% 4.3 8.7% 4.2 Bonds 4.3% 4.3 4.5% 3.9 Other 3.2% 0.5 3.7% 0.3
Total market value of assets 9.1 8.4 Present value of scheme liabilities (11.9) (10.6)
Net deficit in the schemes (2.8) (2.2)
Net liability recognised in the Balance Sheet (2.8) (2.2)
The amounts recognised in the Income Statement are as follows:
Europe Others Total
2011
£m 2010
£m 2011
£m 2010
£m 2011
£m 2010
£m
Current service cost (included within staff costs) (0.1) (0.1) (0.6) (0.6) (0.7) (0.7) Past service cost (included within staff costs) – (0.1) – – – (0.1) Settlement (included within staff costs) – – – 0.1 – 0.1 Expected return on scheme assets 6.3 5.2 0.6 0.4 6.9 5.6 Interest on scheme liabilities (7.7) (8.1) (0.6) (0.6) (8.3) (8.7)
Total included within finance costs (1.4) (2.9) – (0.2) (1.4) (3.1)
Total expenses charged through the Income Statement (1.5) (3.1) (0.6) (0.7) (2.1) (3.8)
Overview
Business R
eviewG
overnanceFinancial Statem
ents
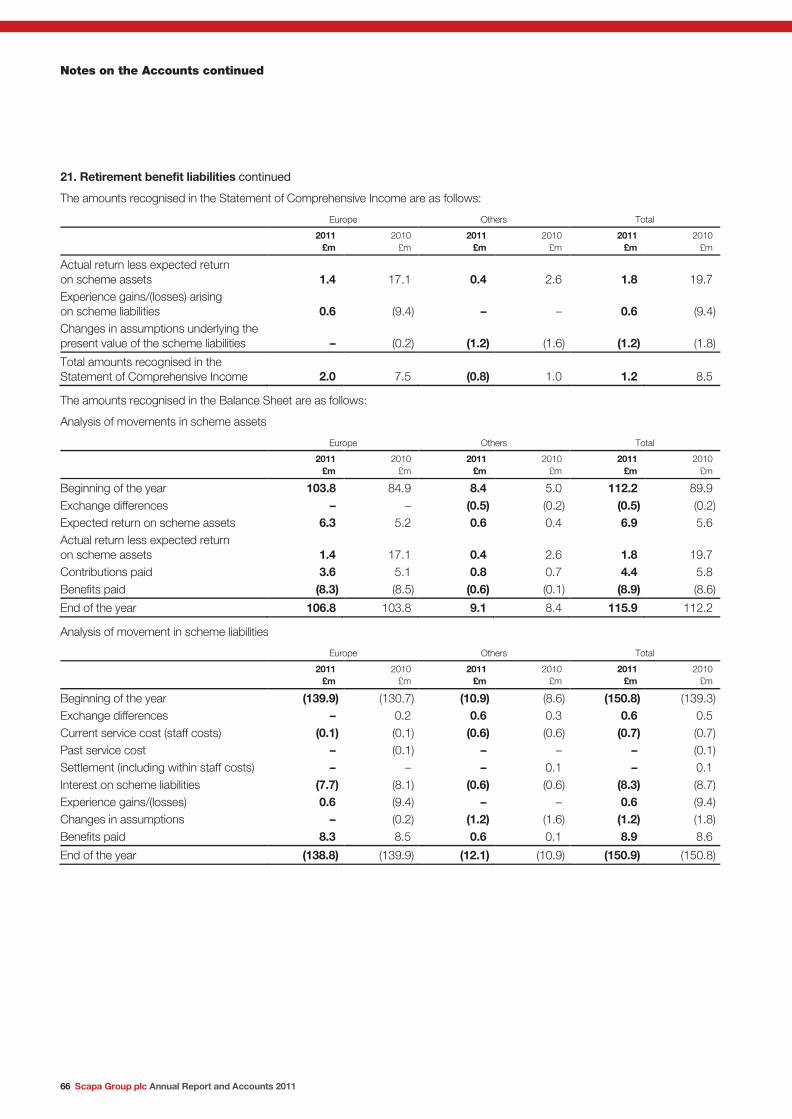
Notes on the Accounts continued
66 Scapa Group plc Annual Report and Accounts 2011
21. Retirement benefit liabilities continued
The amounts recognised in the Statement of Comprehensive Income are as follows:
Europe Others Total
2011
£m 2010
£m 2011
£m 2010
£m 2011
£m 2010
£m
Actual return less expected return on scheme assets 1.4 17.1 0.4 2.6 1.8 19.7 Experience gains/(losses) arising on scheme liabilities 0.6 (9.4) – – 0.6 (9.4) Changes in assumptions underlying the present value of the scheme liabilities – (0.2) (1.2) (1.6) (1.2) (1.8)
Total amounts recognised in the Statement of Comprehensive Income 2.0 7.5 (0.8) 1.0 1.2 8.5
The amounts recognised in the Balance Sheet are as follows:
Analysis of movements in scheme assets
Europe Others Total
2011
£m 2010
£m 2011
£m 2010
£m 2011
£m 2010
£m
Beginning of the year 103.8 84.9 8.4 5.0 112.2 89.9 Exchange differences – – (0.5) (0.2) (0.5) (0.2) Expected return on scheme assets 6.3 5.2 0.6 0.4 6.9 5.6 Actual return less expected return on scheme assets 1.4 17.1 0.4 2.6 1.8 19.7 Contributions paid 3.6 5.1 0.8 0.7 4.4 5.8 Benefits paid (8.3) (8.5) (0.6) (0.1) (8.9) (8.6)
End of the year 106.8 103.8 9.1 8.4 115.9 112.2
Analysis of movement in scheme liabilities
Europe Others Total
2011
£m 2010
£m 2011
£m 2010
£m 2011
£m 2010
£m
Beginning of the year (139.9) (130.7) (10.9) (8.6) (150.8) (139.3) Exchange differences – 0.2 0.6 0.3 0.6 0.5 Current service cost (staff costs) (0.1) (0.1) (0.6) (0.6) (0.7) (0.7) Past service cost – (0.1) – – – (0.1) Settlement (including within staff costs) – – – 0.1 – 0.1 Interest on scheme liabilities (7.7) (8.1) (0.6) (0.6) (8.3) (8.7) Experience gains/(losses) 0.6 (9.4) – – 0.6 (9.4) Changes in assumptions – (0.2) (1.2) (1.6) (1.2) (1.8) Benefits paid 8.3 8.5 0.6 0.1 8.9 8.6
End of the year (138.8) (139.9) (12.1) (10.9) (150.9) (150.8)

Scapa Group plc Annual Report and Accounts 2011 67
21. Retirement benefit liabilities continued
Analysis of movement in Balance Sheet liability:
Europe Others Total
2011
£m 2010
£m 2011
£m 2010
£m 2011
£m 2010
£m
Beginning of the year (36.1) (45.8) (2.5) (3.6) (38.6) (49.4) Exchange differences – 0.2 0.1 0.1 0.1 0.3 Income Statement expense (1.5) (3.1) (0.6) (0.7) (2.1) (3.8) Statement of Comprehensive Income items 2.0 7.5 (0.8) 1.0 1.2 8.5 Contributions paid 3.6 5.1 0.8 0.7 4.4 5.8
Net deficit in the schemes (32.0) (36.1) (3.0) (2.5) (35.0) (38.6)
End of the year (32.0) (36.1) (3.0) (2.5) (35.0) (38.6)
Cumulative actuarial losses on pension schemes recognised in reserves total £9.6m (2010: £10.8m).
Europe
2011
£m 2010
£m 2009
£m 2008
£m 2007
£m
Present value of defined benefit obligation (138.8) (139.9) (130.7) (136.5) (149.1) Fair value of plan assets 106.8 103.8 84.9 94.3 92.0
Deficit in the plan (32.0) (36.1) (45.8) (42.2) (57.1)
Experience adjustments on plan liabilities 0.5 (9.6) 8.1 10.6 (0.8)
Experience adjustments on plan assets 1.4 17.1 (14.3) (1.5) (2.2)
Others
2011
£m 2010
£m 2009
£m 2008
£m 2007
£m
Present value of defined benefit obligation (12.1) (10.9) (8.6) (6.8) (6.6) Fair value of plan assets 9.1 8.4 5.0 5.8 5.4 Unrecognised past service cost – – 0.1 0.1 –
Deficit in the plan (3.0) (2.5) (3.5) (0.9) (1.2) Experience adjustments on plan liabilities – (1.6) 0.1 (0.2) 0.1
Experience adjustments on plan assets 0.4 2.6 (2.9) (0.4) –
Total
2011
£m 2010
£m 2009
£m 2008
£m 2007
£m
Present value of defined benefit obligation (150.9) (150.8) (139.3) (143.3) (155.7) Fair value of plan assets 115.9 112.2 89.9 100.1 97.4 Unrecognised past service cost – – 0.1 0.1 –
Deficit in the plan (35.0) (38.6) (49.3) (43.1) (58.3)
Experience adjustments on plan liabilities 0.5 (11.2) 8.2 10.4 (0.7)
Experience adjustments on plan assets 1.8 19.7 (17.2) (1.9) (2.2)
The above disclosures are stated under IFRSs on an IAS 19 basis.
Overview
Business R
eviewG
overnanceFinancial Statem
ents

Notes on the Accounts continued
68 Scapa Group plc Annual Report and Accounts 2011
22. Share capital
2011
£m 2010
£m
Allotted, issued and fully paid 145,095,883 shares of 5p each 7.3 7.2
The movement in share capital (2010: 144,762,868) relates to share options (see below).
Potential issues of ordinary shares Certain senior managers hold options to subscribe for shares in the Company at prices ranging from nil pence per share to 94.5 pence per share under the share options schemes approved by shareholders. The number of shares subject to options, the periods in which they were granted, and the periods in which they may be exercised are given below:
Scheme Year of grant Average exercise
price per share Exercise period
Number of options
2011
Number of options
2010
Executive share option plan 2000-2002 49p-94.5p up to 20 June 2012 78,500 358,500 Executive share option plan 2006 22.25p up to 31 August 2016 250,000 900,000 Executive share option plan 2007 29.25p up to 20 August 2017 400,000 1,300,000 Executive share option plan 2007 32.75p up to 10 December 2017 300,000 300,000 Executive share option plan 2008 27.75p up to 7 July 2018 200,000 250,000 US stock option plan 2000-2002 49p-94.5p up to 20 June 2012 44,500 452,000 Performance share plan 2009 nil pence per share up to 6 September 2019 500,000 500,000 Performance share plan 2010 nil pence per share up to 8 June 2020 2,500,000 – Performance share plan 2010 nil pence per share up to 29 November 2020 1,500,000 – Sharesave option plan 3 year 2008 24.6p up to 1 September 2011 13,266 322,324 Sharesave option plan 5 year 2008 24.6p up to 1 September 2013 234,921 323,701 Sharesave option plan 3 year 2009 13p up to 1 September 2012 1,025,470 1,236,045 Sharesave option plan 5 year 2009 13p up to 1 September 2014 488,489 725,257
7,535,146 6,667,827
During the year 333,015 options under the 2008 three-year Sharesave option plan were exercised. All other movements from 2010 are expired/lapsed options and new grants.
Details of the share option assumptions and criteria are contained within the Directors’ Remuneration Report.
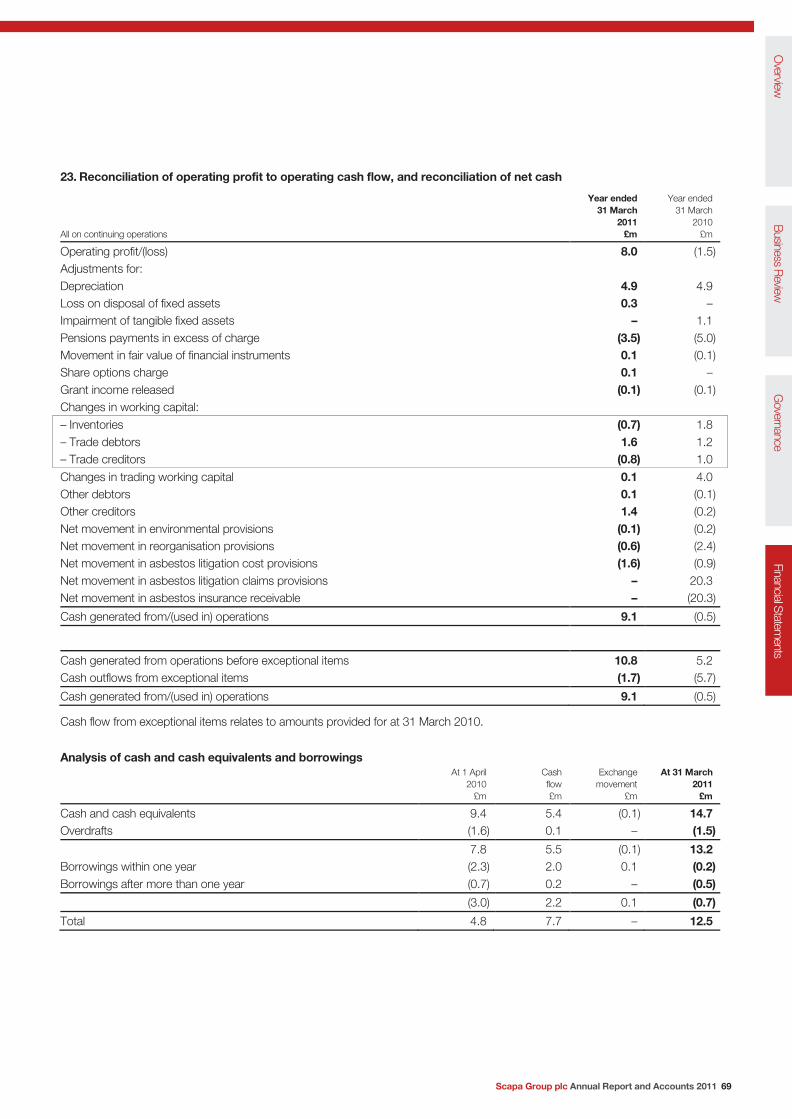
Scapa Group plc Annual Report and Accounts 2011 69
23. Reconciliation of operating profit to operating cash flow, and reconciliation of net cash
All on continuing operations
Year ended 31 March
2011 £m
Year ended 31 March
2010 £m
Operating profit/(loss) 8.0 (1.5) Adjustments for: Depreciation 4.9 4.9 Loss on disposal of fixed assets 0.3 – Impairment of tangible fixed assets – 1.1 Pensions payments in excess of charge (3.5) (5.0) Movement in fair value of financial instruments 0.1 (0.1) Share options charge 0.1 – Grant income released (0.1) (0.1) Changes in working capital: – Inventories (0.7) 1.8 – Trade debtors 1.6 1.2 – Trade creditors (0.8) 1.0
Changes in trading working capital 0.1 4.0 Other debtors 0.1 (0.1) Other creditors 1.4 (0.2) Net movement in environmental provisions (0.1) (0.2) Net movement in reorganisation provisions (0.6) (2.4) Net movement in asbestos litigation cost provisions (1.6) (0.9) Net movement in asbestos litigation claims provisions – 20.3 Net movement in asbestos insurance receivable – (20.3)
Cash generated from/(used in) operations 9.1 (0.5)
Cash generated from operations before exceptional items 10.8 5.2 Cash outflows from exceptional items (1.7) (5.7)
Cash generated from/(used in) operations 9.1 (0.5)
Cash flow from exceptional items relates to amounts provided for at 31 March 2010.
Analysis of cash and cash equivalents and borrowings
At 1 April 2010
£m
Cash flow £m
Exchange movement
£m
At 31 March 2011
£m
Cash and cash equivalents 9.4 5.4 (0.1) 14.7 Overdrafts (1.6) 0.1 – (1.5)
7.8 5.5 (0.1) 13.2 Borrowings within one year (2.3) 2.0 0.1 (0.2) Borrowings after more than one year (0.7) 0.2 – (0.5)
(3.0) 2.2 0.1 (0.7)
Total 4.8 7.7 – 12.5
Overview
Business R
eviewG
overnanceFinancial Statem
ents
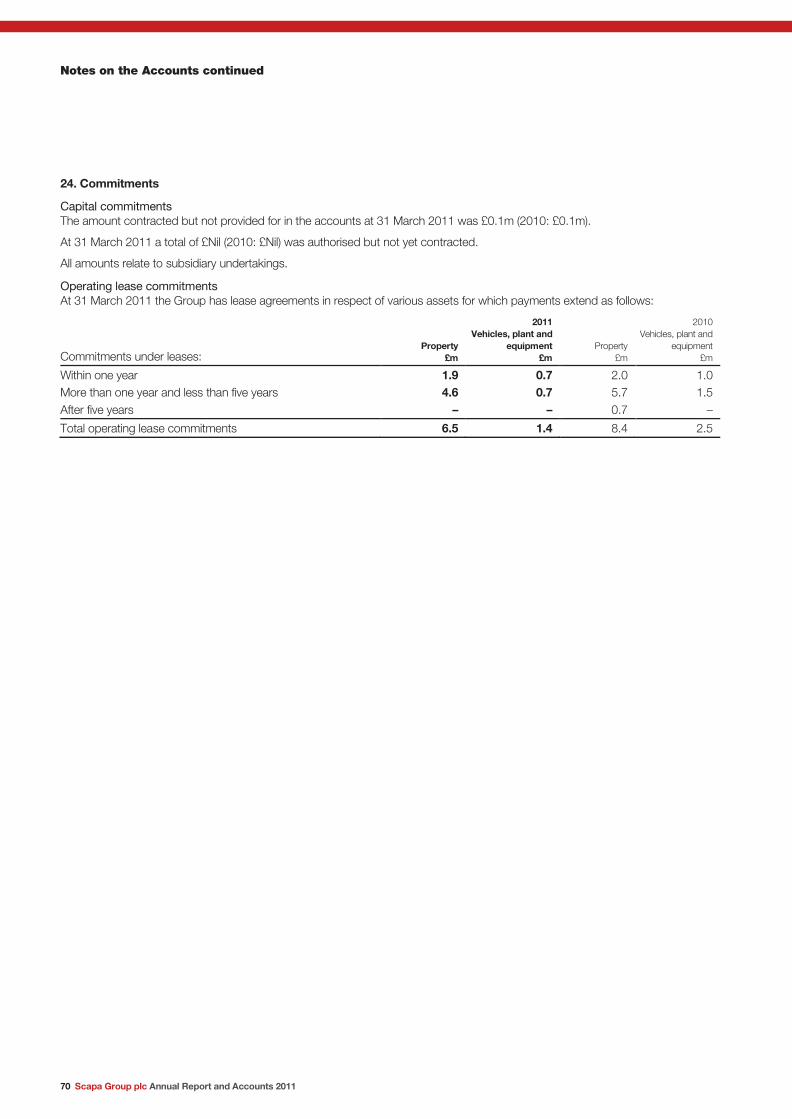
Notes on the Accounts continued
70 Scapa Group plc Annual Report and Accounts 2011
24. Commitments
Capital commitments The amount contracted but not provided for in the accounts at 31 March 2011 was £0.1m (2010: £0.1m).
At 31 March 2011 a total of £Nil (2010: £Nil) was authorised but not yet contracted.
All amounts relate to subsidiary undertakings.
Operating lease commitments At 31 March 2011 the Group has lease agreements in respect of various assets for which payments extend as follows:
Commitments under leases: Property
£m
2011 Vehicles, plant and
equipment £m
Property £m
2010 Vehicles, plant and
equipment £m
Within one year 1.9 0.7 2.0 1.0 More than one year and less than five years 4.6 0.7 5.7 1.5 After five years – – 0.7 –
Total operating lease commitments 6.5 1.4 8.4 2.5

Five Year Summaries
Scapa Group plc Annual Report and Accounts 2011 71
Five Year Financial Summary (unaudited)
2011
£m 2010
£m 2009
£m 2008
£m 2007
£m
Group revenue 192.3 176.7 174.0 170.1 184.3
Group profits/(losses) Profit/(loss) before taxation and exceptional items 6.1 (2.1) (3.4) 7.7 4.2 Exceptional items (operating (charges)/income) – (3.1) (5.9) (0.3) 8.7
Profit/(loss) before taxation 6.1 (5.2) (9.3) 7.4 12.9 Taxation – Taxation on operating activities (2.1) 1.4 1.6 (2.9) (2.6) – Taxation on exceptional items – 1.0 1.8 – 3.0 – Impact of change in tax rate (0.5) – – – – – Exceptional recognition of previously unrecognised deferred tax assets – – 16.8 – –
(2.6) 2.4 20.2 (2.9) 0.4
Profit/(loss) after taxation 3.5 (2.8) 10.9 4.5 13.3
Headline earnings/(loss) per share (p) 2.4 (0.5) (1.2) 3.3 1.1
Net cash equivalents/(debt) 12.5 4.8 6.8 14.8 11.2 Shareholders’ funds – equity 68.6 65.3 62.3 41.2 19.4 Net assets per share (p) 47.4 45.1 43.0 28.5 13.4
Exchange rates (unaudited)
2011 2010 2009 2008 2007
US$ – Closing 1.60 1.52 1.43 1.99 1.96 – Average 1.56 1.58 1.73 2.00 1.89 Canadian $ – Closing 1.56 1.54 1.80 2.04 2.26 – Average 1.58 1.74 1.92 2.08 2.15 Euro – Closing 1.13 1.12 1.08 1.25 1.47 – Average 1.17 1.13 1.21 1.42 1.47
Overview
Business R
eviewG
overnanceFinancial Statem
ents

Scapa Group plc Parent Company Financial Statements
72 Scapa Group plc Annual Report and Accounts 2011
The separate financial statements of Scapa Group plc are presented on pages 74-81, as required by the Companies Act 2006 (‘the Act’). The Group has elected not to adopt International Financial Reporting Standards in the individual company accounts for the Parent Company and subsidiary undertakings, and accordingly these financial statements have been prepared under UK accounting standards and in accordance with the Act. They are therefore presented separately to the Group consolidated financial statements which have been prepared under International Financial Reporting Standards.
Independent Auditors’ Report To the Members of Scapa Group plc
Scapa Group plc Annual Report and Accounts 2011 73
We have audited the Parent Company financial statements of Scapa Group plc for the year ended 31 March 2011 which comprise the Company Balance Sheet, the Statement of Total Recognised Gains and Losses, the Statement of Accounting Policies and the related notes. The financial reporting framework that has been applied in their preparation is applicable law and United Kingdom Accounting Standards (United Kingdom Generally Accepted Accounting Practice).
Respective responsibilities of Directors and Auditors As explained more fully in the Statement of Directors’ Responsibilities set out on page 35, the Directors are responsible for the preparation of the Parent Company financial statements and for being satisfied that they give a true and fair view. Our responsibility is to audit and express an opinion on the Parent Company financial statements in accordance with applicable law and International Standards on Auditing (UK and Ireland). Those standards require us to comply with the Auditing Practices Board’s Ethical Standards for Auditors.
This report, including the opinions, has been prepared for and only for the Company’s members as a body in accordance with Chapter 3 of Part 16 of the Companies Act 2006 and for no other purpose. We do not, in giving these opinions, accept or assume responsibility for any other purpose or to any other person to whom this report is shown or into whose hands it may come save where expressly agreed by our prior consent in writing.
Scope of the audit of the financial statements An audit involves obtaining evidence about the amounts and disclosures in the financial statements sufficient to give reasonable assurance that the financial statements are free from material misstatement, whether caused by fraud or error. This includes an assessment of: whether the accounting policies are appropriate to the Parent Company’s circumstances and have been consistently applied and adequately disclosed; the reasonableness of significant accounting estimates made by the Directors; and the overall presentation of the financial statements. In addition, we read all the financial and non-financial information in the Annual Report and Accounts to identify material inconsistencies with the audited financial statements. If we become aware of any apparent material misstatements or inconsistencies we consider the implications for our report.
Opinion on financial statements In our opinion the Parent Company financial statements:
• give a true and fair view of the state of the Company’s affairs as at 31 March 2011; • have been properly prepared in accordance with United Kingdom Generally Accepted Accounting Practice; and • have been prepared in accordance with the requirements of the Companies Act 2006.
Opinion on other matter prescribed by the Companies Act 2006 In our opinion the information given in the Directors’ Report for the financial year for which the Parent Company financial statements are prepared is consistent with the Parent Company financial statements.
Matters on which we are required to report by exception We have nothing to report in respect of the following matters where the Companies Act 2006 requires us to report to you if, in our opinion:
• adequate accounting records have not been kept by the Parent Company, or returns adequate for our audit have not been received from branches not visited by us; or
• the Parent Company financial statements are not in agreement with the accounting records and returns; or • certain disclosures of Directors’ remuneration specified by law are not made; or • we have not received all the information and explanations we require for our audit.
Other matter We have reported separately on the Group financial statements of Scapa Group plc for the year ended 31 March 2011.
Ian Marsden (Senior Statutory Auditor) for and on behalf of PricewaterhouseCoopers LLP Chartered Accountants and Statutory Auditors Manchester
26 May 2011
Overview
Business R
eviewG
overnanceFinancial Statem
ents
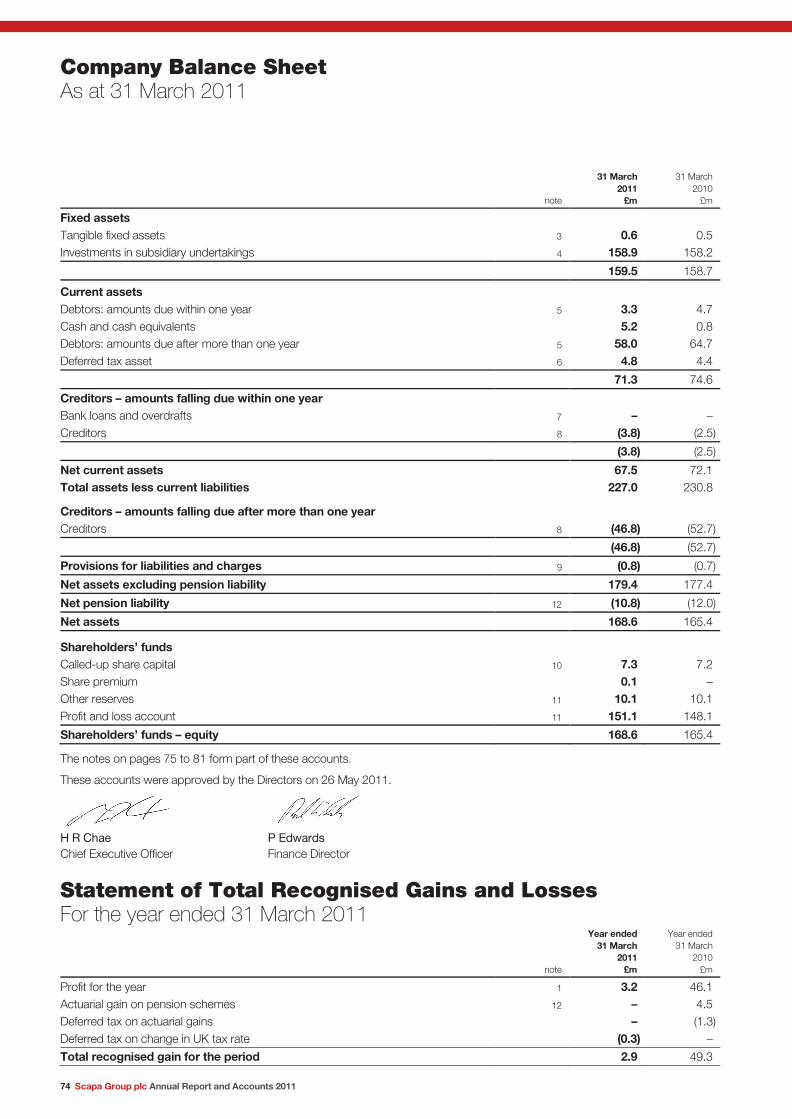
Company Balance Sheet As at 31 March 2011
74 Scapa Group plc Annual Report and Accounts 2011
note
31 March 2011 £m
31 March 2010
£m
Fixed assets Tangible fixed assets 3 0.6 0.5 Investments in subsidiary undertakings 4 158.9 158.2
159.5 158.7
Current assets Debtors: amounts due within one year 5 3.3 4.7 Cash and cash equivalents 5.2 0.8 Debtors: amounts due after more than one year 5 58.0 64.7 Deferred tax asset 6 4.8 4.4
71.3 74.6
Creditors – amounts falling due within one year Bank loans and overdrafts 7 – – Creditors 8 (3.8) (2.5)
(3.8) (2.5)
Net current assets 67.5 72.1 Total assets less current liabilities 227.0 230.8
Creditors – amounts falling due after more than one year Creditors 8 (46.8) (52.7)
(46.8) (52.7)
Provisions for liabilities and charges 9 (0.8) (0.7)
Net assets excluding pension liability 179.4 177.4
Net pension liability 12 (10.8) (12.0)
Net assets 168.6 165.4
Shareholders’ funds Called-up share capital 10 7.3 7.2 Share premium 0.1 – Other reserves 11 10.1 10.1 Profit and loss account 11 151.1 148.1
Shareholders’ funds – equity 168.6 165.4
The notes on pages 75 to 81 form part of these accounts.
These accounts were approved by the Directors on 26 May 2011.
H R Chae P Edwards Chief Executive Officer Finance Director
Statement of Total Recognised Gains and Losses For the year ended 31 March 2011
note
Year ended 31 March
2011 £m
Year ended 31 March
2010 £m
Profit for the year 1 3.2 46.1 Actuarial gain on pension schemes 12 – 4.5 Deferred tax on actuarial gains – (1.3) Deferred tax on change in UK tax rate (0.3) –
Total recognised gain for the period 2.9 49.3

Statement of Accounting Policies
Scapa Group plc Annual Report and Accounts 2011 75
Basis of accounting These financial statements have been prepared on a going concern basis under the historical cost convention, as modified by revaluation of certain financial instruments in accordance with the Companies Act 2006 and applicable UK accounting standards.
A summary of the Company’s principal accounting policies is set out below. These have been applied consistently throughout the year.
Tangible fixed assets Tangible fixed assets are stated at cost less cumulative depreciation and impairment. Depreciation is provided on the basis of writing off the cost of the relevant assets over their expected useful lives. The Company applies the straight line method. The effect is to reduce the cost of plant, machinery and fixtures to estimated residual value over a period of 5–20 years.
Taxation The charge for taxation is based on the taxable profits and losses for the year and takes into account deferred taxation. Full provision is made for deferred tax assets and liabilities arising from timing differences between the recognition of gains and losses in the financial statements and their recognition in a tax computation. Deferred tax assets are only recognised to the extent that their recoverability is regarded as more likely than not.
Provisions Provisions are made in accordance with FRS 12 where an obligation exists for a future liability in respect of a past event and where the amount of obligation can be reliably estimated. Provision is made for vacant and sub-let leasehold properties to the extent that future rental payments are expected to exceed future rental income and for all other known liabilities which exist at the Balance Sheet date, based on management’s best estimate as to the cost of settling these liabilities.
Pension costs Pension costs are accounted for under FRS 17 ‘Retirement Benefits’.
(i) Defined Benefit Pension Schemes For defined benefit schemes, the cost of benefits accruing during the year in respect of current and past service is charged
against operating profit. The expected return on the scheme’s assets and the increase in the present value of the scheme’s liabilities arising from the passage of time, are included in other finance income. Actuarial gains and losses are recognised in the Statement of Total Recognised Gains and Losses.
The Balance Sheet includes the deficit in schemes taking assets at their year-end market values and liabilities at their actuarially calculated value discounted at the current rate of return on a high quality corporate bond of equivalent term and currency to the liability.
(ii) Defined Contribution Pension Schemes Amounts charged in respect of defined contribution pension schemes represent contributions payable in the year.
Fixed asset investments Fixed asset investments are stated at cost, less provision for any impairment in value. Where circumstances indicate that there may have been impairment in the carrying value of a tangible or intangible fixed asset, an impairment review is carried out using cash flows from approved forecasts and projections discounted at the Group’s weighted average cost of capital.
Share-based payments The fair value of employee share options plans is calculated using the appropriate valuation models in accordance with FRS 20 ‘Share-based payments’. The resulting cost is charged to the profit and loss account over the vesting period of the options. The value of the charge is adjusted to reflect expected and actual levels of options vesting. Where share options are granted to employees of subsidiary companies, the cost is debited to the carrying value of the subsidiary investments.
Foreign currencies Transactions in foreign currencies are recorded at the rate ruling at the date of the transaction. Monetary assets and liabilities denominated in foreign currencies are translated into Sterling at the rate of exchange at the Balance Sheet date. Exchange differences on borrowings (including differences arising due to currency swaps) taken out to hedge overseas equity investments and on long-term loans which are considered equivalent to equity are taken to the translation reserve. All other differences are taken to the profit and loss account.
Cash flow statement The Company is a wholly-owned subsidiary of Scapa Group plc and is included in the consolidated financial statements of Scapa Group plc which are publicly available. Consequently, the Company has taken advantage of the exemption from preparing a cash flow statement under the terms of FRS 1 ‘Cash Flow Statements’ (revised 1996).
Related parties The Directors’ Remuneration Report can be found in the Group accounts. There are no other related party transactions. The Company is exempt under the terms of FRS 8 from disclosing related party transactions with entities that are part of Scapa Group plc.
Overview
Business R
eviewG
overnanceFinancial Statem
ents
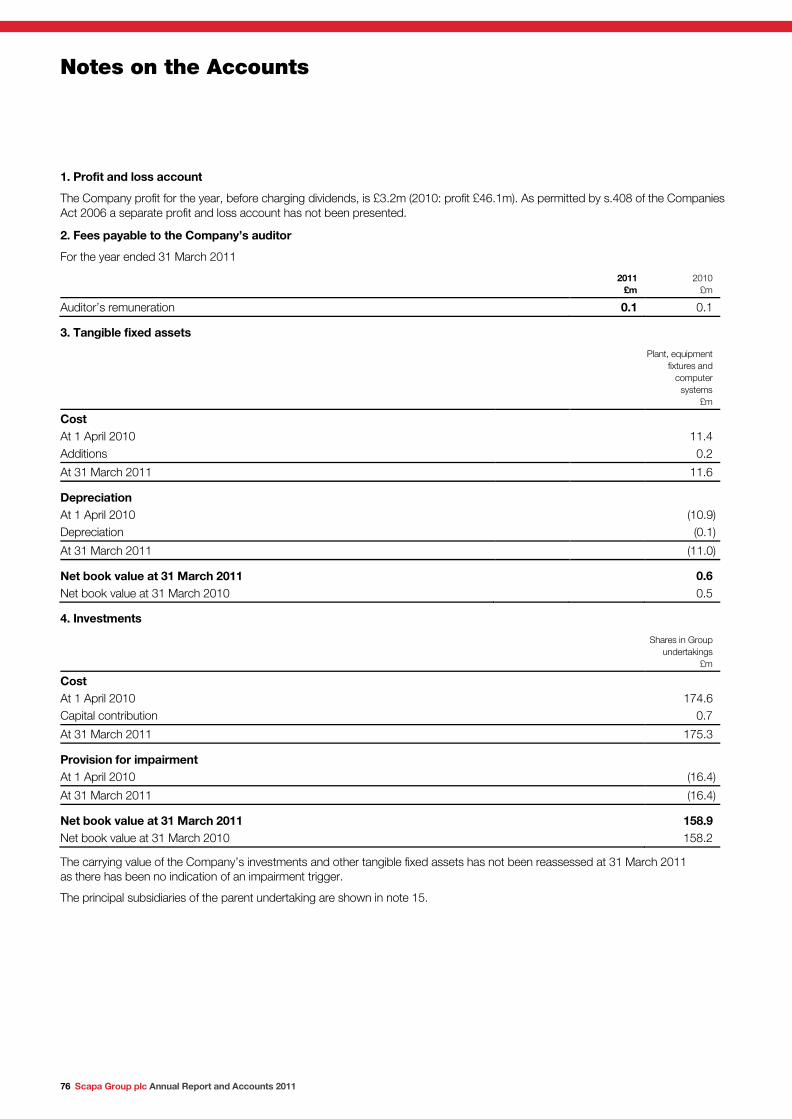
Notes on the Accounts
76 Scapa Group plc Annual Report and Accounts 2011
1. Profit and loss account
The Company profit for the year, before charging dividends, is £3.2m (2010: profit £46.1m). As permitted by s.408 of the Companies Act 2006 a separate profit and loss account has not been presented.
2. Fees payable to the Company’s auditor
For the year ended 31 March 2011
2011
£m 2010
£m
Auditor’s remuneration 0.1 0.1
3. Tangible fixed assets
Plant, equipment fixtures and
computer systems
£m
Cost At 1 April 2010 11.4 Additions 0.2
At 31 March 2011 11.6
Depreciation At 1 April 2010 (10.9) Depreciation (0.1)
At 31 March 2011 (11.0)
Net book value at 31 March 2011 0.6 Net book value at 31 March 2010 0.5
4. Investments
Shares in Group undertakings
£m
Cost At 1 April 2010 174.6 Capital contribution 0.7
At 31 March 2011 175.3
Provision for impairment At 1 April 2010 (16.4)
At 31 March 2011 (16.4)
Net book value at 31 March 2011 158.9 Net book value at 31 March 2010 158.2
The carrying value of the Company’s investments and other tangible fixed assets has not been reassessed at 31 March 2011 as there has been no indication of an impairment trigger.
The principal subsidiaries of the parent undertaking are shown in note 15.
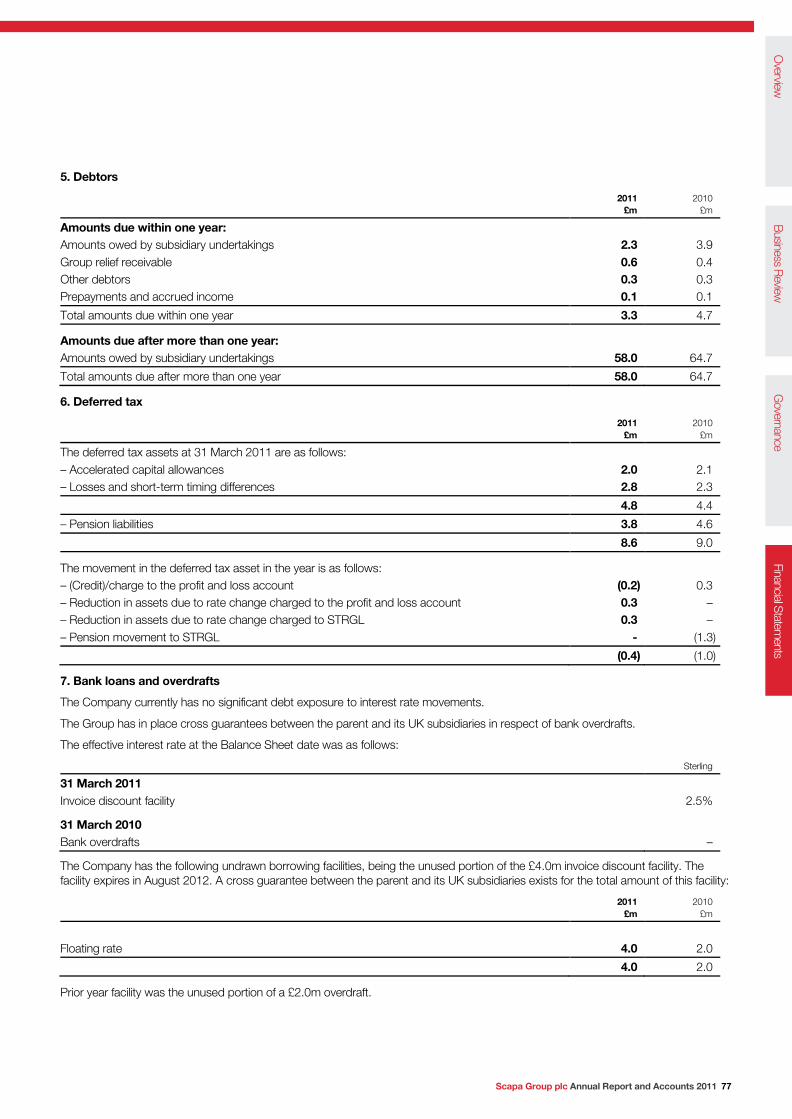
Scapa Group plc Annual Report and Accounts 2011 77
5. Debtors
2011
£m 2010
£m
Amounts due within one year: Amounts owed by subsidiary undertakings 2.3 3.9 Group relief receivable 0.6 0.4 Other debtors 0.3 0.3 Prepayments and accrued income 0.1 0.1
Total amounts due within one year 3.3 4.7
Amounts due after more than one year: Amounts owed by subsidiary undertakings 58.0 64.7
Total amounts due after more than one year 58.0 64.7
6. Deferred tax
2011
£m 2010
£m
The deferred tax assets at 31 March 2011 are as follows: – Accelerated capital allowances 2.0 2.1 – Losses and short-term timing differences 2.8 2.3
4.8 4.4
– Pension liabilities 3.8 4.6
8.6 9.0
The movement in the deferred tax asset in the year is as follows: – (Credit)/charge to the profit and loss account (0.2) 0.3 – Reduction in assets due to rate change charged to the profit and loss account 0.3 – – Reduction in assets due to rate change charged to STRGL 0.3 – – Pension movement to STRGL - (1.3)
(0.4) (1.0)
7. Bank loans and overdrafts
The Company currently has no significant debt exposure to interest rate movements.
The Group has in place cross guarantees between the parent and its UK subsidiaries in respect of bank overdrafts.
The effective interest rate at the Balance Sheet date was as follows:
Sterling
31 March 2011 Invoice discount facility 2.5%
31 March 2010 Bank overdrafts –
The Company has the following undrawn borrowing facilities, being the unused portion of the £4.0m invoice discount facility. The facility expires in August 2012. A cross guarantee between the parent and its UK subsidiaries exists for the total amount of this facility:
2011
£m 2010
£m
Floating rate 4.0 2.0
4.0 2.0
Prior year facility was the unused portion of a £2.0m overdraft.
Overview
Business R
eviewG
overnanceFinancial Statem
ents

Notes on the Accounts continued
78 Scapa Group plc Annual Report and Accounts 2011
7. Bank loans and overdrafts continued
Maturity of non-current financial assets 1-2 years
£m
More than 5 years
£m Total
£m
31 March 2011 Debtors – 58.0 58.0
31 March 2010 Debtors – 64.7 64.7
Fair and book values of non-current financial assets
All non-current financial assets are stated at fair value.
8. Creditors
2011
£m 2010
£m
Amounts due within one year: Amounts owed to subsidiary undertakings 1.6 1.3 Other creditors 2.2 1.2
Total amounts due within one year 3.8 2.5
Amounts due after more than one year: Amounts owed to subsidiary undertakings 46.8 52.7
Total amounts due after more than one year 46.8 52.7
The terms of loans owed to subsidiary undertakings vary; expiry of these ranges from 2015-2020.
9. Provisions
2011
£m 2010
£m
At 1 April 0.7 0.7 Additions in the year 0.1 –
At 31 March 0.8 0.7
Part of the provision relates to the Megolon disposal in 2007. Under the Sale and Purchase Agreement the acquirer can require Scapa to make good any shortfall to an agreed value on the sale of certain property within 42 months of acquisition. A third party valuation in 2009 indicated a shortfall at that time of £0.7m. The remaining provision relates to reorganisation costs.
10. Share capital
2011
£m 2010
£m
Allotted, issued and fully paid 145,095,883 shares of 5p each 7.3 7.2
The movement in share capital (2010: 144,762,868) relates to share options (see note 22 of the Group accounts).
Share options Potential issues of ordinary shares and share options for the Company are disclosed in note 22 of the Group accounts.

Scapa Group plc Annual Report and Accounts 2011 79
11. Reconciliation of shareholders’ funds
Share capital
£m
Share premium
£m
Other reserves
£m
Profit and loss account
£m Total
£m
Balance at 1 April 2010 7.2 – 10.1 148.1 165.4
Issue of share capital 0.1 0.1 – – 0.2 Share options – – – 0.1 0.1 Profit for the period – – – 3.2 (1.8) Deferred tax on change in UK tax rate – – – (0.3) (0.3)
Balance at 31 March 2011 7.3 0.1 10.1 151.1 168.6
Profit for the year includes dividends paid by Group companies of £5.0m.
12. Pension schemes
The Company operates several defined benefit schemes and a defined contribution scheme for employees in the UK.
UK Pension schemes
(a) Defined contribution scheme The Company operates a defined contribution scheme in the UK. Employer’s contributions are charged to the profit and loss account as incurred. The total pension cost for the Company in respect of this scheme for the year ended 31 March 2011 was £0.1m (2010: £0.1m).
(b) Defined benefit schemes The UK defined benefit schemes are closed to new members and future accrual and are therefore funded by contributions from members as defined in the scheme rules, and by the employing company at a rate assessed by the scheme actuary as sufficient to meet the balance of costs determined following the triennial fund reviews. The assets of the schemes are held separately from Company assets under Trust.
The FRS 17 ‘Retirement Benefits’ valuations have been updated by the scheme actuaries, in order to assess the liabilities of the schemes at 31 March 2011. Scheme assets are stated at their market value at 31 March 2011.
The financial assumptions used to calculate scheme liabilities under FRS 17 for the UK defined benefit schemes are as follows:
2011 2010 2009
Discount rate 5.6% 5.7% 6.4% Price inflation per annum (RPI) 3.4% 3.4% 2.8% Price inflation per annum (CPI) 2.4% – – Increases to pensions in payment 2.8%-3.6% 2.8%-3.6% 2.5%-3.3% Increases to deferred pensions 2.4% 3.4% 2.8%
The market value of assets in the schemes at the Balance Sheet date, and the expected rates of return and the present value of the scheme liabilities at each balance sheet date are as follows:
At 31 March 2011 At 31 March 2010 At 31 March 2009
Expected
rate of return Market value
£m Expected
rate of return Market value
£m Expected
rate of return Market value
£m
Equities 7.85% 27.7 7.85% 17.4 7.85% 14.2 Bonds 4.1%-5.6% 26.9 4.4%-5.7% 35.9 3.6%-6.4% 30.2 Other 4.0% 0.4 4.0% 0.6 4.0% 0.6
Total market value of assets 55.0 53.9 45.0 Present value of scheme liabilities (69.6) (70.5) (68.4)
Net deficit in the schemes (14.6) (16.6) (23.4)
Deferred tax asset 3.8 4.6 6.5
Net pension deficit (10.8) (12.0) (16.9)
Overview
Business R
eviewG
overnanceFinancial Statem
ents
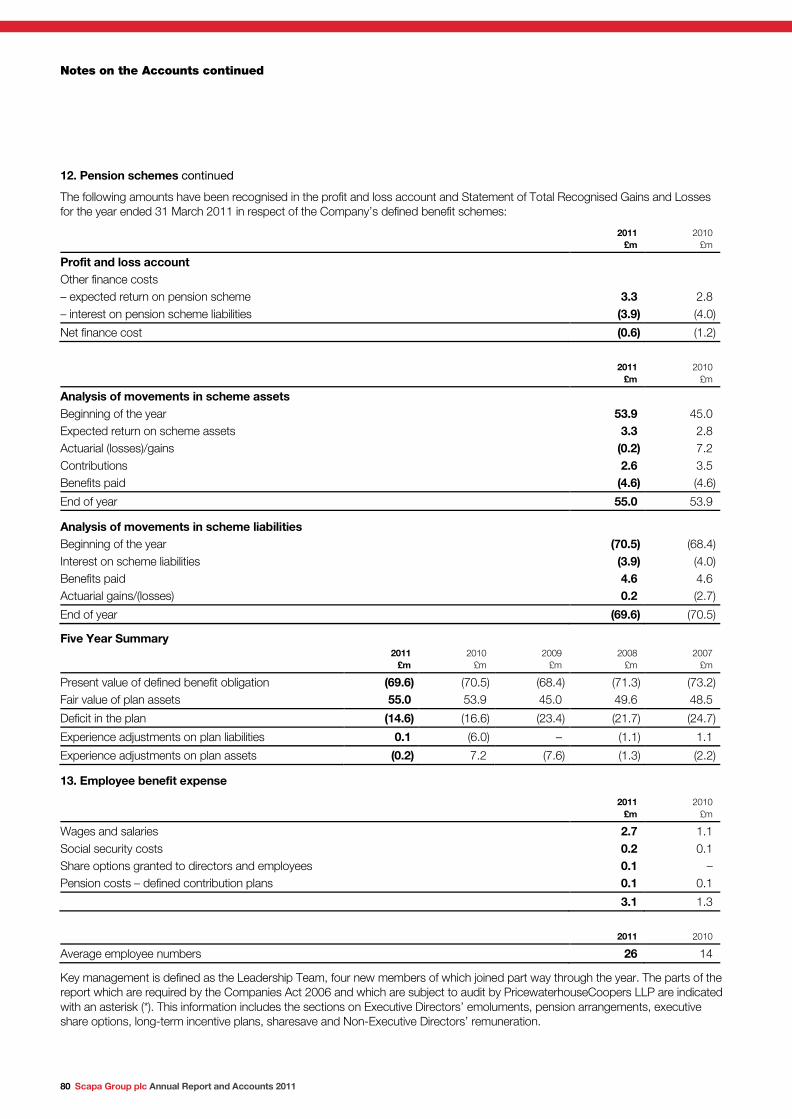
Notes on the Accounts continued
80 Scapa Group plc Annual Report and Accounts 2011
12. Pension schemes continued
The following amounts have been recognised in the profit and loss account and Statement of Total Recognised Gains and Losses for the year ended 31 March 2011 in respect of the Company’s defined benefit schemes:
2011
£m 2010
£m
Profit and loss account Other finance costs – expected return on pension scheme 3.3 2.8 – interest on pension scheme liabilities (3.9) (4.0)
Net finance cost (0.6) (1.2)
2011
£m 2010
£m
Analysis of movements in scheme assets Beginning of the year 53.9 45.0 Expected return on scheme assets 3.3 2.8 Actuarial (losses)/gains (0.2) 7.2 Contributions 2.6 3.5 Benefits paid (4.6) (4.6)
End of year 55.0 53.9
Analysis of movements in scheme liabilities Beginning of the year (70.5) (68.4) Interest on scheme liabilities (3.9) (4.0) Benefits paid 4.6 4.6 Actuarial gains/(losses) 0.2 (2.7)
End of year (69.6) (70.5)
Five Year Summary
2011
£m 2010
£m 2009
£m 2008
£m 2007
£m
Present value of defined benefit obligation (69.6) (70.5) (68.4) (71.3) (73.2) Fair value of plan assets 55.0 53.9 45.0 49.6 48.5
Deficit in the plan (14.6) (16.6) (23.4) (21.7) (24.7)
Experience adjustments on plan liabilities 0.1 (6.0) – (1.1) 1.1
Experience adjustments on plan assets (0.2) 7.2 (7.6) (1.3) (2.2)
13. Employee benefit expense
2011
£m 2010
£m
Wages and salaries 2.7 1.1 Social security costs 0.2 0.1 Share options granted to directors and employees 0.1 – Pension costs – defined contribution plans 0.1 0.1
3.1 1.3
2011 2010
Average employee numbers 26 14
Key management is defined as the Leadership Team, four new members of which joined part way through the year. The parts of the report which are required by the Companies Act 2006 and which are subject to audit by PricewaterhouseCoopers LLP are indicated with an asterisk (*). This information includes the sections on Executive Directors’ emoluments, pension arrangements, executive share options, long-term incentive plans, sharesave and Non-Executive Directors’ remuneration.

Scapa Group plc Annual Report and Accounts 2011 81
14. Dividend per share
No dividend is proposed for the year ending 31 March 2011 (2010: £Nil).
15. Principal subsidiaries
As at 31 March 2011 the principal subsidiaries of the Company were:
Holding and Management Companies Country of Incorporation
Porritts & Spencer Ltd* England Holding company Lindsay and Williams Ltd* England Holding company Scapa North America Inc USA Holding company Scapa Holdings (Georgia) Inc USA Holding company Scapa Holdings GmbH Germany Holding company Scapa Group Holdings GmbH Austria Holding company Scapa (HK) Holdings Ltd Hong Kong Holding company
Technical Tapes Companies
Scapa Tapes North America Ltd Canada Groupe Scapa France SAS France Scapa Deutschland GmbH Germany Scapa Italia SpA Italy Scapa Tapes Benelux BV Netherlands Scapa Ibérica, S.A. Spain Scapa (Schweiz) AG Switzerland Scapa UK Ltd England Scapa Tapes North America (Windsor) Inc USA Scapa Tapes North America (Carlstadt) Inc USA Scapa Tapes (Korea) Co. Ltd Korea Scapa Hong Kong Ltd Hong Kong Scapa Tapes Malaysia Sdn Bhd Malaysia Scapa (Shanghai) International Trading Company Ltd China
All the shareholdings are ordinary shares.
* Denotes the undertakings which are held directly by Scapa Group plc. All the subsidiaries listed are wholly owned and are incorporated in and operate from the countries named.
Designed by luminous.co.uk
Overview
Business R
eviewG
overnanceFinancial Statem
ents

www.scapa.com
Scapa Asia Scapa North America
T +852 2439 4330 T +1 860 688 8000
Scapa Europe
UK Switzerland Germany France Italy
T +44 (0) 161 301 7400 T +41 71 844 5680 T +49 (0) 621 470 91-0 T +33 (0) 475 44 80 00 T +39 0161 867 400
China, Hong KongChina, ShanghaiChina, SchenzhenIndia, ChennaiIndia, MumbaiKorea, AnyangKorea, ChungyangKorea, SeoulMalaysia, Shah Alam
Canada, RenfrewUSA, InglewoodUSA, SyracuseUSA, Windsor
Germany, MannheimFrance, ValenceItaly, GhislarengoSwitzerland, RorschachUnited Kingdom, ManchesterUnited Kingdom, Dunstable
Sca
pa
Euro
pe
Sca
pa
Nor
th A
mer
ica
Sca
pa
Asi
a