Embed Size (px)
Citation preview

Building Polynomials Lesson
Objective: • Understand the connections between linear and polynomial functions.
• Use linear parts to investigate the intercepts and end behavior of polynomials.
Materials:
Day 1 • Building Polynomial Functions Handout
• Graph paper • Scissors
• Cardstock (optional)
• Glue or tape • Colored pencils
Day 2
• Group Equation Sets
• Graph paper
• Scissors • Cardstock (optional)
• Glue or tape • Colored pencils
Day 3
• Polynomial Sort Graph Sets (one per group, cut ahead of time)
Day 1: Building Polynomial Functions (Quadratic) Lesson Plan:
1. Students work on questions 1-4 individually. 2. Class discussion of new equation form (x-intercept) and how it relates to the graph.
3. Assign groups for questions 5-12 so that each group picks a different linear equation. 4. For questions 13-14 use samples from groups to demonstrate directions and see connections as a class. Students draw vertical lines through each x-intercept and cut down
the line to separate graph into 3 sections. (see example) 5. Do questions 15-17 as a class looking at each cut section one at a time to discuss how the sign of the y-values of the two linear equations can help determine the sign of the quadratic
y-value. (see example) 7. Fill in the information in the chart for question 17 as a class and discuss examples from each group and how they all fit the pattern.
8. Have students glue graph on cardstock leaving a small space to define sections. 9. Students work on questions 18-20 individually. 10. Class discussion to summarize and share.
Formative Assessment: Have a group graph two linear equations and pass to another
group who has to sketch the quadratic. Tips:
Be clear about y-values vs. slope of a line when making connections from table 17.
Photo 1: Zoomed in to show the cuts and the important points in the graph. Photo 2: Student example after
completion.
Photo 3: Question 17
Day 2: Building Polynomial Functions (Cubic) Lesson Plan:
1. Assign one Group Equation Set to each group. 2. Students graph the three linear equations on building polynomial functions graph paper
using three different colors. (Each student needs to create their own copy) 3. Have students identify the x-intercepts, draw vertical lines through each x-intercepts and make a vertical cut. (Number the sections before the cut, see example)
4. Using the method from Day 1 table 17 sketch the cubic function by section based only on the linear pieces. Have students use a pencil so changes can be made if needed (see example) 5. Glue the strips back together on cardstock leaving a small space to help define sections.
6. Use student work to discuss end behavior related to the leading coefficient (positive or negative) and begin to identify how the degree (even or odd) relates to end behavior. It might be helpful to use examples of the quadratics from day 1 to show an even degree
function vs. an odd degree function.
Formative Assessment:
Same as day 1 but with cubics.
Photo 1: Finished cubic Photo 3: Finished cubic with
different end behavior
Photo 2: Zoomed in finished cubic

Day 3: Building Polynomial Functions (Higher Degree) Lesson Plan:
1. Students work in groups of 3-4 sorting polynomials by similar characteristics. (Do not tell them how to sort because the goal is to have them sort in different ways which will promote
wonderful discourse) 2. Each group presents sorting method to the class (carefully select the order of presentations based on their sorting techniques and the focus of your lesson).
Possible Groupings:
• End behavior (both end up, both end down, one of each, ect.)
• Number of x-intercepts • Degree of polynomial (Based on general form of equation)
• Number of curves • Number of linear sets used in factored form of the equation
• Single roots, at least one double root, at least one triple root, ect.
Tips:
Copy each group set on different colored paper so they can’t get mixed up. Presentation Order Suggestion:
If your focus is to discuss end behavior work your way up from the most basic to the most specific.
Students who sorted by…
#1 Degree of polynomial #2 Number of curves
#3 Number of x-intercepts #4 Root types (single, double, triple)
#5 End behavior Formative Assessment:
Have the teacher sort the polynomials in a way that the
class has not done yet and have the students guess what the teacher’s sorting method is.
Photo 1: An example of a group that sorted by end behavior. Discuss how the end behavior is related to the equation.
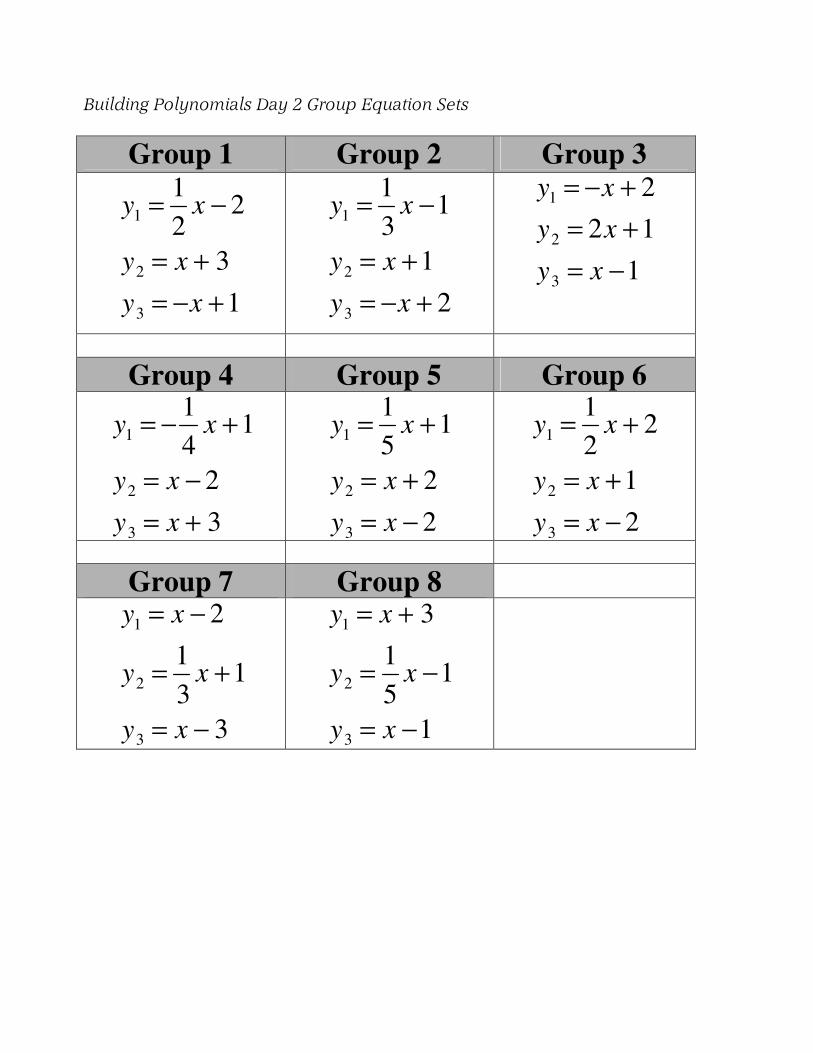
Building Polynomials Day 2 Group Equation Sets
Group 1 Group 2 Group 3
y1
=1
2x − 2
y2
= x + 3
y3
= −x +1
y1
=1
3x −1
y2
= x +1
y3
= −x + 2
y1
= −x + 2
y2
= 2x +1
y3
= x −1
Group 4 Group 5 Group 6
y1
= −1
4x +1
y2
= x − 2
y3
= x + 3
y1
=1
5x + 1
y2
= x + 2
y3
= x − 2
y1
=1
2x + 2
y2
= x +1
y3
= x − 2
Group 7 Group 8
y1
= x − 2
y2
=1
3x +1
y3
= x − 3
y1
= x + 3
y2
=1
5x −1
y3
= x −1

Building Polynomial Function Day 2 Graph
y
y
y
1
2
3
=
=
=
1 2 3 4 5 6 7 8 9 10 11 12 13 14 15–1–2–3–4–5–6–7–8–9–10–11–12–13–14–15 x
1
2
3
4
5
6
7
8
9
10
11
12
13
14
15
–1
–2
–3
–4
–5
–6
–7
–8
–9
–10
–11
–12
–13
–14
–15
y