Embed Size (px)
Citation preview
Ple
ase
note
that
this
is a
n au
thor
-pro
duce
d P
DF
of a
n ar
ticle
acc
epte
d fo
r pub
licat
ion
follo
win
g pe
er re
view
. The
def
initi
ve p
ublis
her-a
uthe
ntic
ated
ver
sion
is a
vaila
ble
on th
e pu
blis
her W
eb s
ite
1
Biosensors and Bioelectronics Vol. 22, Issue 3 , 15 September 2006, P. 440-448 http://dx.doi.org/10.1016/j.bios.2006.05.018 © 2006 Elsevier B.V. All rights reserved
Archimer, archive institutionnelle de l’Ifremerhttp://www.ifremer.fr/docelec/
Building of an immunosensor: How can the composition and structure of the thiol attachment layer affect the immunosensor efficiency?
Elisabeth Brianda, Michèle Salmainb, Jean-Marie Herryc, Hubert Perrotd,
Chantal Compèree and Claire-Marie Pradiera,* aLaboratoire de Réactivité de Surface, UMR CNRS 7609, Université Pierre et Marie Curie, 4 Place Jussieu, 75252 Paris Cedex 05, France bLaboratoire de Chimie et Biochimie des Complexes Moléculaires, UMR CNRS 7576, Ecole Nationale Supérieure de Chimie, 11 Rue Pierre et Marie Curie, 75231 Paris Cedex 05, France cUnité de Bioadhésion et d’Hygiène des Matériaux INRA 91300 Massy France dLaboratoire des Interfaces et Systèmes Electrochimiques, UPR 15, Case 133, 4 place Jussieu, 75252 Paris Cedex 05, France eDépartement Essais et Recherches Technologiques, Interface et Capteurs, IFREMER, Centre de Brest, BP 70, 29280 Plouzané, France *: Corresponding author : Tel.: +33 1 44 27 55 33; fax: +33 1 44 27 60 33. Email : [email protected]
Abstract
Immunosensors, based on the immobilization of a model rabbit antibody on mixed self-assembled monolayers and Protein A as a linking agent on gold transducers, were elaborated and characterized at each step by modulated polarization-infrared spectroscopy (PM-IRRAS) and occasionally by atomic force microscopy (AFM) and quartz crystal microbalance (QCM). By testing two different mixed SAMs comprising 11-mercaptoundecanoic acid (MUA), together with either decanethiol (C9CH3) or mercaptohexanol (C6OH), the role of the chemical composition and structure of the antibody attachment layer upon the sensor performance was demonstrated.
Keywords: Mixed SAM's; Immunosensor; Thiol attachment; IRRAS; QCM

1. Introduction
Many research fields involve the study of interaction of biomolecules with solid surfaces in
particular for new biosensor elaboration. A biosensor can be described as a sensitive interface
including a bioreceptor coupled with a transducer able to detect binding events between the
bioreceptor and the analyte. Biosensors provide a rapid and convenient alternative to
conventional analytical methods for detecting, and in some cases measuring, an analyte in a
complex medium. Different classes of biosensors are classically distinguished, among them
immunosensors that exploit the ability of an antibody to recognize its associated antigen in a
very complex medium1.
The quality of the biointerface governs both the sensitivity and the specificity of the
biosensor. Therefore, its design is the key step during the biosensor elaboration process.
Ideally, the bioreceptor should specifically recognize and bind target species at the lowest
possible concentration. It is well known that proteins, and antigens in particular, may loose
part of their biological activity when immobilized on a surface due to a combination of two
factors: change in conformation and/or unfavourable orientation of the molecule2. As a
consequence, controlling both the amount and orientation of the bioreceptor on the transducer
while preserving its bioactivity is the most critical issue in biosensor research.
Immobilization of bioreceptors (in particular antibodies) via self-assembled monolayers
(SAMs) or mixed SAMs enables to investigate biorecognition phenomena at a molecular level
and fulfils the criteria mentioned above. Let us remind that alkylthiols spontaneously
chemisorb on gold surfaces and form densely packed, crystalline-like thiolate films in a very
reproducible manner3-7. When dealing with ω-functionalized thiols, various chemical moieties
can thus be strongly bound at the solid-liquid interface, and materials with new surface
properties can be designed for the binding of biomolecules8-10. In some cases, the use of
mixed SAMs, formed for instance by co-adsorption of mixtures of two thiols, has been shown
to prevent denaturation and thus improve the bioactivity of a protein immobilized on such
layers in comparison with the protein immobilized on a pure SAM11-14. Mixed SAMs are
generally constituted of one thiolate with a functional headgroup (like a carboxylic acid) at a
low mole fraction and of another “diluting” thiolate at a high mole fraction. The second thiol
first reduces the surface concentration of functional groups and thus minimizes steric
hindrance, partial denaturation of the protein13 and non specific interactions that can produce
2
interference signals11,12. Second, the diluting thiolate can also be used to tailor the overall
physico-chemical properties of the interface (such as its hydrophobic / hydrophilic character).
Characterization of surfaces covered with mixed SAMs is still the subject of numerous studies 15-18.
In this study, we report the construction of an immunosensor, taking the rabbit IgG / anti-
rabbit IgG couple as a model system. The biointerface consisted of a layer of antibody
immobilized by bioaffinity onto Protein A, often used as a linker agent for biosensor
elaboration19-21; Protein A was covalently linked to two mixed SAM systems where 11-
mercaptoundecanoic acid is the “active” thiol. We have found that the nature of the diluting
thiolate had a noticeable influence not only on the overall amount of immobilized Protein A
and but also on its affinity towards rabbit IgG and finally on the properties on the resulting
immunosensor.
2. Materials and methods
2.1. Chemicals
n-Decanethiol (C9CH3), 6-mercaptohexanol (C6OH), 11-mercaptoundecanoic acid (MUA),
N-hydroxysuccinimide (NHS), 1-(3-dimethylaminopropyl)-N'-ethylcarbodiimide hydro-
chloride (EDC) were purchased from Aldrich (St-Quentin Fallavier, France). Rabbit IgG, goat
anti-rabbit IgG, goat anti-mouse IgG and bovine serum albumin (BSA) were purchased from
Pierce (Perbio, Brebières, France). All solvents were reagent-grade. Reagents were used
without any further purification. Experiments were carried out at room temperature.
2.2 Formation of the mixed SAMs
Glass substrates (11x11 mm) coated successively with 50 nm thick layer of chromium and a
200 nm thick layer of gold were purchased from Arrandee (Werther, Germany). The gold-
coated substrates were annealed in a butane flame to ensure a good crystallinity of the
topmost layers, as recommended by the company, and rinsed in a bath of absolute ethanol
during 15 min before adsorption. The substrates were immersed in binary mixtures of 2.5 mM
of MUA and 7.5 mM of C9CH3 or 7.5 mM of C6OH in absolute ethanol for 3 h and thorough
rinsed in ethanol and dried under a flow of clean air.
3

2.3. Covalent immobilization of Protein A
The substrates were treated with a solution of NHS (20 mM) and EDC (10 mM) in ultrapure
water for 2 h following by an immersion in a solution of Protein A (50 mg/L) in 10 mM PBS
pH 7.4 for 2 h. The residual NHS esters were blocked with 1 M ethanolamine pH 9.0 for 20
min. After washing with ultrapure water, the substrates were finally immersed in a 1% (w/v)
solution of BSA in 10 mM PBS pH 7.4 for 2 h.
2.4. Binding of antibody
Protein A-coated substrates were immersed in a solution of rabbit IgG (100 mg/L) in PBS for
1 h, washed with water and dried under a flow of clean air
2.5. Tests of specificity
Goat anti-mouse IgG or goat IgG (non specific antigen) (10 mg/L or 30 mg/L in PBS
respectively; 150 µL) was spotted on the immunosensor and incubated for 1 h. After
extensive washing with water and PM-IRRAS analysis, goat anti-rabbit IgG (specific antigen)
(10 or 30 mg/L in PBS; 150 µL) was spotted on the immunosensor and incubated for 1 h.
2.6. PM-IRRAS measurements
The FTIR instrument used in our experiment is a commercial NICOLET Nexus spectrometer.
The external beam was focused on the sample with a mirror, at an optimal incident angle of
75°. A ZnSe grid polarizer and a ZnSe photoelastic modulator, modulating the incident beam
between p and s polarizations (HINDS Instruments, PEM 90, modulation frequency = 37
kHz), were placed prior to the sample. The light reflected at the sample was then focussed on
a nitrogen-cooled MCT detector. The sum and difference interferograms were processed and
Fourier-transformed to yield the differential reflectivity ΔR/R=(Rp-Rs)/(Rp+Rs) which is the
PM-IRRAS signal. 64 scans were recorded at 8 cm-1 resolution for each spectrum.
2.7. AFM imaging
The AFM was a PicoLE by Molecular Imaging (Scientec, Palaiseau, France) used in an
acoustic mode in air at 22°C. Images of 500x500 nm were obtained at 0.75 Hz with a
resolution 512*512 pixels, with the following characteristics:
4

Probe Characteristics Ultrasharp NSC15/noAI. Radius of curvature less than 10 nm. Tip
height: 15…20 µm. Full tip cone angle less than 30°. Cantilever length: L ± 5 µm: 230.
Cantilever width w ± 3µm: 35. Cantilever thickness, 4.0 µm. Resonance frequency, 325 kHz
Force constant 40 N/m.
2.8. QCM measurements
AT-cut planar quartz crystals (14 mm diameter) with a 9 MHz nominal resonance frequency
(Matel Fondhal France) were used. Two identical gold electrodes, 2000 Å thick and 5 mm in
diameter, were deposited by evaporation techniques on both sides of crystals with a chromium
underlayer. The resonators were connected with a silver conducting paste, through wires, to a
BNC adaptator. A home-made oscillator was designed to drive the crystal at 27 MHz which
corresponds to the third overtone of the quartz resonator. To improve the stability, all the
electronic oscillator components were temperature-controlled by a Watlow heater current
monitor with a stability better than 0.1 K. An experimental cell was developed: the crystal
was mounted between two O-ring seals inserted in a Perspex cell. Only one face of the quartz
was in contact with the solutions. The cell volume was 50 μL. The apparatus included a P1
micropump (Pharmacia) to ensure a 60 μL/min constant flowrate of the solutions. The
experiments were performed at 25°C, the room temperature. The experimental QCM setup
consisted of the 27 MHz QCM and a frequency counter PM 6685.
3. Results and Discussion
The successive steps of biointerface assembling are depicted in Fig. 1. Step 1 is the co-
adsorption of two thiols, MUA and C9CH3 or MUA and C6OH, at a constant 1 to 3
proportion, to form two different mixed SAMs; step 2 is the binding of Protein A by covalent
linkage to the carboxylic acid function of MUA thiolate after activation by NHS and EDC;
step 3 is the blocking of protein non-specific binding sites by BSA; step 4 is the
immobilization of rabbit IgG antibody by bioaffinity. The two mixed SAM systems were
systematically compared at each step.
The gold surfaces were characterized by PM-IRRAS providing chemical and structural
information about thin organic films deposited on gold surfaces. Moreover AFM was used for
gaining additional structural information on the mixed SAMs and the Protein A layers. QCM,
5

performed in the flow-through mode, gave useful quantitative data on the amount of bound
proteins.
Results will be presented and discussed step by step.
3.1. Surface characterization of mixed SAMs
Fig. 2a displays the PM-IRRAS spectrum of the gold surface after immersion in a mixture of
MUA and C9CH3, rinsing in ethanol and drying under N2 flow. Four typical bands appeared
in the ν(C-H) region, at 2855, 2923 and 2877, 2962 cm-1, corresponding to the symmetric and
asymmetric stretching vibrations of the chain CH2 and terminal CH3 respectively. The
position of the CH2 asymmetric stretching vibration band at 2923 cm-1 is typical of a densely
packed, quasi-crystalline arrangement of the alkyl chains thiolates22. Vibration bands in the
lower wavenumber range were also observed at 1400 and 1700 cm-1, showing the presence of
acidic groups, mainly in the deprotonated form. These findings provide good evidence that
adsorption of the mixed SAM of MUA and decanethiol did occur.
Fig. 2b displays the same IR region of the surface spectrum after immersion in the mixture of
MUA and C6OH, rinsing in ethanol and drying under N2 flow. This time, as expected, only
the bands characteristic of the CH2 groups were observed 2853 and 2929 cm-1. The wave-
number of the symmetric and asymmetric ν(C-H), slightly higher than for the MUA/C9CH3
mixed SAM, indicates a more disordered layer. This may be related to the difference of alkyl
chain lengths between MUA and C6OH that does not favour self-assembly of these thiolates
and induces disorder within the thin film. Note that the pure C9CH3 and C6OH SAM layers
were also prepared and analysed, and the position of the two ν(C-H) bands of the CH2 groups
was 2853/2924 and 2857/2931 cm-1 respectively (spectra not shown).
Here again, bands at ca 1400, 1600 and 1700 cm-1, attributed to the symmetric, asymmetric
COO- and C=O stretch vibrations, prove the presence of adsorbed MUA for which the
carboxyl group is both in the protonated and deprotonated forms. Although the comparison of
the intensity of the carboxylic acid vibration bands for the two mixed SAMs is difficult as the
IR measurements were done at two different periods of time, co-adsorption of MUA with
C6OH always led to a slightly higher amount of acidic thiolates than co-adsorption with
C9CH3. Note also that, for similar surface concentrations in MUA, changes in the orientation
6

of the C=O and COO- groups, for instance due to interactions with adjacent groups, may also
account for variations in the stretching vibration intensities23.
The thiol-modified surfaces were then submitted to AFM. We first checked the presence of
large planar areas on clean gold surfaces (data not shown) that allowed us to study the surface
functionalization by formation of SAMs followed by the binding of protein A. The scan size
for the images is then 500 x 500 nm. Figure 3a & b show the topographic and phase images
(figure inset) of the gold surfaces after co-adsorption of mixtures of MUA and C9CH3 or
MUA and C6OH, respectively. While Fig. 3a suggests that the MUA/C9CH3 SAM was rather
homogeneous both from structural and chemical aspects, Fig. 3b indicated the existence of
defects dispersed all over the surface for the mixed MUA/C6OH SAM. Some topographic
cross-sections were made on the two surfaces. They clearly showed a difference in
homogeneity between the two mixed SAMs. On the SAM containing C6OH, the white spots
were about 1 nm high, with some higher defaults. On the SAM containing C9CH3, the
various phase domains are separated by about 5 Å. Thus, no phase segregation apparently
occurred when MUA was adsorbed together with the long chain thiol decanethiol, probably
because of strong hydrophobic and/or Van der Waals interactions expected to favour good
orientation and ordering of the chains on the surface24, whereas it is tempting to interpret the
second set of images as a regular distribution of MUA domains (white spots) dispersed within
the C6OH layer. The spot size is 20 to 40 nm suggests some phase segregation between MUA
and C6OH. Previously reported AFM data on mixed SAMs, showed more heterogeneous
layers, with phase segregation, when the chain lengths of adsorbed thiols differ by more than
3-4 carbons 16,25.
Chemical and structural differences for these two mixed layers are expected to induce changes
in their reactivities and this will be studied in the following.
3.2. Adsorption of Protein A on the mixed SAMs
The SAM-coated gold transducers were first treated with a mixture of NHS and EDC in water
to yield intermediately surface N-hydroxysuccinimide ester functions. The transducers were
then immediately exposed to a buffered solution of Protein A under two different conditions,
50 mg/L, 2 h and 0.5 mg/L, 15 min respectively. The first set of conditions ensured the
saturation of the surface by Protein A, before the further antibody binding step; the second
7

value was chosen so as to yield a submonolayer of protein and get exploitable AFM images.
After copious washing, the gold surfaces were analysed by PM-IRRAS. Protein A is expected
to be immobilized in a covalent manner on the activated MUA acid terminal groups. Fig. 4
shows the PM-IRRAS spectra of the unsaturated PrA layers on the MUA/C9CH3 and
MUA/C6OH SAM layers. Binding of Protein A was assessed by the presence of intense
bands at 1550 and 1660 cm-1 assigned to the Amide II and I bands, respectively. Whatever the
Protein A adsorption conditions, almost twice as much Protein A was adsorbed on the
MUA/C9CH3 SAM compared to the other one as evaluated from the integrated area A of the
peptide bands. Moreover, a sharp band was observed at 1743 cm-1 and was readily attributed
to the C=O stretch of remaining N-hydroxysuccinimide ester functions. Treatment in
ethanolamine solutions induced a disappearance of the residual ester bands and an additional
increase of the amide ones (spectra not shown).
Topographic and phase AFM images of the Protein A layers are shown in Fig. 5A & B; they
both show that the nature of the imaged object has changed compared to the images of Fig. 4.
One observes marked differences between Fig. 5 A and B: the layer of Protein A on the mixed
MUA/C9CH3 SAM was apparently more homogeneous and dense than on the other SAM.
Very small defects, 10 nm wide, 1 nm high, – a topographic cross section is shown in inset,
appeared within the layer and there were no large aggregates as if the protein was regularly
dispersed all over the SAM. Conversely, the second set of images revealed strong
heterogeneities, aggregates of 30 to almost 100 nm wide in addition to rather large “empty”
areas when Protein A was bound to the MUA/C6OH layer. A topographic cross-section
shows a detail of some of these spots. A simple calculation, taking into account the respective
sizes of the cantilever and Protein A, leads to an apparent size for the protein equal to ca. 30
nm. This suggests that, on the mixed MUA/C6OH system, Protein A was immobilized in
single items or small clusters. The height of the white spots is less than 1 nm, i.e. below the
size of Protein A (ca. 3 nm 26). Nevertheless, the images have been obtained in air-acoustic
mode, and the force applied to the molecules may induce a deformation of the protein. The
smaller coverage in Protein A on the mixed MUA/C6OH system (from PM-IRRAS data) and
the more heterogeneous character of the layer might be explained by (1) disorder in the SAM
layer and poor dispersion of the adsorbed MUA thiolates, yielding a low number of useful
anchoring points for Protein A, and/or (2) additional physisorption of Protein A on the mixed
SAM of MUA and C9CH3 by hydrophobic interaction the methyl-terminated thiolate. This
8

assumption is reinforced by the common knowledge that hydrophilic OH-terminated SAMs
are less prone to protein physisorption than methyl-terminated SAMs 27-29.
3.3. Binding of BSA
This step aims at blocking fractions of the surface that are not covered with Protein A and
where the antibody might bind in an uncontrolled way. Knowing that the antibody will not
bind to a BSA layer and that BSA does not associate with Protein A26, this step is expected to
ensure antibody immobilization strictly to Protein A. The transducers were treated with a
solution of BSA and analysed by PM-IRRAS.
Depending on the nature of the underlying SAM layer, different results were obtained (see
Fig. 6A & B, spectra b). For the mixed MUA/C9CH3 underlayer, no increase of the amide
bands was observed. As we have just seen that a large amount of Protein A was bound to the
surface in this case, a straightforward explanation may be that there was no space left
accessible for BSA to bind, although exchange of Protein A by BSA at the liquid/solid
interface cannot be completely ruled out, as proteins cannot be distinguished from one another
by IR spectroscopy. Conversely, for the mixed MUA/C6OH underlayer, a significant increase
of the amide band integrated area was observed (A = 10.8 ∆A = 2.5, calculated from the peak
area after ethanolamine treatment) indicating that an appreciable amount of BSA, similar to
that of Protein A, could still bind to the surface. Since, on this surface, the total amount of
bound Protein A was much lower, there should be available space for binding of BSA.
However it still raises the question why Protein A yielded a full monolayer on the mixed
SAM of MUA and C9CH3 and not on the mixed SAM of MUA and C6OH. A reasonable
assumption would be to consider two competitive binding mechanisms of Protein A on the
surface. The first mechanism implies chemisorption through covalent linkage with the
carboxyl end groups of MUA thiolate. The second mechanism implies non-specific
adsorption by other types of interaction. This second mechanism may occur only for the
mixed MUA/C9CH3 SAM because of favourable interactions with the terminal CH3 groups
of the diluting thiolate. Conversely, the use of C6OH as diluting thiolate may somehow
protect the surface against non-specific physisorption of Protein A. It appears however that it
does not protect the surface against physisorption of BSA again in apparent contradiction with
the general low affinity of proteins for hydroxyl-terminated SAMs28,29. Silin et al. also
9

established that BSA poorly binds to an OH-terminated SAM (16-mercaptohexadecanol)30.
However, their experiments were carried out with long-chain SAMs that are known to be
well-ordered with their OH-terminal groups at the liquid / solid interface. When it comes to
shorter thiols (number of carbons < 10), SAMs are generally less well ordered, indeed
supported by our own IR surface data. Therefore, this disorder may enable interactions
between BSA molecules and the methylene groups of the C6OH chains. Note eventually that
other authors showed that some proteins having polar side-end groups may interact with OH-
terminated SAMs29; the difference of behaviour between Protein A and BSA in that respect
should be related to their surface chemical composition, keeping in mind that multiple modes
of interaction are generally involved as regards protein binding to solid surfaces31. Another
point worth being considered to explain the lower amount of bound Protein A on the
MUA/C6OH SAM is the aggregation of MUA chains on that surface that induces steric
constraints and reduces accessibility to the MUA terminal functions.
To summarize, it is now clearly established that either Protein A binds to the mixed
MUA/C9CH3 and MUA/C6OH SAMs by different mechanisms or that a fraction, ca. 50%, of
the MUA terminal functions are not accessible when aggregated. The question is now whether
this has consequences upon antibody binding and the properties of the resulting
immunosensor.
3.4. Binding of rabbit IgG binding to PrA
The formation of the antibody layer was accomplished by treatment of the Protein A-coated
transducers with a solution of rabbit IgG in PBS (100 mg/L, 1 h). PM-IRRAS spectra of the
gold surfaces are shown in Fig. 6A & B, spectra c, for the mixed SAM of MUA/C9CH3 and
MUA/C6OH, respectively. The surface IR spectra recorded after exposure to Protein A and
BSA are superimposed for comparison. A very large increase of the amide band integrated
areas was observed in both cases, i.e. ∆A = 22.2 and 19.5 a.u., for the mixed MUA/C9CH3
and MUA/C6OH SAMs, respectively, indicating that the amount of antibody was a little
smaller on the latter one. When comparing with the amide bands area measured after binding
of Protein A on both surfaces, the increase was about two-fold for the MUA/C9CH3 SAM
and three-fold for the MUA/C6OH SAM. Considering the relative sizes of Protein A (MW =
36 kDa) and rabbit IgG (MW = 150 kDa), the binding capacity of Protein A immobilized on
the mixed SAM of MUA/C6OH was of ca. 0.75 rabbit IgG per Protein A, which is
10
reasonable. The binding capacity of Protein A immobilized on the mixed MUA/C9CH3 SAM
was only around 0.5 rabbit IgG per Protein A. These features seem to indicate that binding of
rabbit IgG to Protein A is more efficient on the MUA/C6OH underlayer, and two possible
reasons can be suggested:
- Either the fraction of physically bound Protein A, present only on the MUA/C9CH3
layer, is not as efficient for IgG binding as the chemically bound Protein A, or
- There is a true steric hindrance on the layer that limits the binding capacities of the
immobilized Protein A when it forms a dense layer on the MUA/C9CH3 SAM.
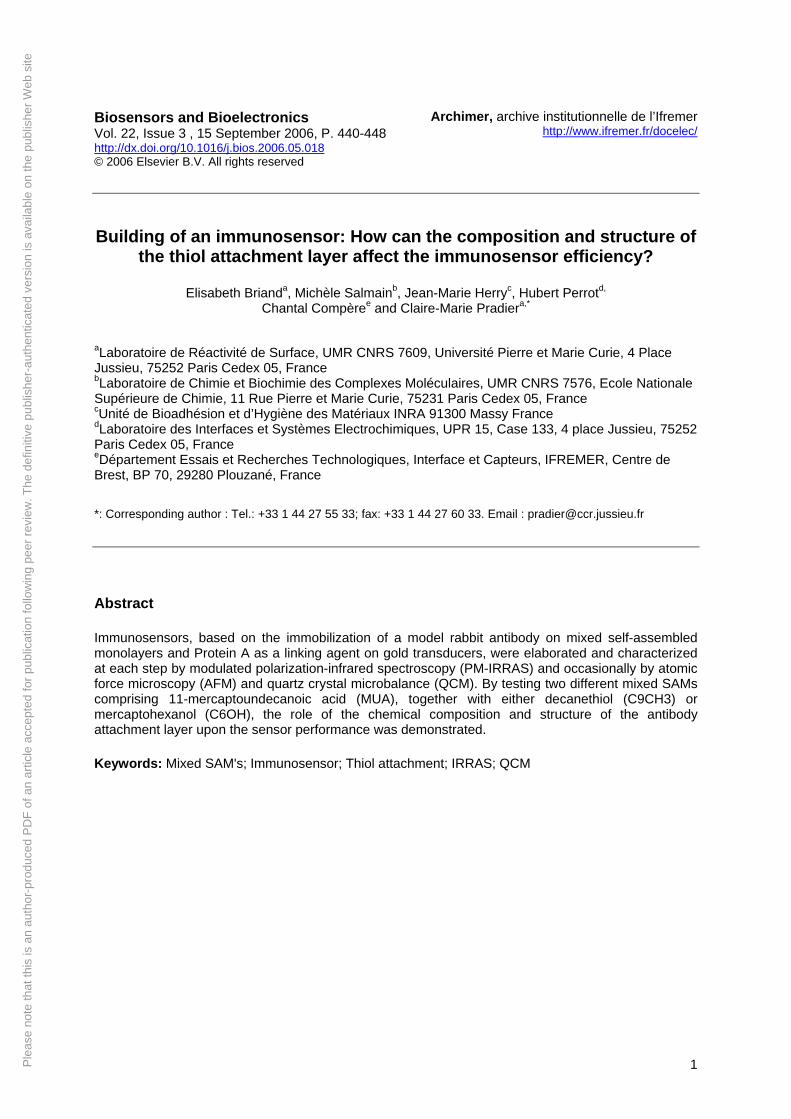
QCM in situ flow-through measurements, presented in Fig. 7A & B, confirmed the rapid
binding of rabbit IgG to the layer of Protein A and showed this time that a slightly higher
amount of rabbit IgG was bound for the mixed MUA/C6OH SAM (∆F = 484 Hz vs 440 Hz
for the mixed MUA/C9CH3 SAM). This slight discrepancy between IR and QCM results may
be due to the very different procedures used for the two experiments, IRRAS analysis being
performed ex situ and QCM analysis being performed in situ using a flow-through set up, i.e.
obviously different mass transport conditions.
Having shown that the amount of bound rabbit IgG was not directly related to the amount of
Protein A, one may wonder whether working with an even more dilute layer of anchoring
thiol and/or binding protein would still enable the binding of a similar amount of antibody.
We then repeated this series of surface functionalisation steps starting from a mixture of
MUA and C6OH, with a mole fraction of MUA χ equal to 0.1 and compared the results with
those obtained for the MUA/C6OH SAM (χ = 0.25). From our previous work, we assume that
the surface mole fraction of MUA is close to that in solution23. Binding of Protein A, BSA,
and eventually antibody, on these two SAMs were estimated from QCM flow-through
measurements. Frequency changes are summarized in Table 1.
One sees first that, when the MUA mole fraction was decreased from 0.25 to 0.1, the amount
of Protein A bound to the surface was reduced by one third. Second, a higher amount of BSA
adsorbed for the mixed SAM with χ = 0.1, confirming that the OH-terminated SAM did
prevent adsorption of Protein A but not of BSA; eventually, in spite of these changes in the
protein layers, the amount of bound antibody was very similar on both surfaces (and probably
corresponded to a full monolayer of antibody); this suggests that, on the mixed SAM with χ =
11

0.25, only a fraction of the Protein A binding sites was occupied by IgG. Here again, the layer
containing the lowest amount of Protein A was the most efficient in terms of IgG binding
capacity (1.5 rabbit IgG per protein A for the mixed SAM χ = 0.1 versus 1 rabbit IgG per
protein A for the other one). Very similarly, Jenkins et al. demonstrated the importance of
steric factors in the immobilization of large proteins like antibodies; they built immunosensors
by immobilizing biotinylated antibodies on mixed SAMs, and came to the conclusion that the
sensitivity of the optimum sensor surface may not correspond to the highest density of
immobilized antibody32.
Type of SAM + PrA + BSA + rabbit IgG
MUA/C6OH, χ = 0.1 100 162 445
MUA/C6OH, χ = 0.25 150 36 442
Table 1: QCM frequency changes (Hz) after successive binding steps
The following steps were only investigated for the SAM of MUA/C6OH, χ = 0.25.
3.5. Antigen recognition
The final key step consisted in testing the recognition of non-specific or specific antigens on
the two model immunosensors built from the mixed SAM of MUA/C9CH3 and MUA/C6OH.
PM-IRRAS was again used to probe their respective behaviour (Fig. 8A & B). After exposure
to the non-specific antigen (anti-mouse IgG 30 mg/L, t = 1h), a decrease of the amide bands
intensity was noticed for both immunosensors, probably owing to the desorption of loosely
bound antibody. This desorption was larger for the mixed SAM of MUA and C9CH3,
suggesting that some antibody molecules were only weakly bound to Protein A, maybe
because the latter were partially denatured or only physisorbed to the SAM layer. Subsequent
treatment with specific antigen (anti-rabbit IgG 20 mg/L, t = 1h) led to a large increase of the
amide bands intensity, as a result of its specific recognition by the immobilized antibody.
Interesting is to consider the antibody binding capacity for the antigen calculated from the
amide band integrated area increase (no correction for sizes difference is necessary as antigen
and antibody have the same MW). The antibody binding capacity was equal to 1.4 antigen per
antibody for the mixed SAM of MUA and C6OH and 1.1 for the other mixed SAM.
12

4. Conclusion and outlook
This systematic comparison of the biosensor surfaces all through the successive steps for
antibody grafting and eventually antigen recognition leads to the following conclusions:
- Using a diluent thiol in combination with an “active” thiol of similar chain lengths
leads to a well ordered mixed SAM with no significant phase segregation. Conversely,
the mixed SAM composed on thiols of very different lengths is rather disordered with
noticeable phase segregation.
- This difference of film structure has a dramatic consequence on the amount of
immobilized Protein A and on the structure of the protein layer, as a saturated Protein
A layer is reached on the mixed SAM of MUA and C9CH3 but not on the mixed SAM
of MUA and C6OH where Protein A molecules form a less dense layer. This in turn
has a marked influence on the binding capacity of Protein A for the antibody but has
no influence on the overall amount of immobilized antibody. Eventually, the binding
capacity of the antibody for the antigen is better for the mixed SAM of MUA and
C6OH even if the overall amount of antibody is still the same.
We may thus expect that real-world immunosensors built according to these two strategies
would have different properties in terms of sensitivity and dynamic range.
Acknowledgement The CNRS and IFREMER are thanked for financing EB PhD grant. References
(1) Wink, T.; van Zuilen, S. J.; Bult, A.; van Bennkom, W. P. Analyst 1997, 122, 43R.
(2) Norde, W. Adv. in Colloid and Interface Sci. 1986, 25, 267.
(3) Bain, C. D.; Troughton, E. B.; Tao, Y.-T.; Evall, J.; Whitesides, G. M.; Nuzzo, R. G.
J. Am. Chem. Soc. 1989, 111, 321.
(4) Nuzzo, R. G.; Dubois, L. H.; Allara, D. L. J. Am. Chem. Soc. 1990, 112, 558.
(5) Porter, A. J.; Bright, T. B.; Allara, D. L.; Chidsey, C. E. D. J. Am. Chem. Soc. 1987,
109, 3559.
(6) Truong, K. D.; Rowntree, P. A. J. Phys. Chem. 1996, 100, 19917.
(7) Whitesides, G. M.; Laibinis, P. E. Langmuir 1990, 6, 87.
(8) Lahiri, J.; Isaacs, L.; Whitesides, G. M. Anal. Chem. 1999, 71, 777.
13

(9) Su, X.-L.; Li, Y. Biosensors and Bioelectronics 2004, 19, 563.
(10) Ulman, A. Chem. Rev. 1996, 96, 1533.
(11) Frederix, F.; Bonroy, K.; Laureyn, W.; Reekmans, G.; Campitelli, A.; Dehean, W.;
Maes, G. Langmuir 2003, 19, 4351.
(12) Ge, B.; Lisdat, F. Anal. Chim. Acta 2002, 454, 53.
(13) Guiomar, A. J.; Guthrie, J. T.; Evans, S. D. Langmuir 1999, 15, 1198.
(14) Wirde, M.; Gelius, U.; Nyholm, L. Langmuir 1999, 15, 6370.
(15) Chen, S.; Li, L.; Boozer, C. L.; Jiang, S. Langmuir 2000, 16, 9287.
(16) Chen, S.; Li, L.; Boozer, C. L.; Jiang, S. J. Phys. Chem. B 2001, 105, 2975.
(17) Hobara D., S. T., Imabayashi S.-i., Kakiuchi T. Langmuir 1999, 15, 5073.
(18) Li L., C. S., Jiang S. Langmuir 2003, 19, 666.
(19) Babacan S., P. P., Letcher S., Rand A.G. Biosensors and Bioelectronics 2000, 15, 615.
(20) Oh B.-K., K. Y.-K., Lee W., Bae Y. M., Lee W. H., Choi J.-W. Biosensors and
Bioelectronics 2003, 18, 605.
(21) Pribyl, J.; Hepel, M.; Halamek, J.; Skladal, P. Sensors and Actuators B: Chemical
2003, 91, 333.
(22) Nuzzo, R. G.; Dubois, L. H.; Allara, D. L. J. Am. Chem. Soc. 1990, 112, 558.
(23) Briand, E.; Salmain, M.; Compère, C.; Pradier, C. M. to be published, 2006.
(24) Clegg, R. S.; Hutchison, J. E. J. Am. Chem. Soc., 1999, 121, 5319.
(25) Kakiuchi, T.; Iida, M.; Gon, N.; Hobara, D.; Imabayashi, S. I.; Niki, K. Langmuir
2001, 17, 1599.
(26) Marxer, C. G.; Coen, M. C.; Schlapbach, L. J. Colloid and Interf. Sci. 2003, 261, 291.
(27) Malmsten, M. J. Colloid Inter.e Sci. 1994, 166, 333.
(28) Martins, M. C. L.; Ratner, B. D.; Barbosa, M. A. J. Biomed.Mater. Res. 2003, 67, 158.
(29) Sigal, G. B.; Mrksich, M.; Whitesides, G. M., J. Am. Chem. Soc., 1998, 120, 3464.
(30) Silin, V.; Weetall, H.; Vanderah, D. J. J. Colloid and Interf. Sci.,. 1997, 185, 94.
(31) Tengvall, P.; Lundström, I.; Lieberg, B. Biomaterials 1998, 19, 407.
(32) Vareiro, M. L. M.; Liu, J.; Knoll, W.; Zak, K.; Williams, D.; Jenkins, A. T. A. Anal. Chem. 2005,
77, 2426.
14

Figure 1: Schematic representation of the successive steps towards the immobilization of antibody
Figure 2: FT-IRRAS spectra of the gold surfaces after immersion in mixtures of (a) MUA and C9CH3; (b) MUA and C6OH. Samples were rinsed in ethanol and dried before analysis.
3000 28000.99
1.00
1.01
1.02
1.03
1.04
1.05
1.06
1.07
2857
2931
28782964 2853
2924
(b)
(a)
PM
-IRR
AS
(a.u
.)
Wavenumbers (cm-1)
3000 28000.99
1.00
1.01
1.02
1.03
1.04
1.05
1.06
1.07
2857
2931
28782964 2853
2924
(b)
(a)
PM-IR
RA
S (a
.u.)
Wavenumbers (cm-1)

Figure 3: Topographic and phase images (insets) of the gold surfaces after immersion in mixtures of (A) MUA and C9CH3; (B) MUA and C6OH. Samples were rinsed in ethanol and dried before analysis. Corresponding topographic cross-sections are presented below each image.
A
B
Figure 4: FT-IRRAS spectra (amide band region) of the gold surfaces after exposure to Protein A (0.5 mg/L in PBS, 15 min) of the mixed SAM of (a) MUA and C9H3; (b) MUA and C6OH. Samples were rinsed in pure water and dried before analysis.
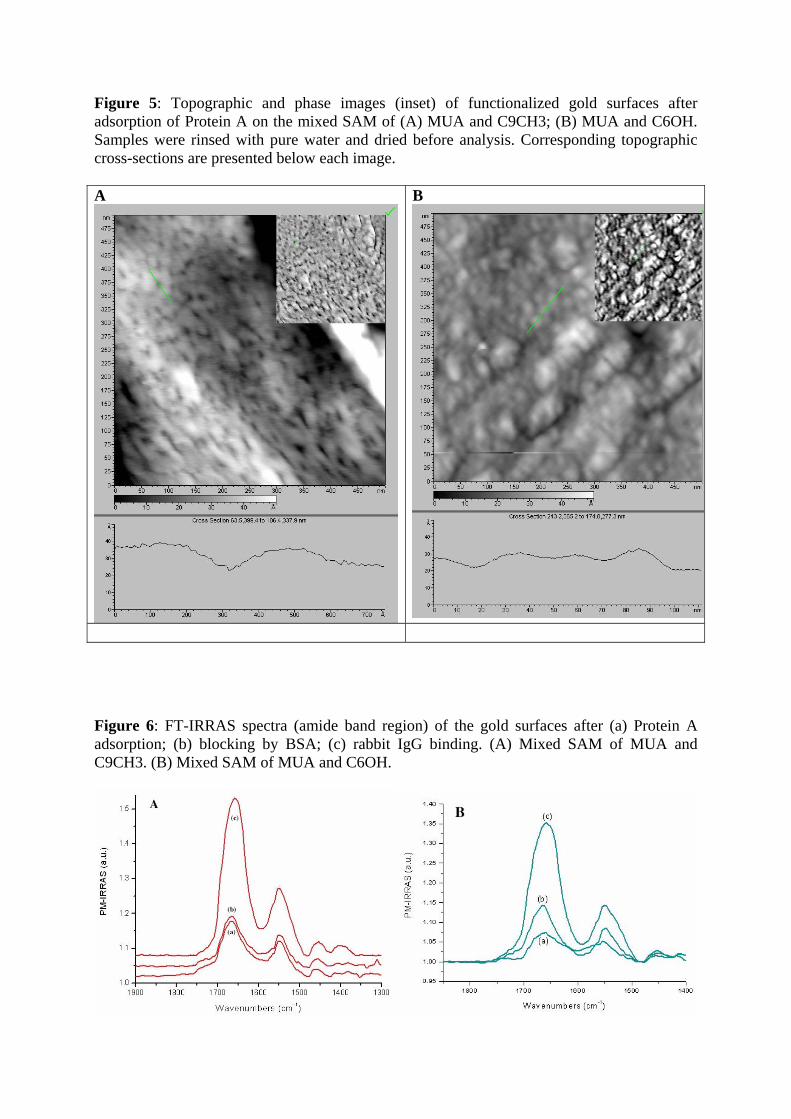
Figure 5: Topographic and phase images (inset) of functionalized gold surfaces after adsorption of Protein A on the mixed SAM of (A) MUA and C9CH3; (B) MUA and C6OH. Samples were rinsed with pure water and dried before analysis. Corresponding topographic cross-sections are presented below each image. A B
Figure 6: FT-IRRAS spectra (amide band region) of the gold surfaces after (a) Protein A adsorption; (b) blocking by BSA; (c) rabbit IgG binding. (A) Mixed SAM of MUA and C9CH3. (B) Mixed SAM of MUA and C6OH.
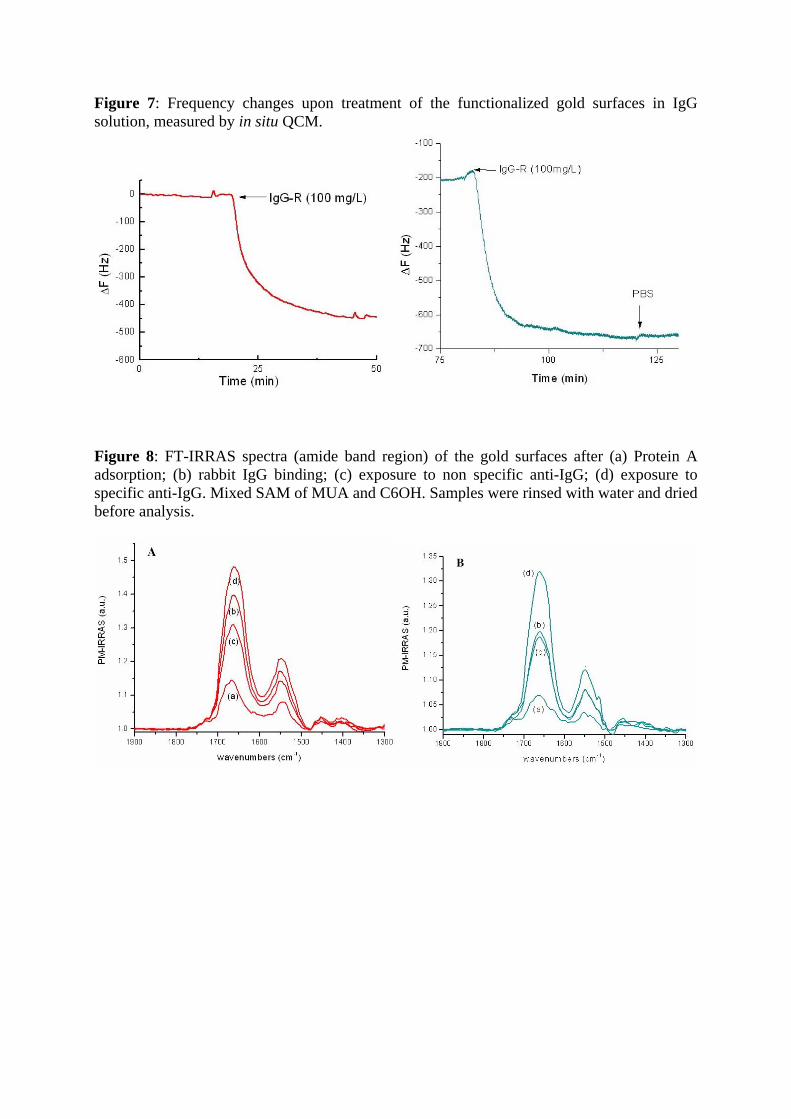
Figure 7: Frequency changes upon treatment of the functionalized gold surfaces in IgG solution, measured by in situ QCM.
Figure 8: FT-IRRAS spectra (amide band region) of the gold surfaces after (a) Protein A adsorption; (b) rabbit IgG binding; (c) exposure to non specific anti-IgG; (d) exposure to specific anti-IgG. Mixed SAM of MUA and C6OH. Samples were rinsed with water and dried before analysis.