Embed Size (px)
Citation preview

Building momentum for change
AA plc Annual Report and Accounts 2017
AA plc A
nnual Report and A
ccounts 2017

THE AA INVESTMENT CASE
The AA has strong fundamentals and a sustainable business model A highly trusted commercial brand The AA has one of the most widely recognised and trusted brands in the UK.
Market leadership We are by far the largest Roadside Assistance provider with approximately 40% share of the UK consumer market. We also have strong market positions across our other products and services.
Opportunity for digital transformation We are at the forefront of digital development with the potential to transform the services we deliver and the experience our Members and customers receive.
High barriers to entry Our deployment system, people and scale combined with the high start-up costs required to operate an efficient national roadside service pose significant barriers to entry.
High recurring revenue Our personal Members are loyal with stable retention rates and average tenure of 12 years.
High cash generation The majority of our customers pay for our services in advance so that virtually all of our accounting profits convert to operating cashflow.
Experienced and skilled workforce Our selection process and continual training for our excellent workforce lead to long service and high repair rates in Roadside Assistance.
OUR STRATEGIC PRIORITIES
OUR STRATEGIC JOURNEY
Executive Chairman’s statement p10
Strengthen the AA’s foundations providing a modern platform to become the pre-eminent Membership services organisation in the UK
Revolutionise customer experience through investment in the Membership proposition and new technologies
Reduce Group borrowings and the associated interest costs
Year 1 (the 2016 financial year): Strengthening the foundations
Our ambition for the AA is to transform it into the UK’s pre-eminent Membership services organisation
Year 3 (the 2018 financial year): Realising the transformation
Year 2 (the 2017 financial year): Building momentum for change

The AA has a long tradition of service and innovation which is at the core of all we do and means that more than 110 years on, we are still one of the UK’s most trusted brands.
We ensure our services are delivered with our long-standing values of courtesy, care and expertise. As we take the AA to the next stage of its development in the dynamic markets in which we operate, we will work collaboratively with our partners to realise the opportunities.
1906 1911 1945 1967 2016
i
A TRUSTED BRAND
Forward-looking statements This Annual Report contains certain forward-looking statements with respect to the operations, strategy, performance, financial condition, and growth opportunities of the Group. By their nature, these statements involve uncertainty and are based on assumptions and involve risks, uncertainties and other factors that could cause actual results and developments to differ materially
from those anticipated. The forward-looking statements reflect knowledge and information available at the date of preparation of this Annual Report and, other than in accordance with its legal and regulatory obligations, the Company undertakes no obligation to update these forward-looking statements. Nothing in this Annual Report should be construed as a profit forecast.
Roadside Assistance Members grew for the first time in years
We are in the final stages of the IT transformation
We have improved the Membership proposition with better products, rewards, advertising and marketing
Success in digital transformation has delivered growth in digital sales and usage of our breakdown app. The first connected car trial supports the development of new operating models
Our in-house Insurance Underwriter and Financial Services partnership with the Bank of Ireland are progressing well
We delivered cost savings as part of the programme which will culminate in savings of at least £40m per year off the 2015 cost base from the 2019 financial year
AA Ireland was sold and £106m of the proceeds were applied to paying down debt
We reduced the cost of debt by a further £10m per annum and extended its average maturity through a refinancing
A total dividend of 9.3p with respect to the 2017 financial year is recommended including the interim dividend of 3.6p
STRATEGIC HIGHLIGHTS
The transformation of the AA is now beginning to reap rewards. We are building the UK’s leading Membership services organisation by strengthening the AA’s foundations and revolutionising customer experience to provide a platform for growth.
Our marketplace p6

i
The following definitions apply throughout the report. 2017 financial year is the year to 31 January 2017
Trading Revenue is revenue excluding discontinued operations, business disposed of and exceptional revenue items.
Trading EBITDA (earnings before interest, tax, depreciation and amortisation) excludes exceptional items and items not allocated to a segment. In the current period items not allocated to a segment principally relate to the difference between the cash contributions to the pension schemes for ongoing service and the calculated annual service cost and share-based payments (see note 5).
Continuing adjusted basic EPS (earnings per share) adjusts for a number of one-offs of which the largest are exceptional operating items, items not allocated to a segment and exceptional finance costs (see note 6).
Cash conversion is net cash inflow from continuing operating activities before tax and exceptional items divided by Trading EBITDA.
Interest cover is Trading EBITDA divided by ongoing cash finance costs (see note 6).
Net debt includes the principal amounts of the Group’s borrowings less cash and cash equivalents.
Roadside Assistance
Insurance Services
Driving Services
Trading Revenue
£742m(£724m)
Trading Revenue
£131m(£131m)
Trading Revenue
£67m(£68m)
Trading EBITDA
£365m(£361m)
Trading EBITDA
£76m(£78m)
Trading EBITDA
£20m(£19m)
THE AA’S AREAS OF BUSINESS
Trading Revenue
£940m2016: £925m
Trading EBITDA
£403m2016: £402m
Profit before tax from continuing operations
£100m2016: £9m
Cash conversion
92%2016: 101%
Net debt
£2.7bn2016: £2.8bn
Continuing adjusted basic EPS
21.3p2016: 21.8p
Continuing basic EPS
12.2p2016: (0.2)p
Interest cover
2.6x2016: 2.4x
FINANCIAL HIGHLIGHTS
Financial review p26 Our performance p24

AA plc Annual Report and Accounts 2017 1
2 The AA at a glance
4 Highlights of the year
6 Our marketplace
8 Our business model
10 Executive Chairman’s statement
14 Strategic priorities
22 Key performance indicators
24 Performance: Roadside Assistance
Performance: Insurance Services
Performance: Driving Services
26 Financial review
30 Risk Management
36 Corporate Responsibility
44 Governance Report Introduction
46 Our Board
48 Executive Committee
50 Governance Structure
55 Nomination Committee Report
58 Risk Committee Report
60 Audit Committee Report
65 Directors’ Remuneration Report
74 Relations with shareholders
75 Directors’ Report
80 Independent Auditor’s Report
86 Consolidated income statement
87 Consolidated statement of comprehensive income
88 Consolidated statement of financial position
89 Consolidated statement of changes of equity
90 Consolidated statement of cashflows
91 Notes to the consolidated financial statements
122 Company statement of financial position
123 Company statement of changes in equity
124 Notes to the Company financial statements
128 Shareholder information
STRATEGIC REPORTCONTENTS
The strength of the AA is inextricably linked with our brand and its foundations in our market-leading roadside assistance service in the UK.Roadside assistance is provided both through personal Membership and business partnerships. We offer other services which enrich Membership, such as AA Tyres and AA Cars.Insurance Services includes broking of primarily motor and home insurance. We also offer financial services and home emergency services. We launched our in-house Insurance Underwriter in January 2016. Driving Services includes driving schools and DriveTech which provides driving training.
Our B
usinessG
overnanceFinancial Statem
entsO
ur Performance

2 AA plc Annual Report and Accounts 2017
Our performance p24
1 Excluding Head Office costs.
We operate three main divisions: Roadside Assistance, Insurance Services and Driving Services.
7%Driving Services
14%Insurance Services
79%Roadside Assistance
Trading Revenue split by division
4%Driving Services
17%Insurance Services
79%Roadside Assistance
Trading EBITDA split by division1
The AA at a glance

AA plc Annual Report and Accounts 2017 3
Our B
usinessG
overnanceFinancial Statem
entsO
ur Performance
Our performance p24
Our performance p25
Our performance p25
We are the UK’s leading provider of roadside assistance, with approximately 3,000 patrols attending an average of around 10,000 breakdowns by cars, motorbikes, caravans and vans every day.
The AA’s broking business offers motor, home, travel and other specialist insurance policies, operating a diverse panel of underwriters including our in-house Underwriter since its launch in January. We also offer home emergency services. In 2015, we relaunched our Financial Services business in partnership with the Bank of Ireland.
We are the UK’s leading provider of driving lessons through AA Driving School and the BSM (British School of Motoring). DriveTech is one of the market leaders in providing driver education including Driver Awareness courses which are offered by police forces.
Trading Revenue
£742m(2016: £724m)
Trading EBITDA
£365m(2016: £361m)
Personal Members
3.3m(2016: 3.3m)
Business customers
10.0m(2016: 10.2m)
ROADSIDE ASSISTANCE
INSURANCE SERVICES
DRIVING SERVICES
Trading Revenue
£67m(2016: £68m)
Trading EBITDA
£20m(2016: £19m)
Driving instructors
2,607(2016: 2,574)
DriveTech Police contracts
11(2016: 11)
Trading Revenue
£131m(2016: £131m)
Trading EBITDA
£76m(2016: £78m)
Insurance policies
1.9m(2016: £2.1m)
Average income per policy (includes FS policies)
£70(2016: £63)
Financial Services products
100k(2016: 33k)

4 AA plc Annual Report and Accounts 2017
Highlights of the yearJanuary 2016 The AA’s in-house motor Insurance Underwriter launched.
Lex Autolease contract won adding around 280,000 vehicles.
Intelematics Europe joint venture launched.
February All patrols using new digital communications devices.
April 2016 annual report published.
Launched our new AA credit card.
May New website launched.
June AA London to Brighton charity cycle – a 60 mile ride coinciding with National Bike Week.
At Glastonbury we attended 401 jobs, including flat batteries, lost keys and wheel changes.
July AA and Chargemaster form a partnership to provide advice, support and access to a UK-wide network of electric vehicle chargers.
Digital Hero Kristian Samuel-CampsKristian’s award was for the way he steered our website transformation, rebuilding this key sales channel from scratch and delivering superb results.
“ From 2am finishes to 4am starts, rebuilding the AA’s website has been a rollercoaster ride. Sometimes stressful, always exhilarating, but totally rewarding”
Brand Values Awards Clive Heywood, Joshua Jones and Zubair AswatThese awards were for the commitment Clive, Joshua and Zubair showed in the rollout and implementation of the latest iPhone technology to our patrols and technicians. They travelled up and down the country tirelessly and were endlessly patient. They personified our five brand values of Courtesy, Collaboration, Care, Dynamism and Expertise.
“ I love the way in which I am able to help our Members and customers through my job. It is thrilling to be recognised although the thanks you get from customers is really reward enough.” Natasha
Zubair Aswat
Clive Heywood
Road and Home Call Centre Customer Adviser Natasha RoseNatasha was recognised for performing at the highest level; displaying a sound knowledge of our products and services; and ensuring the best quality service is offered to our customers.
“ I really felt that the new iPhone would make a huge difference to patrols’ ability to deliver a top class service to members.” Clive
“ We were determined to make sure it was rolled out brilliantly, and that patrols were shown how to get the best out of the tech.” Joshua
“ This needed to be done by people who understood the patrols’ daily challenges out on the road and the benefits the new technology would bring.” Zubair

AA plc Annual Report and Accounts 2017 5
Our B
usinessG
overnanceFinancial Statem
entsO
ur Performance
August AA mortgages launched.
Sale of AA Ireland and £106m of debt paid down.
Launch of home insurance underwriting.
September The AA Hospitality awards for hotels and restaurants.
October Premiere of AA Trust driver distraction film Cadence.
September
November Successful refinancing to improve our debt profile announced.
Connected car trial proves ability to pre-empt breakdowns.
Patrol of the Year John Snowling and Recovery Patrol of the Year Tony Doran attended the London to Brighton veteran car run.
…and see how much you could
SAVEon your mortgage
Employee awards ceremony We celebrated some of our greatest achievements and some of our heroes, all of whom have demonstrated our brand values of Courtesy, Collaboration, Care, Dynamism and Expertise in the way they have done their jobs.
December AA app usage in breakdowns reached 20%.
100th AA Populus poll analysed the fuel choices of Members’ next car:
Petrol 48%
Diesel 18%
Hybrid 11%
Electric 1%
Don’t know 22%
January 2017 Tuesday 3rd was one of the busiest days of the last 12 months. Attending more than 17,000 call-outs, we were 32% busier than a typical Tuesday.
Leadership Award Mark Millar (right)Mark demonstrated exceptional leadership, motivation and inspiration to the people in his team and the wider business. By leading through example, he has set an incredibly high standard of integrity and professionalism.
Patrol of the Year 2016/17 John Snowling (right)The Patrol of the Year is chosen for their skill, ability and dedication to the AA. It is a hard-fought competition between all patrols and we are delighted to recognise John Snowling as the best of the best this year.
The Patrol of the Year uses the number plate 999 AA for the year of his reign.
Patrol of the Year 2015/16 Max Holdstock (left)Our outgoing Patrol of the Year, Max Holdstock, has been a superb representative of the AA’s values for the last year. He has always been the perfect presence at public events up and down the country, including visiting schools and hospitals. He has also been interviewed by a wide range of media. We thank him.
“ I’ve had a brilliant year, and I’ve loved every moment of representing our wonderful business” Max
“ I’m over the moon to have won. There was stiff competition – our patrols really are the best in the business and I still can’t quite believe it. It’s a huge honour.” John
Mark Millar, receiving his award from Olly Kunc
Max Holdstock handing over AA Patrol of the Year’s number plate to John Snowling
“ I’m absolutely delighted to be recognised in this way. The AA is full of fantastic people, and it’s been a privilege to have been given the chance to have such an impact on my team, and the wider business.” Mark
The other award winners:
Tony Doran Recovery Patrol
Mark Harris Jaguar Land Rover Dedicated Technician
Anthony Aldridge Volkswagen Group Dedicated Technician
Mick Saywell Assist Technician
Fourwinds Garage Contractor Award
Gallows Wood Service Station Contractor Award
Sadie Leaman Direct Sales Force Agent
Wes Roberts Home Services Engineer
Simon Goodall Motoring Services Award
Elin Herbert Driving School Award
Lee Norman Sales & Service Call Centre Customer Adviser
Simon Fettes Insurance Call Centre Customer Adviser
Ian McKenry Call Centre Team Leader
Sukriti Prasher IT & Change Hero
Lesley Atkinson Business Transformation Hero
Brian Golds Spirit of the AA – in honour of Di Kirman
Justin Edwards Spirit of the AA – in honour of Di Kirman
Jean Franklin Support Expert

6 AA plc Annual Report and Accounts 2017
Business model
Business model
Market share
Customers
Market drivers
Consumer
Driver training
Business-to-businessTotal
Driving schools
Market share
Customers
Market drivers
Competition
Competition
Our marketplace
ROADSIDE ASSISTANCE MARKET
DRIVING SERVICES MARKET
Roadside Assistance services in the UK, including the AA’s, are provided through business-to-consumer (personal Members) and business-to-business channels (business customers).
Branded driving school organisations, such as the AA, tend to operate a franchise model whereby franchisees receive a car and support from the brand in return for a fee.
The AA has approximately 10% of the very fragmented market for pupils through its two franchises, AA Driving School and British School of Motoring.
In driving schools, pupil segments and their needs are complex, varying by age, region and buying criteria.
The driving school market is driven by levels of economic confidence. Since 2012 demand has been strong due to better economic conditions and a catch-up of people who deferred learning to drive during the financial crisis.
The roadside assistance market is worth approximately £2bn per annum.
In the UK there are a small number of large players with significant market share. Competition is based on quality of service and price. Our competitors include the RAC and Green Flag.
Barriers to entry are significant and include the investment required to build a trusted, highly recognised brand, the creation of a nationwide, branded fleet of qualified patrols with competitive technical ability, and the sophisticated deployment process to operate effectively.
The UK driving services market has high levels of competition ranging from national and regional networks to independent operators. Markets remain competitive with cost and professional qualities top of the buying criteria.
Competitors include Red and Bill Plant driving schools and TTC driver training.
While spend on roadside assistance is discretionary, our business proved remarkably stable over the economic cycle. Positive momentum in the UK economy provides a favourable environment for expansion of our Membership base.
UK volumes are driven primarily by the number of privately-owned vehicles. This grew at approximately 1% per annum between 2007 and 2015. Despite suffering significantly during the financial crisis, new car registrations in the UK have grown strongly in recent years with 2.3% growth in 2016.
For business customers, fees are set either per breakdown or per vehicle and average income per customer is lower than in personal Membership.
The AA has approximately 65% of the car manufacturers segment, over 60% of the UK’s largest fleet and leasing customers and around half of the banking and added value account segment.
Business customers’ cover is provided by the respective partners but with services provided by the AA. These include pay-for-use and insurance-based services.
In personal Membership, fees are paid principally for breakdown cover but additional revenue is available from cross-selling (selling other services) or up-selling (selling higher-value products and services).
Our DriveTech business, which offers training for occupational drivers and individuals who have committed driving offences, is delivered under long-term service contracts, most often with police forces.
The AA has strong positions in both fleet and police markets. In the Police market the AA has contracts with 11 of the 45 police forces in the UK. In the fleet market the AA is market leader and has a range of smaller competitors.
Key customers for occupational driver training are companies with significant logistics operations in the UK and Europe, as well as police forces throughout the UK
Occupational driver training is affected by economic confidence as companies’ fleets grow or contract.
The AA is the clear market leader with approximately 40% of the consumer segment.
Personal Membership covers vehicles or individuals. Vehicle policies cover either single or multiple vehicles; personal policies cover one or more individuals including families, regardless of the vehicle they are travelling in.
Our performance p24
Our performance p25

AA plc Annual Report and Accounts 2017 7
Our B
usinessG
overnanceFinancial Statem
entsO
ur Performance
Business model
Market share
Customers
Market drivers
Competition
Insurance Broker Insurance Underwriter Financial services marketTotal
INSURANCE SERVICES MARKET
The AA acts as an insurance broker and has, since January 2016, operated our own in-house underwriter.
Approximately 9% of our Roadside Assistance Membership base has motor insurance with us and 5% has home insurance. Following the launch of our Underwriter, we have expanded our customer base both for the Underwriter and Broker. The majority of policies we underwrite are for Members who did not previously have insurance with us.
In the UK, motor insurance is a legal requirement and market volumes are driven by the number of cars, motorists and overall cost of motoring.
The residential property market drives the home insurance market as insurance is typically taken when purchasing a property. Mortgage lending, house price momentum and new build volumes are all factors which drive the market.
The UK insurance markets experience high levels of competition.
Along with brand, pricing is a key consideration for customers, particularly for motor insurance.
The AA Underwriter sits on the AA Broker panel and like other underwriters decides whether to provide insurance and under what terms.
The combination of the AA’s brand and proprietary Membership data mean we aim to underwrite 300,000 policies in the first three years of business.
The Underwriter serves predominantly Roadside Assistance Members. We believe Members, in many cases, should be able to obtain competitive insurance cover as a result of the extensive data we hold.
Underwriters compete primarily on price, although brand is also a key consideration.
Our competitors include Saga, Hastings and Esure.
In partnership with the Bank of Ireland, we provide savings , loans, credit cards and mortgages. We aim to do so on a matched book basis.
The combination of the AA’s brand, its history of success in the financial services market and the Bank of Ireland’s service delivery expertise means that we compete effectively. However, our market share is relatively small as this is a new business.
Our customers are largely, but not exclusively, AA Members as we aim to provide services for those we know best. Some products, such as mortgages, are exclusively available to AA Members.
The market is primarily affected by general economic conditions in the UK.
Financial service providers compete on price and quality of product offering.
Our competitors include high street banks such as Barclays and HSBC along with affinity brands such as Tesco, M&S and Virgin Money.
Insurance brokers, such as the AA, act as an intermediary between those seeking insurance cover and insurance underwriters, earning a commission at the point of sale. Insurance brokers assume no underwriting risk.
In 2016, the AA accounted for approximately 2% and 3% of new motor and home insurance policies respectively.
Our Insurance Broking business serves both Roadside Members and non-Members.
Insurance brokers compete with each other and direct insurers through a range of channels. Distribution through price comparison websites (PCWs) amounts to up to 70% of the market in motor insurance. In home insurance PCWs are less dominant, largely because home insurance policies are less homogeneous and less expensive than motor.
Our competitors include Hastings, Swinton and RIAS.
Our performance p25
Source: Department for Transport
0
5
10
15
20
25
30
35
Licensed private cars in the UK, 1950 – 2015
Mill
ions
1950 2015
Source: DVLA
0
200
400
600
800
1,000
1,200
1,400
20162015201420132012201120102009200820072006
Provisional driving licence applications,2006 – 16
Thou
nsan
ds
Source: AA plc
350
400
450
500
550
600
650
700
2011 2012 2013 2014 2015 2016
AA British Insurance Premium Index – motor insurance, 2011 – 16
£ pe
r pol
icy

People Financial resources Innovation
Reliability Intellectual pr
oper
ty
Tech
nolo
gy Courtesy
Care Expertise
Collaboration
Dyn
amism
BRAND
Strategic objectives As we deliver our strategy, we will strengthen the AA’s foundations to become the UK’s pre-eminent Membership services organisation and revolutionise customer experience. In addition, we will reduce borrowings and the associated cost of interest.
Our business model
AA brandThe AA’s highly trusted brand has been at the heart of all we do for more than 110 years. It has supported and differentiated the AA’s Roadside Assistance services through the generations and enabled us to expand into insurance and other services, innovating when dealing with threats and challenges.
Our strengthsPeople, Financial Resources, Innovation, Reliability, Intellectual Property and TechnologyThese strengths of the AA, which derive from our brand and values, allow us to remain robust and flexible in the face of change.
Our valuesCourtesy, Care, Expertise, Collaboration and DynamismThe values of the AA are interwoven with the brand. Our traditional values of Courtesy, Care and Expertise provide the bedrock on which we are transforming the AA. However, to modernise, we also have to operate with Collaboration and Dynamism. These values enable us to make the most of what we have inherited and of the new technologies and methodologies we are adopting.
Our strategic journey p14
8 AA plc Annual Report and Accounts 2017
Sales
Subscription

AA plc Annual Report and Accounts 2017 9
Our B
usinessG
overnanceFinancial Statem
entsO
ur Performance
We are confident that our brand, values, strengths and strategic priorities will continue to reward the trust in the AA and enhance the expertise at the heart of our brand and services. This will provide the platform from which we expect to increase value for shareholders.
Subscription AA Members subscribe in case of – and in advance of – a need for roadside assistance.
Our brand attracts Members and creates loyalty. This helps the AA generate high recurring revenue and strong cash flow, enabling investment in our service levels and Membership proposition.
SalesCustomers buy insurance policies, financial services and other offerings such as driving lessons. Our brand is important in attracting customers. It is also key to building partnerships for the development of new products.
Continued trust
Increased shareholder value
Enhanced expertise
The AA transformed: The UK’s pre-eminent Membership services organisation

10 AA plc Annual Report and Accounts 2017
In transforming the AA, we are building on the strong fundamentals of the business:
High recurring revenues and significant cash generation
A highly regarded and trusted commercial brand
Clear leadership in the stable roadside assistance market
High levels of retention and loyalty among our personal Members
Strong market positions across our range of other products and services
An experienced and dedicated workforce
OUR STRONG FUNDAMENTALS
FINANCIAL HIGHLIGHTS
Cash conversion
92%Dividend per share
9.3p
Adjusted basic EPS
21.3p
Trading Revenue
£940mTrading EBITDA
£403mBasic EPS
12.2p
Executive Chairman’s statement
“The transformation is delivering growth in our Roadside Assistance Membership base and in motor insurance policies, reversing long-term historic declines. It has given us a firm platform for sustainable growth.
We have delivered results in line with expectations, mitigating the increases in Insurance Premium Tax (IPT) and call outs, and paid a progressive dividend. In addition, the refinancing reduced the cash cost of debt by £10m per annum, bringing the annualised reduction since the IPO to more than £75m.
We are realising the AA’s potential. We are now capable of building on our technologies, brand and positioning in our markets to take advantage of the abundant opportunities that arise from our ability to fulfil a wider set of consumer and business needs. We are more than ever convinced of the potential of the AA as we position it as the UK’s pre-eminent Membership services organisation.”
Bob Mackenzie Executive Chairman
Our financial review p26

AA plc Annual Report and Accounts 2017 11
Our B
usinessG
overnanceFinancial Statem
entsO
ur Performance
Results in line with expectationsOverall, Trading Revenue increased 1.6% to £940m with 2.5% growth in Roadside Assistance. Revenue from Insurance Services was flat on the prior year while Driving Services declined.
The turnaround of paid Memberships from decline to growth is a significant milestone in the transformation of the Roadside Assistance business and the AA Group, as Roadside represents 79% of Group Trading EBITDA. Roadside Assistance Trading Revenue grew 2.5% and Trading EBITDA 1.1%, against the background of major transformation, the increased burden of Insurance Premium Tax (IPT) and increased breakdown incidents. This strong performance reflects not just the AA’s resilient business model and demand for our services, but also the significant benefits already evident in the first two years of the transformation.
Group Trading EBITDA rose by 0.2% to £403m with organic revenue growth offset by costs associated with increased breakdown incidents, higher insurance aggregator spend and the planned increase in IT maintenance costs. As a result, the Trading EBITDA margin was slightly lower than last year at 42.9% (2016: 43.5%).
Exceptional operating items were £31m, comprising largely £14m of costs associated with the business restructuring. Of the £10m provided for duplicate breakdown cover, £7m is exceptional operating costs and the balance, which is related to accrued interest for refunds, is allocated to exceptional finance costs. While dealing with this issue has involved a considerable commitment of management time, it has enabled us to incorporate fairer treatment of our customers and Members into our systems and processes.
Operational cash flow was strong and cash conversion from continuing operations before tax and exceptional items was 92%. Net cash flow was £42m after dividends (2016: outflow of £136m). This was achieved despite the additional capital expenditure relating to the transformation.
Strategy updateThe programme to transform the AA into the UK’s pre-eminent Membership services organisation began following the IPO when we set out three strategic priorities and detailed the investment that would be needed. We have delivered a great deal against these priorities, which remain unchanged:
Strengthen the AA’s foundations to modernise the platform to become the pre-eminent Membership services organisation in the UK
Revolutionise customer experience through investment in the Membership proposition and new technologies
Reduce Group borrowings and the associated interest costs
Our strategic journey and highlights of the actions we have taken during the year are set out on the following pages.
Culture and organisationWe fully recognise that the AA’s transformation is dependent on the AA’s teams of people, working on the phones, at their laptops or at the roadside.
A new Membership proposition can only be realised by people who understand what it is and how to deliver it to our Members. That has meant a great deal of change but, importantly, also preservation of the best of our 112 years of culture. A lot of work has been done to achieve the necessary change and to create a culture which embraces it. While this has been under way, we have not only continued to provide our Members and customers with exemplary service but improved and modernised it.
Our brand has supported and differentiated the AA’s service levels across all our products. This brand is tied to our values. At the core of everything we do are our traditional values of courtesy, care and expertise. To modernise, however, we need to operate in a dynamic way, to innovate and move rapidly in a changing market. We also need to collaborate to ensure we have access to the best expertise, advice or partnerships. This full set of values enables us to make the most of what we have inherited as well as the new technologies and methodologies needed in modern markets.
I offer my thanks to the AA teams for their hard work during the year, another one of huge disruption as we did so much to transform the business. Every achievement is the result of change and we know that transformation is challenging and that every single person has been affected one way or another. We have every reason to be proud of what we have achieved and to be excited about what the future holds.
The BoardI thank John Leach, our Senior Independent Director, and the Board for its continued support of the AA over the year. Shareholders can rest assured that the AA has considerable breadth of experience and depth of expertise on the Board.
Corporate responsibility The AA has operated in a highly responsible and ethical way since its beginnings. It has also had a strong public position as the voice of its Members. The work of its Charitable Trust has extended the AA brand and ensured very favourable perceptions of what we do.
However, we have now incorporated the responsible, sustainable and ethical ways of operating into our business by integrating them more formally into our governance, risk management, health and safety practices, and the activities related to our people. Our aim is to continuously improve our performance on every front.
Having established the transformation strategy at the time of the IPO, we have now completed two years of transformation.
PROGRESSION OF THE TRANSFORMATION OF THE AA
Year 2 Building momentum for change
Year 3 Realising the transformation
Our strategic journey p14
Year 1 Strengthening the foundations

12 AA plc Annual Report and Accounts 2017
Executive Chairman’s statement continued
Some of the corporate responsibility highlights of the year have been:
Early development of a more strategic approach to sustainability which will engage the views of a range of stakeholders and result in a more formal strategy
The introduction of a new programme focusing on safety and supported by new technology to help manage safety in our business
A more environmentally focused approach to company car management
A new approach to recruitment, using our culture as a core part of the process, and greater support for management in the development of people and culture
A new code of conduct for suppliers, focused on the ethical delivery of service
As a Membership organisation, our position and role go beyond the commercial drivers of our Roadside Assistance business. One of the ways in which we benefit our Members and the wider community is by gauging drivers’ views through Europe’s biggest motoring opinion panel, the AA Populus Driver Poll. This polling helps us to promote crucial safety and environmental issues.
We are contributing to the debate on Driver Distraction and smart motorways without hard shoulders. I am also very proud of the projects the AA Charitable Trust funds, such as Drive Motorway, a motorway safety course aimed at nervous drivers and the radical new anti-text-driving advertisement now being promoted by the Government’s Think! campaign.
These initiatives are covered in our Corporate Responsibility report.
PensionsAs at 31 January 2017, the net liabilities of the Group’s defined benefit pension schemes under IAS 19 were £395m (2016: £296m). This increase on last year is principally due to the recent volatility of corporate bond yields, which we are required to use as the discount rate or these liabilities. The deficit is, however, a reduction from the £622m reported at 31 July 2016, the result of an increase in corporate bond yields and changes to actuarial assumptions.
This includes the UK scheme for which the IAS 19 deficit valuation was £325m (2016: £238m) as at 31 January 2017. The triennial review valuation for this scheme is being carried out as at 31 March 2016. Preliminary indications suggest the reduction in long-term gilt yields since 2013 will cause the deficit to increase from £202m as at 31 March 2013.
In light of the anticipated increase in cost of the UK pension scheme we have undertaken a review of the options for mitigating current and future liabilities, as previously stated. We are proposing to retain a defined benefit arrangement allowing all members of the current scheme to accrue future service benefits in a single modified Career Average Revalued Earnings defined benefit section (CARE) of the scheme. This will involve transferring employees from the final salary section of our scheme into CARE.
On 20 March 2017, we commenced a consultation process with members of our defined benefit schemes affected by the proposed changes, and we have engaged with the AA recognised union, the Independent Democratic Union (IDU). The proposed scheme changes are designed to:
Mitigate any potential increase in pension costs to the business
Reduce our exposure to pension risks
Remain competitive within our industry
Create a more consistent pension offering across our employees
These changes, if implemented, will be taken into account in agreeing the deficit reduction plan with the pension Trustees. The deficit reduction plan is expected to be finalised before the end of June 2017.
DividendIn view of the AA’s business model, which is characterised by strong cash generation, our confidence in the transformation plans and the interest cost savings facilitated by the refinancing, the Board is recommending the payment of total dividends of 9.3 pence per share in respect of the 2017 financial year.
This includes the interim dividend of 3.6 pence per share which was paid on 28 October 2016. The payment of the final dividend of 5.7 pence per share, subject to approval at the AGM on 8 June, will be paid on 13 June to shareholders on the register on 12 May with the ex-dividend date of 11 May.
It remains our intention to pursue a progressive dividend policy.

AA plc Annual Report and Accounts 2017 13
Our B
usinessG
overnanceFinancial Statem
entsO
ur Performance
GOVERNANCE OVERVIEW
The 2017 financial year has been a dynamic time when we have continued to advance our corporate governance and reporting standards as well as support the transformation of the AA. I am confident that a strong governance framework aligns with a successful transformation.
This was my third year as SID, during which I have supported Bob Mackenzie in his role of Executive Chairman, providing advice and additional oversight on governance matters and the effectiveness of the Board. A key part of this role is ensuring that proper consideration is given to the balance of risk and reward when major decisions about our business are taken, including the sale of AA Ireland and the issuance of the new A5 bonds.
The roles and responsibilities of the Board members are clearly defined, as recommended by the Financial Reporting Council’s UK Corporate Governance Code, and are described in this annual report. A clear separation exists between the Board’s focus on strategic and financial review, value setting and determining our approach to risk and the operational activities of the Executive Committee.
During the year, I oversaw our second internal Board performance evaluation which built on the actions resulting from the first evaluation in the 2016 financial year. These ranged from setting additional time to consider routine and special Board matters, progressing constructive debate and promoting opportunities to signal Board values to the business. Skills matrices were implemented this year and the knowledge gained from this will be invaluable.
Our first external Board evaluation is planned for October and will mark another significant milestone in our evolving governance since our IPO. We have appointed Condign Board Consulting and we look forward to working with them.
Our relationships with our shareholders is central to successful governance. As SID, I act as a key point of contact for shareholders to discuss any matters of concern. I will meet with major shareholders and continue to offer an open invitation for shareholders to meet me. We have invited the governance officers of our top shareholders to discuss governance in more depth and Andrew Miller (Chairman of the Audit Committee) and Mark Millar (Company Secretary) will also attend this meeting in the coming months.
While I encourage shareholders to attend the Annual General Meeting on 8 June 2017, should shareholders wish to discuss any matters at another time, please contact me through the Company Secretary, Mark Millar.
John Leach Senior Independent Director (SID)
Our values as we display them in our buildings
Our Employee Award winners
“This was my third year as SID and one in which I have supported Bob Mackenzie in his role of Executive Chairman, providing advice and additional oversight on governance matters and the effectiveness of the Board.”
John Leach Senior Independent Director (SID)
OutlookWe have made a positive start to the 2018 financial year.
The new IT systems and improved productivity will ultimately enable us to meet our cost savings target to cut at least £40m per annum off the 2015 cost base from the 2019 financial year.
We expect to benefit from continued investment in our digital platform, the customer relationship management systems (CRM), marketing, advertising and product development, with a particular focus on our new connected car product, Car Genie.
With the final tranche of transformation investment of approximately £20m and approximately £45m of maintenance capital expenditure expected in the 2018 financial year, a greater proportion of free cash flow will be available for the creation of shareholder value including the repayment of debt.
We continually review the impact of IPT and other regulatory change on our Membership base. IPT is an inequitable tax on the insurance and roadside assistance industries because it is not subject to the offsetting reliefs which most businesses can claim from VAT. We estimate that irrecoverable VAT costs the AA £25m to £30m per annum.
A strengthened and modernised AA will be capable of realising a wider range of consumer and business opportunities in our markets. We will build on our brand, technologies and leading market positions to be the UK’s pre-eminent Membership services organisation.
Bob Mackenzie Executive Chairman

14 AA plc Annual Report and Accounts 2017
THE TRANSFORMATION PROGRESSION
We invested in the fundamentals needed to modernise our IT systems, recharge our brand, reinforce the excellence of our service delivery and improve the Membership proposition.
We began to build our digital platform and connected car positioning.
We relaunched our Financial Services business and established our Insurance Underwriter.
We significantly reduced the cost of the annual interest on borrowings through a refinancing.
We paid our first dividend.
Strengthening the foundations
OUR STRATEGIC PRIORITIES
Strengthen the AA’s foundations to modernise our platform to become the pre-eminent Membership services organisation in the UK
The benefits of our investment became evident during this year. We have reversed years of decline in paid Membership, with growth accelerating in the second half of the year. This is the result of our modernised digital platforms, the new highly effective marketing approach, and the enriched Membership proposition.
The new business models in Financial Services and Insurance Underwriting are performing well, with the latter driving growth in motor insurance broker policies for the first time since 2008.
Our new IT infrastructure and the investment in new technology for the patrols has made our operations much more efficient and we continue to take out cost. We are encouraged by our connected car technology trial and its potential, particularly as a tool to pre-empt breakdowns.
We applied £106m of the proceeds of the sale of the Irish business to the repayment of debt and further reduced the cost of borrowing through a refinancing.
The strategic achievements of the 2017 financial year are covered more fully on the following pages.
Building momentum for change
Revolutionise customer experience through investment in the Membership proposition and new technologies
Reduce Group borrowings and the associated interest costs
We are now entering the final stage of the three-year programme to transform the AA into the UK’s pre-eminent Membership services organisation.
We expect to begin to realise the benefits in the 2018 financial year.
The AA’s sustainable revenue growth is expected to lead to increased free cash flow, giving us options for the allocation of capital, including the repayment of debt, which will create value for shareholders.
The strategic journey
Year 1 (the 2016 financial year)
Year 2 (the 2017 financial year)

Capital expenditure When we set out the plan for the transformation, we announced that the capital investment required for the IT element of the transformation was £128m over three years. This is now substantially complete with the final tranche of approximately £20m to be invested in the 2018 financial year. We expect maintenance capital expenditure in the order of £45m in the 2018 financial year and beyond.
Operating costs Based on the success of the brand advertising during the past two years, we expect again to invest approximately £10m in brand marketing. In addition, we continue to expect to invest in product development which will significantly enhance the Membership proposition.
Incremental IT operational maintenance costs, mainly fees and licences, reached £7m per year, with an anticipated annual run rate of £8m in the 2018 financial year.
The new IT has increased our efficiency and we expect to reduce costs from the 2019 financial year, saving at least £40m per year off the 2015 cost base. Cumulative savings to date are £20m including £12m in the 2017 financial year. These came from higher productivity throughout the organisation including efficiencies in our call centres and back office. The cost to achieve these total savings is expected to be £45m over three years, of which we have now invested £36m.
FINANCIAL IMPLICATIONS
AA plc Annual Report and Accounts 2017 15
Realising the transformation
Year 3 (the 2018 financial year)
With a stronger, more efficient and modernised platform for our trusted brand, our leading market positions and excellent service levels, we expect to:
Achieve growth based on our leading position and the latent demand in our market – we expect to continue to grow Membership, leverage our new channels and strengthen our business-to-business positioning
Expand our technological capability – we are revolutionising the customer’s experience, driving sales, achieving higher service levels and reducing costs; and in addition developing our positioning to take full advantage of connected car technology
Build on our brand beyond Roadside Assistance – our new businesses, including our in-house Underwriter and Financial Services partnership, fulfil a wider set of consumer and business needs

16 AA plc Annual Report and Accounts 2017
I’m turning into my Dad!(Except that I do it all on the app)
Growing our position in Roadside Assistance
Year 2 Building momentum for change
Paul became a new Member and has already used the breakdown app to find cheap petrol, get his rewards at Moto service stations, and even to change a tyre. Not quite what his dad had.
1
Reversing the long-standing decline in Membership numbersWe have met our goal of reversing the decline in paid personal Membership numbers and we look forward to continued growth.
This arises from the transformation of our Membership proposition and our commercial model. Through our investment in new IT systems, brand, invigorated marketing, a more rational approach to pricing and improved rewards for Members, we have retained more existing Members and won new Members.

AA plc Annual Report and Accounts 2017 17
Our B
usinessG
overnanceFinancial Statem
entsO
ur Performance
Our targeted marketing , with its focus on outdoor advertising, almost trebled the number of times an adult saw our adverts
Sally was one of more than 100,000 people that we, at the AA Driving School and the British School of Motoring (BSM), taught to drive during the year
Advertising and marketing campaigns reaping rewardsWe refreshed our 2016 advertising campaign with a new emphasis on outdoor and radio advertising, in addition to TV, and its effectiveness is evident. We estimate that, on average, each adult has been reached 60 times, compared with 22 times in the previous year. This is one of the reasons behind a 5% increase in utilisation of the service. While this increases our costs, it also underpins retention by reinforcing the value we provide.
Sales and marketing communication has become better pitched to the individual as a result of the marketing element of the CRM which has been operational since April. New Members are no longer deluged with offers but these are now carefully tailored to be relevant and are proving much more attractive.
Our new digital sales channel is highly effective and driving double-digit growth in new business and an increase in average sales value as it helps Members select the right level of cover.
Our improved pricing model ensures our products are more rationally tiered so that Members are now more likely to have the cover they need. Restricted underlying price increases (net of IPT) have helped retention.
Rewards for Members, including discounts with Mitchells & Butlers and MOTO service stations, are gaining usage. Redemptions of the Mitchells & Butlers benefit trebled, driven in part by the app which identifies where those benefits are in relation to a Member’s current location.
Channels for Membership growthThe continued growth in the UK car parc and in total driven mileage underpins the value of our products and services which touch many points of a Member’s life.
Many of our products and services are geared to initiating customer relationships and are complementary to our membership proposition. We are differentiating the AA and creating cross-sell opportunities through the development of products and services such as:
AA Driving School and BSM: as the largest driving school in the UK, we are improving our franchise offering and contact with pupils.
Car loans: we provide financing through our new Financial Services partnership with Bank of Ireland – and now mortgages too.
AA Cars: we now have 2,300 dealers on AA Cars with a significant proportion signed up for the AA Dealer Promise, our code of conduct which offers arbitration by the AA in disputes.
Motor insurance: Membership may result in more competitive pricing – and this also applies to home insurance.
Strengthening our business- to-business positioningOur leading positions in our business-to-business Roadside Assistance markets - manufacturing, fleet and leasing and banks’ Added Value Accounts – lends scale to our operations. The strength of our relationships with our manufacturer partners and our share of about 65% of that market, combined with our strong position in ARC (the pan-European organisation of breakdown clubs), provides us with a platform for innovation across the industry.
We renewed or extended contracts with McLaren, Hyundai, Lotus, MG, Alphabet, Venson, Hertz, South West Ambulance Trust, G4S and Barclaycard (Buying Group).
We have once again reported record satisfaction with our service for VW Group. The scale and expertise of our dedicated technicians and patrol force and the high standards of service we deliver have resulted in a customer satisfaction rate of more than 95%.
Our new contract with Lex Autolease, the UK’s biggest leasing company, commenced in January 2016. This contract added approximately 280,000 vehicles and 50 patrols to our own fleet. This helps our Roadside business, as scale is critical to maintaining high service standards while optimising costs. This brings our overall share of the UK’s 50 largest fleet and leasing companies to more than 60%.
I’ve done it!
2
3 4

18 AA plc Annual Report and Accounts 2017
IT systems and processes Our IT investment can be broadly separated into infrastructure, AA Help (our Roadside Assistance deployment system), customer relationship management (CRM), and our digital platform. The complexity of our requirements means that these systems have to inter-connect. We are now at the stage where we are beginning to benefit from the investment we have made in these systems.
IT support systemsWe have successfully installed new IT infrastructure and applications to support our back-office functions and call centres. This is generating savings as we reduce manual reconciliations and in-house maintenance, and become leaner and more efficient.
AA Help 2 and the patrols’ communication The new version of AA Help, our bespoke operational deployment system, was rolled out in 2016. This improves the interface for our call centres and patrols, enhancing information flow among our employees and patrol deployment.
Access to iPhones and tablets for our patrols has significantly improved their efficiency as they now have easy access to information ahead of and during a job. This also saves time spent on administration as we increasingly reduce reliance on paper records of jobs done.
CRM The marketing element went live ahead of plan, allowing us to segment and market to customers in a more sophisticated, personalised and relevant way. The system reduces the quantity, while increasing the effectiveness, of communication.
The integrated sales platform will, once all Members’ data is loaded, enable a 360-degree view of a customer, their data and products. This will enhance customers’ experience, our ability to match their needs to our range of products and allow us to communicate with greater relevance. It is also expected to reduce handling time, and therefore costs, for call centres and increase the number of products per customer from the current level.
Insurer-hosted pricingThis allows our in-house Underwriter to tailor prices using enhanced data and it enables more dynamic and frequent price changes. In time, other members of the insurer panel will also be able to adopt it and we expect it to improve performance in our broking business.
Expanding our technology capability
Year 2 Building momentum for change
1
The breakdown app speeds up and simplifies communication between the patrol and the Member – and it shows the Member where the patrol is in relation to his own position. It is now used in 22% of breakdowns
Improving our patrols’ efficiency with new technology
Help is in hand

AA plc Annual Report and Accounts 2017 19
Our B
usinessG
overnanceFinancial Statem
entsO
ur Performance
The connected car technology provides a health check of the car’s systems and in up to one third of cases can pre-empt a breakdown
Now I am in control
Realising the potential of digitalisationOur digital investment is improving the attractiveness and efficiency of the AA’s products and processes by making them more immediate, intuitive and relevant.
The new commercial website, launched in May 2016, enhances our commercial online processes including enabling us to update information and prices more rapidly. Since its launch, we have achieved double digit year-on-year new business volume growth.
My AALaunched in early 2016, My AA will be fully functional when the CRM is rolled out across our various product lines. It gives our Members access to their accounts on a new digital platform, enabling them to manage their own information and giving us a single profile of a customer across all our products. This is a critical step leading to modernised self-service, which will deliver savings.
The app The breakdown app has now been downloaded by more than one million Members. But more importantly, it is now used in 22% of breakdowns thus reducing the number of calls being handled by call centres and improving customer experience. The app provides a significant and differentiating benefit to Members as it includes information not available to non-members.
Development of our connected car positionThe AA is developing its connected car technology with our partners, Intelematics Europe and Trakm8. Intelematics Europe is our joint venture with Intelematics, the leading telematics provider, and European roadside assistance clubs and Trakm8 is the telematics partner we have used for our own fleet and with our fleet customers.
We have successfully trialled a retro-fit telematics product and are now planning to launch our new connected car product, Car Genie, in spring 2017. We are encouraged by the trial that established that up to one third of breakdowns could be avoided as the AA could be notified of the faults and plan repairs before the breakdown occurred.
This technology gives the AA the capability to improve its service at the same time as reducing costs through better prognostics, diagnostics, accuracy of deployment and speed of repair. There is also potential for its use in insurance for pricing risk. From the customer’s perspective, it offers additional benefits from the monitoring of safety, security, logistics and driving costs.
I’m feeling
flat
I’m starting to overheat
2 3
The AA is developing connected car technology with its partners Intelematics Europe and Trakm8
Car Genie, our new connected car product

20 AA plc Annual Report and Accounts 2017
Building on our brand
Growing our presence in Home ServicesThe introduction of new operating systems and products into Home Services has prepared the ground for the many opportunities we see in the market. We are ideally placed to disrupt this highly fragmented and mature market, challenging the dominant competitors with our brand and service levels.
Through our own highly trained workforce and partnerships with boiler manufacturers, we are capable of profitable and sustainable growth. Our unique and radical boiler cover service that saves customers money through switching energy tariffs is an example of the value we can provide.
Insurance Underwriter widening the reach of AA insurance The Insurance Underwriter was launched on 30 January 2016 with a highly experienced team, state-of-the-art IT systems, a strong brand and a competitive pricing model. In the first year of business, we have underwritten 115,000 motor policies, expanding our market as the majority of customers are either new to the AA or have not been insured by us for more than ten years. We recently added home insurance underwriting as the proprietary data we have is relevant to both segments.
While the financial benefits are yet to become fully apparent, we are encouraged by our first year and continue to expect that we can build the business over the next few years, supported by a significant level of reinsurance to mitigate risk.
Our Underwriter’s ability to price competitively is also benefiting our broking business as volumes of new business increase.
Year 2 Building momentum for change
1 3
AA-branded Financial Services partnership growing and strengthening The relaunch of AA-branded Financial Services through our long-term partnership with Bank of Ireland (BOI UK) is going well and the relationship is continuing to grow and strengthen. Our customer offering combines BOI UK’s proven product development capability with the strength of the AA’s brand and our Membership base.
The AA’s Financial Services propositions focus on credit cards, unsecured personal loans, savings and mortgages and has already gained around 100,000 customers.
We are confident that we have the platform to rebuild our position in a market which was previously highly successful for the AA.
First class customer care, thanks.
2

AA plc Annual Report and Accounts 2017 21
Our B
usinessG
overnanceFinancial Statem
entsO
ur Performance
Reducing borrowing costsReducing Group borrowings and associated interest costsIt remains a key strategic priority to reduce Group borrowings and the associated cost of servicing that debt. The AA is highly cash generative and converts on average 100% of EBITDA to operating cash flow. We have very low working capital requirements and low levels of maintenance capital expenditure.
In the last two years, transformation capital expenditure has been significant. Higher levels of maintenance capital expenditure were also required before the transformation is fully realised. We now expect transformation capital requirements to reduce considerably, with approximately £20m to be invested in the 2018 financial year.
In the 2019 financial year, we expect no further significant transformation capital expenditure and for underlying maintenance capital expenditure to reach a normalised level. We expect to use our free cash flow to accelerate deleveraging.
During the year we undertook two major transactions which helped reduce the cost of borrowings:
Sale of AA Ireland and repayment of debt On 11 August 2016, we sold AA Ireland. It was an insurance broker-led business which differed significantly from the AA’s UK operations, allowing limited scope for synergies and cross-sell.
Net proceeds from the disposal of AA Ireland were £130m and allowed £106m of the Senior Term Facility to be repaid on 31 August 2016. Under the terms of our borrowings, we have held back £24m from the net proceeds in ring-fenced available cash to be used for potential future acquisitions. Any amounts not committed to an acquisition within 12 months from the AA Ireland completion date must be used to repay either Class A notes or the Senior Term Facility.
Extension of maturities and reduction of cash interest payments through refinancing Aligned with our strategy to reduce Group borrowings and associated interest costs, the refinancing in December not only successfully enabled annual savings to cash interest costs of £10m per annum, but also extended the maturities of a substantial proportion of our debt.
We raised £700m of new Class A5 fixed-rate notes due in 2022, priced at 2.9%, exchanging £300m of our Class A1 notes (due in 2018 and at a fixed rate of 4.7%) and £195m of the A4 notes (due 2019 and at a rate of 3.8%). In addition, under a Tender Offer we accepted £165m of Class B2 notes (due 2022 and at a fixed-rate of 5.5%). As a result, a meaningful portion of the AA’s Class A liabilities have been extended from 2018 and 2019 to 2022 and the aggregate principal of its subordinated Class B2 note liabilities reduced by £165 million.
…and see how much you could
SAVEon your mortgage
In-house Insurance Underwriter has brought new customers into our insurance business
A new MOT for Members’ mortgages launched during the first full year of our AA-branded financial services partnership with Bank of Ireland

22 AA plc Annual Report and Accounts 2017
Key performance indicators
High recurring revenue and cash flow generation arising from strong Trading EBITDA
Key strength Strategic objective
KPI Definition Data Executive directors’ Remuneration
£403m +0.2%
Trading EBITDA
The key measure of segmental performance is considered to be Trading EBITDA, being earnings before interest, tax, depreciation and amortisation and excluding exceptional items, items not allocated to a segment, discontinued operations and businesses held for sale. In the current period, items not allocated to a business segment principally relate to the difference between the cash contributions to the pension schemes for ongoing service and the calculated annual service cost and share-based payments.
Annual cash bonus 70% based on Trading EBITDA. Remaining 30% subject to Trading EBITDA underpin.
High cash flow generation
92% -9ppt
Cash conversion
Net cash inflow from continuing operating activities before tax and exceptional items divided by Trading EBITDA.
–
6.7x +4.3%
Leverage Ratio of net debt to Trading EBITDA for continuing operations for the last 12 months (see page 28).
Individual objective for cash bonus for CFO.
Reduce borrowings and associated interest costs
2.6x +8.3%
Interest cover
Trading EBITDA divided by total ongoing cash finance costs (see note 6).
Individual objective for cash bonus for CFO.
Reduce borrowings
0
100
200
300
400
500
20162017
403 402
Trading EBITDA (£m)
020406080100120
20162017
92 101
Cash conversion (%)
0
2
4
6
8
20162017
6.7 7.0
Leverage
0
1
2
3
4
20162017
2.6 2.4
Interest cover
Shareholder value +3%Total Shareholder Return (%)
Long Term Incentive Plans share performance condition.
Total shareholder return represents the change in closing value of a share held from the IPO to 31 January 2017 plus the value of any dividends paid during that period. This has been measured using the share price on initial admission of £2.50.
ACHIEVE STRONG FINANCIAL PERFORMANCE LEADING TO THE DELIVERY OF SUSTAINABLE SHAREHOLDER RETURNS
CREATE SHAREHOLDER VALUE
Our key performance indicators (KPIs)reflect the AA’s strong fundamental characteristics (listed in the Executive Chairman’s statement) and provide the basis of the transformation which we will deliver through our strategic priorities which are explained in the Strategic Journey. The KPIs below reflect both those fundamental characteristics and our progress against the strategic priorities. The performance underlying these KPIs is explained in Our Performance and the Financial Review.
Key strength Strategic objective
KPI Definition Data Executive directors’ Remuneration

AA plc Annual Report and Accounts 2017 23
Our B
usinessG
overnanceFinancial Statem
entsO
ur Performance
Key strength Strategic objective
KPI Definition Data Executive directors’ Remuneration
0
1,000
2,000
3,000
4,000
20162017
3,335 3,331
Paid personal Members (000s)
0
4,000
8,000
12,000
20162017
9,976 10,216
Business customers (000s)
Paid personal Members (millions)
Individual criteria of bonus of Executive Chairman.
Number of personal Members excluding free Memberships at the period end.
10.0m -2.3%
Business customers (millions)
–Number of business customers at the period end.
Market leader in Roadside Assistance
3.3m +0.1%
Number of employees in the UK that attended breakdowns.
Number of breakdowns attended.
Patrols –
Breakdowns attended (millions)
–
Scale and barriers to entry
Strong market positions in other segments
1.9m -9.4%
Insurance policies (millions)
–Total policies sold in the last 12 months excluding business customers within Home Services.
2,607 +1.3%
2,877 -0.1%
3.6m +5.1%
Number of driving school instructors at the period end.
Franchised driving instructors
–
0
500
1,000
1,500
2,000
2,500
20162017
1,8792,074
Insurance policies (000s)
05001,0001,5002,0002,5003,000
20162017
2,607 2,574
Franchised driving instructors
0
1,000
2,000
3,000
4,000
20162017
3,635 3,459
Breakdowns attended (thousands)
0
1000
2000
3000
4000
20162017
2,877 2,881
Patrols
STRENGTHEN THE AA AS THE PRE-EMINENT MEMBERSHIP SERVICES ORGANISATION IN THE UK AND REVOLUTIONISE CUSTOMER EXPERIENCE
0
50
100
150
200
20162017
158 156
Average income per personal Member (£)
0
4
8
12
16
20
20162017
2018
Average income per business customer (£)
Average income
Individual criteria of bonus of Executive Chairman.
Average income per personal Member excluding free Memberships.
£20 +11.1%
–Average income per business customer.
£158 +1.3%

24 AA plc Annual Report and Accounts 2017
ROADSIDE ASSISTANCE
Roadside Assistance reached an important milestone with the reversal of the long term decline of paid personal Members. Trading Revenue grew 2.5% and Trading EBITDA rose 1.1%.
Trading Revenue excluding business disposed of
£742m(£724m)
Breakdowns attended
Average income per paid Member
(excluding free Membership)
Average income per business
customer
Business Customers
Paid personal Members
(excluding free Memberships)
Trading EBITDA excluding business disposed of
£365m(£361m)
Trading EBITDA margin
49.2%(49.9%)
Our performance
3.6m(3.5m)
£158(£156)
£20(£18)
3.3m(3.3m)
10.0m(10.2m)
Headlines
Paid personal Members up 0.1% to 3,335k with retention increased to 82% and new business volumes up 14%
Income per personal Member rose 1.3% to £158 per Member driven by improved ancillary sales
Retained business contracts with Hyundai, Lotus and McLaren among others
Income per business customer up 11.1% to £20 per customer driven by increased breakdowns attended
Awarded Which? Recommended Provider status for both consumer and AA-provided manufacturer breakdown cover for the 11th year in a row
Overview
Roadside Assistance performance is driven by our highly valued personal Member base. However, business customers provide close to half the jobs for the patrol force, supporting the scale of our operations, which is critical to our success.
Roadside Assistance also includes additional services such as vehicle inspections, AA Cars, AA Tyres, connected car and publishing. Collectively these businesses generate approximately £5m of Trading EBITDA.
Financial performance
Roadside Assistance Trading Revenue grew 2.5% to £742m, driven by the increase in average income for both paid personal Members and business customers . We have turned around the long term decline of paid personal Members, reaching an important milestone in the return to growth since May. Average income per paid personal Member rose 1.3% to £158 (2016: 4.0% rise) driven by improved sales of ancillary products. With more parts sold by patrols, ancillary revenue rose 17% on the prior year. The 27% rise in battery sales volumes followed the adoption of the new testing equipment and payment processes, enabling higher service levels. The combination of enhancements to our product offering, more rational pricing, our higher profile through advertising, more highly valued customer rewards and our improved online capabilities has driven both new sales and retention. Revenue from new Members rose due to a 14% increase in new business volumes, driven particularly by our improved online capabilities. Our retention rate rose to 82% (2016: 81%). Improvements to the Membership proposition mean we are receiving fewer calls from Members requesting a review of their cover. Our Stay AA team have overcome some operational issues at the start of the year and continue to retain more of those who call and at lower discounts. We also grew revenue in the business-to-business segment, largely due to the 11% increase in revenue per customer. This is partly driven by the benefit of the rise in breakdown incidents under pay-for-use contracts and offsets a decline in business customers held with our banking partners. Trading EBITDA increased by £4m to £365m with revenue growth partly offset by increased breakdown incidents. Savings generated by efficiencies in the patrol force and call centres limited the cost impact from higher breakdowns to £6m. Trading EBITDA margin decreased from 49.9% to 49.2%.
Financial review p26

AA plc Annual Report and Accounts 2017 25
Our B
usinessG
overnanceFinancial Statem
entsO
ur Performance
INSURANCE SERVICES DRIVING SERVICES
Policy numbers includes Home
Services
Driving instructors
Average income per policy
Financial Services products
Trading Revenue
£131m(£131m)
Trading Revenue
£67m(£68m)
Trading EBITDA
£76m(£78m)
Trading EBITDA
£20m(£19m)
Trading EBITDA margin
58.0%(59.5%)
Trading EBITDA margin
29.9%(27.9%)
1.9m(2.1m)
£70(£63)
100k(33k)
2,607(2,574)
Headlines
Total policy numbers down 9% but experienced the first motor insurance policy growth since 2008, driven in part by the in-house Underwriter
Financial Services revenue increased as our partnership with the Bank of Ireland continues to build positive momentum
Our core products of motor and home insurance achieved the top five-star rating from Defaqto again
Overview
We arranged 1.9m policies last year for motor and home insurance andHome Services which provides emergency boiler and heating system repairs.We launched our in-house Insurance Underwriter in January 2016 to participate on the AA’s motor insurance panel and, from August, on the AA’s home insurance panel. Our Financial Services partnership with the Bank of Ireland builds on a long history of AA financial services.
Financial performance
Trading Revenue was flat at £131m with lower core insurance and Home Services revenue offset by growth in Financial Services. This performance does not, however, demonstrate the headway we have made in this division. Motor insurance achieved growth in policies for the first time since 2008, benefitting in part from new sales through our in-house Underwriter, which performed ahead of expectations. In its first year of business, we underwrote 115,000 motor insurance policies. The 9% drop in total insurance policies was driven by the planned decline in travel insurance which has lower average premiums than the rest of our portfolio. As result, total average income per policy rose from £63 to £70. Financial Services revenue increased as our partnership continues to build positive momentum utilising the inherent strength of the AA brand and marketing expertise of the AA. Trading EBITDA declined 2.6% to £76m due to higher marketing spend on insurance aggregators and a lower contribution from Home Services as we focus on future profitability over volume. These factors, along with the ramp-up of the Financial Services revenue, resulted in a lower Trading EBITDA margin of 58.0% (2016: 59.5%).
Financial review p26
Headlines
Driving School franchisee numbers increase due to improvements in franchise offering
Decline in number of speed awareness courses delivered by DriveTech
Profitability protected through efficiency savings
Overview
This division comprises Driving Schools and DriveTech. Through the AA and BSM brands the AA is the largest driving school in the UK and DriveTech is the market leader in providing speed awareness courses for police forces in the UK and fleet training services.
Financial performance
Driving Services Trading Revenue declined by £1m to £67m as the higher number of Driving School instructors partially offset a lower number of police speed awareness courses delivered by DriveTech.
The increase in Driving School revenue was in line with the 1% rise in the number of franchised instructors, a reversal of the recent decline. Improvements to our franchise proposition and the strength of the AA and BSM brands with learner drivers has helped this performance.
In DriveTech, revenue was affected by a decline in the number of speed awareness courses delivered, as police forces face funding constraints.
Despite the lower revenue, Driving Services Trading EBITDA rose £1m to £20m driven by efficiency savings.
Financial review p26
Trading Revenue was stable with lower core Insurance and Home Services revenue offset by growth in Financial Services . Trading EBITDA declined due to increased aggregator spend and a lower contribution from Home Services.
Driving Services reported a reduction in Trading Revenue with an increased number of driving instructor franchises offset by fewer speed awareness courses delivered. Trading EBITDA rose, driven by efficiency savings.

26 AA plc Annual Report and Accounts 2017
Financial review
REVENUE2017
£m2016
£m
Roadside Assistance 742 724Insurance Services 131 131Driving Services 67 68Insurance Underwriting – 2Trading Revenue 940 925Revenue from business disposed of – 10Exceptional revenue provision (7) –Group revenue 933 935
Trading Revenue grew 1.6% to £940m, compared with £925m last year. The increase in revenue reflects a robust performance by Roadside Assistance, which grew revenue by £18m or 2.5% through increased average income per personal Member and higher business-to-business revenue.
Revenue for the Group’s other segments was broadly flat on the prior year. In Insurance Services, lower revenue from Home Services and motor insurance was offset by increased Financial Services revenue as our partnership with the Bank of Ireland continues to build positive momentum. Driving Services’ revenue marginally declined due to a fall in the number of speed awareness courses delivered in the year through our DriveTech business. Insurance Underwriting revenue has declined as the income from the launch of our new in-house Insurance Underwriter was offset by an associated change of accounting treatment. The broker commission received on these policies, along with costs incurred, will now be recognised over the life of the policy along with the underwriter premium.
Group revenue also included £7m relating to a provision for duplicate breakdown cover. In addition, £3m was charged to exceptional finance costs bringing the total exceptional charge to £10m. See note 21 for further information.
TRADING EBITDA2017
£m2016
£m
Roadside Assistance 365 361Insurance Services 76 78Driving Services 20 19Insurance Underwriting (1) –Head Office costs (57) (56)Group Trading EBITDA 403 402Trading EBITDA margin (%) 42.9 43.5
Trading EBITDA was £403m, slightly ahead of the prior year result. Growth in Roadside Assistance was partly offset by a 5% increase in breakdown incidents in the year with a net £6m rise in associated costs. Insurance Services Trading EBITDA was affected by higher marketing spend on insurance aggregators and a lower contribution from Home Services as we focus on future profitability in preference to volume. The rise in Head Office costs reflects the impact of increased IT maintenance costs offset by efficiency savings.
We achieved cost savings of £12m in the year, bringing the cumulative savings to £20m. The Trading EBITDA margin reduced from 43.5% to 42.9%.
“The year ending 31 January 2017 was the second full year of the transformation of the AA and the turnaround we are seeing is indicative of the resilience of the business and of the effectiveness of our actions.”
Martin Clarke Chief Financial Officer

AA plc Annual Report and Accounts 2017 27
Our B
usinessG
overnanceFinancial Statem
entsO
ur Performance
OPERATING PROFIT2017
£m2016
£m
Group Trading EBITDA 403 402Items not allocated to a segment (20) (18)Amortisation and depreciation (67) (51)Exceptional operating items including impairment (32) (36)Operating profit from continuing operations 284 297
The £13m fall in operating profit is driven primarily by the increase in amortisation and depreciation.
The £2m increase in items not allocated to a segment is driven by a £7m increase in the share-based payments expense due to the first full year charge for grants made in the prior year under the long term incentive schemes for management. This was partially offset by a £5m decrease in the difference between the cash contributions to the pension scheme (set as part of the 2013 triennial valuation) and the calculated annual service cost (as per IAS 19).
Depreciation and amortisation increased by £16m to £67m reflecting increased IT transformation capital expenditure and the roll out of and use of the first phases of the IT transformation programme.
Exceptional operating items including impairment were £32m, largely comprising £14m of costs associated with the business restructuring and a £7m charge for duplicate breakdown cover.
FINANCE COSTS2017
£m2016
£m
Interest on external borrowings 147 159Finance charges payable under finance leases 8 7Total ongoing cash finance costs 155 166Ongoing amortisation of debt issue fees 5 4Net finance expense on defined benefit pension schemes 10 12Total ongoing non-cash finance costs 15 16Double-running interest on external borrowings – 19Debt repayment premium and penalties 2 62Transfer from cash flow hedge reserve for extinguishment of cash flow hedge 6 8Debt issue fees immediately written off following repayment of borrowings 4 18Duplicate breakdown cover - interest on refunds 3 –Exceptional finance costs 15 107Total finance costs 185 289
Total finance costs fell £104m, of which £60m was due to lower debt repayment premium and penalties and £31m due to lower interest on external borrowings.
The repayment of £106m of our Senior Term Facility in August 2016 and the refinancing undertaken in December 2016 will reduce our annual interest on external borrowings by approximately £5m and £10m respectively.
Taxation
The tax charge for the year of £26m is made up of a current tax charge of £20m and a deferred tax charge of £6m. The deferred tax charge includes a £2m charge due to the reduction in future corporation tax rates substantively enacted during the year. The effective tax rate was 22.0% (2016: 23.5%).
Profit and earnings per share
Profit after tax from continuing operations increased to £74m (2016: £1m loss) driven by the reduction in finance costs incurred in the year. As a result, basic earnings per share rose by 12.4p, from a loss of 0.2p to 12.2p.
Adjusted basic earnings per share were 21.3p (2016: 21.8p) with flat adjusted profit after tax marginally offset by an increased number of ordinary shares.
Profit after tax from discontinued operations related to the Irish business and was £80m, which included £7m operating profit, a tax charge of £4m and £77m from the profit on disposal.
CASH FLOW AND LIQUIDITY2017
£m2016
£m
Trading EBITDA 403 402Working capital (8) 12Other items (24) (8)Cash flow from continuing operating activities before exceptional items and taxation 371 406Discontinued operations 10 14Exceptional items and tax paid (36) (39)Acquisitions and disposals 99 (8)Cash flow from other investing activities (52) (63)Cash inflow from issue of share capital – 199Debt refinancing activities (102) (382)Interest on borrowings (143) (178)Cash flow from other financing activities (105) (85)Net increase in cash and cash equivalents 42 (136)Cash conversion (%) 92 101
The unfavourable movement in working capital of £8m resulted in cash flow from continuing operating activities before exceptional items and tax decreasing from £406m to £371m. Other items included the pension charge not allocated to a segment and working capital exceptional charges. Cash conversion remained healthy at 92% (2016: 101%).
Despite the continuing elevated levels of IT capital expenditure, the AA generated a net cash inflow for the year of £42m (2016: £136m cash outflow). This was a result of the receipt of proceeds from the disposal of our Irish business in August 2016 combined with lower cash outflows associated with debt refinancing activities and interest on borrowings. The cash balance has therefore increased to £211m (2016: £166m), held in AAA money market funds for easy access and high liquidity. The £150m working capital facility remains undrawn other than the £10m ancillary facility used to issue letters of credit to certain corporate insurance providers. We do not currently envisage needing to draw on the working capital facility for the foreseeable future.

28 AA plc Annual Report and Accounts 2017
We are required to hold segregated funds as “restricted cash” in order to satisfy regulatory requirements governing our regulated businesses, including the Insurance Underwriting business. These restricted cash balances have decreased to £23m (2016: £34m) principally due to the sale of the Irish business.
Capital management
The Group considers its capital to be a combination of net debt and equity. As at 31 January 2017, net debt was £2.7bn while the equity market capitalisation was £1.5bn.
The Directors seek to achieve an appropriate balance between the higher return that is possible with borrowings and the advantages and security of equity funding. We aim to reduce both the amount of net debt and the cost of servicing it over time.
As a highly leveraged public company, our intention remains to repay debt through trading cash flows to reduce overall gross borrowings. This is a key medium term focus for the business while maintaining our competitive advantage through investment in technology. The other strategic objectives are of equally high priority but require lower levels of cash to deliver. Given the continued strong cash generation of the business over many years, we do not have to trade these objectives off against each other.
The capital structure at 31 January 2017 is summarised below:
CAPITAL STRUCTUREExpected maturity date
Interest rate %
Principal £m
Senior Term Facility 31 January 2019 5.00 348Class A1 notes 31 July 2018 4.72 175Class A2 notes 31 July 2025 6.27 500Class A3 notes 31 July 2020 4.25 500Class A4 notes 31 July 2019 3.78 55Class A5 notes 31 January 2022 2.88 700Class B2 notes 31 July 2022 5.50 570Total borrowings 4.63 2,848Finance lease obligations 67Cash and cash equivalents (211)Total net debt 2,704Equity (valued at close on 31 January 2017) 1,486Total capital 4,190
The weighted average interest rate for all borrowings of 4.63% has been calculated using the effective interest rate and carrying values on 31 January 2017.
Excluding the remaining Class A1 and Class A4 notes, which are nearing maturity, we do not envisage making material early repayment of the other bonds because of the associated penalties. The substantial IT investment is modernising the business and will also substantially reduce the level of IT spend in subsequent years. Once this is complete, we expect to revert to more normalised levels of capital expenditure. This, together with very low working capital requirements, will significantly improve net cash flow.
We therefore expect to be able to make further repayments to our Senior Term Facility over its remaining life before refinancing any residue at or before maturity.
Net debt and dividends
NET DEBT
Year ended 31 January 2017
£m2016
£m
Senior Term Facility 348 454Class A notes 1,930 1,725Less: AA Intermediate Co Limited group cash and cash equivalents (136) (94)Net Senior Secured Debt1 2,142 2,085Class B2 notes 570 735Finance lease obligations 67 61Net WBS debt2 2,779 2,881Less: AA plc Group cash and cash equivalents3 (75) (72)Total net debt 2,704 2,809
AA plc Trading EBITDA 403 402AA Intermediate Trading EBITDA4 414 417
Net debt ratio5 6.7x 7.0xClass B2 leverage ratio6 6.7x 6.9xSenior leverage ratio7 5.2x 5.0x
Class A free cash flow: debt service8 3.3x 3.6xClass B free cash flow: debt service9 2.3x 2.4x
1 Principal amounts of the Senior Term Facility and Class A notes less AA Intermediate Co Limited group cash and cash equivalents.
2 WBS debt represents the borrowings and cash balances within the WBS structure headed by AA Intermediate Co Limited. This includes the principal amounts of the Senior Term Facility, Class A notes, Class B notes and finance leases less AA Intermediate Co Limited group cash and cash equivalents.
3 Total cash and cash equivalents for the Group excluding the value reported as the AA Intermediate Co Limited group cash and cash equivalents.
4 AA Intermediate Co Limited group Trading EBITDA including discontinued operations as required by the debt documents.
5 Ratio of Total Net Debt to AA plc Trading EBITDA for the last 12 months.
6 Ratio of Net WBS debt2 to AA Intermediate Trading EBITDA for the last 12 months.
7 Ratio of Net Senior Secured Debt1 to AA Intermediate Trading EBITDA for the last 12 months.
8 Ratio of last 12 months free cash flow to proforma debt service relating to the Senior Term Facility and Class A notes.
9 Ratio of last 12 months free cash flow to proforma debt service.
In order to comply with the requirements of the Class A notes, we are required to maintain the Class A free cash flow to debt service ratio in excess of 1.35x. The Class B2 notes require us to maintain the Class B2 free cash flow to debt service ratio in excess of 1x.
The Class A and Class B2 notes therefore place restrictions on the Group’s ability to upstream cash from the key trading companies to pay external dividends and finance activities unconstrained by the restrictions embedded in the financing documents.
The Class A notes only permit the release of cash providing the senior leverage ratio after payment is less than 5.5x and providing there is sufficient excess cash flow to cover the payment.
The Class B2 note restrictions generally only permit the release of cash providing the fixed charge cover ratio after payment is more than 2:1 and providing that the aggregate payments do not exceed 50% of the accumulated consolidated net income.
Financial review continued

AA plc Annual Report and Accounts 2017 29
Our B
usinessG
overnanceFinancial Statem
entsO
ur Performance
KEY CASH RELEASE METRICS2017 2016
Net senior leverage (AA Intermediate Co Limited group)1 5.2x 5.0xExcess cash flow2 £194m £165mFixed charge cover ratio3 3.0x 2.8xConsolidated net income4 £214m £197m
Note that the above table relates to the financial activities of the AA Intermediate Co Limited group and therefore may differ slightly from those of the AA plc Group.
1 Ratio of net Senior Secured Debt to Trading EBITDA of AA Intermediate Co Limited group for the last 12 months. This excludes AA plc Group cash and cash equivalents.
2 Cumulative free cash flow, since 1 February 2013, reduced by dividends paid by the AA Intermediate Co Limited group and adjusted for items required by the financing documents.
3 Ratio of fixed finance charges to Trading EBITDA.
4 Cumulative profit after tax, since 1 May 2013, adjusted for items required by the financing documents and reduced by dividends paid by the AA Intermediate Co Limited group.
Pensions
As at 31 January 2017, the Group’s defined benefit pension schemes net liabilities under IAS 19 were £395m, an increase of £99m since 31 January 2016. This increase is largely due to the reduction in the corporate bond yields, which we are required to use as the discount rate for calculating these liabilities. The deficit is, however, a reduction from the £622m reported at 31 July 2016, a result of an increase in corporate bond yields since that date as well as changes to actuarial assumptions.
A triennial valuation of the UK pension scheme was carried out at 31 March 2016 and whilst the final results are not yet confirmed, the assumptions used for the year end IAS 19 pension valuation have been updated to reflect the assumptions adopted by the Trustees during the triennial valuation. In the meantime, the asset-backed funding scheme deficit reduction contributions will continue to be paid. These contributions were £13m in the 2017 financial year and will increase annually by the rate of inflation. During the 2017 financial year there was an additional one-off contribution of £6m, bringing total deficit reduction contributions for the UK pension scheme to £19m.
Viability statement
The Board has assessed the prospects of the Company in the context of the current financial position of the Group and the Principal Risks described on pages 32 to 35. This assessment was considered in the context of the Group’s strategic planning over a period of three years from February 2017. The Directors considered a number of potential downside scenarios to the Group’s plan. These related to the Principal Risks on a scale of the potential impact based on the probability of occurrence.
The ability of the Group to refinance its debt on the various expected maturity dates (as disclosed in note 20) is a key assumption within this assessment. Following the refinancing in December 2016, the Group has significantly reduced the amount of borrowings due within the next three years, however, the Group will have to refinance £175m of Class A1 notes (due July 2018), £55m of Class A4 notes (due July 2019) and £348m of the Senior Term Facility (due January 2019) over this period. The Directors continue to believe that, given the high liquidity of the sterling bond markets, the recent strong take-up of the new Class A5 notes issued in December 2016 and the strong cash flows of the business, the likelihood of an inability to refinance is very low. In addition, the Directors would expect to refinance these borrowings in advance of the due date so that the Group continues to have access to a number of refinancing opportunities including bond issues, bank borrowings and repayment from existing cash resources. If the Class A notes or the Senior Term Facility are not repaid within 12 months of their due date, then the WBS group will be restricted in its ability to pay dividends until those borrowings are refinanced.
As a highly leveraged business, the Group is subject to loan covenants as well as the requirement to pay liabilities when they fall due. The plan and downside scenarios were therefore assessed in this context and the business remained comfortably able to make payments and comply with covenants over the forecast period.
Finally, the Board considered what level of stress would cause the business viability to be put into question by means of a reverse stress test. This indicated that the viability of the business would be threatened by an unexpected cash outflow of c£240m during each year of the three year plan, as this would bring the Group close to its debt covenants. Any usage of free cash flow on deleveraging over this three year period will reduce this headroom. The Directors felt it unlikely that an unexpected outflow of this magnitude would occur.
Having considered all these elements of the assessment carefully, the Board has a reasonable expectation that the business will continue in operation and meet its liabilities as they fall due for at least as long as the strategic planning time horizon.
Martin Clarke Chief Financial Officer

30 AA plc Annual Report and Accounts 2017
Risk management
Effective risk management is key to the delivery of the AA strategic objectives.
AA Risk Management Framework
Risk RegistersOur Risk Management Framework Policy requires all areas of the business to maintain a risk register which is to be reviewed at least quarterly. Each senior member of the Management team has his/her own set of “Top Risks” which are reviewed each month. Risks from this “bottom up” risk identification exercise are linked to the principal risks identified by the AA plc Board which are documented in this Annual Report & Accounts on pages 32 to 35. Each risk register ‘owner’ is required to formally self-certify the completeness and correctness of their risk register(s) on a quarterly basis. This helps underpin the Risk Management Framework.
Risk assessmentEach identified risk is assessed and scored for probability and impact, both inherently (i.e. without controls) and residually (i.e. with controls). A target risk score is also set. If the residual risk score is higher than the target score, then appropriate management action is taken to ensure our risk exposure is at the desired target level.
Incidents and near missesAn important part of the Risk Management Framework is the identification and reporting of incidents and near misses which help inform our assessment of risk and helps highlight areas for control improvement actions. The AA encourages and fosters a culture of open and honest incident and near miss reporting.
Key risk indicators/tolerancesThe Risk Management Framework is also supported by key risk indicator management information. This is used to monitor the position against our desired risk exposure and to monitor trends and changing factors enabling us to take early corrective action. Where applicable, tolerance levels have been set for risks. Management information reporting provides regular updates to ensure that the risk exposure remains within the desired tolerance level, or is brought to the attention of the relevant management for corrective actions to be agreed and monitored to completion.
Control verificationThe effectiveness of primary control(s) for key risks are verified by the operation and reporting of management “snap checks” (control effectiveness tests).
Remedial actionsManagement actions are documented, implemented and reported to the appropriate risk forum and tracked to resolution, if any of the following issues arise:
Risk exposure greater than desired target;
An incident or near miss occurs that indicates a control deficiency or previously undocumented risk exposure;
Adverse key risk indicator / tolerance reporting;
Adverse ‘snap check’ results;
Deficiencies arising from audit, compliance and other reviews.
Principal risksThe Directors have carried out a robust assessment of the principal risks facing the Group, including those that would threaten its business model, future performance, solvency or liquidity. Inputs to the assessment include the strategic objectives of the AA, internal and external factors, and the risks identified by management. These principal risks have been monitored and updated by the Risk Committee during the year. These risks are detailed below together with the key mitigating actions / controls, a summary of changes during the year and the primary key performance indicators (KPIs).
Risk appetiteThe risk appetite for the AA is documented and approved by the Board. The AA’s Risk Appetite Framework policy defines the amount of risk the organisation is willing to take in achieving its strategic objectives.
The AA brand and the positive perception and promotion of the AA brand are key to the continuing success of the AA. The Group therefore seeks to mitigate, control or avoid risks which may have a negative impact on the brand.
Many of the AA’s activities relate to successfully managing logistics – roadside repair and recovery, arranging suitable insurance and financial products. Our customers trust us to source / provide products and services which deliver desirable customer outcomes.
The AA relies on a number of business partners and believes they should be fairly treated and that the AA should ensure that these partners provide services and products of a suitable standard to both the AA and AA Members.
With our heritage as a Membership organisation, we have a strong sense of customer fairness and therefore seek to avoid potential conduct risk, unethical behaviours and unfair customer outcomes.

AA plc Annual Report and Accounts 2017 31
Our B
usinessG
overnanceFinancial Statem
entsO
ur Performance
The AA will accept a considered and balanced exposure to risks in order to acquire, grow or defend market share.
The AA has a zero appetite for systemic non-compliance with Legal and Regulatory requirements.
We are exposed to movements in the market value of assets (particularly asset values in the Pension Fund) and interest rates on a proportion of our debt. We do not take market risks for reward and use appropriate risk management techniques to reduce the effects of market risk on the Group including interest rate hedging.
The AA seeks to obtain the best available return on its cash commensurate with taking very little risk and minimising credit risk exposure to any one particular institution and by maintaining a balanced investment portfolio.
The AA seeks to ensure that sufficient liquidity is always available to meet the immediate requirements of the Group.
Appropriate and effective business risk reporting has been put in place to track the position against risk appetite. These reporting arrangements are regularly reviewed for adequacy and effectiveness.
Three lines of defenceThe Company practises the “three lines of defence” model in embedding risk management capability across the organisation. The model distinguishes between functions that own and manage risks, functions overseeing risks and functions providing independent assurance. All three lines of defence have specific tasks in the internal control governance framework. In this model, risk management and control is the first line, oversight challenge is the second and independent assurance is the third.
Control assurance mapOur control assurance map takes information from the risk and control output of the first line of defence to highlight the most significant risks and to indicate any areas where controls are not operating effectively or there have been risk incidents. The map also contains the principal risks identified by the Board. Onto this we map the second line – Compliance and Risk Monitoring – and third line – Internal Audit – assurance activity for the current year, prior year and year ahead to provide a view on the coverage of these assignments as well as the ratings of those assignments that have been completed. This is designed to help ensure the assurance plans cover the appropriate areas.
STRATEGIC RISKSHORIZON (EMERGING) RISKS
TRANSITIONAL RISKS
CORE BUSINESS
RISKS(inc. Evolving
Risks)
Assess Probability, Impact & Speed of
Onset
AgreeMaximum
TargetExposure
Report
Monitor for Change/
Evolution
Mitigate/Control
Identify / review risk
The AA uses a bullseye risk model to guide the business in the identification of risks to the organisation. This considers core, transitional, strategic and horizon/emerging risks
Core risks The risks that are a daily part of our business activities (business as usual risks). They may be constant or may be evolving over time.
Transitional risks The risks that are present as a result of initiating and making changes.
Strategic risks Any risk that may adversely impact upon the delivery of a strategic objective.
‘Horizon’ (or emerging) risks New/potential threats or opportunities that we need to prepare for. (These are also considered as part of the strategy and three year planning process.)
Risk Model

32 AA plc Annual Report and Accounts 2017
Principal risk DescriptionRelated strategic objectives Mitigation
1. Outstanding service We are unable to maintain an outstanding service
2. Roadside market share and margin We are unable to maintain our market share and an ability to command a price premium on our roadside services
3. Growing the business We are unable to grow the business in a manner that complements and sustains the brand
4. Insurance business Insurance broking business: Aggregators and price comparison sites will further damage the insurance broker model
6. Regulatory environment A changing regulatory environment may adversely affect our activities
5. Insurance Underwriting Higher than anticipated claims costs
The AA’s brand and its continued success, and in particular the loyalty of our customers, rely on delivering outstanding service that is superior to the rest of the market. Historic inadequate investment in technology, systems and processes would place this objective at increasing risk if this issue was not addressed with sustained improvements to deliver the services our Members expect.
Market leader in Roadside Assistance
Competitors that provide roadside services at a lower price or have a different business model together with changes in car technology, threaten our roadside market share. If we charge a price premium that is above what our service can sustain, we will not grow customers and therefore in the long-term, sustainably grow profits. We need to improve, innovate, demonstrate and deliver a superior proposition and ensure our pricing is competitive relative to this position.
We may be unable to develop and grow new profitable business products and lines that complement the customer experience and which demonstrate standards and values that underlie our core brand.
The changing regulatory environment could cause currently compliant services to become non-compliant, with material implications to customer offerings, pricing and profitability. Failure to comply with regulatory obligations could result in substantial fines.Changes in Government legislation or taxation could impact the business model.
The further growth of price comparison sites may continue to transfer value from our insurance broking business.
There are risks of higher than expected claims frequency, higher average cost per claim and catastrophic claims.
Market leader in Roadside Assistance Scale and barriers to entry
Market leader in Roadside Assistance Strong market positions in other segments Shareholder value High cash flow generation
Market leader in Roadside Assistance Strong market positions in other segments
Strong market positions in other segments
Strong market positions in other segments Shareholder value
We will continue to protect the ability of our Patrols to provide excellent service through providing them with good connectivity to state of the art scheduling systems, investing in in-van technology and equipment, and providing excellent training and support.Ongoing monitoring of complaints, press reports and social media through structured processes, including Compliance and Risk oversight, helps inform our service performance and offerings.
We are improving our roadside Membership proposition by strengthening our roadside products and engaging more Members in additional benefits.We have put in place processes for significantly more effective advertising campaigns and are starting to use new CRM systems to improve our communications with Members, which includes engaging Members in their existing services and benefits to drive loyalty.We have built a pricing team with significant expertise to monitor market pricing levels.
We continue to pursue new opportunities that complement our core brand. Proposed new products and changes to existing products are put through our product development process and are reviewed by the Product Outcomes Forum, (which meets 10 times a year) and includes Executive and senior attendees from the various business areas together with Compliance and Risk oversight.
The AA has a zero appetite for systemic non-compliance with Legal and Regulatory requirements.Close engagement with regulatory objectives is coupled with good governance and strong monitoring processes to ensure that we continue to focus on delivering products and services that result in good customer outcomes.Regular dialogue is maintained with the FCA and other regulatory bodies.Our Regulatory and Legal Change Committee tracks forthcoming changes and advises the business on changes required.Products are reviewed regularly to reaffirm they are fit for purpose.
We are using our strengths in the brand, channels and data to mitigate this risk. Insurer hosted pricing enables our in-house underwriter to make more dynamic and frequent price changes. In time, other members of our broking panel will also use this functionality which should improve our competitiveness.
Best practice is deployed to manage claims frequency, development and costs. The solvency structure plus excess of loss reinsurance is used to help protect us against costly individual claims.
Risk management continued

AA plc Annual Report and Accounts 2017 33
Our B
usinessG
overnanceFinancial Statem
entsO
ur Performance
Primary KPIs (see pages 22 and 23)Change in the year Impact, likelihood and trend
Patrols Breakdowns attended
Paid personal Members Business customer numbers Patrols Breakdowns attended Average income
Paid personal Members Insurance policies Franchised Driving Instructors Trading EBITDA Total Shareholder Return
Insurance policies
We have updated and rolled out our operational deployment system, AA Help, to our Patrols, providing improved deployment and control, as well as continuing to invest in new vans and in-van technology.Our AA breakdown app has now been downloaded by more than one million personal Members and is being actively used in 22% of breakdowns.Our connected car technology trials have proved our ability to predict some breakdowns and this should enable us in the future to further improve the service we offer our members.
The long term decline in paid personal Members has been stabilised.The majority of our roadside Membership products now include unlimited call outs (subject to fair usage) as well as other enhancements. Our Members are now using new added value benefits developed over the last two years, which go beyond the core breakdown services and which further enhance their Membership experience, at a run rate of 1m per year.Recent increases in IPT present a cost to the business and a choice to either take a profit or market share hit. For our consumer roadside business, as the market leader, the effect of IPT rises would be equivalent to a straight tax on our margins if we did not pass the increase on.
The Financial Services business through our arrangement with the Bank of Ireland continues to provide a range of new products.
Pricing transparency at renewal is required by the FCA from 1 April 2017. The AA is preparing for this. As we implement the transformation programme, issues may be identified which relate to historic past practices that may fall short of putting customers at the heart of our business. One issue we found relates to duplicate breakdown cover. We contacted the FCA and we have agreed remediation plans for this issue with them. The extent of this matter became clear through the improved data and process understanding we are gaining through the implementation of our new Customer Relationship Management (“CRM”) systems and our improved culture and conduct focus.
Our new insurance underwriter is widening the reach of AA Insurance. The success of the underwriter has also contributed to the first increase in motor policy numbers within our broking business since 2008.
Our new in house underwriter which was launched in January 2016, (a member of our Broking panel) has grown its Motor book and launched its Home book.
Delivering outstanding service is fundamental to our future and our brand. The impact of failure to deliver the best service in the market would be very high. The actions we have taken in the last two years and have planned for the future continue to substantially reduce the probability of this risk crystallising.
Long-term the AA will find it challenging to grow profit sustainably if its Membership is declining. Therefore, the impact of Membership growth is critical in the long-term. The AA has stabilised a multi-year declining trend in membership numbers in the last 12 months. Rises in IPT present headwinds to building additional momentum in the short-term but the business is focused on realising a sustainably growing Membership.
The immediate impact is low as this is more a long term matter. In the long term without our effective control framework which is in place, our products would become uncompetitive, less relevant to the market place and fail to keep pace with Member and customer needs.Early indications are that the steps we have taken to grow the business are generating value.
The regulatory environment is expected to continue to be dynamic with a continuing programme of regulatory initiatives. These additional requirements may drive further commoditisation into the market at the expense of superior service differentiation. Continued increases in IPT could make insurance products including Roadside Assistance less affordable for our customers.
The competitive threat from aggregators remains unchanged, however the success of our in-house insurer and the adoption of insurer hosted pricing gives us a better process to respond to this threat.
The occurrence of very large one-off claims is expected to be rare but can be more common than predicted and so we have reinsurance processes in place which cap our maximum exposure per claim. The occurrence of smaller claims is built into our pricing models and is carefully monitored
Key: Impact, Likelihood and Trend
Improved since last year
Same as last year
Deteriorating position

34 AA plc Annual Report and Accounts 2017
Further information on financial risk management objectives and policies, including market, credit and liquidity risks is included in note 28 of the financial statements. Details on the Group’s strategic objectives are included on pages 14 to 21.
Risk management continued
Principal risk DescriptionRelated strategic objectives Mitigation
We must continue to transform the AA to achieve the required efficient customer centric services and to develop the business. There is still much to do and the required acceleration of improvements to process, embedded ways of working and culture, inherently involves risks in a customer facing service environment.
Market leader in Roadside Assistance Strong position in other segments
Market leader in Roadside Assistance Strong market position in other segments
High recurring revenue and cash flow generation arising from strong Trading EBITDA High cash flow generation Reduce borrowings and associated interest costs
Market leader in Roadside Assistance Strong market position in other segments
An essential programme of renewal and enhancement of our IT estates is in progress to address the risks to our brand and our competitive capability. The work is extensive and involves a continuing complex programme of work. Given the scale and complexity, the programme involves inherent risks to the timely delivery of this implementation.
Critical information is not available where and when it is needed. The integrity of critical information is corrupted or the confidentiality of commercially sensitive, private or customer information is compromised by inappropriate disclosure. A serious data breach occurs.
The Company is unable to repay or refinance its debt at an acceptable price.
The Company has a large pension scheme, currently in deficit, whose assets and obligations are subject to future variation from investment returns, longevity and other similar factors.
There is an ongoing cost efficiency and process improvement programme in place with progress tracked at regular Management Business Reviews.A rigorous approach is taken in implementing changes to achieve satisfactory control with ongoing monitoring and reporting.As we continue with our transformation initiatives they may occasionally highlight processes that are not compatible with the values of the AA. Where this is the case, steps are taken to ensure the way we undertake business is fit for purpose going forward to achieve our objectives and deliver appropriate customer outcomes. We have a talent management model in place, where skill gaps are identified and development and/or recruitment interventions are actioned.
Proven methodology with specialist IT development skills is in place to manage this risk. The programme is being led by executives with a proven track record in IT transformation.The programme is subject to considerable scrutiny by the executive management team and regular progress reports are reviewed by both the Risk Committee and the Board.
The AA has an ongoing programme of security improvements to try and maintain a suitable level of security for the increasingly sophisticated world-wide cyber threats. Controls include information security awareness training, preventative and detective security, a specialist information security team, and information security requirements being included in third party arrangements.The AA benchmarks its security controls against the Center for Protection of National Infrastructure (CPNI) and associated Critical Security Controls (CSC).
We have strong recurring cash flows which support the current capital structure, and which will enable us to reduce leverage over time in line with our stated strategy. The UK pension scheme is supported by a company covenant and the assets and obligations of the scheme are kept under review.
7. Business transformation We are unable to successfully complete the essential business transformation
8. IT transformation We are unable to successfully deliver the essential IT transformation required
9. DebtThe AA is a highly leveraged company with a substantial pension fund, currently in deficit
10. Information Security/ Cyber Crime/ Data breach There is an increasing threat of cyber-attacks on organisations

AA plc Annual Report and Accounts 2017 35
Our B
usinessG
overnanceFinancial Statem
entsO
ur Performance
Key: Impact, Likelihood and Trend
Improved since last year
Same as last year
Deteriorating position
Change in the year Impact, likelihood and trendMitigation
Leverage Cash conversion Interest cover Trading EBITDA
The transformation programme has enabled us to implement synergies and efficiencies in our systems, support functions and management structure. The recruitment, training and employee assessment processes have all been improved to help ensure we maximise employee performance.
The IT transformation programme has continued to make progress. We have substantially reorganised our IT department, outsourcing a number of functions to achieve a more efficient and cost effective service.Sales through our digital channel grew significantly and our new CRM (Customer Relationship Management) system will enable us to undertake better targeted marketing campaigns. Replacement of our main customer sales and service systems is progressing.
While the AA has continued to improve information security controls during the 2017 financial year we still consider this risk to be increasing due to the ongoing number of high profile cyber-attacks on organisations.The move to the new CRM system will reduce the risk of data breach when fully implemented.As previously reported we consider this to be an emerging/evolving risk and will continue to take additional steps to improve our controls taking guidance from external specialists.
The proceeds from the sale of our Irish business enabled us to make a reduction to our group debt of £106m. The Company also completed a further debt restructuring this year taking advantage of the low interest rate environment to reduce near term debt. This significantly reduced the amount of debt due within 30 months of 31 January 2017 from £1,179m to £578m and reduced the average cost of debt from 4.97% to 4.63%. This refinancing is in line with the AA’s strategy to reduce the cost of its borrowings and resulted in annualised interest savings of approximately £10 million. Whilst the Company remains highly leveraged, this further restructuring improves the ability of the Company to manage unforeseen financial shocks. The triennial valuation of the UK pension fund as at 31 March 2016 is still in discussion with the pension trustees and will be finalised by June 2017. Since 31 July 2016, the IAS 19 valuation of the UK Pension Scheme deficit has fallen from £547m to £325m at 31 January 2017 in line with the increase in corporate bond rates in the second half of the year.
Failure to successfully transform the business would have a significant impact on our long term growth.If changes are poorly implemented, it would have a significant negative impact on customer service and employee relations, including the patrol force which plays such a significant part in delivering the high standard of customer service.To prevent failure, strong management and oversight have been put in place to manage this risk.
New IT systems are key to the successful ongoing development of the AA. The adverse impact of a material delay to the implementation of the programme would be high.
As for any company the impact of this risk crystallising could be substantial. The external environment appears to be increasingly hostile to all businesses with cyber-attacks on companies continuing to be more sophisticated and more frequent.
If this risk materialised, the Group’s bondholders would appoint an administrative receiver to run the business for cash until all secured debt is repaid. However, the AA continues to be a high cash generating organisation and the likelihood is therefore very low, and, as in the previous financial year, this risk has reduced following the most recent debt restructuring.
With the potential continuing volatility in the markets and global economic uncertainty the likelihood of the risk of increasing pension deficits is seen as high.
Primary KPIs (see pages 22 and 23)

36 AA plc Annual Report and Accounts 2017
The AA’s commitment to corporate responsibility
“Patrols spread our culture of courtesy, care, expertise, collaboration and dynamism to our Members.”
Edmund V King OBE AA president
Transforming our corporate responsibility
As president, I lead our campaigns on road safety and environmental issues, as well as heading up our Charitable Trust which feeds into our action on corporate social responsibility.
We’ve gone through a huge transformation this year, and continue to strengthen how we operate in a more sustainable and ethical way, including through our approach to governance, risk management, our people, and health and safety. We’ve embedded this deeply in our culture, business values and behaviours. Some of the main highlights have been:
Early development of a more formal approach to sustainability
The introduction of a new programme focusing on safety, supported by new technology that helps manage safety in our business.
A more environmentally focused approach to company car management.
A new approach to recruitment, using our culture as a core part of the process, and greater support for management in the development of people and culture.
A new code of conduct for suppliers, focused on the ethical delivery of service.
Concerns of drivers
Part of our role at the AA is to help address the current concerns of drivers and to guide them to a future where they can fully benefit from the new technology on the horizon. The car is in a state of transformation. There is much talk of connected cars, driverless cars, electric cars and/or on-demand cars. Despite all the buzz words, the concerns of drivers are still pretty much the same, with congestion, road conditions, costs and casualties still the main issues.
We gauge their views through the biggest dedicated motoring opinion panel in Europe, the AA Populus Driver Poll, which produces monthly state of the driving nation reports from 20-30,000 drivers. This polling helps us to address crucial safety and environmental issues.
The partnership we launched with Chargemaster, the biggest name in electric vehicle (EV) charging, will help our customers get to grips with some of their anxieties shown in our polls over electric cars. Hopefully, my “Living with an Electric Vehicle” blog will also help.
The AA app can save Members ten minutes if they break down and they can track their patrol. It also helps Members to find the cheapest parking or fuel.
Our 10,000 driver trial of connected car technology helps us and our customers to understand some of the future trends. In terms of road safety, our campaign to get double the number of lay-bys on “Smart” motorways without hard shoulders has led to a Government review of the situation.
The AA Charitable Trust uses innovative ways to influence driver behaviour over issues such as the use of mobile phones at the wheel and cycle/motorcycle safety. We are also funding Drive Motorway – a motorway safety course aimed at nervous drivers or those afraid of using “smart” motorways without hard shoulders.
Our patrols are our roadside ambassadors who often feedback to us what is happening on the front line, whether it is plagues of potholes, cones and congestion or great campaign ideas. They embody our culture of courtesy, care, expertise, collaboration and dynamism.
Despite all the talk about driverless cars, the majority of our members still enjoy driving and we aim to do what we can to enhance that pleasure. We will continue to look out for our Members because anything can happen.
Edmund V King OBE AA president AA Charitable Trust director Visiting professor of transport, Newcastle University

AA plc Annual Report and Accounts 2017 37
Our B
usinessG
overnanceFinancial Statem
entsO
ur Performance
Sustainability and corporate responsibility programmeFor the first time in the AA’s history, a policy on sustainability and corporate responsibility has been introduced. This sets out the fundamental way we operate to ensure that Members and staff are kept safe and treated fairly, that the environment is protected as far as possible and that we support local and global communities.
During the 2018 financial year, we will develop a formal strategy, seeking engagement with a range of stakeholders to ensure it supports the operation, meets our investor and shareholder expectations and demonstrates to our Members and the wider public that sustainability and corporate responsibility are embedded in everything we do.
As evidence of the AA’s commitment to sustainability, we are a member (Rated Supplier number : 101639) of the CIPS Sustainability Index which is an independent, cross-sector financial, social and environmental supplier audit run by the Chartered Institute of Procurement and Supply. Our rating in the 2016 calendar year has shown good improvement in the three key sustainability categories relating to the provision of roadside services. The sustainability index also allows a benchmark comparison against similar companies and we are achieving above average scores in all three categories.
2016
2015
Safety incident reports
Near misses RIDDOR Accidents
Safety Our people
We continue to maintain our record of zero fatalities and the number of major injuries we report to the Health and Safety Executive (HSE)remains lower than the national rate for industries operating in a similar environment.
Following a change in reporting procedures to encourage a focus on safety with our patrols, we have seen an increase both in near misses being reported but also accident numbers. We have taken this seriously, carrying out investigations to establish the root cause of this increase so we can take targeted action. We have developed a detailed safety plan to ensure delivery of the actions and to enable us to measure our success.
At the heart of the plan is the commitment to develop a safety culture in which empowerment and accountability are central at all levels and our people are able to take any actions to improve them.
Great progress has been made during the year and, as a result, we have seen our performance improve and accident numbers decrease in the latter part of the year. The key achievements that have driven this improvement are:
Reportable accidents* 2%General accidents 12%Near misses 86%
Incident performance
* reportable to the HSE under the requirements of the Reporting of Injuries, Diseases and Dangerous Occurences Regulations (RIDDOR)
Continuous improvement
in HS&E performance
Simplify HS&E for all to use /
understand
Proportional, proactive HS&E
management that adds value
Everyone owns and actively
manages HS&E
HS&E Excellence
Mission achieved
Sus
tain
ablc
eCom
petit
ive
Adv
anta
ge
Performance Improvements and Cost Savings
Our mission for health, safety and Environment (HS&E) 1. Keep our customers and staff safe and play our
part in looking after the environment
2. Achieve proactive management of HS&E risks, preventing issues before they occur
3. Be recognised as an industry leader in HS&E
Safety campaign: We launched the “Take Care” campaign which embeds one of the Group’s core values, that of Care, into everything we do. Initial roll out has been to the AA’s Roadside Assistance operation and we plan to roll out best practice across the rest of the business next year. This campaign has been fully supported by the Independent Democratic Union, the only recognised union within the AA.
Communications: Improvements in safety communications were delivered, ensuring that how we engage with our workforce is effective and drives change.
Training: We have changed the way in which we engage with patrols in regard to their safety through training. We have redeveloped induction training to ensure that we embed the core values and safety culture, driving empowerment and ownership from day one.
Engagement: Following the recent investment in technology, we are now engaging with our patrols on health and safety issues in more modern ways. We recently achieved a 75% engagement level in an online survey regarding tools and equipment.
Reporting incidents
We have transformed how incidents are reported by staff and investigated by managers with the provision of statistical analysis to enable improvements to be identified. The system is fully automated and allows access to real-time data on accident and incident performance.
NB: The AA reporting year is January to December
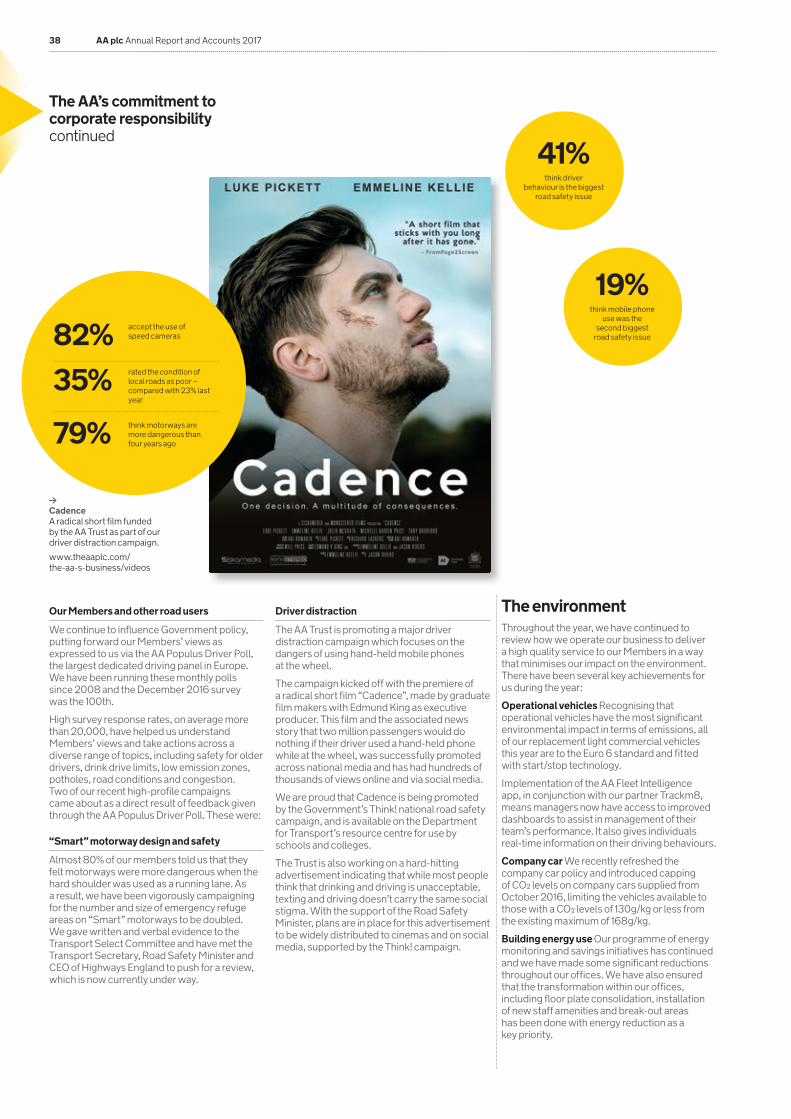
38 AA plc Annual Report and Accounts 2017
Our Members and other road users
We continue to influence Government policy, putting forward our Members’ views as expressed to us via the AA Populus Driver Poll, the largest dedicated driving panel in Europe. We have been running these monthly polls since 2008 and the December 2016 survey was the 100th.
High survey response rates, on average more than 20,000, have helped us understand Members’ views and take actions across a diverse range of topics, including safety for older drivers, drink drive limits, low emission zones, potholes, road conditions and congestion. Two of our recent high-profile campaigns came about as a direct result of feedback given through the AA Populus Driver Poll. These were:
“Smart” motorway design and safety
Almost 80% of our members told us that they felt motorways were more dangerous when the hard shoulder was used as a running lane. As a result, we have been vigorously campaigning for the number and size of emergency refuge areas on “Smart” motorways to be doubled. We gave written and verbal evidence to the Transport Select Committee and have met the Transport Secretary, Road Safety Minister and CEO of Highways England to push for a review, which is now currently under way.
The AA’s commitment to corporate responsibility continued
Driver distraction
The AA Trust is promoting a major driver distraction campaign which focuses on the dangers of using hand-held mobile phones at the wheel.
The campaign kicked off with the premiere of a radical short film “Cadence”, made by graduate film makers with Edmund King as executive producer. This film and the associated news story that two million passengers would do nothing if their driver used a hand-held phone while at the wheel, was successfully promoted across national media and has had hundreds of thousands of views online and via social media.
We are proud that Cadence is being promoted by the Government’s Think! national road safety campaign, and is available on the Department for Transport’s resource centre for use by schools and colleges.
The Trust is also working on a hard-hitting advertisement indicating that while most people think that drinking and driving is unacceptable, texting and driving doesn’t carry the same social stigma. With the support of the Road Safety Minister, plans are in place for this advertisement to be widely distributed to cinemas and on social media, supported by the Think! campaign.
19%think mobile phone
use was the second biggest
road safety issue82%35%
79%
accept the use of speed cameras
rated the condition of local roads as poor – compared with 23% last year
think motorways are more dangerous than four years ago
Cadence A radical short film funded by the AA Trust as part of our driver distraction campaign.
www.theaaplc.com/the-aa-s-business/videos
The environmentThroughout the year, we have continued to review how we operate our business to deliver a high quality service to our Members in a way that minimises our impact on the environment. There have been several key achievements for us during the year:
Operational vehicles Recognising that operational vehicles have the most significant environmental impact in terms of emissions, all of our replacement light commercial vehicles this year are to the Euro 6 standard and fitted with start/stop technology.
Implementation of the AA Fleet Intelligence app, in conjunction with our partner Trackm8, means managers now have access to improved dashboards to assist in management of their team’s performance. It also gives individuals real-time information on their driving behaviours.
Company car We recently refreshed the company car policy and introduced capping of CO2 levels on company cars supplied from October 2016, limiting the vehicles available to those with a CO2 levels of 130g/kg or less from the existing maximum of 168g/kg.
Building energy use Our programme of energy monitoring and savings initiatives has continued and we have made some significant reductions throughout our offices. We have also ensured that the transformation within our offices, including floor plate consolidation, installation of new staff amenities and break-out areas has been done with energy reduction as a key priority.
41%think driver
behaviour is the biggest road safety issue

AA plc Annual Report and Accounts 2017 39
Our B
usinessG
overnanceFinancial Statem
entsO
ur PerformanceSource of emissions
tCO2e (2017)
tCO2e (2016)
% change to 2016
Scope 1 emissions*(direct combustion of fuels in stationary and mobile sources, and fugitive emissions) 45,178 43,740 +3%Scope 2 emissions, market-based**(emissions from generation of purchased emissions in owned or controlled equipment & operations, using a supplier-specific emission factor) 5,480 7,577 -28%Scope 2 emissions, location-based(emissions from generation of purchased emissions in owned or controlled equipment and operations, using a regional emission factor) 4,887 6,514 -25%Total emissions (market-based) 50,658 51,317 -1%Out of scope emissions(emissions from the biofuel content in forecourt diesel and petrol) 996 1,390 -28%Fleet intensity measurement (tCO2e/job)(emissions from operational fleet divided by the number of operational jobs completed) 0.01122 0.01108 +1%Property intensity measurement (tCO2e/ft2)(market-based emissions from energy use in UK corporate portfolio (electricity and natural gas consumption), divided by floor area) 0.01119 0.01385 -24%* Scope 1 – All direct GHG emissions ** Scope 2 – Indirect GHG emissions from consumption of purchased electricity, heat or steam and reported
for location (country-specific emission factors) and market (energy supplier-specific emission factors)
CategoryEmissions
Source
tCO2e (Market Based)
% of Total Emissions
Operational fleet Scope 1 41,624 82%Company cars Scope 1 1,526 3%Property Scope 1&2 7,508 15%* Scope 1 – All direct GHG emissions * Scope 2 – Indirect GHG emissions from consumption of purchased electricity, heat or steam and are reported for
market (energy supplier-specific emission factors).
5,2005,4005,6005,8006,0006,2006,4006,6006,8007,0007,200
20162017
Green House Gas reduction in main offices
Tonn
es
5,000,0006,000,0007,000,0008,000,0009,000,000
10,000,00011,000,000
12,000,00013,000,00014,000,00015,000,000
GasElectricity
2017 2016
Electricity and gas reduction in main offices
kWh
We have made significant improvements in our main offices during the year, compared with our performance in the 2016 financial year:
Green house gas (GHG) emissions in our main offices have been reduced by 16.2%.
Gas usage has been reduced by 9.8%.
Electricity usage has reduced by 7.7%.
Greenhouse Gas Footprint
Our greenhouse gas (GHG) footprint covers all of our activities that are significant to the impact we have on the environment. The majority of our GHG emissions, 82%, are generated through our fleet of operational vehicles and this area saw an increase in absolute emissions of 5% compared with the last financial year. This which was expected as it was in line with the 5% increase in workload during this period. This increase was offset, however by the reduction in emissions from our overall property portfolio which was 19% less than the last financial year. As a result, we have seen our absolute market-based emissions decrease by 1% relative to the previous reporting year.
MethodologyWe have reported all emissions sources required under the Companies Act 2006. The calculations have been completed according to the GHG Protocol Corporate Accounting and Reporting Standard, using emissions factors from the Department for Business Energy and Industrial Strategy and the International Energy Agency.
The reporting period for the GHG data is aligned with the 2017 financial year. Due to the short time between the end of the financial year and the report publication, <1% of consumption data has been estimated following the GHG Protocol calculation guidelines.
The Operational Control Approach has been taken to define the boundaries of the GHG inventory.
Emissions from AA The Driving School Agency Limited are considered outside of scope, as it operates as a franchise and AA plc does not have equity rights or control over the franchisees.
Any joint ventures where the AA is not a majority shareholder are excluded as full operational control is not exercised.
AA Ireland was sold during the reporting year with all emissions included up to the disposal date, 11 August 2016.

40 AA plc Annual Report and Accounts 2017
Our peopleOur people are at the heart of what we do – they deliver the high quality, trusted service to our Members and are essential to our brand reputation. Our focus this year has been to support the business-wide transformation programmes and provide the support, development and change management required to enable our teams to work to the best of their abilities, achieve job satisfaction and deliver business plans and objectives.
Attracting talent and developing our employer brand
Making sure we attract the right talent, and really show people what a great organisation the AA is to work for, has been an important activity this year. A shift in focus to direct recruitment sourcing, rather than using intermediaries, has led to an increase in volume to our candidate pool of over 300%. Our resourcing team delivered over 2,000 candidate offers during the year.
Some of the key highlights we have delivered this year:
We have rebuilt our recruitment website, in line with the refreshed AA brand and values. Our new website brings our staff to the fore, highlighting the role they play, the brilliant job they do, and the diversity of career opportunities we offer.
The AA’s apprenticeship scheme is now live in our Oldbury contact centre. We have partnered with an external learning company, Learn Direct, to support our new two-year scheme. Current numbers on this programme are 30, with more planned in Oldbury and across other sites throughout 2017.
The AA has been designated a Disability Confident employer, having signed up to the seven commitments which actively encourage and enable people with disabilities to work for the AA.
The AA was one of the first organisations to receive a Gold Award from the Armed Forces Covenant Employer Recognition Scheme (ERS). It recognises businesses that are supporters of the Armed Forces Covenant, a promise that those who serve or have served in the Armed Forces, or their families, are treated fairly.
We recommitted our support to the armed forces community at a series of events at AA offices during Armed Forces Week where AA reservists and ex-forces personnel worked with the Ministry of Defence to explain the work of reservists.
The AA’s commitment to corporate responsibility continued
2,346Total number of people answering the phones
to customers
7,449
5,2972,152
Total number of employees
Male employees
Female employees
2,877Total number
of patrols

AA plc Annual Report and Accounts 2017 41
Our B
usinessG
overnanceFinancial Statem
entsO
ur Performance
Investing in our people
This year has been a year of change for many of our teams, therefore, it has been important to provide support, development opportunities and some formal learning. Some of the highlights have been:
Learning and development The new team have introduced an interactive induction guide, which allows new recruits to view videos and source useful information before they start with us. Providing this information to people early on in their AA journey is a key part of cementing our relationship with them.
Developing our people We have worked with the operational management teams to establish what makes a great front-line employee in our contact centres – analysing how we should develop people to maximise their performance through competence and align those competencies to our values. This has been built into our attraction, recruitment, training and assessment programmes.
Learning management system In the later part of 2016, we developed a comprehensive learning management system, which will be launched during 2017. This online solution will offer a range of training and learning interventions, and enable us to record and report on training completion and competence.
Performance management During 2016 we identified behaviours, aligned to our values, with the view to embed these into our performance management processes and framework. Ahead of launching the new performance management process for the 2018 financial year, we are rolling out the new behaviour descriptions to allow our teams to become familiar with them and consider what they really mean for them.
Recognising outstanding contributions The AA employee award ceremony was held in September, attended by 400 employees and their guests. A total of 21 awards were made, ranging from Patrol of the Year to our most outstanding call centre advisers.
Ownership in the AA We feel it is really important that our teams directly benefit from the hard work and dedication they give to the organisation and our brand, so we offer an annual Employee Share Incentive Plan (ESIP) , in which they receive a free matching share for every share purchased. We were pleased to see in the 2017 financial year that 36% of our people have participated.
Our people profile
It is critical to the future success of our business that we have the right people, with the right skills in the right roles to enable us to deliver the service our members expect and deserve.
Synergies and efficiencies in management structures, systems and support functions have enabled stream-lined organisation structures and a reduction in headcount, as the transformation programme continues.
We recognise the benefits of diversity throughout the AA and always look to ensure that we have an appropriate balance of skills and experience at Board level and throughout. More information can be found in our Governance Report on pages 43 to 78.
We strive to engage all our stakeholders with fairness, dignity and respect and endorse the UN Declaration of Human Rights – we do not tolerate child labour or forced labour, and respect freedom of association and the rights of employees to be represented by trade unions or works councils.
The AA is a fair employer and does not discriminate on the basis of gender, religion, age, disability or ethnicity. This policy applies throughout the AA and is communicated to all employees during their induction training and throughout their employment with us. It is our policy that people with disabilities should have full and fair consideration for all vacancies. Where employees become disabled during our employment, we endeavour to retain and adjust their environment where possible to allow them to maximise their potential.
Engaging with our people
It is important to us that we have a culture of openness with our teams and that we engage with them, particularly during this time of transformation. We have regular dialogue with our people through various channels, including staff and management-level focus groups and listening sessions. Communication internally is through our internal intranet and emails, one to one /team meetings, and conferences.
Whistleblowing PolicyWe are committed to conducting our business with honesty and integrity. The AA’s whistleblowing policy encourages employees to raise concerns internally that can be investigated in a timely and effective manner. We regularly brief our employees on our whistleblowing policy and communication channels open to them. During the year, six cases were escalated for review by HR and the ERCC. Common themes include staff behaviour, management discrimination and performance management.
We formally engage and consult with the AA’s recognised union, the IDU, and have an elected Management Forum which provides a platform for management-level employees’ view to be heard, as well as meeting our legal obligation for Information and Consultation.
Our suppliersSupplier Code of Conduct
The Procurement team has gone through its own transformation within the last 12 months under a new Head of Procurement. The focus of the team has expanded to incorporate the management and collaboration of our suppliers in line with the new Supplier Code of Conduct which sets out the standards required of an AA supplier of choice. The code covers:
Ethical dealings (including the Modern Slavery Act 2015)
Environmental responsibility
Health and safety standards
Employment standards
Proprietary information
All key and new suppliers are required to agree to our terms of working before any business is awarded.
Facilities Award
The AA are proud to be recognised by the British Institute of Facilities Management for their collaborative relationship with CBRE, our main supplier of facilities management. In October the AA and CBRE jointly received the coveted award of “Team of the Year”. The judging panel were impressed with how the AA and the CBRE had worked together to reduce running costs, introduce and implement an energy efficiency programme and improve CSR activities linked to sustainability, community engagement, staff wellbeing, and recycling. Examples of the benefits of this joint working are:
The Energy Saving Opportunity Scheme identified savings of circa £250,000.
The 16.2% year on year reduction of tCO2e from our main offices.
Well-being and training events, such as Green Week promoting environmental improvements, energy awareness, tyre checks.
Speak up2017 sees the introduction of ‘Speak Up’ sessions to all management across
the business.

42 AA plc Annual Report and Accounts 2017
Our community (Charity work)Driving for Care Leavers AA Charitable Trust for Road Safety and the Environment (Charity no. 1125119)
The AA Trust helps teenagers leaving care to learn to drive. Following last year’s pilot, twelve pupils from Bristol, Medway, Newcastle, and Westminster are taking part in the second programme. To date three have passed their tests and others are almost ready to take theirs.
The driving lessons give the care leavers a form of independence that many in such circumstances would struggle to achieve. One of the pupils who has passed his test has an apprenticeship with a car manufacturer and being able to drive will help him immensely to make the most of this opportunity. We are now looking at ways of providing assistance in preparing for the theory test. The scheme is supported by the Children’s Commissioner, Anne Longfield OBE and monitored by Bristol University. As well as delivering national support to those that need our help, we also make sure we support local communities and initiatives. Some highlights from this year include:
Patrol visits AA’s biggest fan Allen Childs made a ‘home start’ visit to the AA’s biggest fan, eight-year-old Alfie, in October. The visit was arranged when Alfie’s mother made contact to say that her son, who has autism, was desperate to help an AA patrol on a job.
Bangers for Ben The AA provided breakdown support and European Breakdown Cover for the participants in the annual charity rally. Ben is the automotive industry’s charity which partners with the industry to provide support for life to its people and their families. AA patrols ensured that the bangers cleared the Alps and reached the finish line intact with the additional benefit that two of our team took part in the event which raised £65,000 for the charity.
Children’s magical taxi tour The AA supported the London cabbies ‘Children’s Magical Taxi Tour’ trip from London to Disneyland Paris in September. They were part of a three-mile long convoy of London taxi cabs, ambulance staff and French police escorts all helping to give terminally ill children a magical weekend.
The children were able to explore the AA recovery truck before setting off for their weekend at Disneyland.
Newcastle college Members of our motoring and home insurance team at Newcastle, with the important addition of Patrol Man Pete, took 22 disabled young adults from Newcastle College on a Treasure Trail in South Shields. AA volunteers then visited the college the following day and gave AA goody bags to its special needs department. We have encouraged the relationship to continue through the regular sale of fresh fruit and vegetables by the students to our Newcastle staff.
Staff at our Cheadle office have been helping their local football club Cheadle FC in carrying out work to improve their grounds.
The AA’s commitment to Corporate Responsibility continued
Staff in our Home Emergency Services team at Oldbury raised funds of over £7k for Birmingham Children’s Hospital through this charity in the 2016 financial year by various activities.
We support the AA Charitable Trust through funding and staff as well as encouraging our own people to promote other charities in the industry (Ben) or in the wider communities.

Our B
usinessG
overnanceFinancial Statem
entsO
ur Performance
Our B
usinessG
overnanceFinancial Statem
entsO
ur Performance
Governance report
Introduction From Bob Mackenzie, Executive Chairman and John Leach, Senior Independent Director 44-45
Leadership Profiles of the Board of Directors and Executive Committee
Our governance structure and activity during the 2017 financial year 46-54
Effectiveness Nomination Committee reportEvaluating the performance of the Board, succession planning and talent management 55-57
Accountability Risk Committee reportOverseeing sound risk management and internal control systems 58-59
Audit Committee reportFormal and transparent audit procedures 60-64
Remuneration Board remuneration policy and report 65-73
Relations with shareholders Proactive investor engagement 74
Directors’ report Corporate governance statements 75-78
AA plc Annual Report and Accounts 2017 43

44 AA plc Annual Report and Accounts 2017
Introduction
“Our governance structure and corporate values are critical in underpinning the success of the AA’s transformation.”
Bob Mackenzie Executive Chairman
Dear Shareholder
This report describes the governance structure that is firmly established at the AA to ensure that we are effective, efficient and focused on delivering long-term value for our shareholders. It also sets out the key activities and achievements of the AA plc Board and its Committees during the 2017 financial year, our third year as a public company.
The AA has a notable heritage as an innovative, dynamic and responsible business and it is our duty to protect and enhance this reputation. We firmly believe that the adoption of a strong corporate governance structure, alongside clear corporate values, underpins the continued success of the AA and our brand. We have aligned dependable procedures and processes with the operation of our business to ensure that issues can be raised, captured and dealt with swiftly.
This has been another important year for the AA as the pace and scale of transformative change have gathered momentum. With the business focused on delivering the second phase of the transformation programme and delivering cost savings through improved productivity and efficiency, the Board has been responsible for maintaining a broader overview of all we do, including strategic opportunities such as the sale of AA Ireland and the refinancing.
The Board and Executive Committee strongly recognise the dependency of business success on corporate culture. We acknowledge that it is our continuing responsibility to ensure that the values, attitudes and behaviours we require of all AA employees are constantly reinforced through leadership, our business standards and communications.
We are proud of our results and look forward to delivering the final stages of the transformation programme. We are confident that the AA will be strengthened and revolutionised and the benefits will deliver further increased value to our Members, customers and shareholders. I thank you all for your support during this stage of the AA’s journey.
OverviewDuring the 2017 financial year, our key corporate governance undertakings have been as follows:
1. A refinancing project aligned with our strategic objective to reduce the cost of our debt, extend the payment profile and improve our credit profile, resulting in further annual interest savings of up to £10m.
2. The sale of AA Ireland which completed on the 11 August 2016 and resulted in de-leveraging through a £106m pay down on Group borrowings. A further £24m of the proceeds will be used to repay debt if it is not used for acquisitions during the 12-month period to 10 August 2017.
3. Succession planning for splitting the combined roles of the Executive Chairman and the development of skills matrices at Board and Executive Committees and the senior management team to enable proactive and forward-looking succession planning throughout the business. This is discussed in more detail in the Nomination Committee Report on pages 55-57.
4. Safeguarding the AA during the business transformation by ensuring effective risk management and internal control systems are in place. Also, ensuring that our resilience against potential threats which could cause commercial and reputational damage is robust, such as cyber security, data protection and currency fluctuations.
5. Implementing actions from the first Board effectiveness evaluation, undertaking our second internal evaluation and planning for our first external assessment in the 2018 financial year. This is discussed in more detail in the Nomination Committee Report on pages 55-57.
6. Continuing to evolve a robust governance framework for the regulated business Automobile Association Insurance Services Limited (AAISL), including the establishment of a culture and conduct committee.
7. Developing a robust governance framework for our new insurer, Automobile Association Underwriting Insurance Company Limited.
8. Continuing to strengthen our investor relations through roadshows and active engagement with our key shareholders, as discussed in the Relations with Shareholders section on page 74.

Our B
usinessG
overnanceFinancial Statem
entsO
ur Performance
Our B
usinessG
overnanceFinancial Statem
ents
AA plc Annual Report and Accounts 2017 45
Our Perform
ance
Combined rolesWe acknowledge the implications of combining the roles of Chairman and Chief Executive Officer, yet the Board’s opinion and confidence are unwavering in that it is in the best interests of the Group that I remain in the role of Executive Chairman until the business transformation is delivered.
We will initiate the process to appoint a new CEO in the 2018 financial year. Once the transformation is complete and an effective handover implemented, I will take up the role of Non-Executive Chairman, thereby enabling the AA to fully comply with the Financial Reporting Council’s UK Corporate Governance Code (the Code), which can be found at www.frc.org.uk. A succession plan is in place and is discussed in the Nomination Committee Report on pages 55-57.
As previously reported and as recommended in the Code, while I continue to perform the combined role we have acted to ensure that there are clear written divisions of responsibilities between the combined roles and have enhanced the role of John Leach, Senior Independent Non-Executive Director, to include additional responsibility for oversight on Board governance and process. John Leach and the Non-Executive Directors act to ensure that all decisions are taken with full approval of the Board. Descriptions of the roles and responsibilities of the Board are set out on page 52.
We are confident that the Board has the appropriate balance of skills, experience and independence required to ensure the continued long-term growth and value of the business. This position has been confirmed during the year, both through the development of detailed skills matrices and the board effectiveness evaluation process.
Compliance with the UK Corporate Governance Code This report describes how we govern our business and summarises the work conducted by the AA plc Board and its Committees during the 2017 financial year. It confirms our core achievements and sets out the activities planned for the immediate financial year, as well as acknowledging our longer-term plans.
We are pleased to report that, except for the combined roles of Chairman and Chief Executive Officer, the AA Group is in full compliance with the Code. Our compliance with the required regulatory and statutory standards for a premium listed company is reflected throughout this governance report.
Bob Mackenzie Executive Chairman 27 March 2017
John Leach Senior Independent Director 27 March 2017
“We have embraced initiatives arising from our first Board effectiveness review during the year.”
John Leach Senior Independent Director

46 AA plc Annual Report and Accounts 2017
Bob Mackenzie (64) Executive Chairman
Appointment: Bob joined the AA in June 2014 as part of the MBI team.
Responsibilities: As Executive Chairman, Bob assumes responsibilities for running the Board, driving the strategy of the AA and oversight on governance matters. Bob sits on the Nomination Committee.
Career and experience: Bob qualified as a Chartered Accountant with KPMG in 1978 and has extensive experience of leading consumer services businesses and delivering highly successful business transformation programmes. Previously, Bob held positions as Chairman and CEO of National Car Parks and Green Flag, as well as CEO of Sea Containers Ltd and Chairman of PHS Group plc and a number of other senior executive board positions within consumer services companies. Bob stepped down as Chairman of Northgate plc in September 2015.
Mark Millar (47) General Counsel and Company Secretary
Appointment: Mark joined the AA in September 2014.
Responsibilities: As Company Secretary, Mark is responsible for corporate governance matters, working closely with the Chairman, SID and Board of Directors and attends all Board and committee meetings. Mark leads legal and regulatory aspects of the AA’s business and transactions, such as the financial restructuring projects and the sale of AA Ireland.
During 2016, Mark was awarded the first AA Leadership Award.
Career and experience: A qualified solicitor, Mark was formerly Company Secretary at Domino’s Pizza Group plc and Future plc and has 14 years of experience in the role. Mark also has a wealth of commercial and legal expertise, including ten years as a City solicitor, latterly with Allen & Overy.
Martin Clarke (61) Chief Financial Officer
Appointment: Martin joined the AA in June 2014 as part of the MBI team.
Responsibilities: As CFO, Martin has ultimate responsibility for financial planning and overseeing risk management, treasury and internal controls. Additionally, he focuses on investor relations and improving the capital structure of AA plc.
Career and experience: Martin has over 30 years of private equity experience, principally in the role of Partner and Global Head of Consumer for Permira which he joined in 2002. Prior to Permira, Martin worked at Cinven and Silverfleet, the private equity arm of Prudential plc. He has led a number of major transactions and has sat on the boards of several major companies including New Look, Gala Coral and Galaxy Entertainment Group, which is listed on the Hong Kong Stock Exchange.
Suzi Williams (49) Non-Executive Director
Appointment: Suzi joined the AA in October 2015 as a Non-Executive Director.
Responsibilities: As Non-Executive Director, Suzi provides objective insight and critical debate to Board discussions on strategic, financial and governance matters. Suzi is a member of the Risk, Nomination and Remuneration Committees.
Career and experience: Suzi has extensive experience with consumer-facing companies and brands. A Procter & Gamble trained brand marketer and business leader, Suzi has spent the last 20 years delivering commercial transformation and growth for household names like the BBC, Orange and Capital Radio Group (where she was Commercial Development Director at Global Radio Group from 2004 to 2006). In September 2015, after a ten-year tenure, she stepped down from her role as Group Marketing and Brand Director at BT plc.
Key to committees
N Nomination Committee
RI Risk Committee
A Audit Committee
R Remuneration Committee
N N RI A
N RI R
Our Board Leadership
The age of the Board and Executive Committee member is given at the time the report is published (April 2017)
John Leach (68) Senior Independent Non-Executive Director
Appointment: John Leach joined the AA in June 2014 as a Non-Executive Director. He was appointed as Senior Independent Director on 13 November 2014.
Responsibilities: As Senior Independent Director, John provides objective insight and critical debate to Board discussions on strategic and financial matters and supports the Executive Chairman with additional oversight on governance matters. John is Chair of the Nomination Committee and a member of the Risk and Audit Committees.
Career and experience: John has served on public company boards as either Chairman, CEO or CFO for the past 36 years. He has considerable experience in turnaround situations in the industrial and service sections sitting on the boards of, among others, Brent Walker (including William Hill and Pubmaster), Myson Group and Luminar. Most recently, John was CEO of Hermes UK Focus Funds and a supervisory Board member of Dometic AB. John began his career as an Articled Clerk and subsequently as a Partner in a firm of chartered accountants. He is a Fellow of the Institute of Chartered Accountants and a Fellow of the Association of Corporate Treasurers.

AA plc Annual Report and Accounts 2017 47
Our B
usinessG
overnanceFinancial Statem
entsO
ur Performance
Composition of the Board
The skills and experience of our Board members is broad and has been gained over many years from different environments, such as private equity, entrepreneurial start-ups, strategic consulting and consumer services. All of their careers have involved the delivery of substantial change through operational, financial, strategic or marketing initiatives. The Board is united in its energy and commitment to delivering the objectives of the AA transformation project and building long-term value for shareholders.
During the 2017 financial year, skills matrices were implemented and the data was reviewed by our Human Resources Director and SID to identify areas of focus to broaden the skills, knowledge and experience of Board members. The output of this will shape the training plan for Board members in the coming year. The development of matrices has confirmed that the Board is strongly skilled to deliver the strategic objectives and transformation programme and there are no combined weaknesses identifying a need for an additional Board member at this stage. The skills and composition of the Board are kept under constant review.
Together, the Board members combine to create a composition that is strongly and appropriately aligned with the AA’s values, strategic objectives and corporate responsibilities. We firmly believe that each Board member’s experience, gained through previous roles and any current external roles, strengthens the composition of the Board and creates invaluable insight and diversity of thought, and thus has strengthened governance.
Andrew Blowers (56) Non-Executive Director
Appointment: Andrew joined the AA in September 2014 as a Non-Executive Director.
Responsibilities: As Non-Executive Director, Andrew provides objective insight and critical debate to Board discussions on strategic, financial and governance matters. Andrew is Chair of the Risk Committee and a member of the Audit and Nomination Committees.
Career and experience: Andrew has significant experience in insurance and financial services. He established and sold several successful insurance operations during his 25-year career in the insurance industry, the last being the innovative online insurer Swiftcover, and he was previously an Executive Director of Churchill Insurance. He has previously advised several private equity operations, the Consumers’ Association and the Financial Ombudsman Service in relation to various insurance matters. Andrew was awarded an OBE in 2009. Andrew is a Non-Executive Director of Telecom Plus plc.
Andrew Miller (50) Non-Executive Director
Appointment: Andrew joined the AA in June 2014 as a Non-Executive Director.
Responsibilities: As Non-Executive Director, Andrew provides objective insight and critical debate to Board discussions on strategic, financial and governance matters. Andrew is Chair of the Audit Committee and a member of the Risk and Remuneration Committees.
Career and experience: Andrew is an Operational Managing Director with Terra Firma. He has extensive experience of successful digital transformation in consumer-facing industries, most recently working with Founders’ Forum supporting multinational business on digital transformation. As CEO of the Guardian Media Group from 2010 to 2015, Andrew reshaped the Guardian’s portfolio of businesses to support its transformation into one of the world’s leading digital organisations. From 2002 to 2014, he carried out a similar transformation as CFO and non-executive director of Trader Media Group, which included Autotrader, in its transition from magazines to a wholly digital company.
Prior to his role with Autotrader, Andrew worked in finance and transformation roles across several organisations including Pepsico Europe, Procter & Gamble, Bass Plc and a start-up company. He is a member of the Institute of Chartered Accountants of Scotland, qualifying in 1991, and training with Price Waterhouse after completing his law degree at Edinburgh University.
Simon Breakwell (52) Non-Executive Director
Appointment: Simon joined the AA in September 2014 as a Non-Executive Director.
Responsibilities: As Non-Executive Director, Simon provides objective insight and critical debate to Board discussions on strategic, financial and governance matters. Simon is Chair of the Remuneration Committee and a member of the Nomination Committee.
Career and experience: Simon has significant digital and travel experience. He is currently a Venture Partner at TCV, one of the leading global mid cap funds, and is Chairman of Business Data 4 Travel. Simon is also co-founder of Trover.com and an adviser to Hipmunk.com.
He was a founder of Expedia, a start-up within Microsoft, and ran the North American operations. As President of Expedia International Inc, Simon started up and led the growth of the business in the Europe, Middle East, and Africa regions, including both the Hotels.com and Expedia brands. Simon joined Expedia as a main board Director in 1996 and served for ten years. More recently, Simon was responsible for establishing the European operations for Uber.com.
RN

48 AA plc Annual Report and Accounts 2017
Executive Committee
Bob Mackenzie (64) Executive Chairman
Appointment date: June 2014
Responsibilities: As Executive Chairman, Bob assumes responsibilities for running the Board, driving the strategy of the AA and oversight on governance matters. Bob sits on the Nomination Committee.
Career and experience: Bob qualified as a Chartered Accountant with KPMG in 1978 and has extensive experience of leading consumer services businesses and delivering highly successful business transformation programmes. Previously, Bob held positions as Chairman and CEO of National Car Parks and Green Flag, as well as CEO of Sea Containers Ltd and Chairman of PHS Group plc and a number of other senior executive board positions within consumer services companies. Bob stepped down as chairman of Northgate plc in September 2015.
Kirsty Lloyd-Jukes (33) Membership Services Director
Appointment date: June 2014
Responsibilities: Kirsty became Membership Services Director in November 2014 to support the AA’s strategy of providing more value to Roadside Members and revitalising the Membership proposition. In this role Kirsty has responsibility for the AA Driving School and BSM, AA Media (Publishing, Hotel Inspections, Route Planner), Motoring Services (Used Cars, Inspection, Signs, Service and Repair) and Connected Cars. Kirsty is also the Group Strategy Director.
Career and experience: Kirsty joined the AA as Strategy & Innovations Director in June 2014 and was part of the team that spearheaded the AA plc’s IPO. Previously, she spent seven years at Oliver Wyman working with a broad range of organisations on strategy, commercial and general management.
Mike Lloyd (39) CEO for AAISL
Appointment date: September 2014
Responsibilities: Mike is responsible for the consumer Roadside Assistance, Business Services, Insurance Broking and Financial Services businesses as well as the marketing, digital and public affairs functions for the AA. In March 2017, Mike became CEO of AAISL (the AA’s regulated insurance broking business).
Career and experience: Mike was previously a Partner at Oliver Wyman, leading their consumer services work in the UK.
Martin Clarke (61) Chief Financial Officer
Appointment date: June 2014
Responsibilities: As CFO, Martin has ultimate responsibility for financial planning and overseeing risk management, treasury and internal controls. Additionally, he focuses on investor relations and improving the capital structure of AA plc.
Career and experience: Martin has over 30 years of private equity experience, principally in the role of Partner and Global Head of Consumer for Permira which he joined in 2002. Prior to Permira, Martin worked at Cinven and Silverfleet, the private equity arm of Prudential plc. He has led a number of major transactions and has sat on the boards of several major companies including New Look, Gala Coral and Galaxy Entertainment Group, which is listed on the Hong Kong Stock Exchange.
Olly Kunc (38) Operations Director
Appointment date: August 2014
Responsibilities: Olly joined the AA as Managing Director of Home Services in August 2014 and in September 2014 was appointed Managing Director of Roadside Operations. He has since expanded Operations to bring together all customer-facing activities and focus on customer outcomes, and now holds responsibility for the operations of the AA including patrols, deployment, call centres and technical development and retains oversight over Home Services.
Career and experience: Olly joined the AA after six years at British Gas where he laterly served as Managing Director of Central Heating Installations. He has previously held roles at Barclays, British Airways and L.E.K. Consulting.
Geraint Hayter (43) Director of IT
Appointment date: April 2015
Responsibilities: Geraint is responsible for delivering all IT services to the Group and is working on transforming the IT organisation for the future. He has over 20 years of experience working in IT at large corporate organisations.
Career and experience: Prior to joining the AA, Geraint worked at TUI Travel for 4 years, where he was the Director of IT for the UK business and was responsible for delivering the IT elements of a major transformation programme. Prior to this, Geraint worked at 3M for 16 years; having joined as a Graduate Trainee, Geraint’s last position was IT Director for the UK and Ireland Business.
Mark Millar (47) General Counsel and Company Secretary
Appointment date: September 2014.
Responsibilities: As General Counsel, Mark is responsible for legal and regulatory aspects of the AA’s business and transactions, such as the IPO, financial restructuring projects and the sale of AA Ireland.
During 2016, Mark was awarded the first AA Leadership Award.
Career and experience: A qualified solicitor, Mark was formerly Company Secretary at Domino’s Pizza Group plc and Future plc and has 14 years of experience in the role. Mark also has a wealth of commercial and legal expertise, including ten years as a City solicitor, latterly with Allen & Overy.
Leadership
Janet Connor (52) Director, Insurance & Regulatory Conduct
Appointment date: August 2014
Responsibilities: In March 2017, Janet handed over the role of CEO of AAISL to Mike Lloyd to take up the role of Director, Insurance & Regulatory Conduct. In this role, Janet retains accountability for the Insurer and assumes responsibility for the regulatory change agenda at the AA.
Career and experience: Janet is a Fellow of the Institute of Directors and has pursued a successful career in consumer financial services across retail banking and insurance. Prior to joining the AA, Janet held MD roles in general insurance and latterly she was managing director of RSA plc’s brand, More Than. Previous to this, Janet ran Ageas-owned over-50s insurer RIAS from 2006 to 2011. From April 2017, Janet will sit as a Non-Executive Director of Vanquis Bank – Provident Group.

Our B
usinessG
overnanceFinancial Statem
entsO
ur Performance
AA plc Annual Report and Accounts 2017 49
Details of the Executive Directors’ service contracts are set out in the Directors’ Remuneration Report on pages 65-73.
Edmund King (58) AA President
Appointment date: January 2008
Responsibilities: Edmund is responsible for public affairs, public relations, campaigns and the AA Charitable Trust.
Career and experience: Edmund has a background in research, media, civil service, commerce and extensive transport campaigns. He has worked in the wine trade in Burgundy and for a radio station in LA. He has written several reports on transport and often appears as a transport commentator on radio and television. He is also a Visiting Professor of Transport at Newcastle University. He tweets under @AApresident.
Edmund was awarded an OBE for services to road safety in 2016.
Helen Hancock(46) Human Resources Director
Appointment date: May 2012
Responsibilities: Helen is responsible for delivering the people agenda for the Group and its functions, ensuring appropriate leadership and support is provided for each element of the HR strategy. Helen is an attendee on both the AAISL and AA plc Remuneration Committees.
Career and experience: Helen has over 20 years’ experience working in HR in medium and large corporate organisations. Prior to joining the AA almost five years ago, Helen worked at British American Tobacco for eight years where she held the role of Head of HR for the Southampton site and Senior Business Partner roles for the Global Product function and Group Research & Development. Prior to this, Helen worked at Alldays Convenience Stores Limited (subsequently acquired by The Co-Op) and B&Q plc with various HR remits.
Board diversity
The AA’s recruitment policy is to appoint the best candidate to each role, while having regard to the composition of the Board in terms of age, background, ethnicity, gender and knowledge. We recognise that diversity in its broadest sense can enhance the overall effectiveness of the Board by bringing different voices and opinions to the table.
We monitor and seek to ensure a good balance of male and female employees throughout our Group and we continue to build a supportive and flexible culture that enables us to develop and retain women in senior positions.
The Board is mindful of Lord Davies’ extended target for Women on Boards which has called for FTSE 250 boards to have at least 33% female representation by 2020. The Board also supports the recommendations of the Sir John Parker Review to increase ethnic diversity on boards.
As we continue to build a pipeline of diverse and talented individuals, we are mindful of achieving these future targets while remaining focused on appointing the best candidate to each role.
More information on our diversity policy can be found in our Nomination Committee Report on pages 55-57.
Gender pay
The AA supports the Gender Pay Regulations (GPR), which will come into force from April 2017 and we have tested our information systems to confirm that the appropriate data is accessible in order to meet the snapshot requirements at that time. It is our current intention that we will publish this data alongside the 2018 Annual Report and Accounts, in line with the GPR guidelines.
Given the nature of our business, a higher male to female ratio is expected at the All Employees level.
Gender diversity
Male 86%Female 14%
Board ExecutiveCommittee
[XX]%
LeadershipTeam
All Employees
Male 70%Female 30%
Male 78%Female 22%
Male 79%Female 21%

50 AA plc Annual Report and Accounts 2017
Our Governance structureLeadership
GOVERNANCE STRUCTURE
plc Regulated subsidiaries
Key to committees
AAISL Board AAUICL Board
ARCC (Audit, Risk & Compliance Committee)
Remuneration Committee
Nomination Committee
Culture & Conduct Committee
ARCC (Audit, Risk & Compliance Committee)
Regulatory matters Regulatory mattersGROUP ACTIVITIES
Executive Committee
Risk, Internal Audit & Compliance functions
AADL and other trading subsidiary Boards
Policy Committee Legal and Regulatory Change Committee
Bus
ines
s are
asPe
rfor
man
ce a
nd d
evel
opm
ent
2nd
/ 3rd
lin
e de
fenc
eA
ppro
val a
nd o
vers
ight
Regulatory overview forums
(POF/COF)
Insurance services
Management business reviews
(monthly and quarterly)
Road operations
Steering committees: IT and digital,
strategic projects, information
security
Group functions
Regulatory overview forums
(POF/COF)
IT and digital transformation Insurer
AA plc Board
Disclosure Committee
ERCC (Executive Risk & Compliance Committee)
Nomination Committee
Risk Committee
Remuneration Committee
Audit Committee

AA plc Annual Report and Accounts 2017 51
Our B
usinessG
overnanceFinancial Statem
entsO
ur Performance
Structure
The governance structure of the AA Group has evolved since our IPO in 2014 to provide additional oversight on transformation projects and investment decisions, to meet revised statutory and regulatory requirements and to ensure that our regulated businesses have similarly robust governance standards. This governance structure is critical to ensuring that all our business decisions, operations and activities are carefully scrutinised and controlled so as to safeguard the long-term health and reputation of the AA Group.
Our governance structure aims to enable appropriate, effective decision making with clear accountabilities. It sets out how the business is managed and operated at all levels and across all business areas. It aims to ensure that the risk profile reflects the strategic objectives of the business, with the ultimate aim of protecting the business from reputational or operational damage. This structure dovetails with the governance arrangements of the regulated subsidiaries in the Group.
A key principle of the structure is the delegation of operational management to the Executive Committee with a matrix of authorities setting out how this is further delegated through the organisation.
The Executive Committee gives strategic focus and is responsible for managing the operational and financial performance of the Group by coordinating the work of the specialist business areas. This enables the efficient and effective day-to-day operation of the Group’s businesses.
The Board is kept up to date with developments in the business, including the work of the leadership teams, through the Executive Chairman and Chief Financial Officer’s regular reports, which are discussed in detail at each Board meeting. Sufficient time is given both before and at the end of each Board meeting for the Executive Chairman to meet privately with the Senior Independent Director and Non-Executive Directors to discuss any matters.
AA Developments Limited (AADL), a subsidiary of the Company, is the entity responsible for the provision of our core Roadside Assistance delivery.
Regulated activities
A number of the Group’s businesses include regulated activities and the Group has several regulated subsidiaries. The main such subsidiaries are: the (i) Automobile Association Insurance Services Limited (AAISL), which runs our insurance broking business and which has a board including three independent non-executive directors and the (ii) AA Underwriting Insurance Company Limited (AAUICL), which is our Insurance Underwriter and, which has a board including three independent non-executive directors and is chaired by Andrew Blowers. The Board works closely with the AAISL and AAUICL boards to ensure that appropriate governance is followed in respect of all regulated Group activities.
The role of the Board
The Board is responsible for the stewardship of the Company, protecting the AA heritage and creating sustainable value for our shareholders. It carries out this role through a range of activities which require strong vision, leadership, entrustment and oversight.
The Board embodies the standards and behaviours of the AA that underpin the delivery of long-term success, and it ensures that the procedures and processes are in place to ensure that these values are well understood and observed. The AA’s values, as determined by the Board, are Courtesy, Care, Collaboration, Expertise and Dynamism.
The Board sets the strategy of the Group and provides guidance and oversight to the business operations that assume responsibility for implementing the resulting strategic actions. It agrees the risk appetite and tolerances of the Group and ensures that the risk management structure is aligned and effective. The Board oversees the financial performance of the Group and is also responsible for corporate governance and setting the tone from the top.
Matters reserved for the Board
A number of key decisions and matters are reserved for the Board’s approval and are not delegated to management.
These include:
Matters relating to the Group’s strategy
Monitoring current trading against previously reported trading
Approval of major acquisitions, disposals and capital expenditure
Matters relating to financing and refinancing
Approval of financial results and overseeing the Group’s system of internal control
An annual Board effectiveness evaluation
Setting the Group’s risk appetite and the Risk Management Framework
Matters requiring Board and committee approval are submitted to the Board, together with supporting documentation, as part of the Board or Committee papers. At each Board meeting, the Board pack includes updates from the Executive Chairman and Chief Financial Officer and contains financial results and other functional updates. There are presentations on the Company’s operations and regular discussions on strategy, marketing, shareholder matters, employee engagement, health and safety, corporate responsibility and governance matters.
A Schedule of Matters reserved for the Board’s decision and clear Terms of Reference for its principal committees, along with the roles of individual Board Members, can be found on the Company’s Investor Relations website at www.theaaplc.com/investors/corporate-governance/board-and-committee-terms-of-reference.
The role of the Committees
The Board delegates certain responsibilities to its principal committees to assist it in carrying out its functions of ensuring independent oversight. Our principal Board Committees’ constitutions include independent Non-Executive Directors and play a key role in supporting the Board. A detailed report on the activities undertaken by each Committee in the 2017 financial year is given by the relevant Chair later in this report.
The Board delegates the implementation of strategy and day-to-day management of the Group’s operations to the executive committees. The Board delegates oversight of its announcement obligations under the Market Abuse Regulations to the Disclosure Committee, which was established during the year.
Nomination Committee p55
Audit Committee p60
Risk Committee p58
Remuneration Committee p65

52 AA plc Annual Report and Accounts 2017
CLEAR DIVISION OF RESPONSIBILITIES
Governance continued
Executive Chairman Bob Mackenzie
Senior Independent Director John Leach
Chief Financial Officer Martin Clarke
Company Secretary Mark Millar
Non-Executive Directors Andrew Blowers, Simon Breakwell, Andrew Miller, Suzi Williams
In order for the Board to operate effectively and fulfil its aspirations, it is essential that clear roles and responsibilities are defined and followed. We recognise that clarity in this area is particularly important, given Bob Mackenzie’s dual role of Executive Chairman. John Leach’s role as Senior Independent Director (SID) has been broadened accordingly to provide additional oversight on governance matters.
The Board meets the Code requirement for more than half of the members to be independent.
Providing coherent leadership and ensuring effectiveness in the running of the Board Meeting with major shareholders on both strategic and governance matters Ensuring effective communications by the Group with its shareholders Ensuring Directors receive accurate, timely and clear information and ensuring that agendas emphasise strategic issues Taking the lead in providing a properly constructed, full, formal and tailored induction programme for new Directors Ensuring the Group complies with its regulatory obligations and ensuring good links between the Board and the independent boards of the regulated subsidiaries
Ensuring the Board is alerted to forthcoming complex, contentious or sensitive issues affecting the Group Implementing the decisions of the Board and its Committees Leading the Group’s strategic development, direction and objectives Reviewing the Group’s organisational structure and recommending changes as appropriate Identifying and executing new business opportunities Identifying and executing acquisitions and disposals and leading geographic diversification initiatives Managing the Group’s risk profile including the health and safety performance of the Group Leading the Group’s corporate responsibility programme Building and maintaining effective leadership teams
Acting as a sounding board for the Executive Chairman and a trusted intermediary for the other Directors Providing additional governance oversight, given the dual role of the Executive Chairman Meeting regularly with the independent Non-Executive Directors to facilitate their effective contribution Holding an annual meeting without the Executive Chairman present to evaluate his performance
Being available to shareholders if they request contact both generally and when the normal channels of Executive Chairman or Chief Financial Officer are inappropriate Chairing the Nomination Committee Leading and participating in the Board evaluation process
Recommending to the Board an annual budget and financial plan Examining all trade, investments and major capital expenditure proposed by Group companies Overseeing risk management, treasury and internal controls Ensuring effective communication with shareholders and key stakeholders and updating institutional investors on the business strategy and performance Recommending to the Board appropriate changes to the capital structure and debt levels
Maintaining relationships with the Group’s banks and managing the investment and banking portfolio Managing the Group’s risk profile including the health and safety performance of the Group Implementing the decisions of the Board and its Committees Building and maintaining effective leadership teams Ensuring the Board is alerted to forthcoming complex, contentious or sensitive issues affecting the Group Identifying and executing new business opportunities
Making a Strategic and creative contribution to the Board Bringing independence, impartiality, experience, special knowledge and a different perspective to the Board Providing guidance on matters of concern and strategy development
Overseeing risk management and internal controls Protecting shareholder and stakeholder interests Scrutinising the performance of the Executive Committee in meeting agreed goals and objectives and monitoring the reporting of performance
Developing, implementing and sustaining high standards of corporate governance Supporting the Executive Chairman and other Board Members as necessary Advising the Board on legislation, regulation and corporate governance developments which impact the Group, and maintaining the Group’s Corporate Governance Manuals Communicating with shareholders and keeping the Board informed of shareholder opinions
Coordinating the induction of new directors Ensuring compliance with statutory and regulatory requirements Reviewing and monitoring the Group’s Remuneration Policy Ensuring the Group complies with its regulatory obligations and ensuring good links between the Board and the independent boards of the regulated subsidiaries
Role
Role
Role
Role
Role

AA plc Annual Report and Accounts 2017 53
Our B
usinessG
overnanceFinancial Statem
entsO
ur Performance
CALENDAR OF GOVERNANCE MEETINGS IN FINANCIAL YEAR 2017
BOARD ATTENDANCE
Feb Mar Apr May Jun Jul Sep Oct Nov Dec Jan
Scheduled Board meetings
Board calls
Strategy Workshops
AGM
Nomination Committee
Audit Committee
Risk Committee
Remuneration Committee
An additional Audit Committee was held in April 2016 and an additional Nomination Committee meeting was held in January 2017.
A two-day strategy session was held away from the Head Office on 6 and 7 December 2016.
Key: Special meetings
The Board held ten scheduled meetings and calls during the year and individual attendance is set out in the table below. All Board members attended the AGM. Committee attendance is set out in the individual reports.
Name of Director Date appointed A B% of meetings
attended
Bob Mackenzie Executive Chairman 26 Jun 2014 10 10 100%
Martin Clarke Chief Financial Officer 26 Jun 2014 10 10 100%
John Leach Senior Independent Director (from 13 Nov 2014) 26 Jun 2014 10 10 100%
Andrew Blowers Non-Executive Director 25 Sep 2014 10 10 100%
Simon Breakwell Non-Executive Director 17 Sep 2014 10 10 100%
Andrew Miller Non-Executive Director 26 Jun 2014 81 10 80%
Suzi Williams Non-Executive Director 1 Oct 2015 10 10 100%
NotesA = Number of meetings and calls the Director attended.
B = Maximum number of meetings and calls the Director could have attended.
1 Andrew Miller was unable to attend the Board call in October and the Board meeting in January due to prior commitments but read the papers and provided comments in advance
Where appropriate, members of the AA senior management team were invited to give presentations at Board meetings.
Strategic progress
Progress against strategy is discussed at each scheduled Board meeting to closely monitor strategy implementation by the Group. The two-day strategy session held away from Head Office on 6 and 7 December 2016 provided the opportunity for more relaxed, free-flowing discussion around a broad range of strategic issues. They provided a unique and specific opportunity to develop strategy, address current issues and seek to improve the performance of the business. The sessions focused on the plans for the next three years of development for the business. The Non-Executive Directors were able to share their expertise and provide independent oversight to the direction of the business. Discussions focused not only on the business plan but also on the individuals leading and implementing that plan. These, and other teams that support them, are key to the delivery of the Board’s objectives.

54 AA plc Annual Report and Accounts 2017
In addition to the key operational, financial, CSR and health and safety reports presented at each meeting, the following were considered by the Board during the year:
W1
W1
W1
W1
B68
PLANNING AHEAD
Looking forward to the 2018 financial year, the Board and its Committees will focus on: The final stages of our transformation programme Developing and delivering our three-year plan Splitting the roles of Chairman and Chief Executive Developing succession plans deep into the Group Implementation of strategic priorities Ongoing development of our governance structure
February 2016 Board call
Update on sale of AA Ireland
Approve appointment of new AAISL Non-Executive Director
Update on IT transformation
Review draft of the 2016 Annual Report
October 2016 Board call
Feedback from interim results
Indication of refinancing process
Board review and succession planning
Review independence of Non-Executive Directors
Budget planning
June 2016 Board meeting London
Review and approve Q1 results
Strategic review: Approval of Irish disposal Health and safety
Progress check on IT transformation
Investor relations update – feedback on preliminary results
Financial strategy and three-year planning
Governance updates from Risk, Audit and Nomination Committees
November 2016 Board call
Strategic review: Approval of refinancing Connected car Home Services
Governance updates from Risk, Audit and Nomination Committees
CSR update
December 2016 Board and strategy meetings
Strategic focus and development of three-year plans for business areas
Commercial growth areas Business and IT transformation Business readiness
April 2016 Board meeting London
Approve preliminary results statement
Receive dividend proposal
Approve Annual Report
FY17 Budget
Strategic review: Insurance model Irish disposal update Pensions planning
Receive reports from Risk, Audit, Remuneration and Nomination Committees
Investor relations report
Review responsibility of the Executive Chairman and SID
April 2016 Board call
June 2016 AGM London
Second AGM held in London
Approval of 2016 accounts All resolutions passed
July 2016 Board call
Update on IT transformation
Strategic review: Approval of completion of Irish disposal
September 2016 Board meeting London
Approve Terms of Reference for regulated entity, AAISL Board and committees
Strategic review: Health and safety Project updates Pensions update
Approve interim results, dividend policy and interim dividend payment
Duplicate Cover update
January 2017 Board meeting Oldbury
Evaluate feedback from strategy workshop
Board performance evaluation update
Update from Remuneration Committee
Strategic review: FY18 Budget approval Three-year plan approval
Governance continued
KEY BUSINESS AT MEETINGS DURING THE 2017 FINANCIAL YEAR

AA plc Annual Report and Accounts 2017 55
Our B
usinessG
overnanceFinancial Statem
entsO
ur Performance
Nomination Committee Report
Effectiveness
Dear Shareholder,
I am pleased to present the report of the Nomination Committee (the Committee) for the financial year ended 31 January 2017. The Committee supports the Board in reviewing its structure and composition, evaluating its performance, overseeing succession planning for the Board and its Executive Committees and monitoring Board diversity.
A core focus of the Committee during the 2017 financial year has been to identify and implement step changes to raise the efficiency, and thus the value, of the Board’s work. As part of this process, the Committee considered the results from the first internal Board effectiveness review and agreed a number of key areas to address during the year. The results of this review are detailed later in this report, along with the areas that will be addressed in the coming year.
The succession planning process for splitting the current combined CEO and Chairman roles will be a paramount activity of the Committee and is set out in detail below. The Board effectiveness review, development of skills matrices and an established talent management programme have assisted with the process of understanding the position and prospects of the Board and aided the succession planning process. This report considers this work and the procedures in place for the future appointment of any new director.
The report also sets out other principal activities of the Committee during the year and our action plan for the 2018 financial year.
MEMBERSHIP AND ATTENDANCE DURING THE YEAR
The membership of the Committee, together with appointment dates and attendance at meetings, is set out below:
Name of memberDate appointed
to Committee A B
% of possible
meetings attended
John Leach (Chairman from 13 Nov 2014) 26 Jun 2014 2 2 100%Andrew Blowers 13 Nov 2014 2 2 100%Simon Breakwell 13 Nov 2014 11 2 50%Bob Mackenzie 26 Jun 2014 2 2 100%Suzi Williams 01 Oct 2015 2 2 100%NotesA = Number of meetings the member attended.B = Maximum number of meetings the member could have attended.¹ Simon Breakwell missed one Committee meeting due to family illness.
The Chief Financial Officer, Human Resources Director, Company Secretary and Chair of the Audit Committee, Andrew Miller, were invited to attend meetings during the year.
“ During the second year of the AA’s transformation, we have focused on strengthening processes to ensure the Board is well informed, vocal and engaged. We continue to review and monitor the effectiveness of the Board and lead the process for future appointments to ensure that there is an appropriate balance of skills, experience, knowledge and diversity.”
John Leach Nomination Committee Chairman

56 AA plc Annual Report and Accounts 2017
Nomination Committee Report continued
Nomination Committee responsibilities and activity during the year
The Nomination Committee undertook the following activities during the 2017 financial year:
Reviewed the balance of skill, experience, independence, diversity and knowledge on the Board
Completed the second internal Board evaluation
Undertook a tender process and appointed an external consultancy (Condign Board Consulting Limited) to carry out an external Board evaluation in the 2018 financial year
Produced a skills matrix of Board members to aid future succession planning and talent management
Considered gender and other diversity at Board level and through the management structure
Appraised the performance of the Chairman, a process conducted by the Senior Independent Director and Non-Executive Directors
Reviewed verbal feedback from AAISL on its first board evaluation
Reviewed succession planning for the Board, including commencement of planning for a new CEO
Assessed the future talent pipeline within the Group and senior management succession planning
Reviewed the training and development process for Directors
Reviewed the time commitments of the Non-Executive Directors
Reviewed the skills and independence of each of the independent Non-Executive Directors and subsequent recommendation that each of them be elected or re-elected at the Company’s AGM to be held on 8 June 2017
Updated the Terms of Reference of the Committee, acknowledging the establishment of a Nomination Committee for AAISL
The full Terms of Reference of the Nomination Committee can be found at http://www.theaaplc.com/investors/corporate-governance/board-and-committee-terms-of-reference.
Board evaluation
The Board recognises the need to maintain its development and continually strengthen Board processes. This involves a continuous process of:
Reflecting on past performance and implementation of previous recommendations or actions
Consideration of future training, skills and diversity requirements
Identification and implementation of new recommendations or actions to improve performance
Year 1 Internal evaluation
Year 2 Internal evaluation Actions from Year 1Appoint consultancy to assist with Year 3
Year 3 External evaluation
The Board recognises that the process of improving its effectiveness requires continuous attention, particularly in respect of actions such as ensuring the correct Board balance, succession planning and Board focus.
The Board undertook a rigorous and formal internal evaluation of its own performance and that of its Committees and Directors during the year. The Board believes that an external evaluation every three years will bring new insight into its processes and performance. In the coming year, the Board’s first external evaluation will take place. The Board has begun the process of planning for that external evaluation and has appointed Condign Board Consulting Limited to undertake the review.
The 2017 Board evaluation focused on the following areas of its role and performance:
Accountability, governance, dynamics, process and culture
Composition of the Board and its Committees and their balance and diversity of skills, experience, independence and knowledge, including consideration of gender diversity
How the Board and its Committees work as individual units as well as their interaction with each other and with management
The performance of individual Directors
Other factors relevant to the Board’s effectiveness such as management of meetings and the quality of information provided by management
How to improve the strategy and budgeting processes
The 2016 and 2017 internal Board evaluations included detailed questionnaires and interviews by the Senior Independent Director and Company Secretary. The results of the Board evaluation were reviewed by the Nomination Committee at the March 2017 meeting. The Board received the feedback and was given the opportunity to discuss the results.
The scores of the 2017 internal evaluation were positive in most areas. The Board acts as a strong team with a good mix of skills and experience. The Non-Executive Directors bring independent challenge and the Group also benefits from their experience and skills through a successful mentoring programme with the senior management team.
Improvements had been made to the actions resulting from the 2016 Board evaluation including the improvement of Board committee effectiveness; praise was given to the Company Secretary for facilitating this success.
The key points for action identified for the forthcoming year are succession planning, diversity and increasing the number of board meetings to increase time focused on strategic issues. Steps have been taken to address each of these points.

AA plc Annual Report and Accounts 2017 57
Our B
usinessG
overnanceFinancial Statem
entsO
ur Performance
From the feedback of the internal Board evaluation the following action points were identified and have been or are being progressed:
More timely access to financial information
Develop a formalised process for executive succession planning
Develop a mentoring programme to support the senior management team, especially during the transformation programmes
Increase diversity of skills and experience at Board level, including gender
Encourage open discussions and challenges to decisions at meetings
Improve the effectiveness of Board and committee processes
Ensure meeting packs are received with plenty of time for consideration
Strengthen relationships with brokers, banks, external auditors and other key advisers
These key findings have been implemented in the current financial year and progress will be considered as part of the next performance evaluation and reported in next year’s Annual Report.
Review of the effectiveness of the Executive ChairmanThe effectiveness of the Executive Chairman was considered as part of the Board evaluation process. The feedback provided in the questionnaire was followed by 1-2-1 meetings where responses were discussed with the Senior Independent Director and Company Secretary. The results of the review were unanimously positive. The review confirmed that the Board is satisfied that the Executive Chairman is fulfilling his duties and wish him to continue in the combined role in the coming year.
Succession planning including for the Executive Chairman after the 2017 financial yearSuccession planning has been a key focus for the Committee during the current year. It was previously published that the Board’s intention was for Bob Mackenzie’s combined role of Executive Chairman and CEO to be split in the 2018 financial year. Given that the transformation is still underway, the Board wishes for Bob Mackenzie to continue in the combined role for the 2018 financial year but will advance the process for succession planning this year.
The Committee has started a formalised process of defining the split roles and listing the necessary skills and experience required for the new roles. In the coming year, it will start considering potential successors for the roles to ensure the handover is managed smoothly. The Committee is seeking to ensure that the appointed individual satisfies the criteria for the role in order to promote the success of the business and lead future strategy.
At each meeting, the Committee has considered succession planning in its wider sense, identifying talent and setting training plans to prepare individuals for future roles. This included succession planning for other Directors and the senior management team.
The Committee will continue to ensure that there are sufficient succession plans in place for all executive positions throughout the Group.
DiversityThe Committee recognises the importance of diversity at Board level and throughout the Group and is committed to ensuring that this remains a central feature of the Board and our senior management team. In the interests of the business and our shareholders, the Committee continues to ensure that the business benefits from a representative Board and workforce with a diverse range of skills, experience and knowledge.
We are committed to increasing the representation of women on the Board and aim to develop a clear plan to achieve Lord Davies’ extended target for Women on Boards of 33% female membership by 2020. All aspects of diversity, including ethnic representation, are considered at each level of the recruitment process and the AA supports the recommendations of Sir John Parker’s review increasing ethnic diversity at Board level, developing candidates for Board positions and enhancing transparency and disclosure. These changes can only be achieved by either an additional appointment to the Board or replacement when another Director steps down, neither of which was necessary or occurred during the past year, but the Board will actively consider this during the coming year.
To achieve these targets, the Committee is working closely with the Human Resources Director to develop clear recruitment plans which recognise the need to increase the diversity of the Board, while being mindful that appointments are made on merit.
In the context of the wider workforce, our employment policies and practices reflect a culture where decisions are based on individual ability and potential in relation to the business needs. We are committed to ensuring that individuals are treated fairly and in a non-discriminatory way throughout the recruitment process and at all stages of their employment.
At the AA we recognise the additional challenges faced by disabled people in gaining employment and we are members of the Disability Confident scheme. We have regular discussions with all disabled employees to consider changes we can make to ensure their ongoing career development.
The Committee’s plan for the 2018 financial year includes:
Implement actions from the 2017 Board performance evaluation, particularly around succession planning and diversity.
Begin selection process in connection with the separation of the Executive Chairman’s two roles
Continue succession planning for the Board and key roles across the business
Planning for external independent Board evaluation in 2018
Develop diversity action plan – to ideally meet Lord Davies’ target of 33% women on the Board by 2020 and the recommendations on ethnic diversity made by Sir John Parker in his 2016 review
Continue to operate the successful mentoring programme with the senior management team
Develop and deliver training and induction programme for the Board and senior management
Consider the skills, availability and performance of each Board member and reflect those results in recommendations on the election and re-election of Directors at the Annual General Meeting.
John Leach Nomination Committee Chairman

58 AA plc Annual Report and Accounts 2017
Risk Committee Report
Accountability
“ The achievement of our strategic objectives, fair customer outcomes and the long term sustainable growth of our business requires an embedded and effective risk management culture and process.”
Andrew Blowers Chairman of the Risk Committee
Dear Shareholder,
I am pleased to present the report of the Risk Committee (the Committee) for the financial year ended 31 January 2017.
Effective risk management is a core part of AA governance and culture. Over the last year, the Committee has ensured that the Risk Management Framework and our agreed risk appetite continue to be appropriate for the AA as the transformation initiatives are rolled out. The Committee plays a key oversight role for the Board and this report is presented to demonstrate our approach to risk control and accountability. It sets out the activities and initiatives that we have undertaken during the 2017 financial year and our plans for the forthcoming year.
MEMBERSHIP AND ATTENDANCE DURING THE YEAR
The Committee meets at least quarterly and comprises four independent Non-Executive Directors. The current members are set out below, together with their appointment dates and attendance at meetings.
Name of memberDate appointed
to Committee A B
% of possible
meetings attended
Andrew Blowers (Chairman) 13 Nov 2014 4 4 100%John Leach 13 Nov 2014 4 4 100%Andrew Miller 25 Feb 2015 4 4 100%Suzi Williams 01 Oct 2015 4 4 100%NotesA = Number of meetings the member attended.B = Maximum number of meetings the member could have attended.
Supporting the Committee is an Executive Risk and Compliance Committee (ERCC) which meets ten times a year. This is an executive body, made up of senior executives and functional experts. Its role is to implement the Risk Management Framework and report to the Committee on the effectiveness of the management of risk, new and evolving risks and the effectiveness of the risk management culture and processes. There is also an Audit, Risk and Compliance Committee (ARCC) for the regulated Insurance broking subsidiary, Automobile Association Insurance Services Limited, and an ARCC for the Insurer, AA Underwriting Insurance Company Limited, which also report to the Committee in respect of their work.
The Committee works closely with the ERCC, ARCCs, Head of Compliance and Group Risk Manager and invites executive members of the Group to attend or present, as appropriate.
Risk Committee roles and responsibilities
Overall responsibility for overseeing the management of risks, compliance with our Risk Management Framework and the agreed risk appetite of the Group lies with the Board. These responsibilities are delegated to the Executive Directors of the Board for the day-to-day management of risks and the process is monitored by the Committee (working alongside the Audit Committee) each of whom reports to the Board.
The Committee is concerned with the business of the entire Group and its authority extends to all relevant matters relating to the Company and its business units and subsidiaries. The Committee advises the Board on the Group’s overall risk appetite, tolerance and strategy, and oversees and advises the Board on the current risk exposures of the Group and future risk strategy.
Full Terms of Reference of the Committee can be found at http://www.theaaplc.com/investors/corporate-governance/board-and-committee-terms-of-reference

AA plc Annual Report and Accounts 2017 59
Our B
usinessG
overnanceFinancial Statem
entsO
ur Performance
Risk Management Framework
For risk management to work effectively in the AA, the following are required:
An effective risk culture in place with risk management embedded in the business
The timely identification, reporting and management of the principal risks
The regular review and updating of risk registers, including the assessment of risks and their respective controls
Timely and accurate reporting of incidents and near misses
The operation of management “snap checks” (control effectiveness tests) to confirm the adequate operation of key controls
The implementation and tracking to resolution of management actions for unacceptable risks, deficient controls, incidents and failed “snap checks”
The reporting of key risk indicators (KRIs)
Engagement from all employees to effectively manage risk and operate the organisation’s control framework
The effective operation of the above is monitored by the Committee. The AA’s Risk Management Framework is reviewed annually by the Committee.
Group risk appetite
It is the responsibility of the Board to set and agree the Group risk appetite and this is regularly reviewed by the Committee. The appetite takes into account the level of risk and risk combinations that the Board is prepared to take to achieve the Company’s strategic objectives together with the level of risk shock that the Group is able to withstand. The AA’s Risk Appetite Framework policy outlines the amount of risk the organisation is willing to take.
Principal risks and uncertainties
The Board has identified, and monitors on an ongoing basis, the principal risks to the AA, including those risks that would threaten its business model, future performance, solvency or liquidity. Set out on pages 32 to 35 are the risks the Board considers to be of most significance to the Group in terms of preventing or restricting execution of our strategy, together with the mitigating activities that we have put in place to try to prevent such risk materialising. We recognise that other risks are still present and seek to ensure that they are managed accordingly.
It is recognised that the Group is exposed to a number of risks, wider than those listed. However, we have disclosed those of most concern to the business at this moment in time, including those that have been the subject of debate at recent Board and committee meetings.
Risk Committee activity during the 2017 financial year
The Committee receives regular reports on risk management which include:
The status of the principal risks and the top risks identified by executive management including horizon and emerging risks
Material incidents and near misses
Control effectiveness details
Progress in completing actions to rectify control shortcomings
The Group Risk Appetite Dashboard
KRI exceptions
Risk management process Key Performance Indicators
Minutes of the ERCC
During the year, in addition to the standard reports from the Group Risk Manager and the Compliance Officer, the Committee has received presentations from various areas of the business to enable us to review and consider specific risks. Subjects covered have included:
Information/cyber security
Data protection and retention
Business transformation
IT transformation
Duplicate breakdown cover for Members
Proposals as to how to treat Members who have moved and their address is no longer known
MasterCard/Visa processing
Commercial road income forecasting
The disposal of AA Ireland
Updates from the Chairs of the ARCCs
Initiatives during the 2017 financial year
In our annual report for the 2016 financial year I noted that we intended to make further progress in embedding a sustainable risk management culture into the AA with further focus on the mitigation and management of the principal risks. The status of the principal risks and the changes to them during the year are reported on pages 32-35. I am pleased to report that good progress towards enhancing the risk management process has been made as detailed below:
Enhanced business assurance in the “first line” business areas
Enhanced corporate governance for our broker subsidiary Automobile Association Insurance Services Limited including the establishment of a Culture and Conduct Committee in addition to the ARCC
Establishment of the Insurer’s ARCC and Risk Appetite Framework
Enhancements to our product risk matrix and the development of a supplier risk matrix
Initiatives for the 2018 financial year
Keeping our risk framework and culture fresh and relevant to the business, including simplifying the risk framework where possible, ensuring the Risk Management Framework adds additional value to the business and provides a platform for employees to speak up and voice any concerns they may have
Using the Risk Management Framework to help support the ongoing cultural transformation in the AA
Improving the process for incident management to better learn from errors and ensure more timely effective resolution and the prevention of similar incidents
Continued improvement to historic poor practices and processes
Improving the quality of the reporting that flows to the Committee
Andrew Blowers Chairman of the Risk Committee

60 AA plc Annual Report and Accounts 2017
Audit Committee Report
Effectiveness
“ The Audit Committee continues to provide sound oversight of the Group’s corporate governance, risk management and financial reporting process.”
Andrew Miller Audit Committee Chairman
Dear Shareholder,
I am pleased to present the report of the Audit Committee (the Committee) for the financial year ended 31 January 2017.
During the year, we have consolidated the work we began in our first two years, improving our financial reporting, internal controls and the quality of this report. Relationships with the business, shareholders and external and internal auditors are now well established and the workings of the Committee are strongly embedded.
The major focuses for the business this year have included the IT transformation project and developing and enhancing the business’s culture. The Committee has played a key role in these, taking a keen interest in the progress of initiatives.
A major change in the audit landscape this year was the publication of the Financial Reporting Council’s new guidance on audit committees, which will apply to the Group from the 2018 financial year. In anticipation of this and in the spirit of our early adoption of the new guidance, we have taken as the theme for this 2017 report two key concepts from the new guidance: that the Committee’s relationships with the Board, executive management, and internal and external auditors are characterised by a frank, open working relationship and a high level of mutual respect; and that our role is one of oversight, assessment and review. It is through these themes that we play our role in the transformation project and contribute to the development of the Group’s culture.
We have, since the end of the year, commenced an audit tender process for the appointment of a new auditor with effect from the 2019 financial year. The Committee plays a key oversight role for the Board and this report is presented to demonstrate our approach to accountability, setting out the key issues that we have considered during the 2017 financial year and what we plan to focus on during the forthcoming financial year.
MEMBERSHIP AND ATTENDANCE DURING THE YEAR
The Committee meets at least quarterly and currently comprises three independent Non-Executive Directors. The members are set out below, together with their appointment dates and attendance at meetings.
Name of memberDate appointed
to Committee A B
% of possible
meetings attended
Andrew Miller (Chairman) 26 Jun 2014 4 4 100%John Leach 26 Jun 2014 4 4 100%Andrew Blowers 13 Nov 2014 4 4 100%NotesA = Number of meetings the member attended.B = Maximum number of meetings the member could have attended.
The Committee comprises three members, all of whom are Independent Non-Executive Directors, satisfying the requirements of the UK Corporate Governance Code and the Committee’s Terms of Reference.
As Chairman of the Committee, I invite the Executive Chairman and the Chief Financial Officer to attend meetings of the Audit Committee where appropriate and the Company Secretary attends as Committee Secretary. The Head of Internal Audit also attends regularly, except where performance of internal audit is discussed. Jonathan Roe, as Chair of the Audit, Risk and Compliance Committee (ARCC) of our regulated insurance broker, Automobile Association Insurance Services Limited (AAISL), also regularly attends to ensure consistency across the Group. Other senior executives may attend as required to provide information on matters being discussed which fall into their area of responsibility. The Committee considers that receiving these updates helps to provide us
AA plc Annual Report and Accounts 2017 61
Our B
usinessG
overnanceFinancial Statem
entsO
ur Performance
with an excellent insight into the business’s challenges and aspirations and an opportunity to challenge and discuss these, while sharing our extensive experience and weighing in with an independent perspective.
The external auditors, Ernst & Young LLP, also attend each meeting, except where we discuss their independence, performance and reappointment, fees or audit tendering.
Audit Committee roles and responsibilities
The Committee members have an appropriately wide range and depth of relevant financial and commercial experience. These skills ensure that the Committee has the necessary competencies to fulfil its Terms of Reference, to provide an independent perspective, and to support effective governance. Furthermore, all three members of the Committee meet the specific requirement for recent and relevant financial experience. I am a member of the Institute of Chartered Accountants of Scotland and have recent specific experience as CFO of Trader Media Group, which included Autotrader. John Leach is a Fellow of the Institute of Chartered Accountants and the Association of Corporate Treasurers. Andrew Blowers has extensive financial services experience (with a particular focus on the insurance industry) and has worked in an advisory capacity with the Financial Ombudsman Service. The Board therefore considers that the Committee meets the UK Corporate Governance Code requirements in regards to its composition and expertise.
All three members of this Committee sit on the Risk Committee and I, as Committee Chairman, also sit on the Remuneration Committee, to facilitate efficient cross-communication and ensure that all risk and audit issues are addressed effectively.
The Committee meets regularly to fulfil the following core responsibilities:
Monitor the integrity and effectiveness of our financial reporting
Review and recommend the statutory, preliminary final and interim financial results to the Board
Maintain oversight of financial and other regulatory requirements and make recommendations as to the impact on our financial statements
Review and approve the internal audit plan for the following financial year, ensuring it is aligned with our key strategic priorities
The Committee ensures that regular updates are provided to the Board on how the Committee has discharged its responsibilities.
Full Terms of Reference of the Audit Committee can be found at www.theaaplc.com/investors/corporate-governance.aspx.
Audit Committee activity during the 2017 financial year
The Committee undertook the following activities during the year:
Considered the tendering of external audit services under the new regulatory regime and, as a result has now commenced an audit tender process
The Audit Quality Review team of the FRC, completed a review of the external auditors’ 2016 audit of the Company. No significant issues were noted. The results of this review were discussed and minor improvements to the external audit process for future years were subsequently agreed
Oversaw delivery and outcomes of the IT and business transformation programmes
Reviewed and made recommendations in relation to the statutory, preliminary final and interim financial results
Reviewed cashflows
Oversaw data protection and management of risk
Reviewed debt and financial instruments
Approved and oversaw key policies and practices
Reviewed the internal audit and compliance assurance plan, design and delivery, with particular focus on key strategic priorities
Assessed the effectiveness of the internal audit function and continued to keep under review the adequacy of internal controls
Reviewed and monitored the effectiveness, tenure and independence of the external auditor and provided advice to the Board as to their reappointment or removal
Undertook a thorough review of the Annual Report and Accounts to ensure that the narrative messages are consistent and accurately reflect the financial statements and that the information as a whole is fair, balanced and understandable
This year AAISL also established a new Culture and Conduct Committee. The Audit Committee received verbal updates from the AAISL ARCC Chairman at each of the quarterly meetings
The Committee’s action plan for the 2018 financial year
Looking ahead, the Committee will remain focused on the audit and assurance processes within the business, and maintain its oversight of financial and other regulatory requirements. The action plan for the 2018 financial year will focus on:
Reviewed submissions from audit firms to the audit tender and determine the appointment of the next auditor with effect from the 2019 financial year
Reviewed and recommendation of statutory and interim results
Reviewed of cashflow
Reviewed of assurance plan, design and delivery, with particular focus on key strategic priorities
Approval of internal audit plan and oversight of key policies and practices
Assessing the effectiveness of the internal audit function and keeping under review the adequacy of internal controls
Undertaking a thorough review of the Annual Report and Accounts to ensure that the narrative messages are consistent and accurately reflect the financial statements and that the information as a whole is fair, balanced and understandable

62 AA plc Annual Report and Accounts 2017
Audit Committee Report continued
Significant issues
The Audit Committee has assessed whether suitable accounting policies have been adopted and whether management has made appropriate judgements and estimates.
Throughout the year, the finance team has worked closely with Ernst & Young LLP to ensure that the Group provides the required level of disclosure regarding the significant issues considered by the Committee in relation to the financial statements, as well as how these issues were addressed, while being mindful of matters that may be business sensitive.
The main areas of judgement that have been considered by the Committee to ensure that appropriate rigour has been applied are set out below.
The issue and its significance Work undertaken Outcome and actions
Revenue recognition
The accounting policies for revenue recognition prepared by management have been presented to the Committee which has concluded that they remain consistent and appropriate. The Committee has reviewed management’s assessment of the internal control framework over revenue. This assessment has highlighted some issues with the initial revenue recognition of Roadside Assistance Membership subscriptions by the Membership database as well as the additional controls that management has put in place to identify and correct for these issues. The Committee notes that the current IT transformation plans include the replacement of the Membership database which will improve the controls over revenue recognition in this area.
Management has also carried out an impact assessment to determine the impact of adopting IFRS 15 “Revenue from contracts with customers” which is effective for the Group from 1 February 2018.
The Committee agrees with management’s assessment that the internal controls have remained consistent and effective during the year. The Committee will continue to monitor this area.
Based on the impact assessment of adopting IFRS 15, management has concluded that there will be no material impact on revenue from adopting this standard.
Cyber security Review of existing administrative and technical controls in place to manage the risks associated with cyber security. This was based upon activity conducted by the Information Security team and included testing undertaken by an independent trusted security partner. This highlighted a number of areas of focus where remediation actions were needed to address known issues and vulnerabilities.
Work has been undertaken to implement and strengthen controls in this area, especially around access, licence management, use of PCs, laptops and databases. Oversight of this is now managed by the Risk Committee and in the coming year the Audit Committee plans to review data in more detail.
An IT & Change Senior Internal Auditor joined the internal audit team in late 2015 to provide additional oversight.
Duplicate breakdown cover
Management has provided £10m for refunds due to customers who have purchased duplicate Roadside Assistance cover. These customers are both personal Members and also hold Added Value Accounts (AVAs) with the Group’s banking partners.
Management has identified a group of customers for whom the benefit of holding both forms of cover is not clear. While the situation is being remediated, a provision has been made reflecting management’s assessment of the cost of remediation.
The duplicate breakdown cover provision requires the use of assumptions about the likelihood of refunds being required. Therefore, the value of the provision can change due to changes in the underlying assumptions.
The Committee has reviewed the methodology used in the valuation of the provision and the assumptions used and has concluded that the accounting treatment is appropriate.
This includes the presentation of the cost in the income statement which is split between exceptional revenue and exceptional finance costs.
The Committee received updates during the year from the Chair of the AAISL ARCC in respect of the governance and controls over the ongoing remediation programme. Reviews in this area are also scheduled by both the Compliance Monitoring and Internal Audit functions.
Pensions accounting
The Group’s defined benefit pension scheme is a significant net liability on the Group’s balance sheet (see note 25 to the consilidated financial statements) and the value of the scheme will fluctuate due to changes in the underlying assumptions. The main assumptions which drive these fluctuations are forecast corporate bond yield rates and the forecast inflation rate.
The Committee has considered both the process that management undertook to finalise the assumptions and how these assumptions benchmark against the market. The Committee has concluded that the assumptions are consistent with the prior year and the overall valuation of the net liability is appropriately balanced.
The Committee has also reviewed the disclosures relating to the defined benefit pension scheme and is satisfied that they are appropriate.
Impairment of goodwill
Management has prepared discounted cashflows based on the latest Board approved strategic plan. These discounted cashflows have been compared to the carrying value of goodwill. No indication of impairment of goodwill has been identified.
The Committee has considered the basis of preparation of the discounted cashflows and is satisfied that these reflect the latest strategic plan of the Group and that there is sufficient headroom compared to the carrying value of goodwill.

AA plc Annual Report and Accounts 2017 63
Our B
usinessG
overnanceFinancial Statem
entsO
ur Performance
External auditor
Effectiveness, tenure and independence of the external auditorThe Committee manages the relationship with the Group’s external auditor on behalf of the Board. The Committee considers annually the scope, fee, performance and independence of the external auditor as well as whether a formal tender process is required.
The AA became a constituent member of the FTSE 250 index in March 2015 and Ernst & Young LLP has been the Group’s auditor since the audit for the year ended 31 January 2008. The Company fully supports audit partner rotation and refreshment. Kathryn Barrow is the current audit partner, having been appointed during the 2016 financial year.
After careful and thorough review, spread across two Committee meetings, the Committee believes the independence and objectivity of the external auditor and the effectiveness of the audit process are safeguarded and remain strong. We have received confirmation from Ernst & Young LLP that they remained independent and objective within the context of applicable professional standards.
We have ensured that management confirmed compliance with our Group’s policies on the employment of former Ernst & Young LLP employees and on the use of Ernst & Young LLP for non-audit work. The latter issue is discussed in further detail below.
In recognition of the FRC Ethical Standard 2016, the Committee advised the Board, and subsequently approved the decision, to commence a tender process for external audit services. The process will take place during the 2018 financial year with the outcome planned to take effect for the year ended 31 January 2019.
Audit fees
Details of fees paid to our auditors are listed in note 31. The audit fee for the 2017 financial year was £1.0m.
Non-audit fees
Project2017
£’0002016
£’000
March 2015 refinancing – 500Preparation of subsidiary for sale – 360AA Ireland disposal 201 135FRS 101 conversion 20 –December 2016 refinancing (estimated fee as agreed at the start) 208 –Total non-audit fees in financial year 429 995
The Committee is mindful of engaging the statutory auditor for non-audit services and of potential issues of independence and considered the issue of non-audit fees at its March 2016 and March 2017 meetings. As a result of the work required for the sale of AA Ireland, and the refinancing announced on 17 November 2016, it was acknowledged that non-audit fees for this financial year were high, although not as high as they had been in the previous two years, due to the refinancing and placing and open offer in the 2016 financial year and the IPO in the 2015 financial year.
The Committee recognises that, in some instances, it is more timely and cost-effective for our audit firm, who are already familiar with the Group and its finances, to advise on non-audit matters. This is limited to work where the risk of the auditors’ independence being impaired is low and where appropriate safeguards can be put in place. This has included in the year, work carried out in respect of the disposal of AA Ireland and work required by regulation in respect of the group refinancing.
The Group has an external auditor independence policy (the Policy) in place which is reviewed annually by the Committee in light of relevant ethical guidance and the Committee seeks to ensure that it is adhered to.
The Group acknowledges and supports the FRC Revised Ethical Standards and our Policy reflects these revised standards and accordingly, sets out our commitment to maintaining a 70% cap on non-audit fees with the external auditor. The Committee will monitor compliance with the Policy as part of its role in reviewing auditor independence and the effectiveness of the audit process.
AA plc has complied throughout the 2017 financial year with the provisions of the Statutory Audit Services Order 2014 issued by the Competition and Markets Authority.
Internal controls
The Committee works closely with the Risk Committee and has completed its review of the Group’s systems of internal controls and their effectiveness for the 2017 financial year and has done so in accordance with the requirements of the FRC’s Guidance on Risk Management, Internal Control and Related Financial and Business Reporting document issued in September 2014 (FRC Guidance). It should be noted that the Group’s risk management systems are designed to manage rather than eliminate the risk of failure to achieve business objectives and they can only provide reasonable and not absolute assurance against material misstatement or loss.
The review included, among other things, consideration of:
The Company’s risk appetite (as described in the risk management section on pages 30-31) and the outcome of a survey undertaken in respect of the risk culture within the organisation
The operation of the risk management and internal control system, including the output from an internal audit review of this area
The assessment of risks within the three-year business planning process
The principal risks facing the business, along with the changes to those risks during the year and the mitigating actions being taken in respect of them (see details in the risk management section on pages 32-35)
The outputs from the risk incident and near miss reporting process
In the Committee’s opinion, there were no significant failings noted from this review. The Group has adopted acceptable and appropriate accounting policies and made appropriate estimates and judgements as and where necessary. The Committee also believes that this Annual Report and Accounts provides the information necessary for shareholders to make an assessment as to the Group’s performance, business model and ongoing strategy.
The Committee also:
Ensures that there is an ongoing process for identifying, evaluating and managing the principal risks faced by the Company and the Group
Confirms that the systems have been in place for the year under review and up to the date of approval of the Annual Report and Accounts
Confirms that they are regularly reviewed by the Board
Ensures that the internal control systems accord with the FRC Guidance
Further details on our risk management can be found on pages 30-35 and in our Risk Committee Report on pages 58-59.

64 AA plc Annual Report and Accounts 2017
The Group’s internal control and risk management systems ensure the accuracy and reliability of financial reporting. The key features of those systems include:
Documented financial governance framework
Comprehensive budgeting and reporting processes
Defined lines of accountability and delegation of authority
Review and approval of key accounting policies and estimates
Preparation of consolidated accounts
Investment appraisal process for evaluating major capital expenditure
An embedded whistleblowing policy
Project governance and information security
Fair, balanced and understandable
At the request of the Board, the Committee considered whether, in its opinion, the Annual Report and Accounts for the 2017 financial year is fair, balanced and understandable and whether it provides the information necessary for shareholders to assess the Group’s performance, business model and strategy.
As part of this process, the Committee discussed what information and level of debate and insight it would need in order to satisfy Members that financial information was fair, balanced and understandable.
The Committee was provided with a copy of the Annual Report early in the drafting process in order to assess the broad direction and key messages being communicated. The Committee received further drafts prior to the meeting at which it would be requested to provide its final opinion.
When forming its opinion, the Committee reflected on the information it had received and its discussions throughout the year. In particular, the Committee considered:
Is the report fair?
Is the whole story presented clearly and articulately?
Are the key messages in the narrative reflected in the financial reporting?
Has any sensitive material been omitted?
Are the KPIs disclosed at an appropriate level based on the financial reporting and how the business measures performance?
Is the reporting on the business segments in the narrative reporting consistent with that used for the financial reporting in the financial statements?
Is the report balanced?
Is there consistency between the narrative reporting in the front and the financial reporting in the back of the report?
Do you get the same message when you read the two parts independently?
Are the statutory and adjusted measures explained clearly with appropriate priority and prominence?
Are the key judgements referred to in the narrative reporting and the significant issues reported in this Audit Committee Report consistent with the disclosure of key estimation uncertainties and critical judgements set out in the financial statements? How do these compare with the risks that Ernst & Young LLP is planning on including in its report?
Is the report understandable?
Is there a clear and understandable structure and presentation to the report?
Is the language clear and the layout easy to navigate with good linkage throughout in a manner that reflects the whole story?
Are the important messages highlighted appropriately throughout the document?
Following its review, the Committee is of the opinion that this Annual Report and Accounts for the 2017 financial year is representative of the year, is consistent with its understanding of the business and results, and presents a fair, balanced and understandable overview, providing the necessary information for shareholders to assess the Group’s performance, business model and strategy.
Andrew Miller Chairman, Audit Committee
Audit Committee Report continued

AA plc Annual Report and Accounts 2017 65
Our B
usinessG
overnanceFinancial Statem
entsO
ur Performance
“ Our approach to remuneration supports a strong focus on performance, reflects our key strategic objectives and results in effective alignment between the Executive Directors and our shareholders.”
Simon Breakwell Chairman of the Remuneration Committee
Dear shareholder,
On behalf of the Remuneration Committee I am pleased to present our third Directors’ Remuneration Report as a public limited company.
We are now two years into our transformation and growth strategy. We continue to build momentum towards our objective to strengthen the AA’s position as the UKs pre-eminent Membership services organisation. Our remuneration arrangements are operated in this context.
Remuneration in respect of the 2017 financial year
In the 2017 financial year, we maintained our progressive dividend policy with payments being made to shareholders in June 2016 and October 2016. During the year we sold our Irish subsidiary and used the proceeds to reduce debt in line with our debt reduction strategy. Building on the major steps taken during the previous financial year, we conducted a further refinancing of our debt structure, which has reduced the ongoing annual cash interest costs payable by the Company by an additional £10m per annum. Investment in the business has also continued and the investment in new IT systems will support improvement in customer experience and efficiency gains.
The year-end Trading EBITDA of £403m, once again represents a solid outcome in light of the transformational activity which has taken place during the year.
The Trading EBITDA for the year and performance against the strategic and individual objectives set resulted in bonus outcomes of around 60% of the maximum for the Executive Directors. Further details are set out in the main body of the Remuneration Report.
Although the Company implemented a Performance Share Plan (PSP) in 2015, no awards have yet been granted under this plan. The interests held by participants in share arrangements implemented at the time of Admission are also not yet due to be performance tested. Therefore the Executive Directors did not receive any long-term incentive payments in respect of the 2017 financial year.
Directors’ Remuneration Report
Remuneration

66 AA plc Annual Report and Accounts 2017
Directors’ Remuneration Report continued
Encouraging share ownership
Bob Mackenzie and Martin Clarke have personally chosen to build and retain very significant shareholdings in the Company. These interests demonstrate their commitment to the strategy and provide alignment with shareholders.
The Board is supportive of encouraging a culture of share ownership across the wider organisation. We have been encouraged by the take-up of the all-employee share incentive plan (ESIP) in the previous two years. We therefore intend to operate the ESIP annually, from this year, and we hope more of our employees sign up to and remain in the ESIP to share in the future success of the Company and align their interests with those of our shareholders. This year’s take up was pleasing at 36% of eligible employees.
Salary and bonuses in respect of the 2018 financial year.
Salary levels for the Executive Directors will be reviewed later in the year, so that they are considered at the same time as other employees. This is to ensure that any decisions regarding executive director salaries take into account the approach agreed for the wider workforce.
The maximum bonus opportunity and the metrics for the 2018 financial year will remain unchanged. The majority of the bonus for the coming year (70%) will therefore continue to be based on Trading EBITDA.
Consultation on long term share awards
The Management Value Participation Share structure (MVP Shares), put in place at the time of Admission, was originally designed to conclude in 2019. This award is geared towards creation of total shareholder return thereby aligning the interests of management with those of shareholders. Over recent months the Committee has spent considerable time reviewing the Group’s incentive strategy beyond the timeframe of the original MVP Shares.
At the time of writing, the Committee is in the process of consulting with major shareholders regarding the best way to align incentive arrangements with the interests of shareholders and the strategic ambitions of the Group over the longer-term. To the extent that this review process is concluded in the coming weeks, the Committee may set out further detail regarding proposals for the coming year in the notice for the 2017 AGM.
Although the timing for this process means that details of proposals are not included in this Remuneration Report, the Committee recognises the importance of implementing the right structure for the AA. The proposals must fit the needs of the business and complement the strategy both during and beyond the timeframe of the transformation. We are also keen to ensure that major shareholders are supportive of the direction of travel before the proposals are finalised.
I hope that you find the report to be clear and helpful. The Committee remains committed to keeping shareholders informed regarding key decisions, and a further update regarding our current incentive review will be provided in the notice for the 2017 AGM.
Simon Breakwell Chairman of the Remuneration Committee
MEMBERSHIP AND ATTENDANCE DURING THE YEAR
Name of MemberDate appointed to
Committee A B
% of possible meetings attended
Simon Breakwell 17 September 2014 6 6 100%Andrew Miller 26 June 2014 5 6 83%Suzi Williams 1 November 2015 6 6 100%
A = Number of meetings the Member attended.
B = Maximum number of meetings the Member could have attended.
The Senior Independent Director and Human Resources Director were invited to attend meetings during the year. Deloitte LLP, attend as advisors, where appropriate to do so.

AA plc Annual Report and Accounts 2017 67
Our B
usinessG
overnanceFinancial Statem
entsO
ur Performance
ANNUAL REPORT ON REMUNERATION
This section of the Directors’ Remuneration Report sets out a summary of how we intend to implement the Policy in the forthcoming financial year, as well as details of how we implemented the Policy and the remuneration paid to Directors during the 2017 financial year. Where information has been audited, this has been stated. The Remuneration Committee Chairman’s statement provides further context to the decisions made.
Implementation for the 2018 financial yearThe following table summarises how remuneration arrangements will be operated for the 2018 financial year.
SALARY AND BENEFITS
The current salary levels of the Executive Directors (which are in line with last year) are set out in the table below. The salary for the Executive Chairman has not been increased since Admission in 2014 and that of the CFO since appointment to that role on 1 February 2015. The 2018 salary increases for the wider employee population will be determined in the coming months. In order to ensure a consistent approach, the Committee will review salary levels for the Executive Directors only after the approach for other employees has been agreed.
2017 salary
Bob Mackenzie £750,000Martin Clarke £480,000
Benefits and pension arrangements will be in line with last year.
ANNUAL BONUS
The maximum opportunity for the Executive Directors will remain unchanged at 120% of salary.
For the 2018 financial year, the weighting on financial objectives is unchanged at 70% of the overall bonus. The performance targets in respect of the 2018 bonus will be based on:
Weighting
Trading EBITDA targets 70%Individual/strategic objectives 30%
The non-financial objectives are subject to a profit underpin. The precise performance targets for the coming year are considered to be commercially sensitive at present, but the Committee intends to provide expanded disclosure of targets on a retrospective basis.
The 2018 bonus will again be subject to both malus and clawback provisions.
LONG TERM SHARE AWARDS
No awards have yet been granted in respect of 2018. As noted in the Remuneration Committee Chairman’s statement, the Committee is currently in the process of consulting with major shareholders regarding the strategy for long-term incentives.
NON-EXECUTIVE DIRECTORS
The current fees payable to the Non-Executive Directors (unchanged from last year) are shown in the following table.
Role Fee
Senior Independent Director £170,000Basic fee for other Non-Executive Directors £80,000Additional fee for chairing of Board Committee (other than Nomination Committee) £15,000Additional fee for chairing of Group Insurer Board £20,000
Implementation in the 2017 financial year
Single total figure of remuneration (audited)
EXECUTIVE DIRECTORS
The tables below set out the total remuneration for the Executive Directors for the year ended 31 January 2017.
Bob Mackenzie Martin Clarke
2017 £000
2016 £000
2017 £000
2016 £000
Salary 750 750 480 480Benefits 17 12 24 16Retirement benefits 88 88 56 56Annual bonus 514 707 346 414Long-term incentives1 – – – –Total 1,369 1,557 906 966
1 As at 31 January 2017 the only long-term incentive granted to Executive Directors is the MVP shares. As the performance conditions are not tested until June 2017, the performance conditions are considered to not be substantially complete by year end and therefore no amount is shown.

68 AA plc Annual Report and Accounts 2017
Directors’ Remuneration Report continued
Additional notes to the table
SalaryThe 2017 salary levels for Bob Mackenzie and Martin Clarke were £750,000 and £480,000 respectively.
BenefitsThe benefits for the Executive Directors include a car related benefit, private medical insurance, permanent health insurance, and life assurance. Car allowance (or cash alternative) is provided. Life cover is 4 x annual salary payable should death in service occur. Private medical insurance is provided for the executive only (family cover at the additional cost to the Executive Director). Permanent health insurance cover equal to 75% of the Executive Director’s annual salary is provided (as long as the Executive Director is a member of the AA UK pension scheme, or otherwise by arrangement).
Retirement benefitsThe amount set out in the table represents the Company contribution to the Executive Directors’ retirement planning. The Company makes contributions equal to 11.7% of annual basic salary to both of the Executive Directors for personal arrangements.
Annual bonusFor the 2017 financial year, the maximum annual bonus opportunity for the Executive Directors was 120% of salary. Consistent with best practice this award was also subject to malus and clawback provisions.
The 2017 bonus was subject to Trading EBITDA performance (70% of the overall bonus), and individual objectives (30%). The bonus outcome was determined based on the targets set at the start of the financial year.
As set out in the Executive Chairman’s statement, the Company has made considerable progress towards delivery of strategic goals during the year. The table below summarises the performance achieved and the resulting pay-out under each element of the annual bonus:
Performance measure Weighting Performance achieved
Performance relative to the
target
Resulting level of award (% of max
opportunity)
Trading EBITDA 70% £403m Between threshold and
maximum
37.6%
Individual objectives
30% Progress against various targets set
at the start of the year (with profit
underpin achieved)
Between threshold and
maximum
19.5% to 22.5%
Total 100% 57.1%-60.1%
When reviewing performance against individual objectives the Committee considered outcomes against various targets that were set at the start of the year. In particular, the Committee noted the sale of the Irish business, delivery of further refinancing during the year, progress on the IT transformation and customer based initiatives linked to the Group’s digital offering.
The Board considers that the 2017 financial year Trading EBITDA targets continue to be commercially sensitive at the year end. However, the Committee remains committed to transparent disclosure of remuneration arrangements and therefore intends to disclose details of the Trading EBITDA targets (including the threshold and maximum range) for the 2017 bonus in next year’s report.
In respect of the 2016 bonus targets, the Company agreed to disclose further detail regarding the financial targets on a retrospective basis in this year’s report. As disclosed in last year’s report, 42% out of 60% of the maximum 2016 bonus was earned based on the 2016 Trading EBITDA result of £415m. For the 2016 bonus, 20% of this element was payable for Trading EBITDA of £389.5m, 60% was payable for £410m and 100% was payable for £430.5m.
Long-term incentives – vesting during the year
There were no long-term incentive awards vesting during the year.
Legacy scheme: MVP shares
The MVP shares structure was implemented at Admission in order to align the interests of the MBI team and management with those of shareholders in the period following Admission.
The arrangement takes the form of A shares, B shares and C shares. Each class represents one-third of the total number of shares under the plan. The value of the A, B and C shares is dependent on the total shareholder return (TSR) generated over the three-to five-year period following Admission.
The total value of all the A, B and C shares will be calculated as follows:
Annualised TSR Value of MVP shares
Below 12% nilAt or above 12% 5% of the TSR generated up to the 12% hurdle and 10% of the TSR
generated over and above the 12% hurdle
Prior to Admission, Bob Mackenzie, Martin Clarke and Nick Hewitt subscribed for 40% of the MVP shares. The remaining 60% of MVP shares were allocated in 2015. The table below provides details of the MVP share subscriptions and allocations made on and following Admission.
Now that the MVP shares are fully allocated, other than in exceptional circumstances (eg major role change), the Committee does not intend to allocate any further awards to Executive Directors.
Name Type of award
Percentage of MVP shares held
Face value of MVP shares on subscription (nominal value)1
Performance review dates
Bob Mackenzie
MVP shares (A, B and C shares)
On Admission – 22.4% Subsequent allocation – 32.6% Total – 55%
On Admission – £13,440 Subsequent allocation – £19,560
June 2017(A shares) June 2018
(A and B shares)
June 2019(A, B and C
shares)
Martin Clarke On Admission – 8.8% Subsequent allocation – 13.2% Total – 22%
On Admission – £5,280 Subsequent allocation – £7,920
Nick Hewitt (former director)
On Admission – 8.8% Subsequent allocation – 0% Total – 8.8%
On Admission – £5,280
1 The MVP A, B and C shares are not listed shares, and therefore the nominal value (£0.001) has been used rather than the share price.
2 The subsequent allocations set out above were made on 22 December 2015.
3 The remaining 14.2% of MVP shares are held by the Trustees of the Company’s Employee Benefit Trust for the benefit of other senior managers below Board level.

AA plc Annual Report and Accounts 2017 69
Our B
usinessG
overnanceFinancial Statem
entsO
ur Performance
Single total figure of remuneration (audited)
NON-EXECUTIVE DIRECTORS
The table below sets out the total remuneration for Non-Executive Directors for the year ended 31 January 2017.
Name (role)
2017 2016
Fees £’000
Benefits £’000
Total £’000
Fees £’000
Benefits £’000
Total £’000
John Leach SID/NED 170 – 170 170 – 170Andrew Blowers NED 115 – 115 103 – 103Simon Breakwell NED 95 – 95 95 – 95Andrew Miller NED 95 – 95 94 – 94
Suzi Williams NED 80 – 80 27 – 27
Andrew Blowers is Chairman of the Group’s new insurer and is paid an additional fee of £20,000 per annum (unchanged from last year) for that role.
Statement of Directors’ shareholding and share interests (audited)
The Committee is supportive of Executive Directors building up and maintaining a significant holding in the Company. As at the year end, Bob Mackenzie and Martin Clarke have built up shareholdings in excess of 2.8x and 5x salary respectively (based on the closing share price on 31 January 2017, 243.9p). The Committee views these holdings as a key means of aligning their interests with those of shareholders.
On the appointment of any new executive, the Committee would seek to implement a shareholding guideline which would need to be built up during the course of their tenure. The exact terms would be determined depending on the nature of any future appointment; however, it is currently expected that a requirement of at least 200% of salary would be implemented.
For new appointments to comply we would implement an appropriate time horizon for building the shareholding, including a requirement that executives would retain a proportion of net vested shares until this guideline has been met.
The table below sets out the Directors’ (and any relevant connected persons) share interests in the ordinary shares of the Company as at 31 January 2017.
Shares held outright(a)
Held in ESIP trust(b)
Deferred shares(c
)Shareholding (% of salary)(d
)
Executive DirectorsBob Mackenzie 875,000 1,384 1,298 285Martin Clarke 987,500 1,384 1,298 502
Non-Executive DirectorsAndrew Blowers 9,160 – – n/aAndrew Miller – – – n/aSuzi Williams – – – n/aJohn Leach 32,812 – – n/aSimon Breakwell – – – n/a
(a) Ordinary dividends were received on the shares held outright during the year.
(b) Includes partnership and dividend shares under the all-employee ESIP.
(c ) Includes unvested matching shares under the ESIP.
(d) Based on the closing share price on 31 January 2017 of 243.9p.
Bob Mackenzie and Martin Clarke have each received an additional interest of 116 partnership shares and 116 unvested matching shares under the SIP scheme between 31 January 2017 and 27 March 2017, the latter being the latest practicable date prior to publication of this Annual Report.
The table below sets out the Directors’ interests in MVP shares.
Name
MVP shares
Value subject to a performance condition
Subscribed prior to Admission
Subscribed in December 2015 Total
Executive DirectorsBob Mackenzie 22.4% 32.6% 55.0%Martin Clarke 8.8% 13.2% 22.0%Nick Hewitt (former director) 8.8% – 8.8%Total 40.0% 45.8% 85.8%
The Non-Executive Directors do not have any interests in MVP shares. The remaining 14.2% of MVP shares was issued to the Company’s Employee Benefit Trust for the benefit of senior management below Board level.
Service contracts and letters of appointment
Each of the Board Members will be proposed for re-election at the 2017 Annual General Meeting. The Executive Directors are employed under rolling service contracts that do not have fixed terms of appointment, but are subject to a 12-month notice period. The Non-Executive Directors are appointed under a letter of appointment for an initial term of three years (subject to annual re-election at the AGM) which may be terminated by either party subject to a one-month notice period other than certain conditions under which the Company can terminate with immediate effect. The details of the Non-Executive Directors’ terms are set out below:
Name Date of appointment Term expires
John Leach 26 June 2014 9 June 2018Andrew Miller 26 June 2014 9 June 2018Simon Breakwell 17 September 2014 9 June 2018Andrew Blowers 25 September 2014 9 June 2018Suzi Williams 1 October 2015 1 October 2018
Performance graph and table
The chart below illustrates AA Group’s TSR performance against the FTSE 250 (excluding investment trusts) since Admission.
020406080100120140160180
31 Jan17
31 Oct16
31 Jul16
30 Apr16
31 Jan16
31 Oct15
31 Jul15
30 Apr15
31 Jan15
31 Oct14
31 Jul14
26 Jun14
AA plc FTSE 250 (exc. Investment trusts)
Source: Thomson Reuters Datastream
Value of £100 holding since admission
The table below shows the total remuneration paid to the Executive Chairman each year since Admission.
Executive Chairman remuneration 2015 2016 2017
Executive Chairman single figure of remuneration £1,113k £1,557k £1,369kAnnual bonus payout (% of maximum) 100% 79% 57%Long-term incentives vesting (% of maximum) n/a n/a n/a

70 AA plc Annual Report and Accounts 2017
Directors’ Remuneration Report continued
Percentage change in remuneration of Director undertaking the role of Executive Chairman
The table below illustrates the percentage change in salary, benefits and annual bonus for the 2017 financial year for the Executive Chairman as against all other employees.
% change in base salary
% change in benefits1
% change in annual bonus
Executive Chairman 0% 0% -27%All employees1 1.5% 0% -2.7%
1 No changes to benefits provided.
2 Change in base salary for employees represents the average increase implemented as part of the Company’s annual pay review in April 2016. The change in annual bonus represents the average bonus paid to employees.
Relative importance of spend on pay
The table below illustrates the year-on-year change in the total remuneration costs for all employees against the Company’s key performance metric of Trading EBITDA.
2017 £m
2016 £m
% change
Total employee remuneration 305 328 -7.0%Trading EBITDA¹ 403 402 0.2%Distributions relating to the year² 57 55 3.3%
1 Excludes results of discontinued operations.
2 The total cost of ordinary dividends declared to shareholders relating to the year.
Role of the Remuneration Committee
The Remuneration Committee is responsible for reviewing and making recommendations to the Board regarding the Remuneration Policy of the Group and for reviewing compliance with the policy. The Executive Chairman and the Human Resources Director attended parts of Committee meetings by invitation in order to provide the Committee with additional context. The Company Secretary acts as the Committee’s secretary. No individual was present when their own remuneration was being determined.
Deloitte LLP is engaged by the Committee as their advisers. Deloitte LLP received fees of £36,750 for advice to the Committee on a time and materials basis. During the year, Deloitte LLP also provided the Company with HR consulting services and taxation advice. Deloitte LLP is one of the founding members of the Remuneration Consultants’ Group and adheres to the Remuneration Consultants’ Group’s Code of Conduct. The Committee is satisfied that the advice it has received has been objective and independent.
Remuneration in the wider Group
The wider employee Group participates in performance-based incentives. Throughout the Group, base salary and benefit levels are set taking into account prevailing market conditions. Differences between Executive Director pay policy and other employee pay reflect the seniority of the individuals, and the nature of responsibilities. The key difference in policy is that for Executive Directors a greater proportion of total remuneration is based on incentives. The Committee has oversight of incentive plans operated throughout the Group. Below Board level long-term incentives align with the long-term interests of the business and where appropriate objectives may be tailored to individual business areas.
When setting the policy for the remuneration of the Executive Directors, the Committee has regard to the pay and employment conditions of employees within the Group. However, the Committee does not use comparison metrics or consult directly with employees when formulating the Remuneration Policy for Executive Directors. The Committee reviews salary increases and pay conditions within the business, to provide context for decisions in respect of Executive Directors.
Consideration of shareholder views
We engage with shareholders on a frequent basis as detailed on page 74. Further consultation with major shareholders is undertaken prior to each AGM. As noted in the Remuneration Committee Chairman’s statement, the Committee is currently in the process of consulting with major shareholders regarding the future incentive strategy.
The Committee recognises that aspects of the Company’s Remuneration Policy which were put in place prior to IPO, while aligned to shareholder value creation, are unusual in the context of the UK listed environment. The Committee considers the views of its shareholders and is mindful of evolving best practice in developing policies in the future and will continue to engage with major shareholders and investor bodies regarding the approach to pay.
The table below sets out the votes on the Annual Report on Remuneration at the 2016 AGM and the Remuneration Policy at the 2015 AGM.
Votes for
Votes against
Votes abstained
Remuneration Report (2016 AGM) 96.4% (467.9m)
3.6% (17.7m) 25.8m
Remuneration Policy (2015 AGM) 94.8% (474.7m)
5.2% (26.3m) 42.3m

AA plc Annual Report and Accounts 2017 71
Our B
usinessG
overnanceFinancial Statem
entsO
ur Performance
2015 DIRECTORS’ REMUNERATION POLICY (EXTRACT) – PROVIDED FOR REFERENCE ONLY
The Directors’ Remuneration Policy (the Policy) was last approved by shareholders at the 2015 Annual General Meeting, and took effect upon approval.
The policy table has been provided below for ease of reference. Where appropriate, references to implementation have been updated. The full Policy can be found in the 2015 Annual Report on our website.
POLICY TABLE
Base salary
Purpose and link to strategy To attract and retain executives of the calibre required to deliver the Group’s strategy.Operation When reviewing salary levels the Committee takes into account a range of factors including:
The individual’s skills, experience and performance
The size and scope of the individual’s responsibilities
Market rate for the role
Pay and conditions elsewhere in the Group
Salary levels are typically reviewed annually by the Committee.
Maximum opportunity There is no overall maximum for salary opportunity or increases. Individual salaries are set based on the factors set out above.
The Executive Director salaries as at 31 January 2017 are:
Bob Mackenzie: £750,000
Martin Clarke: £480,000 Performance metrics None.
Benefits
Purpose and link to strategy To provide competitive benefit arrangements appropriate for the role.Operation A range of benefits may be provided to Executive Directors including, but not limited to, car related benefits, life cover and private
medical insurance.
From time to time the Committee may review the benefits provided for individual roles. Additional benefits may be provided where the Committee considers this appropriate (e.g. on relocation).
Directors may also participate in any all-employee share plans (including the Company’s Share Incentive Plan) operated by the Company from time to time on the same terms as other employees.
Maximum opportunity There is no overall maximum for benefits.
Participation in any HMRC-approved all-employee share plan is limited to the maximum award levels permitted by the relevant legislation.
Performance metrics None.
Retirement benefits
Purpose and link to strategy To provide a competitive level of retirement benefits appropriate for the role.Operation Executive Directors are eligible to participate in the AA UK pension scheme (or any other similar pension plan operated by the Group
from time to time) or receive a cash allowance in lieu of participation.
For new hires the nature and value of any retirement benefit provided will be, in the Committee’s opinion, reasonable in the context of market practice for comparable roles and take account of both the individual’s circumstances and the cost to the Company.
Maximum opportunity The maximum benefit is 25% of salary.
For the financial year commencing 1 February 2017 the personal pension or cash allowances for current Directors will be 11.7% of annual basic salary.
Performance metrics None.

72 AA plc Annual Report and Accounts 2017
Directors’ Remuneration Report continued
Annual bonus
Purpose and link to strategy To incentivise the delivery of annual financial, strategic and operational objectives, which are selected to support our business strategy.
Operation Performance metrics and targets are set annually to ensure they remain aligned with financial and strategic goals. Bonus levels are determined by the Committee after the year-end, based on an assessment of performance.
Maximum opportunity The maximum annual opportunity is 120% of salary.Performance metrics Performance targets will be determined by the Committee at the beginning of each performance period, and may comprise of
a combination of financial, strategic, operational and individual targets appropriate for the role.
At least 50% of the award will be subject to financial measures.
The threshold pay-out for the minimum level of performance will be determined by the Committee taking into account the nature of the target. There will normally be scaled pay-outs for performance between the minimum and maximum thresholds.
Recovery provisions Malus and clawback provisions have been introduced for the 2016 bonus. Both malus and clawback will apply to future awards.
2015 Performance Share Plan
Purpose and link to strategy To reward for delivery of performance targets linked to long-term strategic objectives and to provide alignment with the interests of shareholders.
Over time, the Committee intends to transition to this incentive structure which is more conventional for the UK listed environment. The Performance Share Plan (“PSP”) is intended to provide the Committee with the facility to make annual long-term share awards subject to performance measures aligned to the success of the Company.
It is anticipated the PSP will be used for new Executive Directors.Operation The PSP was approved by shareholders at the 2015 AGM. The Committee has not yet granted any awards under this plan.
Awards of conditional shares (or equivalent) will vest dependent on performance measured over a period of at least three years.
The Committee will review the metrics, targets and weightings prior to future grants to ensure they are aligned with the long-term strategic goals.
Dividends (or equivalents, including re-investment) may accrue in respect of any shares that vest.Maximum opportunity The maximum face value of award in respect of any financial year is 200% of salary.
The level of pay-out for the threshold performance hurdle set would normally not exceed 25% of the maximum opportunity. Full vesting will require achievement of the stretch objectives set. There will normally be scaled vesting for performance between the threshold and maximum performance levels.
Performance condition As the PSP is not for immediate use, the performance conditions have not yet been determined.
Prior to granting awards, the Committee will determine the performance metrics, weightings and targets to ensure they are aligned with the corporate strategy.
The Committee would seek to engage appropriately with its major shareholders when making the first awards to Executive Directors under this plan.
Recovery provisions Both malus and clawback provisions will apply to any awards granted to Executive Directors under this plan.

AA plc Annual Report and Accounts 2017 73
Our B
usinessG
overnanceFinancial Statem
entsO
ur Performance
LEGACY ARRANGEMENT – MVP SHARES ON ADMISSION
The Management Value Participation Shares (“MVP shares”) were implemented at Admission. Once the MVP shares are fully allocated (and subject to reallocation in exceptional circumstances) the Committee does not intend to allocate any further MVP shares.
MVP shares
Purpose and link to strategy To link reward with Company performance and long-term shareholder value creation following Admission. Awards are share-based to facilitate share ownership and further align the interests of participants and shareholders.
Operation The MVP shares are a one-off structure implemented prior to Admission.
The MVP shares provide participation in the total shareholder return created over the first five years following Admission, provided a minimum hurdle rate is achieved.
The arrangement takes the form of A shares, B shares and C shares in the Company with each class representing a third of the total number of MVP shares. Unless the Committee determines otherwise, each participant will hold an equal number of A, B and C shares.
The A, B and C shares are convertible into ordinary shares in the Company or are redeemable following satisfaction of the relevant Performance Condition tested on the third, fourth and fifth anniversaries of Admission respectively. If the Performance Condition is not met on the third or fourth anniversary (as relevant), but is satisfied on a subsequent measurement date (including the requirement for further growth in TSR for that additional period), the A and B shares will be convertible or redeemable as described above. Value per share is based on the aggregate value calculated by reference to the performance conditions divided by the aggregate number of shares allocated.
In the event that the Performance Condition of any of the MVP shares has not been satisfied by the fifth anniversary of Admission, the Company will be able to acquire all of the MVP shares for £0.01 in aggregate. The same applies in the event that any holder has not required the Company to convert their MVP shares within the applicable timeframes.
Maximum opportunity The maximum number of ordinary shares resulting from conversion of MVP shares will not in any 10 year period exceed 5% of the issued share capital (as calculated from time to time). Up to 60 million MVP shares may be allocated under this structure.
The allocations of MVP shares to current Executive Directors is as follows:
Bob Mackenzie: 55%
Martin Clarke: 22%
It is anticipated that no further grants of MVP shares will be made to Executive Directors.Performance Condition For all MVP shares, the Performance Condition is that the total shareholder return (TSR) per annum from Admission to the
relevant measurement point is equal to or more than 12% (the Performance Condition).
If the Performance Condition is met, the value of the MVP shares shall be:
5% of the TSR up to the Performance Condition; plus
10% of the amount by which TSR exceeds the Performance Condition.
If the Performance Condition has been satisfied, the MVP shares may be converted into such number of ordinary shares at the average closing price of the share over the ten business days prior to the relevant anniversary.

74 AA plc Annual Report and Accounts 2017
Relations with shareholders
Approach to Investor Relations
The Board acknowledges that it is managing the AA on the behalf of shareholders and, in undertaking this responsibility, seeks to increase long-term shareholder value and to advance the interests of all the AA’s stakeholders. It recognises the importance of its relationships with shareholders and is committed to maintaining an open dialogue with them and the financial community.
We engage with analysts, shareholders and potential investors to ensure we have a strong relationship which allows us to understand their views on material issues relating to the business. An integral part of this open dialogue is communication about our strategy and its delivery.
The AA has a comprehensive Investor Relations (IR) programme which aims to help existing and potential institutional, private and debt investors understand what we do, our strategy and our achievements.
The Board receives independent feedback on our relationships with investors from our brokers. These are included in regular Board reports on IR. All analysts’ notes are circulated to the Board to help it maintain an understanding of markets’ perceptions of the Company and financial forecasts.
Relevant information made available to investors
Financial reportingThe AA reports financial results twice a year at the half year and year-end. Following the announcement on the London Stock Exchange via the Regulatory News Service (RNS), presentations are held to explain the results. These were simultaneously webcast and posted on the IR website to enable viewing by those unable to attend in person.
Ad hoc announcementsAd hoc announcements of material information are made via the RNS and are also available on our IR website to ensure all investors are able to access it.
Annual ReportThe Annual Report is published in line with requirements, to provide sufficient time in advance of the AGM for feedback to be shared with the relevant directors.
WebsiteAn IR website is maintained to facilitate communications with investors and we post material given to fund managers and analysts at IR presentations. In September 2016, the website was redesigned to improve the experience of its users.
Meetings with investors enabled through the IR programme
Institutional shareholders
Meetings with principal shareholdersMeetings with the Executive Chairman and Chief Financial Officer are built around the financial results.
Additional meetings are held on an ad hoc basis throughout the year with the Executive Directors and the IR team. Feedback is given to the Board. Our investor relations programme covers the UK, Continental Europe, North America and Asia.
Investor site visitsWe hold investor trips to Oldbury, the site of our roadside assistance dispatch centre, for major shareholders.
Industry conferencesIndustry conferences give senior management a chance to meet a large number of investors in an efficient way. Conferences attended this year included JP Morgan Business Services Conference and Goldman Sachs Business Services Conference.
Private shareholdersDuring the year, the investor relations department held four private shareholder roadshows focusing on Private Client Brokers. Feedback was given to the Board.
Individual shareholders are encouraged to communicate with the Directors through the Group Company Secretary.
Debt investorsMeetings with credit institutional investors and analysts were held with senior management and our investor relations department throughout the year. In addition, regular dialogue was maintained with our key relationship Banks and Trustee.
During the year, updates and meetings were held in respect of our bonds by our senior management team with credit rating agency Standard & Poor’s.
Annual General Meeting (AGM)
Investors’ views in relation to governance and remuneration are sought ahead of the AGM and summarised to the Board.
The 2016 AGM provided shareholders with an opportunity to question the Board and the Chairs of the Board Committees on matters put to the meeting, including the Annual Report. Proxy votes of shareholders for the AGM are counted independently by the Company’s registrar, announced at the meeting and published on the Group’s website shortly after the conclusion of the AGM.
Meetings with the Senior Independent Director (SID)
The SID is available to meet shareholders and contact should be sought through the Company Secretary.
We have invited the governance officers of our top shareholders to discuss governance in more depth and Andrew Miller (Chairman of Audit Committee) and Mark Millar (Company Secretary) will also attend this meeting in the coming months.

AA plc Annual Report and Accounts 2017 75
Our B
usinessG
overnanceFinancial Statem
entsO
ur Performance
Mark Millar Company Secretary
“ In line with our ethos of continuous improvement, we have advanced our internal governance, controls and conduct during the year.”
The Directors present their report together with the audited accounts for the year ended 31 January 2017.
This Directors’ Report contains certain statutory, regulatory and other information. As permitted by the Companies Act 2006 (the Act), the following information which is required by law to be included in the Directors’ report is incorporated by reference:
Strategic report (pages 2-42)
Corporate governance report (pages 43-78)
Employee involvement and engagement (page 41)
Information about our people (pages 40-41)
Training and career development of disabled employees (pages 40-41)
Carbon emissions (pages 38-39)
Financial instruments (note 27)
Likely future developments (page 13)
Related party transactions (note 32)
Events after the balance sheet date (note 36)
Company status
AA plc (the Company) is a public limited liability company with company number 5149111 and the holding company of the AA Group of companies (the AA). It holds a premium listing on the London Stock Exchange main market for listed securities and is a constituent Member of the FTSE 250 Index.
Results and dividends
The results for the year ended 31 January 2017 are set out on pages 79-127. The Company paid an interim dividend of 3.6p per ordinary share on 25 October 2016. The Board has proposed a final dividend of 5.7p per ordinary share in respect of the year (2016: 5.5p) which, subject to approval by shareholders at the Annual General Meeting (AGM) to be held on 8 June 2017, will be payable on 13 June 2017 to shareholders on the register at the close of business on 12 May 2017, giving a total dividend in respect of the year of 9.3 p per ordinary share (2016: 9p). The ex-dividend date will be 11 May 2017.
Share capital
The Company’s issued share capital, as at 31 January 2017, comprised a single share class of ordinary shares which are listed on the London Stock Exchange and six classes of Management Value Participation Shares (MVP Shares). Details of the movements in the issued share capital can be found in notes 23 and 34 of the financial statements. Each ordinary share carries the right to one vote at general meetings of the Company.
Directors’ ReportAccountability

76 AA plc Annual Report and Accounts 2017
Directors’ Report continued
The issued and fully paid share capital of the Company as at 31 January 2017 is as follows:
Class Nominal value Number Amount (£)
Ordinary £0.001 609,461,827 609,462MVP Shares (A1 shares) £0.001 8,000,000 8,000MVP Shares (B1 shares) £0.001 8,000,000 8,000MVP Shares (C1 shares) £0.001 8,000,000 8,000MVP Shares (A2 shares) £0.001 12,000,000 12,000MVP Shares (B2 shares) £0.001 12,000,000 12,000MVP Shares (C2 shares) £0.001 12,000,000 12,000
The ordinary shares can be held in certificated or uncertificated form. Holders are entitled to attend and speak at general meetings of the Company, to appoint one or more proxies and, if they are corporations, corporate-representatives are entitled to attend general meetings and to exercise voting rights. All issued ordinary shares are fully paid up.
The MVP shares are not listed on any public market and have no voting rights but entitle the holders to receive ordinary shares or cash in the future, subject to satisfaction of performance conditions which require a minimum 12% compound total shareholder return performance condition over a three-to five-year period from Admission of the shares in June 2014. Further details of the MVP shares are set out on pages 69 and 73.
Purchase of own shares
No ordinary shares were purchased by the Company during the 2017 financial year (2016: nil) nor to the date of this Annual Report and Accounts. The existing authority granted to the Directors to make on market purchases of its ordinary shares expires at the end of the AGM to be held in June 2017. Therefore, the Company will re-seek authority by shareholders to purchase up to 10% of the Company’s ordinary share capital as at 27 March 2017 at the AGM.
Shares held by employee benefit trusts
Data on the Group’s share plans can be found at note 34.
Employee Share Incentive Plan (ESIP)In September 2016, the Board approved the continuation of the tax-approved ESIP into its third year and agreed that the grant be made on an evergreen basis, rather than annual, to facilitate administration and encourage take-up and increased employee interest in the success of the Company. The ESIP allows qualifying employees to acquire shares on beneficial terms in accordance with Schedule 2 and/or Schedule 3 to the Income Tax (Earnings and Pensions) Act 2003. Awards under the ESIP are satisfied by the issue of new ordinary shares by the Company.
Scheme participants make regular contributions to the ESIP directly from their salary up to a maximum of £150 per month (Contributory Shares) and under the rules of the scheme, the Company issues a matching share element on a 1:1 basis (Matching Shares).
An invitation to participate in the 2017 evergreen scheme was sent to all eligible UK employees in December 2016 and the take-up to 31 January 2017 was 37% of eligible employees.
The second year’s ESIP invitation matured in December 2016 and matching shares were issued during the year, in accordance with the rules of the ESIP.
Approved Profit Share Scheme (APSS)During the 2016 financial year, the Group implemented an APSS for employees of the Irish subsidiaries. This was approved by our shareholders at the 2016 AGM. The APSS scheme is governed by Irish law and has been approved by the Irish Tax and Customs Revenue and includes features consistent with prevailing market practices.
The scheme is comparable to the ESIP with a matching share awarded on a 1:1 basis. The rules of the scheme permitted the matching element to be satisfied with the market purchase of Ordinary Shares only. At the AGM on 9 June 2016, an ordinary resolution was passed permitting the Company to satisfy matching shares under the APSS with newly issued shares or the transfer of treasury shares.
Under the rules of the scheme, employee contributions ceased at the end of July 2016 due to the sale of AA Ireland on 11 August 2016. The Trustee of the Scheme (Capita) will hold the shares until the end of the two-year retention period that applies to the appropriate APSS shares. The scheme will be wound up in 2018 when all of the scheme shares will have been released by the Trustee.
Long Term Business Plan (LTBP)During the 2016 financial year the Company’s employee benefit trust (EBT) purchased ordinary shares in the market at a cost of £15m which have been used in a long-term bonus plan (LTBP) to incentivise senior management below Board level and to align their interests with shareholders. Awards were made during the 2016 financial year.
Further details of the Company’s share schemes and share-based payments are set out in note 34. Each ordinary share purchased and/or awarded under each plan carries the right to one vote at general meetings of the Company.
Senior Management Plan (SMP)Certain of the Class A2, B2 and C2 MVP shares representing 14.2% of all MVP shares were issued to the Company’s EBT and any ordinary shares resulting from the conversion of such MVP shares would be used for the benefit of the senior management team below Board, subject to satisfaction of specified performance criteria at the absolute discretion of the Remuneration Committee.
SUBSTANTIAL SHAREHOLDINGS
As at 31 January 2017, the Company has been notified in accordance with the Disclosure and Transparency Rules (DTR 5) of the following interests in 3% or more of the issued share capital of the Company:
Name of shareholder Number of shares % shareholding
Parvus Asset Management Europe Limited 109,855,253 18.02%The Capital Group Companies, Inc. 97,957,072 16.07%Woodfood Investment Management 60,910,713 9.99%Citigroup Global Markets Limited 54,969,903 9.02%Standard Life Investment (Holdings) Limited 30,594,272 5.02%Goldman Sachs 26,547,384 4.36%Aviva plc 21,202,919 3.48%
Since 31 January 2017, the Company has been notified in accordance with DTR5 of changes in the following interests:
Citigroup Global Markets Limited 54,181,668 8.89%Parvus Asset Management Europe Limited 117,908,449 19.34%

AA plc Annual Report and Accounts 2017 77
Our B
usinessG
overnanceFinancial Statem
entsO
ur Performance
Except for those listed above, we are not aware of any ordinary shareholders with interests of 3% or more in the issued share capital of the Company. We have not been notified of any other changes to the notifiable voting rights in its shares up to 27 March 2017.
Interest in voting rights
All of the issued (and outstanding) ordinary shares of the Company have equal voting rights, with one vote per share. None of the ordinary shares carry any special voting rights with regard to control of the Company. Other than holding periods that may be imposed on ordinary shares from awards under share schemes, the Group is not aware of any agreements between holders of securities that may result in restrictions on the transfer of ordinary shares.
The Notice of Annual General Meeting (AGM) specifies deadlines for exercising voting rights and appointing a proxy or proxies to vote in relation to resolutions to be passed at the AGM. The relevant proxy votes are counted and the numbers for, against or withheld in relation to each resolution are announced at the AGM and published on the Company’s website after the meeting.
Full voting rights are set out in the Company’s Articles of Association (the Articles) and in the explanatory notes that accompany the Notice of the 2017 AGM. These documents are available on the Company’s website www.theaaplc.com.
The total voting rights figure applicable at 27 March 2017 is 609,575,236 ordinary shares.
Dividend Reinvestment Plan (DRIP)
The Company offers a dividend reinvestment plan to shareholders as a cost-efficient way of increasing their shareholding in the Company.
Directors
The membership of the current Board and biographical details are given on pages 46-47.
Appointment and replacement of Directors This is governed by the Articles, the Act, the UK Corporate Governance Code (the Code) and related legislation.
Directors’ powers The business of the Company is managed by the Board who may exercise all powers of the Company, subject to the Articles, the Act and any directions given by special resolution of shareholders.
Directors’ interests The interests of Directors and their immediate families in the shares of the Company, along with details of the long-term incentives awarded to Executive Directors are contained in the Remuneration report set out on pages 65–73 .
No Directors have beneficial interests in the shares of any subsidiary company. Further details relating to the MVP shares can be found on pages 69–71.
Directors’ indemnities The Company maintains Directors’ and officers’ liability insurance, which gives appropriate cover for any legal action brought against its Directors and officers. The Company has also granted indemnities to each of its Directors and the Company Secretary to the extent permitted by law. Qualifying third-party indemnity provisions (as defined by section 234 of the Act) were in force during the year ended 31 January 2017 and remain in force, in relation to certain losses and liabilities which the Directors or Company Secretary may incur to third parties in the course of acting as Directors or Company Secretary or employees of the Company or any associated company.
Directors’ conflicts of interest The Group has procedures in place for managing conflicts of interest. Should a Director become aware that they, or their connected parties, have an interest in an existing or proposed transaction with the AA, they must notify the Board in writing or at the next Board meeting. Internal controls are in place to ensure that any related party transactions involving Directors, or their connected parties, are conducted on an arm’s length basis. Directors have a continuing duty to update any changes to these conflicts. The Directors consider the conflicts of interest procedures to have operated effectively during the year.
Independence of Directors The Board has reviewed the independence of each Non-Executive Director and considers them to be independent of management and free from business relationships that could interfere with the exercise of independent judgement.
Significant agreements change of control
The Company is not party to any significant agreements that would take effect, alter or terminate following a change of control of the Company. The Company does not have agreements with any Director or officer that would provide compensation for loss of office or employment resulting from a takeover except that provisions of the Company’s share plans and the MVP shares may cause awards and options granted under such arrangements to vest on a takeover.
Going concern and viability statement
Having carried out a comprehensive review of the business, regarding its financial position, future forecasts and the borrowing facilities available, the Directors confirm that they have a reasonable expectation that the AA has adequate resources to continue in operational existence for the foreseeable future. Therefore, the Directors continue to adopt the going concern basis in preparing the financial statements for the year ended 31 January 2017.
Our viability statement is set out on page 29.
Cautionary statement
This Annual Report contains forward-looking statements. These forward-looking statements are not guarantees of future performance, rather they are based on current views and assumptions as at the date of this Annual Report. We made these assumptions in good faith based on the information available to us at the time of the approval of this report. These statements should be treated with caution due to the inherent risks and uncertainties underlying any such forward-looking information. We have no obligation to update these forward looking statements.
Employment
The AA is an equal opportunities employer and has established best practice procedure, from recruitment and selection, through training and development, performance reviews and promotion to retirement. We promote an environment free from discrimination, harassment and victimisation, where everyone will receive equal treatment regardless of gender, colour, ethnic or national origin, disability, age, marital status, sexual orientation or religion.
Political donations
No political donations were made during the year ended 31 January 2017 (2016 : £nil). The AA has a policy of not making donations to political organisations or independent election candidates or incurring political expenditure anywhere in the world as defined in the Act.

78 AA plc Annual Report and Accounts 2017
Disclosures required under Listing Rule 9.8.4
In accordance with Listing Rule 9.8.4(12) and Listing Rule 9.8.4(13), we note that the Trustees of the AA plc 2015 Employee Benefit Trust have waived their right to receive dividends on the ordinary shares comprised in the Trust Fund, being 4,111,423 ordinary shares as at 31 January 2017, under the terms of the Trust Deed.
There are no further disclosures required to be made under Listing Rule 9.8.4.
Auditors
Ernst & Young LLP has been the Group’s auditor since the audit for the year ended 31 January 2008. In recognition of the FRC Ethical Standard 2016, in March 2017 the Audit Committee and Board approved the decision to commence a tender process for external audit services so that a new auditor could be approved at the June 2018 AGM and take up the role of external auditor with effect from the 2019 financial year with the first reporting for the six months to 31 July 2018.
Ernst & Young LLP has signified its willingness to continue in office as statutory auditor of the AA for the 2018 financial year and we (the Board and Audit Committee) are satisfied that Ernst & Young LLP is independent and there are adequate safeguards in place to safeguard its objectivity. A resolution to reappoint Ernst & Young LLP will be proposed at the 2017 AGM.
Disclosure of information to the auditor
So far as the Directors are aware, there is no relevant audit information that has not been brought to the attention of the Company’s auditor during the audit process. Each Director has taken all reasonable steps to make himself or herself aware of any relevant audit information and to establish that such information was provided to the auditor.
2017 Annual General Meeting
The Company’s AGM will be held at Freshfields Bruckhaus Deringer LLP, 65 Fleet Street, London EC4Y 1HS on 8 June 2017 at 12 noon.
The Notice convening the 2017 AGM is contained in a circular sent to shareholders. Full details of all resolutions to be proposed are provided in this circular and the Directors consider that all of the resolutions set out are in the best interests of the Company and its shareholders as a whole. The Directors will be voting in favour of them and unanimously recommend that shareholders vote in favour of each of them.
Responsibilities of the Directors
The Directors are responsible for preparing the Annual Report and the financial statements in accordance with applicable law and regulations. Company law requires the Directors to prepare financial statements for each financial year. Under that law the Directors have prepared the Group financial statements in accordance with International Financial Reporting Standards (IFRS) as adopted by the EU and the Company financial statements in accordance with Financial Reporting Standard (FRS) 101. Under company law, the Directors must not approve the financial statements unless they are satisfied that they give a true and fair view of the state of affairs of the Group and the Company and of the profit or loss of the Group for that period.
In preparing these financial statements, the Directors are required to:
select suitable accounting policies and then apply them consistently;
make judgements and accounting estimates that are reasonable and prudent;
state whether applicable IFRS as adopted by the EU have been followed, subject to any material departures disclosed and explained in the financial statements; and
prepare the Group’s and Company’s financial statements on a going concern basis, unless it is inappropriate to do so.
The Directors are responsible for keeping adequate accounting records that are sufficient to show and explain the Group’s and Company’s transactions and disclose with reasonable accuracy at any time the financial position of the AA and enable them to ensure that the financial statements comply with the Companies Act 2006 and, as regards the Group financial statements, Article 4 of the IAS Regulation. The Directors are also responsible for safeguarding the assets of the AA and hence for taking reasonable steps for the prevention and detection of fraud and other irregularities.
Responsibility statement of the Directors in respect of the Annual Report and financial statements
Each of the Directors as at the date of the Annual Report (as noted on pages 46– 47 confirm that to the best of their knowledge:
the Group and Company financial statements, which have been prepared in accordance with IFRS and FRS101 respectively, give a true and fair view of the assets, liabilities, financial position and profit or loss of the Company and the undertakings included in the consolidation taken as a whole;
the Strategic Report and Directors’ Report on pages 2 to 42 and 75 to 78 include a fair review of the development and performance of the business and the position of the Group, together with a description of the principal risks and uncertainties that it faces; and
the Annual Report, taken as a whole, is fair, balanced and understandable and provides the necessary information for shareholders to assess the Group’s performance, business model and strategy.
A copy of the financial statements of the Group is placed on the Company’s website at www.theaaplc.com. The Directors are responsible for the maintenance and integrity of the corporate and financial information included on the Company’s website. Information published on the internet is accessible in many countries with different legal requirements. Legislation in the UK governing the preparation and dissemination of financial statements may differ from legislation in other jurisdictions.
The Statement of Directors’ Responsibilities was approved by the Board of Directors on 27 March 2017 and signed on its behalf by the Company Secretary:
Mark Millar Company Secretary
27 March 2017
Directors’ Report continued

Our B
usinessG
overnanceFinancial Statem
entsO
ur Performance
AA plc Annual Report and Accounts 2017 79
Financial statementsfor the year ended 31 January 2017

80 AA plc Annual Report and Accounts 2017
1. Our opinion on the financial statements is unmodified:
In our opinion:
the financial statements give a true and fair view of the state of the Group’s and of the parent Company’s affairs as at 31 January 2017 and of the Group’s profit for the year then ended;
the Group financial statements have been properly prepared in accordance with International Financial Reporting Standards (“IFRSs”) as adopted by the European Union;
the parent Company financial statements have been properly prepared in accordance with United Kingdom Generally Accepted Accounting Practice, including Financial Reporting Standard 101 ‘Reduced Disclosure Framework’; and
the financial statements have been prepared in accordance with the requirements of the Companies Act 2006 and, as regards the Group financial statements, Article 4 of the IAS Regulation.
2. Overview
MaterialityOverall Group materiality of £7.6m which represents approximately 2% of earnings before interest, tax, depreciation and amortisation (EBITDA) adjusted for exceptional items.
Audit scopeWe performed an audit of the complete financial information of the Roadside Assistance and Insurance Services divisions and audit procedures on specific balances for the remaining divisions.
The divisions and entities where we performed full and specific scope audit procedures accounted for 97% of the Group’s revenue, 99% of the Group’s Trading EBITDA adjusted for exceptional items and 97% of the Group’s total assets.
Risk of material misstatement
Revenue recognition
Valuation of the net pension scheme liability
Goodwill impairment
Recognition and valuation of provisions: Duplicate breakdown cover
3. Our assessment of the risk of material misstatement
The table below shows the risks of material misstatement we identified that had the greatest effect on the overall audit strategy, the allocation of resources in the audit and directing the efforts of the audit team. In addressing these risks, we have performed the procedures below which were designed in the context of the financial statements as a whole and, consequently, we do not express any opinion on these individual areas.
Risk Our response to these risks
Key observations communicated to the Audit Committee
Revenue recognition (£940m, PY comparative £925m)Refer to page 62 (Audit Committee Report) and note 1.3 (m) (accounting policy)The basis of recognising revenue differs between the various products and services provided by the Group, as set out in accounting policy 1.3 (m).
Management has previously identified issues with the way in which an underlying system generates accounting entries for processing and deferring revenue from the personal roadside business, and has implemented additional procedures to ensure the accurate recording of such revenue.
As such we consider that the deferral and subsequent recognition of revenue generated from the personal roadside business presents an increased risk of error or potential management override.
We considered the Group’s accounting policies in respect of revenue recognition to determine whether they appropriately reflected the requirements of IAS 18 and IFRS 4.
We assessed the design, implementation and operating effectiveness of key controls over revenue recognition and tested controls over revenue processing for the principal roadside assistance, insurance services and driving services income streams.
We tested IT general controls that support the systems that process and record revenue for the roadside assistance, insurance services and driving services income streams.
Specifically, for the system issues where management has implemented additional procedures, we tested controls over those procedures. We checked the completeness of data used in the calculation of revenue, tested the methodology used to generate accounting entries by re-performing a sample of calculations and verified that the resulting accounting entries had been accurately processed.
We performed tests of detail to assess whether the revenue recognition practices adopted complied with the stated accounting policies. We tested a sample of personal Roadside Assistance revenue transactions to confirm that revenue had been deferred in a manner consistent with the relevant contract and a sample of insurance broking transactions to confirm that all services under the contract had been performed at the point at which revenue was recognised.
We inspected a sample of journal entries for any evidence of management override and obtained support for individually unusual and/or material revenue journals.
We performed analytical procedures to compare revenue recognised with our expectations from past experience, management’s forecasts and our understanding of product features and terms. In doing so, we assessed whether deferred revenue from the personal roadside business as at 1 February 2016 had been appropriately released to revenue during the year.
We performed cut-off testing to confirm that revenue has been recorded in the correct period.
We are satisfied that appropriate revenue recognition policies have been adopted and complied with.
Based on additional procedures carried out by management and the results of our own controls and substantive testing, we are satisfied that revenue transactions have been appropriately recorded.
Independent Auditor’s Report to the members of AA plc

Our B
usinessG
overnanceFinancial Statem
entsO
ur Performance
AA plc Annual Report and Accounts 2017 81
Risk Our response to these risks
Key observations communicated to the Audit Committee
Valuation of the net pension scheme liability under IAS 19 (R ) (£395m, PY comparative £296m)Refer to page 62 (Audit Committee Report), note 1.3 (l) (accounting policy) and note 25 (disclosures)The Group operates three defined benefit pension schemes, the most significant of which is the AA UK defined benefit pension scheme (AAUK). We consider the valuation of the AAUK net pension liability to be a significant risk as:
The actuarial assumptions used to value the pension scheme liabilities are judgemental and sensitive.
The schemes hold some complex and illiquid assets for which there are no quoted prices. Prices are obtained directly from the relevant investment managers who apply judgement in valuing those assets.
Due to the significance of the value of the AAUK pension obligation, a small change in actuarial assumptions may result in a material difference to the amounts reported.
We understood and walked through management’s controls in respect of the selection of key assumptions related to the valuation of actuarial liabilities and the valuation of scheme assets.
Using external data we verified the appropriateness of the key actuarial assumptions used by management in determining the pension obligation under IAS 19(R ), as detailed in note 25 of the consolidated financial statements.
We determined whether the assumptions used met the requirements of IFRS and were in line with market practice, as well as the specific circumstances of the schemes and their participants. This included a comparison of life expectancy with relevant mortality tables, benchmarking inflation and discount rates against external market data, considering changes in historical assumptions and evaluating the independence, qualifications and results of work performed by management’s experts involved in the valuation process. We used our pension valuation experts to assist us with these procedures.
We obtained net asset value (NAV) statements in respect of the schemes’ investments directly from the fund administrator and reconciled them to both the scheme’s custody records and the Group financial statements.
Where applicable we reviewed administrator controls reports for controls over valuation of complex assets.
We obtained and reviewed a sample of audited fund financial statements to assess whether the NAV was appropriate.
We tested the assets held in equity markets and confirmed the valuation of those equities.
We tested the data used to perform scheme valuations to gain comfort that the data is complete and accurate and agrees to underlying payroll records.
We reviewed the disclosures relating to the defined benefit schemes.
Based on our procedures we are satisfied that the values of assets held within the scheme are appropriately supported.
We concluded that assumptions used to determine the defined benefit obligation fall within an acceptable range.
Goodwill impairment (carrying value £1,173m, PY comparative £1,199m)Refer to page 62 (Audit Committee Report), note 1.3 (i) (accounting policy) and notes 11 and 26 (disclosures)The goodwill balance as at 31 January 2017 is significant based on its size relative to the total assets of the Group.
The AA plc goodwill arising on consolidation represents the excess of the cost of acquisition over the Group’s interest in the fair value of the identified assets and liabilities at the date of acquisition in 2004.
Management analyses discounted cash flows at the cash generating unit (CGU) level to calculate the value in use for each CGU as required by IAS 36. This calculation represents a significant estimate including judgements related to future Trading EBITDA growth and discount rate assumptions.
In the current financial year, the Group completed the sale of AA Ireland. This resulted in £26m of goodwill being disposed of in the year.
We examined management’s impairment model, which included an assessment of discounted cash flows, to understand the significant assumptions used in the impairment test for each CGU.
We engaged our valuation experts to assess the reasonableness of the discount rate by considering the Group specific circumstances as well as comparable companies from similar sectors.
We performed sensitivity analysis to assess the impact of certain key variables on levels of headroom, including discount rate and Trading EBITDA growth assumptions.
We confirmed the appropriate accounting treatment in respect of the goodwill relating to the disposed of the AA Ireland business.
We confirmed compliance with the Group’s accounting policy.
Based on our procedures, which included additional sensitivity analysis, we are satisfied that no impairment of the recorded goodwill has been identified.

82 AA plc Annual Report and Accounts 2017
Independent Auditor’s Report continued
Risk Our response to these risks
Key observations communicated to the Audit Committee
Recognition and valuation of provisions: Duplicate breakdown cover (£10m, PY comparative £nil)Refer to page 62 (Audit Committee Report), note 1.3 (u) (accounting policy) and notes 4 and 21 (disclosures)In the current year, AA management has become aware of some duplication of Roadside Assistance cover taken by customers who meet certain criteria while being personal Members and holding Added Value Accounts (AVAs) with AA’s banking partners. Through its review of data, management has identified a group of customers for whom the benefit of holding both forms of cover is not clear. Steps are being taken to remediate.
A provision of £10m has been reported by management at 31 January 2017, reflecting its assessment of the cost of remediation which includes refunds of policy premiums. £7m of the provision is presented as an exceptional revenue provision with £3m being the finance charge that represents interest accrual on the refunded policy premiums.
The duplicate breakdown cover provision requires the use of estimates in determining the likelihood of a refund occurring and is dependent on individual customer circumstances. Variability in assumptions can result in measurement uncertainty and a range of potential outcomes.
As a result, the duplicate breakdown cover provision has been added as an area of audit emphasis for the current year.
We inspected legal and regulatory correspondence up to the date of issuance of these financial statements.
We obtained management’s assessment of the provision and based on the actual customer outcomes to date and sensitivity analysis, assessed the reasonableness of the key assumptions that inform the estimate. We recalculated a range of outcomes reflecting variables in those assumptions.
We tested the completeness of underlying data and verified a sample to individual case records in order to assess accuracy.
We confirmed the provision meets the recognition criteria set out in IAS 37 ‘Provisions, Contingent Liabilities and Contingent Assets’.
We are satisfied that the duplicate breakdown cover provision meets the recognition criteria set out in IAS 37 and disclosures in the 31 January 2017 financial statements are in accordance with the applicable accounting framework.
Taking into consideration the variability of assumptions, we consider the provision amount recognised as at 31 January 2017 to be within an acceptable range.

Our B
usinessG
overnanceFinancial Statem
ents
AA plc Annual Report and Accounts 2017 83
Our Perform
ance
4. Involvement with component team
In establishing our overall approach to the Group audit, we determined the type of work that needed to be undertaken at each of the components by us, as the primary audit engagement team, or by the component auditors operating under our instruction.
The Insurance component team is responsible for the audit of the Insurance Services and Insurance Underwriting segments. The Group audit team is responsible for the audit of the Group function and all other components.
The Group audit team provided detailed audit instructions to the component team which included guidance on areas of focus, including the relevant risks of material misstatement detailed above, and set out the information required to be reported to the Group team.
The Group team reviewed key work papers and participated in the planning and execution of the component team’s audit of the identified risks. The Group team attended the closing meetings with the management of the Insurance Companies and attended key Audit Committee meetings.
The work performed on the components, together with the additional procedures performed at Group level, gave us appropriate evidence for our opinion on the consolidated financial statements as a whole.
5. Our application of materiality
We apply the concept of materiality both in planning and performing our audit, and in evaluating the effect of identified misstatements on our audit and of uncorrected misstatements, if any, on the financial statements and in forming our opinion in the Audit Report.
MaterialityMateriality is the magnitude of an omission or misstatement that, individually or in the aggregate, could reasonably be expected to influence the economic decisions of the users of the financial statements. Materiality provides a basis for determining the nature and extent of our audit procedures.
When establishing our overall audit strategy, we determined a magnitude of uncorrected misstatements that we judged would be material for the financial statements as a whole. We determined materiality for the Group to be £7.6m (prior year £8.0m), which is approximately 2% of Trading EBITDA adjusted for exceptional items. We base our materiality on a Trading EBITDA performance measure as Trading EBITDA is the key metric used by management in measuring and reporting on the performance of the business. In presenting its measure of Trading EBITDA, management adjusts Trading EBITDA for non-recurring items and also certain recurring items that are not allocated in assessing segment performance. In calculating materiality, we have adjusted Trading EBITDA only for exceptional items which we considered to be non-recurring. This provided a basis for determining the nature, timing and extent of risk assessment procedures, identifying and assessing the risk of material misstatement and determining the nature, timing and extent of further audit procedures.
During the course of our audit, we reassessed initial materiality. Our final calculated materiality did not result in any substantive change in our audit procedures.
Performance materialityPerformance materiality is the application of materiality at the individual account or balance level. It is set at an amount to reduce to an appropriately low level the probability that the aggregate of uncorrected and undetected misstatements exceeds materiality.
On the basis of our risk assessments, together with our assessment of the Group’s overall control environment, our judgement is that overall performance materiality (ie our tolerance for misstatement in an individual account or balance) for the Group should be 50% of materiality, namely £3.8m (prior year £4.0m). Our objective in adopting this approach is to ensure that total uncorrected and undetected audit differences do not exceed our materiality of £7.6m for the financial statements as whole.
Audit work at individual components is undertaken based on a percentage of our total performance materiality. The performance materiality set for each component is based on the relative size of the component and our view of the risk of misstatement at that component. The range of the performance materiality allocated to components was £0.8m to £2.7m (prior year £0.8m to £2.9m).
Reporting thresholdWe agreed with the Audit Committee that we would report to the Committee all audit differences in excess of £0.4m, which is set at approximately 5% of planning materiality, as well as differences below that threshold that, in our view, warranted reporting on qualitative grounds. We evaluate any uncorrected misstatements against both the quantitative measures of materiality discussed above and in the light of other relevant qualitative considerations.
6. An overview of the scope of our audit
Following our assessment of the risk of material misstatement to the Group financial statements, our audit scope focused on the two largest components, Roadside Assistance and Insurance Services, which were subject to a full scope audit for the year ended 31 January 2017. For the remaining components (Driving Services and Insurance Underwriting) and the statutory entities containing the Group’s borrowings and related hedging instruments, pension scheme balances and Head Office costs, specific audit procedures were performed that were impacted by our assessed risks of material misstatement. The components for which we performed full scope audits accounted for 93% of the Group’s revenue, 92% of the Group’s Trading EBITDA and 61% of the Group’s total assets.
The specific scope component contributed 4% of the Group’s revenue, 7% of the Group’s Trading EBITDA and 36% of the Group’s total assets. The audit scope of these components may not have included testing of all significant accounts of the component but will have contributed to the coverage of significant accounts tested for the Group.
The remaining components together represent 1% of the Group’s Trading EBITDA. For these components, we performed other procedures, including analytical review, testing of consolidation journals and intercompany eliminations to respond to any potential risks of material misstatement to the Group financial statements.

84 AA plc Annual Report and Accounts 2017
Independent Auditor’s Report continued
Items not allocated to a segment and therefore not included in the Trading EBITDA coverage, include the difference between the cash contributions to the pension schemes for ongoing service and the calculated annual service cost and share-based payments. Pensions and Incentive Schemes have been subject to specific substantive audit procedures as set out in this report.
The charts below illustrate the coverage obtained from the work performed by our audit teams.
7. What we have audited
We have audited the financial statements of AA plc for the year ended 31 January 2017 which comprise:
Group
the consolidated income statement
the consolidated statement of comprehensive income
the consolidated statement of financial position
the consolidated statement of changes in equity
the consolidated statement of cash flows
the related notes 1 to 36 to the consolidated financial statements
Company
the company statement of financial position
the company statement of changes in equity
the related notes 1 to 11 to the company financial statements
The financial reporting framework that has been applied in the preparation of the Group financial statements is applicable law and International Financial Reporting Standards (IFRSs) as adopted by the European Union.
The financial reporting framework that has been applied in the preparation of the parent Company financial statements is applicable law and United Kingdom Accounting Standards (United Kingdom Generally Accepted Accounting Practice), including Financial Reporting Standard 101 ‘Reduced Disclosure Framework’.
This report is made solely to the Company’s members, as a body, in accordance with Chapter 3 of Part 16 of the Companies Act 2006. Our audit work has been undertaken so that we might state to the Company’s members those matters we are required to state to them in an auditor’s report and for no other purpose. To the fullest extent permitted by law, we do not accept or assume responsibility to anyone other than the Company and the Company’s members as a body, for our audit work, for this report, or for the opinions we have formed.
8. Respective responsibilities of Directors and auditor
As explained more fully in the Directors’ Responsibilities Statement set out on page 78, the Directors are responsible for the preparation of the financial statements and for being satisfied that they give a true and fair view. Our responsibility is to audit and express an opinion on the financial statements in accordance with applicable law and International Standards on Auditing (UK and Ireland). Those standards require us to comply with the Auditing Practices Board’s Ethical Standards for Auditors.
9. Scope of the audit of the financial statements
An audit involves obtaining evidence about the amounts and disclosures in the financial statements sufficient to give reasonable assurance that the financial statements are free from material misstatement, whether caused by fraud or error. This includes an assessment of: whether the accounting policies are appropriate to the Group’s and the parent Company’s circumstances and have been consistently applied and adequately disclosed; the reasonableness of significant accounting estimates made by the Directors; and the overall presentation of the financial statements. In addition, we read all the financial and non-financial information in the Annual Report and Accounts to identify material inconsistencies with the audited financial statements and to identify any information that is apparently materially incorrect based on, or materially inconsistent with, the knowledge acquired by us in the course of performing the audit. If we become aware of any apparent material misstatements or inconsistencies we consider the implications for our report.
10. Opinion on other matters prescribed by the Companies Act 2006
In our opinion:
the part of the Directors’ Remuneration Report to be audited has been properly prepared in accordance with the Companies Act 2006; and
based on the work undertaken in the course of the audit:
the information given in the Strategic Report and the Directors’ Report for the financial year for which the financial statements are prepared is consistent with the financial statements; and
the Strategic Report and the Directors’ Report have been prepared in accordance with applicable legal requirements.
In light of the knowledge and understanding of the Company and its environment obtained in the course of the audit, we have identified no material misstatements in the Strategic Report or Directors’ Report.
TRADING EBITDA (%)
Full scope components 92%Specific scope components 7%Other procedures 1%
REVENUE (%)
Full scope components 93%Specific scope components 4%Other procedures 3%
TOTAL ASSETS (%)
Full scope components 61%Specific scope components 36%Other procedures 3%

Our B
usinessG
overnanceFinancial Statem
ents
AA plc Annual Report and Accounts 2017 85
Our Perform
ance
11. Matters on which we are required to report by exception
Risk How our audit work addressed the risk
What we concluded to the Audit Committee
ISAs (UK and Ireland) reporting
We are required to report to you if, in our opinion, financial and non-financial information in the Annual Report is:
materially inconsistent with the information in the audited financial statements; or
apparently materially incorrect based on, or materially inconsistent with, our knowledge of the Group acquired in the course of performing our audit; or
otherwise misleading.
In particular, we are required to report whether we have identified any inconsistencies between our knowledge acquired in the course of performing the audit and the Directors’ statement that they consider the Annual Report and Accounts taken as a whole is fair, balanced and understandable and provides the information necessary for shareholders to assess the entity’s performance, business model and strategy; and whether the Annual Report appropriately addresses those matters that we communicated to the Audit Committee that we consider should have been disclosed.
We have no exceptions to report
Companies Act 2006 reporting
We are required to report to you if, in our opinion:
adequate accounting records have not been kept by the parent Company, or returns adequate for our audit have not been received from branches not visited by us; or
the parent Company financial statements and the part of the Directors’ Remuneration Report to be audited are not in agreement with the accounting records and returns; or
certain disclosures of Directors’ remuneration specified by law are not made; or
we have not received all the information and explanations we require for our audit.
We have no exceptions to report
Listing Rules review requirements
We are required to review:
the Directors’ statement, set out on page 77, in relation to going concern and longer-term viability; and
the part of the Corporate Governance Statement relating to the Company’s compliance with the provisions of the UK Corporate Governance Code specified for our review.
We have no exceptions to report
Statement on the Directors’ Assessment of the Principal Risks that would threaten the solvency or liquidity of the entity We have nothing material to add or draw attention to
ISAs (UK and Ireland) reporting
We are required to give a statement as to whether we have anything material to add or to draw attention to in relation to:
the Directors’ confirmation in the Annual Report that they have carried out a robust assessment of the principal risks facing the entity, including those that would threaten its business model, future performance, solvency or liquidity;
the disclosures in the Annual Report that describe those risks and explain how they are being managed or mitigated;
the Directors’ statement in the financial statements about whether they considered it appropriate to adopt the going concern basis of accounting in preparing them, and their identification of any material uncertainties to the entity’s ability to continue to do so over a period of at least 12 months from the date of approval of the financial statements; and
the Directors’ explanation in the Annual Report as to how they have assessed the prospects of the entity, over what period they have done so and why they consider that period to be appropriate, and their statement as to whether they have a reasonable expectation that the entity will be able to continue in operation and meet its liabilities as they fall due over the period of their assessment, including any related disclosures drawing attention to any necessary qualifications or assumptions.
Kathryn Barrow (Senior statutory auditor)for and on behalf of Ernst & Young LLP, Statutory Auditor London
27 March 20171 The maintenance and integrity of the AA plc website is the responsibility of the Directors; the work carried out by the auditors does not involve consideration of these matters and, accordingly,
the auditors accept no responsibility for any changes that may have occurred to the financial statements since they were initially presented on the website.
2 Legislation in the United Kingdom governing the preparation and dissemination of financial statements may differ from legislation in other jurisdictions.

86 AA plc Annual Report and Accounts 2017
Consolidated income statement for the year ended 31 January
Note2017
£m2016
£m
Continuing operationsTrading Revenue 2 940 925Revenue from business disposed of 2 – 10Exceptional revenue provision 2 (7) –Group Revenue 2 933 935Cost of sales (341) (337)Gross profit 592 598Administrative & marketing expenses (309) (302)Share of profits of joint ventures and associates, net of tax 1 1Operating profit 284 297Trading EBITDA 2 403 402Items not allocated to a segment 5 (20) (18)Amortisation and depreciation 11,13 (67) (51)Impairment of investment in joint venture 14 (1) –Exceptional operating items 4 (31) (36)
Operating profit 4 284 297Finance costs 6 (185) (289)Finance income 7 1 1Profit before tax 100 9Tax expense 9 (26) (10)Profit/(loss) for the year from continuing operations 74 (1)Discontinued operationsProfit for the year from discontinued operations 3 80 7Profit for the year 154 6
Earnings per share from profit/(loss) for the year Note2017
pence2016
pence
Basic from total operations 10 25.3 1.0Basic from continuing operations 10 12.2 (0.2)Basic from discontinued operations 10 13.1 1.2Diluted from total operations 10 25.3 1.0Diluted from continuing operations 10 12.2 (0.2)Diluted from discontinued operations 10 13.1 1.2
The accompanying notes are an integral part of this consolidated income statement.

Our B
usinessG
overnanceFinancial Statem
ents
AA plc Annual Report and Accounts 2017 87
Our Perform
ance
Note2017
£m2016
£m
Profit for the year 154 6Other comprehensive income on items that may be reclassified to profit and loss in subsequent yearsExchange differences on translation of foreign operations 2 1Effective portion of changes in fair value of cash flow hedges 13 10Tax effect 9 (1) (2)
14 9Other comprehensive income on items that will not be reclassified to profit and loss in subsequent yearsRemeasurement on (losses)/gains on defined benefit schemes 25 (99) 149Tax effect 9 17 (26)
(82) 123Total other comprehensive income (68) 132Total comprehensive income for the year 86 138
The accompanying notes are an integral part of this consolidated statement of comprehensive income.
Consolidated statement of comprehensive income for the year ended 31 January

88 AA plc Annual Report and Accounts 2017
Note2017
£m2016
£m
Non-current assetsGoodwill and other intangible assets 11 1,283 1,298Property, plant and equipment 13 131 122Investments in joint ventures and associates 14 10 10Deferred tax assets 9 62 52
1,486 1,482Current assetsInventories 15 6 5Trade and other receivables 16 195 172Cash and cash equivalents 17 211 166
412 343Total assets 1,898 1,825
Current liabilitiesTrade and other payables 18 (520) (518)Current tax payable (11) (7)Provisions 21 (19) (8)
(550) (533)Non-current liabilitiesBorrowings and loans 19 (2,819) (2,920)Finance lease obligations 29 (20) (21)Defined benefit pension scheme liabilities 25 (395) (296)Provisions 21 (11) (7)Insurance technical provisions 22 (16) (4)
(3,261) (3,248)Total liabilities (3,811) (3,781)Net liabilities (1,913) (1,956)Equity Share capital 23 1 1Share premium 24 403 399Own shares 24 (26) (22)Currency translation reserve 24 1 (1)Cash flow hedge reserve 24 2 (10)Retained earnings 24 (2,294) (2,323)Total equity attributable to equity holders of the parent (1,913) (1,956)
Signed for and on behalf of the Board on 27 March 2017 by:
Bob Mackenzie Martin ClarkeExecutive Chairman Chief Financial Officer
The accompanying notes are an integral part of this consolidated statement of financial position.
Consolidated statement of financial position as at 31 January

Our B
usinessG
overnanceFinancial Statem
ents
AA plc Annual Report and Accounts 2017 89
Our Perform
ance
Attributable to the equity holders of the parent
Share capital
£m
Share premium
£m
Own shares
£m
Currency translation
reserve £m
Cash flow hedge
reserve £m
Retained earnings
£mTotal
£m
At 1 February 2015 1 200 – (2) (18) (2,436) (2,255)Profit for the year – – – – – 6 6Other comprehensive income – – – 1 8 123 132Total comprehensive income – – – 1 8 129 138Dividends – – – – – (21) (21)Issue of share capital – 199 – – – – 199Purchase of own shares – – (22) – – – (22)Share-based payments – – – – – 5 5At 31 January 2016 1 399 (22) (1) (10) (2,323) (1,956)Profit for the year – – – – – 154 154Other comprehensive income – – – 2 12 (82) (68)Total comprehensive income – – – 2 12 72 86Dividends – – – – – (55) (55)Issue of share capital – 4 – – – – 4Purchase of own shares – – (4) – – – (4)Share-based payments – – – – – 12 12At 31 January 2017 1 403 (26) 1 2 (2,294) (1,913)
The accompanying notes are an integral part of this consolidated statement of changes in equity.
Consolidated statement of changes in equityfor the year ended 31 January

90 AA plc Annual Report and Accounts 2017
Note2017
£m2016
£m
Profit before tax from continuing and discontinued operations 184 17Amortisation and depreciation 11,13 68 54Net finance costs 6,7 184 288Other adjustments to profit before tax (62) 12Working capital:(Increase)/decrease in trade and other receivables (45) 13Increase in trade and other payables 23 6Increase/(decrease) in provisions 24 (6)Difference between pension charge and cash contributions (10) (1)Total working capital adjustments (8) 12Net cash flows from operating activities before tax 366 383Tax paid (21) (2)Net cash flows from operating activities 345 381Investing activitiesCapital expenditure (71) (75)Proceeds from sale of fixed assets 18 11Acquisitions and disposals, net of cash acquired or disposed of 3 99 (8)Interest received 1 1Net cash flows from investing activities 47 (71)Financing activitiesProceeds from borrowings 700 735Issue costs on borrowings (6) (16)Debt repayment premium and penalties (30) (62)Repayment of borrowings (766) (1,039)Share capital issued – 199Refinancing transactions (102) (183)Purchase of own shares – (22)Interest paid on borrowings (143) (178)Payment of finance lease capital (43) (34)Payment of finance lease interest (7) (8)Dividends paid (55) (21)Net cash flows from financing activities (350) (446)Net increase/(decrease) in cash and cash equivalents 42 (136)Net foreign exchange differences 3 –Cash and cash equivalents at 1 February 166 302Cash and cash equivalents at 31 January 17 211 166
The cash flows from operating activities are stated net of cash outflows relating to exceptional items of £15m (2016: £37m). This relates to the cost of business transformation of £11m (2016: £21m), non-recurring costs of IT system implementation and cost restructuring activities of £7m (2016: £7m), share issue costs of £nil (2016: £1m), refinancing of the Group’s borrowings £nil (2016: £4m), and a net cash inflow from onerous property lease provisions in respect of vacant properties of £3m (2016: £4m outflow).
Other adjustments to profit before tax of £62m (2016: inflow of £12m) include profit on sale of Ireland £77m (2016: £nil), share of profit from joint ventures and associates of £1m (2016: profit of £1m), share based payments of £12m (2016: £5m), loss on sale of fixed assets of £3m (2016: £3m), impairment of investment in joint ventures of £1m (2016: £nil) and loss on disposal of Autowindshields of £nil (2016: £5m).
Operating cash flows from discontinued operations were £10m (2016: £14m) (see note 3).
The accompanying notes are an integral part of this consolidated statement of cash flows.
Consolidated statement of cash flowsfor the year ended 31 January

Our B
usinessG
overnanceFinancial Statem
ents
AA plc Annual Report and Accounts 2017 91
Our Perform
ance
Notes to the consolidated financial statements
1 Basis of preparation and accounting policies
1.1 General informationThe consolidated financial statements for the year ended 31 January 2017 comprise the financial statements of AA plc (‘the Company’) and its subsidiaries (together referred to as ‘the Group’). AA plc is a public limited company incorporated and domiciled in England and Wales.
These statements and the prior year comparatives have been presented to the nearest £million.
1.2 Basis of preparationThe Group has prepared these statements under International Financial Reporting Standards (IFRS) as adopted by the European Union, International Financial Reporting Interpretation Council (IFRIC) interpretations and those parts of the Companies Act 2006 applicable to companies reporting under IFRS.
These consolidated financial statements have been prepared under the historic cost convention as modified by the measurement of derivatives and liabilities for contingent consideration in business combinations at fair value.
a) Going concernThe Group is highly cash generative with a large proportion of its revenues coming from recurring transactions. The significant customer loyalty demonstrated by high renewal rates and lengthy customer tenure underpins this and in addition to the cash balances at the reporting date the Group has agreed undrawn credit facilities. The majority of the Group’s borrowings are long term in nature with no borrowings due within 12 months from the date of signing of these financial statements. For the Group’s longer term viability, it remains a key assumption of the Directors that the Group continues to have ready access to both public debt and equity markets to enable these borrowings to be easily refinanced in due course. The Directors have reviewed projected cash flows for a period of one year from the date of signing these financial statements and have concluded that the Group has sufficient funds to continue trading for this period and the foreseeable future. Therefore, the financial statements have been prepared using the going concern basis.
b) Basis of consolidationThe consolidated financial statements incorporate the financial statements of the Company and entities controlled by the Company (its subsidiaries). Control is achieved where the Company has rights to variable returns from its involvement with the entity and has the ability to influence those returns through its power over the entity.
The results of subsidiaries acquired or disposed of during the year are included in the consolidated income statement from the effective date of acquisition or up to the effective date of disposal, as appropriate. Where necessary, adjustments are made to the financial statements of subsidiaries to bring the accounting policies into line with those used by the Group. All intra-group transactions, balances, income and expenses are eliminated on consolidation.
1.3 Accounting policiesThe principal accounting policies are set out below.
a) Interests in joint ventures and associatesAn associate is an entity over which the Group is in a position to exercise significant influence, but not control or joint control, through participating in the financial and operating policy decisions of the entity. Joint ventures are joint arrangements whereby the parties that have joint control of the arrangement have rights to the net assets of the arrangement.
The results, assets and liabilities of joint ventures and associates are incorporated in these financial statements using the equity method of accounting. Investments in joint ventures and associates are carried in the Group balance sheet at cost, including direct acquisition costs, as adjusted by post-acquisition changes in the Group’s share of the net assets less any impairment losses.
b) Foreign currenciesThese financial statements are presented in pound sterling, which is the currency of the primary economic environment in which the Group operates.
Transactions in currencies other than the functional currency of each consolidated undertaking are recorded at rates of exchange prevailing on the dates of the transactions. Monetary assets and liabilities denominated in foreign currencies are translated into the respective functional currency at rates of exchange ruling at the balance sheet date. Gains and losses arising on the translation of assets and liabilities are taken to the income statement.
The results of overseas operations are translated into sterling at average rates of exchange for the period. Exchange differences arising on the retranslation of the opening net assets of overseas operations are transferred to the Group’s cumulative translation reserve in equity.
c) Business combinations and goodwillAll business combinations are accounted for by applying the acquisition method.
Costs related to the acquisition, other than those associated with the issue of debt or equity securities, are expensed as incurred.
Goodwill arising on consolidation represents the excess of the cost of acquisition over the Group’s interest in the fair value of the identified assets and liabilities of a subsidiary at the date of acquisition. Goodwill is recognised as an asset at cost less accumulated impairment losses.
Any contingent consideration payable is recognised at fair value at the acquisition date, and subsequent changes to the fair value of the contingent consideration are recognised in profit or loss. Any consideration paid to a former owner who continues to work for the business as part of the acquisition that is contingent on future service is excluded from goodwill and treated as acquisition earn-out costs within items not allocated to a segment in administrative and marketing expenses.
d) Intangible assetsIntangible assets other than goodwill which are acquired separately are stated at cost. The cost of intangible assets acquired in a business combination is their fair value as at the date of acquisition.
Following initial recognition, intangible assets are carried at cost less any accumulated amortisation and impairment losses. Intangible assets with finite lives are amortised over the useful economic life.
e) Software and development costsSoftware development expenditures on an individual project are recognised as an intangible asset when the Group can demonstrate:
The technical feasibility of completing the intangible asset so that it will be available for use or sale
Its intention to complete and its ability to use or sell the asset
How the asset will generate future economic benefits
The availability of resources to complete the asset
The ability to measure reliably the expenditure during development
Following initial recognition of the development expenditure as an asset, the cost model is applied. The asset is carried at cost less any accumulated amortisation and impairment losses. Amortisation of the asset begins when development is complete and the asset is available for use. It is amortised over its useful life of three to five years.

92 AA plc Annual Report and Accounts 2017
1 Basis of preparation and accounting policies (continued)
1.3 Accounting policies (continued)f) Property, plant and equipmentLand and buildings held for use in the production of goods and services or for administrative purposes are stated in the balance sheet at cost or fair value for assets acquired in a business combination less any subsequent accumulated depreciation and impairment losses. No capitalised interest is included in the cost of items of property, plant and equipment.
Property, plant and equipment is stated at cost less accumulated depreciation and impairment losses. Such costs include costs directly attributable to making the asset capable of operating as intended. The cost of property, plant and equipment less their expected residual value is depreciated by equal instalments over their useful economic lives. These lives are as follows:
Buildings 50 years Related fittings 3–20 years Leasehold properties over the period of the lease IT systems (hardware) 3–5 years Plant, vehicles and other equipment 3–10 years
Assets held under finance leases are depreciated on a straight line basis over the lease term.
g) InventoriesInventories are stated at the lower of cost and net realisable value. Costs include all costs incurred in bringing each product to its present location and condition. Net realisable value is based on estimated selling price less any further costs expected to be incurred to completion and disposal.
h) Financial instrumentsFinancial assets and financial liabilities are recognised on the Group’s balance sheet when the Group becomes a party to the contractual provisions of the instrument. They are classified according to the substance of the contractual arrangements entered into. At each reporting date the Group assesses whether there is any objective evidence that a financial asset or a group of financial assets is impaired.
Trade receivables and trade payablesTrade receivables and trade payables are not interest bearing and are recognised initially at fair value. A provision for impairment of trade receivables is established when there is objective evidence that the Group will not be able to collect all amounts due according to the original terms of the receivables.
Cash and cash equivalentsCash and cash equivalents comprise cash balances and call deposits with an original maturity less than three months.
Debt instrumentsDebt is initially recognised in the balance sheet at fair value less transaction costs incurred directly in connection with the issue of the instrument. Debt issue fees in respect of the instrument, including premiums and discounts on issue, are capitalised at inception and charged to the income statement over the term of the instrument using the effective interest method. Issue costs relating to the extinguishment of debt are charged to the profit and loss account immediately.
Equity instruments (share capital issued by the Group)An equity instrument is any contract that evidences a residual interest in the assets of the Group after deducting all its liabilities. Equity instruments are recognised at the fair value of proceeds received less direct issue costs.
Derivative financial instrumentsThe Group’s capital structure exposes it to the financial risk of changes in interest rates and fuel prices. The Group uses interest rate and fuel swap contracts to hedge these exposures.
Derivative financial instruments are recorded in the balance sheet at fair value. The fair value of derivative financial instruments is determined by reference to market values for similar financial instruments. The gain or loss on remeasurement to fair value is recognised immediately in profit or loss unless they qualify for hedge accounting as described below.
Cash flow hedgesChanges in the fair value of derivative financial instruments that are designated as highly effective hedges of future cash flows are recognised in other comprehensive income. Any ineffective portion of the hedge is recognised immediately in the income statement. Amounts recognised in other comprehensive income are reclassified from equity to profit and loss (within finance costs) in the period when the hedged item affects profit or loss. When a hedging instrument expires or is sold, or when a hedge no longer meets the criteria for hedge accounting, any cumulative gain or loss recognised in the other comprehensive income at that time remains in equity and is reclassified when the hedged transaction is ultimately recognised in the income statement.
In order to qualify for hedge accounting, the Group is required to document from inception the relationship between the item being hedged and the hedging instrument and demonstrate that the hedge will be highly effective on an ongoing basis. This effectiveness testing is performed at each period end to ensure that the hedge remains highly effective.
i) Impairment of assetsThe carrying amounts of the Group’s non-financial assets, other than inventories and deferred tax assets, are reviewed at each reporting date to determine whether there is any indication of impairment. If any such indication exists, then the asset’s recoverable amount is estimated. In addition, goodwill and intangible assets not yet available for use are tested for impairment annually.
For the purpose of impairment testing, assets that cannot be tested individually are grouped together into the smallest group of assets that generates cash inflows from continuing use that are largely independent of the cash inflows of other assets or groups of assets (the cash generating units or “CGUs”). The goodwill acquired in a business combination is allocated to CGUs so that the level at which impairment is tested reflects the lowest level at which goodwill is monitored for internal reporting purposes.
The recoverable amount of an asset or cash generating unit is the greater of its value in use and its fair value less costs to sell. In assessing value in use, the estimated future cash flows are discounted to their present value using a pre-tax discount rate that reflects current market assessments of the time value of money and the risks specific to the asset.
An impairment loss is recognised if the carrying amount of an asset or its CGU exceeds its estimated recoverable amount. Impairment losses are recognised in profit or loss. Impairment losses recognised in respect of CGUs are allocated first to reduce the carrying amount of any allocated goodwill and then to reduce the carrying amounts of the other assets on a pro rata basis.
An impairment loss in respect of goodwill is not reversed. In respect of other assets, an impairment loss is reversed if there has been a change in the estimates used to determine the recoverable amount. An impairment loss is reversed only to the extent that the asset’s carrying amount does not exceed the carrying amount that would have been determined, net of depreciation or amortisation, if no impairment loss had been recognised.
Notes to the consolidated financial statements continued

Our B
usinessG
overnanceFinancial Statem
ents
AA plc Annual Report and Accounts 2017 93
Our Perform
ance
1 Basis of preparation and accounting policies (continued)
1.3 Accounting policies (continued)j) LeasesFinance leases transfer substantially all of the risks and rewards of ownership to the lessee. All other leases are classified as operating leases.
Assets held under finance leases are recognised as assets of the Group at their fair value or, if lower, at the present value of the minimum lease payments, each determined at the inception of the lease. The corresponding liability to the lessor is shown as a financial liability. Lease payments are apportioned between finance charges and the lease obligation so as to achieve a constant rate of interest on the remaining balance of the liability. Finance charges are charged directly to the income statement.
Rentals payable and receivable under operating leases are charged, or credited, to the income statement on a straight-line basis over the term of the relevant lease. Any incentives to enter into an operating lease are recognised evenly over the lease term.
k) ProvisionsA provision is required when the Group has a present legal or constructive obligation as a result of a past event and it is probable that settlement will be required of an amount that can be reliably estimated. Provisions are discounted where the impact is material.
Provisions for restructuring costs are recognised when the Group has a detailed formal plan for the restructuring that has been communicated to affected parties.
For property leases, where a decision has been made prior to the year end to permanently vacate the property, provision is made for future rent and similar costs net of any rental income expected to be received up to the estimated date of final disposal.
l) Retirement benefit obligationThe Group’s position in respect of defined benefit pension plans is calculated by estimating the amount of future benefit that employees have earned in return for their service in the current and prior periods; that benefit is discounted to determine its present value, and the fair value of any plan assets (at bid price) is deducted. The Group determines the net interest on the net defined benefit liability for the period by applying the discount rate used to measure the defined benefit obligation at the beginning of the annual period to the net defined benefit liability.
The discount rate is the yield at the reporting date on bonds that have a credit rating of at least AA, with maturity dates approximating the terms of the Group’s obligations, and that are denominated in the currency in which the benefits are expected to be paid.
Remeasurements arising from defined benefit plans comprise actuarial gains and losses and the return on plan assets (excluding interest). The Group recognises them immediately in other comprehensive income and all other expenses related to defined benefit plans in administrative and marketing expenses in profit or loss.
When the benefits of a plan are changed, or when a plan is curtailed, the portion of the changed benefit related to past service by employees, or the gain or loss on curtailment, is recognised immediately in profit or loss when the plan amendment or curtailment occurs.
The calculation of the defined benefit obligations is performed by a qualified actuary using the projected unit credit method. When the calculation results in a benefit to the Group, the recognised asset is limited to the present value of benefits available in the form of any future refunds from the plan or reductions in future contributions and takes into account the adverse effect of any minimum funding requirements.
For defined contribution schemes, the amounts recognised in profit or loss are the contributions payable in the year.
m) Revenue recognitionRevenue is measured at the fair value of the consideration receivable less any discounts and excluding value added tax and other sales related taxes.
Roadside membership subscriptions and premiums receivable on underwritten insurance products are apportioned on a time basis over the period where the Group is liable for risk cover. The unrecognised element of subscriptions and premiums receivable, relating to future periods, is held within liabilities as deferred income and provision for unearned premiums.
Commission income from insurers external to the Group is recognised at the commencement of the period of risk.
Where customers choose to pay by instalments, the Group charges interest based on the principal outstanding and disclosed interest rate and recognises this income over the course of the loan.
For all other revenue, income is recognised at point of delivery of goods or on provision of service. This includes work which has not yet been fully invoiced, provided that it is considered to be fully recoverable.
n) Insurance contractsAn insurance contract is a contract under which insurance risk is transferred to the issuer of the contract by another party. In the roadside assistance segment, the Group accepts insurance risk from its customers under roadside recovery service contracts by agreeing to provide services whose frequency and cost is uncertain. Claims and expenses arising from these contracts are recognised in profit or loss as incurred. The Group also has insurance risk within the insurance underwriting segment on insurance products underwritten by the Group.
At the balance sheet date, a liability adequacy test is performed to ensure the adequacy of the insurance contract liabilities. In performing these tests, current estimates of future cash outflows arising under insurance contracts are considered and compared with the carrying amount of deferred income, provision for unearned premiums and other insurance contract liabilities. Any deficiency is immediately recognised in profit or loss and an onerous contract provision is established.
The estimation of the ultimate liability from claims made under insurance contracts for breakdown recovery is not considered to be one of the Group’s most critical accounting estimates. This is because there is a very short period of time between the receipt of a claim, eg. a breakdown, and the settling of that claim. Consequently, there are no significant provisions for unsettled claims costs in respect of the roadside assistance services.
The provision for outstanding claims relating to products with insurance risk within the insurance underwriting segment is set on an individual claim basis and is based on the ultimate cost of all claims notified but not settled, less amounts already paid by the reporting date, together with a provision for related claims handling costs. The provision also includes the estimated cost of claims incurred but not reported at the statement of financial position date (“IBNR”), which is set using statistical methods. Both outstanding claims and IBNR are not discounted for the time value of money. The amount of any anticipated reinsurance, salvage or subrogation recoveries is separately identified and reported within trade and other receivables and insurance contract liabilities respectively. Differences between the provisions at the reporting date and settlements and provisions in the following year are recognised in the income statement as they arise.
ReinsuranceThe Group undertakes a programme of reinsurance in respect of the policies which it underwrites. Outward reinsurance premiums are accounted for in the same accounting period as the related inward insurance premiums and are included as a deduction from earned premium, and therefore as a reduction in revenue. The amount of any anticipated reinsurance recoveries is treated as a reduction in claims costs.

94 AA plc Annual Report and Accounts 2017
Notes to the consolidated financial statements continued
1 Basis of preparation and accounting policies (continued)
1.3 Accounting policies (continued)o) Exceptional items and adjusted earnings per shareExceptional operating items are events or transactions that fall within the operating activities of the Group and which by virtue of their size or incidence have been disclosed in order to improve a reader’s understanding of the financial statements.
In addition, occasionally there are events or transactions that fall below operating profit that are one-off in nature and items within operating profit that relate to transactions that do not form part of the ongoing segment performance and which by virtue of their size or incidence have been separately disclosed in the financial statements.
Adjusted earnings per share adjusts profit after tax for items that are either discontinued operations, one-off in nature or relate to transactions that do not form part of the ongoing performance of the Group.
p) Finance income and costsFinance costs comprise interest payable, finance charges on finance leases recognised in profit or loss using the effective interest method, amortisation of debt issue fees, unwinding of the discount on provisions (including the net defined benefit obligations) and net foreign exchange losses that are recognised in the income statement (see foreign currency accounting policy).
Finance income comprises interest receivable on funds invested and net foreign exchange gains.
Foreign currency gains and losses are reported on a net basis.
q) TaxationTax on the profit or loss for the year comprises current and deferred tax.
Current tax is the expected tax payable or receivable on the taxable income or loss for the year, using tax rates enacted or substantively enacted at the balance sheet date, and any adjustment to tax payable in respect of previous years.
Deferred tax is provided on temporary differences between the carrying amounts of assets and liabilities for financial reporting purposes and the amounts used for taxation purposes. The following temporary differences are not provided for: the initial recognition of goodwill; the initial recognition of assets or liabilities that affect neither accounting nor taxable profit other than in a business combination; and differences relating to investments in subsidiaries to the extent that they will probably not reverse in the foreseeable future. The amount of deferred tax provided is based on the expected manner of realisation or settlement of the carrying amount of assets and liabilities, using tax rates enacted or substantively enacted at the balance sheet date.
A deferred tax asset is recognised only to the extent that it is probable that future taxable profits will be available against which the temporary difference can be utilised. The carrying amount of deferred tax assets is reviewed at each balance sheet date and reduced to the extent that it is no longer probable that sufficient taxable profits will be available to allow all or part of the asset to be recovered.
r) Segmental analysisThe Group reports its operations using the segments that are reported for management purposes. Segments are based on business operations because this is where Group risk and return is focused.
s) Share-based paymentsThe Group operates a number of equity settled, share-based payment compensation plans for employees. The fair value of the equity settled awards is measured at the grant date based on expectations of performance conditions being met. The fair value of the awards is recognised as an expense with a corresponding credit to reserves.
t) Discontinued operations and disposalsA discontinued operation is a component of the Group’s business, the operations and cash flows of which can be clearly distinguished from the rest of the Group and which:
Represents a separate major line of business or geographical area of operations;
Is part of a single coordinated plan to dispose of a separate major line of business or geographical area of operations; or
Is a subsidiary acquired exclusively with a view to re-sale
Classification as a discontinued operation occurs on disposal or when the operation meets the criteria to be classified as held for sale, if earlier.
When an operation is classified as a discontinued operation, the consolidated income statement is represented as if the operation had been discontinued from the start of the comparative year.
u) Critical accounting estimates and judgementsEstimates are evaluated continually and are based on historical experience and other factors, including expectations of future events that are believed to be reasonable under the circumstances. The Group makes estimates and assumptions about the future. The resulting accounting estimates will, by definition, seldom equal the related actual results.
Management has exercised judgement in applying the Group’s accounting policies and in making critical estimates. The underlying assumptions on which these judgements are based, are reviewed on an ongoing basis and include the selection of assumptions in relation to the retirement benefit obligation and assumptions for future growth of cash flows to support the value-in-use calculations for the goodwill impairment review.
The principal estimates and assumptions that have a risk of causing an adjustment to the carrying amounts of assets and liabilities within the next financial period are discussed below.
Retirement benefit obligationThe Group’s retirement benefit obligation, which is actuarially assessed each period, is based on key assumptions including return on plan assets, discount rates, inflation, future salary and pension costs. These assumptions may be different to the actual outcome.
Derivative financial instrumentsThe fair value of derivative financial instruments is determined by reference to market values for similar financial instruments. The Group is therefore required to identify changes in market conditions around expectations for interest rates. These assumptions may be different to the actual outcome.
Goodwill The Group tests goodwill for impairment annually. The recoverable amounts of cash generating units have been determined based on value-in-use calculations which require the use of estimates. Management have prepared discounted cash flows based on the latest strategic plan.
Share-based paymentsThe Group has issued a number of share-based payment awards to employees during the year which are measured at fair value. This involves estimates about the expected volatility of the share price and the number of leavers over the vesting period.
Provision for duplicate breakdown coverThe Group has made a provision in revenue and finance costs for potential refunds due to customers who may have duplicate cover as a business-to-business customer and as a personal Member. This provision has required the use of estimates in determining the likelihood of a refund occurring and is dependent on individual customer circumstances. These estimates may be different to the actual outcome and include the split of the exceptional charge between revenue and finance costs.

Our B
usinessG
overnanceFinancial Statem
ents
AA plc Annual Report and Accounts 2017 95
Our Perform
ance
2 Segmental information2017
£m2016
£m
RevenueRoadside Assistance 742 724Insurance Services 131 131Driving Services 67 68Insurance Underwriting – 2Trading Revenue 940 925Revenue from business disposed of – 10Exceptional revenue provision (see note 21) (7) –Group Revenue 933 935
Trading EBITDARoadside Assistance 365 361Insurance Services 76 78Driving Services 20 19Insurance Underwriting (1) –Head Office costs (57) (56)Trading EBITDA 403 402
Items not allocated to a segment (20) (18)Amortisation and depreciation (67) (51)Impairment of investment in joint venture (1) –Exceptional operating items (31) (36)Operating profit 284 297Net finance costs (184) (288)Profit before tax from continuing operations 100 9
All segments operate principally in the UK. Turnover by destination is not materially different from turnover by origin.
During August 2015, AA plc Group agreed to dispose of its windscreen replacement subsidiary Autowindshields (UK) Limited. Contracts were exchanged in August 2015 and the sale was completed by the end of the previous financial year. The results of this business have been presented above as business disposed of.
The segmental results for the prior period have been restated to exclude Ireland which is now a discontinued operation (see note 3).
For management purposes, the Group is organised into business units based on their products and services. The Group has five reportable operating segments as follows:
Roadside Assistance: This segment is the largest part of the AA business. The AA provides a nationwide service, sending patrols out to Members stranded at the side of the road, repairing their vehicles where possible and getting them back on their way quickly and safely.
Insurance Services: This segment includes the insurance brokerage activities of the AA, primarily in arranging motor and home insurance for customers, its home emergency activities and its intermediary financial services business.
Driving Services: This segment contains the AA Driving School and the British School of Motoring, which are the two largest driving schools in the UK, as well as AA DriveTech, which provides driver training and educative programmes.
Insurance Underwriting: This segment consists of the insurance underwriting and reinsurance activities of the AA. Any adjustments arising on consolidation of the Group’s insurance underwriting activities, such as the deferring of revenue relating to the broker, are included in this segment.
Head Office costs: This segment includes IT, finance, property and other back office support functions.
Segment performance is primarily evaluated using the Group’s key performance measures of Trading Revenue and Trading EBITDA.
Trading Revenue is revenue on a continuing basis adjusted for exceptional items and business disposed of. Trading EBITDA is profit after tax on a continuing basis as reported, adjusted for depreciation, amortisation, exceptional operating items, items not allocated to a segment, net finance costs, tax expense and business disposed of. This better reflects the Group’s underlying performance.
Items not allocated to a segment relate to transactions that do not form part of the ongoing segment performance and include transactions which are one-off in nature (see note 5).
Depreciation, amortisation, exceptional items, net finance costs and tax expense are not allocated to individual segments as they are managed on a group basis.
Segmental information is not presented for items in the statement of financial position as management does not view this information on a segmental basis.

96 AA plc Annual Report and Accounts 2017
Notes to the consolidated financial statements continued
3 Discontinued operations
On 11 August 2016, the Group completed the sale of its Irish business. The entities sold were AA Ireland Limited and its subsidiary undertakings. The Ireland business segment has therefore been reported as a discontinued operation as it represented a separate geographical area and the whole of the Irish operation was disposed of in the year.
As part of the transaction, the AA Ireland pension scheme, which is closed to future accrual, was transferred to AA Corporation Limited, a UK subsidiary of AA plc and will continue to be the responsibility of the Group.
a) Results of discontinued operations2017
£m2016
£m
Revenue 23 38Expenses (15) (25)Trading EBITDA 8 13Depreciation and amortisation (1) (3)Exceptional items – (2)Operating profit 7 8Profit on disposal of discontinued operations 77 –Profit before tax 84 8Tax (4) (1)Profit for the year from discontinued operations 80 7
Tax includes a charge of £1m (2016: £1m) in relation to the trading results of the discontinued operation and a charge of £3m (2016: £nil) in relation to tax due on the licensing of the brand to the Irish business segment. The tax due on the use of the brand has arisen over a number of years but has become material in the current financial year and related wholly to the discontinued operations. As this liability rests with the UK Group, any changes from the amounts provided will be reflected in the UK entity accounts going forward.
No additional tax arises on the profit on disposal of the Irish business segment mainly due to the application of the substantial shareholding exemption.
The profit from the sale of the Ireland business segment consisted of the following:£m
Proceeds 133Fees (3)Net assets (53)Profit on disposal of discontinued operations 77
Proceeds, net of fees, were £130m and allowed £106m of the Senior Term Facility to be repaid on 31 August 2016. Under the terms of our borrowings, we have held back £24m from the net proceeds in ring-fenced available cash to be used for potential future acquisitions. Any amounts not committed to an acquisition within 12 months from the AA Ireland completion date must be used to repay either Class A notes or the Senior Term Facility.
b) Net cash flows of discontinued operations2017
£m2016
£m
Operating cash flow 10 14Investing cash flow (3) (4)Total cash flows 7 10
During the year, the following cash flows arose as a result of Group acquisitions and disposals:£m
Cash proceeds from sale of Irish business segment 133Fees (3)Net cash proceeds from sale of Irish business segment 130Cash held in Irish business at point of disposal (31)Acquisitions and disposals, net of cash acquired or disposed of 99

Our B
usinessG
overnanceFinancial Statem
ents
AA plc Annual Report and Accounts 2017 97
Our Perform
ance
3 Discontinued operations (continued)
c) Net assets of discontinued operations at point of disposal
£mGoodwill 26Other intangible assets 9Property, plant and equipment 3Trade and other receivables 25Cash and cash equivalents 31Trade and other payables (39)Provisions - restructuring (1)Cumulative foreign exchange adjustment in reserves (1)Total 53
4 Operating profit
Operating profit from continuing operations is stated after charging:2017
£m2016
£m
Amortisation of owned intangible assets 33 21Depreciation of owned tangible fixed assets 12 10Depreciation of leased tangible fixed assets 22 20Operating lease rentals payable – land and buildings 4 5Exceptional operating items 31 36
Exceptional revenue included £7m for duplicate breakdown cover (2016: £nil). In addition, £3m was charged to exceptional finance charges, bringing the total exceptional amount for duplicate breakdown cover to £10m. See note 21 for further information.
Exceptional operating costs include £14m relating to business transformation costs (2016: £22m), £3m loss on disposal of fixed assets (2016: £3m), £3m for IT systems transformation (2016: £2m), £1m costs from onerous properties (2016: £2m income), £nil for the loss on disposal of Autowindshields (UK) Limited (2016: £5m), £nil relating to finance transactions (2016: £4m), and £3m mainly relating to non-recurring costs for cost restructuring activities (2016: £2m).
Costs from the current year refinancing in December 2016 were directly attributable to the issue and repayment of loan notes and have therefore been included either in finance costs or in borrowings as debt issue fees (see notes 6 and 20).
5 Items not allocated to a segment 2017
£m2016
£m
Share-based payments (see note 34) 12 5Difference between cash contributions to the pension scheme for ongoing service and the calculated annual service costs 8 13Total items not allocated to a segment 20 18

98 AA plc Annual Report and Accounts 2017
Notes to the consolidated financial statements continued
6 Finance costs 2017
£m2016
£m
Interest on external borrowings (147) (159)Finance charges payable under finance leases (8) (7)Total ongoing cash finance costs (155) (166)Ongoing amortisation of debt issue fees (5) (4)Net finance expense on defined benefit pension schemes (10) (12)Total ongoing non-cash finance costs (15) (16)Double-running interest on external borrowings – (19)Debt repayment premium and penalties (2) (62)Transfer from cash flow hedge reserve for extinguishment of cash flow hedge (6) (8)Debt issue fees immediately written off following repayment of borrowings (see note 20) (4) (18)Duplicate breakdown cover – interest on refunds (see note 21) (3) –Exceptional finance costs (15) (107)Total finance costs (185) (289)
Within interest on external borrowings is £10m (2016: £13m) of interest charged on the Senior Term Facility and £8m (2016: £8m) charged in relation to the interest rate swaps used to hedge the variable element of the Senior Term Facility (see note 20).
Double-running interest costs related to the double-running of the Class B/B2 notes from the time of issue of the Class B2 notes in April 2015 until the repayment of the Class B notes in July 2015.
During the previous year, the Group repaid the original Class B notes of £655m and PIK notes of £175m (see note 20). As a result, the Group incurred early repayment penalties of £58m for the Class B notes and £4m for the PIK notes.
During the year, the Group repaid £106m of the Senior Term Facility (2016: £209m), following which the Group transferred the fair value of the cash flow hedges related to the repayment of £6m (2016: £8m) from other comprehensive income to the income statement.
As part of the refinancing during the current year, the Group incurred a £2m premium cost in relation to the repayment of £165m of the Class B2 notes (see note 20). This premium was written off in the income statement.
7 Finance income2017
£m2016
£m
Interest receivable 1 1Total finance income 1 1
8 Staff costs2017
£m2016
£m
Wages and salaries 251 270Social security costs 25 24Retirement benefit costs 29 34
305 328
The average monthly number of persons employed under contracts of service during the year was:2017 2016
Operational 6,266 6,620Management and administration 1,188 1,242
7,454 7,862

Our B
usinessG
overnanceFinancial Statem
ents
AA plc Annual Report and Accounts 2017 99
Our Perform
ance
9 Tax
The major components of the income tax expense are:
2017 £m
2016 £m
Consolidated income statement Current income taxCurrent income tax charge 21 9Adjustments in respect of previous years (1) –
20 9Deferred taxEffect of tax rate change on opening balances 2 7Origination and reversal of temporary differences 2 –Adjustments in respect of prior years 2 (6)
6 1Tax expense in the income statement 26 10
2017 £m
2016 £m
Consolidated statement of comprehensive incomeTax on the effective portion of changes in fair value of cash flow hedges 1 2Tax on remeasurements of defined benefit pension liability (17) 26Income tax (credited)/charged directly to other comprehensive income (16) 28
Reconciliation of tax expense to profit before tax multiplied by UK’s corporation tax rate:2017
£m2016
£m
Profit before tax from continuing operations 100 9
Tax at rate of 20.0% (2016: 20.2%) 20 2Adjustments relating to prior years 1 –Rate change adjustment on temporary differences 2 7Expenses not deductible for tax purposes:– Share-based payments 2 –– Other non-deductible expenses/non-taxed income 1 1Income tax expense reported in the consolidated income statement at effective rate of 22.0% (2016: 23.5%) 26 10
In addition to the tax expense disclosed above, a charge of £4m (2016: £1m) has arisen on discontinued operations (see note 3).
The 2017 effective rate has been calculated by excluding the rate change adjustment that has arisen as a result of the future reduction in corporation tax rates affecting the carrying value of the deferred tax balances and the impact of share-based payments. The 2016 effective tax rate is as reported in last year’s financial statements.
Deferred tax by type of temporary differenceConsolidated statement of
financial positionConsolidated
income statement2017
£m2016
£m2017
£m2016
£m
Accelerated depreciation for tax purposes 8 9 1 4Revaluations of land and buildings to fair value (1) (1) – –Rollover relief (2) (2) – –Pension 32 15 – 1Revaluation of cash flow hedges 4 5 – (1)Short-term temporary differences 7 9 2 (8)Losses available for offsetting against future taxable income 14 17 3 5Deferred tax expense 6 1Net deferred tax assets 62 52

100 AA plc Annual Report and Accounts 2017
Notes to the consolidated financial statements continued
9 Tax (continued)
Reconciliation of net deferred tax assets2017
£m2016
£m
At 1 February 52 81Tax expense recognised in the income statement (6) (1)Tax income/(expense) recognised in OCI 16 (28)At 31 January 62 52
The Group offsets tax assets and liabilities if and only if it has a legally enforceable right to set off current tax assets and current tax liabilities and the deferred tax assets and deferred tax liabilities relate to income taxes levied by the same tax authority.
The UK corporation tax rate will reduce from 20% to 19% on 1 April 2017 and then to 17% (2016: 18%) on 1 April 2020. These rates have been substantively enacted at the balance sheet date and have therefore been included in the deferred tax calculations.
Deferred tax has been recognised at an overall rate of 17.2% for the UK at 31 January 2017 (2016: 18.4%) and 12.5% for Ireland as at 31 January 2016. The UK rate has been adjusted to reflect the expected reversal profile of the Group’s temporary differences.
The Group has tax losses which arose in the UK of £76m (2016: £92m) that are available indefinitely for offsetting against future taxable profits of the companies in which the losses arose. A deferred tax asset has been recognised in respect of these losses.
10 Earnings per share
Basic earnings per share amounts are calculated by dividing net profit for the year attributable to ordinary shareholders by the weighted average number of ordinary shares outstanding during the year.
2017 2016
Basic earnings per share:Profit after tax from total operations (£m) 154 6Weighted average number of shares outstanding (millions) 609 596Basic earnings per share from total operations (pence) 25.3 1.0
2017 2016
Basic earnings per share:Profit/(loss) after tax from continuing operations (£m) 74 (1)Weighted average number of shares outstanding (millions) 609 596Basic earnings per share from continuing operations (pence) 12.2 (0.2)
2017 2016
Basic earnings per share:Profit after tax from discontinued operations (£m) 80 7Weighted average number of shares outstanding (millions) 609 596Basic earnings per share from discontinued operations (pence) 13.1 1.2
For diluted earnings per share, the weighted average number of ordinary shares is adjusted to assume conversion of all potential dilutive ordinary shares.
Under the Group’s all employee share incentive plan, shares are purchased monthly at market value and are therefore not dilutive. In addition, matching shares are issued monthly at market value and are therefore not dilutive.
The Group has another class of potential dilutive ordinary shares relating to the MVP shares (see note 34). However, as at 31 January 2017, based on average market value of ordinary shares for the year, these were not dilutive.
There are no further classes of share that are dilutive as at 31 January 2017. 2017 2016
Weighted average number of ordinary shares in issue (millions) 609 596Potentially dilutive shares (millions) – –Weighted average number of diluted ordinary shares (millions) 609 596Diluted earnings per share from total operations (pence) 25.3 1.0Diluted earnings per share from continuing operations (pence) 12.2 (0.2)Diluted earnings per share from discontinued operations (pence) 13.1 1.2
Adjusted earnings per share adjusts profit after tax for items that are either discontinued operations, one-off in nature or relate to transactions that do not form part of the ongoing performance of the Group.

Our B
usinessG
overnanceFinancial Statem
ents
AA plc Annual Report and Accounts 2017 101
Our Perform
ance
10 Earnings per share (continued)2017 2016
Profit after tax from continuing operations as reported (£m) 74 (1)Adjusted for:Exceptional items (£m) 31 36Impairment of investment in joint venture (£m) 1 –Items not allocated to a segment (£m) 20 18Exceptional finance costs (see note 6) (£m) 15 107Tax expense (£m) 26 10Adjusted profit before tax (£m) 167 170Tax at the effective rate of 22.0% (2016: 23.5%) (£m) (37) (40)Adjusted profit after tax (£m) 130 130Weighted average number of shares outstanding (millions) 609 596Adjusted basic earnings per share (pence) 21.3 21.8Weighted average number of diluted ordinary shares (millions) 609 596Adjusted diluted earnings per share (pence) 21.3 21.8
11 Goodwill and other intangible assetsGoodwill
£mSoftware
£mTotal
£m
Cost At 1 February 2015 1,199 129 1,328 Additions – 64 64Disposals – (2) (2)At 31 January 2016 1,199 191 1,390Additions – 56 56Disposals – (30) (30)Disposed with sale of subsidiary (26) (14) (40)At 31 January 2017 1,173 203 1,376
Amortisation and impairmentAt 1 February 2015 – 71 71Amortisation – 21 21Amortisation within discontinued operations – 2 2Disposals – (2) (2)At 31 January 2016 – 92 92Amortisation – 33 33Amortisation within discontinued operations – 1 1Disposals – (29) (29)Disposed with sale of subsidiary – (5) (5)Exchange differences – 1 1At 31 January 2017 – 93 93
Net book value At 31 January 2017 1,173 110 1,283At 31 January 2016 1,199 99 1,298
Within software, £53m (2016: £53m) relates to assets under construction which are not amortised.
Software additions comprise £12m (2016: £13m) in relation to internally developed assets and £44m (2016: £51m) in relation to separately acquired assets.
The Group has reviewed and shortened the useful economic lives of some software assets, which are expected to be replaced by new software in the year ending 31 January 2018. As a result, amortisation for those assets has been recalculated resulting in an additional amortisation charge to the income statement of £3m.

102 AA plc Annual Report and Accounts 2017
Notes to the consolidated financial statements continued
12 Business combinations
Acquisitions during the year ended 31 January 2017 There were no acquisitions during the year ended 31 January 2017.
Acquisitions during the year ended 31 January 2016 On 18 August 2015, the Group acquired the entire share capital of XL Insurance (Gibraltar) Limited, an insurance underwriter, for a total consideration of £7m. It was then renamed AA Underwriting Insurance Company Limited.
13 Property, plant and equipmentFreehold
Land & Buildings £m
Long Leasehold Land & Buildings
£mVehicles
£m
Plant & equipment
£mTotal
£m
Cost At 1 February 2015 24 10 92 107 233 Additions – – 47 21 68Disposals – – (50) (3) (53)At 31 January 2016 24 10 89 125 248Additions – – 50 14 64Disposals – – (36) (42) (78)Disposed with sale of subsidiary – (3) (6) (8) (17)Exchange differences – – 1 1 2At 31 January 2017 24 7 98 90 219
Depreciation and impairmentAt 1 February 2015 6 4 37 86 133 Charge for the year 1 – 20 9 30Charge for the year within discontinued operations – – 1 – 1Disposals – – (36) (2) (38)At 31 January 2016 7 4 22 93 126Charge for the year – 1 23 10 34Disposals – – (16) (44) (60)Disposed with sale of subsidiary – (2) (4) (8) (14)Exchange differences – – 1 1 2At 31 January 2017 7 3 26 52 88
Net book value At 31 January 2017 17 4 72 38 131At 31 January 2016 17 6 67 32 122
The net book amount of vehicles includes £72m (2016: £65m) held under finance lease agreements. The accumulated depreciation on these assets is £26m (2016: £19m).
The net book amount of other assets includes £nil (2016: £nil) in respect of plant & machinery held under finance lease agreements. The accumulated depreciation on these assets is £8m (2016: £8m).
Within plant and equipment £4m (2016: £10m) relates to assets under construction which are not depreciated.

Our B
usinessG
overnanceFinancial Statem
ents
AA plc Annual Report and Accounts 2017 103
Our Perform
ance
14 Investments in joint ventures and associates2017 2016
Joint ventures
£mAssociates
£mTotal
£m
Joint ventures
£mAssociates
£mTotal
£m
At 1 February 6 4 10 1 3 4Additions 1 1 2 5 – 5Disposals – (1) (1) – – –Share of profits – 1 1 – 1 1Dividend received – (1) (1) – – –Impairment (1) – (1) – – –At 31 January 6 4 10 6 4 10
The joint ventures of the Group which are indirectly held are detailed below.Company Country of registration Nature of business
AA Law Limited (49% interest held)1 England Insurance services TVS Auto Assist (India) Limited (49% interest held)2 India Roadside servicesMotoriety UK Limited (50% interest held)3 England Roadside servicesIntelematics Europe Limited (32% interest held)4 England Roadside services
1 The Group exercises joint control over AA Law Limited through its equal representation on the Board.
2 The Group exercises joint control over TVS Auto Assist (India) Limited through its joint influence over key decision making.
3 The Group exercises joint control over Motoriety UK Limited through its joint influence over key decision making.
4 The Group exercises joint control over Intelematics Europe Limited through its joint influence over key decision making.
The associates of the Group which are indirectly held are listed below.Company Country of registration Nature of business
ARC Europe SA (20% interest held) Belgium Roadside services
During the year, the Group sold its interest in the shares of ACTA Assistance SA to ARC Europe SA. The other parties owning shares in ACTA Assistance SA and ARC Europe SA also sold their interest in ACTA Assistance for shares in ARC Europe so that the overall interest held in ARC Europe remained the same for each party.
The Group also received a dividend from ACTA Assistance during the year of £1m.
The investment in Motoriety was impaired from £1m to £nil as the Group does not deem the investment to be recoverable due to the loss making position of that company. On 23 February 2017, the board of directors of Motoriety UK Limited resolved to commence a pre-pack administration for its assets to be disposed of by an administrator.
15 Inventories2017
£m2016
£m
Finished goods 6 56 5
16 Trade and other receivables2017
£m2016
£m
CurrentTrade receivables 141 146Prepayments and accrued income 22 21Reinsurers’ share of insurance liability (see note 22) 28 1Other receivables 4 4
195 172
Included in trade receivables are amounts of £70m (2016: £89m) relating to amounts due from insurance broking customers.
Reinsurers’ share of insurance liability comprises £15m unearned reinsurance premiums and £13m reinsurance claims outstanding.

104 AA plc Annual Report and Accounts 2017
Notes to the consolidated financial statements continued
17 Cash and cash equivalents2017
£m2016
£m
Ring-fenced cash at bank and in hand – available 128 74Ring-fenced cash at bank and in hand – restricted 8 20Non ring-fenced cash at bank and in hand – available 60 58Non ring-fenced cash at bank and in hand – restricted 15 14
211 166
Ring-fenced cash and cash equivalents relate to cash held by AA Intermediate Co Limited and its subsidiaries. Dividends can only be paid to AA plc when certain debt to EBITDA and cash flow criteria are met.
Cash at bank and in hand includes £23m (2016: £34m) held by and on behalf of the Group’s insurance businesses which are subject to contractual or regulatory restrictions. The reduction in ring-fenced restricted cash since 31 January 2016 relates to the sale of the Irish business.
18 Trade and other payables 2017
£m2016
£m
Trade payables 97 110Other taxes and social security costs 27 23Accruals 57 67Deferred income 241 248Provision for unearned premiums in insurance underwriting (see note 22) 18 –Other payables 33 30Obligations under finance lease agreements (see note 29) 47 40
520 518
Included in trade payables are amounts of £82m (2016: £86m) relating to amounts due to underwriters in respect of insurance broking activities.
19 Borrowings and loans2017
£m2016
£m
Borrowings (see note 20) 2,799 2,893Interest rate swap used for hedging (see note 27) 20 27
2,819 2,920
The interest rate swap liability is shown on a net basis as the liability is settled with each counterparty on a net basis. On a gross basis, the asset is £19m (2016: £24m) and the liability is £39m (2016: £51m).
20 Borrowings
Expected maturity date Interest ratePrincipal
£mIssue costs
£m
Amortised issue costs
£m
Total at 31 January
2017 £m
Total at 31 January
2016 £m
Senior Term Facility 31 January 2019 5.00% 348 (3) 2 347 452Class A1 notes 31 July 2018 4.72% 175 (3) 3 175 474Class A2 notes 31 July 2025 6.27% 500 (1) – 499 499Class A3 notes 31 July 2020 4.25% 500 (3) 2 499 498Class A4 notes 31 July 2019 3.78% 55 (2) 2 55 249Class A5 notes 31 January 2022 2.88% 700 (37) 1 664 –Class B2 notes 31 July 2022 5.50% 570 (16) 6 560 721
4.63% 2,848 (65) 16 2,799 2,893
At 31 January 2017, the Senior Term Facility carried interest at a rate of LIBOR plus a margin of 2%. The variable element has been fully hedged using matching interest rate swap arrangements which fix LIBOR at 3.00% until 31 July 2018 and then at 4.93% until 31 January 2019. All other borrowings have fixed interest rates. The weighted average interest rate for all borrowings of 4.63% has been calculated using the effective interest rate and carrying values on 31 January 2017.

Our B
usinessG
overnanceFinancial Statem
ents
AA plc Annual Report and Accounts 2017 105
Our Perform
ance
20 Borrowings (continued)
A summary of the Group’s financing transactions is shown below:Senior Term
Facility £m
Class A1 £m
Class A2 £m
Class A3 £m
Class A4 £m
Class A5 £m
Class B2 £m
Total £m
As at 1 February 2016 454 475 500 500 250 – 735 2,914Issue/repayment date:31 August 2016 (106) – – – – – – (106)6 December 2016 – (300) – – (195) 700 (165) 40Total 348 175 500 500 55 700 570 2,848
In order to show the Group’s net borrowing, the notes and the issue costs have been offset. Issue costs are shown net of any premium on the issue of borrowings. Interest rate swaps are recognised in the Consolidated statement of financial position at fair value at the year end.
All of the Class A notes and Senior Term Facility are secured by first ranking security in respect of the undertakings and assets of AA Intermediate Co Limited and its subsidiaries. The Class A facility security over the AA Intermediate Co Limited group’s assets ranks ahead of the Class B2 notes. The Class B2 notes have first ranking security over the assets of the immediate parent undertaking of the AA Intermediate Co Limited group, AA Mid Co Limited. AA Mid Co Limited group can only pay a dividend when certain net debt to EBITDA and cash flow criteria are met.
The Class B2 notes have an initial period to 31 July 2018 when any voluntary repayment would incur a make-whole payment and incur all remaining interest due to 31 July 2018. After this period, there is a further two year period when any voluntary repayment would be made at a fixed premium based on the date of redemption. Any voluntary early repayments of the Class A notes would incur a make-whole payment of all interest due to expected maturity date, except the Class A5 notes which can be settled without penalty within three months of the expected maturity date.
Following the sale of the Irish business (see note 3), part of the sale proceeds were used to repay £106m of the Senior Term Facility on 31 August 2016. Under the terms of our borrowings, we have held back £24m from the net proceeds in ring-fenced available cash to be used for potential future acquisitions. Any amounts not committed to an acquisition within 12 months from the AA Ireland completion date must be used to repay either Class A notes or the Senior Term Facility.
On 6 December 2016, the Group issued £700m of Class A5 notes at an interest rate of 2.88%. Holders of £300m of A1 notes and £195m of A4 notes exchanged their A notes for the new A5 notes. From the remaining proceeds, the Group tendered £165m of Class B2 notes. The refinancing was completed at a premium of £30m and with issue costs of £8m. In line with the Group accounting policy, £37m of costs associated with the A1 and A4 notes were capitalised. This consisted of £28m of the premium, £7m of new issue fees and £2m of unamortised issue costs relating to the A1 and A4 notes that were exchanged. Costs associated with the B2 notes have been written off. This consisted of £2m of the premium, £1m of new issue costs and £3m of unamortised issue costs relating to the B2 notes that were tendered.
In order to comply with the requirements of the Class A notes, we are required to maintain the Class A free cash flow to debt service ratio in excess of 1.35x and the senior leverage ratio below 5.5x. The Class B2 notes require us to maintain the Class B2 free cash flow to debt service ratio in excess of 1x.
The Class A and Class B2 notes therefore place restrictions on the Group’s ability to upstream cash from the key trading companies to pay external dividends and finance activities unconstrained by the restrictions embedded in the debts.
The Class A notes only permit the release of cash providing the senior leverage ratio after payment is less than 5.5x and providing there is sufficient excess cash flow to cover the payment. The Class B2 notes only permit the release of cash providing the fixed charge cover ratio after payment is more than 2:1 and providing that the aggregate payments do not exceed 50% of the accumulated consolidated net income.

106 AA plc Annual Report and Accounts 2017
Notes to the consolidated financial statements continued
21 Provisions
Property leases
£mRestructuring
£mOther
£m
Duplicate breakdown
cover £m
Total £m
At 1 February 2015 18 1 1 – 20Utilised during the year (4) – (1) – (5)Released unutilised during the year (2) – – – (2)Charge for the year 1 – 1 – 2At 31 January 2016 13 1 1 – 15Utilised during the year (1) (1) (1) – (3)Disposed with sale of subsidiary – (1) – – (1)Charge for the year 5 4 – 10 19At 31 January 2017 17 3 – 10 30
Current 6 3 – 10 19Non-current 11 – – – 11At 31 January 2017 17 3 – 10 30Current 6 1 1 – 8Non-current 7 – – – 7At 31 January 2016 13 1 1 – 15
The property lease provision relates to future onerous lease costs of vacant properties for the remaining period of the lease, net of expected sub-letting income. These sums are mainly expected to be paid out over the next 6 years however it will take 37 years to fully pay out all amounts provided for. The provision has been calculated on a pre-tax discounted basis.
The restructuring provision relates to redundancy and other related costs following the restructuring of operations in the current and prior periods.
Other provisions primarily comprised a provision for an onerous contract which has been utilised in 2017.
We are aware that there is some duplication of Roadside Assistance cover taken by a limited number of business-to-business customers who are personal Members and hold AVAs (Added Value Accounts) with our banking partners. While some may be unaware that they have duplicate cover, others choose to maintain this to receive the benefits of Membership. Through the review of data for the new Customer Relationship Management systems, we identified a group of customers for whom the benefit of holding both forms of cover is not clear. We proposed a programme of remediation for them which has the support of the regulatory authority. We have provided a total of £10m for our estimate of the refunds due, of which £7m is expected to relate to premiums previously paid for breakdown cover and £3m for interest payable on those premiums. We expect to pay out these amounts during the next financial year.
22 Insurance Underwriting
Reconciliation to segmental result2017
£m2016
£m
Gross earned premium 10 2Reinsurance earned premium (7) –Net earned premium 3 2Deferral of broker commission (3) –Insurance Underwriting revenue (see note 2) – 2
2017 £m
2016 £m
Gross claims incurred (16) (1)Reinsurance recoveries 14 –Net claims paid (2) (1)Administrative costs (2) (1)Deferral of broker acquisition costs 3 -Insurance Underwriting costs (1) (2)

Our B
usinessG
overnanceFinancial Statem
ents
AA plc Annual Report and Accounts 2017 107
Our Perform
ance
22 Insurance Underwriting (continued)
Reconciliation of movements in the provision for unearned premiums2017
£m2016
£m
Gross unearned premiums at 1 February – –Less: unearned reinsurance premiums – –Net unearned premiums at 1 February – –
Gross premiums written 28 2Less: outward reinsurance premium (22) –Net premiums written 6 2
Gross premiums earned (10) (2)Less: reinsurance premium earned 7 –Net premiums earned (3) (2)
Gross unearned premiums at 31 January (see note 18) 18 –Less: unearned reinsurance premiums (see note 16) (15) –Net unearned premiums at 31 January 3 –
Reconciliation of movements in claims outstanding2017
£m2016
£m
Gross claims outstanding at 1 February 4 4Less: reinsurance claims outstanding (1) (1)Net claims outstanding at 1 February 3 3
Gross claims incurred 16 1Less: reinsurance recoveries (14) –Net claims incurred 2 1
Gross claims paid (4) (1)Less: received from reinsurance 2 –Net claims paid (2) (1)
Gross claims outstanding at 31 January (see below) 16 4Less: reinsurance claims outstanding (see note 16) (13) (1)Net claims outstanding at 31 January 3 3
On 7 December 2016, the Lord Chancellor announced a review into the discount rate for personal injury damages awards (the ‘Ogden rate’), which is used by UK courts in the calculation of personal injury lump sum settlements. On 27 February 2017, it was announced that there will be a reduction in the Ogden rate from 2.5% to minus 0.75% with effect from 20 March 2017. The Group has therefore adopted a discount rate of minus 0.75% in estimating claims liabilities in existence at 31 January 2017, which has increased both gross insurance technical provisions and the reinsurance claims outstanding by c. £3m. There is negligible impact on the Group’s operating profit.
Insurance technical provisions 2017
£m2016
£m
Outstanding claims provisions 10 2Other technical provisions – provisions for incurred but not reported claims 6 2
16 4
Provision is made for the estimated cost of claims incurred but not settled at the balance sheet date, including the cost of claims incurred but not yet reported. The estimated cost of claims includes expenses to be incurred in settling claims.

108 AA plc Annual Report and Accounts 2017
Notes to the consolidated financial statements continued
23 Share capital2017
£m2016
£m
Allotted, called up and fully paid609,461,827 (2016: 608,181,845) ordinary shares of £0.001 each 1 1
1 1
The voting rights of the holders of all ordinary shares are the same and all ordinary shares rank pari passu on a winding up. AA plc has no authorised ordinary share capital.
All movement in the number of shares relates to the issue of matching shares in relation to the staff share incentive plans (see note 34).
The MVP shares in issue were as follows: 2017
£0002016
£000
Allotted, called up and fully paid20,000,000 (2016: 20,000,000) MVP A shares of £0.001 each 20 2020,000,000 (2016: 20,000,000) MVP B shares of £0.001 each 20 2020,000,000 (2016: 20,000,000) MVP C shares of £0.001 each 20 20
60 60
The MVP shares have no voting rights. There are 8 million authorised shares in each of the following MVP share classes: A1, B1 and C1. There are 12 million authorised shares in each of the following MVP share classes: A2, B2 and C2. In total, there are 60 million authorised MVP shares. See also note 34.
24 Reserves
Share premium
£m
Own shares
£m
Currency translation
reserve £m
Cash flow hedge
reserve £m
Retained earnings
£m Total
£m
At 1 February 2015 200 – (2) (18) (2,436) (2,256)Retained profit for the year – – – – 6 6Dividends paid – – – – (21) (21)Purchase of own shares by the employee benefit trust – (22) – – – (22)Issue of shares 206 – – – – 206Share issue costs (7) – – – – (7)Share-based payments – – – – 5 5Other comprehensive income:Exchange differences on translation of foreign operations – – 1 – – 1Remeasurement gains on defined benefit schemes (note 25) – – – – 149 149Tax effect of remeasurement gain on defined benefit schemes (note 9) – – – – (26) (26)Effective portion of changes in fair value of cash flow hedges – – – 10 – 10Tax effect of effective portion of changes in fair value of cash flow hedges (note 9) – – – (2) – (2)At 31 January 2016 399 (22) (1) (10) (2,323) (1,957)Retained profit for the year – – – – 154 154Dividends paid – – – – (55) (55)Purchase of own shares by the employee benefit trust – (4) – – – (4)Issue of shares 4 – – – – 4
Share-based payments – – – – 12 12Other comprehensive income:Exchange differences on translation of foreign operations – – 2 – – 2Remeasurement losses on defined benefit schemes (note 25) – – – – (99) (99)Tax effect of remeasurement losses on defined benefit schemes (note 9) – – – – 17 17Effective portion of changes in fair value of cash flow hedges – – – 13 – 13Tax effect of effective portion of changes in fair value of cash flow hedges (note 9) – – – (1) – (1)At 31 January 2017 403 (26) 1 2 (2,294) (1,914)

Our B
usinessG
overnanceFinancial Statem
ents
AA plc Annual Report and Accounts 2017 109
Our Perform
ance
24 Reserves (continued)
Currency translation reserveThe translation reserve comprises foreign exchange differences arising from the translation of the financial statements of foreign operations, as well as from the translation of liabilities that hedge the Group’s net investment in a foreign subsidiary.
Cash flow hedge reserveThe cash flow hedge reserve comprises the effective portion of the cumulative net change in the fair value of cash flow hedging instruments related to hedged transactions that have not yet occurred.
DividendsIn the year ended 31 January 2017, total dividends of 9.1p (2016: 3.5p) per qualifying ordinary share were paid. Dividends are paid from the unconsolidated distributable reserves of AA plc. As at 31 January 2017, the Company had distributable reserves of £512m (2016: £495m). In March 2017, the Directors proposed a final dividend of 5.7p per ordinary share (2016: 5.5p), representing total dividend payments of £57m in respect of the 2017 financial year (2016: £55m). Subject to approval by shareholders at the AGM on 8 June 2017, the dividend will be paid on 13 June 2017 and will be accounted for as an appropriation of retained earnings in the 2018 financial year.
25 Pensions
The Group operates two funded defined benefit pension schemes: the AA UK Pension Scheme (AAUK) and the AA Ireland Pension Scheme (AAI). The assets of the schemes are held separately from those of the Group in independently administered funds. The AAUK scheme has final salary sections and a Career Average Revalued Earnings (CARE) section which accrues benefits on an average salary basis. All AAUK sections are largely closed to new entrants but open to future accrual for existing members. The AAI scheme is closed to new entrants and future accrual of benefits. The Group also operates an unfunded post-retirement Private Medical Plan (AAPMP), which is a defined benefit scheme that is not open to new entrants. During the year, following the sale of the Irish business by the Group (see note 3), AA Corporation Limited, a UK subsidiary of the Group became the sponsor of the AAI scheme.
The AAUK pension scheme is governed by a corporate trustee whose board is currently composed of member-nominated and company-nominated directors. The AAI pension scheme is governed by a corporate trustee whose board is currently composed of company-nominated directors of which some are also members of the scheme. For both pension schemes the company-nominated directors include an independent director whom the trustee board directors have nominated as Chairman. The trustee of each scheme is responsible for paying members’ benefits and for investing scheme assets, which are legally separate from the Group.
The valuations have been based on a full assessment of the liabilities of the schemes which have been updated where appropriate to 31 January 2017 by independent qualified actuaries.
The amounts recognised in the balance sheet are as follows:As at 31 January 2017
AAUK £m
AAI £m
AAPMP £m
Total £m
Present value of the defined benefit obligation in respect of pension plans (2,515) (53) (59) (2,627)Fair value of plan assets 2,190 42 – 2,232Deficit (325) (11) (59) (395)
As at 31 January 2016AAUK
£mAAI £m
AAPMP £m
Total £m
Present value of the defined benefit obligation in respect of pension plans (2,053) (46) (47) (2,146)Fair value of plan assets 1,815 35 – 1,850Deficit (238) (11) (47) (296)
The increase in the deficit is due to changes in the financial assumptions, primarily a decrease in the discount rate and increase in assumed price inflation partially offset by the updating of mortality rates.
In November 2013, the Group completed the AAUK pension scheme triennial valuation agreeing a deficit of £202m with the pension trustees and implementing an asset backed funding scheme. The asset backed funding scheme provides a long-term deficit reduction plan where the Group makes an annual deficit reduction contribution, increasing with inflation (capped at 5% each year), over a period of 25 years up to 2038 secured on the Group’s brands. In the year ended 31 January 2017 this contribution was £13m. The Group also made an additional one off deficit reduction payment of £6m to the AAUK scheme bringing total deficit reduction contributions for the AAUK scheme to £19m. The Group is currently committed to pay c.£13m in annual deficit reduction contributions for the AAUK scheme.
Using an inflation assumption of 3.2% and a discount rate assumption of 2.7%, the present value of the future deficit reduction contributions has been calculated and based on these assumptions, the Group does not expect the present value of deficit reduction contributions to exceed the IAS 19 deficit. The Group has also considered circumstances in which a surplus could be created and note that, in this event, the Group would have an unconditional right to a refund of the surplus assuming the gradual settlement of AAUK liabilities over time until all members have left the plan.
The triennial valuation of the AAUK pension scheme as at 31 March 2016 is currently underway. It is likely, following completion of the valuation, that both the ongoing and deficit reduction employer contributions the Group is required to pay will increase above current levels. In light of this anticipated increase in cost, we have undertaken a review of the options for mitigating current and future liabilities. We are proposing to retain a defined benefit arrangement allowing all members of the AAUK scheme to accrue future service benefits in a single modified CARE defined benefit section of the scheme. This will involve moving employees from the final salary sections of the AAUK scheme into the modified CARE section. On the 20 March 2017, we commenced a consultation process with employees affected by the proposed changes. These changes, if implemented, will be taken into account in agreeing the future contributions and deficit reduction plan with the pension trustees which should be finalised by 30 June 2017.

110 AA plc Annual Report and Accounts 2017
Notes to the consolidated financial statements continued
25 Pensions (continued)
The last triennial valuation for the AAI scheme was in December 2013. The Group made deficit reduction contributions of c. £1m in the year ended 31 January 2017 and will continue to make annual deficit reduction contributions, increasing with inflation, until December 2023 or until an alternative agreement is agreed with the trustees.
The triennial valuation of the AAI scheme is due as at 31 December 2016, and is expected to be finalised during the 2018 financial year.
In total, the Group is currently committed to pay c. £19m in ongoing employer contributions and c. £14m in deficit reduction employer contributions to its defined benefit plans (AAUK and AAI) in the year ending 31 January 2018.
Assets £m
Liabilities £m
Income statement
£m
Statement of comprehensive
income £m
Balance at 1 February 2016 1,850 (2,146) – –Current service cost – (29) (29) –Interest on defined benefit scheme assets/(liabilities) 68 (78) (10) –Amounts recognised in the income statement 68 (107) (39) –Effect of changes in financial assumptions – (613) – (613)Effect of changes in demographic expectations – 110 – 110Effect of experience adjustment – 81 – 81Return on plan assets excluding interest income 323 – – 323Amounts recognised in the statement of comprehensive income 323 (422) – (99)Foreign exchange gain/(loss) 5 (6) – (1)Contribution from scheme participants 1 (1) – –Benefits paid from scheme assets (55) 55 – –Ongoing employer contributions 20 – – –Deficit reduction employer contributions 20 – – –Movements through cash (14) 54 – –Balance at 31 January 2017 2,232 (2,627) – –
Assets £m
Liabilities £m
Income statement
£m
Statement of comprehensive
income £m
Balance at 1 February 2015 1,844 (2,278) – –Current service cost – (34) (34) –Past service cost – (2) (2) –Interest on defined benefit scheme assets/(liabilities) 56 (68) (12) –Amounts recognised in the income statement 56 (104) (48) –Effect of changes in financial assumptions – 185 – 185Effect of experience adjustment – 1 – 1Return on plan assets excluding interest income (37) – – (37)Amounts recognised in the statement of comprehensive income (37) 186 – 149Foreign exchange loss – (1) – (1)Contribution from scheme participants 1 (1) – –Benefits paid from scheme assets (52) 52 – –Ongoing employer contributions 24 – – –Deficit reduction employer contributions 14 – – –Movements through cash (13) 51 – –Balance at 31 January 2016 1,850 (2,146) – –
A redundancy exercise was carried out during the year ended 31 January 2016 which affected 28 members of the AAUK Scheme. Under the terms of the AAUK Scheme the members were entitled to enhanced pension benefits upon redundancy and the impact of this was a past service cost of £2m in relation to the AAUK scheme.

Our B
usinessG
overnanceFinancial Statem
ents
AA plc Annual Report and Accounts 2017 111
Our Perform
ance
25 Pensions (continued)
Fair value of plan assetsThe overall expected rate of return is calculated by weighting the individual rates in accordance with the anticipated balance in the plan’s investment portfolio.
The table below shows the AAUK plan assets split between those that have a quoted market price and those that are unquoted. In respect of the AAI scheme 33.1% (2016: 26.6%) of assets do not have a quoted market price.
The fair value of the AAUK assets and the return on those assets were as follows:2017 2016
Assets with a quoted
market price £m
Assets without a quoted
market price £m
Assets with a quoted
market price £m
Assets without a quoted
market price £m
Equities 184 258 136 265Bonds 876 183 667 122Property 81 168 79 172Hedge funds – 401 – 356Cash/net current assets 37 2 17 1Total AAUK assets 1,178 1,012 899 916Actual return on AAUK assets 388 18
Investment strategyThe AAUK trustee determines its investment strategy after taking advice from a professional investment adviser. The scheme’s investment strategy has been set following an asset/liability review which considered a wide range of investment opportunities available to the scheme and how they might perform in combination. Other factors were also taken into account such as the strength of the employer covenant, the long term nature of the liabilities and the funding plan agreed with the employer.
The trustee aims to achieve the scheme’s investment objectives through investing partly in a diversified mix of growth assets which, over the long term, are expected to grow in value by more than low risk assets like cash and gilts. This is done within a broad liability driven investing framework that uses cash, gilts and other hedging instruments like swaps in a capital efficient way. In combination this efficiently captures the trustee risk tolerances and return objectives relative to the scheme’s liabilities. A number of investment managers are appointed to promote diversification by assets, organisation and investment style.
To diversify sources of return and risk, the AAUK scheme invests in many asset classes and strategies, including equities, bonds and property funds which primarily rely on the upward direction of the underlying markets for returns, and also hedge funds which also invest in asset classes like equities, bonds and currencies, but in such a way that relies more on the skill of the investment manager to add returns whilst hedging against downward market moves.
The trustee’s investment advisors carry out detailed ongoing due diligence on funds in all asset classes from both operational and investment capability standpoints and any funds which are not expected to achieve their investment performance targets are replaced where possible.
Pension plan assumptionsThe principal actuarial assumptions were as follows:
%
AAUK AAI AAPMP2017
%2016
%2017
%2016
%2017
%2016
%
Pensioner discount rate 2.7 3.6 1.6 1.7 2.7 3.6Non pensioner discount rate 2.9 3.8 2.4 2.6 2.7 3.8Pensioner RPI 3.5 2.9 – – 3.5 2.9Non pensioner RPI 3.5 3.2 – – 3.5 3.2Rate of increase of pensions in payment – pensioner 3.2 2.8 – – – –Rate of increase of pensions in payment – non pensioner 3.2 3.0 – – – –Pensioner increase for deferred benefits 2.4 2.2 1.5 1.5 – –Medical premium inflation rate – – – – 7.5 6.9
Mortality assumptions for the AAUK scheme are set using standard tables based on scheme specific experience where available and an allowance for future improvements. For 2017, the assumptions used were in line with the SAPS (S2) series mortality tables (2016 – SAPS (S1) series) with future improvements in line with the CMI_2015 model with a 1.5% long-term rate of improvement (2016 – CMI_2012 model with a 1.5% long-term rate of improvement). The AAI scheme mortality assumptions are set using standard tables with scheme specific adjustments.
The AA schemes’ overall assumptions are that an active male retiring in normal health currently aged 60 will live on average for a further 27 years and an active female retiring in normal health currently aged 60 will live on average for a further 30 years.

112 AA plc Annual Report and Accounts 2017
Notes to the consolidated financial statements continued
25 Pensions (continued)
Sensitivity analysisReasonably possible changes at the reporting date to one of the relevant actuarial assumptions, holding other assumptions constant, would have affected the defined benefit liability by the amounts shown below:
For the year ending 31 January 2017AAUK
£mAAI £m
AAPMP £m
Increase of 0.25% in discount rate 127 3 2Increase of 0.25% in Inflation rate (102) (1) –Increase of 1% in medical claims inflation – – (9)Increase of one year of life expectancy (90) (2) –
An equivalent decrease in the assumptions at 31 January 2017 would have had the equal but opposite effect on the amounts shown above, on the basis that all other variables remain constant.
The weighted average duration of plan liabilities at 31 January 2017 is around 21 years.
Pension scheme risksThe AAUK and AAI schemes have exposure to a number of risks because of the investments they make in following their investment strategy. Investment objectives and risk limits are implemented through the investment management agreements in place with the schemes’ investment managers and monitored by the trustees by regular reviews of the investment portfolios. In addition, under guidance from their investment advisors the trustees monitor estimates of key risks on an ongoing basis such as those shown below. A number of measures are taken to mitigate these risks where possible.
Interest rate risk and Inflation risk - this is the risk that the present value of future cash flows of a financial asset or liability will fluctuate because of changes in market interest rates and/or expected inflation. The scheme is subject to interest rate and inflation risk because some of the scheme’s investments are in gilts, index linked gilts and other hedging assets. These investments are held in order to mitigate the impact of interest rate and inflation changes on the Scheme’s liabilities.
Credit risk - this is the risk that one party to a financial instrument will cause a financial loss for the other party by failing to discharge an obligation. This risk mainly relates to the Scheme’s bonds and is mitigated by carrying out due diligence and investing only in bond funds which are well diversified in terms of credit instrument, region, credit rating and issuer of the underlying bond assets. To reduce risk further, the underlying bond assets within a fund are ringfenced, and the scheme diversifies across a number of bond funds.
Currency risk - the scheme is subject to currency risk because some of the scheme’s investments are in overseas markets. The trustee hedges some of this currency risk by investing in investment funds which hold currency derivatives to protect against adverse fluctuations in the relative value of its portfolio positions as a result of changes in currency exchange rates.
Market price risk - this is the risk that the fair value or future cash flows of a financial asset such as equities will fluctuate because of changes in market prices (other than those arising from interest rate, inflation or currency risk), whether those changes are caused by factors specific to the individual financial instrument or its issuer, or factors affecting all similar financial instruments traded in the market. The scheme manages this exposure to overall price movements by constructing a diverse portfolio of investments across various markets and investment managers.
Financial derivatives risk – The scheme does not directly hold any financial derivatives but instead invests in investment funds which hold the derivatives required to hedge the scheme’s interest rate, inflation and currency risks. The scheme also permits some of the investment managers to use derivative instruments if these are being used to contribute to a reduction of risks or facilitate efficient portfolio management of their funds. The main risks associated with financial derivatives include: losses may exceed the initial margin; counterparty risk where the other party defaults on the contract; and liquidity risk where it may be difficult to close out a contract prior to expiry. These risks are managed by monitoring of investment managers to ensure they have reasonable levels of market exposure relative to initial margin and positions are fully collateralised on a daily basis with secure cash or gilts collateral.
The AAUK scheme had hedged around 50% of interest rate risk and around 75% of inflation risk (of the liabilities) as at 31 January 2017 and hedging had been fairly constant at those levels for some years as part of a policy to reduce financial risks to the Scheme. The current longer term objective is to aim to hedge around 75% of both the interest rate risk and inflation risk of the liabilities; this will help to further reduce funding level volatility. More interest rate hedging will be added in due course as, and when, prevailing pricing is regarded as reasonable value in the circumstances, or if any other reasons drive a policy change on risk appetite.

Our B
usinessG
overnanceFinancial Statem
ents
AA plc Annual Report and Accounts 2017 113
Our Perform
ance
26 Impairment of intangible assets
Goodwill acquired through business combinations has been allocated to cash generating units (“CGUs”) on initial recognition and for subsequent impairment testing.
The carrying value of goodwill by CGU is as follows:2017
£m2016
£m
Roadside Assistance 874 874Insurance Services 240 240Driving Schools 26 26DriveTech 33 33Ireland – 26
1,173 1,199
The Group has performed impairment testing at 31 January 2017 and 31 January 2016. The impairment test compares the recoverable amount of the CGU to its carrying value. The Ireland segment was disposed of on 11 August 2016 (see note 3).
The recoverable amount of each CGU has been determined based on a value in use calculation using cash flow projections from the Group’s three year plan up to 31 January 2020 and a reasonable expectation of growth in the subsequent two years. For the purposes of the impairment test, terminal values have been calculated using the Gordon growth model and a nil growth assumption after year 5 which is lower than the expected long term average growth rate of the UK economy. Cash flows have been discounted at a pre-tax rate reflecting the time value of money and the risk specific to these cash flows. This has been determined as a pre-tax rate of 9.0% (2016: 9.9%).
The value in use calculation used is most sensitive to the assumptions used for growth and for the discount rate. Accordingly, stress testing has been performed on these key assumptions as part of the impairment test to further inform the consideration of whether any impairment is evident. Further to this, management believes that no reasonably foreseeable change in any of the key assumptions would cause the recoverable amount of the CGU to be lower than its carrying amount, and consequently no impairment has been recognised.
27 Financial assets and financial liabilities
The carrying amounts of all financial assets and financial liabilities by class are as follows:
Financial assets 2017
£m2016
£m
Loans and receivablesCash and cash equivalents 211 166Trade receivables 141 146Other receivables and accrued income 16 17Total financial assets 368 329
Financial liabilities 2017
£m2016
£m
Measured at fair value through other comprehensive incomeInterest rate and fuel swaps used for hedging 20 27
Loans and borrowingsTrade payables 97 110Other payables 56 66Obligations under finance lease agreements 67 61Borrowings 2,799 2,893Total financial liabilities 3,039 3,157

114 AA plc Annual Report and Accounts 2017
Notes to the consolidated financial statements continued
27 Financial assets and financial liabilities (continued)
Fair valuesFinancial instruments held at fair value are valued using quoted market prices or other valuation techniques.
Valuation techniques include net present value and discounted cash flow models, and comparison to similar instruments for which market observable prices exist. Assumptions and market observable inputs used in valuation techniques include interest rates.
The objective of using valuation techniques is to arrive at a fair value that reflects the price of the financial instrument at each year end at which the asset or liability would have been exchanged by market participants acting at arm’s length.
Observable inputs are those that have been seen either from counterparties or from market pricing sources and are publicly available. The use of these depends on the liquidity of the relevant market. When measuring the fair value of an asset or a liability, the Group uses observable inputs as much as possible. Fair values are categorised into different levels in a fair value hierarchy based on the inputs used in the valuation as follows:
Level 1 – Quoted market prices in an actively traded market for identical assets or liabilities. These are the most reliable.
Level 2 – Inputs other than quoted prices included in Level 1 that are observable for the assets or liabilities. These include valuation models used to calculate the present value of expected future cash flows and may be employed either when no active market exists or when there are quoted prices available for similar instruments in active markets. The models incorporate various inputs, including interest rate curves and forward rate curves of the underlying instrument.
Level 3 – Inputs for assets or liabilities that are not based on observable market data.
If the inputs used to measure the fair values of an asset or a liability might be categorised in different levels of the fair value hierarchy, then the fair value measurement is categorised in its entirety in the same level as the lowest input that is significant to the entire measurements.
The fair values are periodically reviewed by the Group Treasury function. The following tables provide the quantitative fair value hierarchy of the Group’s interest rate swaps and loan notes.
The carrying values of all other financial assets and liabilities (including the Senior Term Facility) are approximate to their fair values:
At 31 January 2017:
Carrying value
£m
Fair value measurement using
Quoted prices in active markets
(Level 1) £m
Significant observable
inputs (Level 2)
£m
Significant unobservable
inputs (Level 3)
£mFinancial liabilities measured at fair valueInterest rate and fuel swaps (note 19) 20 – 20 –Liabilities for which fair values are disclosedLoan notes (note 20) 2,452 2,656 – –
At 31 January 2016:
Carrying value
£m
Fair value measurement using
Quoted prices in active markets
(Level 1) £m
Significant observable
inputs (Level 2)
£m
Significant unobservable
inputs (Level 3)
£m
Financial liabilities measured at fair valueInterest rate and fuel swaps (note 19) 27 – 27 –Liabilities for which fair values are disclosedLoan notes (note 20) 2,441 2,528 – –
There have been no transfers between the levels and no non-recurring fair value measurements of assets and liabilities during the two years to 31 January 2017.

Our B
usinessG
overnanceFinancial Statem
ents
AA plc Annual Report and Accounts 2017 115
Our Perform
ance
28 Financial risk management objectives and policies
The Group’s principal financial liabilities comprise borrowings as well as trade and other payables. The main purpose of these financial liabilities is to finance the Group’s operations. The Group’s principal financial assets include deposits with financial institutions, money market funds and trade receivables.
The Group is exposed to market risk, credit risk and liquidity risk. The Group’s senior management oversees the management of these risks, supported by the Group Treasury function. The Group Treasury function ensures that the Group’s financial risks are governed by appropriate policies and procedures and that financial risks are identified, measured and managed in accordance with the Group’s policies and risk objectives. All derivative activities are for risk management purposes and are carried out by the Group Treasury function. It is the Group’s policy not to trade in derivatives for speculative purposes.
The Board of Directors reviews and agrees policies for managing each of these risks, which are summarised below.
Market riskMarket risk is the risk that the fair value of future cash flows of a financial instrument will fluctuate because of changes in prices set by the market. The key market risk that the Group is exposed to is interest rate risk. The Group has policies and limits approved by the Board for managing the interest rate risk exposure. The Group’s policy is to fully hedge all of its exposure to variable interest rates. The Group has therefore taken out interest rate swaps to the value of its variable rate instruments.
The interest rate profile of the Group’s interest-bearing financial instruments is as follows:2017
£m2016
£m
Fixed rate instrumentsFinancial liabilities (2,518) (2,502)Effect of interest rate swaps (348) (454)Net exposure to fixed rate instruments (2,866) (2,956)Variable rate instrumentsFinancial liabilities (347) (452)Effect of interest rate swaps 348 454Net exposure to variable rate instruments 1 2
Sensitivity of fixed-rate instruments The Group does not account for any fixed-rate financial assets and financial liabilities at fair value through profit or loss and does not use derivative instruments in fair value hedges. Consequently, having regard to fixed rate instruments, a change in market interest rates at the reporting date would not affect profit or loss.
Sensitivity of variable rate instrumentsAn increase of 50 basis points in interest rates at 31 January 2017 would have increased equity by £2m (2016: £4m) and would have had no impact on profit or cash. A decrease to interest rates of the same magnitude will have an equal and opposite effect on equity and profit. This calculation assumes that the change occurred at the year end and had been applied to risk exposures existing at that date.
This analysis assumes that all other variables remain constant and considers the effect of financial instruments with variable interest rates and the fixed rate element of interest rate swaps. The analysis is performed on the same basis for all comparative periods.
Credit riskCredit risk is the risk that a counterparty will not meet its obligations under a financial instrument or customer contract, leading to a financial loss. The Group is exposed to credit risk in relation to its financial assets, outstanding derivatives and trade and other receivables. The Group assesses its counterparty exposure in relation to the investment of surplus cash and undrawn credit facilities. The Group primarily uses published credit ratings to assess counterparty strength and therefore to define the credit limit for each counterparty, in accordance with approved treasury policies.
The credit risk for the Group is limited as payment from customers is generally required before services are provided.
Credit risk in relation to deposits and derivative counterparties is managed by the Group’s treasury function in accordance with the Group’s policy. Investments of surplus funds are made only with approved counterparties and within credit limits assigned to each counterparty. The limits are set to mitigate financial loss through any potential counterparty failure.
The Group’s maximum exposure to credit risk for the components of the statement of financial position at each reporting date is the carrying amount except for derivative financial instruments. The Group’s maximum exposure for financial derivative instruments is noted under liquidity risk.

116 AA plc Annual Report and Accounts 2017
Notes to the consolidated financial statements continued
28 Financial risk management objectives and policies (continued)
The ageing analysis of trade receivables is as follows:Past due but not impaired
Total £m
Neither past due nor
impaired £m
< 30 days £m
30-60 days £m
60+ days £m
2017 141 135 4 – 22016 146 136 2 2 6
The movements in the provision for the collective impairment of receivables are as follows:2017
£m2016
£m
At 1 February 2 2Charge for the year 2 1Utilised (1) –Unused amounts reversed (1) (1)At 31 January 2 2
Liquidity riskLiquidity risk is the risk that the Group either does not have available sufficient financial resources to enable it to meet its obligations as they fall due, or can secure them only at excessive cost. The Group’s approach to managing liquidity risk is to evaluate current and expected liquidity requirements to ensure that it maintains sufficient reserves of cash and headroom on its working capital facilities.
The table below analyses the maturity of the Group’s financial liabilities on a contractual undiscounted cash flow basis and includes any associated debt service costs. The analysis of non-derivative financial liabilities is based on the remaining period at the reporting date to the contractual maturity date.
At 31 January 2017:On demand
£mLess than 1 year
£m1-2 years
£m2-5 years
£mOver 5 years
£mTotal
£mLoans and borrowings – 126 641 1,536 1,195 3,498Obligation under finance leases – 51 13 8 – 72Other payables and accruals – 56 – – – 56Trade payables – 97 – – – 97
– 330 654 1,544 1,195 3,723
Interest rate swaps used for hedgingAssets (inflow) – (14) (8) – – (22)Liabilities – 23 18 – – 41
– 9 10 – – 19– 339 664 1,544 1,195 3,742
At 31 January 2016:On demand
£mLess than 1 year
£m1-2 years
£m2-5 years
£mOver 5 years
£mTotal
£m
Loans and borrowings – 138 140 1,990 1,436 3,704Obligation under finance leases – 43 14 8 – 65Other payables and accruals – 66 – – – 66Trade payables – 110 – – – 110
– 357 154 1,998 1,436 3,945
Interest rate swaps used for hedgingAssets (inflow) – (9) (3) – – (12)Liabilities – 16 8 5 – 29
– 7 5 5 – 17– 364 159 2,003 1,436 3,962

Our B
usinessG
overnanceFinancial Statem
ents
AA plc Annual Report and Accounts 2017 117
Our Perform
ance
28 Financial risk management objectives and policies (continued)
Capital managementAs noted in the financial review on pages 26 to 29, the Group considers its capital to be a combination of net debt and equity.
2017 £m
2016 £m
Total net debt 2,704 2,809Equity (valued at close on 31 January 2017) 1,486 1,790Total capital 4,190 4,599
The Group’s objectives when managing capital are:
to safeguard the entity’s ability to continue as a going concern, so that it can continue to provide returns for shareholders and benefits for other stakeholders;
to further strengthen the AA as the pre-eminent Membership services organisation in the UK;
to revolutionise the customer experience through investing in and embracing new technologies;
to reduce Group borrowings and associated interest costs; and
to provide an adequate return to shareholders.
The relative priorities of these objectives are discussed on page 28 of the financial review.
The Group monitors capital using net debt to Trading EBITDA ratios. The key ratios are Senior Secured Debt to Trading EBITDA, and Net Debt to Trading EBITDA as calculated below:
2017 £m
2016 £m
Senior Term Facility 348 454Class A notes 1,930 1,725Less: AA Intermediate Co Limited group cash and cash equivalents (136) (94)Net Senior Secured Debt1 2,142 2,085Class B2 notes 570 735Finance lease obligations 67 61Net WBS Debt2 2,779 2,881Less: AA plc Group cash and cash equivalents3 (75) (72)Total Net Debt 2,704 2,809
AA plc Trading EBITDA 403 402AA Intermediate Trading EBITDA4 414 417
Net debt ratio5 6.7x 7.0xClass B2 leverage ratio6 6.7x 6.9xSenior leverage ratio7 5.2x 5.0x
1 Principal amounts of the Senior Term Facility and Class A notes less AA Intermediate Co Limited group cash and cash equivalents.
2 WBS debt represents the borrowings and cash balances within the WBS structure headed by AA Intermediate Co Limited. This includes the principal amounts of the Senior Term Facility, Class A notes, Class B2 notes and finance leases less AA Intermediate Co Limited group cash and cash equivalents.
3 Total cash and cash equivalents for the Group excluding the value reported as the AA Intermediate Co Limited group cash and cash equivalents.
4 AA Intermediate Co Limited group Trading EBITDA including discontinued operations and business held for sale as required by the debt documents .
5 Ratio of Total Net Debt to AA plc Trading EBITDA for the last 12 months.
6 Ratio of Net WBS Debt to AA Intermediate Trading EBITDA for the last 12 months.
7 Ratio of Net Senior Secured Debt to AA Intermediate Trading EBITDA for the last 12 months.
The Senior Term Facility, Class A notes and Class B2 notes have interest cover covenants attached to them. The Group was in compliance with all covenants throughout the period and as at 31 January 2017.
The Group includes regulated companies which are required to hold sufficient capital to meet acceptable solvency levels based on the relevant regulators’ requirements (see note 17). There are no other externally imposed capital requirements.
Further details on our policies and processes for managing capital, as well as the thresholds set for the covenants above are set out in the financial review on pages 26 to 29.
Further details of our objectives to reduce Group borrowings are set out in the strategic report on page 14.

118 AA plc Annual Report and Accounts 2017
Notes to the consolidated financial statements continued
29 Commitments and contingencies
Operating lease commitments Future minimum rentals payable under non-cancellable operating leases as at 31 January are as follows:
Land and buildings2017
£m2016
£m
Leases expiring:Within one year 1 –Between one and five years 10 11After five years 23 28
34 39Rentals receivable from operating sub-leases (4) (4)Amounts included in onerous lease provisions (4) (6)
26 29
Where a property is no longer used by the Group for operational purposes, tenants are sought to reduce the Group’s exposure to lease payments. Where the future minimum lease payments are in excess of any expected rental income due, a provision is made.
Finance lease commitmentsThe Group has finance lease contracts for various items of plant and machinery. Future minimum lease payments under finance lease contracts, together with the present value of the net minimum lease payments, are as follows:
2017 2016Present value
of payments £m
Minimum payments
£m
Present value of payments
£m
Minimum payments
£m
Within one year 47 51 40 43Between one and five years 20 21 21 22Total minimum lease payments 67 72 61 65Less amounts representing finance charge – (5) – (4)Present value of minimum lease payments 67 67 61 61
Capital commitmentsAmounts contracted for but not provided in the financial statements amounted to £14m (2016: £15m).
30 Subsidiary undertakings
The subsidiary undertakings of AA plc, all of which are wholly owned except where stated, are listed in note 9 of the Company financial statements.
31 Auditor’s remuneration2017
£m2016
£m
Amounts receivable by the Company’s auditor and its associates in respect of:Audit of financial statements of subsidiaries of the Company 1 1Corporate finance services – 1
The fee for the audit of these financial statements was £0.2m (2016: £0.2m).
Corporate finance services mainly relate to reporting accountant work that would normally be undertaken by the auditor. The fee for this work was £0.4m (2016: £1m).
32 Related party transactions
The following table provides the total value of transactions that have been entered into with associates during each financial year:
Transactions with associates:
Associate Nature of transaction2017
£m2016
£m
ACTA SA. Call handling fees paid 2 2ARC Europe SA. Registration fees paid 1 1
Note that the Group’s interest in ACTA SA was sold in the year, see note 14.

Our B
usinessG
overnanceFinancial Statem
ents
AA plc Annual Report and Accounts 2017 119
Our Perform
ance
33 Compensation of key management personnel of the Group
Key management personnel are defined as those persons having authority and responsibility for planning, directing and controlling the activities of the Group.
Key management personnel consists of the Executive Chairman, the Chief Financial Officer, Non-Executive Directors and the Executive Management Committee.
The amounts recognised as an expense during the financial year in respect of key management personnel are as follows:2017
£m2016
£m
Short-term employee benefits 6 6Share-based payments – MVP and LTBP shares (see note 34) 8 2Total compensation of key management personnel 14 8
34 Share-based payments2017
£m2016
£m
Share-based payments – MVP shares 8 2Share-based payments – LTBP 2 2Share-based payments – staff share incentive plan 2 1
12 5
Management value participation shares (MVP shares)On 23 June 2014, the Company issued 24 million convertible, redeemable MVP shares to certain key members of senior management at £0.001 per share. These shares were divided into three classes and are convertible into ordinary shares following satisfaction of a Total Shareholder Return (TSR) performance condition of 12% (or above) per annum compound growth against the admission price of £2.50 which is tested on the third, fourth and fifth anniversaries of admission to the London Stock Exchange.
A further 36 million MVP shares were issued at £0.001 per share on 22 December 2015.
At 31 January 2016, 14.2% of the issued MVP shares were held in the Employee Benefit Trust (EBT). On 22 April 2016, awards were granted by the EBT to further key members of senior management over ordinary shares which convert from the remaining 14.2% (amounting to 8,520,000) MVP shares.
The MVP share-based payments are equity settled. The following table illustrates the number and fair value of the MVP shares awarded:
Vesting date2017
No. of shares2016
No. of shares
2017 Fair value per share
£
2016 Fair value per share
£
June 2014 awards:A1 shares 23 June 2017 8,000,000 8,000,000 0.25 0.25B1 shares 23 June 2018 8,000,000 8,000,000 0.26 0.26C1 shares 23 June 2019 8,000,000 8,000,000 0.26 0.26December 2015 awards:A2 shares 23 June 2017 9,160,000 9,160,000 0.38 0.38B2 shares 23 June 2018 9,160,000 9,160,000 0.40 0.40C2 shares 23 June 2019 9,160,000 9,160,000 0.40 0.40April 2016 awardsA2 shares 23 June 2017 2,840,000 – 0.35 –B2 shares 23 June 2018 2,840,000 – 0.35 –C2 shares 23 June 2019 2,840,000 – 0.35 –Total 60,000,000 51,480,000
Unvested A1 and A2 shares can also be converted on the fourth or fifth anniversary of admission and unvested B1 and B2 shares can also be converted on the fifth anniversary of admission.

120 AA plc Annual Report and Accounts 2017
Notes to the consolidated financial statements continued
34 Share-based payments (continued)
All MVP shares were valued using a Binomial model and 25% volatility assumption to calculate the fair value using the following risk-free interest rates:Vesting period
3 year %
4 year %
5 year %
Risk-free interest rate for A1, B1 and C1 MVP shares 0.88 1.35 1.82Risk-free interest rate for A2, B2 and C2 MVP shares issued December 2015 0.55 0.77 0.98Risk-free interest rate for A2, B2 and C2 awards over MVP shares - April 2016 0.44 0.38 0.55
The expected volatility reflects the assumption that the historical volatility is indicative of future trends which may not necessarily be the actual outcome.
Long Term Bonus Plan (LTBP)On 13 August 2015, the Company’s EBT issued 3 million conditional awards over market purchased ordinary shares to certain key members of senior management at nil cost. A further 1 million conditional ordinary shares were issued on 16 November 2015.
These shares were divided into three tranches, A, B and C, and vest following satisfaction of a Total Shareholder Return (TSR) performance condition of 12% per annum compound growth against the admission price of £2.50 which is tested on the third, fourth and fifth anniversaries of admission to the London Stock Exchange and satisfaction of certain individual performance targets.
The LTBP share-based payments are equity settled. The following table illustrates the number and fair value of the LTBP shares:
Vesting date2017
No. of shares2016
No. of shares
2017 Fair value per share
£
2016 Fair value per share
£
August 2015 awardsA shares 26 June 2017 757,792 1,010,219 2.93 2.93B shares 26 June 2018 745,956 1,010,219 2.39 2.39C shares 26 June 2019 740,236 1,010,219 1.88 1.88November 2015 awardsA shares 26 June 2017 247,104 247,104 1.43 1.43B shares 26 June 2018 247,104 247,104 1.12 1.12C shares 26 June 2019 247,104 247,104 0.83 0.83Total 2,985,296 3,771,969
If the awards over A shares do not vest on the third anniversary of admission, then they are retested on the fourth and/or fifth anniversary. If the awards over B shares do not vest on the fourth anniversary of admission, then they are retested on the fifith anniversary.
The number of ordinary shares over which awards are held has reduced by 786,673 due to the adjustment to the entitlement of leavers during the financial year.
The awards over shares issued in August 2015 were valued using a Monte Carlo simulation model and 20% volatility assumption to calculate the fair value using the following risk-free interest rates:
Vesting period3 year 4 year 5 year
Risk-free interest rate (%) 0.70 0.72 1.00
The awards over shares issued in November 2015 were valued using a Monte Carlo simulation model and 24% volatility assumption to calculate the fair value using the following risk-free interest rates:
Vesting period3 year 4 year 5 year
Risk-free interest rate (%) 0.58 0.79 0.99
The expected volatility reflects the assumption that the historical volatility is indicative of future trends which may not necessarily be the actual outcome.

Our B
usinessG
overnanceFinancial Statem
ents
AA plc Annual Report and Accounts 2017 121
Our Perform
ance
34 Share-based payments (continued)
Staff share incentive plansThe Group has a number of all employee Share Incentive Plans (SIP).
Under the SIP, employees are able to buy Partnership shares by making weekly or monthly payments into the SIP.
In addition, for every Partnership share an employee purchases the Company will match this on a 1:1 basis (Matching Shares).
The SIP share-based payments are equity settled. The following table illustrates the fair value and vesting period of the SIPs:
Share type Award date Vesting date No. of shares
2017Volatility
%
Risk-free interest rate
%
Fair value per share
£
Charge for year ended 31 January
2017 £m
Charge for year ended 31 January
2016 £m
2015 SIP
Partnership shares 29 August 2014 29 August 2015 2,132,766 21 0.55 0.23 – –Matching shares 29 August 2014 29 August 2018 2,132,766 21 0.55 2.58 1 12016 SIPMatching shares 11 January 2016 11 January 2019 1,366,211 26 0.76 2.93 1 –
5,631,743 2 1
The SIPs are valued using a Black Scholes model.
The expected volatility reflects the assumption that the historical volatility is indicative of future trends which may not necessarily be the actual outcome.
The 2016 SIP scheme began in January 2016 with the issue of 111,577 shares in that month. Shares were then issued each month until December 2016.
The 2017 SIP scheme began in February 2017, after the current year end.
35 Accounting standards, amendments and interpretations
New accounting standards, amendments and interpretations adopted in the yearIn the year ended 31 January 2017, the Group did not adopt any new standards or amendments issued by the IASB or interpretations issued by the IFRS Interpretations Committee (IFRS IC) that have had a material impact on the consolidated financial statements. Other new standards, amendments and interpretations adopted, that have not had a material impact on the amounts reported in these financial statements but may impact the accounting for future transactions and arrangements, were:
Effective date
IAS 1: Disclosure Initiative 1 January 2016Annual Improvements to IFRS 2012-2014 1 January 2016IFRS 11: Accounting for Acquisitions of Interests in Joint Operations 1 January 2016
New accounting standards, amendments and interpretations not yet adopted A number of new standards, amendments and interpretations, which have not been applied in preparing these financial statements, have been issued and are effective for annual reports beginning after 1 February 2016:
Effective date
IAS 12: Recognition of Deferred Tax Assets for Unrealised Losses 1 January 2017IAS 7: Disclosure Initiative 1 January 2017IFRS 15: Revenue from Contracts with Customers 1 January 2018IFRS 9: Financial Instruments 1 January 2018IFRS 2: Classification and Measurement of Share Based Payment Transactions – Amendments to IFRS 2 1 January 2018IFRS 16: Leases 1 January 2019
The Group has carried out an impact assessment to determine the impact of adopting IFRS 15. Based on this assessment, management has concluded that there will be no material impact on revenue from adopting this standard.
The Group is currently assessing whether the other standards above will have a material impact on the financial statements for the year ended 31 January 2018.
36 Events after the reporting period
On 20 March 2017, the Group commenced a consultation process with members of the UK defined benefit pension scheme affected by proposed changes to the scheme. See further details in note 25. These changes, if implemented, will be taken into account in the 2018 financial year.

122 AA plc Annual Report and Accounts 2017
Company statement of financial position as at 31 January
Notes2017
£m2016
£m
Non-current assetsInvestment in subsidiaries 2 818 806Investments in joint ventures 3 4 4
822 810Current assetsTrade and other receivables 4 17 14Cash at bank and in hand 5 60 59
77 73Total assets 899 883
Current liabilities Trade and other payables 6 (8) (9)
Non-current liabilitiesOther payables 7 (1) (1)Total liabilities (9) (10)
Net assets 890 873
EquityCalled up share capital 8 1 1Share premium 403 399Own shares (26) (22)Retained earnings 512 495Total equity attributable to equity holders of the parent 890 873
The profit for the financial year of the Company is £60m (2016: £51m).
As at 31 January 2017, the Company had distributable reserves of £512m (2016: £495m).
Signed for and on behalf of the Board on 27 March 2017 by:
Bob Mackenzie Martin ClarkeExecutive Chairman Chief Financial Officer
The accompanying notes are an integral part of this company statement of financial position.

Our B
usinessG
overnanceFinancial Statem
ents
AA plc Annual Report and Accounts 2017 123
Our Perform
ance
Company statement of changes in equity as at 31 January
Share capital
£m
Share premium
£m
Own shares
£m
Retained earnings
£mTotal
£m
At 1 February 2015 1 200 – 458 659Profit for the year – – – 51 51Dividends – – – (21) (21)Issue of share capital – 199 – – 199Purchase of own shares – – (22) – (22)Share-based payments – – – 7 7At 31 January 2016 1 399 (22) 495 873Profit for the year – – – 60 60Dividends – – – (55) (55)Issue of share capital – 4 – – 4Purchase of own shares – – (4) – (4)Share-based payments – – – 12 12At 31 January 2017 1 403 (26) 512 890
The accompanying notes are an integral part of this company statement of changes in equity.

124 AA plc Annual Report and Accounts 2017
1 Authorisation of financial statements and Company accounting policies
1.1 Authorisation of financial statements The parent company financial statements of AA plc (the “Company”) for the year ended 31 January 2017 were authorised for issue by the Board of Directors on 27 March 2017 and the balance sheet was signed on the Board’s behalf by Bob Mackenzie and Martin Clarke. AA plc is a public limited company incorporated and domiciled in England and Wales. The Company’s ordinary shares are traded on the London Stock Exchange.
These financial statements were prepared in accordance with Financial Reporting Standard 101 Reduced Disclosure Framework (FRS101). The financial statements are prepared under the historical cost convention and on a going concern basis.
No profit and loss account is presented by the Company as permitted by Section 408 of the Companies Act 2006.
The accounting policies which follow set out those policies which apply in preparing the financial statements for the year ended 31 January 2017. The financial statements are prepared in sterling and are rounded to the nearest million pounds (£m).
1.2 Basis of preparationThe Company has taken advantage of the following disclosure exemptions under FRS 101:
IAS 1 paragraph 10(d) (statement of cash flows),
IAS 1 paragraph 16 (statement of compliance with all IFRS),
IAS 1 paragraph 38A (requirement for minimum of two primary statements, including cash flow statements),
IAS 1 paragraph 111 (cash flow statement information),
IAS 1 paragraphs 134-136 (capital management disclosures),
IFRS 1 paragraphs 6 and 21,
Paragraphs 45(b) and 46 to 52 of IFRS 2, ‘Share-based payment’,
IAS 7: ‘Statement of cash flows’,
IAS 8 paragraphs 30 and 31,
The requirements in IAS 24, ‘Related party disclosures’ to disclose related party transactions entered into between two or more members of a group.
1.3 Accounting policiesa) Foreign currencies Transactions in foreign currencies are recorded at the rate ruling at the date of the transaction or at the contracted rate if the transaction is covered by a forward foreign currency contract. Monetary assets and liabilities denominated in foreign currencies are retranslated at the rate of exchange ruling at the balance sheet date or if appropriate at the forward contract rate. All differences are taken to the profit and loss account.
b) Investments in subsidiaries and joint venturesFixed asset investments are included in the balance sheet at cost, less any provisions for permanent impairment.
Investments in subsidiaries and joint ventures are stated at the lower of cost and net realisable value.
The carrying amounts of the Company’s assets are reviewed for impairment when events or changes in circumstances indicate that the carrying amount of the fixed asset may not be recoverable. If any such indication exists, the asset’s recoverable amount is estimated. An impairment loss is recognised whenever the carrying amount of an asset or its income-generating unit exceeds its recoverable amount. Impairment losses are recognised in the profit and loss account unless it arises on a previously revalued fixed asset.
The recoverable amount of fixed assets is the greater of their net realisable value and value in use. In assessing value in use, the expected future cash flows are discounted to their present value using a pre-tax discount rate that reflects current market assessments of the rate of return expected on an investment of equal risk. For an asset that does not generate largely independent income streams, the recoverable amount is determined for the income-generating unit to which the asset belongs.
Joint ventures are joint arrangements whereby the parties that have joint control of the arrangement have rights to the net assets of the arrangement.
c) Critical accounting estimates and judgements Estimates are evaluated continually and are based on historical experience and other factors, including expectations of future events that are believed to be reasonable under the circumstances. The Group makes estimates and assumptions about the future. The resulting accounting estimates will, by definition, seldom equal the related actual results. The principal estimates and assumptions that have a risk of causing an adjustment to the carrying amounts of assets and liabilities within the next financial period are discussed below.
Management has exercised judgement in applying the Group’s accounting policies and in making critical estimates. The underlying assumptions on which these judgements are based, are reviewed on an ongoing basis and include the assumptions for future growth of cash flows to support the value-in-use calculations for the investment impairment review.
InvestmentsThe Group tests the investment balances for impairment annually. The recoverable amounts of the investments have been determined based on value-in-use calculations which require the use of estimates. Management has prepared discounted cash flows based on the latest strategic plan.
Notes to the Company financial statements

Our B
usinessG
overnanceFinancial Statem
ents
AA plc Annual Report and Accounts 2017 125
Our Perform
ance
2 Investments in subsidiaries 2017
£m2016
£m
At 1 February 806 799Charge for the share incentive schemes 12 7At 31 January 818 806
In the year ended 31 January 2017, there was an increase in investment in subsidiaries of £12m (2016: £7m) relating to the fair value of share-based payments granted. Details are provided in note 34 of the Group financial statements.
No indicators of impairment in the value of subsidiaries have been identified.
3 Investments in joint ventures 2017
£m2016
£m
At 1 February 4 –Additions – 4At 31 January 4 4
On 29 June 2015, the Company invested £4m in a 49% share of a joint venture with TVS Automobile Solutions, one of the largest players in the Indian automotive market.
4 Trade and other receivables2017
£m2016
£m
Trade receivables from subsidiary undertakings 17 13Group relief receivable – 1
17 14
Amounts owed by subsidiary undertakings are unsecured, have no repayment terms and bear no interest.
5 Cash2017
£m2016
£m
Cash 60 5960 59
6 Trade and other payables2017
£m2016
£m
Amounts owed to subsidiary undertakings 8 8Accruals – 1
8 9
Amounts owed to subsidiary undertakings are unsecured, have no repayment terms and bear no interest.

126 AA plc Annual Report and Accounts 2017
Notes to the Company financial statements continued
7 Other payables2017
£m2016
£m
Other payables 1 1
All amounts are due within five years.
8 Share capital2017
£m2016
£m
Allotted, called up and fully paid609,461,827 (2016: 608,181,845) ordinary shares of £0.001 each 1 1
1 1
The voting rights of the holders of all ordinary shares are the same and all ordinary shares rank pari passu on a winding up. AA plc has no authorised ordinary share capital.
The movement in the number of shares in the current year is in relation to the matching shares for the staff share incentive plans (see Group financial statements – note 34 for further information on these shares).
The Company has 60 million MVP shares in issue (see Group financial statements – note 34 for further information on these shares).
9 Subsidiary undertakings
All subsidiaries are wholly owned and incorporated and registered where stated below.
All subsidiaries are consolidated in the group financial statements.
The principal subsidiary undertakings of the Company at 31 January 2017 are:Name Country
AA Acquisition Co Limited² United KingdomAA Bond Co Limited³ JerseyAA Corporation Limited² United KingdomAA Financial Services Limited² United KingdomAA Intermediate Co Limited² United KingdomAA Media Limited² United KingdomAA Mid Co Limited1, 2 United KingdomAA Reinsurance Company Limited1,4 GuernseyAA Senior Co Limited² United KingdomAA The Driving School Agency Limited² United KingdomAA Underwriting Insurance Company Limited⁵ GibraltarAutomobile Association Developments Limited² United KingdomAutomobile Association Insurance Services Limited² United KingdomDrivetech (UK) Limited² United KingdomIntelligent Data Systems (UK) Limited² United KingdomVVCR Europe B.V.1, 6 Netherlands
1 Directly owned by AA plc, all other subsidiaries are indirectly held
2 Company registered office: Fanum House, Basing View, Basingstoke, Hampshire, RG21 4EA, England
3 Company registered office: 22 Greenville Street, St Helier, JE4 8PX, Jersey
4 Company registered office: Heritage Hall, Le Marchant Street, St Peter Port, GY1 4JH, Guernsey
5 Company registered office: First Floor, Grand Ocean Plaza, Ocean Village, Gibraltar
6 Company registered office: Markeloseweg 94, 7461 PB, 175, 7460AD, Rijssen, Nijverdal, Netherlands

Our B
usinessG
overnanceFinancial Statem
ents
AA plc Annual Report and Accounts 2017 127
Our Perform
ance
9 Subsidiary undertakings (continued)
The other subsidiary undertakings of the Company at 31 January 2017 are: Name Country
A.A. Pensions Trustees Limited² United KingdomAA Assistance Limited² United KingdomAA Brand Management Limited² United KingdomAA Insurance Holdings Limited1,2 United KingdomAA Ireland Pension Trustees Limited³ IrelandAA Pension Funding GP Limited⁴ United KingdomAA Pension Funding LP⁴ United KingdomAA PIK Co Limited1,5 JerseyAA Road Services Limited² United KingdomAA Technical Solutions Limited² United KingdomAA Underwriting Limited² United KingdomAutomobile Association Holdings Limited² United KingdomAutomobile Association Insurance Services Holdings Limited² United KingdomAutomobile Association Protection and Investment Planning Limited² United KingdomAutomobile Association Services Limited² United KingdomAutomobile Association Travel Services Limited² United KingdomAutomobile Association Underwriting Services Limited² United KingdomBreakdown Assistance Services Limited⁶ United KingdomBreakdown Hero Limited⁶ United KingdomDrakefield Group Limited² United KingdomDrakefield Holdings Limited² United KingdomDrakefield Insurance Services Limited² United KingdomDrakefield Services Limited² United KingdomLongacre Claims Limited² United KingdomNationwide 4 X 4 Ltd² United KingdomPeak Performance Management Limited² United KingdomPersonal Insurance Mortgages and Savings Limited² United KingdomThe Automobile Association Limited⁵ JerseyVVCR Europe Beroepsopleidingen B.V.⁷ NetherlandsVVCR Europe Holding B.V.⁷ Netherlands
1 Directly owned by AA plc, all other subsidiaries are indirectly held
2 Company registered office: Fanum House, Basing View, Basingstoke, Hampshire, RG21 4EA, England
3 Company registered office: 61a South William Street, Dublin 2, Ireland
4 Company registered office: 50 Lothian Road, Festival Square, Edinburgh, EH3 9WJ, Scotland
5 Company registered office: 22 Greenville Street, St Helier, JE4 8PX, Jersey
6 Company registered office: 90 Long Acre, London, WC2E 9RA, England
7 Company registered office: Markeloseweg 94, 7461 PB, 175, 7460AD, Rijssen, Nijverdal, Netherlands
10 Auditor’s remuneration
The fee for the audit of these financial statements was £0.2m (2016: £0.2m).
11 Staff costs
The Company had no employees or employee staff costs in the current or prior year. However, the Company has incurred costs in respect of the Non-Executive Directors of £1m (2016: £1m).

128 AA plc Annual Report and Accounts 2017
AA plc
Company number: 5149111
Registered office
Fanum House Basing View Basingstoke Hampshire RG21 4EA
Telephone: 0370 544 8866
Share price information
The Company’s ordinary shares are listed on the London Stock Exchange. Share price information can be found on the website www.theaaplc.com
ISIN Number: GB00BMSKPJ95
SEDOL Number: BMSKRPJ9
Advisors
Corporate BrokersCenkos Securities, 6.7.8 Tokenhouse Yard, London EC2R 7AS Liberum Capital, Ropemaker Place, Level 12, 25 Ropemaker Street, London, EC2Y 9LY Morgan Stanley & Co, 20 Bank Street, Canary Wharf, London E14 4AD
SolicitorsFreshfields Bruckhaus Deringer LLP, 65 Fleet Street, London EC4Y 1HS Proskauer Rose (UK) LLP, 110 Bishopsgate, London EC2N 4AY
AuditorsErnst & Young LLP, 1 More London Place, London SE1 2AF
RegistrarCapita Asset Services, 40 Dukes Place, London EC3A 7NH Telephone: 0871 664 0300 (calls cost 10p per minute plus network extras) Lines are open Monday – Friday, 9.00am – 5.30pm (from outside the UK: +44 (0) 208 639 3399).
Please note that from 19 June 2017 Equiniti Limited will replace Capita Asset Services as Registrar to AA plc. Your existing share certificate(s) will remain valid and do not need to be replaced.
The contact details for Equiniti are as follows:
By post: Equiniti Limited, Aspect House, Spencer Road, Lancing, West Sussex BN99 6DA.
By telephone: 0333 207 6538 (from outside the UK: +44 121 415 0999). Lines are open 8.30am to 5.30pm, Monday to Friday.
Online: www.shareview.co.uk.
Financial public relationsHeadland Consultancy, Eldon House, 2-3 Eldon Street, London EC2M 7LS
Financial CalendarThe Company’s Annual General Meeting will be held on 8 June 2017 at Freshfields Bruckhaus Deringer LLP, 65 Fleet Street, London EC4Y 1HS.
Warning to ShareholdersShare fraud includes scams where investors are called and offered shares that often turn out to be worthless or non-existent, or an inflated price for shares that they own. These calls often require you to make a quick decision and come from fraudsters operating in ‘boiler rooms’ that are often based abroad. High pressure sales tactics can also come by email, post, word of mouth or at a seminar. Scams are also advertised in newspapers, magazines or online and appear as if they are genuine investment opportunities.
In addition, be aware of money recovery scams which can be initiated by someone claiming to be from the police or a government agency. Organisations’ names vary but can include the National Fraud Intelligence Bureau and the US Securities & Exchange Commission. You should check the latest information on the Financial Conduct Authority (FCA) website at www.fca.org.uk/consumers/scams/what-to-do-if-you-are-scammed for more details of scams pretending to be the police or a government agency.
The FCA found that even experienced investors have been caught out by share fraud and on average, around £200 million is lost in the UK each year.
If you are offered unsolicited investment advice, discounted shares, a premium price for shares you own, or free company or research reports, you should take these steps before handing over any money:
1. Get the name of the person and organisation contacting you
2. Check the Financial Services Register (FSR) at www.fca.org.uk/firms/systems-reporting/register to ensure they are authorised
3. Use the details on the FSR to contact the firm
4. If you are based in the UK, call the FCA Consumer Helpline on 0800 111 6768 if there is no telephone number on the FSR or you are told it is out of date
5. Search the FCA’s list of known unauthorised firms and individuals to avoid doing business with
6. Remember that law enforcement and other agencies will not contact members of the public asking for their bank details or money
7. Remember: if it sounds too good to be true, it probably is
If you use an unauthorised firm to buy or sell shares or other investments, you will not have access to the Financial Ombudsman Service or Financial Services Compensation Scheme (FSCS) if things go wrong. If you are approached about a share scam you should tell the FCA using the share fraud reporting form at www.fca.org.uk/consumers/scams, where you can find out about the latest investment scams. If you are based in the UK, you can also call the FCA Consumer Helpline on 0800 111 6768. If you have already paid money to share fraudsters you should contact Action Fraud online at www.actionfraud.police.uk or, if you are based in the UK, by telephone on 0300 123 2040.
Shareholder queries and information
Financial information about the company including the annual report, regulatory announcements and corporate governance information is available on our website: www.theaaplc.com
Alternatively please contact us at [email protected]
Shareholder information

Designed and produced by Friend. www.friendstudio.com Print: Pureprint Group
This report has been printed on Claro Bulk which is FSC® certified and made from 100% Elemental Chlorine Free (ECF) pulp. The mill and the printer are both certified to ISO 14001 environmental management system and registered to EMAS the eco management Audit Scheme. The report was printed using vegetable based inks by a CarbonNeutral® printer.

AA plc A
nnual Report and A
ccounts 2017