Embed Size (px)
Citation preview
For Use at Unconstrained Fixed Income Summit Only. Not for Further Distribution.For Use at Unconstrained Fixed Income Summit Only. Not for Further Distribution.
Building a Resilient Fixed Income Portfolio
for all Stages of the Economic Cycle
For Use at Unconstrained Fixed Income Summit Only. Not for Further Distribution.
Matthew J. Eagan, CFA, Vice President and Portfolio Manager, Fixed Income, Loomis, Sayles & Company
Kevin P. Kearns, Vice President, Portfolio Manager & Senior Derivatives Strategist, Absolute Return and Credit, Loomis, Sayles &
Company
For Use at Unconstrained Fixed Income Summit Only. Not for Further Distribution.
2
Survey Question 1
What is the role of unconstrained fixed income in
a portfolio?
1. To outperform in a rising rate environment
2. To protect capital in a downturn
3. To provide attractive, uncorrelated return
For Use at Unconstrained Fixed Income Summit Only. Not for Further Distribution.
3
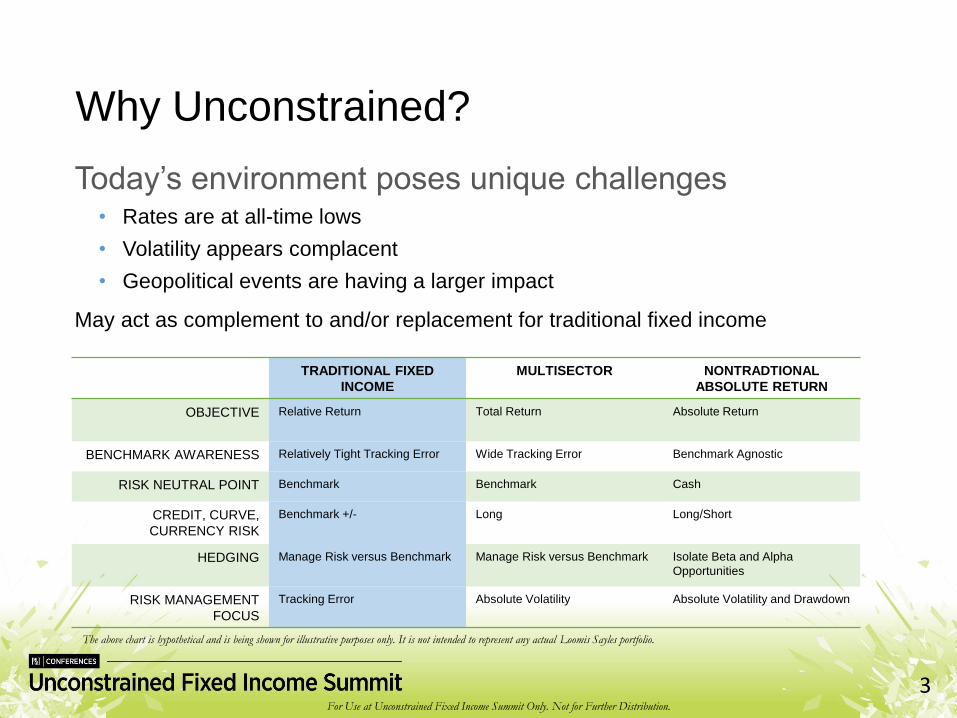
Why Unconstrained?
Today’s environment poses unique challenges • Rates are at all-time lows
• Volatility appears complacent
• Geopolitical events are having a larger impact
May act as complement to and/or replacement for traditional fixed income
TRADITIONAL FIXED
INCOME
MULTISECTOR NONTRADTIONAL
ABSOLUTE RETURN
OBJECTIVE Relative Return Total Return Absolute Return
BENCHMARK AWARENESS Relatively Tight Tracking Error Wide Tracking Error Benchmark Agnostic
RISK NEUTRAL POINT Benchmark Benchmark Cash
CREDIT, CURVE,
CURRENCY RISK
Benchmark +/- Long Long/Short
HEDGING Manage Risk versus Benchmark Manage Risk versus Benchmark Isolate Beta and Alpha
Opportunities
RISK MANAGEMENT
FOCUS
Tracking Error Absolute Volatility Absolute Volatility and Drawdown
The above chart is hypothetical and is being shown for illustrative purposes only. It is not intended to represent any actual Loomis Sayles portfolio.
For Use at Unconstrained Fixed Income Summit Only. Not for Further Distribution.
4
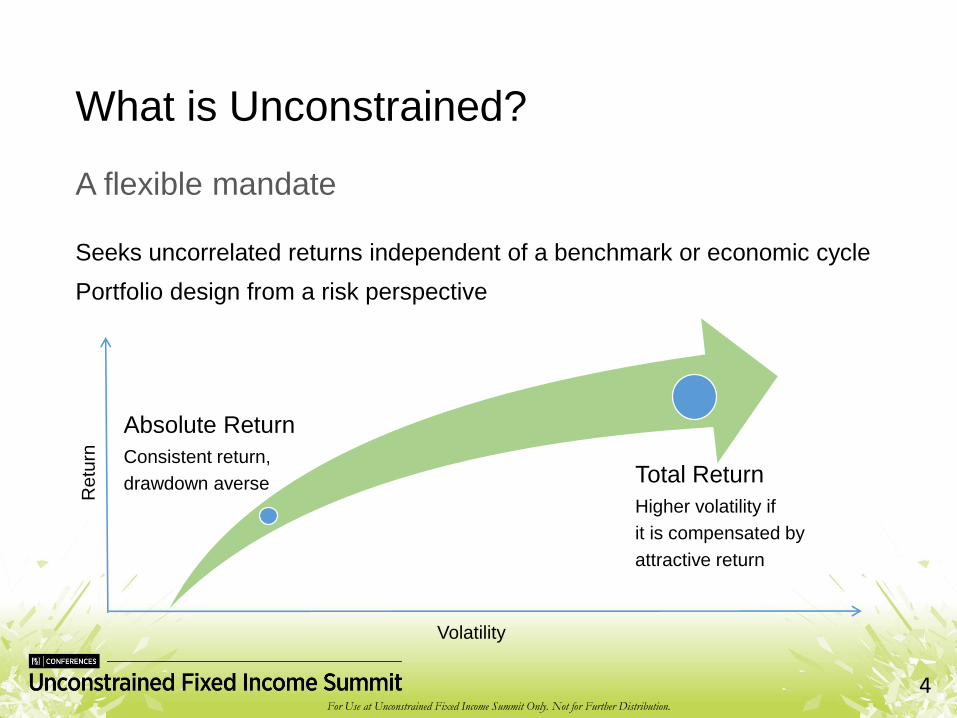
What is Unconstrained?
A flexible mandate
Seeks uncorrelated returns independent of a benchmark or economic cycle
Portfolio design from a risk perspective
Absolute Return
Consistent return,
drawdown averse Total Return
Higher volatility if
it is compensated by
attractive return
Re
turn
Volatility
For Use at Unconstrained Fixed Income Summit Only. Not for Further Distribution.
5
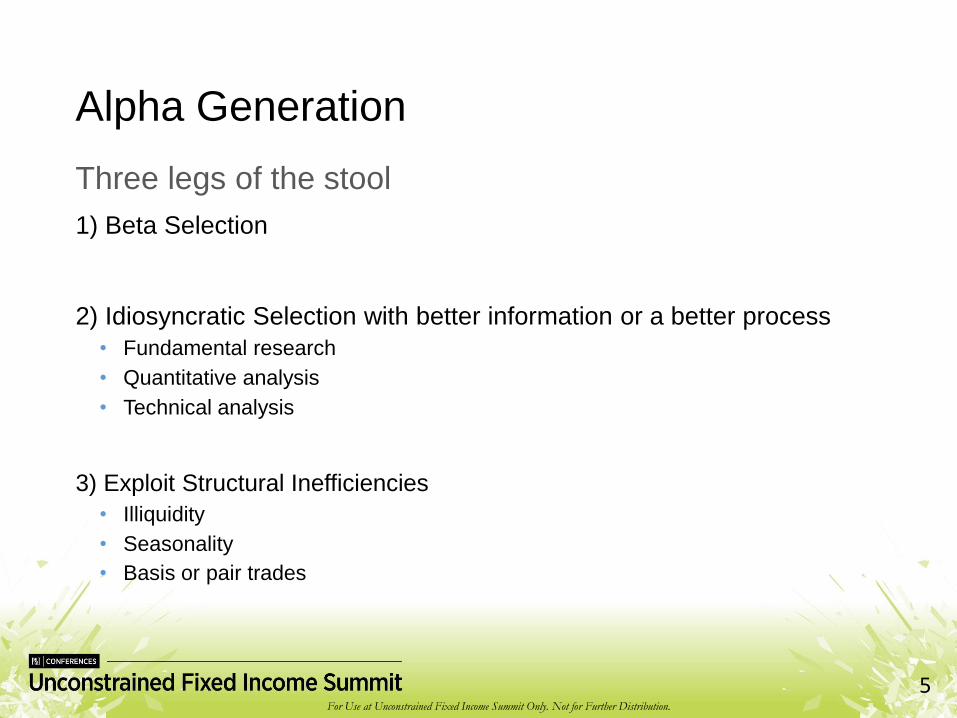
Alpha Generation
Three legs of the stool
1) Beta Selection
2) Idiosyncratic Selection with better information or a better process
• Fundamental research
• Quantitative analysis
• Technical analysis
3) Exploit Structural Inefficiencies
• Illiquidity
• Seasonality
• Basis or pair trades
For Use at Unconstrained Fixed Income Summit Only. Not for Further Distribution.
6
Survey Question 2
What stage of the economic cycle are we currently in?
1. Downturn
2. Credit Repair
3. Recovery
4. Expansion / Late Cycle
For Use at Unconstrained Fixed Income Summit Only. Not for Further Distribution.
7
Under Weight
OverWeight
Stocks
Bonds
Cash
FX
Credit
Under Weight
OverWeight
Stocks
Bonds
Cash
FX
Credit
Under Weight
OverWeight
Stocks
Bonds
Cash
FX
Credit
Under Weight
OverWeight
Stocks
Bonds
Cash
FX
Credit
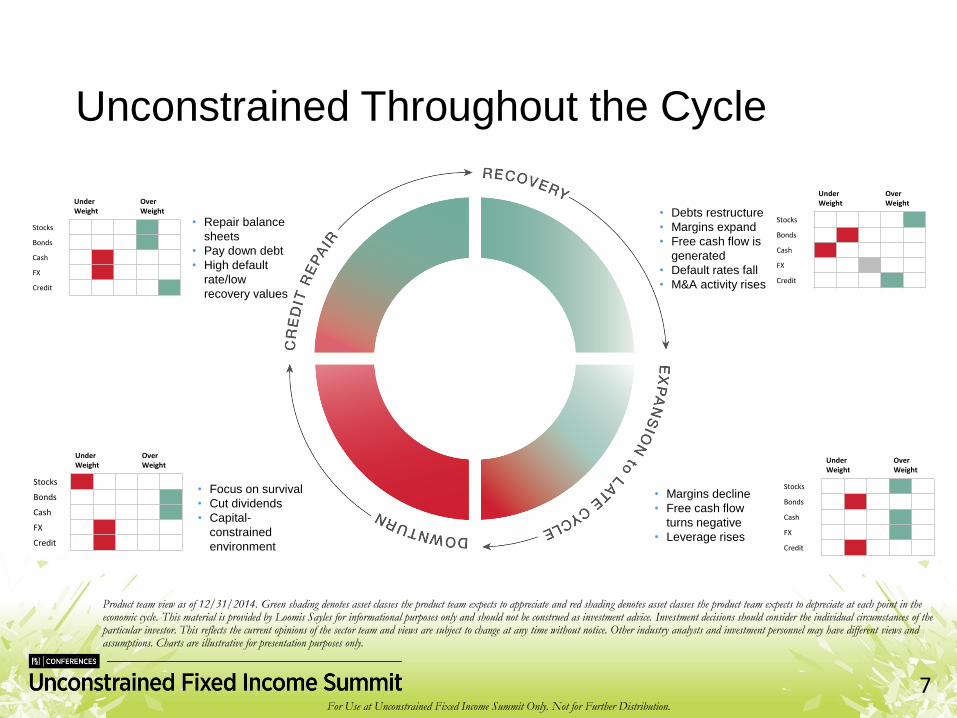
Product team view as of 12/31/2014. Green shading denotes asset classes the product team expects to appreciate and red shading denotes asset classes the product team expects to depreciate at each point in the economic cycle. This material is provided by Loomis Sayles for informational purposes only and should not be construed as investment advice. Investment decisions should consider the individual circumstances of the particular investor. This reflects the current opinions of the sector team and views are subject to change at any time without notice. Other industry analysts and investment personnel may have different views and assumptions. Charts are illustrative for presentation purposes only.
Unconstrained Throughout the Cycle
• Margins decline
• Free cash flow
turns negative
• Leverage rises
• Focus on survival
• Cut dividends
• Capital-
constrained
environment
• Repair balance
sheets
• Pay down debt
• High default
rate/low
recovery values
• Debts restructure
• Margins expand
• Free cash flow is
generated
• Default rates fall
• M&A activity rises
For Use at Unconstrained Fixed Income Summit Only. Not for Further Distribution.
8
-15%
-5%
5%
15%
25%
2006 2013 2014
-15%
-5%
5%
15%
25%
2004-2005 2010 2011 2012
-30%
-10%
10%
30%
50%
Oct 2002 - Dec 2003 2009
-30%
-10%
10%
30%
50%
June 2001 - Sep2002
2007 2008
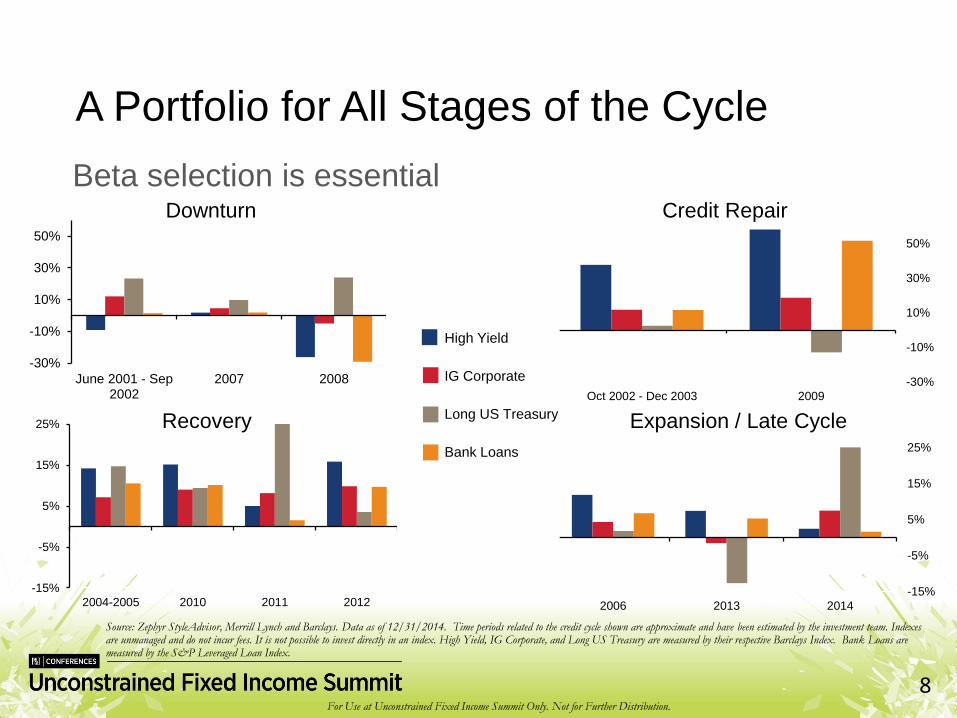
Beta selection is essential
A Portfolio for All Stages of the Cycle
Source: Zephyr StyleAdvisor, Merrill Lynch and Barclays. Data as of 12/31/2014. Time periods related to the credit cycle shown are approximate and have been estimated by the investment team. Indexes are unmanaged and do not incur fees. It is not possible to invest directly in an index. High Yield, IG Corporate, and Long US Treasury are measured by their respective Barclays Index. Bank Loans are measured by the S&P Leveraged Loan Index.
Downturn Credit Repair
Expansion / Late CycleRecovery
High Yield
IG Corporate
Long US Treasury
Bank Loans
For Use at Unconstrained Fixed Income Summit Only. Not for Further Distribution.
9
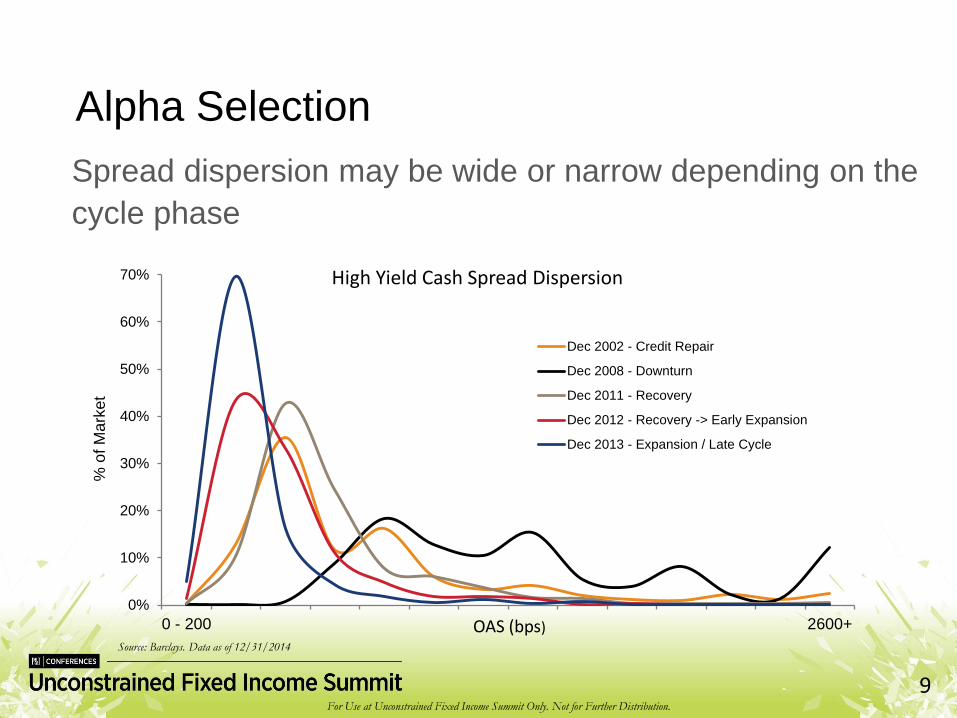
Alpha Selection
Spread dispersion may be wide or narrow depending on the
cycle phase
0%
10%
20%
30%
40%
50%
60%
70%
0 - 200 2600+
Dec 2002 - Credit Repair
Dec 2008 - Downturn
Dec 2011 - Recovery
Dec 2012 - Recovery -> Early Expansion
Dec 2013 - Expansion / Late Cycle
OAS (bps)
% o
f M
ark
et
High Yield Cash Spread Dispersion
Source: Barclays. Data as of 12/31/2014
For Use at Unconstrained Fixed Income Summit Only. Not for Further Distribution.
10
-0.80
-0.60
-0.40
-0.20
0.00
0.20
0.40
0.60
0.80
1.00
Dec-00 Dec-01 Dec-02 Dec-03 Dec-04 Dec-05 Dec-06 Dec-07 Dec-08 Dec-09 Dec-10 Dec-11 Dec-12 Dec-13 Dec-14
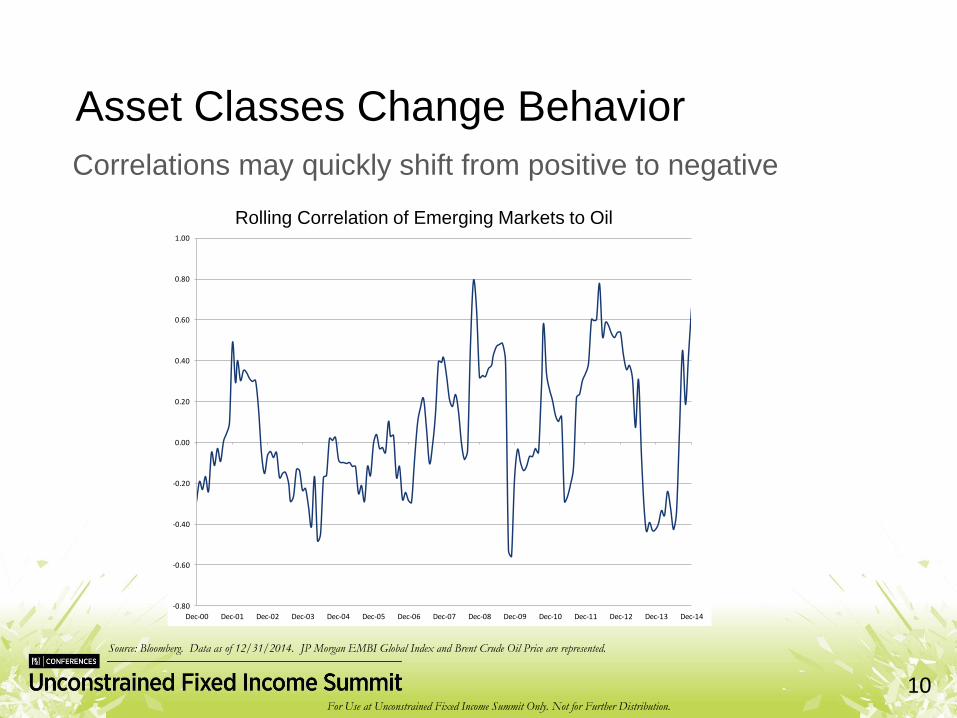
Asset Classes Change Behavior
Correlations may quickly shift from positive to negative
Source: Bloomberg. Data as of 12/31/2014. JP Morgan EMBI Global Index and Brent Crude Oil Price are represented.
Rolling Correlation of Emerging Markets to Oil
For Use at Unconstrained Fixed Income Summit Only. Not for Further Distribution.
11
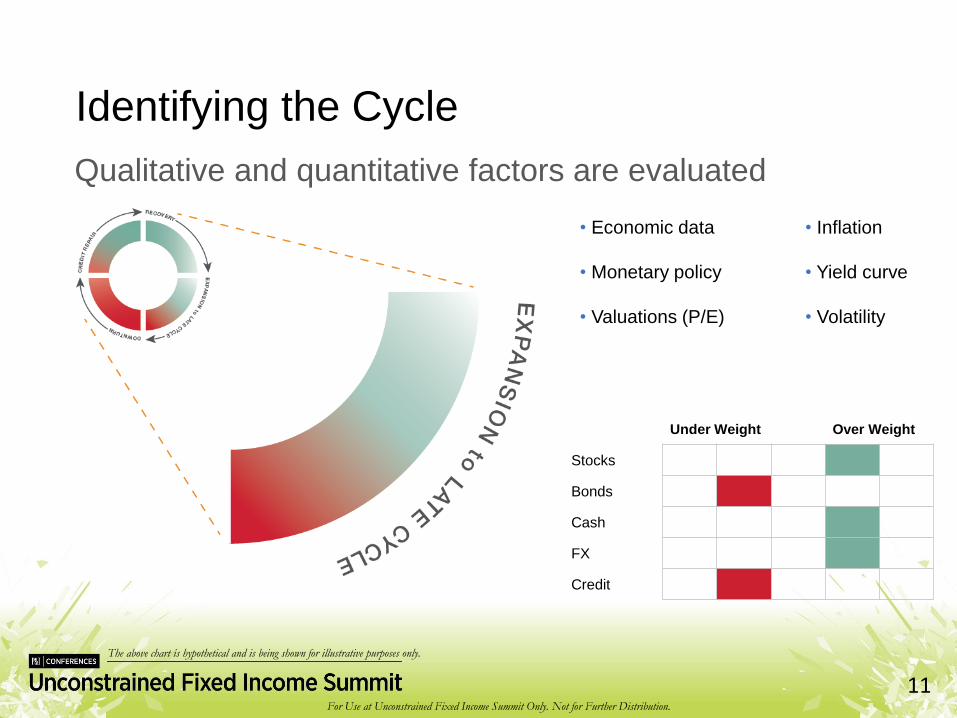
Identifying the Cycle
Qualitative and quantitative factors are evaluated
• Economic data
• Monetary policy
• Valuations (P/E)
• Inflation
• Yield curve
• Volatility
Under Weight Over Weight
Stocks
Bonds
Cash
FX
Credit
The above chart is hypothetical and is being shown for illustrative purposes only.

For Use at Unconstrained Fixed Income Summit Only. Not for Further Distribution.
12
Europe
High Yield
EMBI Global HY
ABS US Large Cap Value
Japan
US Small Cap
Europe IG
Bank Loans
US IG Corp
Convertibles
-10.0
-7.5
-5.0
-2.5
0.0
2.5
5.0
7.5
10.0
12.5
15.0
17.5
20.0
22.5
25.0
27.5
-26.0-24.0-22.0-20.0-18.0-16.0-14.0-12.0-10.0-8.0-6.0-4.0-2.00.02.04.06.0
Valuation tools help identify asset classes with favorable
asymmetric return/risk profiles
Acting on the Cycle
High Yield (491.88)
Targets CurrentInput Date
Downside: 600.00 -1.63 -1.08
Base: 385.00 8.90 9.45
Upside: 325.00 12.05 12.60
Attribution Score (Base/Down): 5.00 5.00
Team “Beta”: 1.00 0.90
Chart is illustrative for presentation purposes only as a sampling of risk management tool output. The information is not intended to represent any actual portfolio.
For Use at Unconstrained Fixed Income Summit Only. Not for Further Distribution.
13
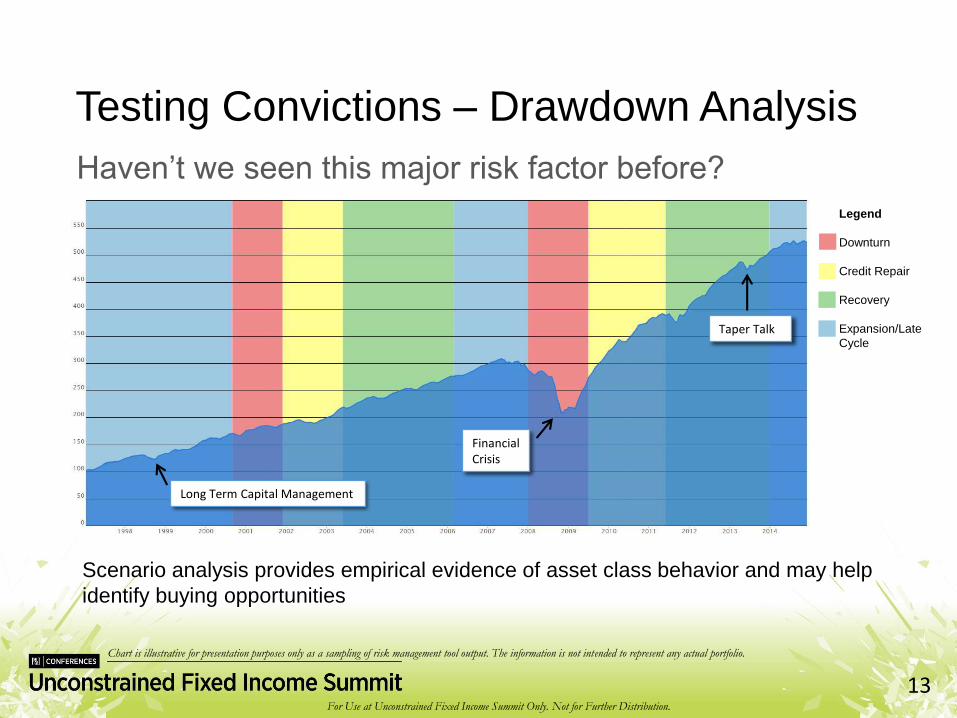
Testing Convictions – Drawdown Analysis
Haven’t we seen this major risk factor before?
Scenario analysis provides empirical evidence of asset class behavior and may help
identify buying opportunities
Long Term Capital Management
Financial Crisis
Taper Talk
Legend
Downturn
Credit Repair
Recovery
Expansion/Late
Cycle
Chart is illustrative for presentation purposes only as a sampling of risk management tool output. The information is not intended to represent any actual portfolio.
For Use at Unconstrained Fixed Income Summit Only. Not for Further Distribution.
14
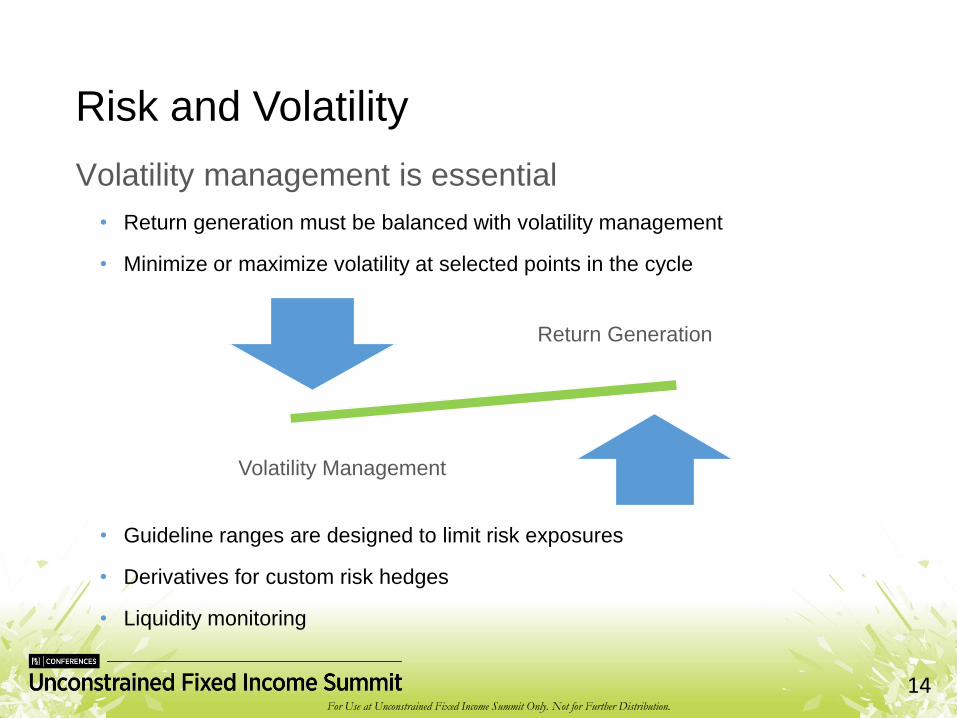
Risk and Volatility
Volatility management is essential
• Return generation must be balanced with volatility management
• Minimize or maximize volatility at selected points in the cycle
• Guideline ranges are designed to limit risk exposures
• Derivatives for custom risk hedges
• Liquidity monitoring
Return Generation
Volatility Management
For Use at Unconstrained Fixed Income Summit Only. Not for Further Distribution.
15
Survey Question 3
What are your risk and return expectations for an
unconstrained mandate?
1. Low volatility, consistent return
2. Moderate volatility, moderate return
3. Higher volatility, higher return
For Use at Unconstrained Fixed Income Summit Only. Not for Further Distribution.
16
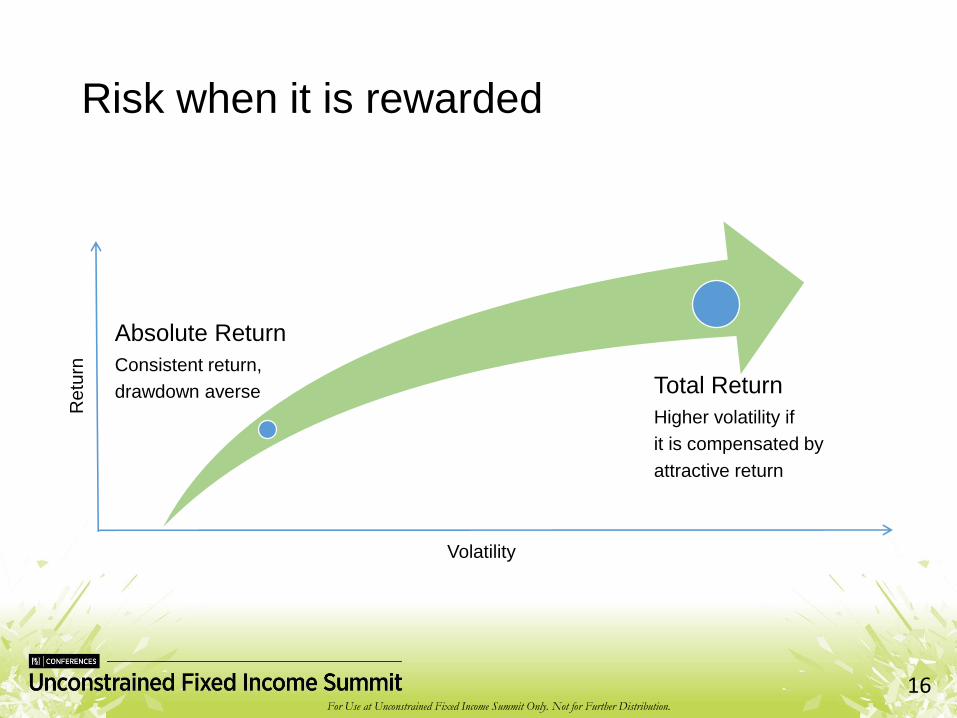
Risk when it is rewarded
Absolute Return
Consistent return,
drawdown averse Total Return
Higher volatility if
it is compensated by
attractive return
Re
turn
Volatility
For Use at Unconstrained Fixed Income Summit Only. Not for Further Distribution.
17
This material is provided for informational purposes only and should not be construed as investment advice. Investment decisions should consider the individual circumstances of the particular investor. Any opinions or forecasts contained herein reflect subjective judgments and assumptions of the author, and do not necessarily reflect the views of Loomis, Sayles & Company, L.P. or any portfolio manager. Investment recommendations may be inconsistent with these opinions. There can be no assurance that developments will transpire as forecasted and actual results will be different. Data and analysis does not represent the actual or expected future performance of any investment product. We believe the information, including that obtained from outside sources, to be correct, but we cannot guarantee its accuracy. Opinions reflect the views of the authors on the date made and are subject to change at any time without notice.