Embed Size (px)
Citation preview
1
Bronx Financial Services Survey Report
University Neighborhood Housing Program
University Neighborhood Housing Program (UNHP) works to create and preserve affordable housing
primarily in the Northwest Bronx, an area of severe rental burden, housing quality problems and a high rate of
foreclosure. UNHP provides direct services to local residents at our Northwest Bronx Resource Center where,
in collaboration with other non-profit groups, we provide free programs: financial coaching and workshops,
small business help, foreclosure prevention, income tax preparation and first-time Homebuyers Program.
2
Bronx Financial Services Survey Report
In 2012, UNHP released a Banking report, Creating a
Bronx Economy: Banking Options and Alternative
Solutions, in response to growing concerns about whether
banks were meeting the needs of neighborhood residents.
The report highlighted the fact that the Bronx still has one
of the lowest bank to population ratios in the nation,
combined with a high prevalence of high-cost fringe and
sub-prime financial services.
Based on the Bronx Financial Services Survey, this report
assesses the existing discrepancy between banking
products and the needs of low income Bronx residents.
The survey draws attention to the personal banking
experiences of Bronx residents and underscores the
financial practices and literacy of our respondents. The
survey and report together add to the literature on banking
in the Bronx through their qualitative and quantitative
insights. As a comprehensive evaluation of the financial
impediments faced by low income Bronx residents, the
report expands the conversation by highlighting the root
causes and conditions that hinder banking in the Bronx.
“I am conscious of the exploitation of pawn shops and if I had another alternative – a higher flow of income – I wouldn’t resort to them. But I work 55 hours a week as a home health aid to elderly people. They don’t pay me for late hours and what I make is not enough.”
–Anonymous Survey Respondent
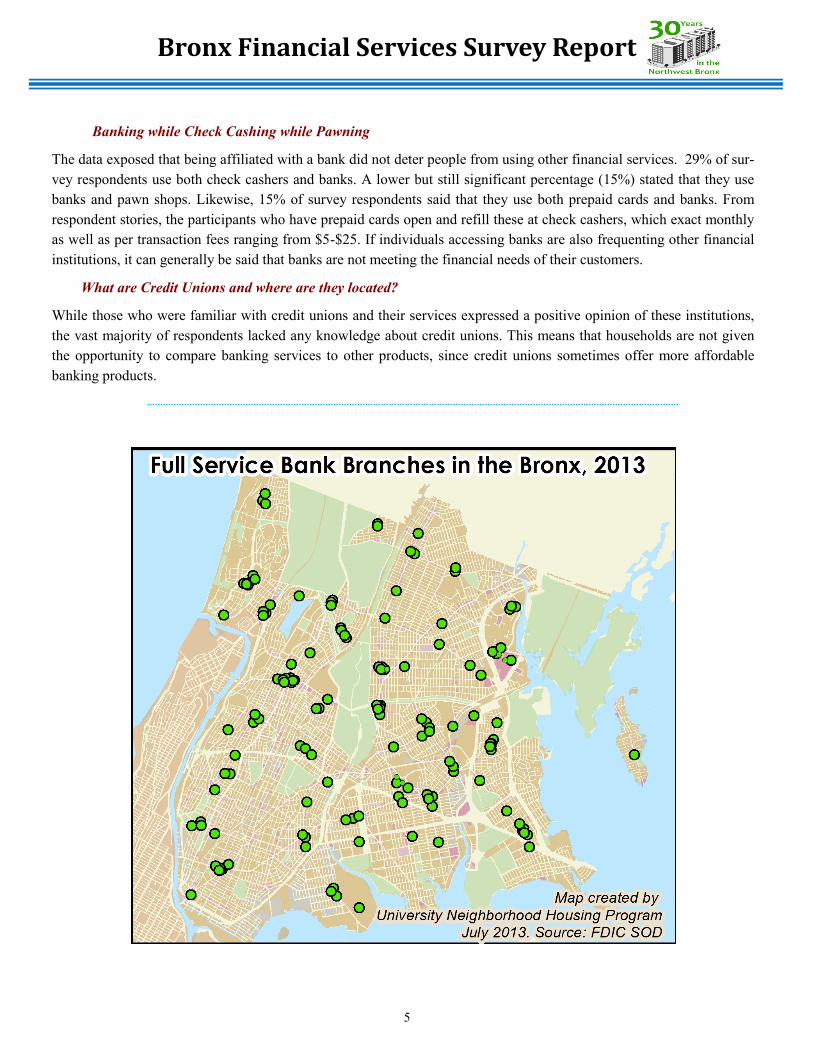
Methodology
The Bronx Financial Services Survey was conducted anonymously by trained
UNHP staff to ensure consistency and full completion. The survey was
administered in English and Spanish and focused on respondent experiences
using financial services, level of trust for financial institutions, as well as
financial practices and literacy. Nine locations were strategically selected to
conduct the surveys for different events and at different times in order to
access a diverse sampling of Bronx low earner residents who may rely on
fringe services.2 (See map at right)
The Bronx stands well above national and state-wide averages for unbanked and under-banked households. According to a 2010-2013 report released by the Office for Financial Empowerment of the New York City Department of Consumer Affairs, the percent of unbanked households in New York City is 13.4%, compared to 28.7% in the Bronx.1
Part I: Demographic Information
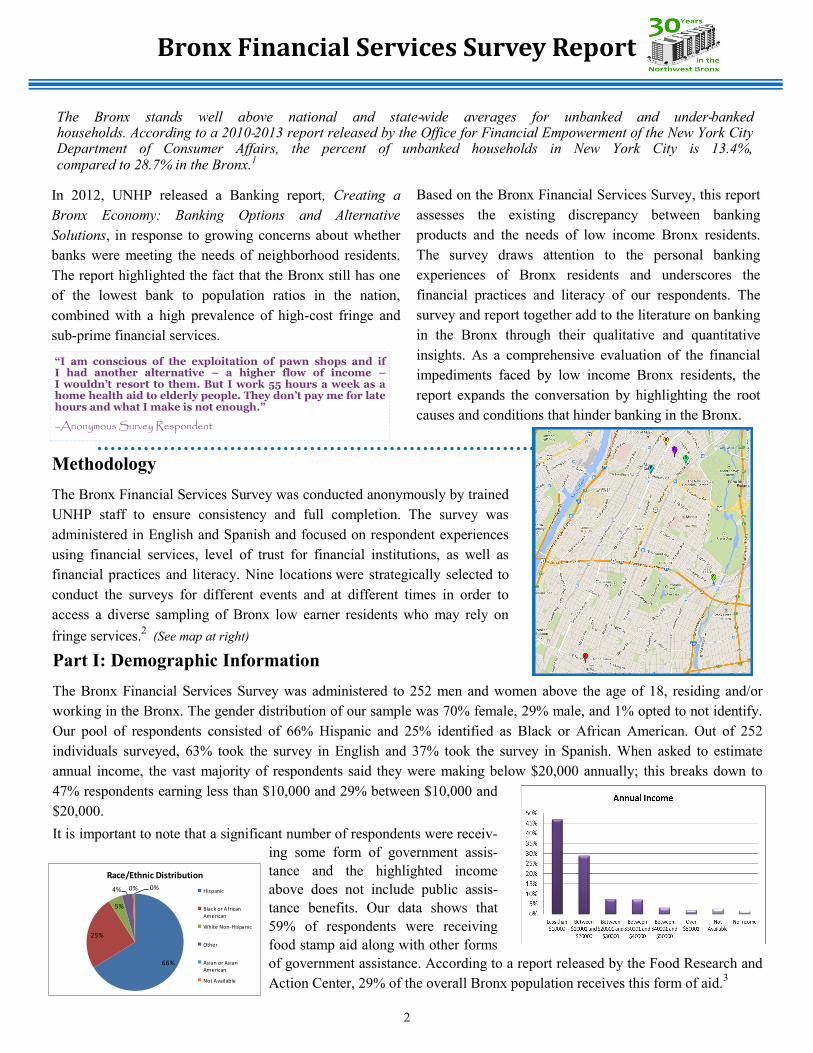
The Bronx Financial Services Survey was administered to 252 men and women above the age of 18, residing and/or
working in the Bronx. The gender distribution of our sample was 70% female, 29% male, and 1% opted to not identify.
Our pool of respondents consisted of 66% Hispanic and 25% identified as Black or African American. Out of 252
individuals surveyed, 63% took the survey in English and 37% took the survey in Spanish. When asked to estimate
annual income, the vast majority of respondents said they were making below $20,000 annually; this breaks down to
47% respondents earning less than $10,000 and 29% between $10,000 and
$20,000.
It is important to note that a significant number of respondents were receiv-
ing some form of government assis-
tance and the highlighted income
above does not include public assis-
tance benefits. Our data shows that
59% of respondents were receiving
food stamp aid along with other forms
of government assistance. According to a report released by the Food Research and
Action Center, 29% of the overall Bronx population receives this form of aid.3
66%
25%
5%
4% 0% 0%
Race/Ethnic Distribution
Hispanic
Black or AfricanAmerican
White Non-Hispanic
Other
Asian or AsianAmerican
Not Available
3
Bronx Financial Services Survey Report
Part II: Financial Practices and Literacy Findings
Low wages and a rising cost of living subject households to rely on exploitative services that offer them short term
solutions to immediate financial problems. With 47% of respondents making less than $10,000 annually, lack of in-
come serves as a major impediment to achieving financial stability. This has the potential of increasing the rate of peo-
ple who use pawn shops and other fringe borrowing alternatives.
When asked where they learned about how to maintain their
personal finances and where they sought financial help, 48% and 51% of
respondents respectively said they turned to family or friends. We realized
that respondents hesitated when answering this question.
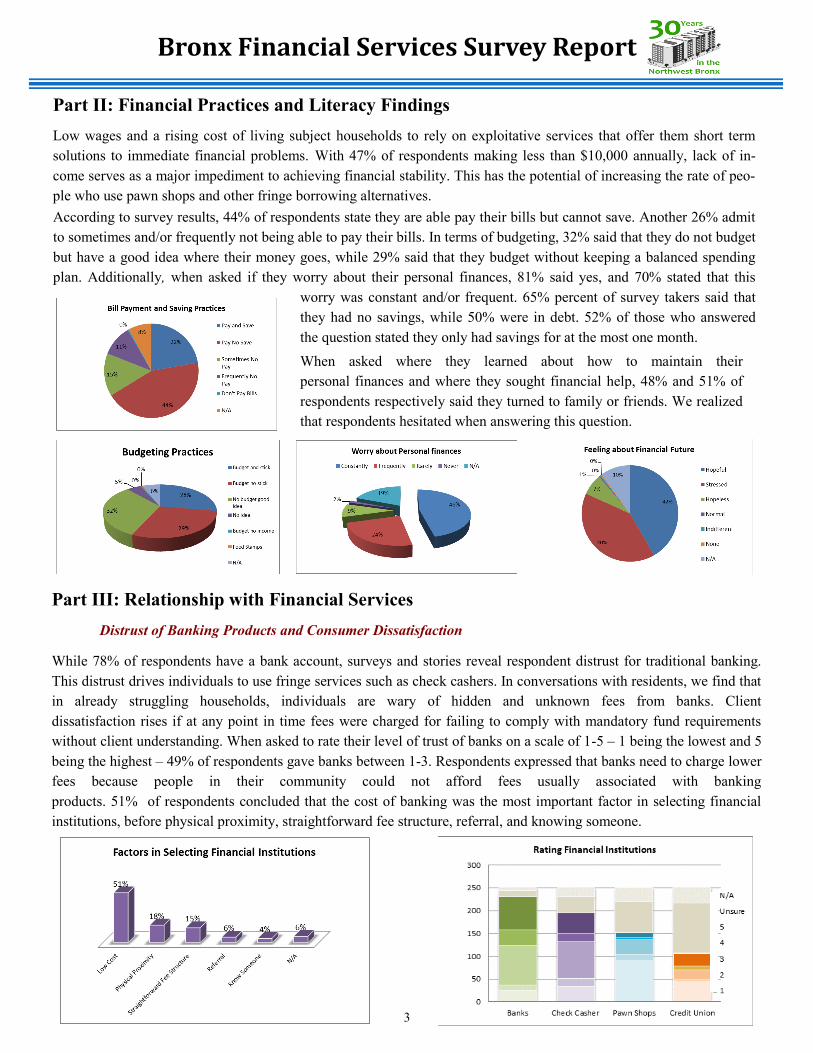
According to survey results, 44% of respondents state they are able pay their bills but cannot save. Another 26% admit
to sometimes and/or frequently not being able to pay their bills. In terms of budgeting, 32% said that they do not budget
but have a good idea where their money goes, while 29% said that they budget without keeping a balanced spending
plan. Additionally, when asked if they worry about their personal finances, 81% said yes, and 70% stated that this
worry was constant and/or frequent. 65% percent of survey takers said that
they had no savings, while 50% were in debt. 52% of those who answered
the question stated they only had savings for at the most one month.
Part III: Relationship with Financial Services
Distrust of Banking Products and Consumer Dissatisfaction
While 78% of respondents have a bank account, surveys and stories reveal respondent distrust for traditional banking.
This distrust drives individuals to use fringe services such as check cashers. In conversations with residents, we find that
in already struggling households, individuals are wary of hidden and unknown fees from banks. Client
dissatisfaction rises if at any point in time fees were charged for failing to comply with mandatory fund requirements
without client understanding. When asked to rate their level of trust of banks on a scale of 1-5 – 1 being the lowest and 5
being the highest – 49% of respondents gave banks between 1-3. Respondents expressed that banks need to charge lower
fees because people in their community could not afford fees usually associated with banking
products. 51% of respondents concluded that the cost of banking was the most important factor in selecting financial
institutions, before physical proximity, straightforward fee structure, referral, and knowing someone.
4
Bronx Financial Services Survey Report
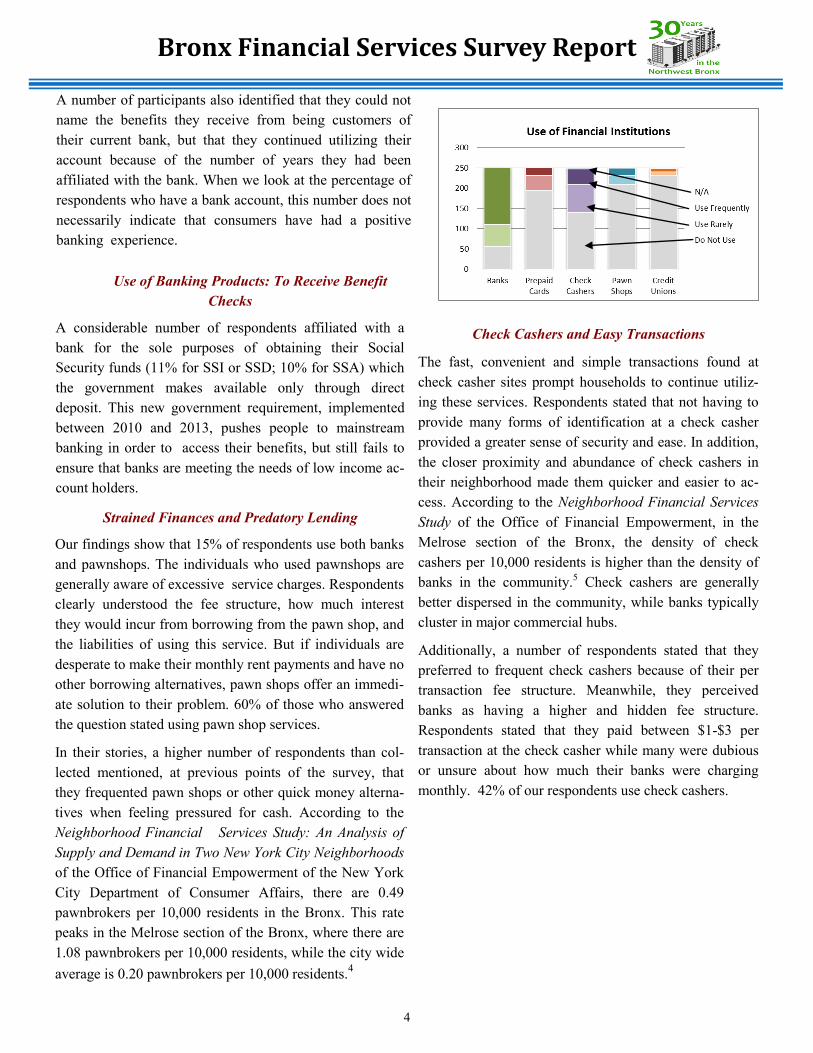
A number of participants also identified that they could not
name the benefits they receive from being customers of
their current bank, but that they continued utilizing their
account because of the number of years they had been
affiliated with the bank. When we look at the percentage of
respondents who have a bank account, this number does not
necessarily indicate that consumers have had a positive
banking experience.
Use of Banking Products: To Receive Benefit
Checks
A considerable number of respondents affiliated with a
bank for the sole purposes of obtaining their Social
Security funds (11% for SSI or SSD; 10% for SSA) which
the government makes available only through direct
deposit. This new government requirement, implemented
between 2010 and 2013, pushes people to mainstream
banking in order to access their benefits, but still fails to
ensure that banks are meeting the needs of low income ac-
count holders.
Strained Finances and Predatory Lending
Our findings show that 15% of respondents use both banks
and pawnshops. The individuals who used pawnshops are
generally aware of excessive service charges. Respondents
clearly understood the fee structure, how much interest
they would incur from borrowing from the pawn shop, and
the liabilities of using this service. But if individuals are
desperate to make their monthly rent payments and have no
other borrowing alternatives, pawn shops offer an immedi-
ate solution to their problem. 60% of those who answered
the question stated using pawn shop services.
In their stories, a higher number of respondents than col-
lected mentioned, at previous points of the survey, that
they frequented pawn shops or other quick money alterna-
tives when feeling pressured for cash. According to the
Neighborhood Financial Services Study: An Analysis of
Supply and Demand in Two New York City Neighborhoods
of the Office of Financial Empowerment of the New York
City Department of Consumer Affairs, there are 0.49
pawnbrokers per 10,000 residents in the Bronx. This rate
peaks in the Melrose section of the Bronx, where there are
1.08 pawnbrokers per 10,000 residents, while the city wide
average is 0.20 pawnbrokers per 10,000 residents.4
Check Cashers and Easy Transactions
The fast, convenient and simple transactions found at
check casher sites prompt households to continue utiliz-
ing these services. Respondents stated that not having to
provide many forms of identification at a check casher
provided a greater sense of security and ease. In addition,
the closer proximity and abundance of check cashers in
their neighborhood made them quicker and easier to ac-
cess. According to the Neighborhood Financial Services
Study of the Office of Financial Empowerment, in the
Melrose section of the Bronx, the density of check
cashers per 10,000 residents is higher than the density of
banks in the community.5 Check cashers are generally
better dispersed in the community, while banks typically
cluster in major commercial hubs.
Additionally, a number of respondents stated that they
preferred to frequent check cashers because of their per
transaction fee structure. Meanwhile, they perceived
banks as having a higher and hidden fee structure.
Respondents stated that they paid between $1-$3 per
transaction at the check casher while many were dubious
or unsure about how much their banks were charging
monthly. 42% of our respondents use check cashers.
5
Bronx Financial Services Survey Report
Banking while Check Cashing while Pawning
The data exposed that being affiliated with a bank did not deter people from using other financial services. 29% of sur-
vey respondents use both check cashers and banks. A lower but still significant percentage (15%) stated that they use
banks and pawn shops. Likewise, 15% of survey respondents said that they use both prepaid cards and banks. From
respondent stories, the participants who have prepaid cards open and refill these at check cashers, which exact monthly
as well as per transaction fees ranging from $5-$25. If individuals accessing banks are also frequenting other financial
institutions, it can generally be said that banks are not meeting the financial needs of their customers.
What are Credit Unions and where are they located?
While those who were familiar with credit unions and their services expressed a positive opinion of these institutions,
the vast majority of respondents lacked any knowledge about credit unions. This means that households are not given
the opportunity to compare banking services to other products, since credit unions sometimes offer more affordable
banking products.
6
Bronx Financial Services Survey Report
References
1. New York City Department of Consumer Affairs. "A Progress Report on the First Three Years, 2006-2009." NYC.gov.
http://www.nyc.gov/html/ofe/downloads/pdf/ofe_progress_report_dec2009.pdf (accessed November 5, 2013), 11.
2. The locations/programs where surveys were administered are: UNHP, (B) West Farms Square (C), Bronx Defenders (A),
Financial Education Workshop (F), Citizenship Classes (G), Part of the Solution (D), Bally Total Fitness (E), and LIFT. (D)
3. "County by county Review of SNAP/ Food Stamp Participation." frac.org. http://frac.org/wp-content/uploads/2010/07/
ny_times_snap_poverty_formatted.pdf (accessed November 5, 2013), 20.
4. New York City Department of Consumer Affairs. "Neighborhood Financial Services Study: An Analysis of Supply and
Demand of Two New York City Neighborhoods." NYC.gov. http://www.nyc.gov/html/ofe/downloads/pdf/NFS_Compiled.pdf
(accessed November 5, 2013), 23.
5. Density of Banks and Credit Unions in Melrose per 10,000 residents is 0.82
Density of Check Cashers in Melrose per 10,000 residents is 0.93
New York City Department of Consumer Affairs. "Neighborhood Financial Services Study: An
Analysis of Supply and Demand of Two New York City Neighborhoods." NYC.gov. http://www.nyc.gov/html/ofe/downloads/
pdf/NFS_Compiled.pdf (accessed November 5, 2013), 23.
Part IV: Recommendations
By offering free and very low cost banking products targeted to low income clients, banks can positively impact our
communities. To address distrust towards traditional banking among Bronx residents, banks must improve their
customer service and ensure that a transparent and open relationship is maintained between the bank and the client, since
even customers with a free bank account simply use banks to withdraw their monthly allocation. This entails clearly out-
lining banking services offered and implementing a more straightforward fee structure to enhance customer understand-
ing about services being offered.
Access to information must also play an integral part in tackling the barriers to banking in the Bronx. Nonprofit groups
and social services agencies should continue educating the community to ensure that individuals are practicing more
responsible banking. However, banks should also start thinking outside of standard models to expand convenience of
their services to low income residents. This could come in the form of partnerships with other financial institutions or by
developing new creative means of banking in the Bronx.
Without better paying jobs, however, individuals will continue to be pressured to turn to exploitative, quick cash ser-
vices. Even if individuals are informed about fringe services, inability to pay rent or necessary bills only exacerbate the
“crisis of affordability” of the Bronx, exemplified by the growing disparity between stagnating wages and increasing
rents.
To dismantle the legacy of redlining and community disinvestment, we must introduce more affordable and
transparent banking products, educate people on responsible banking through financial education workshops,
and bring better paying jobs to the Bronx.
For more information, read our 2012 report
on Banking in the Bronx!
http://www.unhp.org/pdf/BankingInTheBronx.pdf
Call us at : 718-933-2539