Embed Size (px)
Citation preview
Discussion Papers No. 572, December 2008 Statistics Norway, Research Department
Brita Bye, Taran Fæhn, and Leo A. Grünfeld
Growth policy in a small, open economy Domestic innovation and learning from abroad
Abstract: Research and development (R&D) play a pivotal role for innovation and productivity growth, and knowledge spillovers can make the case for public support to private R&D. In small and open economies, absorption of foreign knowledge through exports and imports can be even more decisive for economic growth than domestic innovation. This macro economic analysis investigates how policies should be formed in order to reap the largest productivity effects, when both these sources of growth interplay. In particular, the firms’ capacity to absorb knowledge from abroad depends on domestic R&D, and this reinforces the efficiency arguments for stimulating R&D. We find that from a welfare perspective, export promotion of R&D-based technologies proves slightly more efficient than R&D support.
Keywords: Absorptive capacity, Computable general equilibrium model, Endogenous growth, Research and Development, Spillovers, Two faces of R&D.
JEL classification: C68, E62, H32, O38, O41
Acknowledgement: Financial support from the Norwegian Research Council programme RENERGI is greatly acknowledged.
Address: Brita Bye, Statistics Norway, Research Department. E-mail: [email protected]
Taran Fæhn, Statistics Norway, Research Department. E-mail: [email protected]
Leo A. Grünfeld, Menon Business Economics, Norway. E-mail: [email protected]

Discussion Papers comprise research papers intended for international journals or books. A preprint of a Discussion Paper may be longer and more elaborate than a standard journal article, as it may include intermediate calculations and background material etc.
Abstracts with downloadable Discussion Papers in PDF are available on the Internet: http://www.ssb.no http://ideas.repec.org/s/ssb/dispap.html For printed Discussion Papers contact: Statistics Norway Sales- and subscription service NO-2225 Kongsvinger Telephone: +47 62 88 55 00 Telefax: +47 62 88 55 95 E-mail: [email protected]
3
1. Introduction A case for growth-enhancing policy arises when the incentives of private firms to invest in technological
improvements are insufficient from an economy-wide perspective. The role of research and development
(R&D) as an engine for technological progress is well documented (see e.g. Romer, 1990; Griliches,
1995; Jones and Williams, 1998, 2000). The main argument for public stimulation of R&D is that the
non-excludable, common features of knowledge suggest external spillover effects, both to other R&D
firms that gain productivity from standing on the shoulders of previous findings and to other industries
that obtain increased technological efficiency (Romer, 1990). Patent systems ensure a certain business
potential of R&D, but at the same time ownership rights to knowledge hamper competition and
economic efficiency. These aspects call for stimulating R&D and R&D-based activities. Some efficiency
arguments go the other way around. There will be unnecessary social costs to the extent that R&D firms
duplicate their findings or commercialise marginally better innovations that steal markets from already
established R&D-based productions, as in the creative destruction model of Aghion and Howitt (1992).
However, it is commonly accepted that the balance of evidence suggests too little private R&D and a
case for policy intervention (Griliches, 1995; Jones and Williams, 1998).
The empirical literature from the last decade puts emphasis not only on domestic R&D, but also on the
absorption of R&D knowledge from abroad as decisive for the productivity and competitiveness of
firms, and the efficiency of economies. As a consequence, promoting technological change involves
not only domestic R&D stimuli, but also strategies for exploiting the international knowledge stock
that is embedded in cross-border flows of persons, ideas, services, and products. These insights form
the fundament on which the EU Lisbon strategy is built. Coe and Helpman (1995) and several similar
studies in its wake find that the level and composition of imports affect learning from abroad. Recent
findings indicate that exports may prove even more important than imports (Alvarez and Lopez,
2006). Not only does the firm’s own trade matter; there is evidence of considerable externalities
(Delgado et al, 2002; Baldwin and Gu, 2003). Empirical research during the last two decades,
including the influential work of Griffith et al. (2004), has also lent convincing support to the twofold
productivity effect of investing in domestic R&D; besides spurring domestic innovations, R&D
extends the capacity of firms to absorb knowledge spillovers from abroad. This hypothesis of the so-
called two faces of R&D was first formulated in Cohen and Levinthal (1989). Coe and Helpman
(1995) and Keller (2004) document that the international spillover channels for technological growth
are particularly important to small and open economies, as their domestic knowledge pools and
capacities for creating novel patents, products, and processes, are limited.
4
The research question of this paper is how small and open economies should form their policy
strategies for stimulating productivity growth. Though a vast growth policy literature exist, the last
decades’ increased research knowledge on the magnitude and determinants of international spillovers
gives reason to revisit the insight from previous, applied policy studies, particularly in the case of
small, open economies. While the vast majority of earlier studies have treated technological change as
exogenous, the endogenous growth models’ introduction of the role of R&D policy represented a
considerable leap forward. Numerical contributions include Diao et al. (1999), Ghosh (2007)1, Russo
(2004), Alvarez-Palaez and Groth (2005), and Steger (2005).2 Typically, they find large productivity
gains from stimulating R&D. However, only the two first mentioned analyses introduce the small,
open economy perspective and a role for international knowledge absorption. They also allow for
some endogeneity of absorption, by linking the productivity of R&D to the economy-wide capital
import. These studies do, however, find only minor effects of trade policy on growth and economic
efficiency. In light of the novel findings on determinants of knowledge absorption summarised above
and surveyed more thoroughly in section 2, there is a need to re-examine the policy impacts, in
particular, the potential of R&D and trade policies.
The main contribution of our study is to examine the policy implications refining the specifications of
absorption mechanisms in a small, open economy in accordance with the recent literature. In
particular, we look at how the export channel for technology spillovers can be exploited. We also
allow for the observed variation among industries with respect to absorption and absorptive capacity.
While Diao et al. (1999) channel all spillovers through the R&D industry we have put effort into
representing how international knowledge affects the productivity of final goods producers differently,
according to industry-specific trade intensities and absorptive capacities.
First, we look at the impact of directing a general subsidy to R&D when both faces of R&D are
accounted for, i.e. the industry-specific absorptive capacity effects as well as direct productivity
effects through innovation. In practical policy, R&D support takes on various forms. A more and more
widespread measure is general tax credits and/or transfers according to firms’ R&D expenses (Warda,
2005). We compare this R&D measure with a similar amount devoted to promoting trade. While Diao
et al. (1999) and Ghosh (2007) find only small economy-wide productivity gains of trade policies, the
new evidence have led us to study export promotion, rather than import liberalisation, which appears
1 Ghosh (2007) applies the same absorption model as Diao et al. (1999). 2 Diao et al (2006) incorporate spillovers between export and productivity in a model for Thailand, but absorptive capacity is not included.
5
as an, á priori, more potent trade policy instrument, especially if directed towards R&D-based
production. Even though direct export subsidies are strictly regulated within the EU/EEA and the
WTO agreements, there exist various more acceptable export promotion instruments for newly
developed products, like grants, loans, guarantees, and marketing arrangements to promote inter-
nationalisation. The EU Lisbon strategy focuses explicitly on such measures to enhance productivity
and competitiveness in the EU. Greenaway and Keller (2007) survey the literature covering the effects
of such measures on exports. Although a significant number of export promotion instruments appear
to have no effect on export volumes, several are found to have strong impact.
In presence of the dynamics of absorption, as well as R&D-based innovation and of the various
externalities involved in these processes, the relative performance of R&D and export measures for
growth and efficiency is not obvious. Moreover, other market imperfections and existing public
interventions will also affect outcomes. To evaluate the effects of the policy incentives, we therefore
use a computable general equilibrium (CGE) model that is calibrated to the small, open Norwegian
economy. It includes R&D-based growth of the Romer (1990) type, as well as trade and R&D-
sensitive absorption that affects the total factor productivity of firms. In spite of the included
endogeneities of growth, the dominant growth impulses are still driven by external factors, in
accordance with the findings for small, open countries.
The main conclusion from our study is that stimuli directed to R&D-based technology exports perform
slightly better than R&D support in terms of improving economic efficiency. However, in light of the
efficacious international regulations of strategic trade instruments, legal and more politically
acceptable R&D support stands out as an almost equivalently good alternative. We find that the
economic setting in which the productivity processes and the policy interventions take place, affect the
efficiency outcomes notably. Even though the R&D subsidy responds better to the external effects of
domestic innovation and absorption, the directed export measure has more favourable interaction
effects with existing policy instruments and market imperfections. This demonstrates the value added
of placing the modelling of growth processes within a realistic, empirically based CGE framework. A
significant contribution to the efficiency superiority of the directed export measure is its ability to
divert resources away from politically favoured, traditional export industries with lower rates of
return. In addition, the export measure is more successful in counteracting imperfections in the
markets for R&D-based technology and dampening the market stealing effects of R&D.
6
2. International knowledge spillovers The idea that knowledge and technology have public goods features is by no means new. Marshall
(1891) pointed to the free exchange of knowledge between agents as one of the key forces behind
industrial development. Gerschenkron (1962) and Abramowitz (1986) stress the importance of
learning and diffusion of knowledge as engines behind long-term growth, and Romer (1986) and
Lucas (1988) show how analytical growth models improve their empirical fit when growth is
endogenised through knowledge accumulation and externalities. The concept of knowledge spillovers
now also plays an important role in industrial organisation (see e.g. d’Aspremont and Jacquemin, 1988
for a central contribution).
Knowledge spillovers require that knowledge is diffused by one agent and absorbed by another. If, for
instance, a technology or a competency is highly codified, the potential for spillovers is limited (see
e.g. Fagerberg et al, 2004). Similarly, if a firm has a low capacity to absorb external knowledge,
spillovers will not play a central role in productivity improvements. Several studies address how
investments in knowledge increase the capacity of firms, industries or countries to learn from the
frontier; see Abramowitz (1986) and Griffith et al. (2004). The latter study also allows for a
counteracting effect, in that growth slows down as you approach the frontier, because the learning gap
tightens. Knowledge and technology flow across countries through trade, migration, investment, and
media. Keller (2004) provides an excellent survey of the empirical literature on this subject over the
last 10 to 15 years.
Imports appear to be one of the most robust channels of international knowledge spillovers. Coe and
Helpman (1995) find that the total factor productivity of OECD countries is strongly affected by their
openness to R&D-intensive imports. The smaller a country is the more important are imports as a
source of overall growth. Similar results are reproduced in a series of studies. Keller (2002) extends
the framework of Coe and Helpman and shows that geographical distance has a strong negative effect
on spillovers through imports, disclosing that spillovers depend strongly on physical and cultural
proximity. Other studies have applied the same approach on more detailed cross-country industry data
(e.g. Crespo et al, 2002) and reveal the same strong productivity effects on the industry level of R&D-
intensive imports. More recent studies also incorporate absorptive capacity aspects in international
learning through imports, showing that more R&D-intensive sectors are able to learn more from R&D-
intensive imports than less R&D-intensive sectors, as in Griffith et al (2004). See Grünfeld (2002) for
a study of Norwegian data.

7
Exports as a channel of knowledge spillovers have received less robust support, and the number of
studies is more limited. Yet, recent evidence identifies significant spillover effects from exporters to
domestic firms. Bernard and Jensen (1999, 2004) give support to the learning-by-exporting effect,
showing that exporters have a 0.8 per cent higher productivity growth after controlling for exporter
selection. However, it is not clear whether this effect relates to spillovers from other firms in the
export market or from scale effects as exporters find new markets. Delgado et al (2002) and Baldwin
and Gu (2003) control for the scale effect by focusing on young exporters and find evidence of
learning by exporting. Alvarez and Lopez (2006) find strong spillover effects from exporters to non-
exporters in a highly detailed firm level study on Chile. In contrast, Clerides et al. (1998) find no such
evidence in a dataset for Colombia, Mexico, and Morocco. Surprisingly, no studies apply the Coe and
Helpman method to investigate the effects of export on the home country productivity. Neither do
there exist any studies of the interaction between spillovers through exports and the absorptive
capacity of firms. Another potential channel for spillovers is foreign direct investments (FDI). We
exclude FDI as a channel, based on two Scandinavian studies (Grunfeld, 2002; Braconier et al, 2001)
that find no significant spillover effects from inward FDI.3 .
We model import and export intensity of industries as decisive to learning across borders. The idea is
that exposure to international competitors provides information about their technology and
competency. We explicitly model the capacity of firms to absorb knowledge from abroad as a function
of the R&D-intensity of the industry, proxied by its intensity of R&D-based, high-tech capital. The
productivity effects of investing in absorptive capacity have decreasing returns to scale, in order to
account for catching-up effects.
3 Pottelsberghe and Lichtenberg (2001) identify spillovers from FDI on the macro level, while Damijan et al. (2004) find that spillovers through inward FDI stands out as the most important contributor to productivity in 10 transition economies, based on firm-level data. In the case of Norway and Sweden, industry data studies show no significant spillover effects from inward FDI (Grünfeld, 2002, Braconier et al. 2001), but firm-level analysis and studies of worker mobility between multinationals and domestic firms show significant spillovers (Karpaty and Lundberg, 2004 and Balsvik, 2006).
8
3. An open economy CGE model with innovation and absorption effects
3.1. General features The CGE model is a dynamic growth model with intertemporally optimising firms and households. It
gives a detailed description of the empirical tax, production, and final consumption structures. It
specifies 15 final goods industries and one R&D industry producing R&D-based capital goods. The
final goods industries4 comprise one public and 14 private industries, which according to the empirical
input-output structure deliver to final markets and produce intermediates for each other. The public
sector collects taxes, distributes transfers, and purchases goods and services from the industries and
from abroad. The model fits a small, open economy and is calibrated for Norway. International prices
are determined at the world market, as is the interest rate. Financial savings are endogenously
determined, subject to a non-ponzi game restriction that prevents foreign net wealth from exploding in
the long term. The exchange rate serves as numeraire.
The model takes into consideration exogenous growth drivers through changes in demography and
international conditions, as well as the following endogenous productivity growth mechanisms;
i) Productivity within the R&D industry continuously grows because of dynamic spillovers from the
accumulated knowledge induced by previously patented R&D, though with decreasing returns as in
Jones (1995). ii) New R&D-based capital varieties emerge based on the new patents, and due to love
of capital variety, the productivity of R&D-based investments within final goods industries increases
with the number of patents. iii) The absorption of productivity improvements from abroad depends on
the industries’ extent of foreign trade and their reliance on R&D-based capital. iv) Finally, labour
productivity improves through accumulation of several types of real capital, which results from the
cash-flow maximisation of rational, forward-looking firms.
The following two subsections, 3.2. and 3.3., provide detailed descriptions of the parts of the model
that bring about productivity growth through absorption and domestic innovation, respectively.
Subsection 3.4. briefly outlines the remaining model mechanisms, including behavioural relations and
equilibrium and balanced-growth conditions. To simplify this model exposition, we disregard policy
variables as taxes and subsidies. Appendix B provides a more thorough, aggregated presentation of the
equations determining firm and household behaviour, where the relevant policy variables are included.
4 See appendix A for a list. The following industries are treated exogenously: the governmental sector, the offshore production of oil, gas and pipeline transport, and ocean transport.
9
Appendix C gives details on parameter values, as well as calibration and solution procedures. Bye et
al. (2006)5 provides the complete model documentation.
3.2. Productivity growth through absorption of international knowledge In general terms, the technology of firm i, irrespective of industry, can be represented by
(1) ( ) ( )iiWi
Hii VFgXXX =,
Wi
Hi XX , are production for domestic and export deliveries, respectively, and VFi is a nested Constant
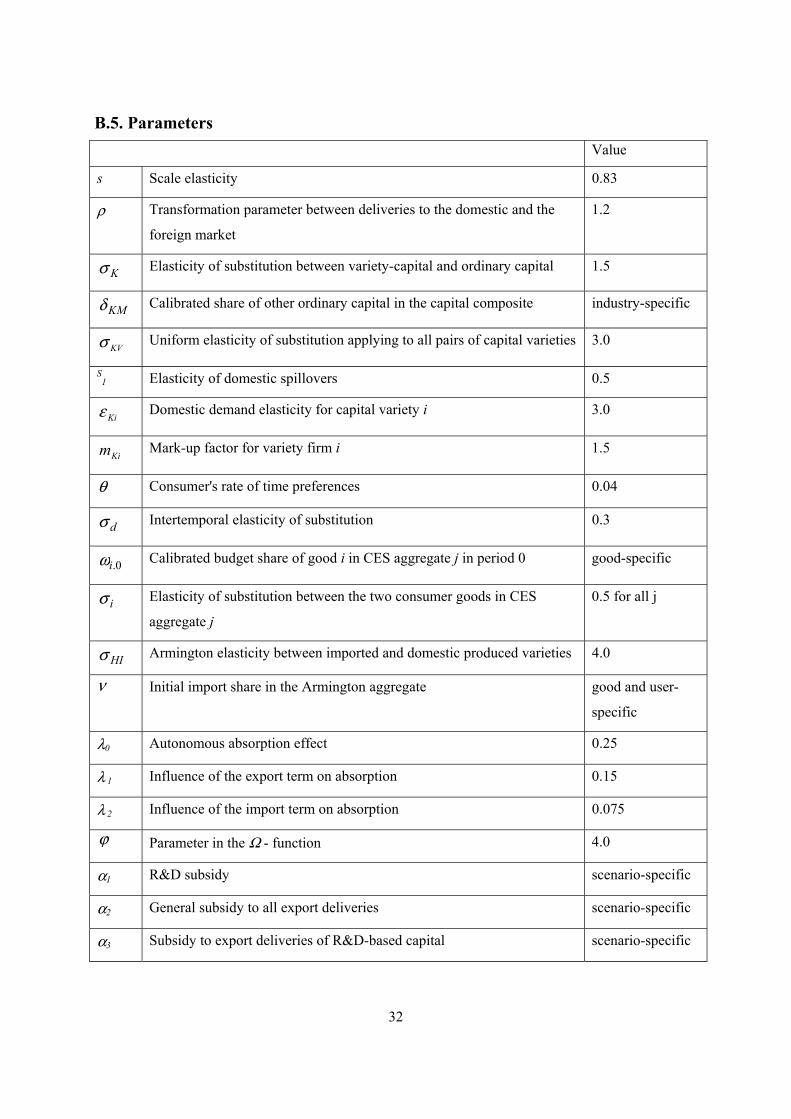
Elasticities of Substitution (CES) function of a number of variable inputs, see figure B.1. in appendix
B. There are decreasing returns to scale in all industries.6 VFi can be represented by
(2) ( )ττττ iMi
Viiii VKKLfVF ,,,= .
Li, KVi, KM
i, and Vi represent the firm’s input of labour, R&D-based capital, other capital, and
intermediates, respectively. Factor inputs also depend on a factor-neutral, endogenous productivity
variable τ, which is common to all firms in the industry, thus having no subscript. τ reflects the firms’
absorbed productivity by learning from abroad
(3) )( 210 BAAF λλλτ ++= .
τ responds to growth in the productivity level abroad, AF, according to an absorption elasticity
BA 210 λλλ ++ , where λ0 ensures an autonomous effect of external productivity growth. The λ1 and
λ2 -parameters determine the relative influence of Α, an export-dependent term, and Β, an import-
dependent term, defined as follows
(4) X
XAW
⋅Ω= ,
(5) HXIB ⋅Ω= .
The term Α accounts for the absorption elasticity’s dependence on the industry’s export, XW, as share
of total output, X. The term B describes the corresponding dependence on industry import, I, measured
relative to the domestic deliveries of similar products from domestic firms within the industry, XH. The
function Ω, represents the absorptive capacity of the firm. We model it as a function of the industry’s
input intensity of R&D-based capital, KV/VF. The model implies that for industries engaging in foreign
trade, the firms’ capacities to learn from this interplay with foreign agents expand if the intensity of
5 Available at http://www.ssb.no/emner/10/03/doc_200611/doc_200611.pdf. 6 The scale elasticity is equal for all industries, see also appendix B and C.
10
R&D-based capital of the industry increases. There is decreasing returns to the R&D-based capital
intensity, which we ensure by the following specification
(6)
00
00
//
2
//
VFKVFK
VFKVFK
V
V
V
V
+
⎟⎟⎠
⎞⎜⎜⎝
⎛
=Ωϕ
ϕ, φ>0, 0'>Ω , 0'' <Ω .
We assume equal λ-values for all industries, see appendix B.6. Their values are chosen in accordance
with estimates found in the literature. In particular, facing international competition in foreign markets
proves somewhat more influential than competing with importers in the home markets. All firms are
symmetric, and we implicitly assume that they do not consider the strategic effects on their absorbed
productivity of adjusting their trade or R&D-based capital intensity, since firms are small. Thus, the
absorbed productivity effects are external.7 Appendix C provides more details on the calibration.
3.3. Productivity growth through domestic innovation Domestic innovation takes place within the R&D industry, which provides R&D-based technologies.
The process involves two distinct activities within each firm: R&D that develops patents and capital
production based on these patents. The industry output of patents, RX , benefits from endogenous
domestic productivity spillovers that originate from the accumulated stock of knowledge, R, and are
freely accessible, thus
(7) ssR VFRX 1=
and RXRR += −1 . The parameter s1 denotes the elasticity with respect to the domestic spillovers. As
suggested in Jones (1995), it is less than unity. This productivity growth dynamics generated by R&D
is external to the individual patent producer, who is too small to consider the effect of its own output
on the accumulated stock of patented knowledge. s <1 is the scale elasticity of the variable input
factors used for production of R&D. The development of a patent represents a fixed establishment cost
for a new firm in the R&D industry before entering the market for R&D-based capital goods with a
new and distinct variety, KV. The production of R&D-based capital varieties also involves variable
factor input costs. We assume identical factor input cost structures for all R&D firms both in their
patent and capital production.
7 Note that defining absorptive capacity in terms of R&D-based capital investments excludes absorptive capacity effects in the R&D industry; confer also footnote 5.
11
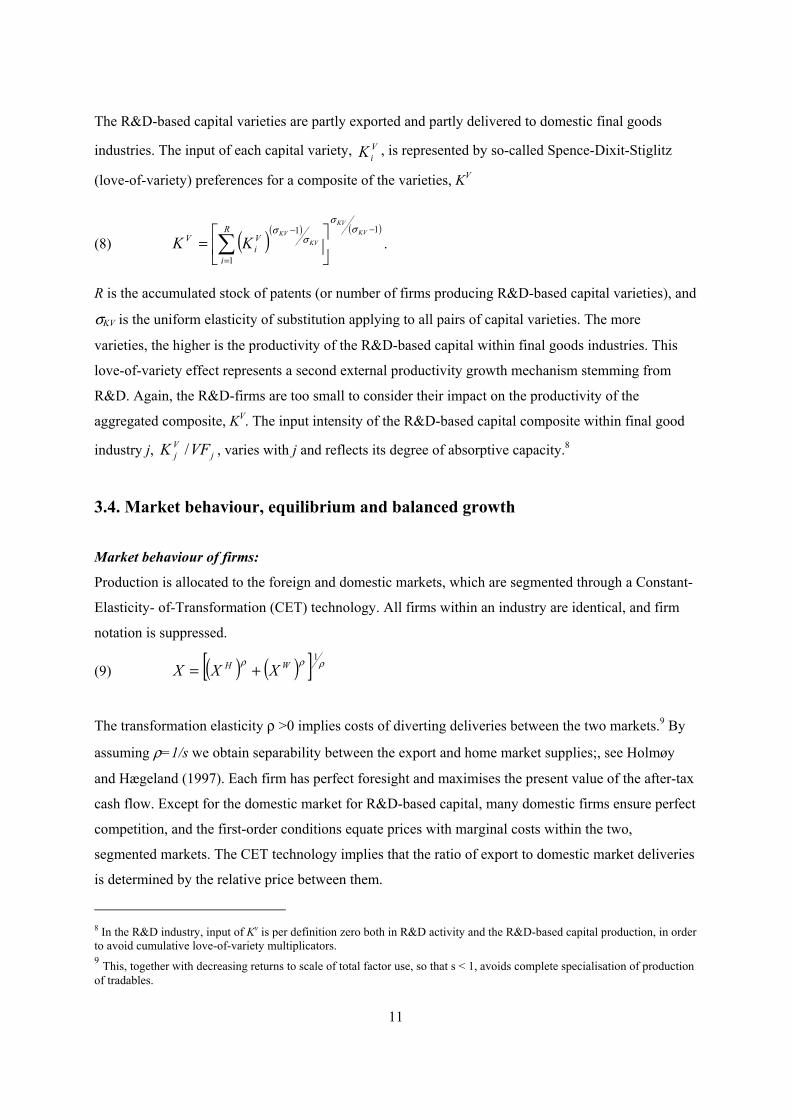
The R&D-based capital varieties are partly exported and partly delivered to domestic final goods
industries. The input of each capital variety, ViK , is represented by so-called Spence-Dixit-Stiglitz
(love-of-variety) preferences for a composite of the varieties, KV
(8) ( )( ) ( )1
1
1 −
=
−
⎥⎦
⎤⎢⎣
⎡= ∑KV
KV
KVKVR
i
Vi
V KKσ
σ
σσ
.
R is the accumulated stock of patents (or number of firms producing R&D-based capital varieties), and
σKV is the uniform elasticity of substitution applying to all pairs of capital varieties. The more
varieties, the higher is the productivity of the R&D-based capital within final goods industries. This
love-of-variety effect represents a second external productivity growth mechanism stemming from
R&D. Again, the R&D-firms are too small to consider their impact on the productivity of the
aggregated composite, KV. The input intensity of the R&D-based capital composite within final good
industry j, jVj VFK / , varies with j and reflects its degree of absorptive capacity.8
3.4. Market behaviour, equilibrium and balanced growth
Market behaviour of firms:
Production is allocated to the foreign and domestic markets, which are segmented through a Constant-
Elasticity- of-Transformation (CET) technology. All firms within an industry are identical, and firm
notation is suppressed.
(9) ( ) ( )[ ] ρρρ 1WH XXX +=
The transformation elasticity ρ >0 implies costs of diverting deliveries between the two markets.9 By
assuming ρ=1/s we obtain separability between the export and home market supplies;, see Holmøy
and Hægeland (1997). Each firm has perfect foresight and maximises the present value of the after-tax
cash flow. Except for the domestic market for R&D-based capital, many domestic firms ensure perfect
competition, and the first-order conditions equate prices with marginal costs within the two,
segmented markets. The CET technology implies that the ratio of export to domestic market deliveries
is determined by the relative price between them.
8 In the R&D industry, input of Kv is per definition zero both in R&D activity and the R&D-based capital production, in order to avoid cumulative love-of-variety multiplicators. 9 This, together with decreasing returns to scale of total factor use, so that s < 1, avoids complete specialisation of production of tradables.
12
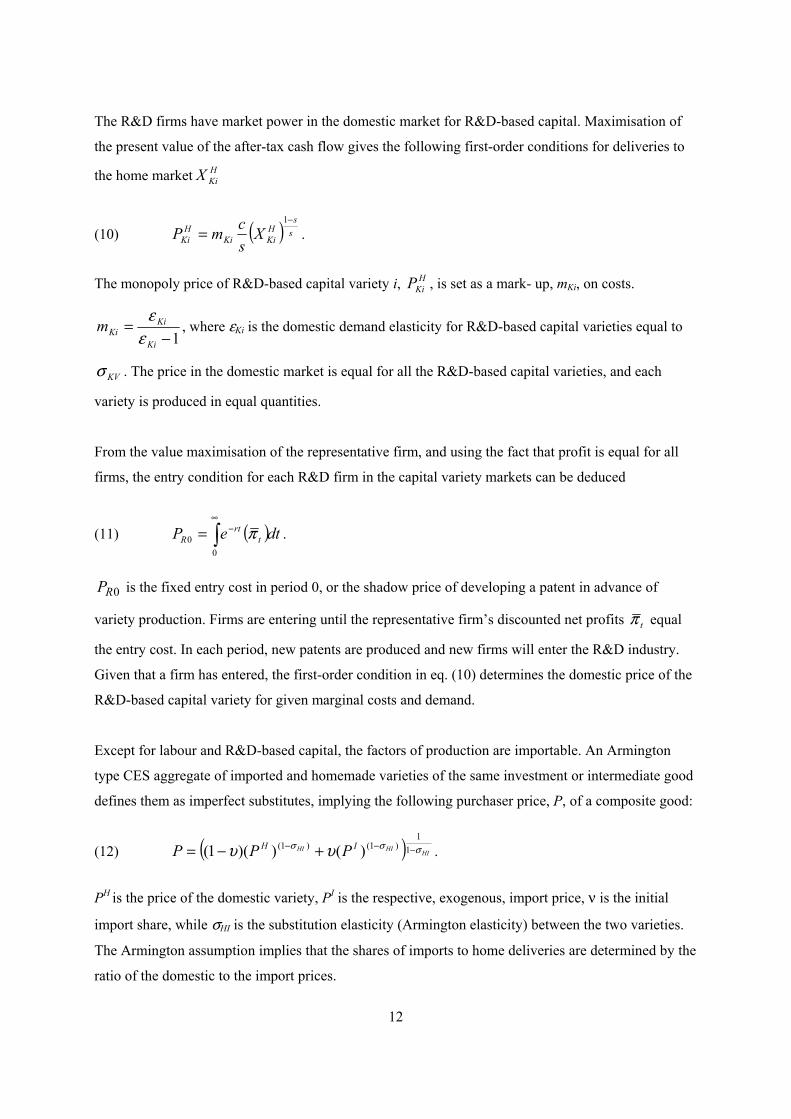
The R&D firms have market power in the domestic market for R&D-based capital. Maximisation of
the present value of the after-tax cash flow gives the following first-order conditions for deliveries to
the home market HKiX
(10) ( ) ss
HKiKi
HKi X
scmP
−
=1
.
The monopoly price of R&D-based capital variety i, HKiP , is set as a mark- up, mKi, on costs.
1−=
Ki
KiKim
εε
, where εKi is the domestic demand elasticity for R&D-based capital varieties equal to
KVσ . The price in the domestic market is equal for all the R&D-based capital varieties, and each
variety is produced in equal quantities.
From the value maximisation of the representative firm, and using the fact that profit is equal for all
firms, the entry condition for each R&D firm in the capital variety markets can be deduced
(11) ( )dteP trt
R ∫∞
−=0
0 π .
0RP is the fixed entry cost in period 0, or the shadow price of developing a patent in advance of
variety production. Firms are entering until the representative firm’s discounted net profits tπ equal
the entry cost. In each period, new patents are produced and new firms will enter the R&D industry.
Given that a firm has entered, the first-order condition in eq. (10) determines the domestic price of the
R&D-based capital variety for given marginal costs and demand.
Except for labour and R&D-based capital, the factors of production are importable. An Armington
type CES aggregate of imported and homemade varieties of the same investment or intermediate good
defines them as imperfect substitutes, implying the following purchaser price, P, of a composite good:
(12) ( ) HIHIHI IH PPP σσσ υυ −−− +−= 11
)1()1( )())(1( .
PH is the price of the domestic variety, PI is the respective, exogenous, import price, ν is the initial
import share, while σHI is the substitution elasticity (Armington elasticity) between the two varieties.
The Armington assumption implies that the shares of imports to home deliveries are determined by the
ratio of the domestic to the import prices.
13
Consumer behaviour
Consumption and savings result from the decision of an infinitely lived, perfectly foresighted
representative consumer that maximises intertemporal utility. The consumer chooses a consumption
path subject to an intertemporal budget constraint that requires the present value of consumption not to
exceed total wealth (current non-human wealth plus the present value of labour income and net
transfers). Labour supply is exogenous. We assume that the consumer's rate of time preferences equals
the exogenously given nominal interest rate for the entire time path. Total consumption is allocated
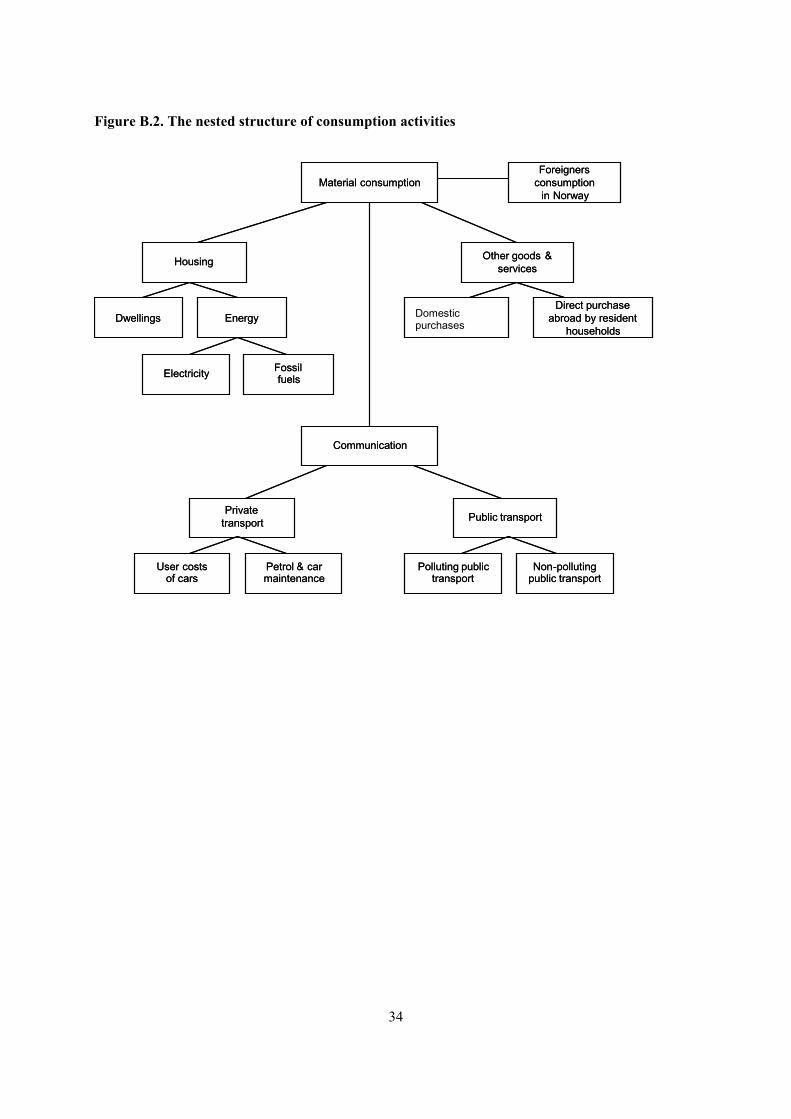
across 10 different goods and services according to a nested CES structure. The structure is given in
figure B.2 in appendix B. Each consumer good also consists of one imported and one domestically
produced variety according to an Armington function as in eq. (12).
Equilibrium conditions
The model is characterised by equilibrium in each period in all product markets and the labour market.
Intertemporal equilibrium requires fulfilment of two transversality conditions: the limit values of the
total discounted values of net foreign debt and of real capital, respectively, must both be zero. The
model is characterised by a path-dependent balanced growth path solution (or steady state solution),
see Sen and Turnovsky (1989) for a theoretical exposition. This implies that both the path and the
long-run stationary solution differ between simulated scenarios.
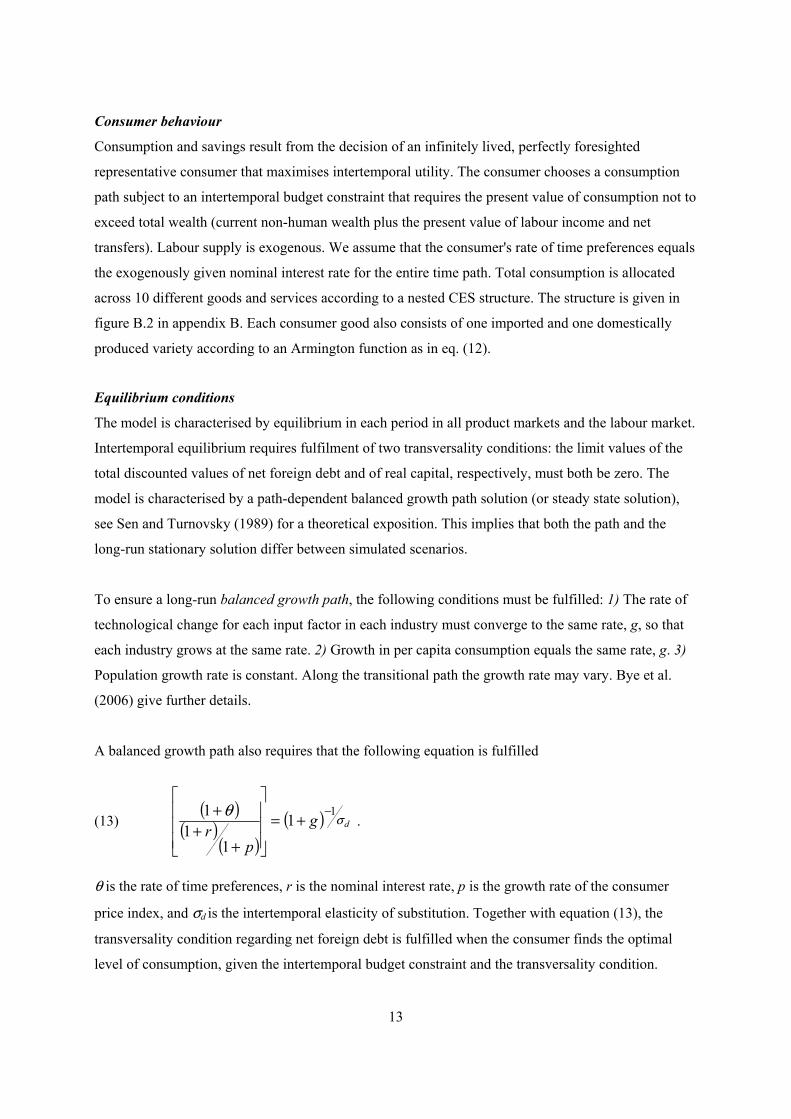
To ensure a long-run balanced growth path, the following conditions must be fulfilled: 1) The rate of
technological change for each input factor in each industry must converge to the same rate, g, so that
each industry grows at the same rate. 2) Growth in per capita consumption equals the same rate, g. 3)
Population growth rate is constant. Along the transitional path the growth rate may vary. Bye et al.
(2006) give further details.
A balanced growth path also requires that the following equation is fulfilled
(13) ( )
( )( )
( ) dg
pr
σθ 1
1
11
1 −+=
⎥⎥⎥
⎦
⎤
⎢⎢⎢
⎣
⎡
++
+ .
θ is the rate of time preferences, r is the nominal interest rate, p is the growth rate of the consumer
price index, and σd is the intertemporal elasticity of substitution. Together with equation (13), the
transversality condition regarding net foreign debt is fulfilled when the consumer finds the optimal
level of consumption, given the intertemporal budget constraint and the transversality condition.
14
Correspondingly, the transversality condition for the value of real capital is a restriction on the
determination of net investments by firms. In an infinite time horizon, growth in our model will only
depend on exogenous drivers. For technical reasons, we have set all exogenous and endogenous
growth drivers to zero in the far future (after about 100 years). This ensures that the economy is
eventually on a balanced growth path (steady state) and that this growth path, with zero growth both in
consumption and in the consumer price index, satisfies these transversality conditions. In particular,
equation (13) then implies that r=θ at all points in time.
4. Effects of growth policy
4.1. The policy schemes We compare two different policy alternatives, both designed to stimulate the productivity of firms.
The first, an R&D subsidy, directly affects domestic innovation as well as the capacity of firms to
absorb technological progress from abroad. The second policy is a support for promotion of exporting
R&D-based capital goods. It is primarily motivated by the absorption externalities related to trading
and, in particular, to exporting. The policy instruments are dimensioned so that they involve the same
discounted government expenditures. Each year the governmental budgets are balanced by reduced
VAT rates.
We ask what policies perform better when it comes to stimulating economic growth and national
welfare. In presence of many channels and externalities, it is difficult, á priori, to predict outcomes of
policies. Thus, we use CGE model simulations to quantify the simultaneous effects on the innovation
and absorption processes. We identify important interaction effects through other markets and
imperfections in the economy. In table 2 we report the long-run effects of policies 70 years from now,
after the economy has reached stable growth rates and before the endogenous growth is emptied out.
The effects are measured as per cent changes from a reference path, see appendix C for more details.
4.2 R&D support We introduce a constant 5.0 per cent ad valorem subsidy to the development of new patents through
R&D. It corresponds to approximately 1.5 times the value of today’s Norwegian R&D tax credit
system.10 The direct effect is to shift marginal costs of R&D downwards. The marginal willingness to
invest in R&D is determined by the discounted future profit from sales of R&D-based capital for the
10 This approximates a support of € 250 in annuity terms.
15
last new firm entering the R&D industry, and it falls along with entry, as the market share and profit of
each capital variety producer fall. The marginal costs of R&D will perpetually shift downwards as a
result of dynamic, positive spillover effects from the accumulated knowledge stock. In long-run
equilibrium, R&D increases considerably, by 18.7 per cent, while the shadow price of patents falls by
6.9 per cent compared to the baseline; see table 2. Total deliveries of R&D-based capital increase by
6.7 per cent, while the number of capital varieties increases by 13.5 per cent. The output of each
variety falls because the demand for each variety shifts downwards when their number increase. The
output of each variety is further downscaled in response to increased factor prices. For instance, wages
increase by 2.5 per cent.
The factor price increases reflect higher scarcity. Increased factor demand from the newcomers in the
R&D industry is part of this picture, but the main pressure comes from other final goods producers.
Their increased factor demand reflects two productivity effects. First, the productivity of the R&D-
based capital they use increases with the number of varieties because of love of variety. This is
reflected in a fall in the capital price per efficiency unit of 5.5 per cent, despite a slight rise in the price
of each variety of 0.4 per cent. Second, increased R&D intensity through investments in R&D-based
capital, measured in efficiency terms, increases the R&D intensity. This improves the absorptive
capacity of the final goods producers.
The absorption effects are most prominent within the trade-intensive final goods industries, and in
particular the export-intensive ones since the export engine is empirically the strongest. Absorption
effects through export are self-enforcing before emptying out: In isolation, higher export increases
absorption, which again feeds back into higher export by improving the productivity and
competitiveness of domestic firms. The most exposed and R&D-intensive final goods firms,
represented by those in Traditional manufacturing11, face a 1.6 per cent increase in their long-run,
absorbed productivity level. In other, less exposed and less R&D-intensive industries, smaller or no
effects occur on productivity absorbed from abroad. The R&D production industry even faces a slight
reduction in absorbed productivity, because the share of export in total output of R&D-based capital
goods falls.
In the long run, total export increases by 3.1 per cent and the rise in GDP is 1.7 per cent. The long run
GDP growth rate increases by 0.04 percentage points due to the stimulation of the productivity growth
processes. Welfare measured as total discounted utility of consumption rises by 0.8 per cent.
11 This industry includes manufacturing of metals, industrial chemicals, pulp, and paper.
16
4.3. Export promotion In this policy alternative we represent export-promoting instruments by a subsidy to exports of R&D-
based capital. For a small, open economy without market power in the export markets and without
noteworthy influence on world market prices, policy stimulation of export would normally not be
recommendable from an efficiency point of view. However, as export positively affects spillovers
from abroad, and is a stronger impetus than import in this respect, there could still be efficiency
arguments for strategically promoting export in small, open countries. In particular, promoting sales of
R&D-based products would have a welfare increasing potential. 12
The constant export support rate amounts to 1.3 per cent of the export value. It serves to increase
export of R&D-based capital by 10.3 per cent in the long run; see table 1. This is approximately 40 per
cent more than the increase in the R&D subsidy case. The absorption of international spillovers in the
R&D industry increases in every period, and in the long run the increase is 0.2 percent, as compared to
a fall of 0.1 per cent in the R&D subsidy case.
However, this comes at the expense of absorption in other industries. The support to export in the
R&D industry results in a downscaling of their home market deliveries of R&D-based capital
compared with the R&D support case. Also, the productivity of the capital is lower, because new
patents develop at a slower pace. In the long run, the number of varieties available in the market
increases by only 9.1 per cent in the export support case, as compared to 13.5 per cent in the R&D
support case. As a consequence of these changes, the absorptive capacity falls in most final goods
industries relative to the previous policy case.
In addition, productivity through absorption depends on foreign trade intensities. Because the export
policy scheme is biased towards one industry, only, it crowds out other exports from, for instance,
traditional manufacturing. In aggregate, gross trade increases slightly more under the export support
scheme than the R&D support scheme. However, most of this stems from more import, which has
weaker absorption effects. In addition, the trade increase tends to come within industries with
relatively small potentials for interaction effects with absorptive capacity, as in the retail markets for
12 Albeit being subject to heavy international regulations, we have simulated a general export-promoting stimulus in order to de-emphasise the R&D effects and cultivate the general absorption effects of export. This policy results in an efficiency loss of 0.1 per cent compared to the reference and shows that the absorption argument, alone, is not empirically strong enough to defend export promotion. Unless accompanied by R&D promotion, the absorptive capacity of firms gradually deteriorates. We find a long run fall in the average absorption, competitiveness, and over-all export. Thus, economic as well as legal arguments weigh against pursuing this policy instrument any further.
17
consumer goods. In sum, absorbed productivity falls slightly in this alternative compared with the
R&D subsidy, contributing to lower welfare.
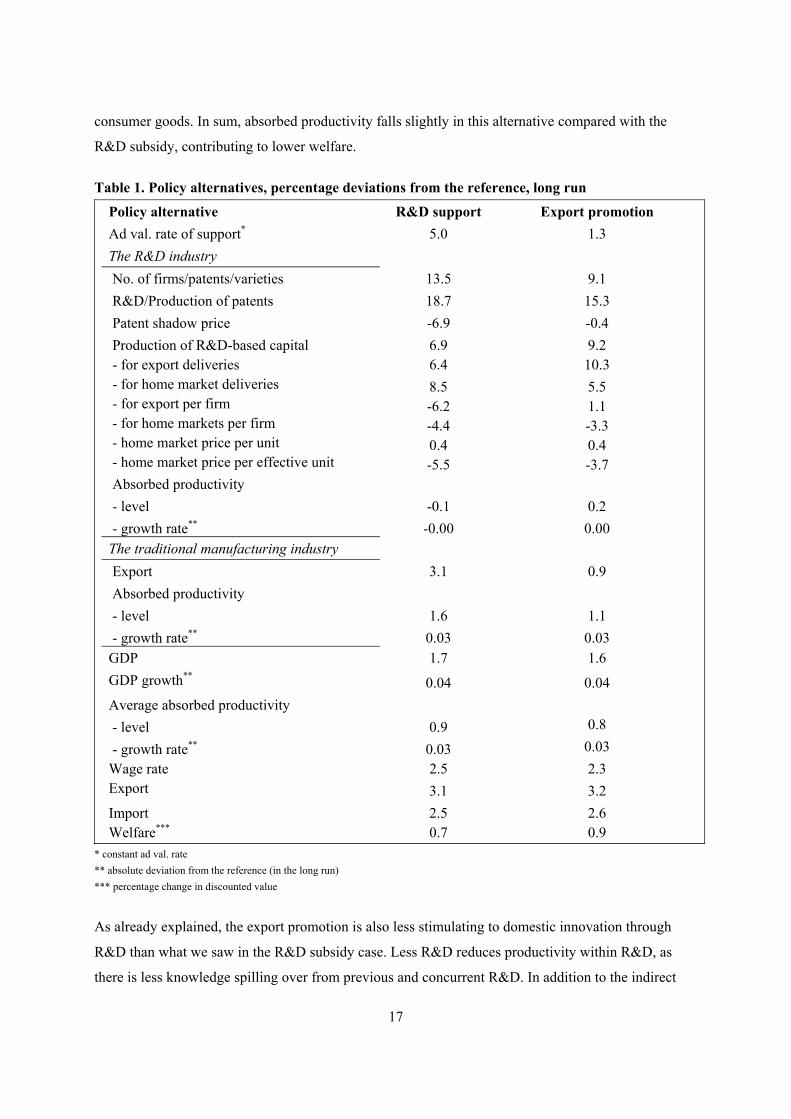
Table 1. Policy alternatives, percentage deviations from the reference, long run
Policy alternative Ad val. rate of support*
R&D support 5.0
Export promotion 1.3
The R&D industry No. of firms/patents/varieties 13.5 9.1 R&D/Production of patents 18.7 15.3 Patent shadow price -6.9 -0.4 Production of R&D-based capital - for export deliveries - for home market deliveries - for export per firm - for home markets per firm - home market price per unit - home market price per effective unit
6.9 6.4 8.5 -6.2 -4.4 0.4 -5.5
9.2 10.3 5.5 1.1 -3.3 0.4 -3.7
Absorbed productivity - level
- growth rate**
-0.1
-0.00
0.2
0.00 The traditional manufacturing industry Export 3.1 0.9 Absorbed productivity - level
- growth rate**
1.6
0.03
1.1
0.03 GDP 1.7 1.6 GDP growth** 0.04 0.04 Average absorbed productivity - level
- growth rate**
0.9
0.03
0.8
0.03 Wage rate 2.5 2.3 Export 3.1 3.2 Import 2.5 2.6 Welfare*** 0.7 0.9
* constant ad val. rate ** absolute deviation from the reference (in the long run) *** percentage change in discounted value
As already explained, the export promotion is also less stimulating to domestic innovation through
R&D than what we saw in the R&D subsidy case. Less R&D reduces productivity within R&D, as
there is less knowledge spilling over from previous and concurrent R&D. In addition to the indirect
18
absorptive capacity effect already explained, a direct productivity effect also occurs in the final goods
industries when fewer varieties of R&D-based capital emerge. On the other hand, other distortions are
counteracted in the wake of lower R&D. The increased supply of R&D-based capital goods partly
stems from higher production in already established firms than in the other policy case. This effect
contributes to increase welfare, as larger production scales within each firm counteract the
inefficiencies related to the existing market imperfections. In addition, fewer patents imply less R&D
costs behind the sales from the R&D industry. This does, in isolation, save social costs. A third
positive contribution to welfare relates to the crowding out of traditional manufacturing. This industry
enjoys various lenient indirect taxes and other favourable input cost terms designed to keep up its
competitiveness.13 Thus, its contraction brings about welfare improvements.
To sum up the efficiency effects, the export promoting scheme fosters less productivity spillovers both
from domestic innovation and absorption than does the R&D support. However, there are positive
contributions from counteracted distortions elsewhere in the economy, including less total R&D
investment costs, increased scales within firms with mark-ups and reduced activity within industries
facing favourable and inefficient policies. All in all, the total welfare is marginally higher with support
to R&D-based export than with R&D subsidies.
4.4 Sensitivity analysis of the absorption elasticities The econometric foundation for quantifying absorption effects is still debateable and insufficiently
tested, in particular when it comes to the trade sensitivities and the externalities of absorption. We
have, therefore, simulated the sensitivity of our policy results to different strengths of the absorption
elasticity; see table 2. In the regime labelled none, the parameters λ1 and λ2 in eq. (3) are set to zero.
This removes absorption endogeneities both through trade and absorptive capacity effects of R&D,
and renders the productivity growth through cross-border learning exogenous. The main regime is
denoted moderate in table 2, while a strong absorption regime is constructed by increasing λ1 and λ2
with 1/3.14
The main conclusion above that export promotion is slightly welfare superior, is insensitive to the
variations of λ1 and λ2. The explanations for the ranking of the policy schemes are also robust to the
changes in the absorption assumptions. In all regimes, a change from R&D subsidy to export
13 These include relatively lower taxes on electricity, CO2 emissions, and labour, as well as favourable energy contracts. 14 The model framework relies on strictly positive outputs and is unsuitable for simulating with substantially higher absorption elasticities, because activities in the sheltered sector, including R&D, will be crowded out.
19
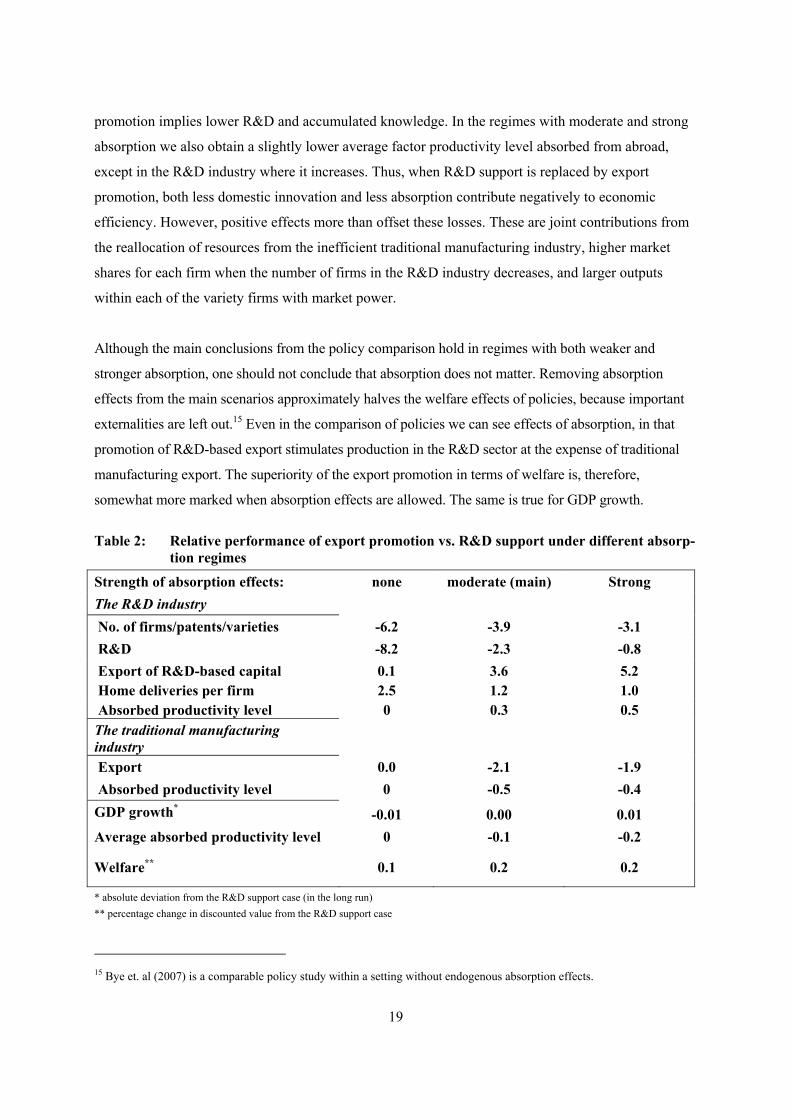
promotion implies lower R&D and accumulated knowledge. In the regimes with moderate and strong
absorption we also obtain a slightly lower average factor productivity level absorbed from abroad,
except in the R&D industry where it increases. Thus, when R&D support is replaced by export
promotion, both less domestic innovation and less absorption contribute negatively to economic
efficiency. However, positive effects more than offset these losses. These are joint contributions from
the reallocation of resources from the inefficient traditional manufacturing industry, higher market
shares for each firm when the number of firms in the R&D industry decreases, and larger outputs
within each of the variety firms with market power.
Although the main conclusions from the policy comparison hold in regimes with both weaker and
stronger absorption, one should not conclude that absorption does not matter. Removing absorption
effects from the main scenarios approximately halves the welfare effects of policies, because important
externalities are left out.15 Even in the comparison of policies we can see effects of absorption, in that
promotion of R&D-based export stimulates production in the R&D sector at the expense of traditional
manufacturing export. The superiority of the export promotion in terms of welfare is, therefore,
somewhat more marked when absorption effects are allowed. The same is true for GDP growth.
Table 2: Relative performance of export promotion vs. R&D support under different absorp-tion regimes
Strength of absorption effects: none moderate (main) Strong The R&D industry No. of firms/patents/varieties -6.2 -3.9 -3.1 R&D -8.2 -2.3 -0.8 Export of R&D-based capital Home deliveries per firm
0.1 2.5
3.6 1.2
5.2 1.0
Absorbed productivity level 0 0.3 0.5 The traditional manufacturing industry
Export Absorbed productivity level
0.0 0
-2.1 -0.5
-1.9 -0.4
GDP growth* -0.01 0.00 0.01 Average absorbed productivity level 0 -0.1 -0.2
Welfare** 0.1 0.2 0.2
* absolute deviation from the R&D support case (in the long run) ** percentage change in discounted value from the R&D support case
15 Bye et. al (2007) is a comparable policy study within a setting without endogenous absorption effects.
20
5. Conclusions Recent empirical studies find that a country’s level of R&D affects productivity and competitiveness
of national firms, not only through developing new and better products and processes, but also through
increasing the firms’ capacity to learn from abroad. For small countries, the international channel is of
high importance, as they necessarily rely heavily on technological change induced abroad. This fact
brings up the question on how national efforts can enhance the exploitation of this common good.
In this study we examine the policy implications of refining the specifications of absorption
mechanisms in a small open economy. Especially, we introduce a role for the export channel, which is
novel when compared to earlier macroeconomic studies. We combine the modelling of innovation
processes with the modelling of absorption within an empirical setting, to grasp quantitatively the
interplay between domestic innovation and spillovers of productivity growth from abroad. The
processes are modelled in a CGE framework that also accounts for indirect interdependencies via
resource restraints and behavioural responses. The disaggregate approach also allows us to study
industrial differences and variations in growth prospects.
Our study finds that directed support to R&D-based technology export promotion performs slightly
better than R&D support in terms of economic efficiency. However, as strategic export promotion is
likely to run counter with international competition rules, direct R&D support is a good substitute in
terms of effects on economic efficiency and growth. While the R&D subsidy performs better in
meeting the externalities both related to domestic innovations and absorption, the directed export
measure has more favourable interaction effects with existing policy instruments and market
imperfections. In our case these effects include diverting resources away from the politically favoured
traditionally manufacturing export industries, counteracting imperfections and dampening the market
stealing effects in the markets for R&D-based technology.
We find a relatively large welfare impact from trade policy compared to the existing literature. The
difference is mainly related to our introduction of the export-driven impetus for absorption effects that
is not accounted for in other analyses. Also, relative to the R&D subsidy, the export measure performs
better than in previous studies. Our sensitivity analysis reveals that this feature is not explained by the
introduction of absorption effects, but comes as a consequence of export promotion counteracting
market imperfections elsewhere in the economy. As such, the effects are fairly case specific and reflect
Norwegian tax systems and market characteristics. Nevertheless, we claim that lessons of more

21
general interest can be learned, as the inclination of governments to favour its traditional export
industries at the expense of economic efficiency is widespread.
There are several potentials for adding features into the model that are empirically significant and
relevant from a growth and welfare perspective. Human capital is an important growth engine and a
factor that is crucial for the economy’s capacity to absorb knowledge from abroad. Accumulation of
human capital and education policies will interact with innovation policies in ways that are crucial to
understand in order to choose optimal growth promoting policies. Such interactions are left for future
research, as are interlinkages between private and governmental R&D.

22
References Abramovitz, M. (1986): Catching Up, Forging Ahead and Falling Behind, Journal of Economic His-tory 46 (2), 385-406. Aghion, P. and P. Howitt (1992): A model of growth through creative destruction, Econometrica 60(2), 323-351. Alvarez, R. and R. Lopez (2006): Is Exporting a Source of Productivity Spillovers, Working paper 2006/012, Center for Applied Economics and Policy Research, Indiana. Alvarez-Pelaez, J. M. and C. Groth (2005): Too little or too much R&D?, European Economic Review 49, 437-456. Andreassen, L. and G. H. Bjertnæs (2006): Tallfesting av faktoretterspørsel i MSG6 (Quantifying factor input demand in the MSG6 model), Documents 2006/7, Statistics Norway. d’Aspremont, C. and A. Jacquemin (1988): Cooperative and Noncooperative R&D in Duopoly with Spillovers, American Economic Review 78 (5), 1133-37. Baldwin, J., & Gu, W. (2003): Export market participation and productivity performance in Canadian manufacturing.Canadian Journal of Economics, 36, 634–657. Balsvik, R. (2006): Is mobility of labour a channel for spillovers from multinationals to local domestic firms?, Discussion paper no. 25/2006, Department of Economics, NHH, Bergen. Basu, S. (1996): Procyclical Productivity: Increasing Returns to Cyclical Utilization? Quarterly Journal of Economics 111, 709-751. Bernard, A. B. and J. B. Jensen. (1999): “Exceptional Exporter Performance: Cause, Effect, or Both?” Journal of International. Economics 47 (1), 1–25. Bernard, A. B. and J. B. Jensen (2004): Why some firms export, The Review of Economics and Statistics, 86/2, 561-569. Braconier, H., K. Ekholm and K. H. M. Knarvik (2001): Does FDI work as a channel for R&D spillovers? Weltwirtschaftliches Archiv 137 (4), 644-665. Bye, B., T.R. Heggedal, T. Fæhn and B. Strøm (2006): A CGE model of induced technological change: A detailed model description, Documents 2006/11, Statistics Norway. http://www.ssb.no/emner/10/03/doc_200611/doc_200611.pdf Bye, B., T. Fæhn, and T.R. Heggedal, (2007): Welfare and growth impacts of innovation policies in a small, open economy: an applied general equilibrium study, Discussion paper 510, Statistics Norway. Clerides, S. K. S. Lach and J. R. Tybout (1998): Is learning by exporting important? Micro-dynamic evidence from Colombia, Mexico and Marocco, The Quarterly Journal of Economics, 113/3, 903-947. Coe, D.T. and E. Helpman (1995): International R&D spillovers, European Economic Review 39, 859-887.
23
Cohen, W. M. and D. A. Levinthal (1989): Innovation and learning: The two faces of R&D, Economic Journal 99 (September), 569-596. Crespo, J., C. Martin, and F.J. Velázquez (2002): International technology diffusion through imports and its impact on economic growth, European Economy Group, Working Paper 112/2002, Universidad Compultense de Madrid Damijan, J.P., S. Polanec and J. Prasnikar (2004): Self-selection, export market heterogeneity and productivity improvements: Firm-level evidence form Slovenia, LICOS Discussion Papers 148/2004, Katholieke Universiteit Leuven, Belgium. Delgado, M., Farinas, J., & Ruano, S. (2002). Firm productivity and export markets: A non-parametric approach. Journal of International Economics, 57, 392–422. Diao, X., T. Roe and E. Yeldan (1999): Strategic policies and growth: An applied model of R&D-driven endogenous growth, Journal of Development Economics 60, 343-380. Diao, X., J. Rattsø and H.E. Stokke (2006): Learning by exporting and structural change: A Ramsey growth model of Thailand, Journal of Policy Modeling 28, 293-306. ECON (2001): Støtte til internasjonalisering av næringslivet, Research note no. 46/01, Oslo. Fagerberg, J., D. C. Mowery, and R. R. Nelson (2004). The Oxford Handbook of Innovation,
Oxford University Press
Fernandes, A. and Isgut, A. (2005): Learning by doing, learning by exporting, and productivity: Evi-dence from Columbia. Mimeo: Wesleyan University and World Bank. Gerschenkron, A. (1962): Economic Backwardness in Historical Perspective, Belknap Press, Cambridge, MA. Greenaway D. and R. Kneller (2007): Firm Heterogeneity, Exporting and Foreign Direct Investment, Economic Journal, 117 (February), F134–F161 Griffith R., S. Redding and J.Van Reenen (2004), Mapping the two faces of R&D: productivity growth in a panel of OECD industries, The Review of Economics and Statistics 86, 883-895. Grilliches, Z. (1995): R&D and Productivity: Econometric Results and Measurement Issues, In P.
Stoneman (ed): Handbook of the Economics of Innovation and Technical Change, Blackwell: Oxford.
Grünfeld, L.A. (2002): International R&D spillovers and the effect of absorptive capacity, an empirical study, Working paper no 630, Norwegian Institute of Foreign Affairs, Oslo, Norway. Holmøy, E. and T. Hægeland (1997): Aggregate Productivity Effects of Technology Shocks in a Model of Heterogeneous Firms; the Importance of Equilibrium Adjustments; Discussion Papers 198, Statistics Norway. Jones, C. I. (1995): R&D based models of economic growth, Journal of Political Economy 193, 759-84.

24
Jones, C.I. and Williams, J.C. (1998): Measuring the social returns to R&D, Quarterly Journal of Economics 113, 1119-1135 Jones, C. I. (1999): Growth: With or Without Scale Effects, The American Economic Review 89, 139-144. Jones, C. I. and J.C. Williams (2000): Too Much of a Good Thing? The Economics of Investment in R&D, Journal of Economic Growth 5, 65-85. Keller, W. (2002): Geographic Localization of International Technology Diffusion, American Economic Review 92, 120–42. Keller, W. (2004): International Technology Diffusion, Journal of Economic Literature XLII, 752-782. Karpaty P., and L. Lundberg (2004): Foreign Direct Investment and Productivity spillovers in Swedish Manufacturing., WP 2/2004, Örebro University, Department of Economics. Klette, T.J. (1999): Market Power, scale economies and productivity: Estimates from a panel of establishment data. Journal of Industrial Economics 47, 451-476. Leahy, D. and J.P. Neary (1999): R&D spillovers and the case for industrial policy in an open economy, Oxford Economic Papers 51, 40-59. Lin, H. C. and B. Russo (2002): Growth Effects of Capital Income Taxes: How much does Endogenous Innovation Matter? Journal of Public Economic Theory 4, 613-640. Lucas, R. (1988): On the Mechanisms of Development Planning, Journal of Monetary Economics 22 (1), 3-42. Norrbin, S. C. (1993): The Relationship Between Price and Marginal Cost in U.S. industry: A Contradiction, Journal of Political Economy 101, 1149-1164 Norwegian Ministry of Finance (2004): Perspektivmeldingen 2004 – utfordringer og valgmuligheter for norsk økonomi (Perspectives 2004 - challenges and options for the Norwegian economy), St.meld. no. 8. Pottelsberghe, B. van and F. Lichtenberg (2001): Does Foreign Direct Investment Transfer Technology Across Borders?," The Review of Economics and Statistics, 83(3), 490-497. Romer, P. M. (1986): Increasing Returns and Long-Run Growth, Journal of Political Economy 94 (5), 1002-37. Romer, P. (1990): Endogenous Technological Change, Journal of Political Economy 94, 1002-1037. Russo, B. (2004): A cost-benefit analysis of R&D tax incentives, Canadian Journal of Economics 37, 313-335. Sen, P. and S.J. Turnovsky (1989): Deterioration of the terms of trade and capital accumulation: a re-examination of the Laursen-Metzler effect, Journal of International Economics 26, 251-270.

25
Steger, T. M. (2005): Welfare implications of non-scale R&D-based growth models, Scandinavian Journal of Economics 107(4), 737-757.
Warda J. (2005): Tax treatment of business investments in intellectual assets: an international comparison. OECD DSTI/STP/TIP 2005; 13

26
Appendix A
Production activities
Other Products and Services Traditional Manufacturing Polluting Transport Services Non Polluting Transport Services Research and development (R&D) R&D based Capital Transport Oils Heating Fuels Other Ordinary Machinery Building of Ships, Oil Drilling Rigs, Oil Production Platforms etc. Construction, excl. of Oil Well Drilling Ocean Transport - Foreign, Services in Oil and Gas Exploration Crude Oil Natural Gas Pipeline Transport of Oil and Gas Production of Electricity Wholesale and Retail Trade Government Input Activities
27
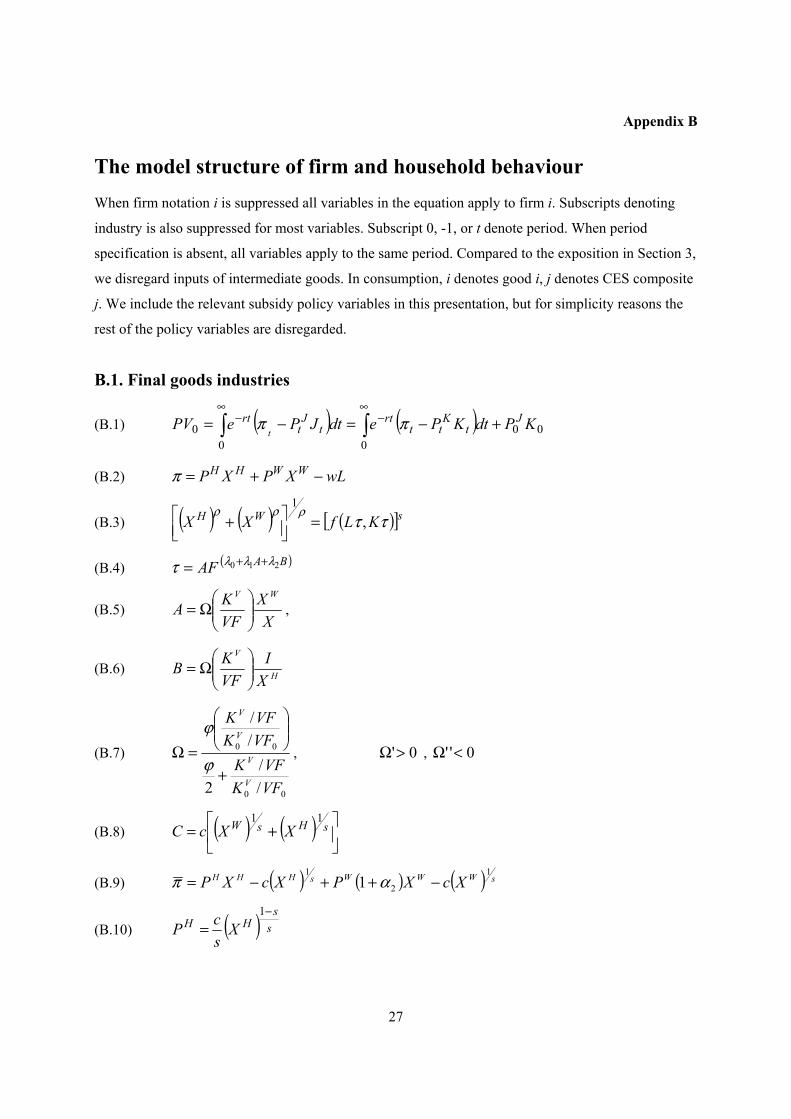
Appendix B
The model structure of firm and household behaviour When firm notation i is suppressed all variables in the equation apply to firm i. Subscripts denoting
industry is also suppressed for most variables. Subscript 0, -1, or t denote period. When period
specification is absent, all variables apply to the same period. Compared to the exposition in Section 3,
we disregard inputs of intermediate goods. In consumption, i denotes good i, j denotes CES composite
j. We include the relevant subsidy policy variables in this presentation, but for simplicity reasons the
rest of the policy variables are disregarded.
B.1. Final goods industries
(B.1) ( ) ( ) 0000
0 KPdtKPedtJPePV Jt
Ktt
rtt
Jt
rtt
+−=−= ∫∫∞
−∞
− ππ
(B.2) wLXPXP WWHH −+=π
(B.3) ( ) ( ) ( )[ ]sWH KLfXX ττρρρ
,1
=⎥⎦⎤
⎢⎣⎡ +
(B.4) ( )BAAF 210 λλλτ ++=
(B.5) X
XVFKA
WV
⎟⎟⎠
⎞⎜⎜⎝
⎛Ω= ,
(B.6) H
V
XI
VFKB ⎟⎟
⎠
⎞⎜⎜⎝
⎛Ω=
(B.7)
00
00
//
2
//
VFKVFK
VFKVFK
V
V
V
V
+
⎟⎟⎠
⎞⎜⎜⎝
⎛
=Ωϕ
ϕ, 0'>Ω , 0'' <Ω
(B.8) ( ) ( ) ⎥⎦
⎤⎢⎣
⎡+= sHsW XXcC
11
(B.9) ( ) ( ) ( ) sWWWsHHH XcXPXcXP1
2
11 −++−= απ
(B.10) ( ) ss
HH XscP
−=
1
28
(B.11) ( ) ( ) ss
WW Xs
cP−
+=
1
21 α
(B.12) ρ/1=s
(B.13) ( ) ( )
( ) ( )⎟⎠⎞⎜
⎝⎛
−⎟⎠⎞⎜
⎝⎛ −⎟
⎠⎞⎜
⎝⎛ −
⎥⎥⎥⎥
⎦
⎤
⎢⎢⎢⎢
⎣
⎡
⎟⎟⎠
⎞⎜⎜⎝
⎛
−−+⎟
⎟
⎠
⎞
⎜⎜
⎝
⎛=
11)1(
11
KK
KK
KK
KM
V
KMKM
M
KMKK
K
σσ
σσ
σσ
δδ
δδ
(B.14) ( )( ) ( )1
1
1 −
=
−
⎥⎦
⎤⎢⎣
⎡= ∑KV
KV
KVKV
i
R
i
VV KKσ
σ
σσ
(B.15) ( )( ) ( )KVKV
R
i
KVi
KV PPσσ −
=
−
⎥⎦
⎤⎢⎣
⎡= ∑1
1
1
1
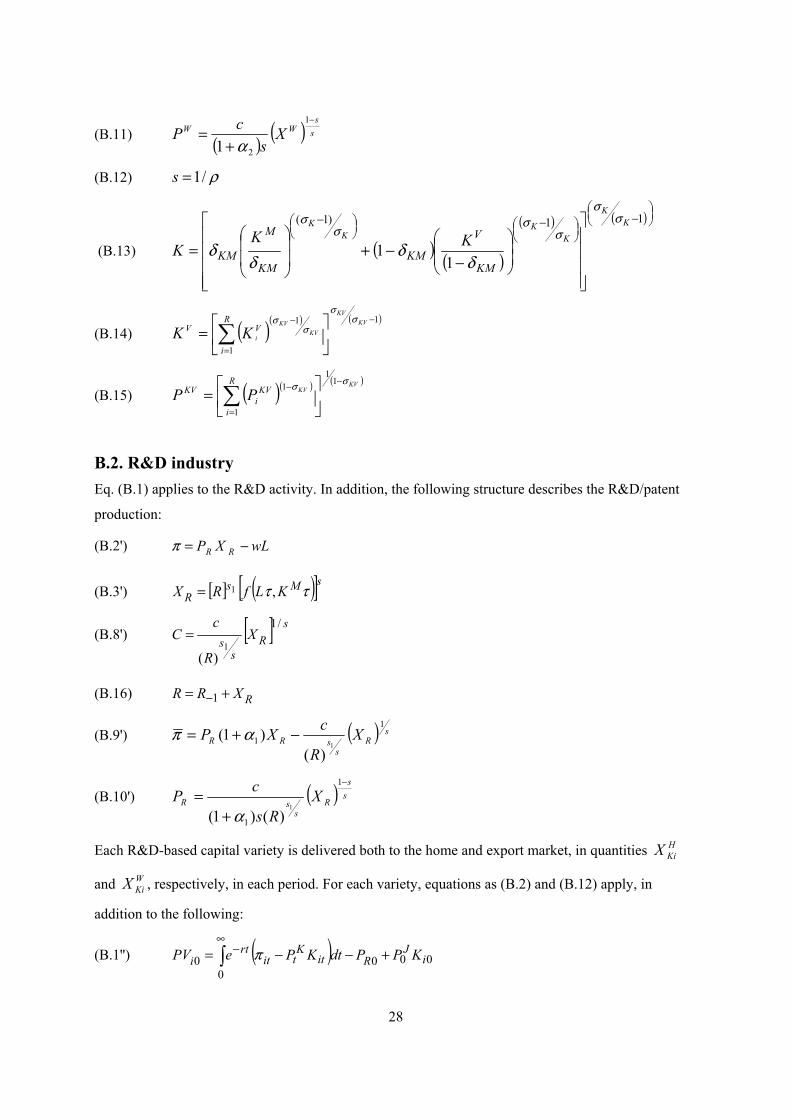
B.2. R&D industry Eq. (B.1) applies to the R&D activity. In addition, the following structure describes the R&D/patent
production:
(B.2') wLXP RR −=π
(B.3') [ ] ( )[ ]sMsR KLfRX ττ ,1=
(B.8') [ ] sR
ss X
R
cC
/1
1)(
=
(B.16) RXRR += −1
(B.9') ( ) sR
ssRR X
R
cXP1
1 1
)()1( −+= απ
(B.10') ( ) ss
Rs
sR XRs
cP−
+=
1
1
1
)()1( α
Each R&D-based capital variety is delivered both to the home and export market, in quantities HKiX
and WKiX , respectively, in each period. For each variety, equations as (B.2) and (B.12) apply, in
addition to the following:
(B.1'') ( ) 0000
0 iJ
RitK
titrt
i KPPdtKPePV +−−= ∫∞
− π
29
(B.3'') ( ) ( )[ ] ( )[ ]sMii
WKi
HKi KLfXX ττρρρ ,
1
=+
(B.8'') ( ) ( ) ⎥⎦⎤
⎢⎣⎡ += sH
KisW
Kii XXcC11
(B.9'') ( ) ( ) ( ) sWKi
WKi
WK
sHKi
HKi
HKi
HKii XcXPXcXXP
1
3
1)1( ⋅−++⋅−= απ
(B.10'') ( ) ss
HKiKi
HKi X
scmP
−
=1
(B.17) HKi
HKi
HKi
HKi
Ki XP
PX
∂∂
−=ε
(B.18) 11 −
=−
=KV
KV
Ki
KiKim
σσ
εε
(B.11'') ( ) ss
WKi
WK X
scP
−
+=
1
3 )1( α
(B.19) ( )dteP trtH
R ∫∞
−=0
0 π
B.3. Consumer behaviour
(B.20) ( ) dteduU tt
ρ−∞
∫=0
0
(B.21) ⎟⎟⎠
⎞⎜⎜⎝
⎛ −
−= d
d
ddud
dt
σσ
σσ
1
1)(
(B.22) dtedPW rtt
Dt
−∞
∫=0
0
(B.23) [ ] dDtt Pd σμ −⋅=
(B.24) ttt ndD )1( +=
(B.25) Djt
jtD
it
Djt
iit PVD
PP
Djσ
ω ⎟⎟⎠
⎞⎜⎜⎝
⎛= 0.
(B.26) ( ) HIHIHI Iii
Hii
Di PPP σσσ υυ −−− +−= 1
1)1()1( )())(1(
(B.27) ( )( )gnD
D
t
t ++=+ 111

30
B.4. Variables
0PV The present value of the representative firm
π Operating profit
JP Price index of the investment good composite
J Gross investment
KP User cost index of capital composite
K Capital composite
XH Output of final good firm delivered to the domestic market
XW Output of final good firm delivered to the export market
X Total industry output
PH Domestic market price index of final good
PW World market price index of final good
w Wage rate
L Labour
τ Endogenous factor productivity change through absorption of international spillovers
VK R&D-based capital
MK Other ordinary capital
C The variable cost function
c Price index of the CES-aggregate of production factors
π Modified profit (the period-internal maximand of firms)
R Accumulated number of patents/R&D-based capital varieties
RX Production of patents
ViK R&D-based capital variety i
KViP User cost of R&D-based capital variety i
HRP Shadow price of the patent
HKiX Output of R&D-based capital variety firm i delivered to the domestic market

31
WKiX Output of R&D-based capital variety firm i delivered to the export market
HKiP Domestic market price index of R&D-based capital variety i
WKP World market price index of R&D-based capital varieties
PKV User cost index of the R&D-based capital composite
0U Discounted period utilities of a representative consumer
d Consumption of a representative consumer
PD Consumer price index
r Nominal interest rate
W0 Consumer's current non-human wealth + present value of labour income + net transfers
μ Marginal utility of wealth
D Aggregate consumption
n Annual population growth rate
Di Demand for consumer good i
VDj Aggregate expenditure on CES aggregate j
g Growth rate
I Import
PI Import price
P Purchaser price, Armington composite good
Α The absorption elasticity’s export-dependent term
Β The absorption elasticity’s import-dependent term
Ω The absorptive capacity wrt. spillovers from abroad
AF Productivity level abroad
32
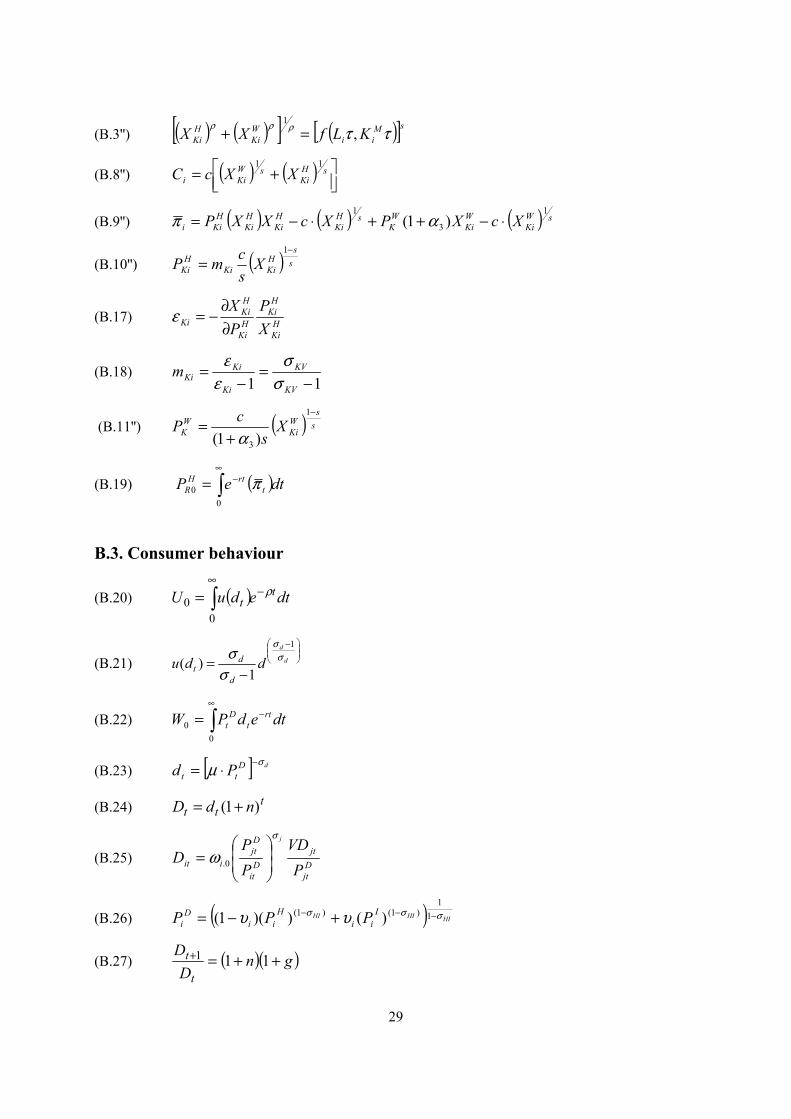
B.5. Parameters Value
s Scale elasticity 0.83
ρ Transformation parameter between deliveries to the domestic and the
foreign market
1.2
Kσ Elasticity of substitution between variety-capital and ordinary capital 1.5
KMδ Calibrated share of other ordinary capital in the capital composite industry-specific
KVσ Uniform elasticity of substitution applying to all pairs of capital varieties 3.0
S1 Elasticity of domestic spillovers 0.5
Kiε Domestic demand elasticity for capital variety i 3.0
Kim Mark-up factor for variety firm i 1.5
θ Consumer's rate of time preferences 0.04
dσ Intertemporal elasticity of substitution 0.3
0.iω Calibrated budget share of good i in CES aggregate j in period 0 good-specific
iσ Elasticity of substitution between the two consumer goods in CES
aggregate j
0.5 for all j
HIσ Armington elasticity between imported and domestic produced varieties 4.0
ν Initial import share in the Armington aggregate good and user-
specific
λ0 Autonomous absorption effect 0.25
λ 1 Influence of the export term on absorption 0.15
λ 2 Influence of the import term on absorption 0.075
ϕ Parameter in the Ω - function 4.0
α1 R&D subsidy scenario-specific
α2 General subsidy to all export deliveries scenario-specific
α3 Subsidy to export deliveries of R&D-based capital scenario-specific
33
Figure B.1. The nested structure of the production technology
GrossProduction
(X)
VariableInput(VF)
OtherInput(S)
Buildings and Constructions
(KB)
Various Material Inputs
(V)
ModifiedRealValueAdded
(RT)
Labour and MachineryServ.
(R)
Transport Services
(T)
PollutingTransport
(P)
Non-PollutingTransport
(TN)
Machinery Services
(N)
Labour(L)
PollutingCommercial
Transport (TP)
Own Transport
(O)
Machinery(K)
Energy(EM)
Electricity (E)
FossilFuels
(F)
Transport Oil and Gasoline
(ET)
TransportEquipment
(KT)
Capital Varieties
(KV)
Other Machinery
(KM)
Varieties (KV 1, ..., Kv R )
GrossProduction
(X)
VariableInput(VF)
OtherInput(S)
Buildings and Constructions
(KB)
Various Material Inputs
(V)
ModifiedRealValueAdded
(RT)
Labour and MachineryServ.
(R)
Transport Services
(T)
PollutingTransport
(P)
Non-PollutingTransport
(TN)
Machinery Services
(N)
Labour(L)
PollutingCommercial
Transport (TP)
Own Transport
(O)
Machinery(K)
Energy(EM)
Electricity (E)
FossilFuels
(F)
Transport Oil and Gasoline
(ET)
TransportEquipment
(KT)
Capital Varieties
(KV)
Other Machinery
Varieties (KV 1, ..., Kv R )
34
Figure B.2. The nested structure of consumption activities
Material consumption
Communication
Housing
Dwellings Energy
Electricity Fossil fuels
Other goods & services
Direct purchase abroad by resident
households
Private transport
User costs of cars
Petrol & car maintenance
Public transport
Polluting publictransport
Non-polluting public transport
Foreigners consumption
in Norway Material consumption
Communication
Housing
Dwellings Energy
Electricity Fossil fuels
Other goods & services
Domestic purchases
Direct purchase abroad by resident
households
Private transport
User costs of cars
Petrol & car maintenance
Public transport
Polluting publictransport
Non-polluting public transport
Foreigners consumption
in Norway
35
Appendix C
Calibration and parameters The model is calibrated to the 2002 Norwegian National Accounts. The elasticities of substitution in the
production technology range from 0.15 at the upper part of the nested tree to 0.5 further down in the nested
tree structure, see appendix B, figure B.1, and are in the range of empirical findings (Andreassen and
Bjertnæs, 2006). We have less empirical foundation for the substitution possibilities within the composite
of R&D-based capital and other machinery capital. We assume a relatively high substitution elasticity of
1.5, while the elasticity between the different R&D-based capital varieties is expected to be even higher and
set to 3.0, giving a mark-up factor of 1.5 for the domestic price of R&D-based capital varieties.16
The elasticities of scale are equal to 0.83 in all industries and fit econometric findings of moderate
decreasing returns to scale in Norwegian firms (Klette, 1999). The scale elasticity is at the lower end
of the estimates by Klette (1999), but is chosen in order to avoid unrealistic industrial specialisation
patterns.17 This implies that the elasticities of transformation between domestic and foreign deliveries
are equal to 4.9. The elasticities of substitution between domestic products and imported goods are
assumed equal to 4. The elasticity of scale related to previous knowledge is equal to 0.5, in order to
ensure decreasing spillover effects of the knowledge base, supported by both theoretical and empirical
findings (see Jones, 1995; 1999; Leahy and Neary, 1999).
In the scenarios, the exogenous growth factors are assumed to grow at constant rates. In most cases,
rates are set in accordance with the average annual growth estimates in the baseline scenario of
Norwegian Ministry of Finance (2004) that reports the governmental economic perspectives until
2050. The population growth is set to 0.4 per cent annually, in accordance with the expectations in
Norwegian Ministry of Finance (2004). Exogenous activities, like public consumption and output, are
also set in accordance with the governmental perspectives. The exogenous levels of offshore
investments and oil and gas exports result from a smoothing of their expected present values in the
16 This is in line with the Jones and Williams (2000) computations that exclude creative destruction (similarly to our model). Numerical specifications of Romer's Cobb Douglas production functions, as in Diao et al. (1999), Lin and Russo (2002), and Steger (2005), result in far larger mark-ups. Mark-ups of 1.5 are nevertheless in the upper bound of econometric estimates (Norrbin, 1993; Basu, 1996). Our main motivation for staying in the upper bound area is that we model industrial R&D as outsourced to a separate high-tech industry. Thus, R&D costs are ascribed to this industry, whereas the marginal costs of final goods industries exclude this part of the costs. This deviates from typical regressions of mark-ups, where marginal costs include all observed costs, including industrial R&D costs. 17 Because ρ=1/s, a larger elasticity of scale will imply a larger elasticity of transformation between domestic and foreign deliveries, 1/(1-ρ). If the elasticity of scale is close to 1 (constant returns to scale), the elasticity of transformation will be very high, implying practically no dispersion between domestic and foreign deliveries.
36
governmental perspectives. The smoothing is made to account for the economic significance of the
Norwegian oil and gas resources without introducing another source of dynamics into the growth path.
World market prices are assumed to increase 1.4 per cent annually. This is in the lower range of
exogenous price growth estimates in the governmental perspectives, and is chosen so that exogenous
inflationary impulses are more in line with internal impulses, which are dampened by the
consumption-smoothing features of the model. This provides us with endogenous developments of the
delivery ratios between the export and domestic markets that are more in line with those of the
governmental perspectives. The international nominal interest rate is 4 per cent. All policy variables
are constant in real terms at their 2002 levels.
In the governmental perspectives, total factor productivity growth is entirely exogenous and valued at,
on average, 1 per cent annually. Our model distinguishes between exogenous and endogenous
components. In line with empirical findings; see e.g. Coe and Helpman (1995) and Keller (2004), we
calibrate 5 per cent of the long-run domestic growth to stem from domestic innovation.18 The long run
in this context is 50-70 years from now, where the reference path obtains a stable growth period. The
assumed 5 per cent growth resulting from domestic innovation in this period forms a basis for
calibrating the 2002 level of accumulated knowledge, R0, which together with the remaining
parameters of the model determines the productivity growth from domestic knowledge accumulation.
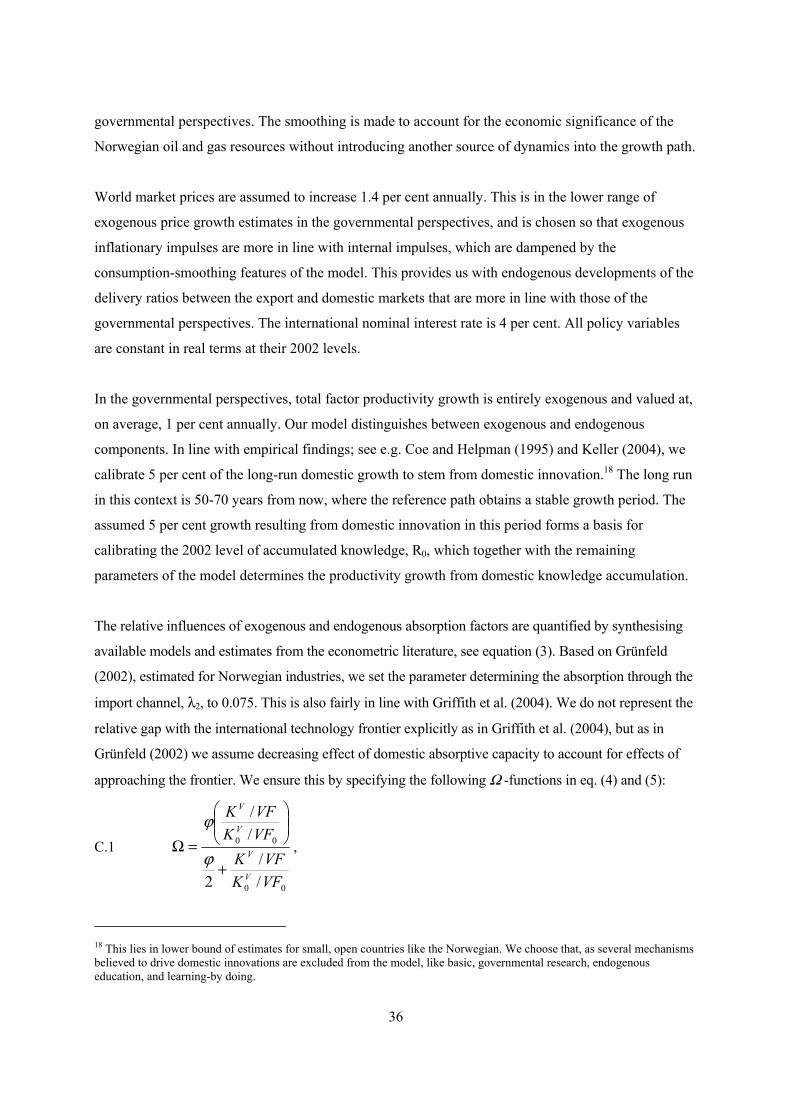
The relative influences of exogenous and endogenous absorption factors are quantified by synthesising
available models and estimates from the econometric literature, see equation (3). Based on Grünfeld
(2002), estimated for Norwegian industries, we set the parameter determining the absorption through the
import channel, λ2, to 0.075. This is also fairly in line with Griffith et al. (2004). We do not represent the
relative gap with the international technology frontier explicitly as in Griffith et al. (2004), but as in
Grünfeld (2002) we assume decreasing effect of domestic absorptive capacity to account for effects of
approaching the frontier. We ensure this by specifying the following Ω -functions in eq. (4) and (5):
C.1
00
00
//
2
//
VFKVFK
VFKVFK
V
V
V
V
+
⎟⎟⎠
⎞⎜⎜⎝
⎛
=Ωϕ
ϕ,
18 This lies in lower bound of estimates for small, open countries like the Norwegian. We choose that, as several mechanisms believed to drive domestic innovations are excluded from the model, like basic, governmental research, endogenous education, and learning-by doing.
37
where subscript 0 refers to values in the first year of the reference path, 2002. The historical import
channel impact in Coe and Helpman (1995) is also in the range of our estimate for λ2, when we adjust
for that they have not specified the influence of innovativeness.
Neither of the studies reported above include export as a channel of spillovers. Our main sources w.r.t
export effects are Alvarez and Lopez (2006), Delgado et al (2002) and Baldwin and Gu (2003). Even
when using conservative estimates, it is reasonable to assume that export is a considerably more
effective channel for spillovers than import. We include absorptive capacity effects in this term, too,
and use a λ1- parameter of 0.15, which is a doubling compared to the parameter for the import channel.
In addition to effects from imports and exports, the absorbed productivity equation, eqn. (3), includes
the influence on productivity from unexplained, exogenous drivers. These are captured through the λ0
parameter, which is set to 0.25. The autonomous contribution to growth is lower than in Coe and
Helpman (1995), since we regard more of the productivity effects as explained (through changes in
export and absorptive capacity). Some of our sources report industry-specific parameters, but we have
assumed common elasticities for all. The productivity level abroad, AF, is calibrated (dependent on
R0) so that long-run TFP growth arrives at levels comparable with the projections in Norwegian
Ministry of Finance (2004).
In the long run, i.e. 50-70 years from now, the stable GDP growth rate of the reference path amounts
to 1.6 per cent annually. The endogenous growth effects of innovation will asymptotically approach
zero, in line with the non-scale growth assumption (Jones, 1995). The endogenous absorptive capacity
effects also asymptotically approach zero, according to the decreasing effect of absorptive capacity. In
an infinite time horizon, growth will thus only depend on exogenous drivers. For technical reasons, we
have set all exogenous and endogenous growth drivers to zero in the far future (after about 100 years).
This ensures that the economy is eventually on a balanced growth path (steady state) and that this
growth path, with zero growth, satisfies the transversality conditions described in section 3.4. In
particular, equation (13) then implies that r=θ at all points in time.19
19 We have tested the significance of this assumption by varying at what time the zero growth is imposed. The relative effects of the different policy analyses appear independent of this timing, as do the growth rates within the stable period. Only the durability of the stable period is affected.