Embed Size (px)
Citation preview

Kristin Gaddis • Emerging Technologies Committee Breakout
06/14/13
1
BREEDING HEALTHIER CATTLE:
Using producer-recorded data to make genetic improvement in cattle health
KL Parker Gaddis
OUTLINE
• Introduction • Research
– Part 1: Data editing & validation – Part 2: Genetic analysis – Part 3: Genomic analysis
• Discussion & Conclusions
INTRODUCTION
Functional Traits
• Traits that increase efficiency by decreasing input costs as opposed to increasing output of products
• Examples:
– Health – Fertility – Longevity
Functional Traits
• Are lowly heritable in general • Have high economic value
Percentage of total variance attributable to genetics is small.
Percentage of total variance attributable to environmental factors is large.
Health Traits
• Health can have a large impact on overall productivity and profitability – Dairy cattle: milk production, fertility, etc. – Beef cattle: milk production, fertility, etc.
• We need to focus attention on improving the health and welfare of cows, as well as production, in order to remain competitive with other countries

Kristin Gaddis • Emerging Technologies Committee Breakout
06/14/13
2
Health Traits
• Healthy cows are more profitable
– Less management costs – Less veterinary costs – Less replacement costs
Health Traits
• Selection can be difficult – Not easily measurable – Subjective – Many different traits – Multitude of environmental factors
• Management, nutrition, weather, etc., etc.
• BUT, improvements can be permanent
Health Traits
• Phenotypes – No unified or mandated recording system in US
• Dairy cattle – USDA Animal Improvement Programs Laboratory
created a data format (Format 6) to facilitate the collection and exchange of health events for research purposes
Format 6
• Up to 20 events can be stored for each record • Currently 20 standardized health event codes
– Ex) MAST, RETP, LAME
• 4 general management codes – Ex) LOCO, TEMP
• Includes a field for producer remarks and details
RESEARCH
Research
• Main Objective: Investigate the use of producer-recorded data via on-farm management software programs for genetic improvement of health traits in the US dairy cattle population
• Use this data to examine relationships among disease traits and between disease and production traits
• Develop optimized genomic selection strategies
Kristin Gaddis • Emerging Technologies Committee Breakout
06/14/13
3
Part 1: Data editing & validation
• Can producer-recorded data serve as reliable data to use for genetic analyses?
• Do these data reflect the incidences of diseases that are estimated in designed epidemiological studies?
• Do the phenotypic relationships between diseases reflect what we expect based on prior biological knowledge?
Data Editing
• Two datasets available
– Health data (Format 6): 8,361,900 raw records – Production data (Format 4): 1,840,902 raw records
Dat
a Ed
iting
EliminateMinimum Constraint
HY has ! 1 incident reported
HY has ! 5 cows
YES
Maximum Constraint
Incidence ! µ + 2!
YES
Retain
NO
NO
NO
YES
Within US
General Editing
Cow record with identification
Lactations 1 - 5
Lactation !365 days
Lactation not terminated (termination code = 0)
HY = herd-year
Health Event Incidences
Lactational Incidence Rate • Calculated for events with
short periods of risk
Incidence Density • Calculated for events with
long periods of risk
LIR = Number of first occurrences of a specific disease in a lactationNumber of lactations at risk
ID = Number of first occurrences of a specific diseaseNumber of cows at risk starting lactation + Number of cows at risk ending lactation
2!"#
$%&
Kelton et al., 1998
Literature Incidence
• Incidences gathered from literature ranged from 1979 to 2011
• Many differences make direct comparison difficult – Experimental design, population, environment, health
event definitions, etc. • Lend support to values calculated from
producer-recorded data 0 10 20 30 40
Literature Incidences by Health Event
Reported Literature Incidence
CALC
CYST
DIAR
DIGE
DSAB
DYST
KETO
LAME
MAST
METR
RESP
RETP
* Incidence calculated from producer-recorded data
Retained placenta
Respiratory problems
Metritis
Mastitis
Lameness
Ketosis
Dystocia
Displaced abomasum
Digestive problems
Diarrhea
Cystic ovaries
Hypocalcemia
Kristin Gaddis • Emerging Technologies Committee Breakout
06/14/13
4
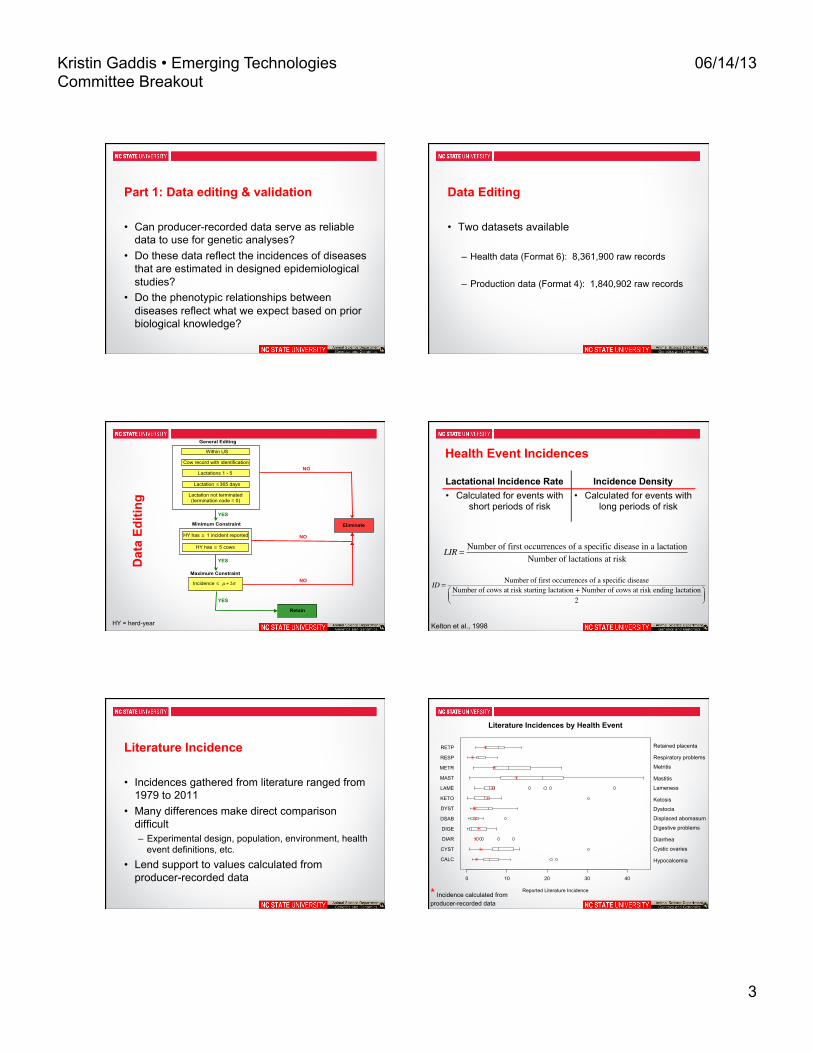
Relationship Analysis
• Do these data exhibit relationships between health events that would be expected?
• Does an animal experiencing health event X have increased probability of experiencing health event Y later?
• Does an animal experiencing health event X have increased probability of experiencing a second incidence of health event X later?
Relationship Analysis
• Path diagrams allow putative routes of causation to be developed from an average timeline of occurrence – Mean days in milk (DIM)
• Most health events occur within the first 60 days post-parturition
Relationship Analysis
• Health event data is binary 0/1
• Generalized linear model – logistic regression ! = X"
!!
= logit of observing health event of interest
= vector of fixed effects (herd, parity, year, breed, season)
= corresponding incidence matrix X
Relationship Analysis
• Probability of observing health event Yi is πi
• Odds of observing health event = • Coefficient estimates from logistic regression
are equal to log odds ratios
! i
1"! i( )
! = log" i 1#" i( )" j 1#" j( )
Relationship Analysis
• Odds ratio = 1.0 – No association between the independent and
dependent variable
• Odds ratio > 1.0 – Further from 1.0 indicate stronger associations
Rel
atio
nshi
p A
naly
sis

Kristin Gaddis • Emerging Technologies Committee Breakout
06/14/13
5
0 to 60 DIM Reproductive
Digestive
Mammary
Respiratory
Locomotive
Relationship Analysis
DSAB(25)
RETP(2)
KETO(14)
DYST(1)
2.62
15.50
Relationship Analysis Results
2.14
2.441.22
2.30 2.6215.50
2.36
8.37
1.69
2.00
3.67
2.401.80
1.83
3.58
2.13
2.16
1.47
1.70
2.60
3.00
1.65
2.60
1.28
1.40
2.38
1.52
DYST(1)
RETP(2)
KETO(14)
CALC(27)
DSAB(25)
METR(27)
DIAR(46)
DIGE(50)
RESP(56)MAST
(82)REPR(74)
1.23
Reproductive
Digestive
Mammary
Respiratory
Miscellaneous
Locomotive
0 to 60 DIM
Relationship Analysis
• 2nd analysis completed for mastitis & lameness
– More likely to occur multiple times in a single lactation
– Previous incidences included as predictors in the
models
Relationship Analysis
MASTITIS 61-90 DIM 91-150 DIM 0 to 60 DIM OR = 2.94 0 to 90 DIM OR = 2.83
LAMENESS 61-90 DIM 91-150 DIM 0 to 60 DIM Not significant 0 to 90 DIM OR = 1.93
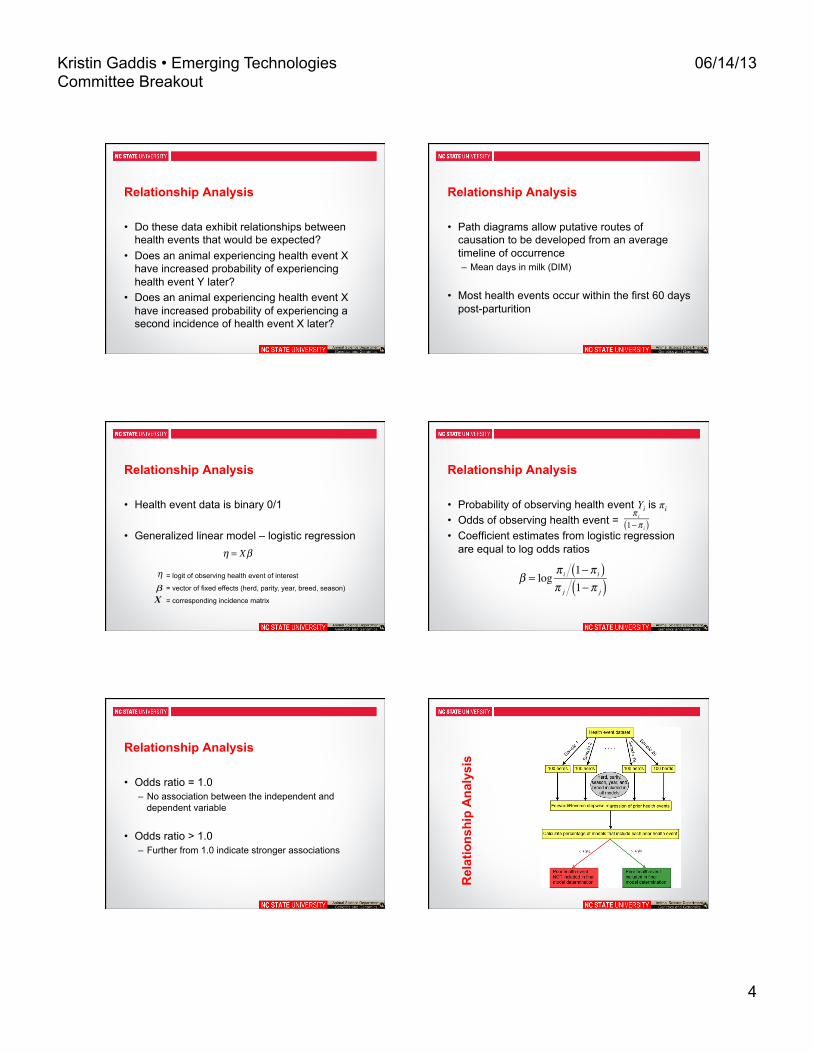
Part 2: Genetic Analyses
• Do health traits have a genetic component?
• Would genetic selection be possible?
• What are the heritabilities of diseases calculated using producer-recorded data?
Genetic Analyses
• Estimate heritabilities for common health events occurring from 1996 to 2012
• Similar editing was applied – US records – Parities 1 through 5 – Minimum/maximum constraints
Kristin Gaddis • Emerging Technologies Committee Breakout
06/14/13
6
Genetic Analyses • Sire model using ASReml
Gilmour et al., 2009
! = X" + Zhh + Zss
= logit of observing health event of interest = vector of fixed effects (parity, year-season) X = incidence matrix of fixed effects h = random herd-year effect s = random sire effect = incidence matrix of corresponding random effect
!!
Zh,Zs
s ~ N 0,A! s2( )( )
Genetic Analyses
1st lactation only Lactations 1 to 5
Health Event Heritability (± SE)
Cystic ovaries 0.03 (0.010) Digestive problem 0.04 (0.028) Displaced abomasum 0.30 (0.042) Ketosis 0.08 (0.019) Lameness 0.01 (0.006) Mastitis 0.05 (0.009) Metritis 0.05 (0.009) Reproductive problem 0.03 (0.009) Retained placenta 0.09 (0.021)
Health Event Heritability (± SE)
Cystic ovaries 0.03 (0.006) Digestive problem 0.07 (0.018) Displaced abomasum 0.22 (0.024) Ketosis 0.06 (0.012) Lameness 0.03 (0.005) Mastitis 0.05 (0.006) Metritis 0.06 (0.007) Reproductive problem 0.03 (0.007) Retained placenta 0.08 (0.012)
Genetic Analyses
0
5
10
15
20
25
30
35
CYST DIGE DSAB KETO LAME MAST METR REPR RETP
Lacta%onal Incidence Rate for 10 Best and Worst Sires’ Daughters
Lact
atio
nal I
ncid
ence
Rat
e (%
)
Health Event LIR for 10 worst sires’ daughters
LIR for 10 best sires’ daughters
Genetic Analyses
• Multiple trait analysis using a threshold sire model in thrgibbs1f90
Tsuruta & Misztal, 2006
! = X" + Zhh + Zss = unobserved liabilities to the diseases = vector of fixed effects (parity, year-season) X = incidence matrix of fixed effects h = random herd-year effect s = random sire effect = incidence matrix of corresponding random effect
!!
Zh,Zs
s ~ N 0,A! s2( )( )
Genetic Analyses
• Traits included in the multiple-trait analysis:
– Cystic ovaries – Displaced abomasum – Ketosis – Lameness – Mastitis – Metritis – Retained placenta
Genetic Analysis Mastitis Metritis Lameness
Retained placenta
Cystic ovaries Ketosis
Displaced abomasum
Mastitis 0.10 (0.09, 0.12)
Metritis -0.30 (-0.45, -0.15)
0.04 (0.03, 0.05)
Lameness -0.29 (-0.46, -0.11)
0.21 (0, 0.45)
0.019 (0.01,0.03)
Retained placenta
0.01 (-0.14, 0.16)
0.78 (0.68, 0.88)
-0.14 (-0.36, 0.07)
0.05 (0.03, 0.06)
Cystic ovaries
-0.09 (-0.29, 0.13)
-0.17 (-0.37, 0.06)
-0.19 (-0.40, -0.06)
-0.12 (-0.34, 0.12)
0.026 (0.02, 0.03)
Ketosis
-0.28 (-0.47, -0.07)
0.45 (0.26, 0.64)
0.08 (-0.17, 0.34)
0.10 (-0.17, 0.35)
-0.15 (-0.367, 0.13)
0.08 (0.05, 0.11)
Displaced abomasum
0.005 (-0.15, 0.17)
0.44 (0.28, 0.60)
-0.10 (-0.29, 0.09)
0.06 (-0.12, 0.25)
-0.10 (-0.31, 0.10)
0.81 (0.70, 0.92)
0.13 (0.11, 0.16)
Estimated heritabilities (95% HPD) on diagonal and estimated genetic correlations (95% HPD) below diagonal.

Kristin Gaddis • Emerging Technologies Committee Breakout
06/14/13
7
Part 3: Genomic Analyses
• Will genomic information improve our ability to select healthier animals when using producer-recorded data?
• Does the reliability of breeding values significantly increase when using genomic information with health data?
Genomic Analyses
= genetic gain each year Reliability = how certain we are about an animal’s estimate of genetic merit (genomics can increase!) Selection intensity = how “choosy” we are when making mating decisions (management can increase!) Genetic variance = variation in the population due to genetics Generation interval = time between generations (genomics can decrease!)
!Gyear =reliability " selection intensity " genetic variance
generation interval
!Gyear
X'X X'ZZ'X Z'Z +!A-1
"
#$$
%
&''bu
"
#$$
%
&''=
X'yZ'y
"
#$$
%
&''
Genomic Analyses
• Single-step method: allows incorporation of pedigree and genomic information
• Traditional BLUP analysis:
Replace A-1 with blended H-1 matrix
Genomic Analyses
• Blended H-1 matrix:
H-1 = A-1 +0 00 G-1 -A22
-1
!
"##
$
%&&
G = relationship matrix based on genomic information A22 = additive relationship matrix between genotyped animals
Legarra et al., 2009
Genomic Analyses
• Benefits of single-step: – Variance components and weights can be estimated
simultaneously – Easy to implement for complex data and models
• Disadvantage of single-step:
– Can be computationally expensive
Aguilar et al., 2010
Genomic Analyses
• 50K SNP data available for 7,883 bulls
• Single-step methodology was employed to include genomic information using thrgibbs1f90
Tsuruta & Misztal, 2006

Kristin Gaddis • Emerging Technologies Committee Breakout
06/14/13
8
Genomic Analyses
• Multiple trait analysis using a threshold sire model
! = X" + Zhh + Zss = unobserved liabilities to the diseases = vector of fixed effects (parity, year-season) X = incidence matrix of fixed effects h = random herd-year effect s = random sire effect = incidence matrix of corresponding random effect
!!
Zh,Zs
s ~ N 0,H! s2( )( )
Genomic Analyses
• Preliminary results:
Mastitis Metritis Lameness Mastitis 0.09 (0.07, 0.10) Metritis -0.27 (-0.38, -0.11) 0.04 (0.039, 0.05) Lameness -0.15 (-0.33, 0.14) -0.02 (-0.21, 0.14) 0.01 (0.004, 0.014)
Select estimated heritabilities (95% HPD) on diagonal and estimated genetic correlations (95% HPD) below diagonal.
Genomic Analyses
• Comparison of reliability calculated with and without genomic information
Event EBV Reliability GEBV Reliability Percent Increase Displaced abomasum
0.30 0.40 33%
Ketosis 0.28 0.35 25% Lameness 0.28 0.37 32% Mastitis 0.30 0.41 37% Metritis 0.30 0.41 37% Retained placenta 0.29 0.38 31%
DISCUSSION & CONCLUSIONS So what?
Discussion & Conclusions
• Data Editing & Validation – Evidence for the usefulness of on-farm recorded
health information – Incidence rates were similar to those in literature – Improvements could be made with more complete
data recording and standardized event definitions
Discussions & Conclusions
• Genetic Analyses – Health events do have a genetic component – Low heritabilities – Reasonable improvements must be expected
• Also largely influenced by environmental factors • Focus on long-term results
Kristin Gaddis • Emerging Technologies Committee Breakout
06/14/13
9
Discussion & Conclusions
• Genomic Analyses – Genomic information can improve reliability of
breeding value estimates – Genomic information can also decrease the
generation interval, allowing progress to be made in shorter time periods
Discussion & Conclusions
• Herd health is closely related to productivity and profitability
• Healthier cows are more profitable cows!
Discussion & Conclusions
• Many phenotypes are needed
• Keep good records and focus on long-term results
• Record events as consistently as possible
Acknowledgements Advisors: Christian Maltecca and Joe Cassady John Cole, USDA AIPL John Clay, DRMS Select Sires ABS Global References Aguilar, I., I. Misztal, D.L. Johnson, a Legarra, S. Tsuruta, and T.J. Lawlor. 2010. Hot topic: a
unified approach to utilize phenotypic, full pedigree, and genomic information for genetic evaluation of Holstein final score. Journal of dairy science. 93:743–52. doi:10.3168/jds.2009-2730.
Gilmour, A.R., B.J. Gogel, B.R. Cullis, and R. Thompson. 2009. ASReml User Guide Release 3.0. Kelton, D. F., K. D. Lissemore, and R. E. Martin. 1998. Recommendations for recording and
calculating the incidence of selected clinical diseases of dairy cattle. J Dairy Sci 81(9):2502-2509
Legarra, A., I. Aguilar, and I. Misztal. 2009. A relationship matrix including full pedigree and genomic information. J. Dairy Sci. 92:4656–4663. doi:10.3168/jds.2009-2061.
Tsuruta, S., and I. Misztal. 2006. THRGIBBS1F90 for estimation of variance components with threshold linear models. In Proc. 8th World Congr. Genet. Appl. Livest. Prod. Belo Horizonte, Brazil. Commun. 27–31.
*Images from Google Images
QUESTIONS? Thank you!