Embed Size (px)
Citation preview
Brazil Fast Food Corp.
Consolidated Interim Financial Information
for the quarterly period ended March 31, 2014
- 2 -
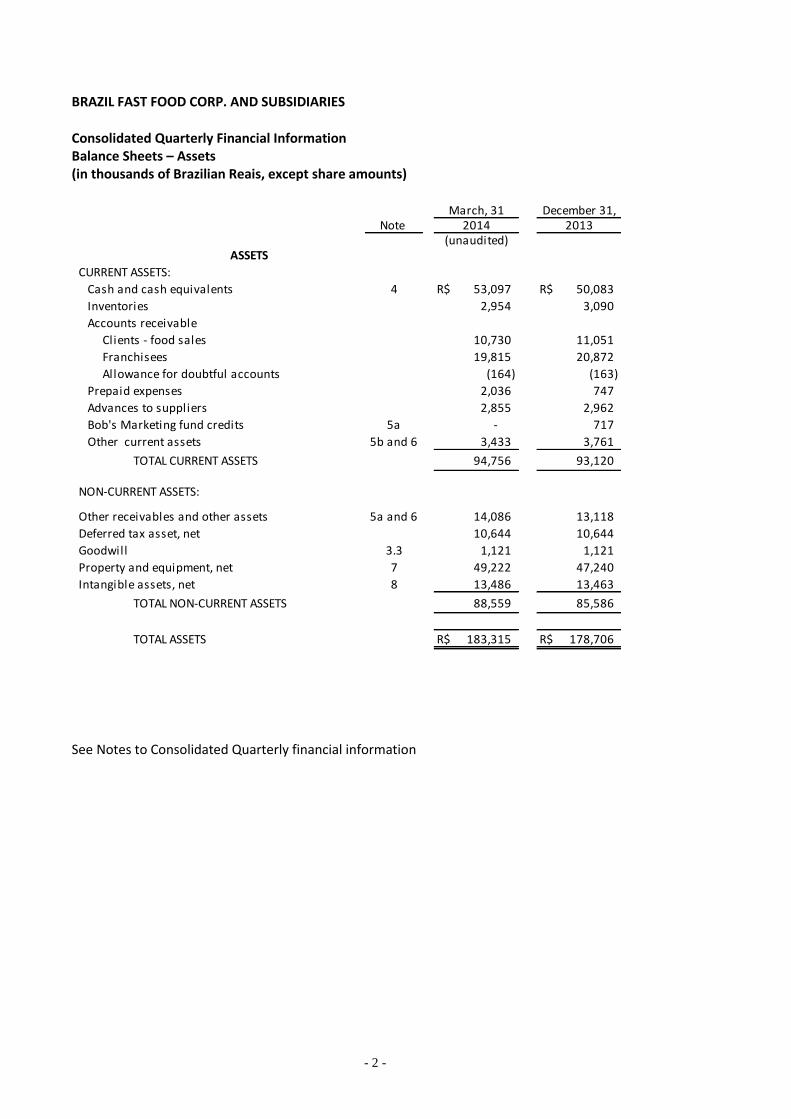
BRAZIL FAST FOOD CORP. AND SUBSIDIARIES
Consolidated Quarterly Financial Information Balance Sheets – Assets (in thousands of Brazilian Reais, except share amounts)
See Notes to Consolidated Quarterly financial information
Note
CURRENT ASSETS:
Cash and cash equivalents 4 R$ 53,097 R$ 50,083
Inventories 2,954 3,090
Accounts receivable
Clients - food sales 10,730 11,051
Franchisees 19,815 20,872
Allowance for doubtful accounts (164) (163)
Prepaid expenses 2,036 747
Advances to suppliers 2,855 2,962
Bob's Marketing fund credits 5a - 717
Other current assets 5b and 6 3,433 3,761
TOTAL CURRENT ASSETS 94,756 93,120
NON-CURRENT ASSETS:
Other receivables and other assets 5a and 6 14,086 13,118
Deferred tax asset, net 10,644 10,644
Goodwill 3.3 1,121 1,121
Property and equipment, net 7 49,222 47,240
Intangible assets, net 8 13,486 13,463
TOTAL NON-CURRENT ASSETS 88,559 85,586
TOTAL ASSETS R$ 183,315 R$ 178,706
March, 31 December 31,
(unaudited)ASSETS
2014 2013
- 3 -
BRAZIL FAST FOOD CORP. AND SUBSIDIARIES
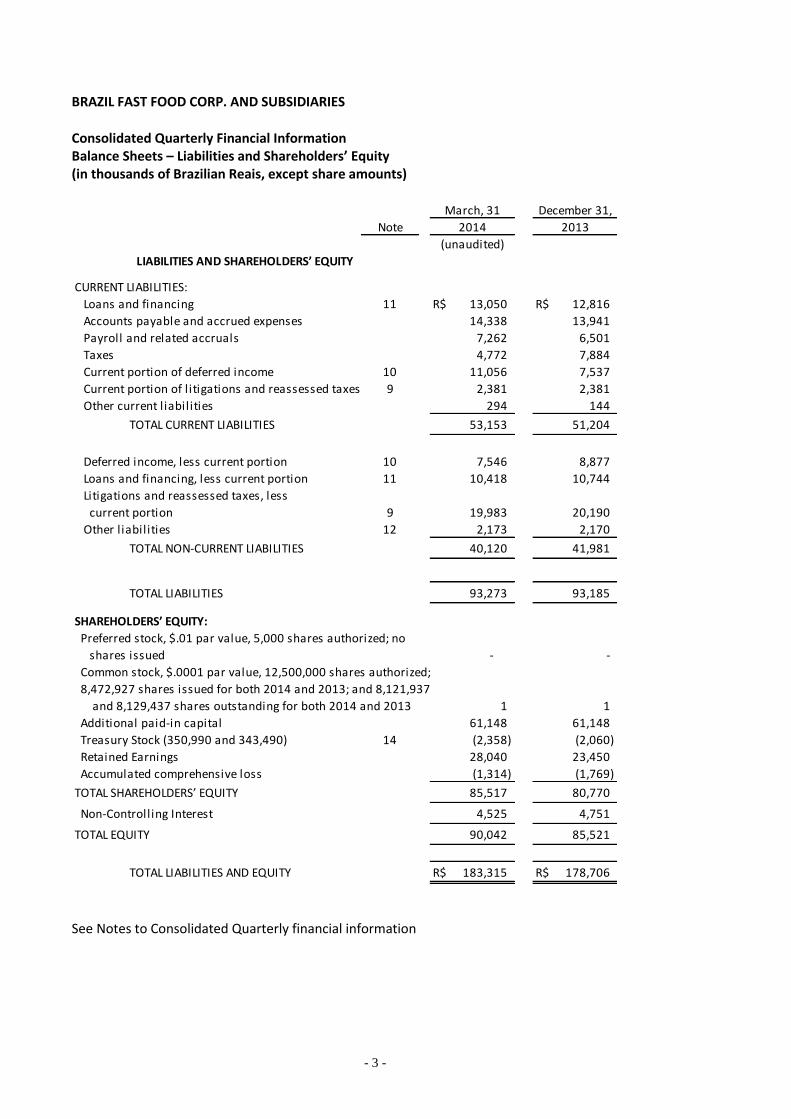
Consolidated Quarterly Financial Information Balance Sheets – Liabilities and Shareholders’ Equity (in thousands of Brazilian Reais, except share amounts)
See Notes to Consolidated Quarterly financial information
Note
CURRENT LIABILITIES:
Loans and financing 11 R$ 13,050 R$ 12,816
Accounts payable and accrued expenses 14,338 13,941
Payroll and related accruals 7,262 6,501
Taxes 4,772 7,884
Current portion of deferred income 10 11,056 7,537
Current portion of l itigations and reassessed taxes 9 2,381 2,381
Other current l iabilities 294 144
TOTAL CURRENT LIABILITIES 53,153 51,204
Deferred income, less current portion 10 7,546 8,877
Loans and financing, less current portion 11 10,418 10,744
Litigations and reassessed taxes, less
current portion 9 19,983 20,190
Other l iabilities 12 2,173 2,170
TOTAL NON-CURRENT LIABILITIES 40,120 41,981
TOTAL LIABILITIES 93,273 93,185
SHAREHOLDERS’ EQUITY:
Preferred stock, $.01 par value, 5,000 shares authorized; no
shares issued - -
Common stock, $.0001 par value, 12,500,000 shares authorized;
8,472,927 shares issued for both 2014 and 2013; and 8,121,937
and 8,129,437 shares outstanding for both 2014 and 2013 1 1
Additional paid-in capital 61,148 61,148
Treasury Stock (350,990 and 343,490) 14 (2,358) (2,060)
Retained Earnings 28,040 23,450
Accumulated comprehensive loss (1,314) (1,769)
TOTAL SHAREHOLDERS’ EQUITY 85,517 80,770
Non-Controlling Interest 4,525 4,751
TOTAL EQUITY 90,042 85,521
TOTAL LIABILITIES AND EQUITY R$ 183,315 R$ 178,706
March, 31 December 31,
2014 2013
(unaudited)
LIABILITIES AND SHAREHOLDERS’ EQUITY
- 4 -
BRAZIL FAST FOOD CORP. AND SUBSIDIARIES
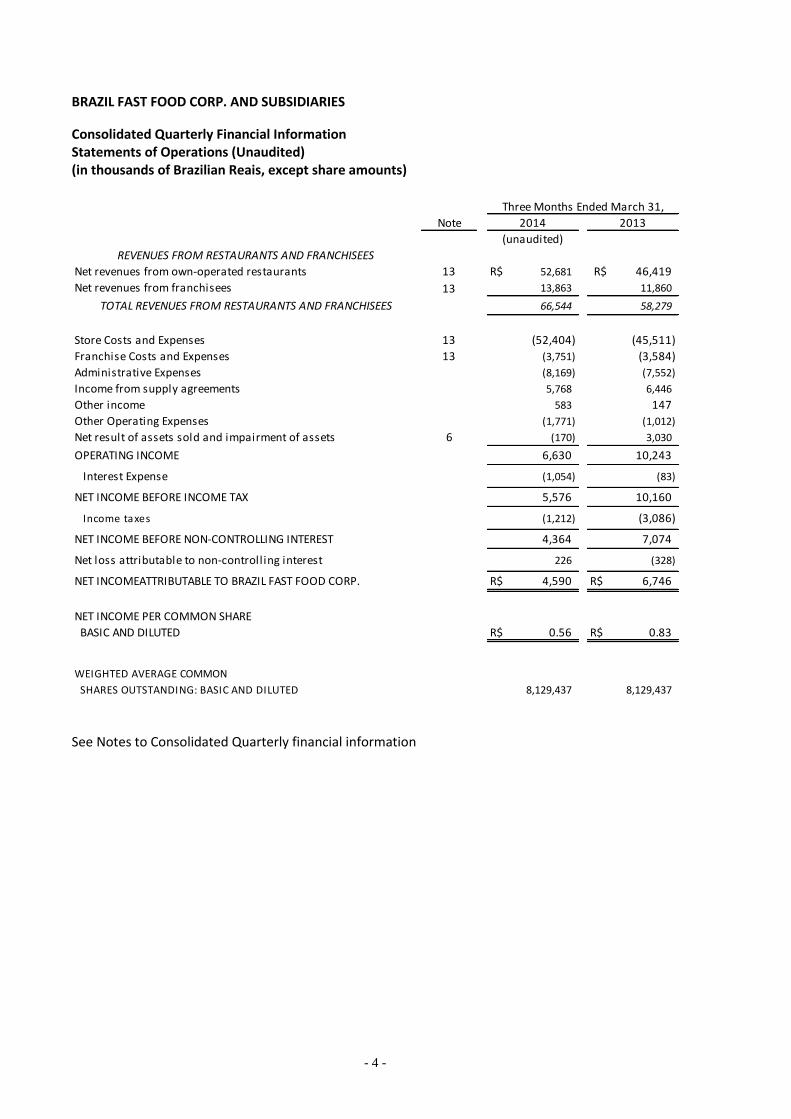
Consolidated Quarterly Financial Information Statements of Operations (Unaudited) (in thousands of Brazilian Reais, except share amounts)
See Notes to Consolidated Quarterly financial information
Note
Net revenues from own-operated restaurants 13 R$ 52,681 R$ 46,419
Net revenues from franchisees 13 13,863 11,860
66,544 58,279
Store Costs and Expenses 13 (52,404) (45,511)
Franchise Costs and Expenses 13 (3,751) (3,584)
Administrative Expenses (8,169) (7,552)
Income from supply agreements 5,768 6,446
Other income 583 147
Other Operating Expenses (1,771) (1,012)
Net result of assets sold and impairment of assets 6 (170) 3,030
OPERATING INCOME 6,630 10,243
Interest Expense (1,054) (83)
NET INCOME BEFORE INCOME TAX 5,576 10,160
Income taxes (1,212) (3,086)
NET INCOME BEFORE NON-CONTROLLING INTEREST 4,364 7,074
Net loss attributable to non-controlling interest 226 (328)
NET INCOMEATTRIBUTABLE TO BRAZIL FAST FOOD CORP. R$ 4,590 R$ 6,746
NET INCOME PER COMMON SHARE
BASIC AND DILUTED R$ 0.56 R$ 0.83
WEIGHTED AVERAGE COMMON
SHARES OUTSTANDING: BASIC AND DILUTED 8,129,437 8,129,437
TOTAL REVENUES FROM RESTAURANTS AND FRANCHISEES
REVENUES FROM RESTAURANTS AND FRANCHISEES
Three Months Ended March 31,
2014 2013
(unaudited)
- 5 -
BRAZIL FAST FOOD CORP. AND SUBSIDIARIES
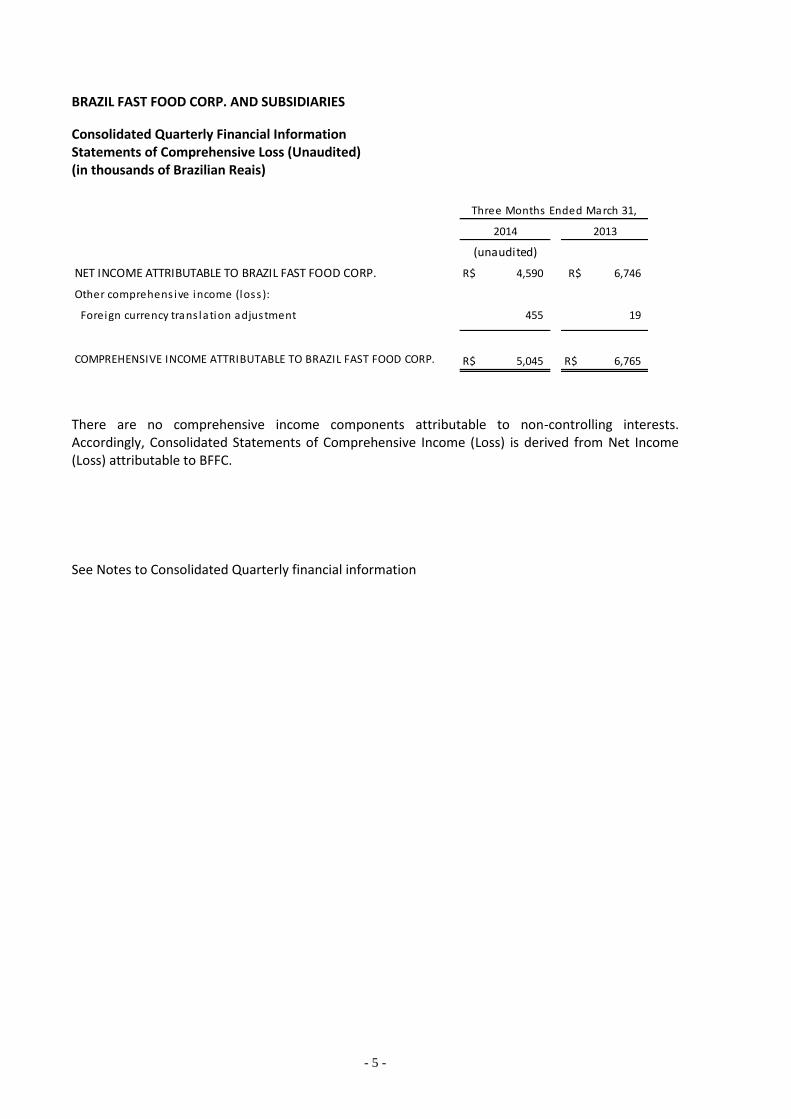
Consolidated Quarterly Financial Information Statements of Comprehensive Loss (Unaudited) (in thousands of Brazilian Reais)
There are no comprehensive income components attributable to non-controlling interests. Accordingly, Consolidated Statements of Comprehensive Income (Loss) is derived from Net Income (Loss) attributable to BFFC.
See Notes to Consolidated Quarterly financial information
NET INCOME ATTRIBUTABLE TO BRAZIL FAST FOOD CORP. R$ 4,590 R$ 6,746
Other comprehens ive income (loss ):
Foreign currency trans lation adjustment 455 19
COMPREHENSIVE INCOME ATTRIBUTABLE TO BRAZIL FAST FOOD CORP. R$ 5,045 R$ 6,765
Three Months Ended March 31,
2014 2013
(unaudited)
- 6 -
BRAZIL FAST FOOD CORP. AND SUBSIDIARIES
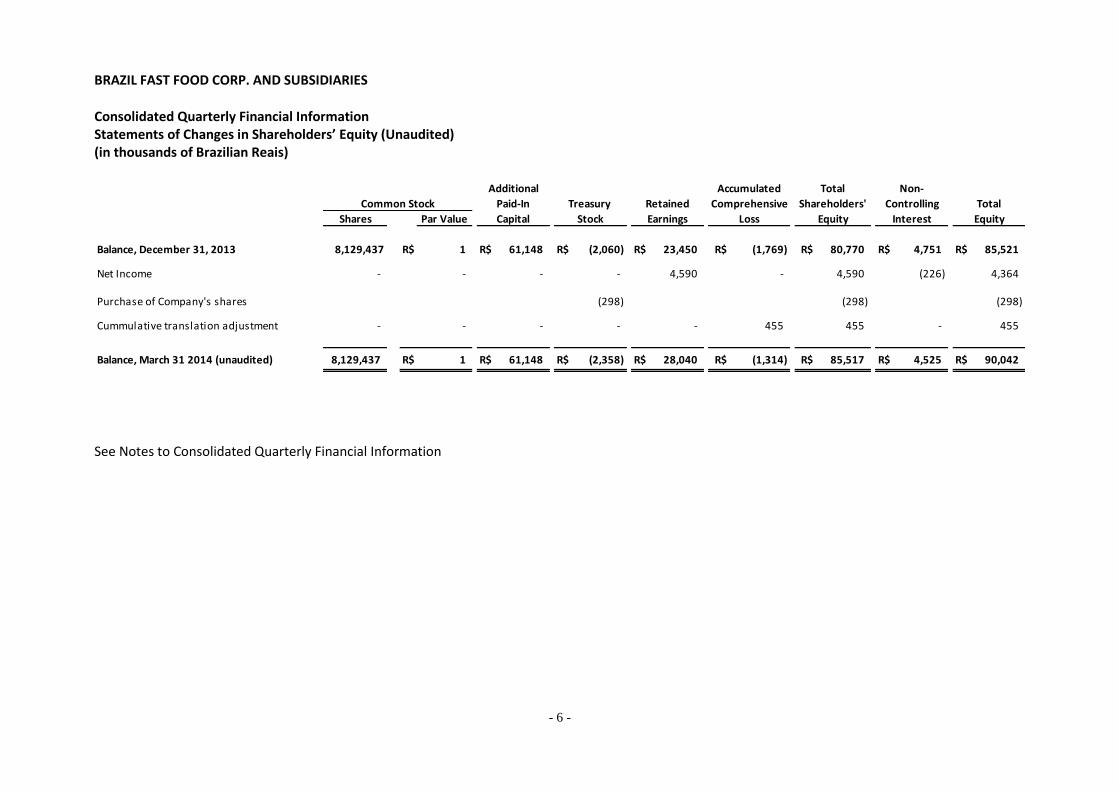
Consolidated Quarterly Financial Information Statements of Changes in Shareholders’ Equity (Unaudited) (in thousands of Brazilian Reais)
See Notes to Consolidated Quarterly Financial Information
Shares Par Value
Balance, December 31, 2013 8,129,437 R$ 1 R$ 61,148 R$ (2,060) R$ 23,450 R$ (1,769) R$ 80,770 R$ 4,751 R$ 85,521
Net Income - - - - 4,590 - 4,590 (226) 4,364
Purchase of Company's shares (298) (298) (298)
Cummulative translation adjustment - - - - - 455 455 - 455
Balance, March 31 2014 (unaudited) 8,129,437 R$ 1 R$ 61,148 R$ (2,358) R$ 28,040 R$ (1,314) R$ 85,517 R$ 4,525 R$ 90,042
Total
Equity Interest Equity
Accumulated Total Non-
Shareholders' ControllingComprehensive
Loss
Additional
Common Stock Paid-In RetainedTreasury
Capital EarningsStock
- 7 -
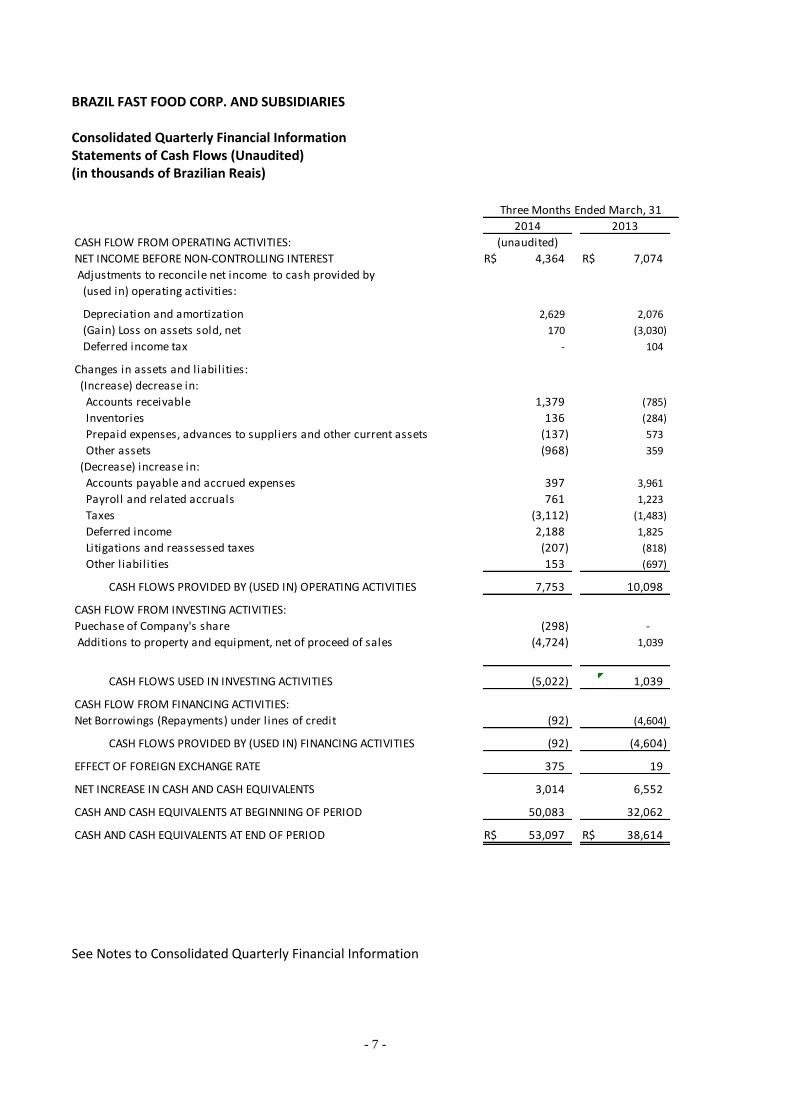
BRAZIL FAST FOOD CORP. AND SUBSIDIARIES Consolidated Quarterly Financial Information Statements of Cash Flows (Unaudited) (in thousands of Brazilian Reais)
See Notes to Consolidated Quarterly Financial Information
CASH FLOW FROM OPERATING ACTIVITIES:
NET INCOME BEFORE NON-CONTROLLING INTEREST R$ 4,364 R$ 7,074
Adjustments to reconcile net income to cash provided by
(used in) operating activities:
Depreciation and amortization 2,629 2,076
(Gain) Loss on assets sold, net 170 (3,030)
Deferred income tax - 104
Changes in assets and liabilities:
(Increase) decrease in:
Accounts receivable 1,379 (785)
Inventories 136 (284)
Prepaid expenses, advances to suppliers and other current assets (137) 573
Other assets (968) 359
(Decrease) increase in:
Accounts payable and accrued expenses 397 3,961
Payroll and related accruals 761 1,223
Taxes (3,112) (1,483)
Deferred income 2,188 1,825
Litigations and reassessed taxes (207) (818)
Other l iabilities 153 (697)
CASH FLOWS PROVIDED BY (USED IN) OPERATING ACTIVITIES 7,753 10,098
CASH FLOW FROM INVESTING ACTIVITIES:
Puechase of Company's share (298) -
Additions to property and equipment, net of proceed of sales (4,724) 1,039
CASH FLOWS USED IN INVESTING ACTIVITIES (5,022) 1,039
CASH FLOW FROM FINANCING ACTIVITIES:
Net Borrowings (Repayments) under lines of credit (92) (4,604)
CASH FLOWS PROVIDED BY (USED IN) FINANCING ACTIVITIES (92) (4,604)
EFFECT OF FOREIGN EXCHANGE RATE 375 19
NET INCREASE IN CASH AND CASH EQUIVALENTS 3,014 6,552
CASH AND CASH EQUIVALENTS AT BEGINNING OF PERIOD 50,083 32,062
CASH AND CASH EQUIVALENTS AT END OF PERIOD R$ 53,097 R$ 38,614
2014 2013
Three Months Ended March, 31
(unaudited)
- 8 -
BRAZIL FAST FOOD CORP. AND SUBSIDIARIES Notes to Consolidated Quarterly Financial Information (Unaudited) (in thousands of Brazilian Reais, unless otherwise stated)
NOTE 1 – BUSINESS CONTEXT
The Company was incorporated in the state of Delaware, United States, on September 16, 1992. Its business purposes are to provide food services through the operation of own- and franchise-operated restaurants and kiosks (collectively “point of sales”) primarily in Brazil – where it manages one of the largest local food service groups – and also in Angola and Chile.
Below, summaries of the Company’s business per brand are given:
BOB’S TRADEMARK
Since March 1996 the Company has owned this brand, operated stores directly and managed a franchise chain which includes: (i) the selection of franchise operators; (ii) making decisions regarding the chain’s products and overall characteristics; (iii) the administration of the Bob’s marketing fund. Besides Brazil (where the vast majority of its operations are focused), the Bob’s trade mark is present in Angola and Chile through local franchise operators.
KFC TRADEMARK
Since the first quarter of 2007 the Company has operated points of sale in the cities of Rio de Janeiro and São Paulo as a franchisee of KFC (a Yum! Restaurants International brand).
PIZZA HUT TRADEMARK
Since the last quarter of 2008 the Company has operated restaurants in the São Paulo metropolitan area as a franchisee of Pizza Hut (a Yum! Restaurants International brand). See note 3.2.4.
DOGGIS TRADEMARK
Since the last quarter of 2008 the Company has represented this Chilean hot-dog chain in Brazil as a Master Franchisee of Gastronomía & Negocios Sociedad Anonima (“G&N”), one of the fast food leaders in Chile and the owner of the Doggis hot-dog chain, which has 250 stores in Chile. See note 3.2.2.
YOGGI TRADEMARK
In May 2012 the Company acquired the Yoggi brand, a Brazilian frozen yogurt network in operation since 2008, since which time it has managed this franchise chain. See note 3.2.3.
- 9 -
NOTE 2 - FINANCIAL STATEMENT PRESENTATION
The accompanying unaudited Consolidated Quarterly Financial Information of Brazil Fast Food Corp. and its subsidiaries (jointly referred to as “the Company”, “BFFC” or “Brazil Fast Food”) have been prepared in accordance with International Financial Reporting Standards, International Accounting Standards and Interpretations (collectively “IFRSs”) issued by the International Accounting Standards Board (IASB). The Company began to present its financial statements in accordance with IFRS in the 2013 interim periods. Up to December 31, 2012 the Company prepared and presented its financial statements in accordance with U.S. generally accepted accounting principles (U.S. GAAP). The Company made an assessment of the accounting policies used in its business and concluded that this change would result in no material difference to its current financials and results of operations. See note 15. These unaudited Consolidated Quarterly Financial Information and the accompanying notes should be read in conjunction with the audited consolidated financial statements and notes contained in the Company’s Annual Report for the year ended December 31, 2013, available at its website. These statements and the accompanying notes are reported in Brazilian Reais (legal currency of Brazil - “Reais” or “R$”) except where stated otherwise. The Company’s operating (functional) currency is the Real, and this is the currency used to prepare and present this quarterly financial information.
The consolidated balance sheet as at March 31, 2014, and the consolidated statements of operations and consolidated statement of cash flows for the three-month period ended March 31, 2014 and 2013 included in this report are unaudited. However, in management's opinion, such Consolidated Quarterly Financial Information reflects all normal recurring adjustments that are necessary for a fair presentation. The results for the interim periods are not necessarily indicative of trends or results expected for the full year ending December 31, 2014.
The preparation of financial statements in compliance with IFRSs requires the use of certain critical accounting estimates. It also requires Company’s management to exercise judgment in applying the Company's accounting policies to determine the appropriate amounts to be recorded in the quarterly financial information. When significant items are subject to such estimates and assumptions, this can affect the value of the assets, liabilities, revenues, expenses and disclosures in the quarterly financial information. The actual results may differ from these estimates.
The Consolidated quarterly financial information for the quarter ended March 31, 2014 was approved by the Board of Directors on May 08, 2014.
- 10 -
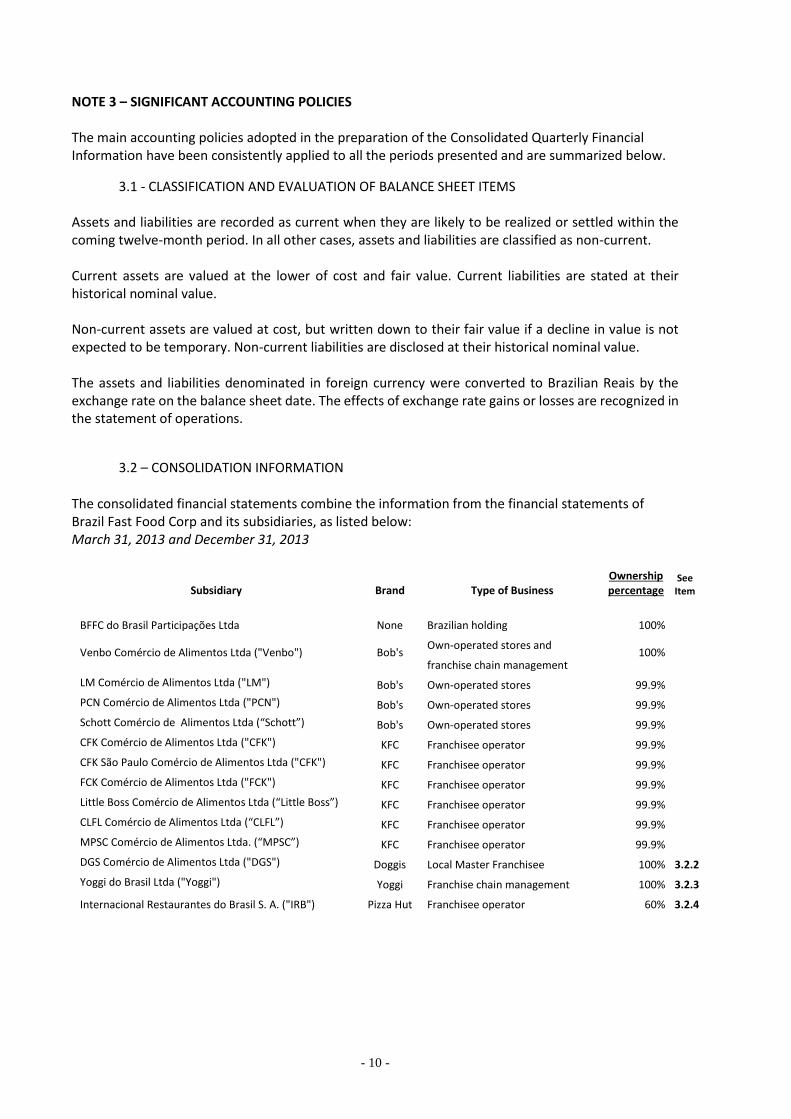
NOTE 3 – SIGNIFICANT ACCOUNTING POLICIES The main accounting policies adopted in the preparation of the Consolidated Quarterly Financial Information have been consistently applied to all the periods presented and are summarized below.
3.1 - CLASSIFICATION AND EVALUATION OF BALANCE SHEET ITEMS
Assets and liabilities are recorded as current when they are likely to be realized or settled within the coming twelve-month period. In all other cases, assets and liabilities are classified as non-current. Current assets are valued at the lower of cost and fair value. Current liabilities are stated at their historical nominal value.
Non-current assets are valued at cost, but written down to their fair value if a decline in value is not expected to be temporary. Non-current liabilities are disclosed at their historical nominal value. The assets and liabilities denominated in foreign currency were converted to Brazilian Reais by the exchange rate on the balance sheet date. The effects of exchange rate gains or losses are recognized in the statement of operations.
3.2 – CONSOLIDATION INFORMATION The consolidated financial statements combine the information from the financial statements of Brazil Fast Food Corp and its subsidiaries, as listed below: March 31, 2013 and December 31, 2013
Subsidiary Brand Type of Business Ownership percentage
See Item
BFFC do Brasil Participações Ltda None Brazilian holding 100%
Venbo Comércio de Alimentos Ltda ("Venbo") Bob's Own-operated stores and
100%
franchise chain management
LM Comércio de Alimentos Ltda ("LM") Bob's Own-operated stores 99.9%
PCN Comércio de Alimentos Ltda ("PCN") Bob's Own-operated stores 99.9%
Schott Comércio de Alimentos Ltda (“Schott”) Bob's Own-operated stores 99.9%
CFK Comércio de Alimentos Ltda ("CFK") KFC Franchisee operator 99.9%
CFK São Paulo Comércio de Alimentos Ltda ("CFK") KFC Franchisee operator 99.9%
FCK Comércio de Alimentos Ltda ("FCK") KFC Franchisee operator 99.9%
Little Boss Comércio de Alimentos Ltda (“Little Boss”) KFC Franchisee operator 99.9%
CLFL Comércio de Alimentos Ltda (“CLFL”) KFC Franchisee operator 99.9%
MPSC Comércio de Alimentos Ltda. (“MPSC”) KFC Franchisee operator 99.9%
DGS Comércio de Alimentos Ltda ("DGS") Doggis Local Master Franchisee 100% 3.2.2
Yoggi do Brasil Ltda ("Yoggi") Yoggi Franchise chain management 100% 3.2.3
Internacional Restaurantes do Brasil S. A. ("IRB") Pizza Hut Franchisee operator 60% 3.2.4
- 11 -
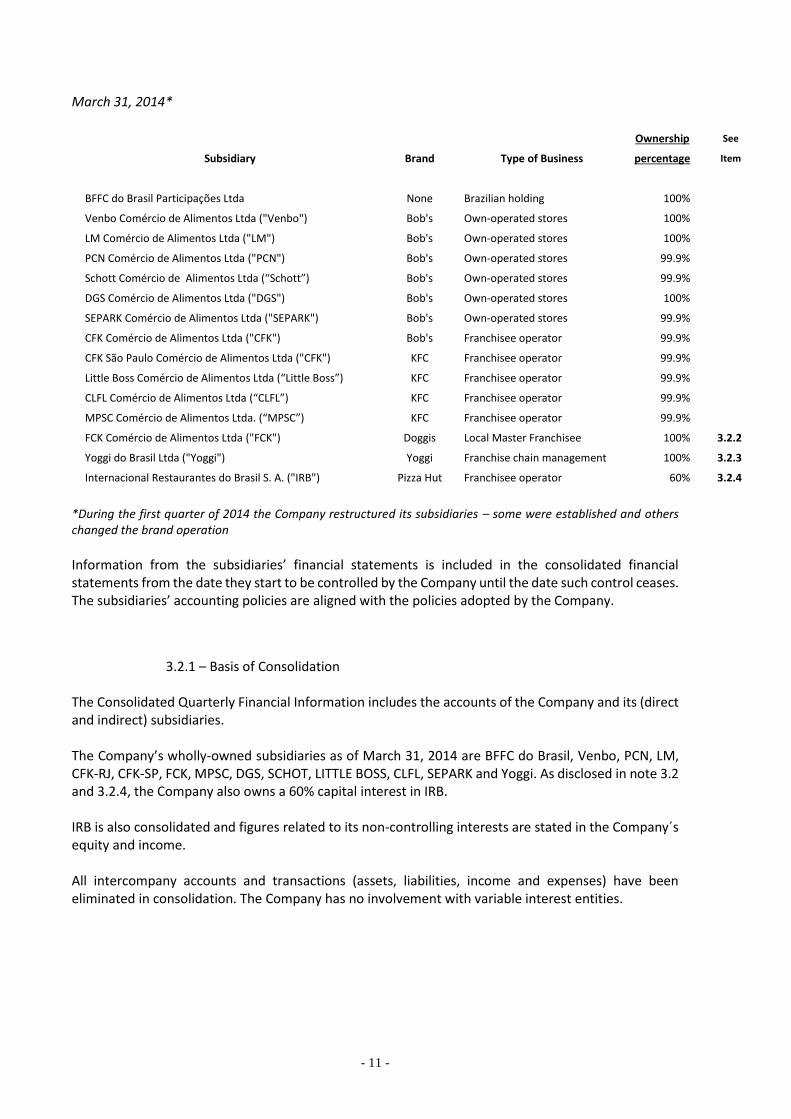
March 31, 2014*
Ownership See
Subsidiary Brand Type of Business percentage Item
BFFC do Brasil Participações Ltda None Brazilian holding 100%
Venbo Comércio de Alimentos Ltda ("Venbo") Bob's Own-operated stores 100%
LM Comércio de Alimentos Ltda ("LM") Bob's Own-operated stores 100%
PCN Comércio de Alimentos Ltda ("PCN") Bob's Own-operated stores 99.9%
Schott Comércio de Alimentos Ltda (“Schott”) Bob's Own-operated stores 99.9%
DGS Comércio de Alimentos Ltda ("DGS") Bob's Own-operated stores 100%
SEPARK Comércio de Alimentos Ltda ("SEPARK") Bob's Own-operated stores 99.9%
CFK Comércio de Alimentos Ltda ("CFK") Bob's Franchisee operator 99.9%
CFK São Paulo Comércio de Alimentos Ltda ("CFK") KFC Franchisee operator 99.9%
Little Boss Comércio de Alimentos Ltda (“Little Boss”) KFC Franchisee operator 99.9%
CLFL Comércio de Alimentos Ltda (“CLFL”) KFC Franchisee operator 99.9%
MPSC Comércio de Alimentos Ltda. (“MPSC”) KFC Franchisee operator 99.9%
FCK Comércio de Alimentos Ltda ("FCK") Doggis Local Master Franchisee 100% 3.2.2
Yoggi do Brasil Ltda ("Yoggi") Yoggi Franchise chain management 100% 3.2.3
Internacional Restaurantes do Brasil S. A. ("IRB") Pizza Hut Franchisee operator 60% 3.2.4
*During the first quarter of 2014 the Company restructured its subsidiaries – some were established and others changed the brand operation
Information from the subsidiaries’ financial statements is included in the consolidated financial statements from the date they start to be controlled by the Company until the date such control ceases. The subsidiaries’ accounting policies are aligned with the policies adopted by the Company.
3.2.1 – Basis of Consolidation The Consolidated Quarterly Financial Information includes the accounts of the Company and its (direct and indirect) subsidiaries. The Company’s wholly-owned subsidiaries as of March 31, 2014 are BFFC do Brasil, Venbo, PCN, LM, CFK-RJ, CFK-SP, FCK, MPSC, DGS, SCHOT, LITTLE BOSS, CLFL, SEPARK and Yoggi. As disclosed in note 3.2 and 3.2.4, the Company also owns a 60% capital interest in IRB. IRB is also consolidated and figures related to its non-controlling interests are stated in the Company´s equity and income. All intercompany accounts and transactions (assets, liabilities, income and expenses) have been eliminated in consolidation. The Company has no involvement with variable interest entities.
- 12 -
3.2.2 – Controlling interest in DGS In October 2008 the Company reached an agreement with Gastronomía & Negocios Sociedad Anonima (“G&N”, formerly Grupo de Empresas Doggis Sociedad Anonima), one of the fast food leaders in Chile and owner of the Doggis hot-dog chain, which has 250 stores in Chile. According to this agreement, BFFC do Brasil would establish a Master Franchise to manage, develop and expand the Doggis hot-dog chain in Brazil through own-operated restaurants and franchisees, and G&N would establish a Master Franchise to manage, develop and expand the Bob’s hamburger chain in Chile through own-operated restaurants and franchisees. The Master Franchise established in Brazil was named DGS Comercio de Alimento S.A. (“DGS”) and the Master Franchise established in Chile was named BBS S.A. (“BBS”). According to this agreement, BFFC do Brasil would own 20% of BBS and G&N would own 20% of DGS. During the quarter ended September 30, 2012, the original agreement was reviewed, subsequent to which BFFC acquired the remaining 20% of DGS’s capital shares from G&N in exchange for 20% of BBS’s capital shares, which were accordingly transferred to G&N.
Currently, the Company owns 100% of DGS and continues to develop the Doggis trademark in Brazil. G&N owns 100% of BBS’s capital shares and will continue to develop the Bob’s trademark in Chile. Due to a restructuring of some of the Company’s subsidiaries during the first quarter of 2014, the management of Doggis trademark changed from DGS Comercio de Alimento S.A. to FCK Comércio de Alimentos Ltda.
3.2.3 – Acquisition of Yoggi In May 2012, the Company acquired Yoggi do Brasil Ltda (“Yoggi”), which has operated a frozen yogurt franchise network in Brazil since 2008. Yoggi’s operating results have been fully consolidated since the acquisition.
3.2.4 – Acquisition of IRB
In December 2008, the Company reached an agreement with Restaurants Connection International Inc. (“RCI”) to acquire, through its wholly-owned holding subsidiary, BFFC do Brasil, 60% of Internacional Restaurantes do Brasil (“IRB”), which operates Pizza Hut restaurants in the city of São Paulo as a Yum! Brands franchisee. The remaining 40% of IRB is held by another Brazilian company of which IRB’s current CEO is the main stockholder. IRB is also consolidated and figures related to its non-controlling interests are stated in the Company´s equity and income.
- 13 -
3.3 – GOODWILL Goodwill is an asset representing the future economic benefits arising from other assets acquired in a business combination that are not individually identified and separately recognized. Goodwill is reviewed for impairment at least annually. The goodwill impairment test has two steps. In the first step, the fair value of the reporting unit is compared with its carrying value (including goodwill). If the fair value of the reporting unit is less than its carrying value, an indication of goodwill impairment exists for the reporting unit and the entity must perform step two of the impairment test (measurement). In step two, an impairment loss is recognized for any excess of the carrying amount of the reporting unit’s goodwill is greater than the implied fair value of that goodwill. The implied fair value of goodwill is determined by allocating the fair value of the reporting unit in a manner similar to a purchase price allocation, and the residual fair value after this allocation is the implied fair value of the reporting unit’s goodwill. The fair value of the reporting unit is determined using a discounted cash flow analysis. If the fair value of the reporting unit exceeds its carrying value, step two does not need to be performed. The Company’s excess of fair value over recognized acquired assets and liabilities was recognized as goodwill (non-current assets) at an amount of R$1.1 million in December 2012. R$799 thousand of this was allocated to IRB unit (see 3.2.4) and R$322 thousand was allocated to Yoggi unit (see 3.2.3). Management requested third-party assistance in obtaining the fair value of IRB and Yoggi’s long-lived assets acquired as per IASB IFRS 3 “Business Combinations” An annual goodwill impairment test is conducted in the fourth quarter, comparing the fair value of reporting units, generally based on discounted future cash flows, with their carrying amount including goodwill. If goodwill is determined to be impaired, the loss is measured as the excess of the reporting unit’s carrying amount over its fair value. Company’s annual goodwill impairment test did not result in any impairment loss during the quarters ended March 31, 2014 and 2013.
3.4 – FOREIGN CURRENCY Assets and liabilities recorded in functional currencies other than Brazilian Reais are translated into Brazilian Reais at the exchange rate reported by the Central Bank of Brazil for the balance sheet date. Revenues and expenses are translated at the weighted average exchange rate for the year. The resulting translation adjustments are recognized in other comprehensive income. Gains or losses from foreign currency transactions, such as those resulting from the settlement of receivables or payables denominated in foreign currency, are recognized in the consolidated statement of operations as they occur.
3.5 – CASH AND CASH EQUIVALENTS
The Company considers all highly liquid investments purchased with an original maturity of three months or less to be cash equivalents.
- 14 -
3.6 – ACCOUNTS RECEIVABLE Accounts receivable consist primarily of receivables from food sales, franchise royalties and assets sold to franchisees. On March 31, 2014, the Company had approximately 1,093 franchised points of sale (approximately 1,070 on December 31, 2013). A few of them may undergo financial difficulties in the course of their business and may therefore fail to pay their monthly royalty fees. If a franchisee fails to pay its invoices for more than six months in a row, one of the following procedures is adopted: either (i) the franchisee’s accounts receivable are written off if the individual invoices are below R$5; or (ii) the Company records an allowance for doubtful accounts with a corresponding reduction in net revenues from franchisees if the individual invoices are over R$5. In addition, the Company recognizes an allowance for doubtful receivables to cover any amounts that may be unrecoverable based upon an analysis of the Company's prior collection experience, customer creditworthiness and current economic trends. After all attempts to collect a receivable have failed, the receivable is written off against this allowance. Despite writing off these receivables in the accounting books or recording an allowance for doubtful accounts, the finance department keeps records of all uncollected receivables from franchisees for purposes of commercial negotiations. When a franchisee has past due royalty fees, the Company may renegotiate such debts with the franchisee and collect them in installments. The Company may also mediate the sale of the franchise business to another franchisee (new or owner of another franchised store) and reschedule such accounts receivable as part of the purchase price. When either kind of agreement is reached and collectability of the past due amounts is reasonably assured, the Company records these amounts as “Franchisees - renegotiated past due accounts”.
3.7 – INVENTORIES
Inventories, primarily consisting of food, beverages and supplies, are stated at the lower of cost or market value. Cost of inventories is determined using the weighted average cost method.
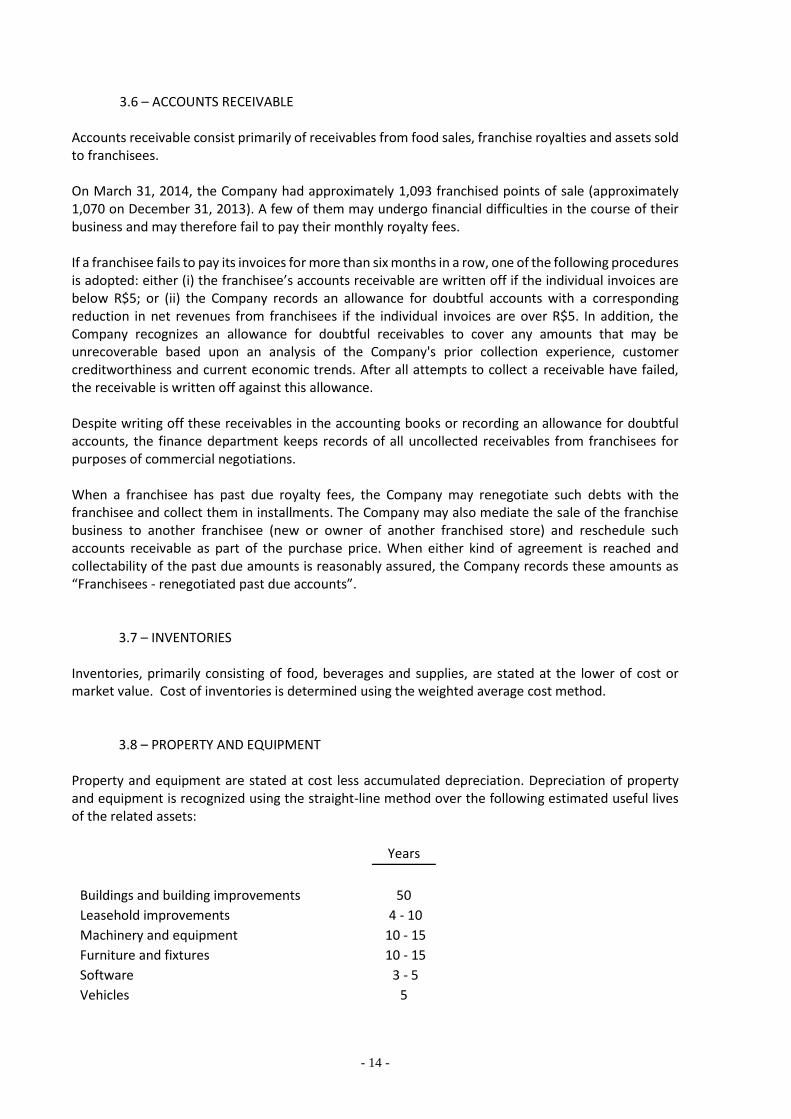
3.8 – PROPERTY AND EQUIPMENT
Property and equipment are stated at cost less accumulated depreciation. Depreciation of property and equipment is recognized using the straight-line method over the following estimated useful lives of the related assets:
Years
Buildings and building improvements 50
Leasehold improvements 4 - 10
Machinery and equipment 10 - 15
Furniture and fixtures 10 - 15
Software 3 - 5
Vehicles 5
- 15 -
3.9 – INTANGIBLE ASSETS
Intangible assets, which are comprised of (i) leasehold premiums paid in advance for rented outlet premises; (ii) initial franchise fees, stated at cost less accumulated amortization; and (iii) the fair value of the trademark and customer portfolio (franchise contracts) allocated in connection to Yoggi acquisition. The amortization periods, which range from 5 to 20 years, are based on the management's estimate of the related rental or franchise contracts including renewal options, and are set at the Company’s discretion.
3.10 – PRE-OPENING COSTS Labor costs and the costs of hiring and training personnel and certain other costs relating to the opening of new restaurants are expensed as incurred.
3.11 – REVENUE RECOGNITION Restaurant sales revenue is recognized when a purchase in a store is concluded. Initial franchise fee revenue is recognized when all material services and conditions relating to the franchise have been substantially performed or satisfied, which normally occurs when the restaurant is opened. Monthly royalty fees equivalent to a percentage of the franchisees’ gross sales are recognized in the month when they are earned. Revenues from trade partners’ agreements are recognized as credit in the Company’s statements of operations under “revenues from trade partners”. Such revenue is recorded when cash from trade partners is received, since it is difficult to estimate the receivable amount, and significant doubts about its collectability exist until the trade partner agrees on the exact amount. When revenues from trade partners’ agreements are received in advance in cash, they are recognized as deferred income and are charged to income on a straight line basis over the term of the related trade partner agreement on a monthly basis. Income obtained from the lease of any of the Company’s properties, administration fees on the marketing fund, and nonrecurring gains are all recognized as other income when earned and deemed realizable. The relationship between the Company and each of its franchisees is legally bound by a formal contract, whereby each franchisee agrees to pay monthly royalty fees equivalent to a percentage of its gross sales. The formal contract and the franchisees’ sales (as a consequence of their business) meet three of the four revenue recognition requirements:
- Persuasive evidence that an arrangement exists — the contract is signed by the franchisee; - Delivery has occurred or services have been rendered — franchisee sales are the basis of royalty revenues; - The seller’s price to the buyer is fixed or determinable — the contract states that royalties are a percentage of the franchisee’s gross sales.
- 16 -
The Company also meets the fourth requirement for revenue recognition (collectability is reasonably assured) when recording its revenues. If a franchisee fails to pay its invoices for more than six months in a row, the Company does not stop invoicing the contracted amounts. However, in such cases the Company offsets any additional invoiced amounts with a corresponding full allowance for doubtful accounts. For purposes of internal and tax reporting, the Company’s subsidiaries record their revenues gross of taxes on sales, since in Brazil these taxes are included in both sales prices and royalty fees. In addition, due to specific tax rules in Brazil, local companies are required to account for sales even when they are canceled, by recording a separate item in the general ledger to offset the original sales amount recorded. However, for financial reporting purposes, the Company presents its revenues net of taxes and net of canceled sales (when costumer gives up his order, after it has been printed at the cashier). The composition of Gross and Net Revenues is disclosure at note 13.
3.12 – MARKETING EXPENSES
3.12.1 – Bob’s, Yoggi´s and Doggis’ Brand
According to the Company’s franchise agreements, the Bob’s marketing fund for advertising and promotions is comprised of financial contributions paid by its franchisees and own-operated restaurants. The Company manages the funds, which must be used in the common interest of the Bob’s, Yoggi’s and Doggis’ chains through the best efforts of its marketing department to increase restaurant sales. Each brand marketing fund is managed separately.
Franchisees’ marketing fund contributions are billed monthly and recorded on an accrual basis. A corresponding amount is recorded as a liability.
In general, franchisees pay a percentage of their gross monthly sales every month to the respective brand’s marketing fund (4% Bob’s, 2% Yoggi and 4%Doggis. Since 2006, the gross monthly sales from own-operated restaurants (except for sales from special events) have also been subject to the marketing fund contribution. These contributions can be deducted from the Company’s marketing department expenses if previously agreed with franchisees. However, total marketing investments may be greater than percentage of combined sales if a supplier makes an extra contribution (joint marketing programs) or if more own resources are used on marketing, advertising and promotions.
The Bob’s marketing fund is mainly invested in nationwide advertising programs (commercials or advertising on TV, radio and billboards). Franchisees may also invest directly in advertising and promotions for their own stores, upon prior receipt of consent.
The marketing funds resources are not required to be invested during the same month or year that they are received, but must be used in subsequent periods.
Periodically, meetings are held with the Bob’s Franchisee Council to divulge the marketing fund accounts in a report that is similar to a cash flow statement. This statement discloses the marketing contributions received and the marketing expenses, both on a cash basis.
- 17 -
The balance of any unspent resources from the marketing funds is recognized as accrued accounts payable. On March 31, 2014 and on December 31, 2013 there was no balance of this type and on December 31, 2013, this amount was R$4.7 million. These balances represented contributions made by the Company and franchisees that had not yet been used in campaigns.
Marketing funds expenses on advertising and promotions are recognized as incurred. Total marketing investments financed by the marketing fund amounted to R$11.7 and R$11.8 million for the three-month periods ended March 31, 2014 and 2013, respectively.
3.12.2 - KFC and Pizza Hut Brands
We contribute 0.5% of KFC’s and Pizza Hut’s monthly net sales into a marketing fund managed by YUM! Brands - Brazil. In addition, the Company is also committed to investing 5.0% of KFC and Pizza Hut’s monthly net sales in local marketing and advertising.
Marketing expenses on KFC and Pizza Hut advertising and promotions are recognized as incurred and amounted to R$1.7 and R$1.8 million for the three-month periods ended March 31, 2014 and 2013, respectively.
3.13 – INCOME TAXES
The Company accounts for income tax in accordance with guidance provided by the IASB IAS 12 Income Tax. According to this guidance, deferred tax assets and liabilities are recognized for the future tax consequences attributable to differences between the carrying amounts of existing assets and liabilities on the financial statements and their respective tax basis and operating loss carry-forwards. Deferred tax assets and liabilities are measured using the enacted tax rates expected to apply to taxable income in the years in which the temporary differences are expected to be recovered or settled. The valuation allowance reflects the Company's assessment of the likelihood of realizing the net deferred tax assets in view of current operations and is comprised of tax loss carry-forwards held by the Company through the portion of its subsidiaries’ tax losses which are greater than the respective projected taxable income. Under the above-referred guidance, the effect of any change in tax rates or deferred tax assets and liabilities is recognized in income in the period it is enacted. The effect of income tax positions is recorded only if those positions are “more likely than not” to be sustained. Recognized income tax positions are measured at the largest amount that is greater than 50% likely of being realized. Changes in recognition or measurement are reflected in the period in which the change in judgment occurs. Although there is no material charges related to interest and penalties at the current time, such costs, if incurred, are reported within the provision for income taxes.
- 18 -
3.14 – IMPAIRMENT OR DISPOSAL OF LONG-LIVED ASSETS
The Company adopted guidance on the impairment or disposal of long-lived assets in the IASB IAS 36 Impairment of Assets, which require an impairment loss to be recognized if the carrying amount of a long-lived asset is not recoverable and its carrying amount exceeds its fair value. Also, this guidance requires that long-lived assets being disposed of be measured at either the carrying amount or the fair value less cost to sell, whichever is lower, whether reported in continuing operations or in discontinued operations. If an indicator of impairment (e.g. negative operating cash flows for the most recent trailing twelve-month period) exists for any group of assets, an estimate of discounted future cash flows produced by each restaurant within the asset grouping is compared to its carrying value. If any asset is determined to be impaired, the loss is measured by the excess of the carrying amount of the asset over its fair value as determined by estimates of discounted future cash flows. For the purposes of impairment testing for its long-lived assets, the Company’s management has concluded that an individual point of sale is the lowest level of independent cash. The Company reviews long-lived assets of such individual points of sale (primarily Property & Equipment and allocated intangible assets subject to amortization) that are currently operating for impairment on an annual basis or whenever events or changes in circumstances indicate that the carrying amount of a point of sale may not be recoverable. The Company evaluates recoverability based on the point of sale’s forecasted undiscounted cash flows, which incorporate the best estimates of sales growth and margin improvement based on the company’s plans for the unit and actual results at comparable points of sale. For point of sale assets that are deemed not to be recoverable, the impaired point of sale is written down to its estimated fair value. The key assumptions in the determination of fair value are the future discounted cash flows for the point of sale. The discount rate used in the fair value calculation is the company’s estimate of its weighted average cost of capital. Estimates of future cash flows are highly subjective judgments and can be significantly impacted by changes in the business or economic conditions. During the quarters ended March 31, 2014 and 2013, the Company’s review made in accordance with this guidance derived no charges on the income statement.
3.15 – COMMITMENTS AND CONTINGENCIES
Liabilities for loss contingencies arising from claims, assessments, litigation, fines, penalties and other sources are recorded when it is probable that a liability has been incurred and the amount can be reasonably estimated. Legal costs incurred in connection with loss contingencies are expensed as incurred.
3.16 – BASIC AND DILUTED EARNINGS PER SHARE (EPS) Basic EPS are computed based on weighted average shares outstanding and exclude any potential dilution. Diluted EPS reflect potential dilution from the exercise or conversion of securities into common stock or from other contracts for the issue of common stock. There were no common share equivalents outstanding at March 31, 2014, or December 31, 2013 that would have had a dilutive effect on earnings for the respective periods.
- 19 -
3.17 – FAIR VALUE MEASUREMENTS
The Company utilizes valuation techniques that maximize the use of observable inputs and minimize the use of unobservable inputs to the greatest possible extent. The Company determines fair value based on assumptions that market participants would use in pricing an asset or liability in the principal or most advantageous market. When considering market participant assumptions in fair value measurements, the following fair value hierarchy distinguishes between observable and unobservable inputs, which are categorized in one of the following levels: • Level 1 Inputs: quoted prices in active markets for identical assets or liabilities that the entity can access at the measurement date. A quoted market price in an active market provides the most reliable evidence of fair value and is used without adjustment to measure fair value whenever available, with limited exceptions. • Level 2 Inputs: inputs other than quoted market prices included within Level 1 that are observable for the asset or liability, either directly or indirectly. • Level 3 Inputs: Unobservable inputs are used to measure fair value when relevant observable inputs are not available, thereby allowing for situations in which there is little, if any, market activity for the asset or liability at the measurement date. An entity develops unobservable inputs using the best information available in the circumstances, which might include the entity's own data, taking into account all information about market participant assumptions that is reasonably available.
3.18 – RECENTLY ISSUED ACCOUNTING STANDARDS The following standards were recently adopted by the Company:
- IAS 32 – Financial instruments: Presentation – This standard applies to fiscal years starting January 1, 2014 and set guidelines on the offsetting of financial assets and liabilities. The adoption of IAS 32 in 2014 did not have an effect on the Company’s consolidated financial statements.
The following standards were recently issued or amended but not yet adopted by the Company:
- IFRS 9 - Financial instruments – Classification and measurement - IFRS 9 concludes the first part of the project that substitutes "IAS 39 – Financial Instruments: Recognition and Measurement”. IFRS 9 uses a simple approach to determine if a financial asset is measured at amortized cost or fair value, based on how an entity manages its financial instruments (its business model) and the contractual cash flow that characterizes the financial assets. The standard also requires the adoption of only one method to calculate impairment. This standard is effective for fiscal years starting January 1, 2015 and the Company does not expect significant effects as a result of its adoption.
A number of other new standards, amendment to standards and new interpretations became mandatory for the first time for the financial year beginning January 1, 2014, and have not been listed in the present Consolidated Quarterly Financial Information because of either their non-applicability to or their immateriality to the Company´s consolidated financial statements.
- 20 -
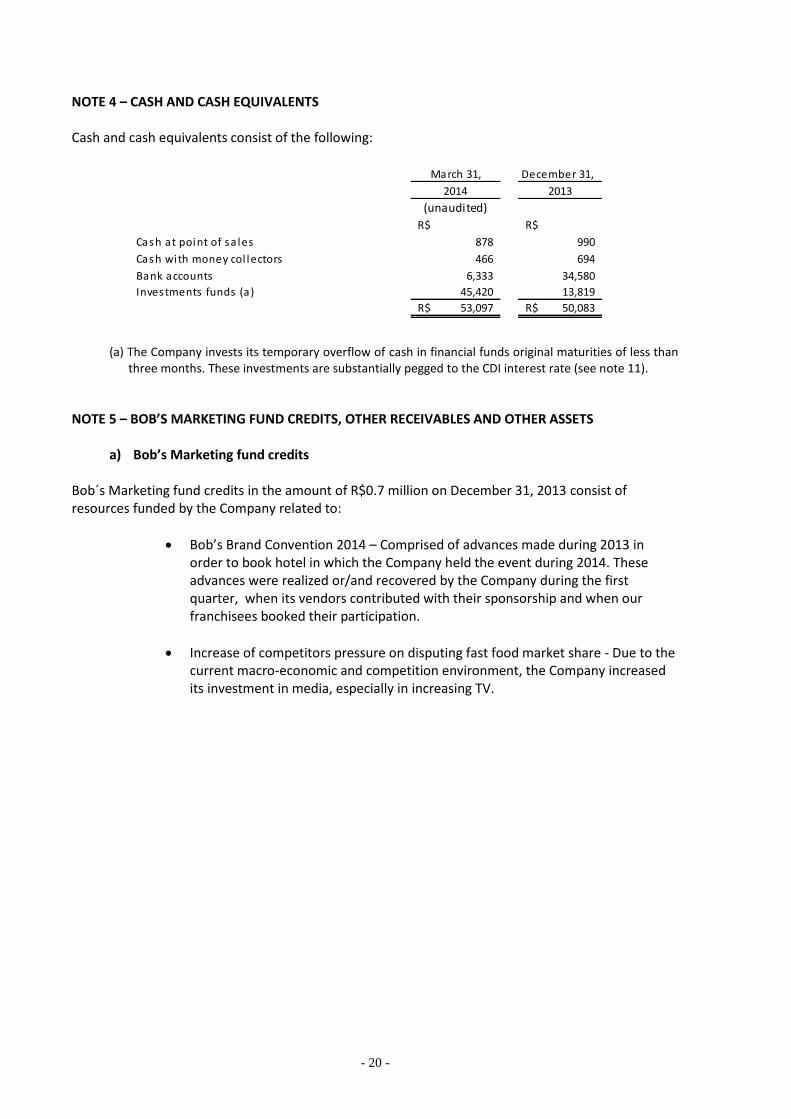
NOTE 4 – CASH AND CASH EQUIVALENTS Cash and cash equivalents consist of the following:
(a) The Company invests its temporary overflow of cash in financial funds original maturities of less than
three months. These investments are substantially pegged to the CDI interest rate (see note 11).
NOTE 5 – BOB’S MARKETING FUND CREDITS, OTHER RECEIVABLES AND OTHER ASSETS
a) Bob’s Marketing fund credits
Bob´s Marketing fund credits in the amount of R$0.7 million on December 31, 2013 consist of resources funded by the Company related to:
Bob’s Brand Convention 2014 – Comprised of advances made during 2013 in order to book hotel in which the Company held the event during 2014. These advances were realized or/and recovered by the Company during the first quarter, when its vendors contributed with their sponsorship and when our franchisees booked their participation.
Increase of competitors pressure on disputing fast food market share - Due to the current macro-economic and competition environment, the Company increased its investment in media, especially in increasing TV.
December 31,
R$ R$
Cash at point of sa les 878 990
Cash with money col lectors 466 694
Bank accounts 6,333 34,580
Investments funds (a) 45,420 13,819
R$ 53,097 R$ 50,083
(unaudited)
2014 2013
March 31,
- 21 -
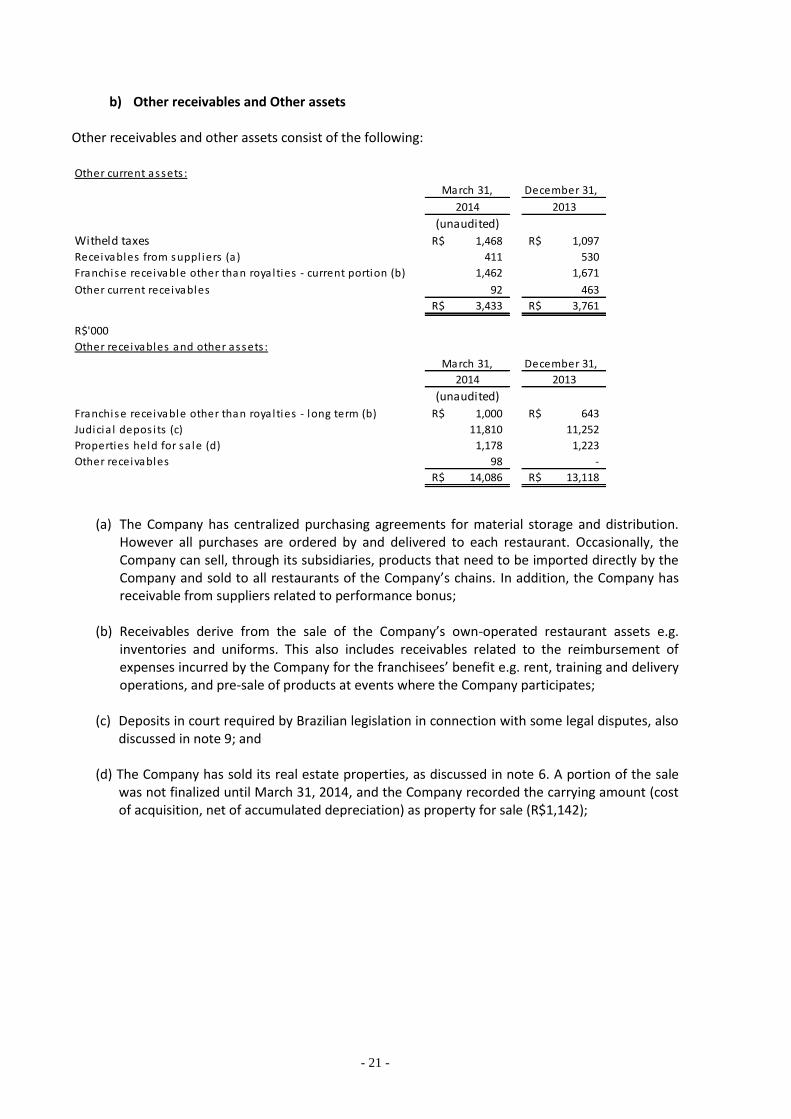
b) Other receivables and Other assets Other receivables and other assets consist of the following:
(a) The Company has centralized purchasing agreements for material storage and distribution. However all purchases are ordered by and delivered to each restaurant. Occasionally, the Company can sell, through its subsidiaries, products that need to be imported directly by the Company and sold to all restaurants of the Company’s chains. In addition, the Company has receivable from suppliers related to performance bonus;
(b) Receivables derive from the sale of the Company’s own-operated restaurant assets e.g.
inventories and uniforms. This also includes receivables related to the reimbursement of expenses incurred by the Company for the franchisees’ benefit e.g. rent, training and delivery operations, and pre-sale of products at events where the Company participates;
(c) Deposits in court required by Brazilian legislation in connection with some legal disputes, also discussed in note 9; and
(d) The Company has sold its real estate properties, as discussed in note 6. A portion of the sale
was not finalized until March 31, 2014, and the Company recorded the carrying amount (cost of acquisition, net of accumulated depreciation) as property for sale (R$1,142);
Other current assets :
December 31,
Witheld taxes R$ 1,468 R$ 1,097
Receivables from suppl iers (a) 411 530
Franchise receivable other than royalties - current portion (b) 1,462 1,671
Other current receivables 92 463
R$ 3,433 R$ 3,761
R$'000
Other receivables and other assets :
December 31,
Franchise receivable other than royalties - long term (b) R$ 1,000 R$ 643
Judicia l depos its (c) 11,810 11,252
Properties held for sa le (d) 1,178 1,223
Other receivables 98 -
R$ 14,086 R$ 13,118
2014 2013
March 31,
2014 2013
March 31,
(unaudited)
(unaudited)
- 22 -
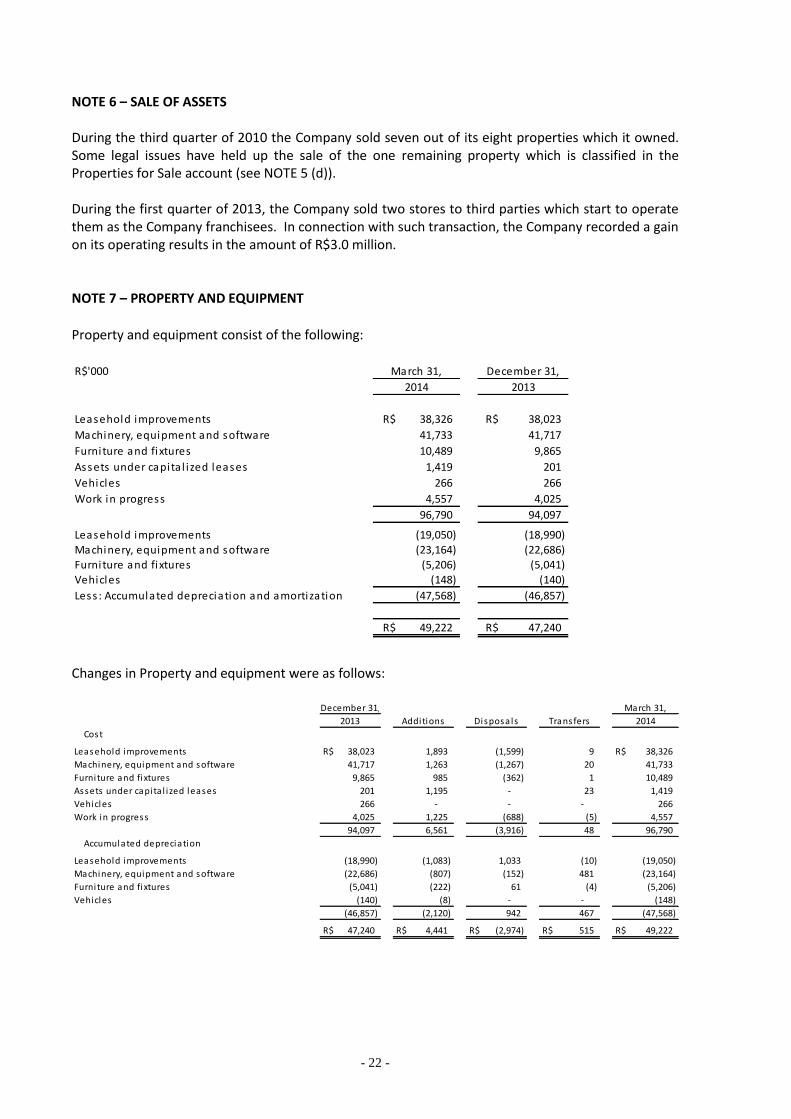
NOTE 6 – SALE OF ASSETS During the third quarter of 2010 the Company sold seven out of its eight properties which it owned. Some legal issues have held up the sale of the one remaining property which is classified in the Properties for Sale account (see NOTE 5 (d)).
During the first quarter of 2013, the Company sold two stores to third parties which start to operate them as the Company franchisees. In connection with such transaction, the Company recorded a gain on its operating results in the amount of R$3.0 million. NOTE 7 – PROPERTY AND EQUIPMENT
Property and equipment consist of the following:
Changes in Property and equipment were as follows:
R$'000
Leasehold improvements R$ 38,326 R$ 38,023
Machinery, equipment and software 41,733 41,717
Furniture and fixtures 10,489 9,865
Assets under capita l i zed leases 1,419 201
Vehicles 266 266
Work in progress 4,557 4,025
96,790 94,097
Leasehold improvements (19,050) (18,990)
Machinery, equipment and software (23,164) (22,686) Furniture and fixtures (5,206) (5,041)
Vehicles (148) (140)
Less : Accumulated depreciation and amortization (47,568) (46,857)
R$ 49,222 R$ 47,240
March 31, December 31,
2014 2013
Cost
Leasehold improvements R$ 38,023 1,893 (1,599) 9 R$ 38,326
Machinery, equipment and software 41,717 1,263 (1,267) 20 41,733
Furniture and fixtures 9,865 985 (362) 1 10,489
Assets under capita l i zed leases 201 1,195 - 23 1,419
Vehicles 266 - - - 266
Work in progress 4,025 1,225 (688) (5) 4,557
94,097 6,561 (3,916) 48 96,790
Accumulated depreciation
Leasehold improvements (18,990) (1,083) 1,033 (10) (19,050)
Machinery, equipment and software (22,686) (807) (152) 481 (23,164)
Furniture and fixtures (5,041) (222) 61 (4) (5,206)
Vehicles (140) (8) - - (148)
(46,857) (2,120) 942 467 (47,568)
R$ 47,240 R$ 4,441 R$ (2,974) R$ 515 R$ 49,222
December 31, March 31,
2013 Additions Disposals Transfers 2014
- 23 -
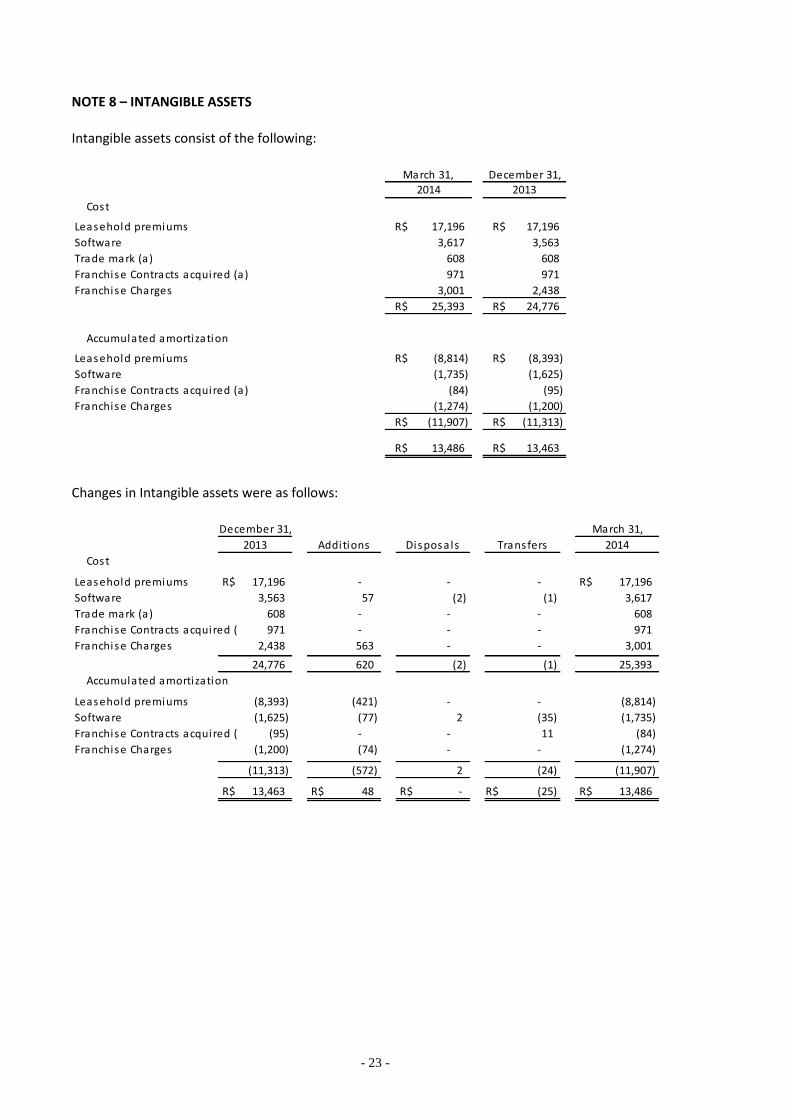
NOTE 8 – INTANGIBLE ASSETS
Intangible assets consist of the following:
Changes in Intangible assets were as follows:
Cost
Leasehold premiums R$ 17,196 R$ 17,196
Software 3,617 3,563
Trade mark (a) 608 608
Franchise Contracts acquired (a) 971 971
Franchise Charges 3,001 2,438
R$ 25,393 R$ 24,776
Accumulated amortization
Leasehold premiums R$ (8,814) R$ (8,393)
Software (1,735) (1,625)
Franchise Contracts acquired (a) (84) (95)
Franchise Charges (1,274) (1,200)
R$ (11,907) R$ (11,313)
R$ 13,486 R$ 13,463
December 31,March 31,
2014 2013
Cost
Leasehold premiums R$ 17,196 - - - R$ 17,196
Software 3,563 57 (2) (1) 3,617
Trade mark (a) 608 - - - 608
Franchise Contracts acquired (a) 971 - - - 971
Franchise Charges 2,438 563 - - 3,001
24,776 620 (2) (1) 25,393
Accumulated amortization
Leasehold premiums (8,393) (421) - - (8,814)
Software (1,625) (77) 2 (35) (1,735)
Franchise Contracts acquired (a) (95) - - 11 (84)
Franchise Charges (1,200) (74) - - (1,274) -
(11,313) (572) 2 (24) (11,907)
R$ 13,463 R$ 48 R$ - R$ (25) R$ 13,486
December 31, March 31,
2013 Additions Disposals 2014Transfers
- 24 -
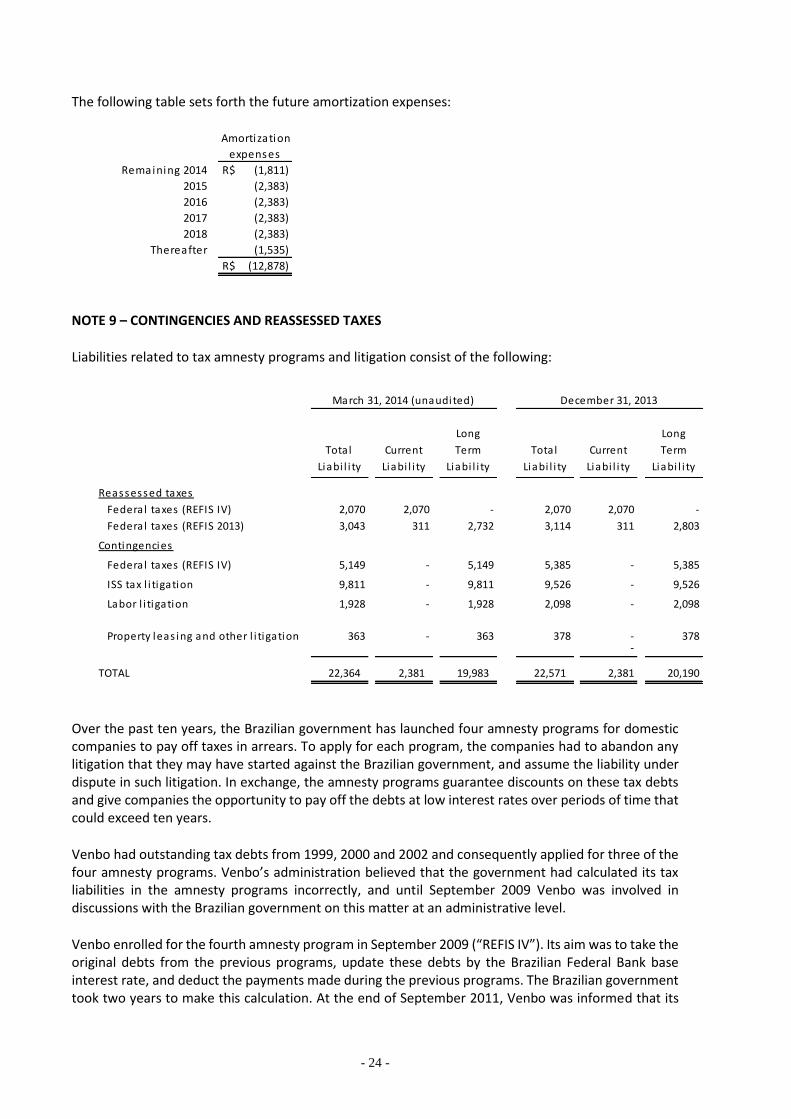
The following table sets forth the future amortization expenses:
NOTE 9 – CONTINGENCIES AND REASSESSED TAXES
Liabilities related to tax amnesty programs and litigation consist of the following:
Over the past ten years, the Brazilian government has launched four amnesty programs for domestic companies to pay off taxes in arrears. To apply for each program, the companies had to abandon any litigation that they may have started against the Brazilian government, and assume the liability under dispute in such litigation. In exchange, the amnesty programs guarantee discounts on these tax debts and give companies the opportunity to pay off the debts at low interest rates over periods of time that could exceed ten years.
Venbo had outstanding tax debts from 1999, 2000 and 2002 and consequently applied for three of the four amnesty programs. Venbo’s administration believed that the government had calculated its tax liabilities in the amnesty programs incorrectly, and until September 2009 Venbo was involved in discussions with the Brazilian government on this matter at an administrative level.
Venbo enrolled for the fourth amnesty program in September 2009 (“REFIS IV”). Its aim was to take the original debts from the previous programs, update these debts by the Brazilian Federal Bank base interest rate, and deduct the payments made during the previous programs. The Brazilian government took two years to make this calculation. At the end of September 2011, Venbo was informed that its
Amortization
Remaining 2014 R$ (1,811)
2015 (2,383)
2016 (2,383)
2017 (2,383)
2018 (2,383)
Thereafter (1,535)
R$ (12,878)
expenses
Long Long
Total Current Term Total Current Term
Liabi l i ty Liabi l i ty Liabi l i ty Liabi l i ty Liabi l i ty Liabi l i ty
Reassessed taxes
Federa l taxes (REFIS IV) 2,070 2,070 - 2,070 2,070 -
Federa l taxes (REFIS 2013) 3,043 311 2,732 3,114 311 2,803
Contingencies
Federa l taxes (REFIS IV) 5,149 - 5,149 5,385 - 5,385
ISS tax l i tigation 9,811 - 9,811 9,526 - 9,526
Labor l i tigation 1,928 - 1,928 2,098 - 2,098
Property leas ing and other l i tigation 363 - 363 378 - 378 -
TOTAL 22,364 2,381 19,983 22,571 2,381 20,190
December 31, 2013March 31, 2014 (unaudited)
- 25 -
consolidated tax debt was approximately R$22.4 million. Since the amnesty program allowed income tax credits to be used to reduce the debt, Venbo was able to cut its tax debt by the R$11.1 million it had in income tax credits.
Venbo disagrees with the amount calculated by the Brazilian government in September 2011. Venbo believes that the Brazilian government failed to consider the payments it made during the prior amnesty programs, which totaled R$10.4 million. According to Venbo’s records, Venbo should owe R$4.2 million after the income tax credits are included in the calculations.
Venbo filed an administrative appeal against the Brazilian Internal Revenue Service’s ruling, requesting a review of the calculations for the REFIS IV program. In 2013, the Company received a negative response from the Brazilian government. The Company therefore filed a second administrative appeal and is in the process of gathering all the documentation required to file a judicial claim against the Brazilian Internal Revenue Service. At this time, Venbo cannot estimate what the outcome of this claim will be and whether it will be able to reduce the liability to the amount it believes it owes.
Under the REFIS IV program, Venbo will pay 130 more monthly installments of approximately R$47,300 and three monthly installments of approximately R$111,700 commencing in April 2014, with interest accruing at rates set by the Brazilian Federal Government (SELIC), which is currently 9.24%p.a.
During the three-month period ended March 31, 2014, the Company paid approximately R$0.3 million (R$0.7 million in the same period of 2013) related to REFIS IV program, including R$0.1 million of interests.
Besides the debts included in REFIS IV, the Company received other notifications from the Brazilian tax authorities in the last quarter of 2013, claiming that Venbo used invalid tax credits to reduce different federal taxes (mainly income tax, PIS and COFINS). In the same period, the Brazilian tax authority established another federal tax settlement program, named “REFIS 2013”.
The Company’s accounting department and tax accounting advisors understand that the Company would probably have a negative outcome if it took this matter to court, and accordingly the Company’s management opted to include these debts in the REFIS 2013 program.
Under the terms of this new tax amnesty program, the amounts due through December 31, 2013, will be paid in 120 monthly installments, an 80% reduction in the penalty, a 40% reduction in interest, and a 100% reduction in legal charges.
The debts included in this program have been recorded in the Company’s financial statements as follows: R$1,436 as Other Operating Expenses and R$1,293 as Interest Expenses in 2013 in its Statement of Operations, and a total counterpart of R$2,729 as a liability in the balance sheet as at December 31, 2013.
Contingencies
• REFIS IV
As discussed above, Venbo does not agree with a portion of the tax debt consolidated by the Brazilian Federal government, and has initiated proceedings to have its tax debt reviewed. The portion of the liability under dispute has been reclassified to a contingency account.
• Income tax notice
- 26 -
In 2006 the Company set up a Brazilian holding company, BFFC do Brasil Comércio e Participações Ltda (“BFFC do Brasil”, formerly 22N Participações Ltda), via the capital contribution of the equity interest the Company held in Venbo Comércio de Alimentos Ltda (“Venbo”).
Through this restructuring, the Company started to consolidate its businesses in Brazil through BFFC do Brasil, resulting in enhanced management decisions, improved efficiency, and easier access to bank loans. All these developments derived from the Company’s multi-brand strategy, which involved the operation in Brazil of international fast-food trademarks such as KFC, Pizza Hut and Doggis, followed by the acquisition of the Yoggi’s brand (local frozen yogurt franchisee).
In addition to the operating benefits, this restructuring generated income tax credits for Venbo for the five years subsequent to 2006.
The Company’s restructuring process and related tax benefits were reported on the Company’s Consolidated Financial Statements as at December 31, 2006 and 2007.
In the second semester of 2013, Venbo Comércio de Alimentos Ltda (“Venbo”), an indirect subsidiary of the Company, received notice from the Brazilian tax authorities requiring an inspection of its tax records. The tax inspectors found that a restructuring carried out in 2006, which was related to a consolidation of the Company’s businesses in Brazil and which generated income tax credits for Venbo, constituted abusive tax planning. As a consequence, Venbo was fined R$17 million. The Company filed an administrative appeal against the penalty charged by the Brazilian Internal Revenue Service (“RFB”).
The Company estimates that the RFB’s decision on whether it will uphold its decision will take two or three years at the administrative level. Should it uphold the tax assessment, the Company will take the matter to court, where it and its legal advisors expect to obtain a positive outcome. Based on these estimates the Company did not accrue any liability related to this issue in its Consolidated Financial Statements as at March 31, 2014. There can be no assurance that this tax assessment will not have a material impact on the business.
• ISS tax litigation
None of the Company’s revenues were subject to municipal tax on services rendered (ISS) until 2003. At the beginning of 2004, new legislation came in, which stated that royalties were to be considered liable for ISS tax payment. Although the Company is claiming in court that royalties should not be understood as payment for services rendered and therefore should not be taxed under ISS legislation, the Company is making monthly deposits of the amount claimed in court.
By March 31, 2014, the Company had deposited R$9.8 million (R$9.4 million by December 31, 2013), which, based on the opinion of its legal advisors, the Company’s management believes to be sufficient to cover the Company’s current ISS tax contingencies.
In the third quarter of 2009, the Company’s claim was partially settled in court. The decision required the Rio de Janeiro municipality to reimburse the Company approximately R$0.5 million paid in taxes ‘before the new ISS legislation was enacted. The Company is studying how the tax credits likely to be received from the municipality could be used to offset other taxes to be paid to the municipality, since the Company is currently depositing the amount due in court. In view of the uncertainty about whether this tax credit will be realized, the Company does not recognize the related amount as a gain.
The referred change in ISS tax legislation has triggered much debate about whether marketing fund contributions and initial fees paid by franchisees should be considered services rendered and be liable for ISS tax payment. The Company and its legal advisors understand that such payments are not covered
- 27 -
by ISS legislation, and that accordingly, they are not subject to such taxation. The Company and its legal advisors are making every effort to prevent marketing fund contributions and initial fees from being liable for this tax.
• Labor litigation
As of March 31, 2014, the Company accounted for R$1.9 million for labor-related liabilities (R$1.8 million in December 31, 2013), which Management, based on the opinion of its legal advisors, deems sufficient to cover the Company’s existing labor contingencies.
• Other contingencies
As of March 31, 2014 the Company 2013 the Company had other unresolved claims pending related to the former owner of Venbo, to franchisees or ex-franchisees, to owners of properties where the Company held lease contracts, to former employees and others, for which its legal advisors evaluated as possible and favorable outcome in the approximately amount of R$33.1 million. For those claims no liability was recorded in the Company´s balance sheet as per the accounting practices.
NOTE 10 – DEFERRED INCOME
The Company settles agreements with beverage and food suppliers, and for each product it negotiates a monthly performance bonus which depends on the product’s sales volume to its chains (including own-operated and franchise operated stores). The performance bonus, or vendor bonus, can be paid monthly or in advance (estimated), depending on the agreement terms negotiated with each supplier. When a vendor bonus is received in advance in cash, it is recorded as an entry in “Cash and Cash Equivalents” with a corresponding credit in Deferred Income and is recognized on a straight-line basis over the term of the related supply agreement on a monthly basis. Performance bonuses may also include exclusivity agreements, which are normally paid in advance by suppliers.
- 28 -
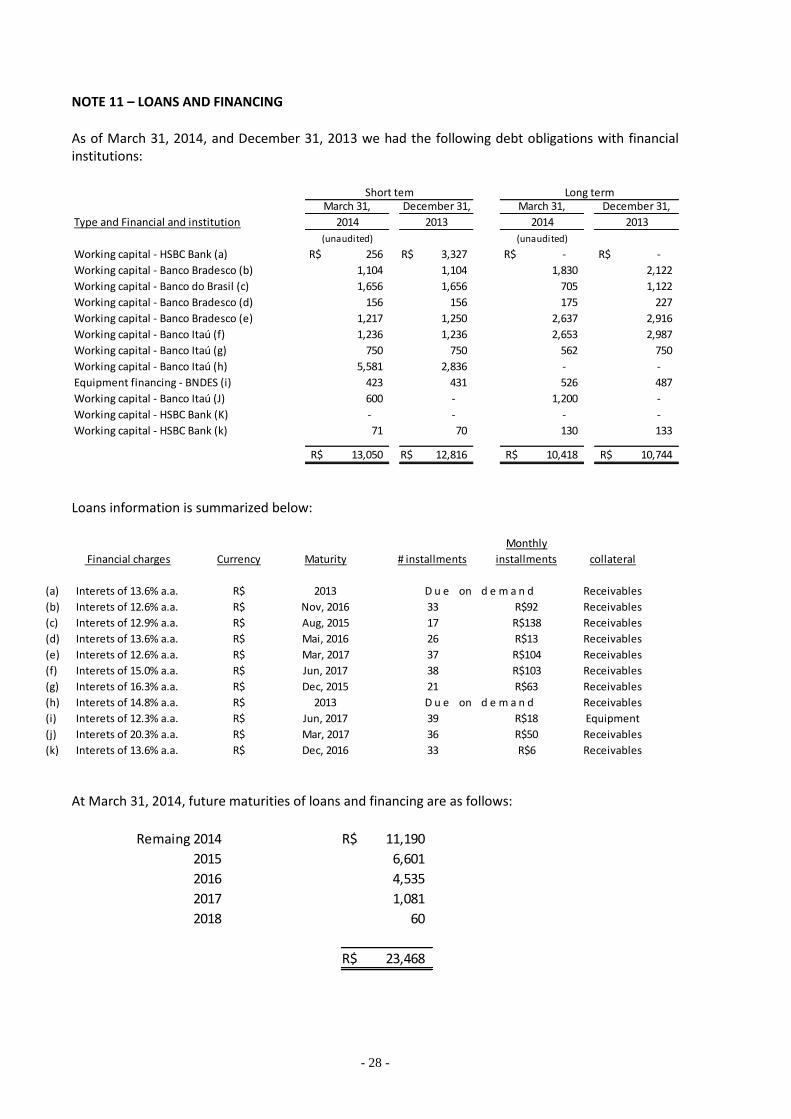
NOTE 11 – LOANS AND FINANCING
As of March 31, 2014, and December 31, 2013 we had the following debt obligations with financial institutions:
Loans information is summarized below:
At March 31, 2014, future maturities of loans and financing are as follows:
R$ 256 R$ 3,327 R$ - R$ -
1,104 1,104 1,830 2,122
1,656 1,656 705 1,122
156 156 175 227
1,217 1,250 2,637 2,916
1,236 1,236 2,653 2,987
750 750 562 750
5,581 2,836 - -
423 431 526 487
600 - 1,200 -
- - - -
71 70 130 133
R$ 13,050 R$ 12,816 R$ 10,418 R$ 10,744
Working capital - Banco Itaú (J)
December 31,
2014
March 31,
2013 2014 2013
Short tem Long termMarch 31, December 31,
(unaudited) (unaudited)
Type and Financial and institution
Working capital - HSBC Bank (a)
Working capital - Banco Bradesco (b)
Working capital - Banco do Brasil (c)
Working capital - Banco Bradesco (d)
Working capital - HSBC Bank (k)
Working capital - HSBC Bank (K)
Working capital - Banco Bradesco (e)
Working capital - Banco Itaú (f)
Working capital - Banco Itaú (h)
Equipment financing - BNDES (i)
Working capital - Banco Itaú (g)
Monthly
Financial charges Currency Maturity # installments installments collateral
(a) Interets of 13.6% a.a. R$ 2013 Receivables
(b) Interets of 12.6% a.a. R$ Nov, 2016 33 R$92 Receivables
(c) Interets of 12.9% a.a. R$ Aug, 2015 17 R$138 Receivables
(d) Interets of 13.6% a.a. R$ Mai, 2016 26 R$13 Receivables
(e) Interets of 12.6% a.a. R$ Mar, 2017 37 R$104 Receivables
(f) Interets of 15.0% a.a. R$ Jun, 2017 38 R$103 Receivables
(g) Interets of 16.3% a.a. R$ Dec, 2015 21 R$63 Receivables
(h) Interets of 14.8% a.a. R$ 2013 Receivables
(i) Interets of 12.3% a.a. R$ Jun, 2017 39 R$18 Equipment
(j) Interets of 20.3% a.a. R$ Mar, 2017 36 R$50 Receivables
(k) Interets of 13.6% a.a. R$ Dec, 2016 33 R$6 Receivables
D u e on d e m a n d
D u e on d e m a n d
Remaing 2014 R$ 11,190
2015 6,601
2016 4,535
2017 1,081
2018 60
R$ 23,468
- 29 -
From the total debt of R$23.5 million, R$3.3 million have variable interest rates based on CDI. CDI is a daily variable interest rate used by Brazilian banks. It is linked to the Brazilian equivalent of the Federal Reserve fund rates and its fluctuations are much like those observed in the international financial market. Based on these outstanding amounts, a 100 basis point change in interest rates would raise our interest expense by approximately R$0.1 million at March 31, 2014. NOTE 12 – OTHER LIABILITIES During the second quarter of 2012, the Company initiated a new intensive program through which certain of its employees may receive a compensation bonus in cash in 2015 if certain annual targets are met from 2012 to 2015. In connection with this new program, the Company has accrued R$2,173 as other liabilities in its consolidated balance sheet as of March 31, 2014. NOTE 13 – SEGMENT INFORMATION The Company owns and operates, both directly and through franchisees, Brazil’s second largest fast food restaurant chain, with 1,176 point of sales. The Company owns and operates, through its subsidiaries Separk, Venbo, LM, DGS and PCN, 35 points of sale under the Bob’s brand. Besides the own-operated point of sales, 1,023 point of sales are operated by franchisees under the Bob’s brand. The franchise operations for the Bobs brand were managed by Venbo until the end of 2013. Since the first quarter of 2014, such business is managed by DGS. Since April 2007, the Company has operated the KFC brand in Brazil. Currently, the Company owns and operates, through its subsidiaries CFK SP, Little Boss and MPSC, 13 stores in Rio de Janeiro and São Paulo under the KFC brand. Since December 2008, the Company has operated the Pizza Hut brand in São Paulo, Brazil, through its subsidiary IRB. Currently, the Company owns and operates 34 stores in São Paulo under the Pizza Hut brand. Since September 2008, the Company has operated the Doggis brand in Brazil, through its subsidiary, DGS until December 2013 and through its subsidiary FCK since January 2014. In 2011, the Company converted all of its own-operated Doggis stores to franchised stores. Currently, 26 points of sale are operated by franchisees under Doggis’ brand. In May 2012, the Company acquired Yoggi, a frozen yogurt chain which operates in Brazil since in 2008. Currently, 45 points of sale are operated by franchisees under Yoggi’s brand. Currently, most of the Company’s operations are concentrated in southeastern Brazil. As of March 31, 2014, of the total of 1,176 points of sales, 672 were located at the same region, providing 57.2% of total. Outside Brazil, the Bob’s brand is also present through franchise operations in Angola, Africa (five stores) and, since the last quarter of 2009, Chile, South America (seven stores). These operations are not material to our overall results.
- 30 -
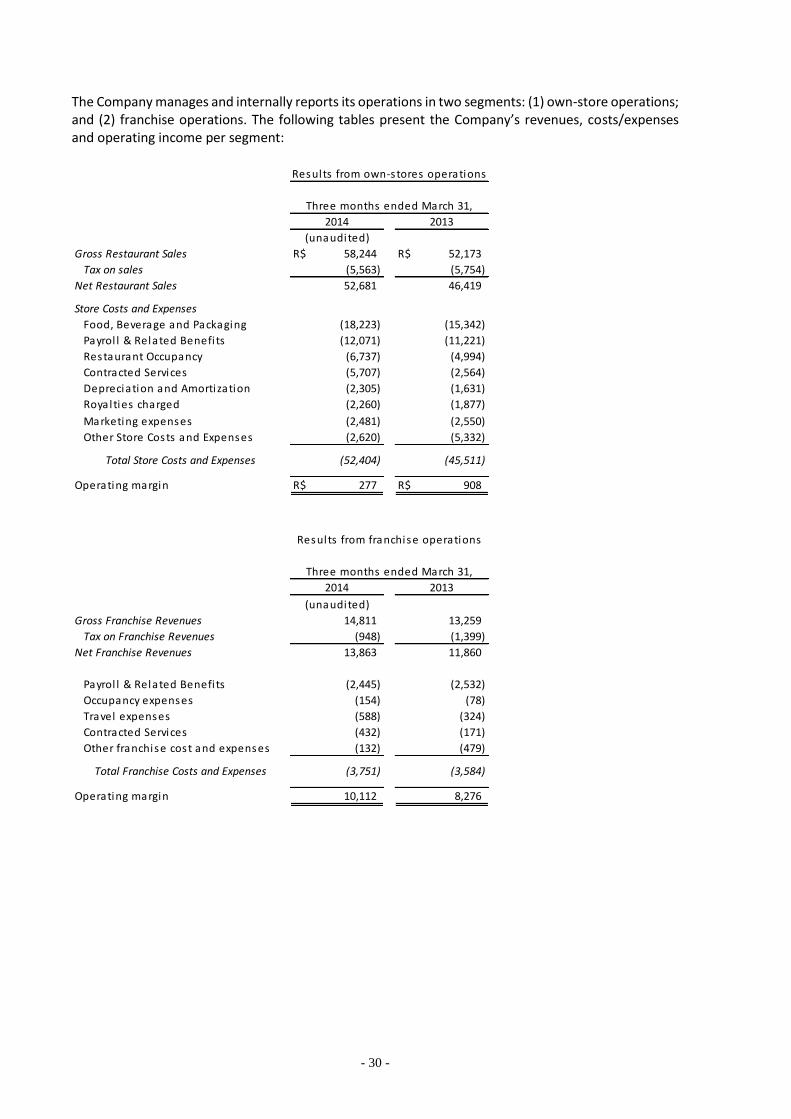
The Company manages and internally reports its operations in two segments: (1) own-store operations; and (2) franchise operations. The following tables present the Company’s revenues, costs/expenses and operating income per segment:
Gross Restaurant Sales R$ 58,244 R$ 52,173
Tax on sales (5,563) (5,754)
Net Restaurant Sales 52,681 46,419
Store Costs and Expenses
Food, Beverage and Packaging (18,223) (15,342)
Payrol l & Related Benefi ts (12,071) (11,221)
Restaurant Occupancy (6,737) (4,994)
Contracted Services (5,707) (2,564)
Depreciation and Amortization (2,305) (1,631)
Royalties charged (2,260) (1,877)
Marketing expenses (2,481) (2,550)
Other Store Costs and Expenses (2,620) (5,332)
Operating margin R$ 277 R$ 908
(45,511)
Results from own-stores operations
Three months ended March 31,
(52,404)
(unaudited)
2014 2013
Total Store Costs and Expenses
Gross Franchise Revenues 14,811 13,259
Tax on Franchise Revenues (948) (1,399)
Net Franchise Revenues 13,863 11,860
Payrol l & Related Benefi ts (2,445) (2,532)
Occupancy expenses (154) (78)
Travel expenses (588) (324)
Contracted Services (432) (171)
Other franchise cost and expenses (132) (479)
Operating margin 10,112 8,276
(3,751) (3,584)
Three months ended March 31,
2014 2013
Results from franchise operations
(unaudited)
Total Franchise Costs and Expenses
- 31 -
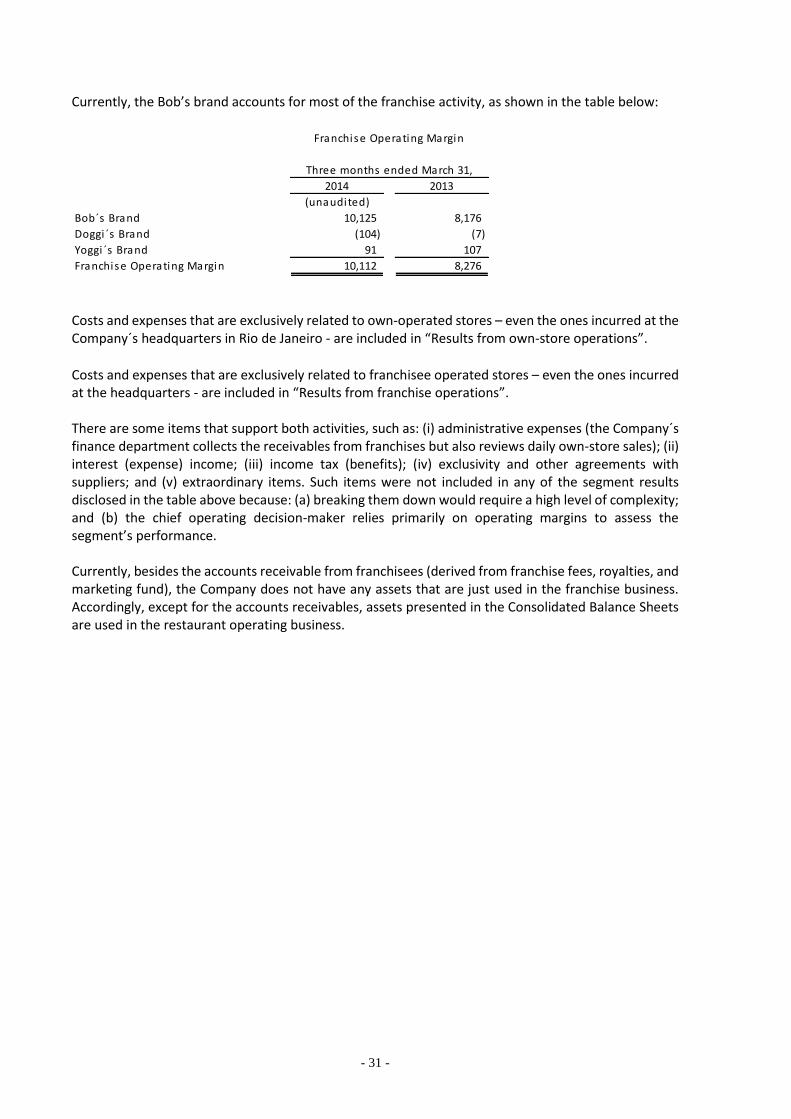
Currently, the Bob’s brand accounts for most of the franchise activity, as shown in the table below:
Costs and expenses that are exclusively related to own-operated stores – even the ones incurred at the Company´s headquarters in Rio de Janeiro - are included in “Results from own-store operations”.
Costs and expenses that are exclusively related to franchisee operated stores – even the ones incurred at the headquarters - are included in “Results from franchise operations”. There are some items that support both activities, such as: (i) administrative expenses (the Company´s finance department collects the receivables from franchises but also reviews daily own-store sales); (ii) interest (expense) income; (iii) income tax (benefits); (iv) exclusivity and other agreements with suppliers; and (v) extraordinary items. Such items were not included in any of the segment results disclosed in the table above because: (a) breaking them down would require a high level of complexity; and (b) the chief operating decision-maker relies primarily on operating margins to assess the segment’s performance. Currently, besides the accounts receivable from franchisees (derived from franchise fees, royalties, and marketing fund), the Company does not have any assets that are just used in the franchise business. Accordingly, except for the accounts receivables, assets presented in the Consolidated Balance Sheets are used in the restaurant operating business.
Bob´s Brand 10,125 8,176
Doggi ´s Brand (104) (7)
Yoggi ´s Brand 91 107
Franchise Operating Margin 10,112 8,276
Three months ended March 31,
Franchise Operating Margin
(unaudited)
2014 2013
- 32 -
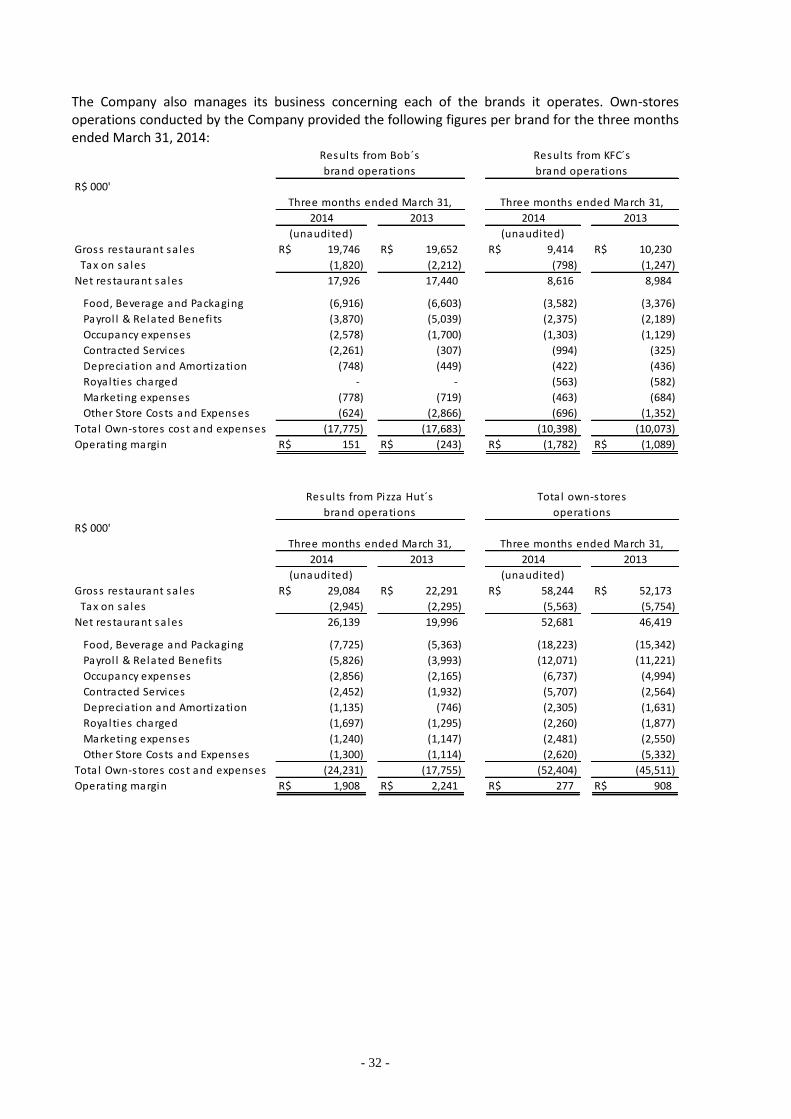
The Company also manages its business concerning each of the brands it operates. Own-stores operations conducted by the Company provided the following figures per brand for the three months ended March 31, 2014:
R$ 000'
Gross restaurant sa les R$ 19,746 R$ 19,652 R$ 9,414 R$ 10,230
Tax on sa les (1,820) (2,212) (798) (1,247)
Net restaurant sa les 17,926 17,440 8,616 8,984
Food, Beverage and Packaging (6,916) (6,603) (3,582) (3,376)
Payrol l & Related Benefi ts (3,870) (5,039) (2,375) (2,189)
Occupancy expenses (2,578) (1,700) (1,303) (1,129)
Contracted Services (2,261) (307) (994) (325)
Depreciation and Amortization (748) (449) (422) (436)
Royalties charged - - (563) (582)
Marketing expenses (778) (719) (463) (684)
Other Store Costs and Expenses (624) (2,866) (696) (1,352)
Total Own-stores cost and expenses (17,775) (17,683) (10,398) (10,073)
Operating margin R$ 151 R$ (243) R$ (1,782) R$ (1,089)
2014 2013 2014 2013
Three months ended March 31, Three months ended March 31,
brand operations brand operations
Results from Bob´s Results from KFC´s
(unaudited) (unaudited)
R$ 000'
Gross restaurant sa les R$ 29,084 R$ 22,291 R$ 58,244 R$ 52,173
Tax on sa les (2,945) (2,295) (5,563) (5,754)
Net restaurant sa les 26,139 19,996 52,681 46,419
Food, Beverage and Packaging (7,725) (5,363) (18,223) (15,342)
Payrol l & Related Benefi ts (5,826) (3,993) (12,071) (11,221)
Occupancy expenses (2,856) (2,165) (6,737) (4,994)
Contracted Services (2,452) (1,932) (5,707) (2,564)
Depreciation and Amortization (1,135) (746) (2,305) (1,631)
Royalties charged (1,697) (1,295) (2,260) (1,877)
Marketing expenses (1,240) (1,147) (2,481) (2,550)
Other Store Costs and Expenses (1,300) (1,114) (2,620) (5,332)
Total Own-stores cost and expenses (24,231) (17,755) (52,404) (45,511)
Operating margin R$ 1,908 R$ 2,241 R$ 277 R$ 908
Results from Pizza Hut´s
brand operations
Three months ended March 31,
2014 2013
(unaudited)
Total own-stores
operations
Three months ended March 31,
2014 2013
(unaudited)
- 33 -
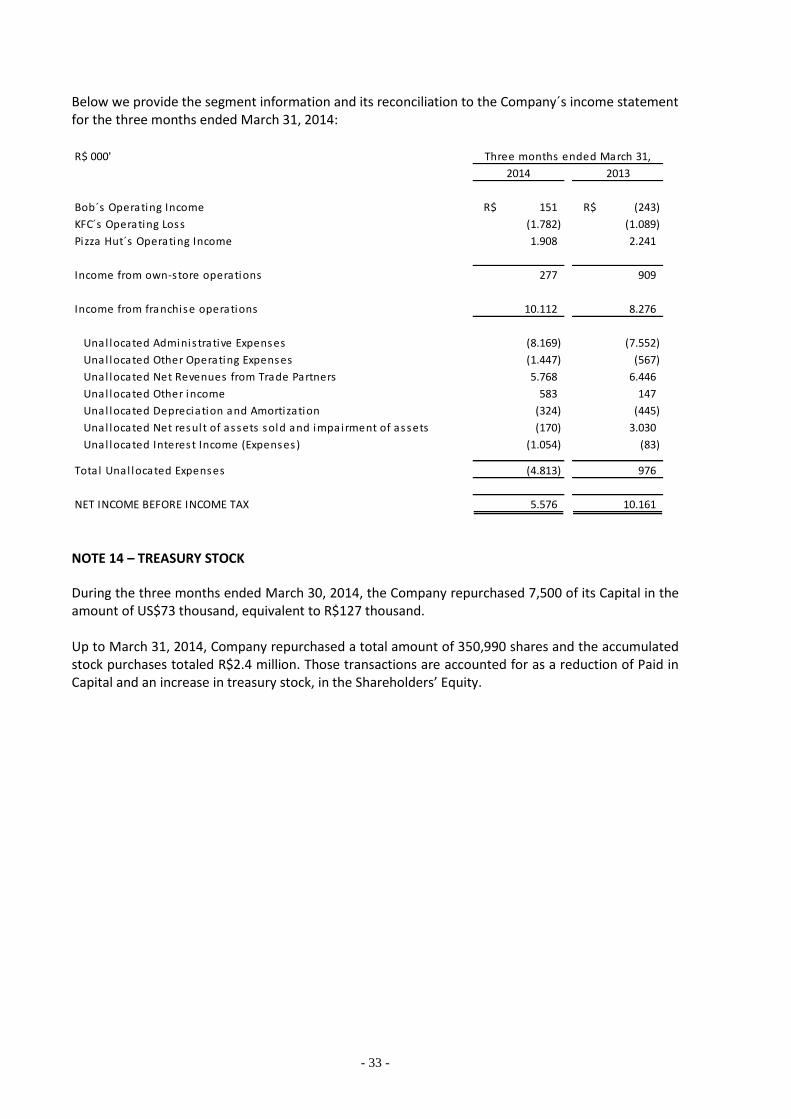
Below we provide the segment information and its reconciliation to the Company´s income statement for the three months ended March 31, 2014:
NOTE 14 – TREASURY STOCK
During the three months ended March 30, 2014, the Company repurchased 7,500 of its Capital in the amount of US$73 thousand, equivalent to R$127 thousand.
Up to March 31, 2014, Company repurchased a total amount of 350,990 shares and the accumulated stock purchases totaled R$2.4 million. Those transactions are accounted for as a reduction of Paid in Capital and an increase in treasury stock, in the Shareholders’ Equity.
R$ 000'
Bob´s Operating Income R$ 151 R$ (243)
KFC´s Operating Loss (1.782) (1.089)
Pizza Hut´s Operating Income 1.908 2.241
Income from own-store operations 277 909
Income from franchise operations 10.112 8.276
Unal located Adminis trative Expenses (8.169) (7.552)
Unal located Other Operating Expenses (1.447) (567)
Unal located Net Revenues from Trade Partners 5.768 6.446
Unal located Other income 583 147
Unal located Depreciation and Amortization (324) (445)
Unal located Net result of assets sold and impairment of assets (170) 3.030
Unal located Interest Income (Expenses) (1.054) (83)
Total Unal located Expenses (4.813) 976
NET INCOME BEFORE INCOME TAX 5.576 10.161
2014 2013
Three months ended March 31,
- 34 -
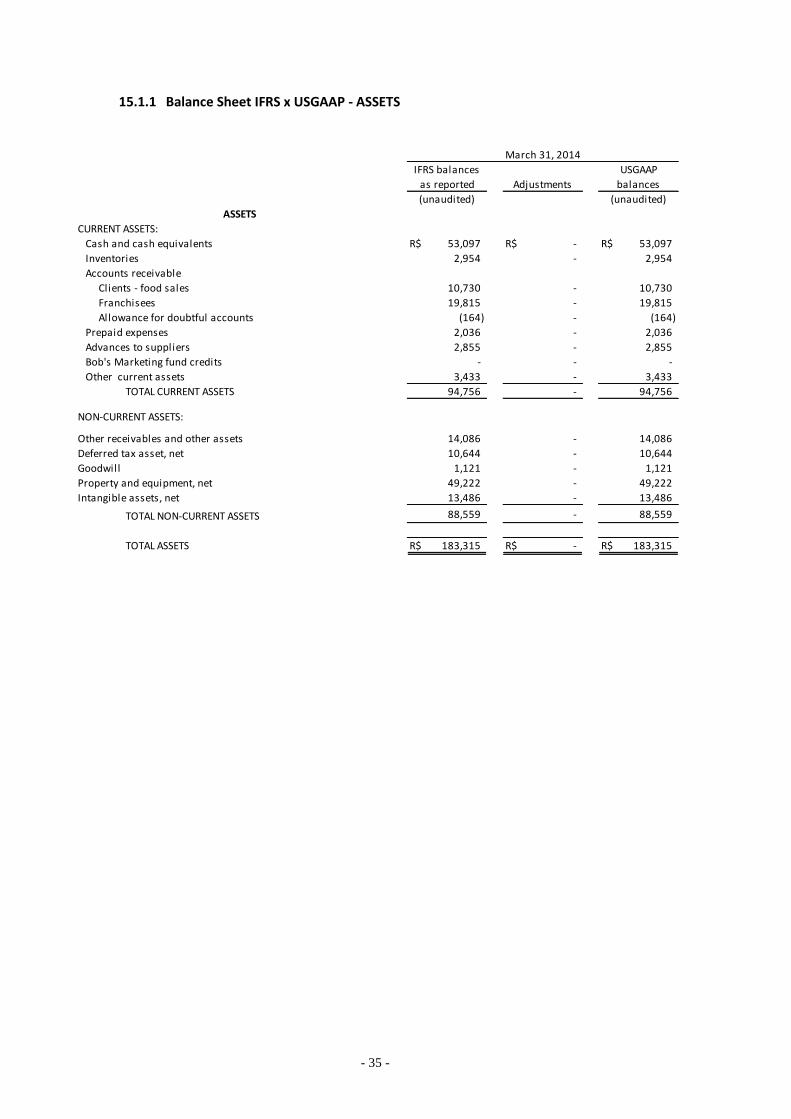
NOTE 15 – FIRST-TIME ADOPTION OF IFRS – TRANSITIONAL BASIS 15.1 - Consolidated quarterly information As discussed at note 2, until the year ended December 31, 2012, the Company disclosed its consolidated financial statements under the United States Generally Accepted Accounting Principles (US GAAP). In the year started January 1, 2013, the Company’s management decided to change its accounting practices and adopt the International Financial Reporting Standards (IFRS) issued by the International Accounting Standards Board (IASB) and, consequently, the consolidated Quarterly Information are being presented for the first time in accordance with the IFRS. Accordingly, the Company adopted the IFRS 1 in the preparation of these Consolidated Quarterly Financial Information at the transition date of January 1, 2011, and prepared its opening balance sheet pursuant to the IFRS on that date applying relevant mandatory exceptions and certain optional exemptions referring to the complete retrospective application of IFRS Standards, with its first reporting referring to the quarter ended March 31, 2013, in comparison with the information as of December 31, 2012. By means of a diagnosis, the Company’s management evaluated the effects of the adoption of the IFRS on the opening balance sheet (date of initial adoption January 1, 2011) and on the financial statements of the quarter ended March 31, 2014 and did not identify significant effects from the adoption of the IFRS in comparison with the US GAAP for the year ended December 31, 2013 and on the quarterly information as of March 31, 2014. In order to present the results of this diagnosis, the tables below detail the presentation of the quarterly information in accordance with the accounting practice currently adopted (IFRS) in comparison with the accounting practices previously adopted (US GAAP), in the consolidated balance sheet and shareholders’ equity of the Company, as of March 31, 2014, besides the respective statement of income and cash flow for the quarter then ended.
- 35 -
15.1.1 Balance Sheet IFRS x USGAAP - ASSETS
CURRENT ASSETS:
Cash and cash equivalents R$ 53,097 R$ - R$ 53,097
Inventories 2,954 - 2,954
Accounts receivable
Clients - food sales 10,730 - 10,730
Franchisees 19,815 - 19,815
Allowance for doubtful accounts (164) - (164)
Prepaid expenses 2,036 - 2,036
Advances to suppliers 2,855 - 2,855
Bob's Marketing fund credits - - -
Other current assets 3,433 - 3,433
TOTAL CURRENT ASSETS 94,756 - 94,756
NON-CURRENT ASSETS:
Other receivables and other assets 14,086 - 14,086
Deferred tax asset, net 10,644 - 10,644
Goodwill 1,121 - 1,121
Property and equipment, net 49,222 - 49,222
Intangible assets, net 13,486 - 13,486
TOTAL NON-CURRENT ASSETS 88,559 - 88,559
TOTAL ASSETS R$ 183,315 R$ - R$ 183,315
ASSETS
March 31, 2014
USGAAP
balances
(unaudited)
IFRS balances
as reported Adjustments
(unaudited)
- 36 -
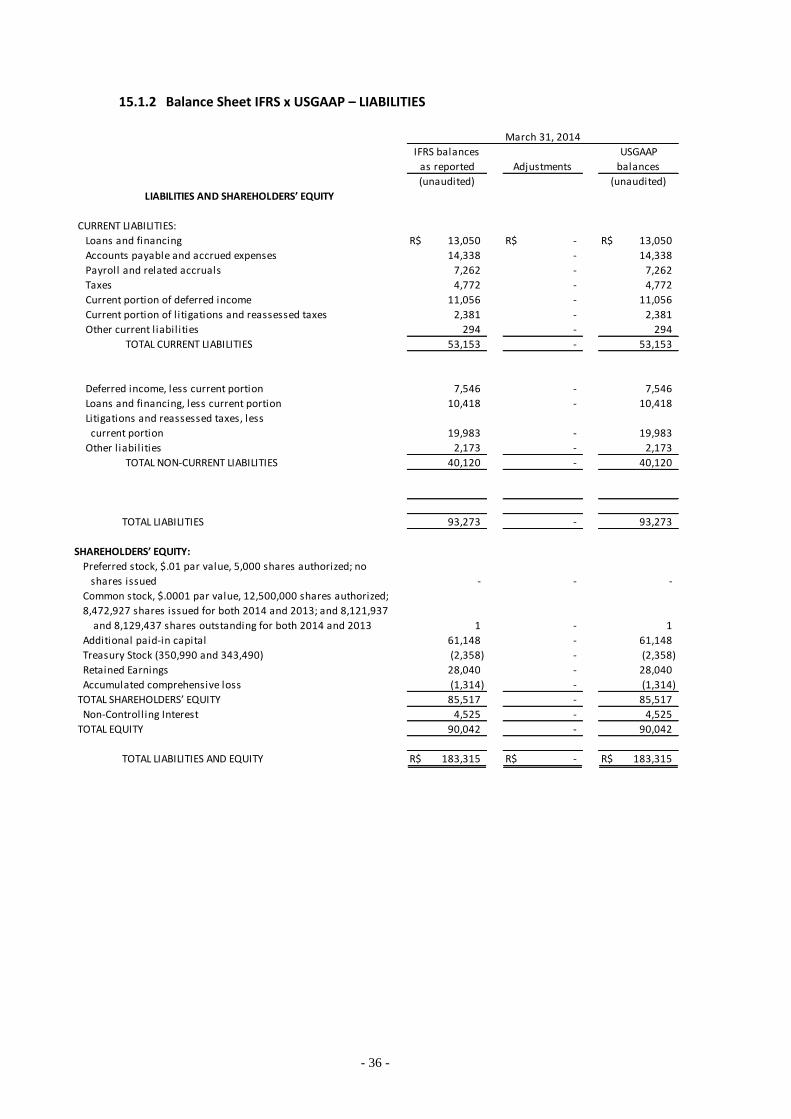
15.1.2 Balance Sheet IFRS x USGAAP – LIABILITIES
CURRENT LIABILITIES:
Loans and financing R$ 13,050 R$ - R$ 13,050
Accounts payable and accrued expenses 14,338 - 14,338
Payroll and related accruals 7,262 - 7,262
Taxes 4,772 - 4,772
Current portion of deferred income 11,056 - 11,056
Current portion of l itigations and reassessed taxes 2,381 - 2,381
Other current l iabilities 294 - 294
TOTAL CURRENT LIABILITIES 53,153 - 53,153
Deferred income, less current portion 7,546 - 7,546
Loans and financing, less current portion 10,418 - 10,418
Litigations and reassessed taxes, less
current portion 19,983 - 19,983
Other l iabilities 2,173 - 2,173
TOTAL NON-CURRENT LIABILITIES 40,120 - 40,120
TOTAL LIABILITIES 93,273 - 93,273
SHAREHOLDERS’ EQUITY:
Preferred stock, $.01 par value, 5,000 shares authorized; no
shares issued - - -
Common stock, $.0001 par value, 12,500,000 shares authorized;
8,472,927 shares issued for both 2014 and 2013; and 8,121,937
and 8,129,437 shares outstanding for both 2014 and 2013 1 - 1
Additional paid-in capital 61,148 - 61,148
Treasury Stock (350,990 and 343,490) (2,358) - (2,358)
Retained Earnings 28,040 - 28,040
Accumulated comprehensive loss (1,314) - (1,314)
TOTAL SHAREHOLDERS’ EQUITY 85,517 - 85,517
Non-Controlling Interest 4,525 - 4,525
TOTAL EQUITY 90,042 - 90,042
TOTAL LIABILITIES AND EQUITY R$ 183,315 R$ - R$ 183,315
balances
IFRS balances
as reported Adjustments
March 31, 2014
USGAAP
(unaudited)
LIABILITIES AND SHAREHOLDERS’ EQUITY
(unaudited)
- 37 -
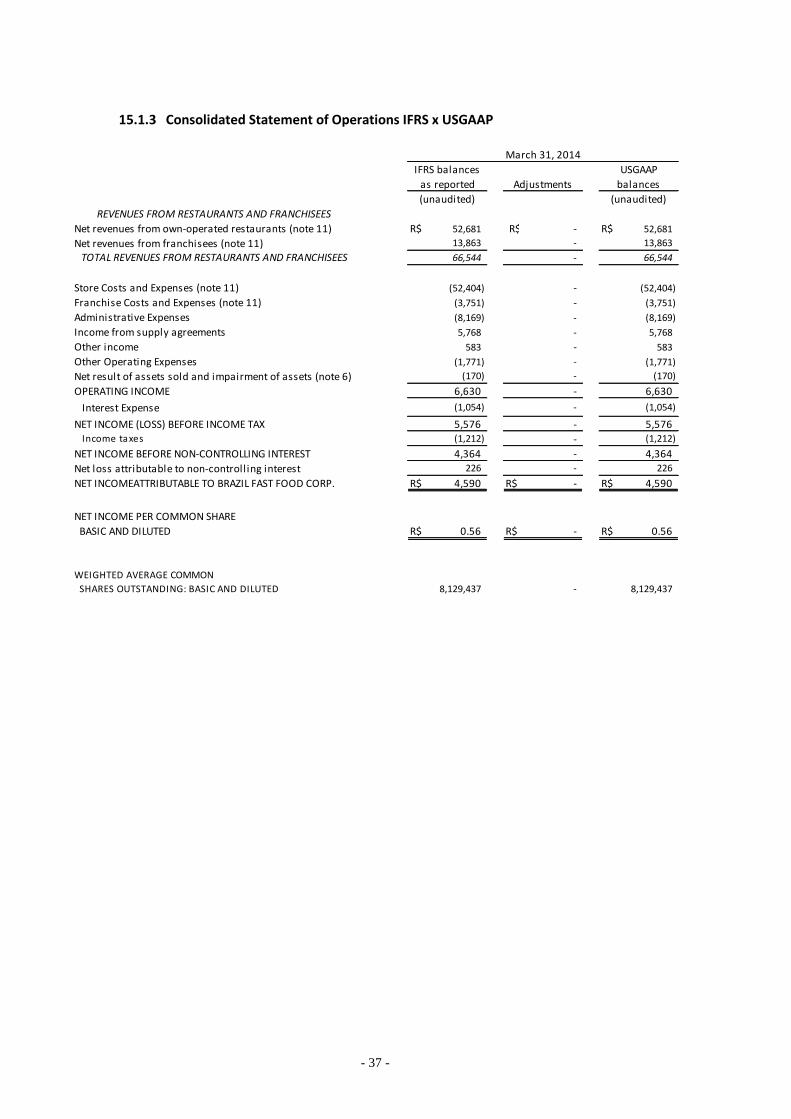
15.1.3 Consolidated Statement of Operations IFRS x USGAAP
Net revenues from own-operated restaurants (note 11) R$ 52,681 R$ - R$ 52,681
Net revenues from franchisees (note 11) 13,863 - 13,863
66,544 - 66,544
Store Costs and Expenses (note 11) (52,404) - (52,404)
Franchise Costs and Expenses (note 11) (3,751) - (3,751)
Administrative Expenses (8,169) - (8,169)
Income from supply agreements 5,768 - 5,768
Other income 583 - 583
Other Operating Expenses (1,771) - (1,771)
Net result of assets sold and impairment of assets (note 6) (170) - (170)
OPERATING INCOME 6,630 - 6,630
Interest Expense (1,054) - (1,054)
NET INCOME (LOSS) BEFORE INCOME TAX 5,576 - 5,576 Income taxes (1,212) - (1,212)
NET INCOME BEFORE NON-CONTROLLING INTEREST 4,364 - 4,364
Net loss attributable to non-controlling interest 226 - 226
NET INCOMEATTRIBUTABLE TO BRAZIL FAST FOOD CORP. R$ 4,590 R$ - R$ 4,590
NET INCOME PER COMMON SHARE
BASIC AND DILUTED R$ 0.56 R$ - R$ 0.56
WEIGHTED AVERAGE COMMON
SHARES OUTSTANDING: BASIC AND DILUTED 8,129,437 - 8,129,437
REVENUES FROM RESTAURANTS AND FRANCHISEES
TOTAL REVENUES FROM RESTAURANTS AND FRANCHISEES
(unaudited) (unaudited)
March 31, 2014
IFRS balances USGAAP
as reported Adjustments balances
- 38 -
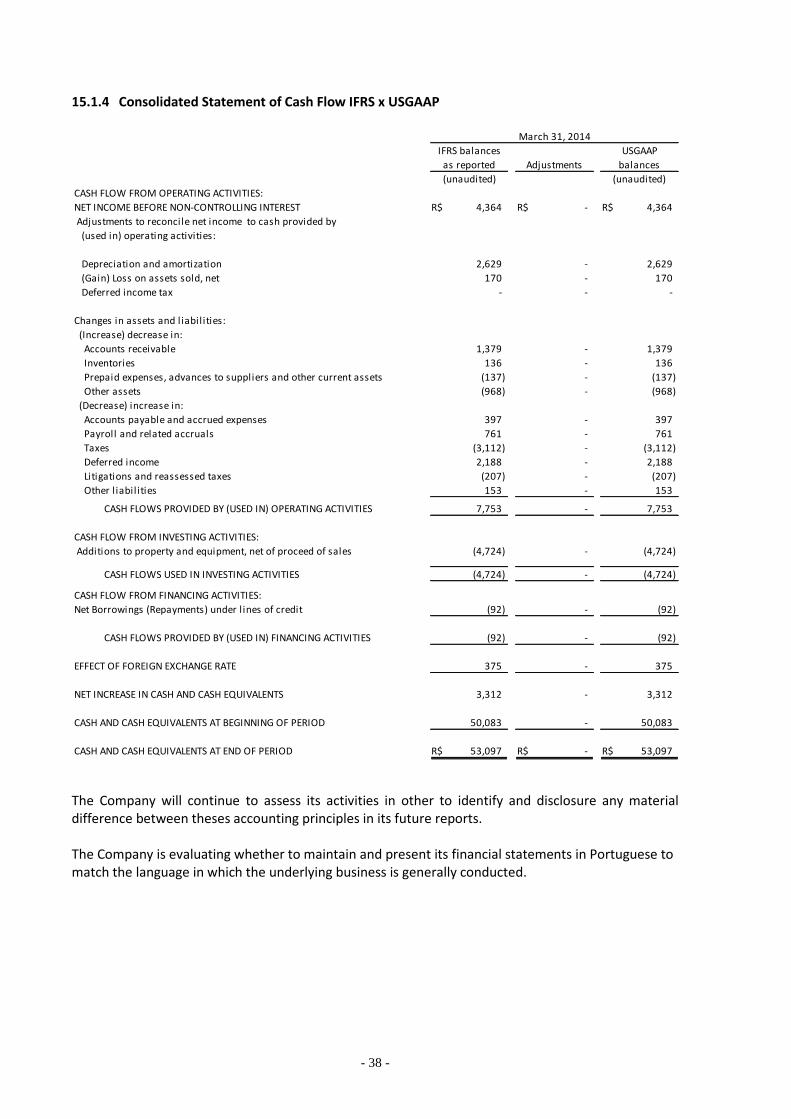
15.1.4 Consolidated Statement of Cash Flow IFRS x USGAAP
The Company will continue to assess its activities in other to identify and disclosure any material difference between theses accounting principles in its future reports. The Company is evaluating whether to maintain and present its financial statements in Portuguese to match the language in which the underlying business is generally conducted.
CASH FLOW FROM OPERATING ACTIVITIES:
NET INCOME BEFORE NON-CONTROLLING INTEREST R$ 4,364 R$ - R$ 4,364
Adjustments to reconcile net income to cash provided by
(used in) operating activities:
Depreciation and amortization 2,629 - 2,629
(Gain) Loss on assets sold, net 170 - 170
Deferred income tax - - -
Changes in assets and liabilities:
(Increase) decrease in:
Accounts receivable 1,379 - 1,379
Inventories 136 - 136
Prepaid expenses, advances to suppliers and other current assets (137) - (137)
Other assets (968) - (968)
(Decrease) increase in:
Accounts payable and accrued expenses 397 - 397
Payroll and related accruals 761 - 761
Taxes (3,112) - (3,112)
Deferred income 2,188 - 2,188
Litigations and reassessed taxes (207) - (207)
Other l iabilities 153 - 153
CASH FLOWS PROVIDED BY (USED IN) OPERATING ACTIVITIES 7,753 - 7,753
CASH FLOW FROM INVESTING ACTIVITIES:
Additions to property and equipment, net of proceed of sales (4,724) - (4,724)
CASH FLOWS USED IN INVESTING ACTIVITIES (4,724) - (4,724)
CASH FLOW FROM FINANCING ACTIVITIES:
Net Borrowings (Repayments) under l ines of credit (92) - (92)
CASH FLOWS PROVIDED BY (USED IN) FINANCING ACTIVITIES (92) - (92)
EFFECT OF FOREIGN EXCHANGE RATE 375 - 375
NET INCREASE IN CASH AND CASH EQUIVALENTS 3,312 - 3,312
CASH AND CASH EQUIVALENTS AT BEGINNING OF PERIOD 50,083 - 50,083
CASH AND CASH EQUIVALENTS AT END OF PERIOD R$ 53,097 R$ - R$ 53,097
(unaudited) (unaudited)
March 31, 2014
USGAAPIFRS balances
as reported Adjustments balances
- 39 -
Brazil Fast Food Corp.
Management’s Discussion of Results of operations for the quarterly period ended March 31, 2014
- 40 -
1 - INTRODUCTION
The following Management’s Discussion and Analysis (“MD&A”) is intended to help readers understand the results of the Company’s operations. The MD&A is provided as a supplement to, and should be read in conjunction with, our quarterly financial information and the accompanying notes to the quarterly financial information. References to “we”, “us” or the “Company” are to Brazil Fast Food Corp.
2 – SPECIAL NOTE ABOUT FORWARD-LOOKING STATEMENS
Certain statements in the MD&A other than purely historical information, including estimates, projections, statements relating to our business plans, objectives and expected operating results, and the assumptions upon which those statements are based, are forward-looking statements. These forward-looking statements generally are identified by words such as “believe,” “project,” “expect,” “anticipate,” “estimate,” “intend,” “strategy,” “plan,” “may,” “should,” “will,” “would,” “will be,” “will continue,” “will likely result,” and similar expressions. Forward-looking statements are based on current expectations and assumptions that are subject to risks and uncertainties which may cause actual results to differ materially from the forward-looking statements. A detailed discussion of risks and uncertainties that could cause actual results and events to differ materially from such forward-looking statements is included in the Company’s Annual Report for the year ended December 31, 2012 at our website. We undertake no obligation to update or revise publicly any forward-looking statements, whether as a result of new information, future events, or otherwise.
OUR BUSINESS
We, through BFFC do Brasil, manage both directly and through franchisees the second largest fast food chain in Brazil based on number of system units. Reference is made to note 1 of the Consolidated Quarterly Financial Information to a detailed discussion regarding our brands and the brands we represent as franchisee.
Our revenues are comprised of retail sales at Company restaurants and kiosks, franchise revenues from initial fees paid upon the signing of a new franchise contract or franchise contract renewal and royalty fees based on a percentage of sales reported by franchise restaurants and kiosks, agreements with trade partners’, and property income from restaurants that we lease or sublease to franchisees for a period no longer than one year.
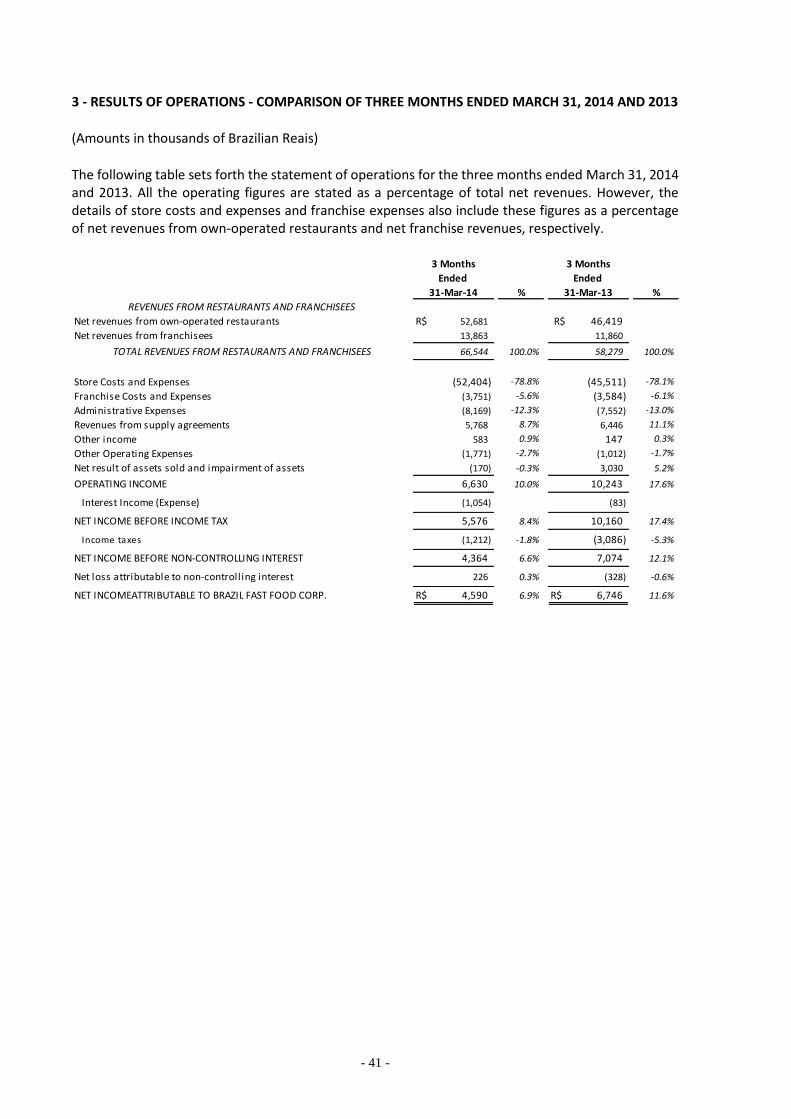
- 41 -
3 - RESULTS OF OPERATIONS - COMPARISON OF THREE MONTHS ENDED MARCH 31, 2014 AND 2013
(Amounts in thousands of Brazilian Reais)
The following table sets forth the statement of operations for the three months ended March 31, 2014 and 2013. All the operating figures are stated as a percentage of total net revenues. However, the details of store costs and expenses and franchise expenses also include these figures as a percentage of net revenues from own-operated restaurants and net franchise revenues, respectively.
% %
Net revenues from own-operated restaurants R$ 52,681 R$ 46,419
Net revenues from franchisees 13,863 11,860
66,544 100.0% 58,279 100.0%
Store Costs and Expenses (52,404) -78.8% (45,511) -78.1%
Franchise Costs and Expenses (3,751) -5.6% (3,584) -6.1%
Administrative Expenses (8,169) -12.3% (7,552) -13.0%
Revenues from supply agreements 5,768 8.7% 6,446 11.1%
Other income 583 0.9% 147 0.3%
Other Operating Expenses (1,771) -2.7% (1,012) -1.7%
Net result of assets sold and impairment of assets (170) -0.3% 3,030 5.2%
OPERATING INCOME 6,630 10.0% 10,243 17.6%
Interest Income (Expense) (1,054) (83)
NET INCOME BEFORE INCOME TAX 5,576 8.4% 10,160 17.4%
Income taxes (1,212) -1.8% (3,086) -5.3%
NET INCOME BEFORE NON-CONTROLLING INTEREST 4,364 6.6% 7,074 12.1%
Net loss attributable to non-controlling interest 226 0.3% (328) -0.6%
NET INCOMEATTRIBUTABLE TO BRAZIL FAST FOOD CORP. R$ 4,590 6.9% R$ 6,746 11.6%
TOTAL REVENUES FROM RESTAURANTS AND FRANCHISEES
3 Months
31-Mar-14
3 Months
31-Mar-13
Ended Ended
REVENUES FROM RESTAURANTS AND FRANCHISEES
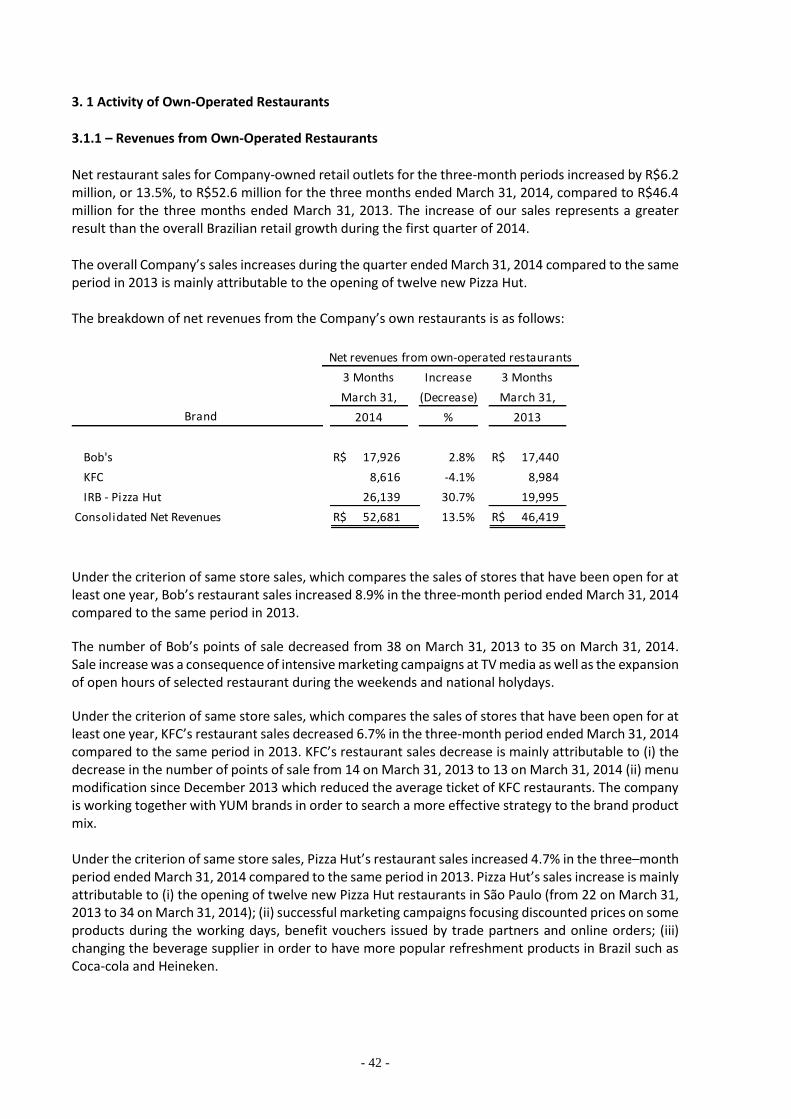
- 42 -
3. 1 Activity of Own-Operated Restaurants
3.1.1 – Revenues from Own-Operated Restaurants
Net restaurant sales for Company-owned retail outlets for the three-month periods increased by R$6.2 million, or 13.5%, to R$52.6 million for the three months ended March 31, 2014, compared to R$46.4 million for the three months ended March 31, 2013. The increase of our sales represents a greater result than the overall Brazilian retail growth during the first quarter of 2014.
The overall Company’s sales increases during the quarter ended March 31, 2014 compared to the same period in 2013 is mainly attributable to the opening of twelve new Pizza Hut.
The breakdown of net revenues from the Company’s own restaurants is as follows:
Under the criterion of same store sales, which compares the sales of stores that have been open for at least one year, Bob’s restaurant sales increased 8.9% in the three-month period ended March 31, 2014 compared to the same period in 2013.
The number of Bob’s points of sale decreased from 38 on March 31, 2013 to 35 on March 31, 2014. Sale increase was a consequence of intensive marketing campaigns at TV media as well as the expansion of open hours of selected restaurant during the weekends and national holydays.
Under the criterion of same store sales, which compares the sales of stores that have been open for at least one year, KFC’s restaurant sales decreased 6.7% in the three-month period ended March 31, 2014 compared to the same period in 2013. KFC’s restaurant sales decrease is mainly attributable to (i) the decrease in the number of points of sale from 14 on March 31, 2013 to 13 on March 31, 2014 (ii) menu modification since December 2013 which reduced the average ticket of KFC restaurants. The company is working together with YUM brands in order to search a more effective strategy to the brand product mix. Under the criterion of same store sales, Pizza Hut’s restaurant sales increased 4.7% in the three–month period ended March 31, 2014 compared to the same period in 2013. Pizza Hut’s sales increase is mainly attributable to (i) the opening of twelve new Pizza Hut restaurants in São Paulo (from 22 on March 31, 2013 to 34 on March 31, 2014); (ii) successful marketing campaigns focusing discounted prices on some products during the working days, benefit vouchers issued by trade partners and online orders; (iii) changing the beverage supplier in order to have more popular refreshment products in Brazil such as Coca-cola and Heineken.
Increase
(Decrease)
Brand %
Bob's R$ 17,926 2.8% R$ 17,440
KFC 8,616 -4.1% 8,984
IRB - Pizza Hut 26,139 30.7% 19,995
Consolidated Net Revenues R$ 52,681 13.5% R$ 46,419
March 31, March 31,
2014 2013
3 Months 3 Months
Net revenues from own-operated restaurants
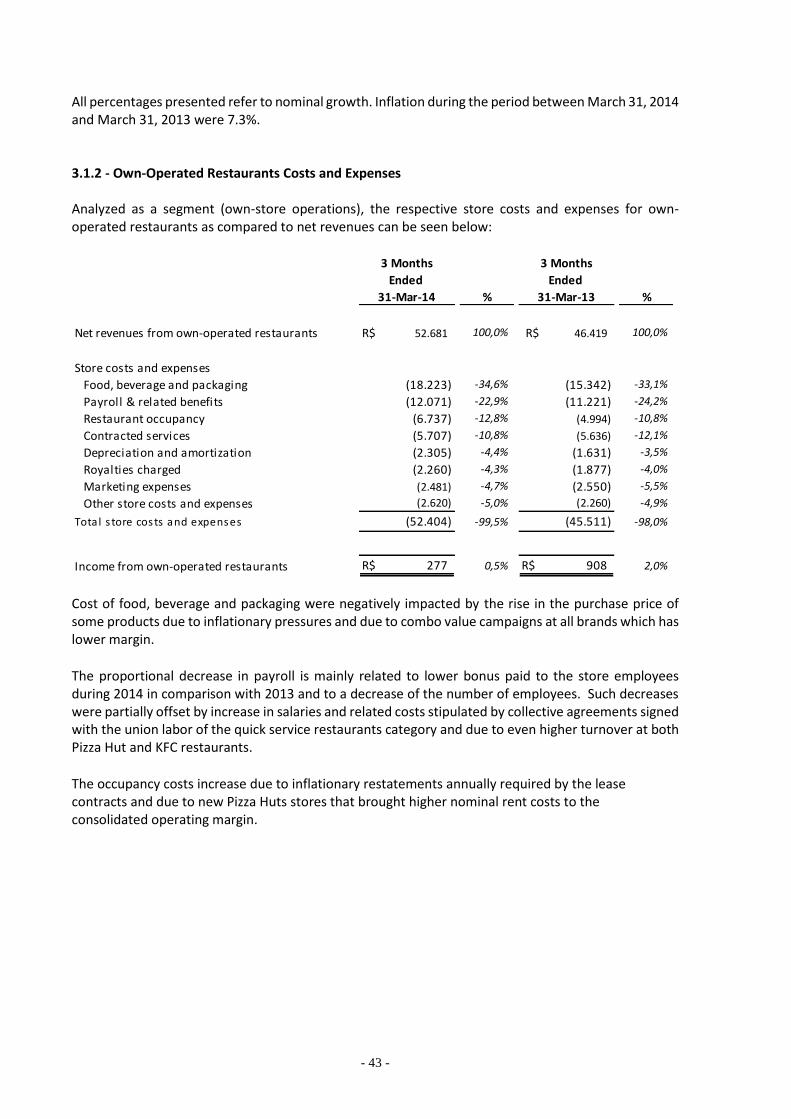
- 43 -
All percentages presented refer to nominal growth. Inflation during the period between March 31, 2014 and March 31, 2013 were 7.3%. 3.1.2 - Own-Operated Restaurants Costs and Expenses Analyzed as a segment (own-store operations), the respective store costs and expenses for own-operated restaurants as compared to net revenues can be seen below:
Cost of food, beverage and packaging were negatively impacted by the rise in the purchase price of some products due to inflationary pressures and due to combo value campaigns at all brands which has lower margin.
The proportional decrease in payroll is mainly related to lower bonus paid to the store employees during 2014 in comparison with 2013 and to a decrease of the number of employees. Such decreases were partially offset by increase in salaries and related costs stipulated by collective agreements signed with the union labor of the quick service restaurants category and due to even higher turnover at both Pizza Hut and KFC restaurants.
The occupancy costs increase due to inflationary restatements annually required by the lease contracts and due to new Pizza Huts stores that brought higher nominal rent costs to the consolidated operating margin.
% %
Net revenues from own-operated restaurants R$ 52.681 100,0% R$ 46.419 100,0%
Store costs and expenses
Food, beverage and packaging (18.223) -34,6% (15.342) -33,1%
Payroll & related benefits (12.071) -22,9% (11.221) -24,2%
Restaurant occupancy (6.737) -12,8% (4.994) -10,8%
Contracted services (5.707) -10,8% (5.636) -12,1%
Depreciation and amortization (2.305) -4,4% (1.631) -3,5%
Royalties charged (2.260) -4,3% (1.877) -4,0%
Marketing expenses (2.481) -4,7% (2.550) -5,5%
Other store costs and expenses (2.620) -5,0% (2.260) -4,9%
Total s tore costs and expenses (52.404) -99,5% (45.511) -98,0%
Income from own-operated restaurants R$ 277 0,5% R$ 908 2,0%
3 Months 3 Months
Ended Ended
31-Mar-14 31-Mar-13
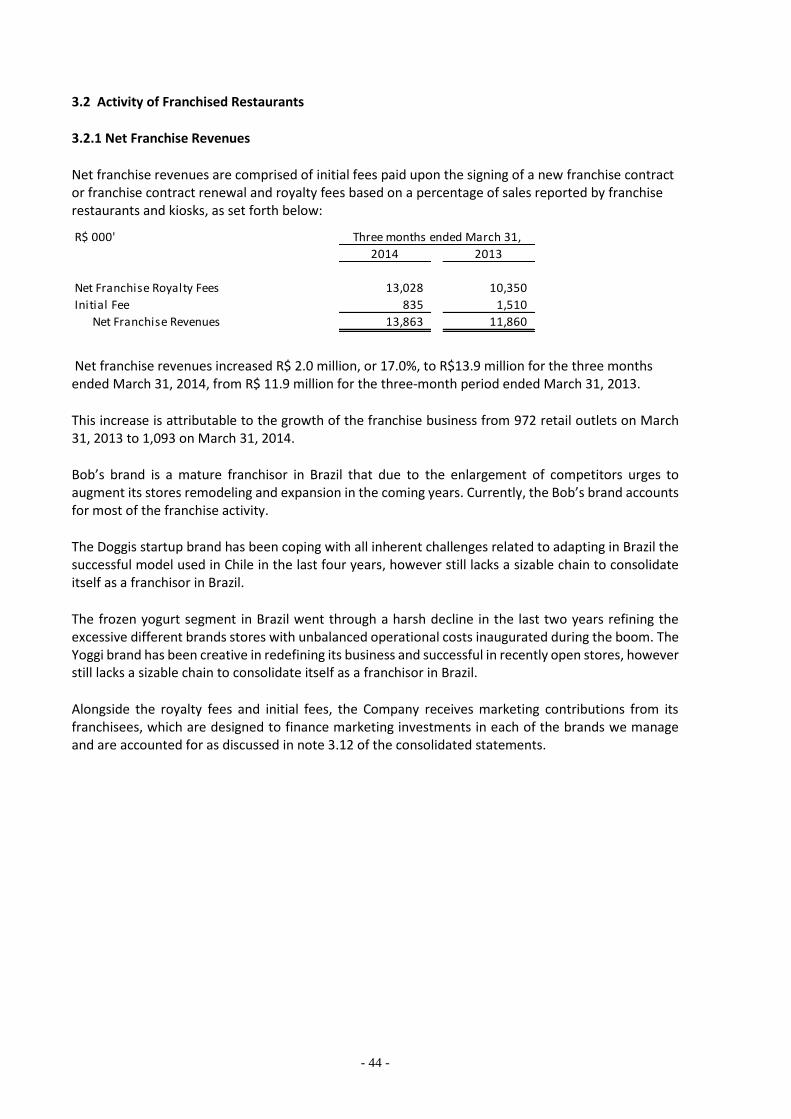
- 44 -
3.2 Activity of Franchised Restaurants
3.2.1 Net Franchise Revenues
Net franchise revenues are comprised of initial fees paid upon the signing of a new franchise contract or franchise contract renewal and royalty fees based on a percentage of sales reported by franchise restaurants and kiosks, as set forth below:
Net franchise revenues increased R$ 2.0 million, or 17.0%, to R$13.9 million for the three months ended March 31, 2014, from R$ 11.9 million for the three-month period ended March 31, 2013.
This increase is attributable to the growth of the franchise business from 972 retail outlets on March 31, 2013 to 1,093 on March 31, 2014.
Bob’s brand is a mature franchisor in Brazil that due to the enlargement of competitors urges to augment its stores remodeling and expansion in the coming years. Currently, the Bob’s brand accounts for most of the franchise activity.
The Doggis startup brand has been coping with all inherent challenges related to adapting in Brazil the successful model used in Chile in the last four years, however still lacks a sizable chain to consolidate itself as a franchisor in Brazil.
The frozen yogurt segment in Brazil went through a harsh decline in the last two years refining the excessive different brands stores with unbalanced operational costs inaugurated during the boom. The Yoggi brand has been creative in redefining its business and successful in recently open stores, however still lacks a sizable chain to consolidate itself as a franchisor in Brazil.
Alongside the royalty fees and initial fees, the Company receives marketing contributions from its franchisees, which are designed to finance marketing investments in each of the brands we manage and are accounted for as discussed in note 3.12 of the consolidated statements.
R$ 000'
Net Franchise Royalty Fees 13,028 10,350
Initial Fee 835 1,510
Net Franchise Revenues 13,863 11,860
Three months ended March 31,
2014 2013
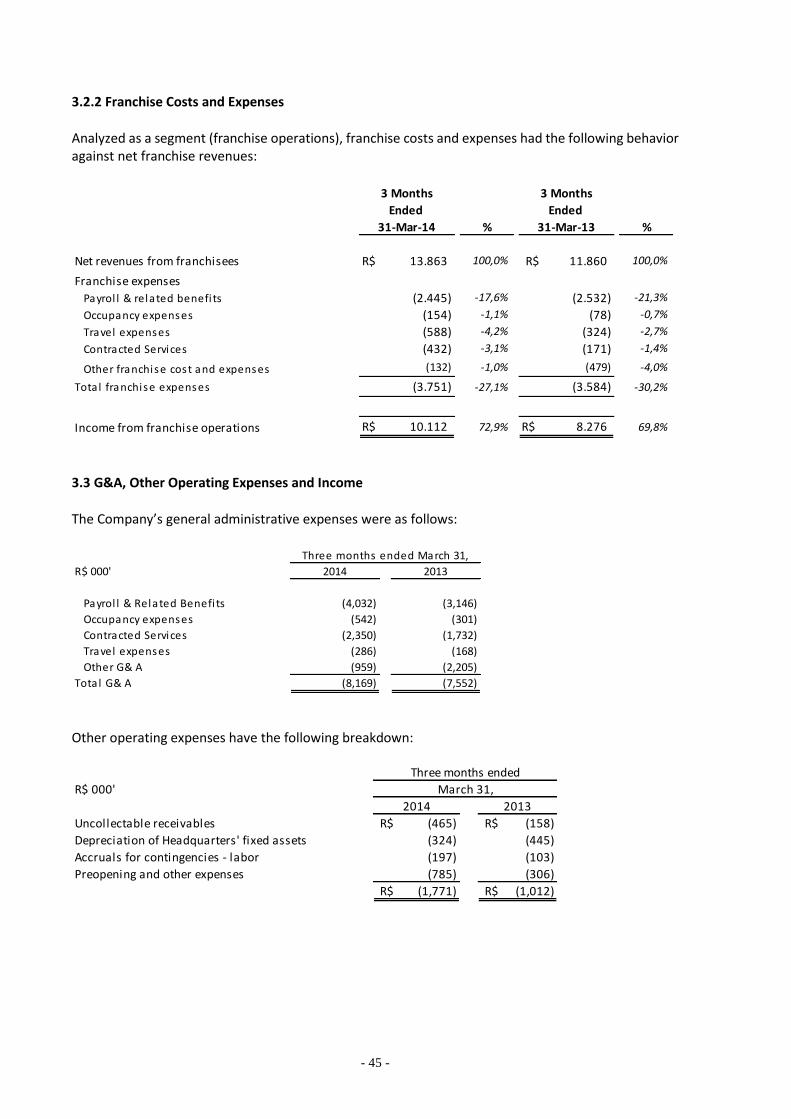
- 45 -
3.2.2 Franchise Costs and Expenses
Analyzed as a segment (franchise operations), franchise costs and expenses had the following behavior against net franchise revenues:
3.3 G&A, Other Operating Expenses and Income
The Company’s general administrative expenses were as follows:
Other operating expenses have the following breakdown:
% %
Net revenues from franchisees R$ 13.863 100,0% R$ 11.860 100,0%
Franchise expenses
Payrol l & related benefi ts (2.445) -17,6% (2.532) -21,3%
Occupancy expenses (154) -1,1% (78) -0,7%
Travel expenses (588) -4,2% (324) -2,7%
Contracted Services (432) -3,1% (171) -1,4%
Other franchise cost and expenses (132) -1,0% (479) -4,0%
Total franchise expenses (3.751) -27,1% (3.584) -30,2%
Income from franchise operations R$ 10.112 72,9% R$ 8.276 69,8%
3 Months 3 Months
Ended Ended
31-Mar-14 31-Mar-13
R$ 000'
Payrol l & Related Benefi ts (4,032) (3,146)
Occupancy expenses (542) (301)
Contracted Services (2,350) (1,732)
Travel expenses (286) (168)
Other G& A (959) (2,205)
Tota l G& A (8,169) (7,552)
2014 2013
Three months ended March 31,
R$ 000'
Uncollectable receivables R$ (465) R$ (158)
Depreciation of Headquarters' fixed assets (324) (445)
Accruals for contingencies - labor (197) (103)
Preopening and other expenses (785) (306)
R$ (1,771) R$ (1,012)
20132014
Three months ended
March 31,
- 46 -
4. LIQUIDITY AND CAPITAL RESOURCES (Amounts in thousands of Brazilian Reais)
Since March 1996, we made acquisitions of businesses and capital improvements (including the refurbishment of some of the Company’s stores), for which we used cash remaining at the closure of our acquisition of Venbo, borrowed funds from various sources, and made private placements of our securities. As of March 31, 2014, we accumulated net earnings of approximately R$27.8 million. Also, as of March 31, 2014, we had cash on hand of approximately R$53.1 million and a working capital of approximately R$41.2 million.
In the past, debts denominated in any other currency than Brazilian Reais increased with the major devaluation of the Brazilian Real at the beginning of 1999. A series of years with reduced sales, mainly due to the weak economic environment in Brazil, worsened the situation and we were not able to pay some of our obligations, including taxes. In the following years the payment of taxes in arrears was renegotiated with levels of Brazilian government so they could be paid off in monthly installments.
With the improvement of the Brazilian economy since 2002, our total revenues have increased and, combined with a capital injection of R$9.0 million, we have started to reduce our debt position. In 2003 we rescheduled much of the debt to long term. The continued improvement of sales led us to (i) drastically reduce our debts with financial institutions in 2005; and (ii) extinguish those debts and reverse our financial position to present time deposits with financial institutions at the end of 2006. The improved collection rate from our franchisees, commencing in 2005, also strengthened our current assets. In 2007 and the first three quarters of 2008, we maintained this positive scenario and recorded positive working capital.
During the last quarter of 2008, we increased our bank debt position in order to fund the acquisition of IRB, the expansion of the KFC stores and the startup of the Doggis brand. These transactions brought the Company’s working capital back into negative territory. After a series of positive results (operating income in the years of 2009 to 2013, as well as in the three months of 2014) the Company returned to positive working capital.
For the quarter ended March 31, 2014, we had net cash provided by operating activities of R$7.7 million (R$10.1 million in 2013), net cash used in investing activities of R$ 5.0 million (R$ 1.0 million provided in 2013) and net cash used in financing activities of R$0.1 million (R$4.6 million provided in 2013). Net cash used in investing activities was primarily the result of Company's investment in property and equipment to improve Company's retail operations. Net cash used in financing activities was mainly the result of repayment of borrowings to fund the Company’s investments and operations.
Since the beginning of the repurchase program, we have also invested approximately R$2.4 million in share re, re-purchasing 350,990 shares that had gained considerable value in the over-the-counter market where they are negotiated.
We have had a policy of retaining future earnings for the development of our business. Today, our dividend policy is subject to the discretion of the Board of Directors and depends upon a number of factors, including future earnings, financial condition, cash requirements, and general business conditions. Each year, the Board of Directors discusses our profits distribution while considering our investment programs.
We are not engaged in trading market risk-sensitive instruments or purchasing hedging instruments or “other than trading” instruments that are likely to expose us to market risk, whether interest rate, foreign currency exchange, commodity price or equity price risk. Our primary market risk exposures are those relating to interest rate fluctuations and possible devaluations of the Brazilian currency. In
- 47 -
particular, a change in Brazilian interest rates would affect the rates at which we could borrow funds under our several credit facilities with Brazilian banks and financial institutions.
Reference is made to notes 9 and 11 to the Consolidated Quarterly Financial Information in regard to the Company’s indebtedness related to financial institutions and reassessed taxes.
Reference is made to note 3 to the Consolidated Quarterly Financial Information, in regard to the Company’ significant accounting policies.