Embed Size (px)
Citation preview

BPD 20203LAND SURVEY FOR CONSTRUCTION
Learning Modul2nd Edition
Sulzakimin Haji Mohamed
DEPARTMENT OF CONSTRUCTION MANAGEMENTFACULTY OF TECHNOLOGY MANAGEMENT AND BUSINESS
Internal Circulation Only
BPD 20203LAND SURVEY FOR CONSTRUCTION
Learning Modul2nd Edition
Sulzakimin Haji Mohamed
DEPARTMENT OF CONSTRUCTION MANAGEMENTFACULTY OF TECHNOLOGY MANAGEMENT AND BUSINESS
Internal Circulation Only
BPD 20203LAND SURVEY FOR CONSTRUCTION
Learning Modul2nd Edition
Sulzakimin Haji Mohamed
DEPARTMENT OF CONSTRUCTION MANAGEMENTFACULTY OF TECHNOLOGY MANAGEMENT AND BUSINESS
Internal Circulation Only

BPD 20203LAND SURVEY FOR CONSTRUCTION
SULZAKIMIN HJ MOHAMED
DEPARTMENT OF CONSTRUCTIONMANAGEMENT
FACULTY OF TECHNOLOGY MANAGEMENT ANDBUSINESS

Cetakan Kedua (Modul Pembelajaran), 2013© Sulzakimin Hj Mohamed
Hak cipta terpelihara. Tidak dibenarkan mengeluar ulang dalam apa-apa juga bentuk dan jugacara baik secara elektronik, mekanik, rakaman, atau lain-lain, mana-mana bahagian kandunganmodul ini sebelum mendapat izin daripada Universiti Tun Hussein Onn Malaysia, 86400 ParitRaja, Batu Pahat, Johor, Malaysia.
Diterbitkan dan dicetak oleh:
Penerbit UTHMUniversiti Tun Hussein Onn Malaysia86400 Parit Raja, Batu PahatJohor Darul Ta’zimTel: 07-4537051/7454Fax: 07-4536145E-mel: [email protected] Web: www.uthm.edu.my
i
CONTENT PAGESINTRODUCTION iOBJECTIVE vi
CHAPT ER 1 INTRODUCTION TO LAND SURVEYING1.1 Introduction 1
1.2 Definition of surveying 2
1.3 Land Surveying Work Categories 3
1.4 Land Surveying Branches 8
1.5 Surveying unit 12
1.6 Conclusion 13
Learning Activities 14
References 14
CHAPTER 2 SURVEYING PRINCIPLE2.1 Introduction 15
2.2 Accuracy & Precision 16
2.3 Concept of error in Surveying 18
2.4 Natural Factors l 18
2.5 Conclusion 20
Learning Activities 21
References 21
CHAPTER 3 SURVEYING EQUIPMENT3.1 Introduction 22
3.2 Linear Measurement 23
3.3 Total Station 28
3.3.1 Temporary Setup 31
ii
3.3.2 Standard Adjustment 31
3.4 Objective of Linear Measurement 32
3.5 Angle Measurement 33
3.6 Objective of Angle Measurement 36
3.7 Width 38
3.8 Conclusion 43
Learning Activities 43
References 43
CHAPTER 4 WAGE/PAYMENT CALCULATION FOR SURVEY4.1 Introduction 44
4.2 Type of Land Purposes i 44
4.3 Wage Rate 44
4.4 Conclusion 45
Learning Activities 48
References 48
CHAPTER 5 COORDINATES SYSTEMS5.1 Introduction 49
5.2 System Of Geographical References 49
5.3 Cartesian Coordinates Systems 50
5.4 Malaysian Rectified Skewed Orthomophic (MRSO) 51
5.5 Conclusion 51
Learning Activities 52
References 52
iii
CHAPTER 6 DISTANCE AND ANGLE MEASUREMENT6.1 Introduction 53
6.2 Traversing 54
6.3 Planning 55
6.4 Field Notes 60
6.5 Calculation (Determination of Class and Area) 65
6.6 Conclusion 69
Learning Activities 70
Refernces 70
CHAPTER 7 HEIGHT MEASUREMENT (LEVELLING)7.1 Introduction 71
7.2 Levelling Instrument 71
7.3 Levelling Operation 72
7.4 Calculation 75
7.5 Application of Levelling 78
7.6 Source of Error 83
7.7 Conclusion 84
Learning Activities 85
Refernces 85
CHAPTER 8 GEOGRAPHICAL INFORMATION SYSTEM (GIS)8.1 Introduction 86
8.2 GIS components 87
8.3 GIS Application 89
8.4 Conclusion 92
Learning Activities 92
References 92
iv
CHAPTER 9 APPLICATION OF SURVEYING IN CONSTRUCTION9.1 Introduction 93
9.2 Responsibilities 93
9.3 Prejob Meeting 94
9.4 Planning 95
9.5 Reconnaissance 95
9.6 Office Preparation 97
9.7 Application for Engineering Survey 98
9.9 Conclusion 104
Learning Activities 105
References 105
v
INTRODUCTIONThis module generally is a student learning guide for the course BPD 20203 Land
Survey for Construction offered in the Faculty of Technology Management and
Business, Universiti Tun Hussein Onn Malaysia. It Introduces the survey and its
principles, land surveying equipment, surveying wage scale, coordinate systems,
distance measurement, angle measurement, measure the height, and the introduction to
Geographic Information Systems (GIS).
OBJECTIVEThis subject is intended to give the student exposure and understanding of the concepts
and practical skills of land survey in construction industry.
LEARNING OUTCOMEAt the end of the course, students will:
1. Describe the methods of land surveying in the construction industry through the use
of appropriate measuring equipment (A3, PLO-4).
2. Using the appropriate land surveying equipment and method for the purpose of
building structural surveying works, drainage, earthworks, drainage and method of
controlling the vertical adjustment of the building (P4, PLO-2).
3. Can understand the use of Geographic Information Systems (SMG) in land surveying
work for construction (C3, PLO-4).
vi
SYNOPSISIntroduction to the survey and its principles, land surveying equipment, surveying wage
scale, coordinate systems, distance measurement, angle measurement, measure the
height, and the introduction to the application of geographic information systems (GIS).
ASSESSMENT1. Assignment : 15%(CLO2)
2. Test : 15% (CLO1)
3. Group Project : 30% (CLO1 ; CLO2 ,CLO3)
4. Final Examination : 40%
Total : 100%
REFERENCESList of references is stated at the end of each chapter.
:
1
CHAPTER 1
INTRODUCTION TO LAND SURVEYING
1.1 INTRODUCTION
Surveying is the art and science of measuring distances and angles on or near
the surface of the earth. Only a surveyor who possesses a thorough
understanding of surveying techniques will be able to determine the most efficient
methods required to obtain optimal results over a wide variety of surveying
problems.
Surveying is scientific to the degree that rigorous mathematical techniques are
used to analyze and adjust the field survey data. The accuracy and thus reliability
of the survey depend not only on the field expertise of the surveyor but also on
the surveyor’s understanding of the scientific principles underlying and affecting
all forms of survey measurement.
Surveying is indispensable to the engineer in the planning, design and
construction of a project, so all engineers should have a thorough understanding
of the limits of accuracy possible in the construction and manufacturing
processes.
LEARNING OUTCOME
At the end of the chapter, students will be able to:-
(1) Describe the concept of land surveying’(2) Discuss the application of land surveying for construction.(3) Explain the unit of measurement involved in land sdurveying.
2
1.2 DEFINITION OF SURVEY
According to RICS, surveying is made up of 7 specializations, known as sectors
namely: General Practice, Planning and Development, Building Surveying,
Quantity Surveying, Rural Practice, Minerals Surveying and Land Surveying.
Almost half of all surveyors work in general practices, which is mostly concerned
with valuation and investment. Valuation deals with issues such as how much a
company’s assets are worth, how much rent should be charged on commercial
and industrial property and whether a home is good value. Valuation surveyors
are experts in property markets, land and property values, valuation procedures
and property law.
Planning and development surveyors are involved in projects from their earliest
planning stages right through to eventual completion. Projects vary enormously,
but typically might involve instructions from a property developer to examine the
viability of a proposed housing scheme.
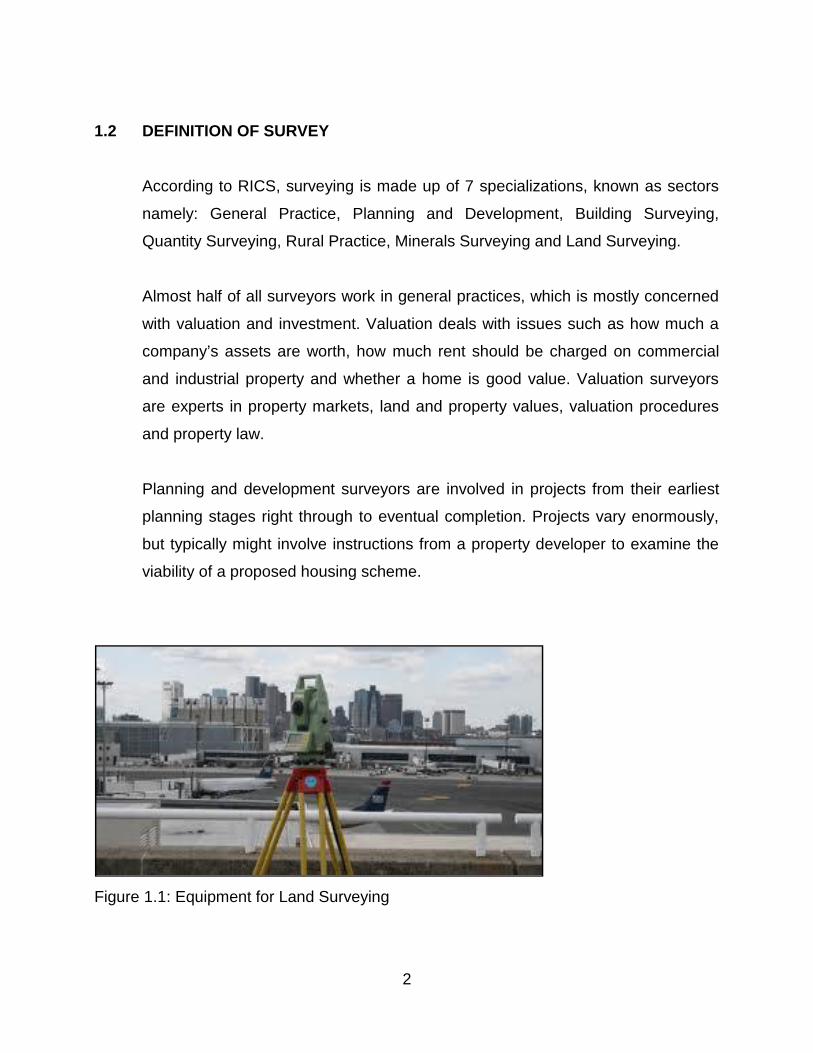
Figure 1.1: Equipment for Land Surveying
3
In Figure 1.1, it shows equipment that are used in land surveying. It is also use in
the work of building surveyors involved advising in the construction, maintenance,
repair and refurbishment of all types of residential and commercial property and
may include specialization in other types such as historic or listed buildings.
The quantity surveyors are trained to evaluate the costs of preparing the site,
construction, labour, material and plant costs, fitting out costs, professionals’
fees, taxes and other charges as well as the likely running and maintenance
costs for the new building.
Surveyors in rural practices advice landowners, farmers and others with interests
in the countryside. They are responsible for the management of country estates
and farms, the planning and execution of development schemes for agriculture,
forestation, recreation and the valuation and sale of property and livestock.
Minerals surveyors plan the development and future of mineral workings. They
work with local authorities and the owners of land on planning applications and
appeal, mining law and working rights, mining subsidence and damage, the
environment effects of mines and the rehabilitation of derelict land.
Figure 1.2: Works in the early stage of construction
4
As for this subject, Figure 1.2 shows some early works done by land surveyor
and it is for construction objectives. The objectives are:
1. To determine position of any point on earth
2. To determine area & volume
3. To determine positional height
4. To study the importance of surveying in the initial phase of construction
5. To familiarize with the payment related to surveying work
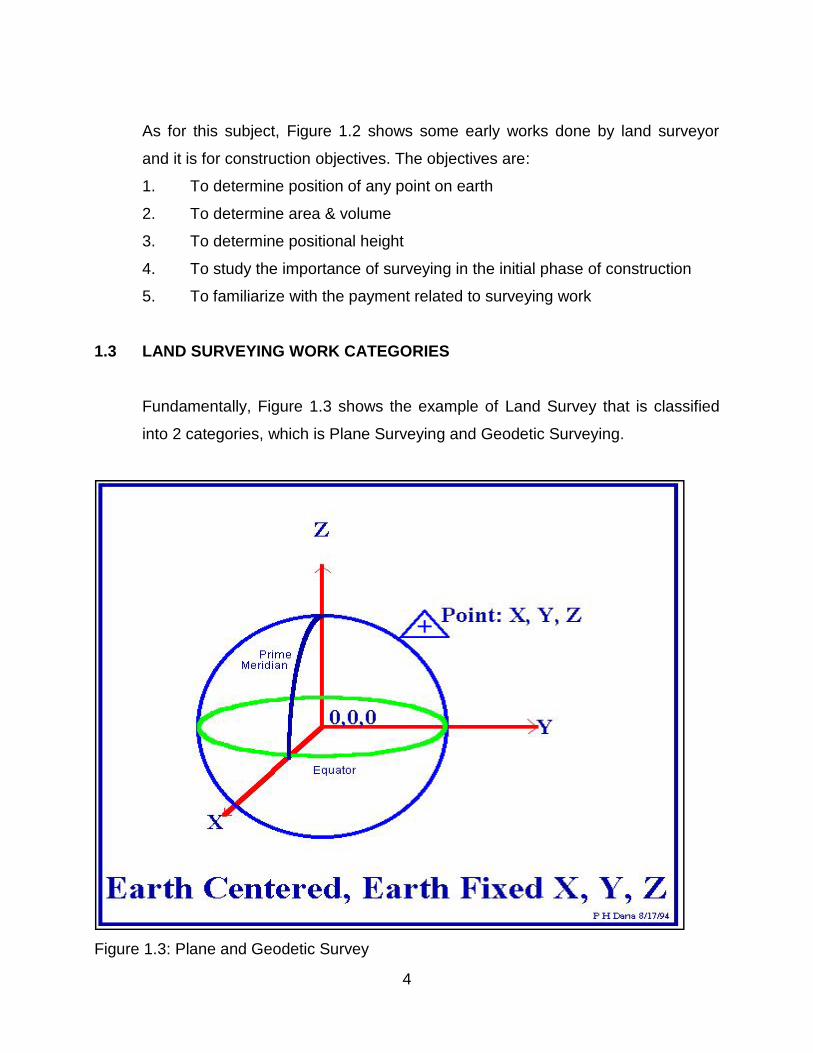
1.3 LAND SURVEYING WORK CATEGORIES
Fundamentally, Figure 1.3 shows the example of Land Survey that is classified
into 2 categories, which is Plane Surveying and Geodetic Surveying.
Figure 1.3: Plane and Geodetic Survey
5
1. Plane Surveying
Plane surveying is that type of surveying in which the surface of the earth is
considered to be plane for all X and Y dimensions. All Z dimensions (height) are
referenced for the mean spherical surface of the earth (mean sea level). Most
engineering and property surveys are plane survey, although some of these
surveys that cover large distances (e.g., highways and railroads) will have
corrections applied at regular intervals to correct for the earth’s curvature.
Among the surveying work that fall into plane surveying are:
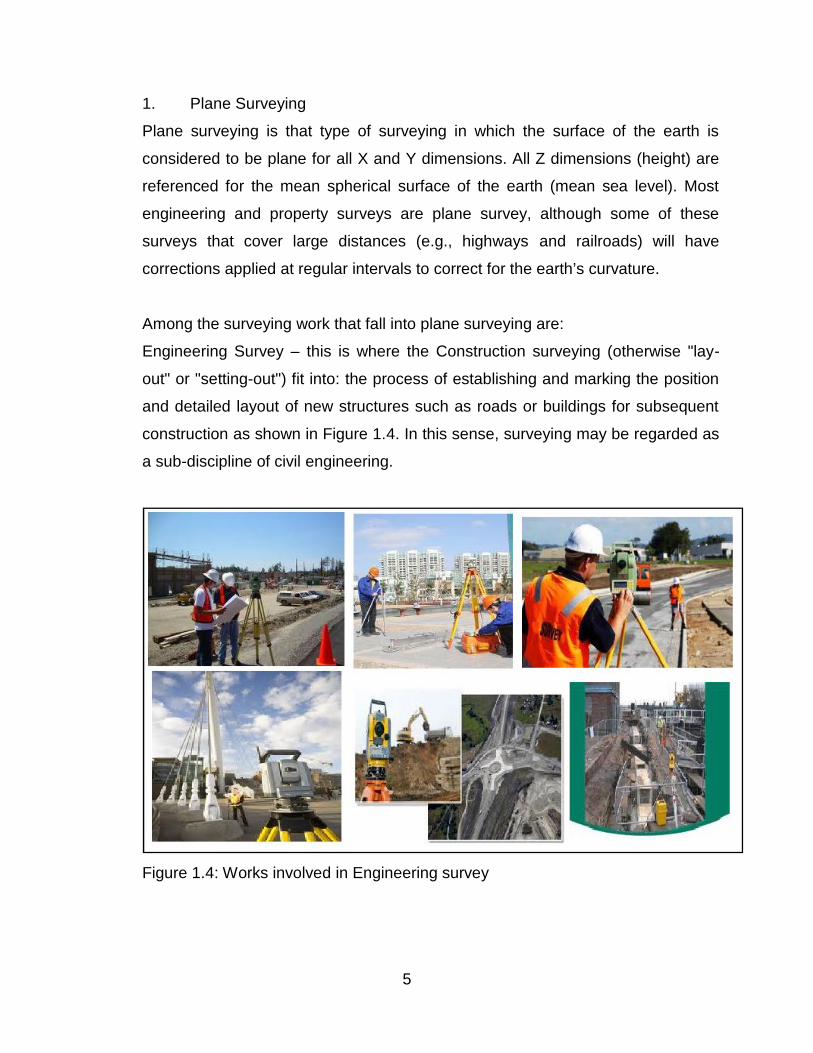
Engineering Survey – this is where the Construction surveying (otherwise "lay-
out" or "setting-out") fit into: the process of establishing and marking the position
and detailed layout of new structures such as roads or buildings for subsequent
construction as shown in Figure 1.4. In this sense, surveying may be regarded as
a sub-discipline of civil engineering.
Figure 1.4: Works involved in Engineering survey
6
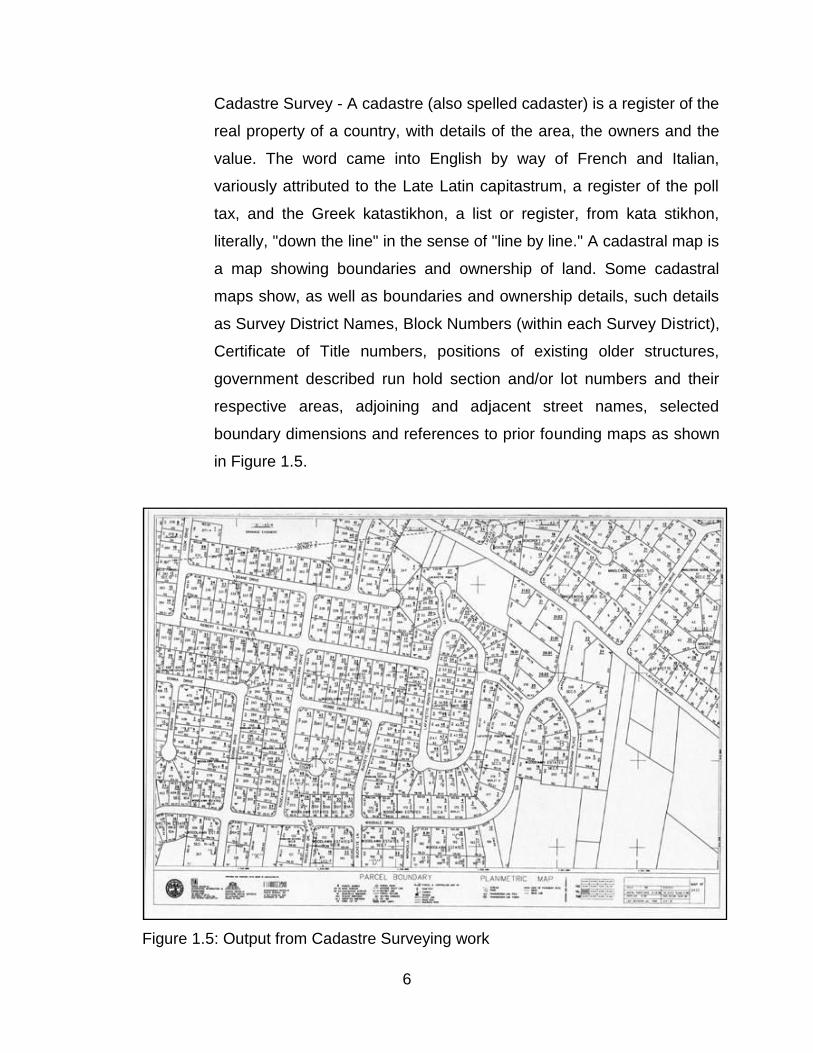
Cadastre Survey - A cadastre (also spelled cadaster) is a register of the
real property of a country, with details of the area, the owners and the
value. The word came into English by way of French and Italian,
variously attributed to the Late Latin capitastrum, a register of the poll
tax, and the Greek katastikhon, a list or register, from kata stikhon,
literally, "down the line" in the sense of "line by line." A cadastral map is
a map showing boundaries and ownership of land. Some cadastral
maps show, as well as boundaries and ownership details, such details
as Survey District Names, Block Numbers (within each Survey District),
Certificate of Title numbers, positions of existing older structures,
government described run hold section and/or lot numbers and their
respective areas, adjoining and adjacent street names, selected
boundary dimensions and references to prior founding maps as shown
in Figure 1.5.
Figure 1.5: Output from Cadastre Surveying work
7
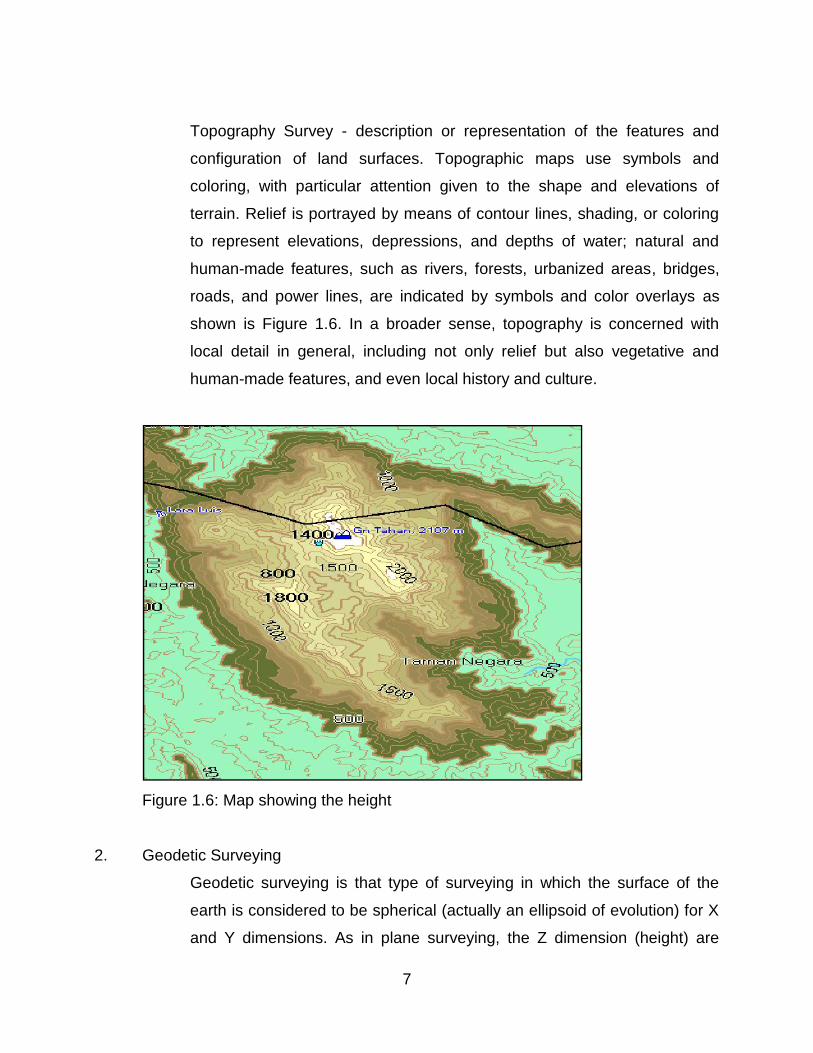
Topography Survey - description or representation of the features and
configuration of land surfaces. Topographic maps use symbols and
coloring, with particular attention given to the shape and elevations of
terrain. Relief is portrayed by means of contour lines, shading, or coloring
to represent elevations, depressions, and depths of water; natural and
human-made features, such as rivers, forests, urbanized areas, bridges,
roads, and power lines, are indicated by symbols and color overlays as
shown is Figure 1.6. In a broader sense, topography is concerned with
local detail in general, including not only relief but also vegetative and
human-made features, and even local history and culture.
Figure 1.6: Map showing the height
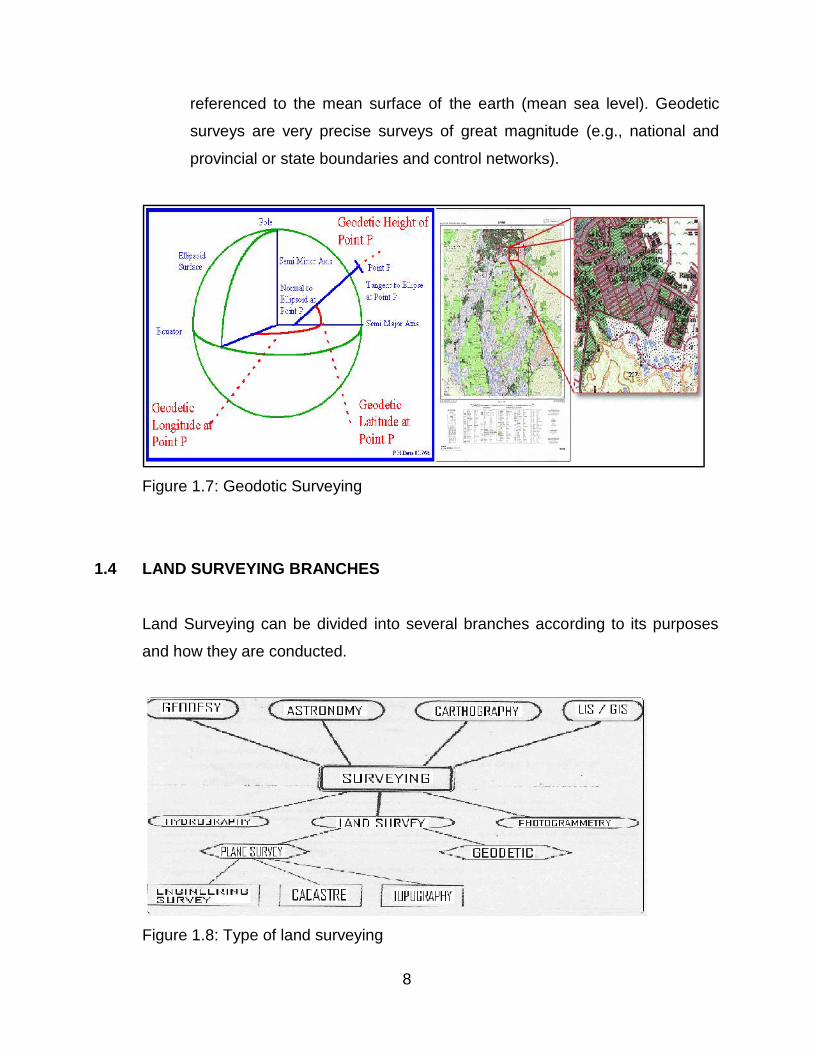
2. Geodetic Surveying
Geodetic surveying is that type of surveying in which the surface of the
earth is considered to be spherical (actually an ellipsoid of evolution) for X
and Y dimensions. As in plane surveying, the Z dimension (height) are
8
referenced to the mean surface of the earth (mean sea level). Geodetic
surveys are very precise surveys of great magnitude (e.g., national and
provincial or state boundaries and control networks).
Figure 1.7: Geodotic Surveying
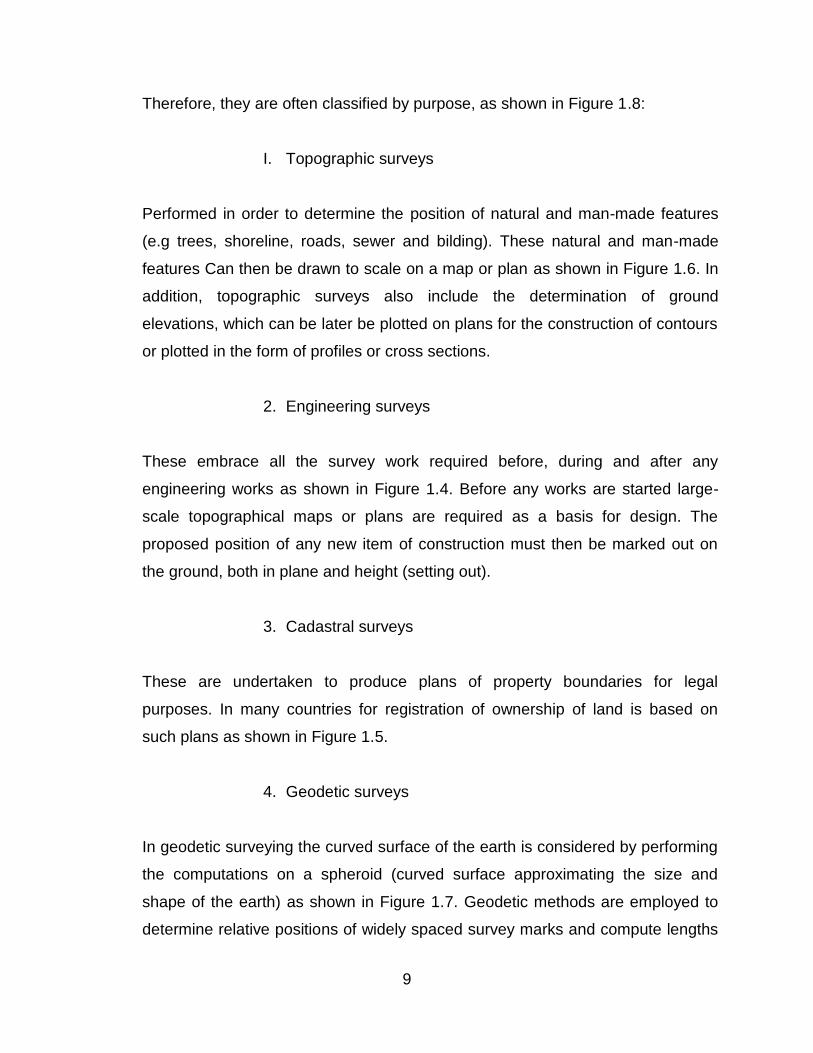
1.4 LAND SURVEYING BRANCHES
Land Surveying can be divided into several branches according to its purposes
and how they are conducted.
Figure 1.8: Type of land surveying
9
Therefore, they are often classified by purpose, as shown in Figure 1.8:
I. Topographic surveys
Performed in order to determine the position of natural and man-made features
(e.g trees, shoreline, roads, sewer and bilding). These natural and man-made
features Can then be drawn to scale on a map or plan as shown in Figure 1.6. In
addition, topographic surveys also include the determination of ground
elevations, which can be later be plotted on plans for the construction of contours
or plotted in the form of profiles or cross sections.
2. Engineering surveys
These embrace all the survey work required before, during and after any
engineering works as shown in Figure 1.4. Before any works are started large-
scale topographical maps or plans are required as a basis for design. The
proposed position of any new item of construction must then be marked out on
the ground, both in plane and height (setting out).
3. Cadastral surveys
These are undertaken to produce plans of property boundaries for legal
purposes. In many countries for registration of ownership of land is based on
such plans as shown in Figure 1.5.
4. Geodetic surveys
In geodetic surveying the curved surface of the earth is considered by performing
the computations on a spheroid (curved surface approximating the size and
shape of the earth) as shown in Figure 1.7. Geodetic methods are employed to
determine relative positions of widely spaced survey marks and compute lengths
10
and directions of the long lines between them.
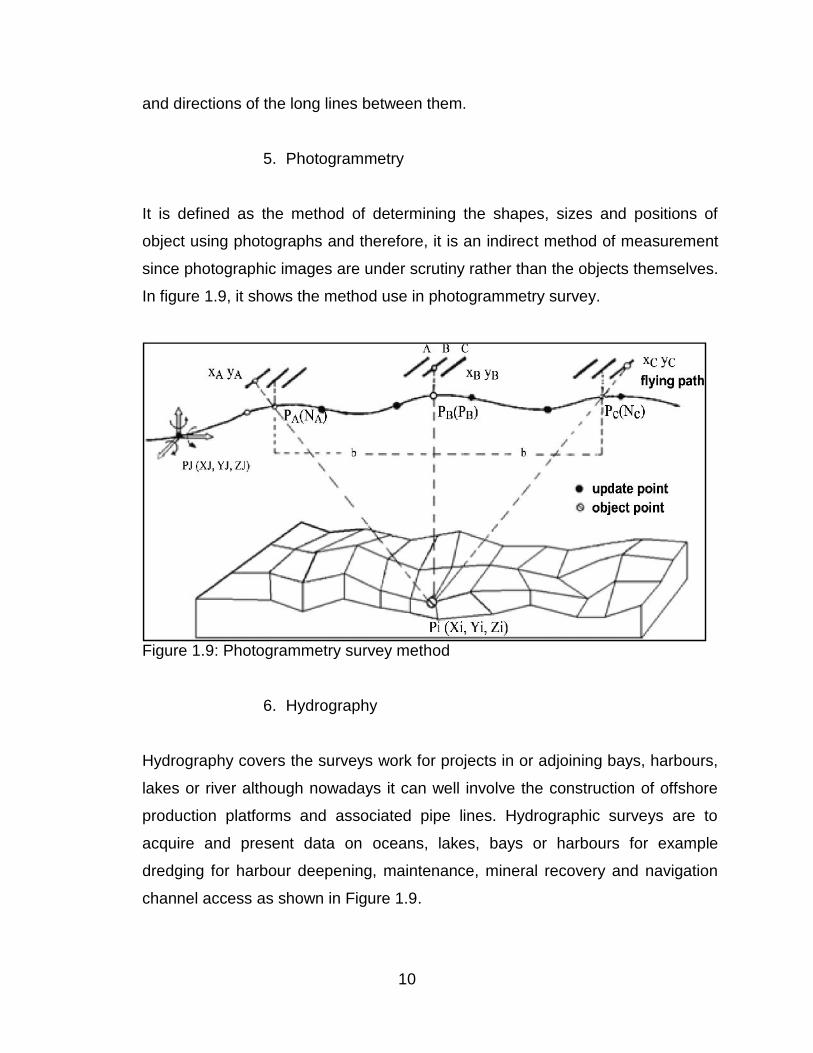
5. Photogrammetry
It is defined as the method of determining the shapes, sizes and positions of
object using photographs and therefore, it is an indirect method of measurement
since photographic images are under scrutiny rather than the objects themselves.
In figure 1.9, it shows the method use in photogrammetry survey.
Figure 1.9: Photogrammetry survey method
6. Hydrography
Hydrography covers the surveys work for projects in or adjoining bays, harbours,
lakes or river although nowadays it can well involve the construction of offshore
production platforms and associated pipe lines. Hydrographic surveys are to
acquire and present data on oceans, lakes, bays or harbours for example
dredging for harbour deepening, maintenance, mineral recovery and navigation
channel access as shown in Figure 1.9.
10
and directions of the long lines between them.
5. Photogrammetry
It is defined as the method of determining the shapes, sizes and positions of
object using photographs and therefore, it is an indirect method of measurement
since photographic images are under scrutiny rather than the objects themselves.
In figure 1.9, it shows the method use in photogrammetry survey.
Figure 1.9: Photogrammetry survey method
6. Hydrography
Hydrography covers the surveys work for projects in or adjoining bays, harbours,
lakes or river although nowadays it can well involve the construction of offshore
production platforms and associated pipe lines. Hydrographic surveys are to
acquire and present data on oceans, lakes, bays or harbours for example
dredging for harbour deepening, maintenance, mineral recovery and navigation
channel access as shown in Figure 1.9.
11
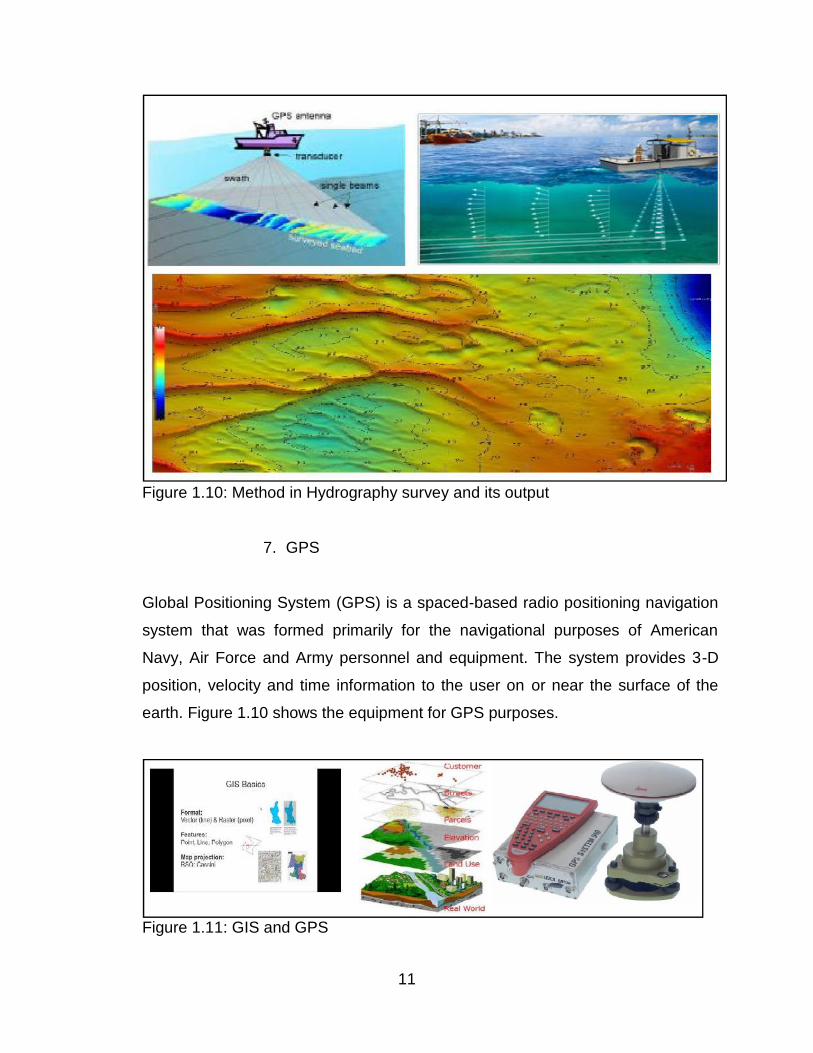
Figure 1.10: Method in Hydrography survey and its output
7. GPS
Global Positioning System (GPS) is a spaced-based radio positioning navigation
system that was formed primarily for the navigational purposes of American
Navy, Air Force and Army personnel and equipment. The system provides 3-D
position, velocity and time information to the user on or near the surface of the
earth. Figure 1.10 shows the equipment for GPS purposes.
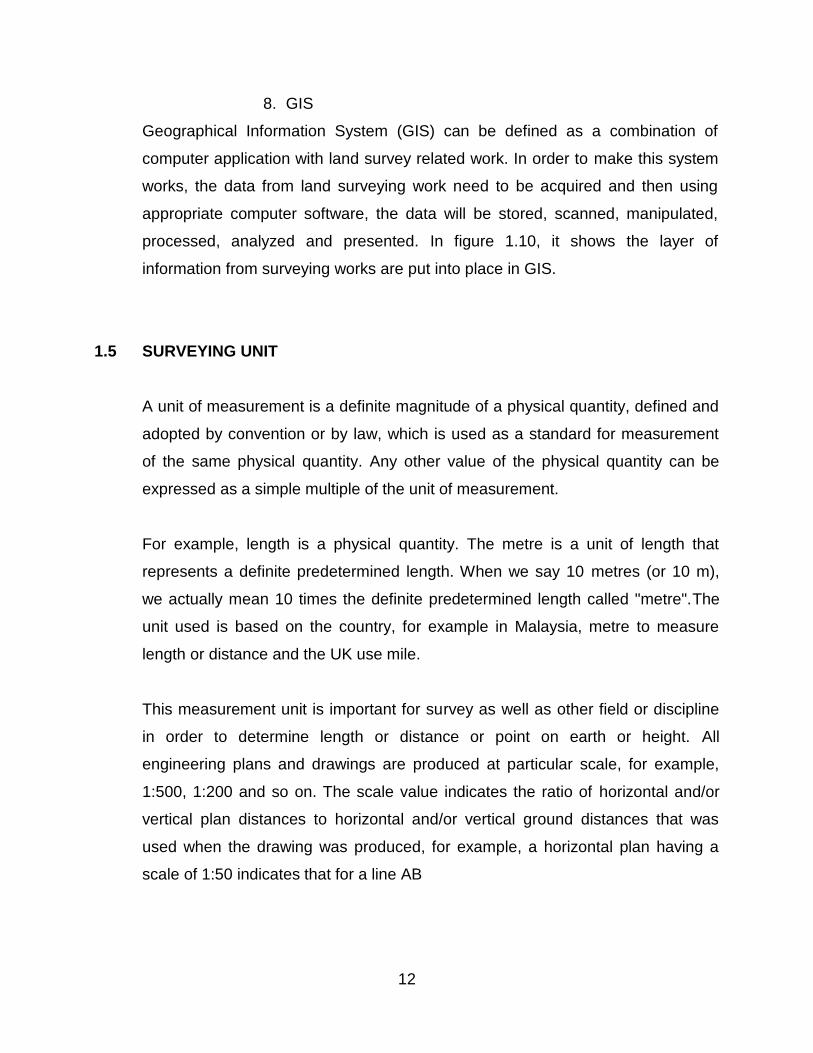
Figure 1.11: GIS and GPS
12
8. GIS
Geographical Information System (GIS) can be defined as a combination of
computer application with land survey related work. In order to make this system
works, the data from land surveying work need to be acquired and then using
appropriate computer software, the data will be stored, scanned, manipulated,
processed, analyzed and presented. In figure 1.10, it shows the layer of
information from surveying works are put into place in GIS.
1.5 SURVEYING UNIT
A unit of measurement is a definite magnitude of a physical quantity, defined and
adopted by convention or by law, which is used as a standard for measurement
of the same physical quantity. Any other value of the physical quantity can be
expressed as a simple multiple of the unit of measurement.
For example, length is a physical quantity. The metre is a unit of length that
represents a definite predetermined length. When we say 10 metres (or 10 m),
we actually mean 10 times the definite predetermined length called "metre".The
unit used is based on the country, for example in Malaysia, metre to measure
length or distance and the UK use mile.
This measurement unit is important for survey as well as other field or discipline
in order to determine length or distance or point on earth or height. All
engineering plans and drawings are produced at particular scale, for example,
1:500, 1:200 and so on. The scale value indicates the ratio of horizontal and/or
vertical plan distances to horizontal and/or vertical ground distances that was
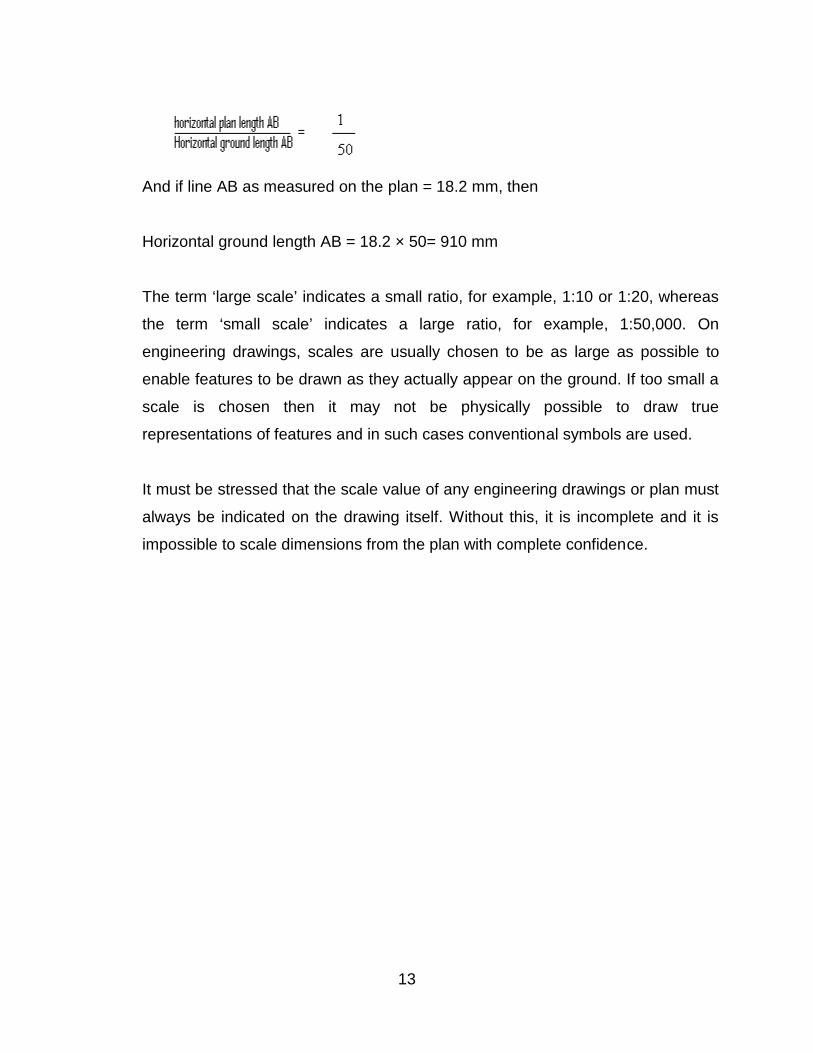
used when the drawing was produced, for example, a horizontal plan having a
scale of 1:50 indicates that for a line AB
13
And if line AB as measured on the plan = 18.2 mm, then
Horizontal ground length AB = 18.2 × 50= 910 mm
The term ‘large scale’ indicates a small ratio, for example, 1:10 or 1:20, whereas
the term ‘small scale’ indicates a large ratio, for example, 1:50,000. On
engineering drawings, scales are usually chosen to be as large as possible to
enable features to be drawn as they actually appear on the ground. If too small a
scale is chosen then it may not be physically possible to draw true
representations of features and in such cases conventional symbols are used.
It must be stressed that the scale value of any engineering drawings or plan must
always be indicated on the drawing itself. Without this, it is incomplete and it is
impossible to scale dimensions from the plan with complete confidence.
14
1.6 CONCLUSION
Surveying is a meld of science, art, and measurement technology used to
determine and record the relative positions of points on (or above or below) the
earth's surface. Surveying can involve anything from determining the position of
a single point, to establishing the boundary between adjacent land parcels, to
mapping the terrain in a stream valley, to modeling the size and shape of the
entire earth. With rapidly expanding residential and business developments, and
the steady rise in land value, a surveyor's measurements and decisions are
increasingly important. Computing, electronic field instruments including GPS,
and GIS have brought new tools and challenges to surveyors.Surveying is done
by a variety of people with various skills and backgrounds and utilizing a range of
equipment and methods. Moreover, issues of property boundaries are the
venueof the land surveyor
LEARNING ACTIVITIES(1) In what other contexts and occupations are the term survey employed?
(2) How does surveyor benefit from the exploration of space?
REFERENCES
Anderson, J., & Mikhail, E. (1998). Surveying: Theory and practice. (7th ed., p.
1011). McGraw-Hill.
Charles D. Ghilani, Paul R. Wolf (2008), Elementary Surveying: An Introduction to
Geomatics,Prentice Hall.
15
CHAPTER 2SURVEYING PRINCIPLE
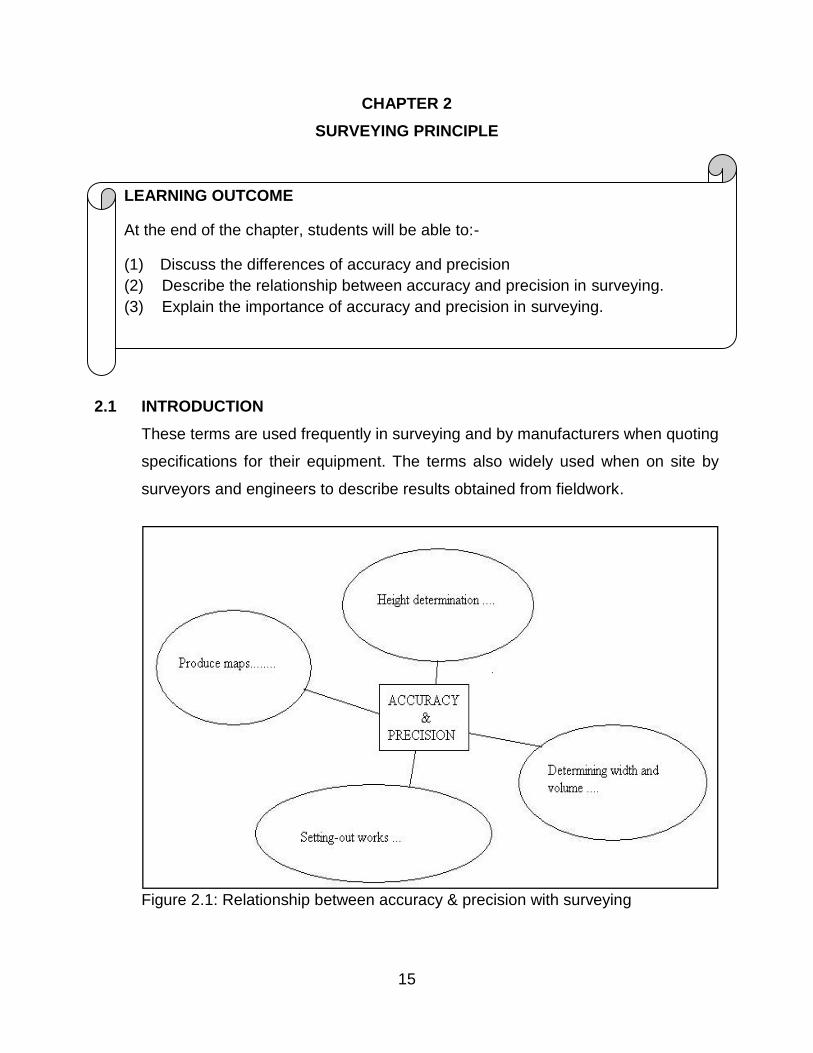
2.1 INTRODUCTIONThese terms are used frequently in surveying and by manufacturers when quoting
specifications for their equipment. The terms also widely used when on site by
surveyors and engineers to describe results obtained from fieldwork.
Figure 2.1: Relationship between accuracy & precision with surveying
LEARNING OUTCOME
At the end of the chapter, students will be able to:-
(1) Discuss the differences of accuracy and precision(2) Describe the relationship between accuracy and precision in surveying.(3) Explain the importance of accuracy and precision in surveying.
16
Accuracy is the relationship between the value of a measurement and the "true"
value of the dimension being measured; the greater the accuracy, the smaller the
error. Precision describes the degree of refinement with which the measurement
is based. Figure 2.1 depicts the relationship of accuracy and precision with
surveying, where the measurement done in surveying must follow certain ways in
order to achieve the objective of surveying with the accuracy and precision
needed.
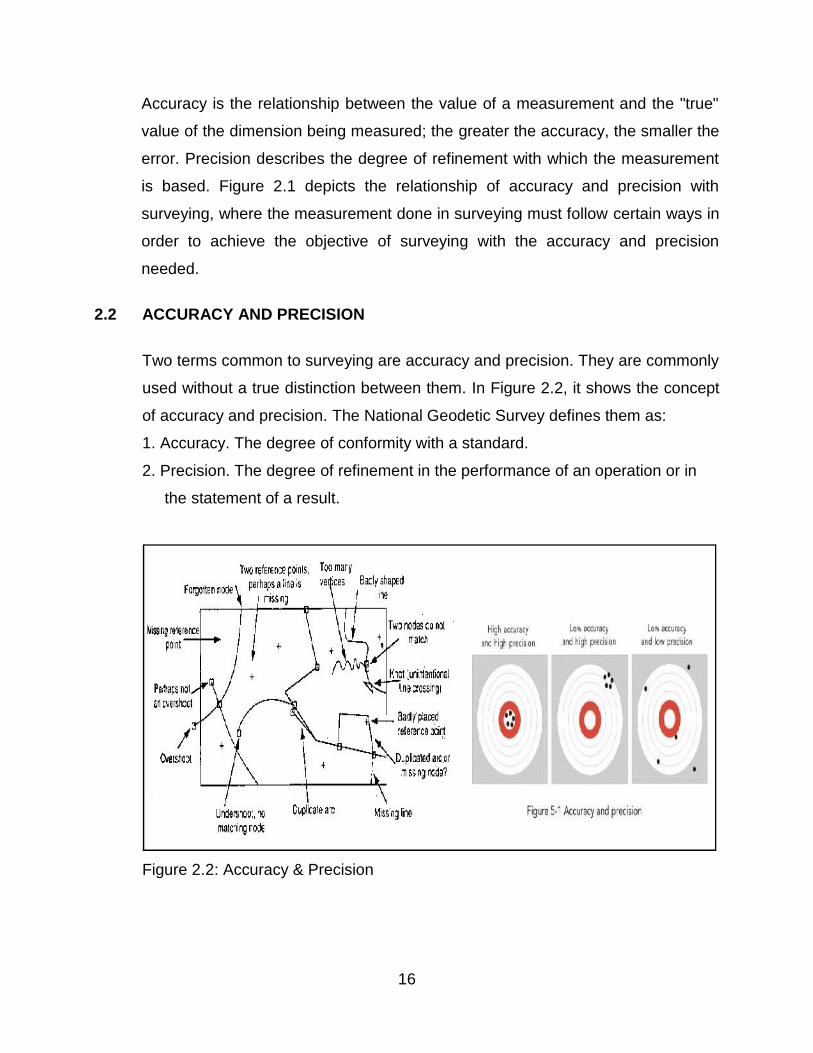
2.2 ACCURACY AND PRECISION
Two terms common to surveying are accuracy and precision. They are commonly
used without a true distinction between them. In Figure 2.2, it shows the concept
of accuracy and precision. The National Geodetic Survey defines them as:
1. Accuracy. The degree of conformity with a standard.
2. Precision. The degree of refinement in the performance of an operation or in
the statement of a result.
Figure 2.2: Accuracy & Precision
17
Accuracy is considered to be an overall estimate of the errors present in
measurements including systematic effects. Accuracy also can be described as
the relationship between the value of a measurement and the true value of the
dimension being measured. Accuracy relates to the degree of perfection
obtained, and is a function of the quality of the result and the quality of the
operation used to obtain the result. Accuracy is a function of precise methods,
precise instruments, precise procedures, and most of all, good planning.
Precision can be described as the degree of refinement with which the
measurement is made and also represents the repeatability of a measurement
and is concerned only with random errors. A set of observations that are closely
grouped together and have small deviations from the sample mean will have a
small standard error and said to be precise. While precise instruments are not a
necessity, the use of less precise instruments may require increased time spent
at a station and require more observations to achieve accurate results.
Good planning and a reconnaissance trip will save many man-hours later.
Precision relates to the degree of perfection used (technique) and is a function of
proper instrumentation (tools), procedures (methods), and observations.
Accuracy is the degree of perfection obtained (results). Actual results must be
used to compute accuracy. When the results do not compare favorably with the
estimated results, it should be assumed that errors exist which should be
corrected.
The accuracy of a field survey depends directly upon its precision. Although by
chance (for example, compensating error) surveys with high order accuracies
might be attained without high order precision, such accuracies are not valid.
Therefore, all measurements and results should be shown with the number of
significant figures that are commensurate with the precision used to attain the
results. All surveys must be performed with a precision that ensures that the
desired accuracy is attained.
18
2.3 CONCEPT OF ERROR IN SURVEYING
An error due to the effects of temperatures could cause a precise measurement
to become relatively inaccurate. Temperature is not only one factor that can affect
the accuracy of distances measured by tape or electronic distance measurement.
It can be said that no measurement except for counting can be free of error. For
every measuring technique used, a more precise and potentially more accurate
method can be found.
For purposes of calculating errors, the true value is determined statistically after
repeated measurements. In the simplest case, the true value for a distance is the
mean value for a series of repeated measurements.
Systematic errors are defined as those errors whose magnitudes are algebraic
sign can be determined. The fact that these errors can be determined allows the
surveyor to eliminate them from the measurements and thus improve the
accuracy. The error due to the effects of temperature is an example of systematic
error.
Random errors are associated with the skill and vigilance of the surveyor.
Random errors are introduced into each measurement mainly because no human
being can perform perfectly. Random errors, by their very nature, tend to cancel
themselves when surveyors are skilled and careful in measuring. However,
random errors resulting from unskilled or careless work do cause problems.
2.4 Natural Factors
Differential Temperatures:
Bright sunlight striking certain parts of the instrument may cause differential
expansion of the metal components of the instrument, resulting in small errors. To
minimize this error, it is recommended to work under a parasol.
19
Heat Waves:
Heat waves can cause distortion of lines of sight near a reflecting surface. The
use of a tower can reduce the effect of heat waves. Working at night is another
alternative available. Otherwise, unless it is urgent, on control surveys the work
should be postponed until better conditions exist.
Phase:
If a sight is not evenly lighted on both sides, the instrument man will tend to point
toward one side. This phenomenon, called "phase", can be reduced by using a
target with a flat surface pointed directly toward the instrument. "Y" shaped
targets are useful in reducing phase.
Diffraction:
If a line of sight passes very near a solid object such as a pole, light rays from a
distant target may bend or diffract around the object, causing the object to appear
in the wrong place. The closer the obstacle is to the instrument, the greater the
diffraction. Diffraction can occur in either horizontal or vertical observations.
To detect diffraction, move the focusing knob slowly back and forth while
watching the target. If the target appears to move relative to the obstacle and the
cross hairs, the obstacle is causing diffraction. Offset the line to correct this
condition.
Refraction:
When light waves pass from a medium of one density into a medium of a different
density, the rays change in direction (bend). The change in direction is called
refraction. Since sight lines are light rays, they are refracted, or bent, by changes
in the atmosphere, causing small errors in angular measurement. Normally, the
lateral refraction is insignificant in most surveys, but its effects can be further
minimized by understanding and avoiding situations that generate the largest
refraction of line of sight.
20
When the sun shines on a barren, dark surface, the surface warms
relatively quickly. This warms the air and, if calm, it produces a column of warm,
light air rising from the surface.
Other situations include:
o Dark, freshly plowed fields lying between lighter colored areas of growing
crops.
o Clear areas between heavy forests.
o Large bodies of warm water between land areas.
o Open valleys bordered by bluffs on either side. If a line must pass over a
valley, set the observation points as far back from the edges of the valley
as possible.
o Air tends to layer parallel to the slopes of embankments or the base of
foothills.
Minimizing Refraction:
When refraction is probable in angles to be measured, or is suspected in angles
that have been measured, carefully examine the survey area and plan station
locations to avoid problem conditions listed above.
Make observations when a breeze keeps the air stirred and prevents layering, or
on cloudy days or at night. Reobserve lines under different atmospheric
conditions, preferably when the wind is from a different direction.
21
2.5 CONCLUSION
Students should be able to justify that for each project survey, the establishment
of the appropriate levels of accuracy and precision is necessary to meet the
project requirements. In addition, they must be able to use delicate instruments
with accuracy and precision. A measurement system can be accurate but not
precise, precise but not accurate, neither, or both. For example, if an experiment
contains a systematic error, then increasing the sample size generally increases
precision but does not improve accuracy. The result would be a consistent yet
inaccurate string of results from the flawed experiment. Eliminating the systematic
error improves accuracy but does not change precision.
LEARNING ACTIVITIES(1) Why the concept of error is important in surveying?
(2) Discuss the differences between accuracy and precision. In your opinion, does a
professional need to understand.
REFERENCESBarry F. Kavanagh (2003), Geomatics, Prentice Hall.
Charles D. Ghilani, Paul R. Wolf (2008), Elementary Surveying: An Introduction to
Geomatics,Prentice Hall
22
CHAPTER 3SURVEYING EQUIPMENT (TOTAL STATION)
3.1 INTRODUCTION
Making measurements and the subsequent computations utilizing them are
fundamental tasks of surveyors. The process requires a combination of human
skill and mechanical equipment applied with the utmost judgment. Experience
and good physical conditions improve the human factor while superior equipment
enables good operators to do better work with more consistent results and in less
time. Measurements are never exact, however, and no matter how carefully
made, they will always contain errors.
Surveyors, whose work must be performed to exacting standards, should
therefore thoroughly understand the different kinds of errors, their sources and
expected magnitudes under varying conditions and manner of propagations. Only
then can they select instruments and procedures necessary to reduce error sizes
to within tolerable limits.
This chapter covers the equipment use in land survey and as for this module, it
only discuss equipment that is related to construction industry. Moreover, land
LEARNING OUTCOME
At the end of the chapter, students will:be able to-
(1) Describe the basic usage of total station.(2) Discuss the basic surveying concepts and operations including error theory,
distance measurement, leveling (differential, cross sectioning, profiling),coordinate geometry, bearings and azimuths, angular measurement andbasic calculation.
23
survey is the activities that involve making measurement prior to the construction
of any projects such building, roads, tunnel and other built environments.
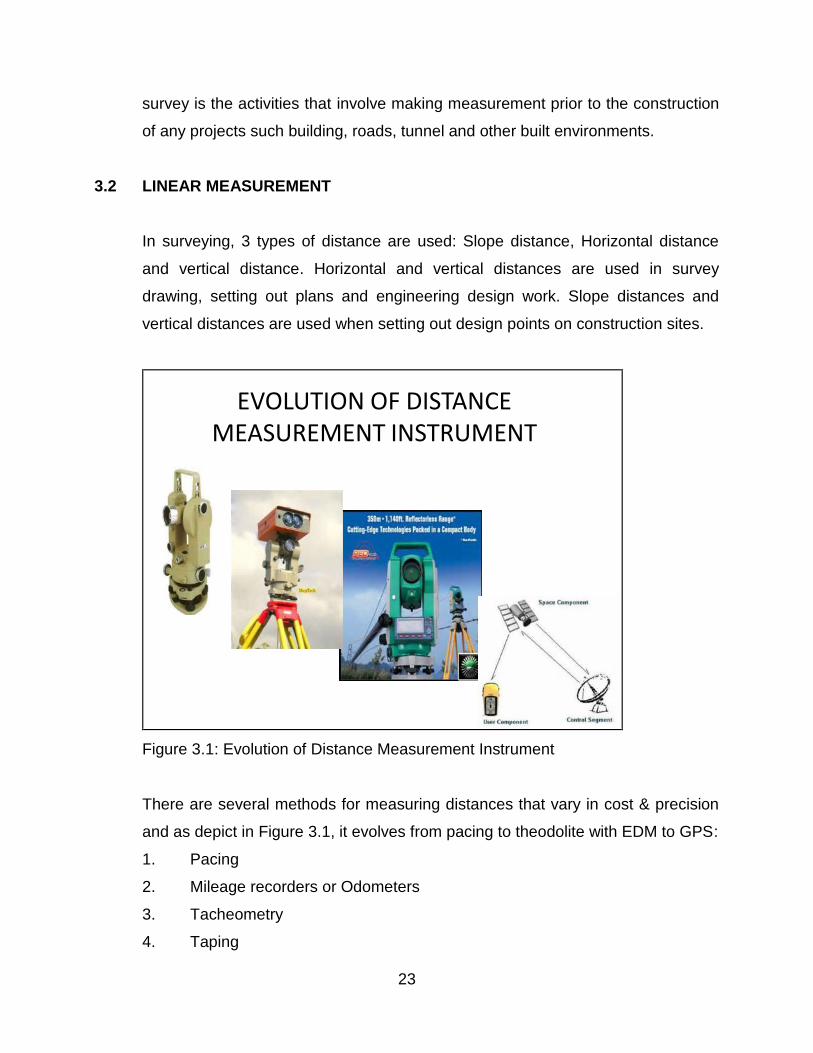
3.2 LINEAR MEASUREMENT
In surveying, 3 types of distance are used: Slope distance, Horizontal distance
and vertical distance. Horizontal and vertical distances are used in survey
drawing, setting out plans and engineering design work. Slope distances and
vertical distances are used when setting out design points on construction sites.
EVOLUTION OF DISTANCEMEASUREMENT INSTRUMENT
Figure 3.1: Evolution of Distance Measurement Instrument
There are several methods for measuring distances that vary in cost & precision
and as depict in Figure 3.1, it evolves from pacing to theodolite with EDM to GPS:
1. Pacing
2. Mileage recorders or Odometers
3. Tacheometry
4. Taping
24
5. Electronic Distance Measurement (EDM)
6. Total Station
7. GPS (Global Positioning System)
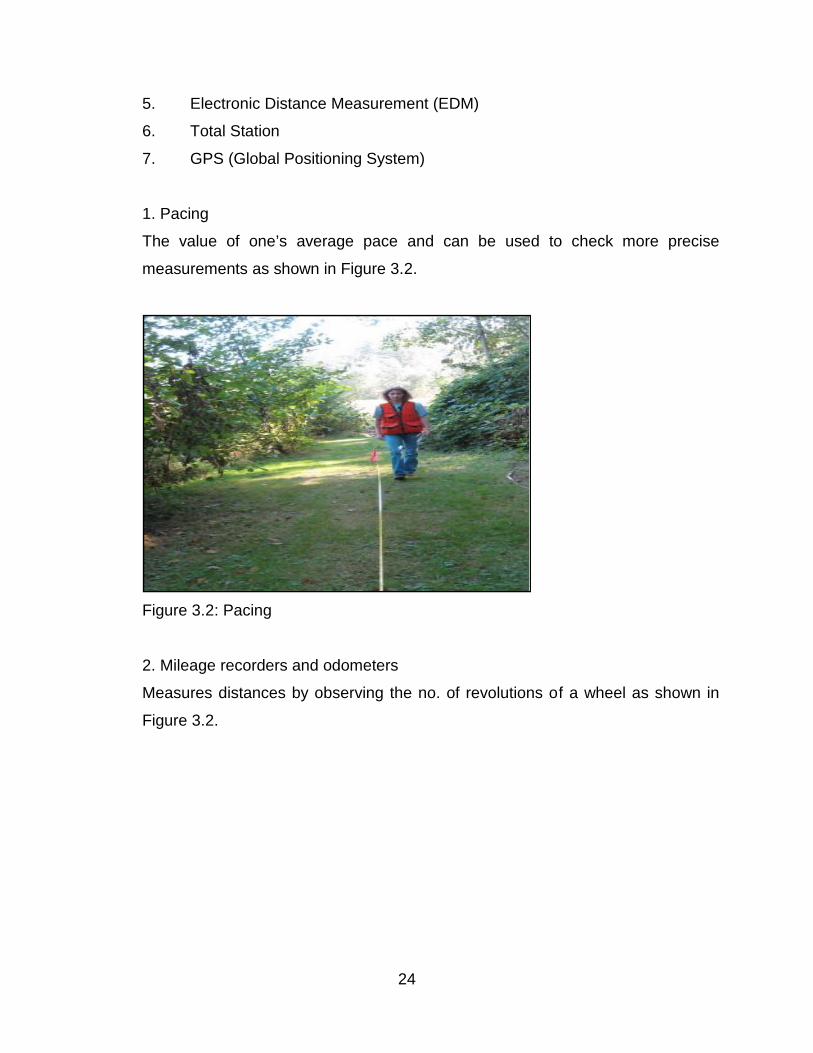
1. Pacing
The value of one’s average pace and can be used to check more precise
measurements as shown in Figure 3.2.
Figure 3.2: Pacing
2. Mileage recorders and odometers
Measures distances by observing the no. of revolutions of a wheel as shown in
Figure 3.2.
25
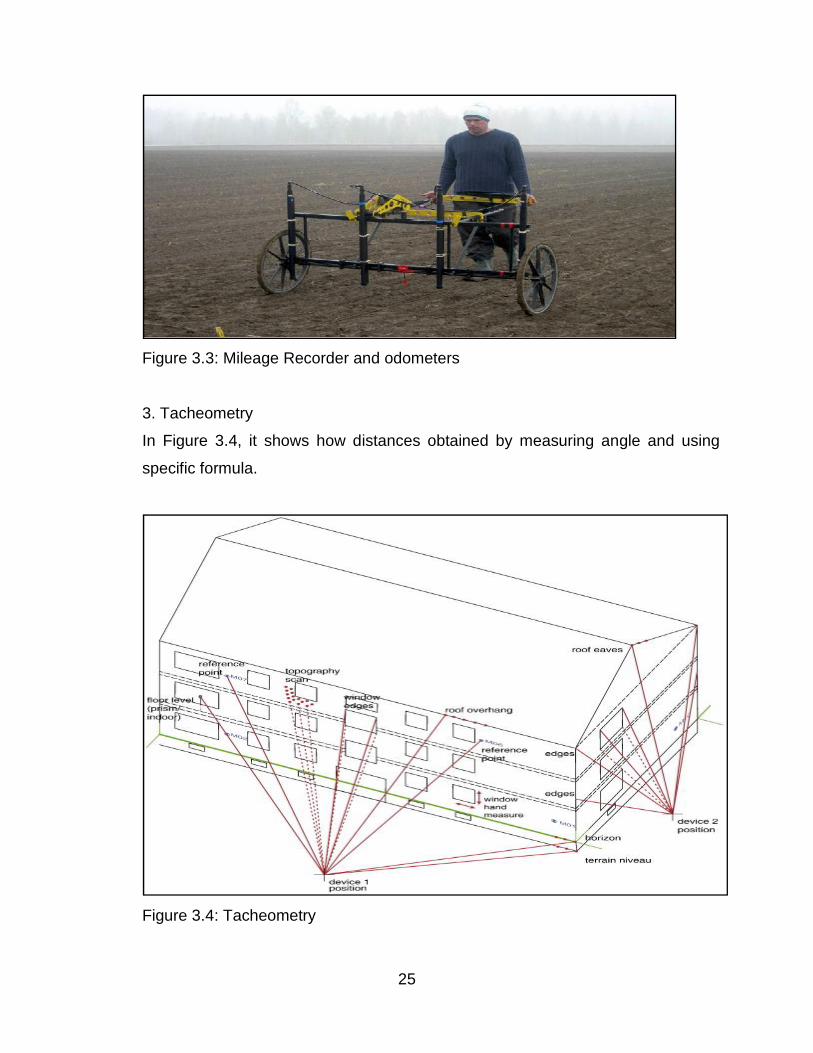
Figure 3.3: Mileage Recorder and odometers
3. Tacheometry
In Figure 3.4, it shows how distances obtained by measuring angle and using
specific formula.
Figure 3.4: Tacheometry
26
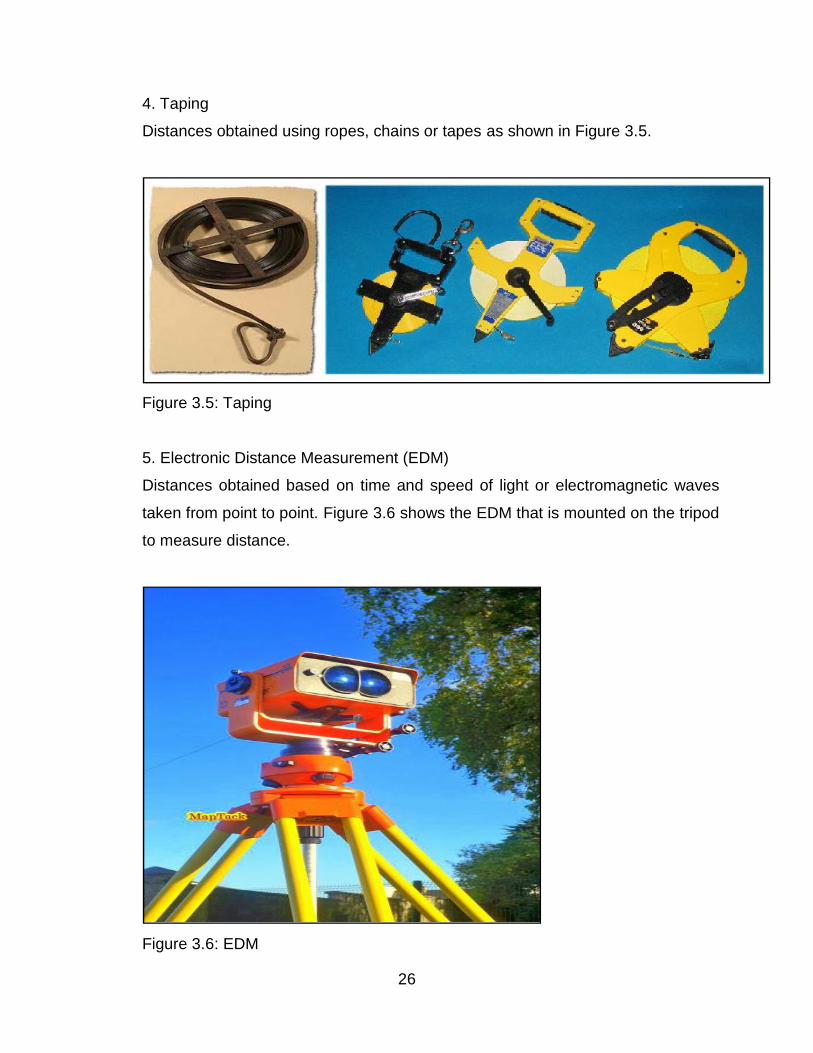
4. Taping
Distances obtained using ropes, chains or tapes as shown in Figure 3.5.
Figure 3.5: Taping
5. Electronic Distance Measurement (EDM)
Distances obtained based on time and speed of light or electromagnetic waves
taken from point to point. Figure 3.6 shows the EDM that is mounted on the tripod
to measure distance.
Figure 3.6: EDM
27
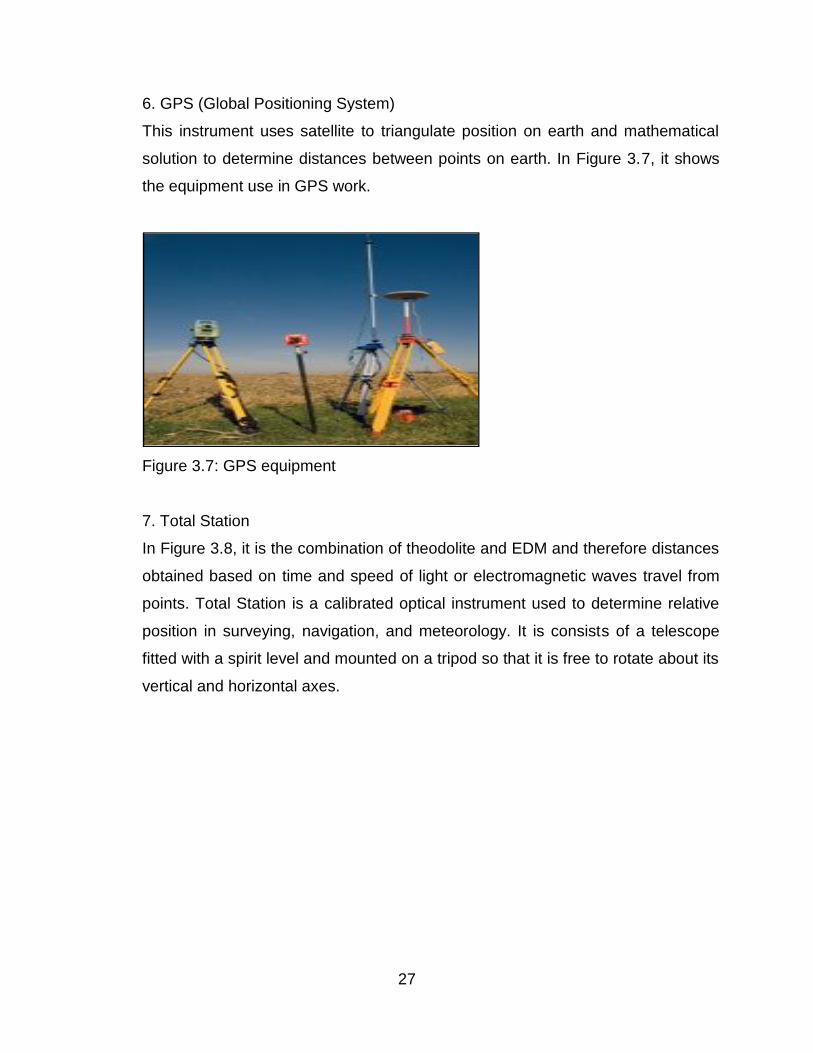
6. GPS (Global Positioning System)
This instrument uses satellite to triangulate position on earth and mathematical
solution to determine distances between points on earth. In Figure 3.7, it shows
the equipment use in GPS work.
Figure 3.7: GPS equipment
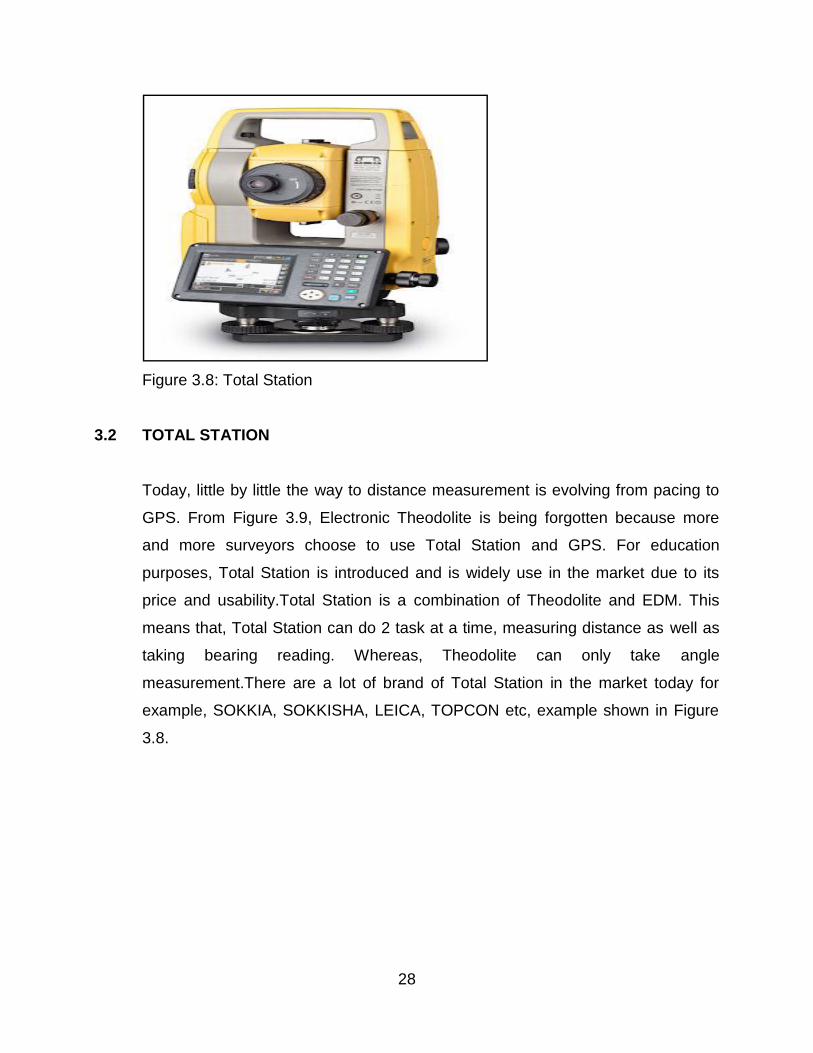
7. Total Station
In Figure 3.8, it is the combination of theodolite and EDM and therefore distances
obtained based on time and speed of light or electromagnetic waves travel from
points. Total Station is a calibrated optical instrument used to determine relative
position in surveying, navigation, and meteorology. It is consists of a telescope
fitted with a spirit level and mounted on a tripod so that it is free to rotate about its
vertical and horizontal axes.
28
Figure 3.8: Total Station
3.2 TOTAL STATION
Today, little by little the way to distance measurement is evolving from pacing to
GPS. From Figure 3.9, Electronic Theodolite is being forgotten because more
and more surveyors choose to use Total Station and GPS. For education
purposes, Total Station is introduced and is widely use in the market due to its
price and usability.Total Station is a combination of Theodolite and EDM. This
means that, Total Station can do 2 task at a time, measuring distance as well as
taking bearing reading. Whereas, Theodolite can only take angle
measurement.There are a lot of brand of Total Station in the market today for
example, SOKKIA, SOKKISHA, LEICA, TOPCON etc, example shown in Figure
3.8.
29
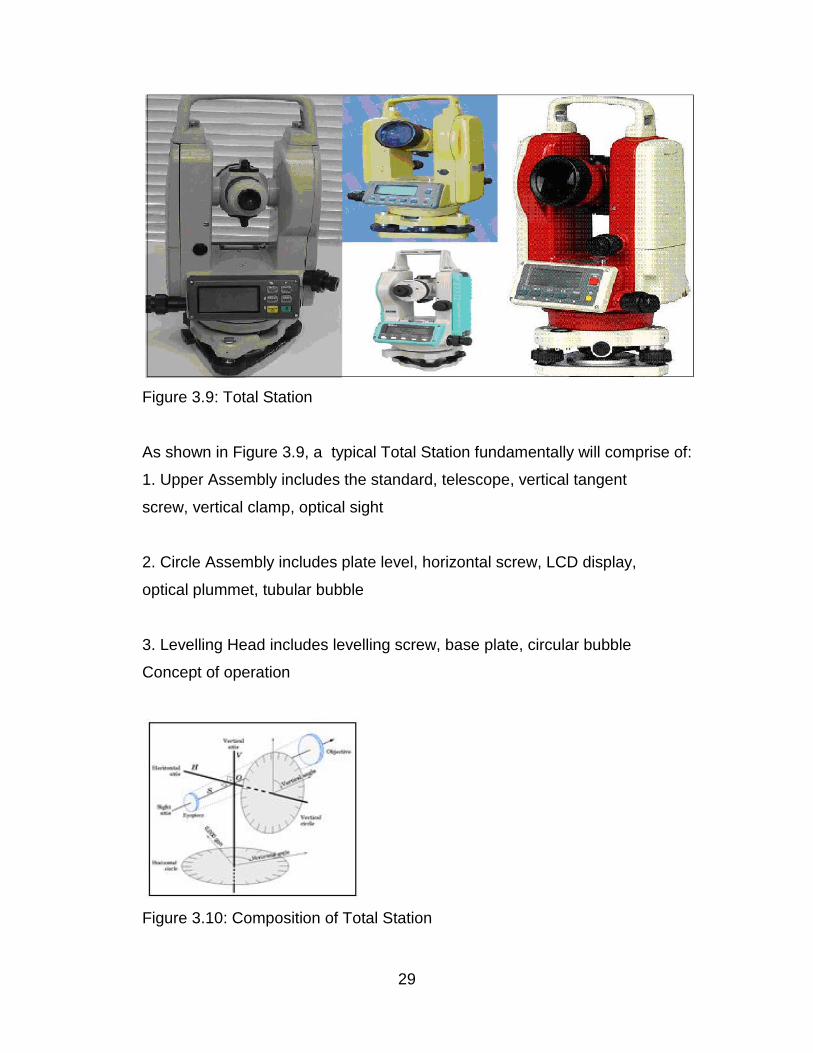
Figure 3.9: Total Station
As shown in Figure 3.9, a typical Total Station fundamentally will comprise of:
1. Upper Assembly includes the standard, telescope, vertical tangent
screw, vertical clamp, optical sight
2. Circle Assembly includes plate level, horizontal screw, LCD display,
optical plummet, tubular bubble
3. Levelling Head includes levelling screw, base plate, circular bubble
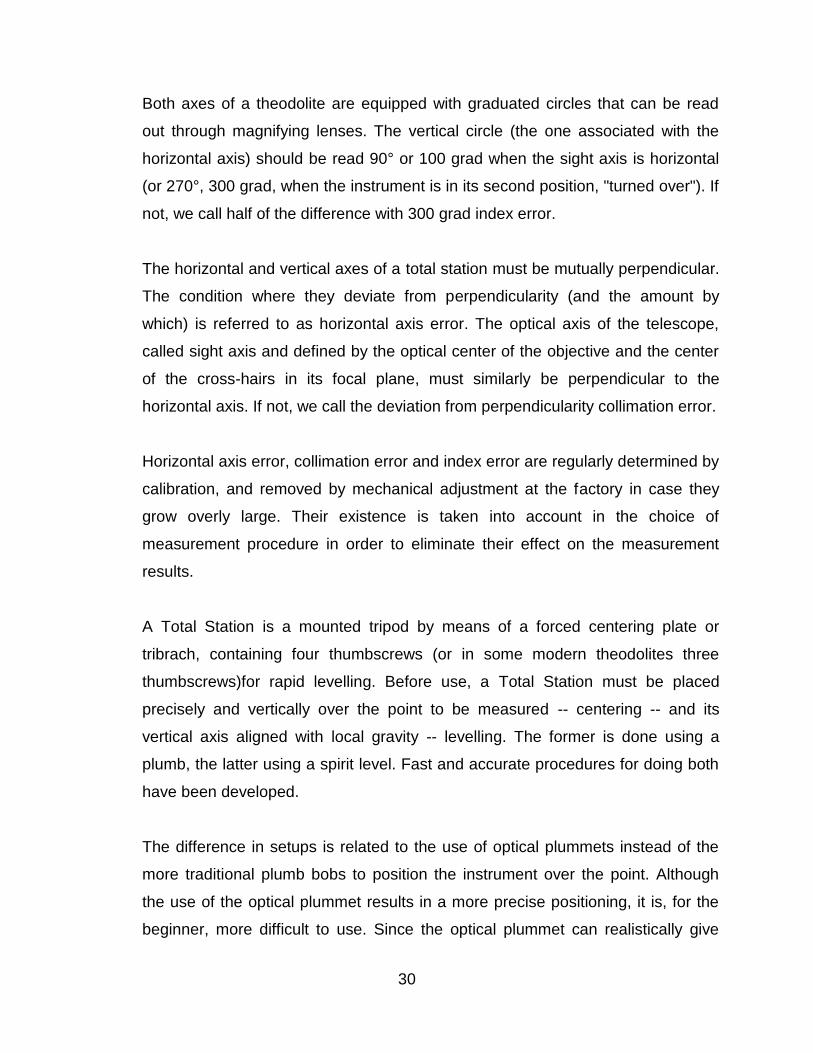
Concept of operation
Figure 3.10: Composition of Total Station
30
Both axes of a theodolite are equipped with graduated circles that can be read
out through magnifying lenses. The vertical circle (the one associated with the
horizontal axis) should be read 90° or 100 grad when the sight axis is horizontal
(or 270°, 300 grad, when the instrument is in its second position, "turned over"). If
not, we call half of the difference with 300 grad index error.
The horizontal and vertical axes of a total station must be mutually perpendicular.
The condition where they deviate from perpendicularity (and the amount by
which) is referred to as horizontal axis error. The optical axis of the telescope,
called sight axis and defined by the optical center of the objective and the center
of the cross-hairs in its focal plane, must similarly be perpendicular to the
horizontal axis. If not, we call the deviation from perpendicularity collimation error.
Horizontal axis error, collimation error and index error are regularly determined by
calibration, and removed by mechanical adjustment at the factory in case they
grow overly large. Their existence is taken into account in the choice of
measurement procedure in order to eliminate their effect on the measurement
results.
A Total Station is a mounted tripod by means of a forced centering plate or
tribrach, containing four thumbscrews (or in some modern theodolites three
thumbscrews)for rapid levelling. Before use, a Total Station must be placed
precisely and vertically over the point to be measured -- centering -- and its
vertical axis aligned with local gravity -- levelling. The former is done using a
plumb, the latter using a spirit level. Fast and accurate procedures for doing both
have been developed.
The difference in setups is related to the use of optical plummets instead of the
more traditional plumb bobs to position the instrument over the point. Although
the use of the optical plummet results in a more precise positioning, it is, for the
beginner, more difficult to use. Since the optical plummet can realistically give
31
position only when the instrument is level (or nearly so), the beginning surveyor is
often unaware of the relative location of the instrument until the setup procedure
is almost complete, and if the instrument has not been properly positioned, the
entire procedure must be repeated. To reduce setup time, a systematic approach
is recommended.
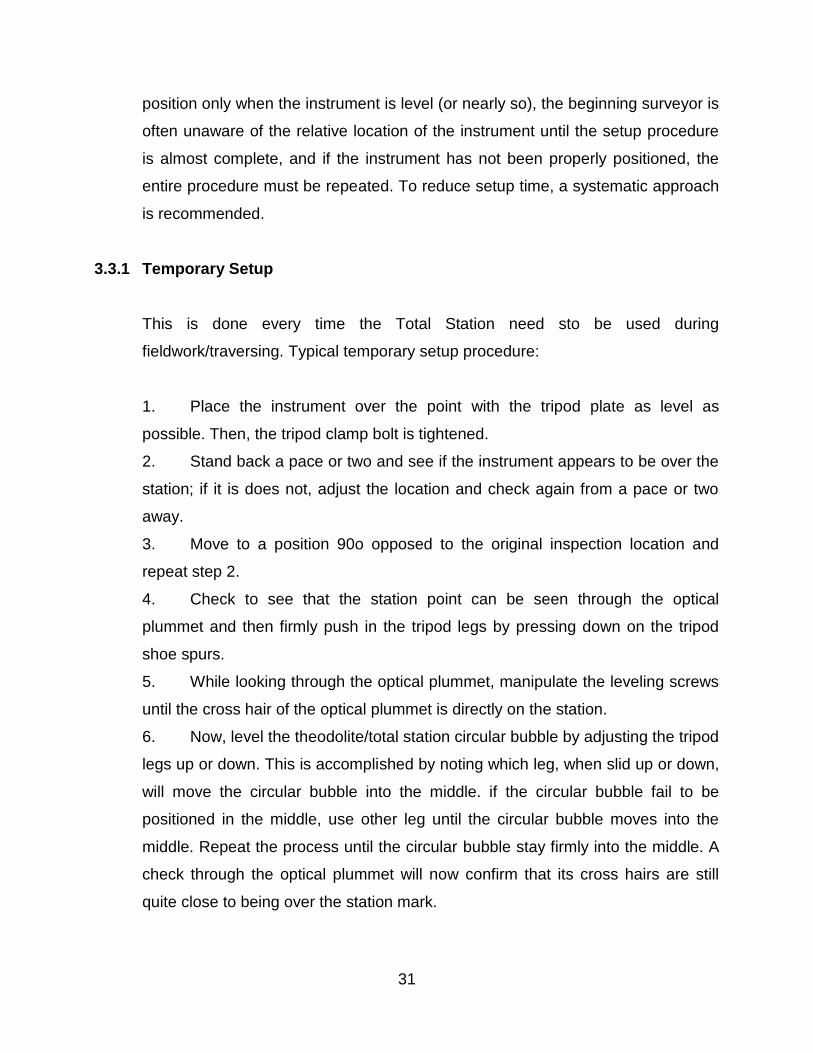
3.3.1 Temporary Setup
This is done every time the Total Station need sto be used during
fieldwork/traversing. Typical temporary setup procedure:
1. Place the instrument over the point with the tripod plate as level as
possible. Then, the tripod clamp bolt is tightened.
2. Stand back a pace or two and see if the instrument appears to be over the
station; if it is does not, adjust the location and check again from a pace or two
away.
3. Move to a position 90o opposed to the original inspection location and
repeat step 2.
4. Check to see that the station point can be seen through the optical
plummet and then firmly push in the tripod legs by pressing down on the tripod
shoe spurs.
5. While looking through the optical plummet, manipulate the leveling screws
until the cross hair of the optical plummet is directly on the station.
6. Now, level the theodolite/total station circular bubble by adjusting the tripod
legs up or down. This is accomplished by noting which leg, when slid up or down,
will move the circular bubble into the middle. if the circular bubble fail to be
positioned in the middle, use other leg until the circular bubble moves into the
middle. Repeat the process until the circular bubble stay firmly into the middle. A
check through the optical plummet will now confirm that its cross hairs are still
quite close to being over the station mark.
32
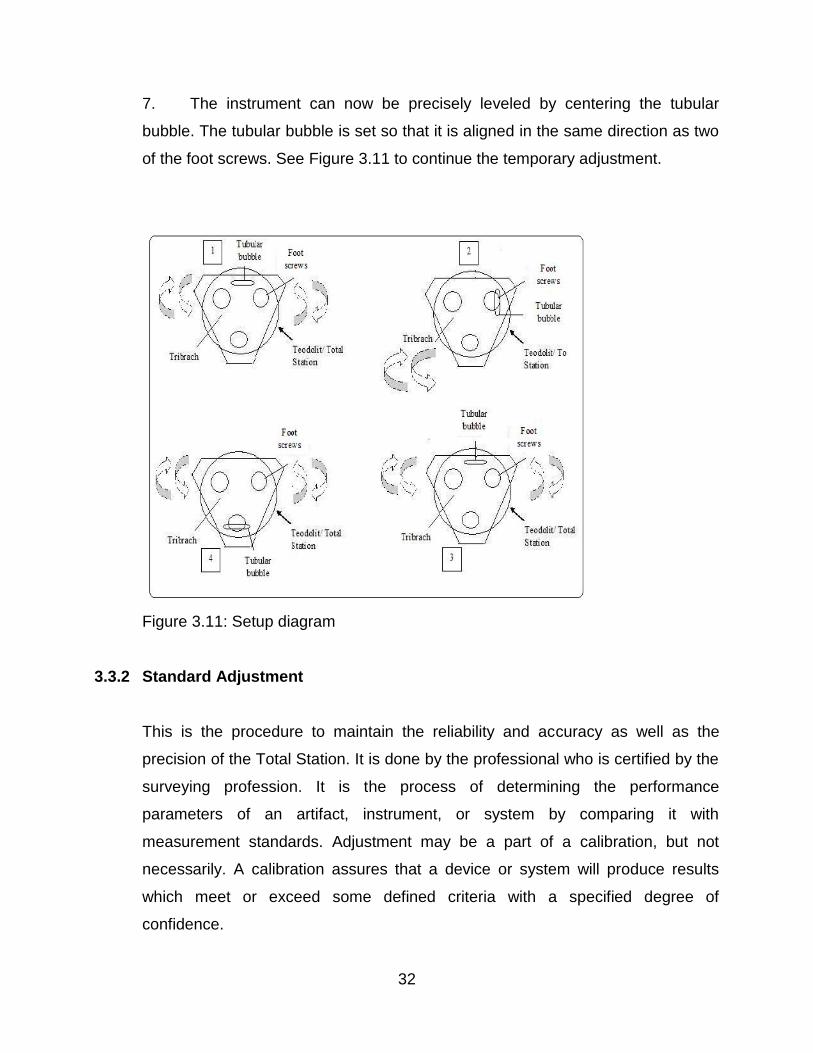
7. The instrument can now be precisely leveled by centering the tubular
bubble. The tubular bubble is set so that it is aligned in the same direction as two
of the foot screws. See Figure 3.11 to continue the temporary adjustment.
Figure 3.11: Setup diagram
3.3.2 Standard Adjustment
This is the procedure to maintain the reliability and accuracy as well as the
precision of the Total Station. It is done by the professional who is certified by the
surveying profession. It is the process of determining the performance
parameters of an artifact, instrument, or system by comparing it with
measurement standards. Adjustment may be a part of a calibration, but not
necessarily. A calibration assures that a device or system will produce results
which meet or exceed some defined criteria with a specified degree of
confidence.
33
Two important measurement concepts related to calibration are precision and
accuracy. Precision refers to the minimum discernible change in the parameter
being measured, while accuracy refers to the actual amount of error that exists in
a calibration. All measurement processes used for calibration are subject to
various sources of error. It is common practice to classify them as random or
systematic errors. When a measurement is repeated many times, the results will
exhibit random statistical fluctuations which may or may not be significant.
Systematic errors are offsets from the true value of a parameter and, if they are
known, corrections are generally applied, eliminating their effect on the
calibration. If they are not known, they can have an adverse effect on the
accuracy of the calibration. High-accuracy calibrations are usually accompanied
by an analysis of the sources of error and a statement of the uncertainty of the
calibration. Uncertainty indicates how much the accuracy of a calibration could be
degraded as a result of the combined errors. The horizontal axis should be
perpendicular to the vertical axis. The standards are checked for proper
adjustment by first setting up the transit and then sighting a high point.
3.4 OBJECTIVE OF LINEAR MEASUREMENT
The objectives of the measurement for the distance of points on the surface of the
earth are:
Area calculation
Boundary determination
Any related information of points on earth
3.5 ANGLE MEASUREMENT
In surveying, angle measurement is important as well as the distance
measurement. There are two types of angle measurements:
Horizontal Angle,
34
Vertical Angle.
EVOLUTION OF ANGULARMEASUREMENT INSTRUMENT
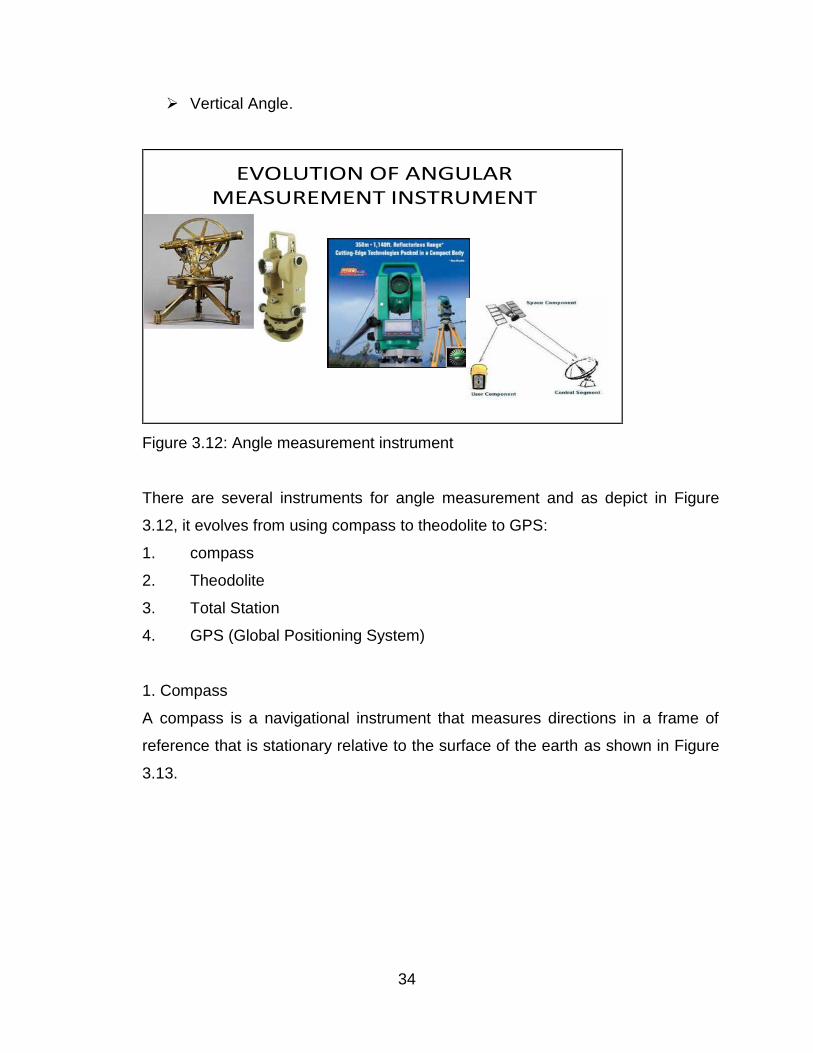
Figure 3.12: Angle measurement instrument
There are several instruments for angle measurement and as depict in Figure
3.12, it evolves from using compass to theodolite to GPS:
1. compass
2. Theodolite
3. Total Station
4. GPS (Global Positioning System)
1. Compass
A compass is a navigational instrument that measures directions in a frame of
reference that is stationary relative to the surface of the earth as shown in Figure
3.13.
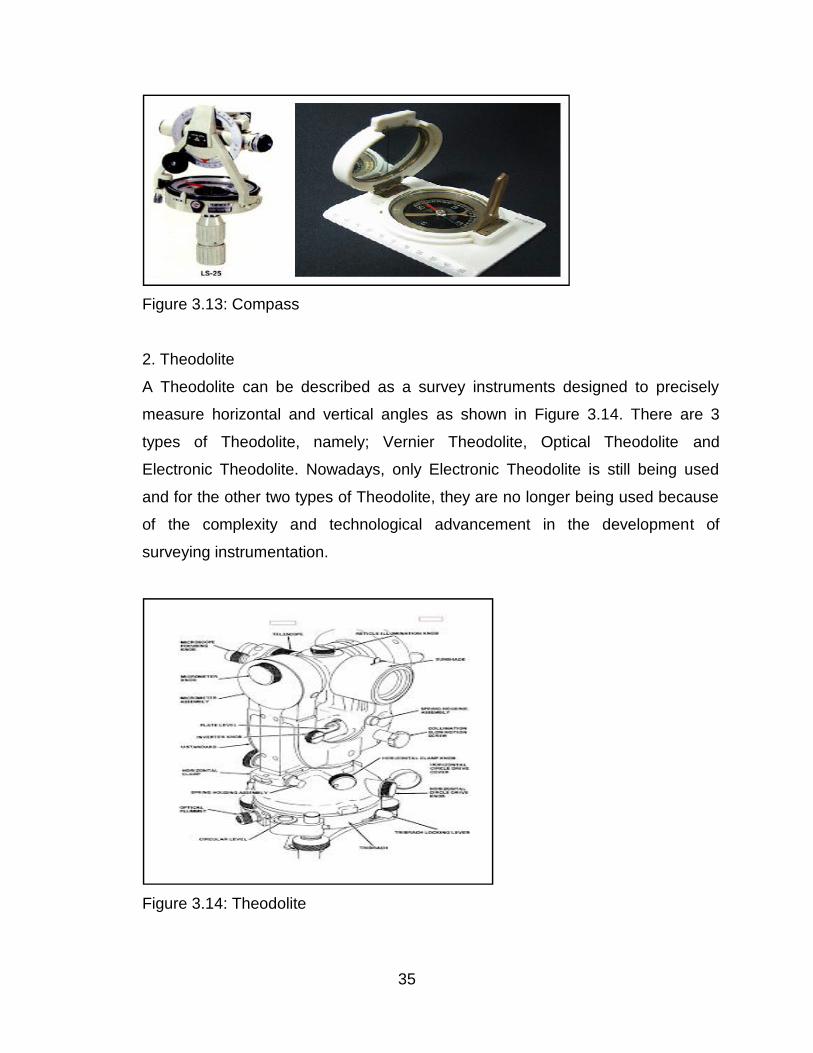
35
Figure 3.13: Compass
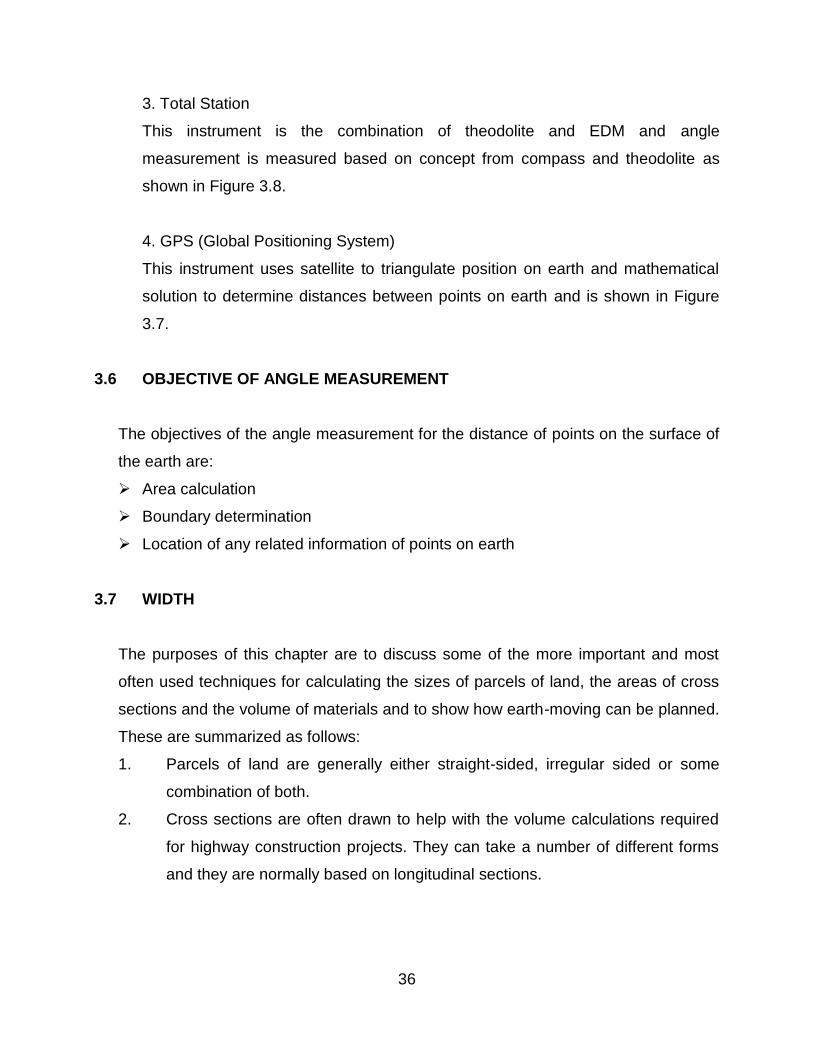
2. Theodolite
A Theodolite can be described as a survey instruments designed to precisely
measure horizontal and vertical angles as shown in Figure 3.14. There are 3
types of Theodolite, namely; Vernier Theodolite, Optical Theodolite and
Electronic Theodolite. Nowadays, only Electronic Theodolite is still being used
and for the other two types of Theodolite, they are no longer being used because
of the complexity and technological advancement in the development of
surveying instrumentation.
Figure 3.14: Theodolite
36
3. Total Station
This instrument is the combination of theodolite and EDM and angle
measurement is measured based on concept from compass and theodolite as
shown in Figure 3.8.
4. GPS (Global Positioning System)
This instrument uses satellite to triangulate position on earth and mathematical
solution to determine distances between points on earth and is shown in Figure
3.7.
3.6 OBJECTIVE OF ANGLE MEASUREMENT
The objectives of the angle measurement for the distance of points on the surface of
the earth are:
Area calculation
Boundary determination
Location of any related information of points on earth
3.7 WIDTH
The purposes of this chapter are to discuss some of the more important and most
often used techniques for calculating the sizes of parcels of land, the areas of cross
sections and the volume of materials and to show how earth-moving can be planned.
These are summarized as follows:
1. Parcels of land are generally either straight-sided, irregular sided or some
combination of both.
2. Cross sections are often drawn to help with the volume calculations required
for highway construction projects. They can take a number of different forms
and they are normally based on longitudinal sections.
37
3. Volumes of materials can be calculated in a number of ways, depending on
the project concerned. The 3 major methods involve the use of cross sections,
spot heights and contours.
4. The movement of earth on a project is best planned with the aid of a mass
haul diagram
In many engineering projects, large parcels of land are required for the site and huge
amounts of material have to be moved in order to form the necessary embankments,
cuttings, foundations, basements, lakes and so on. It is essential that engineers
make as accurate a measurement as possible of any areas and volumes involved in
order that appropriate cost estimates for such earthwork quantities can be included
in the tender documents
In addition, for certain projects, such as the construction of a new highway, where
large amounts of material have to be excavated and moved around the site, careful
planning of this movement is essential since charges may be levied not only on the
volumes involved but also on the distances over which they are moved.
AREAS ENCLOSED BY STRAIGHT LINE
Into this category fall areas enclosed by traverse, triangulation or detail survey lines.
The results obtained for such areas will be exact since correct geometric equations
and theorems can be applied.
Areas from triangles:The straight sided can be divided into well conditioned triangles,
the areas of which can be calculated using one of the following formula:
1. Area = √ [s(s – a) (s – b) (s – c)] where a, b and c are the lengths of the sides
of the triangle and s = ½ (a + b + c)
2. Area = ½ (base of triangle × height of triangle)
3. Area = ½.a.b sin c where c is the angle contained between side lengths a and
b.
4. Area = average / 2 (from 2 multiply Latit and 2 multiply)
38
5. The area of any straight sided figure can be calculated by splitting it into
triangles and summing the individual areas.
AREAS ENCLOSED BY IRREGULAR LINE
For such cases only approximate results can be achieved. However, methods are
adopted which will give the best approximations.
Graphical method:
This method involves the use of a transparent overlay of squared paper which is laid
over the drawing or plan. The number of squares and parts of squares which are
enclosed by the area is counted and knowing the plan scale, the area represented by
each square is known and hence the total area can be computed. This can be very
accurate method if a small grid is used.
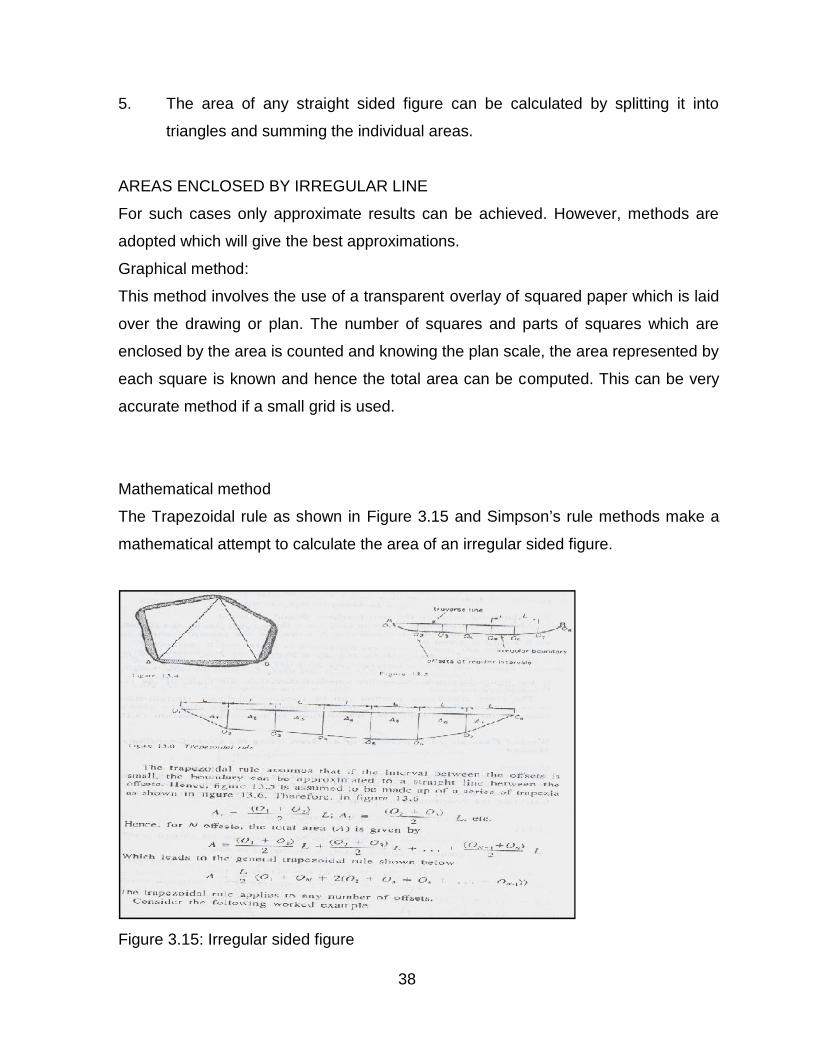
Mathematical method
The Trapezoidal rule as shown in Figure 3.15 and Simpson’s rule methods make a
mathematical attempt to calculate the area of an irregular sided figure.
Figure 3.15: Irregular sided figure
38
5. The area of any straight sided figure can be calculated by splitting it into
triangles and summing the individual areas.
AREAS ENCLOSED BY IRREGULAR LINE
For such cases only approximate results can be achieved. However, methods are
adopted which will give the best approximations.
Graphical method:
This method involves the use of a transparent overlay of squared paper which is laid
over the drawing or plan. The number of squares and parts of squares which are
enclosed by the area is counted and knowing the plan scale, the area represented by
each square is known and hence the total area can be computed. This can be very
accurate method if a small grid is used.
Mathematical method
The Trapezoidal rule as shown in Figure 3.15 and Simpson’s rule methods make a
mathematical attempt to calculate the area of an irregular sided figure.
Figure 3.15: Irregular sided figure
39
For example, in Trapezoidal rule:
The following offsets, 8 m apart were measured at rights from a traverse line to an
irregular boundary. The data, 0m, 2.3m, 5.5m, 7.9m, 8.6m, 6.9m, 7.3m, 6.2m, 3.1m
and 0m. Solution:
Area = 8/2 [0 + 0 + 2( 2.3 + 5.5 + 7.9 + 8.6 + 6.9 + 7.3 + 6.2 + 3.1)
= 4 × 2 (47.8) = 382.4 m2
Using the Simpson’s rule:
Referring to figure 6a, N must be odd number in Simpson’s rule. There are an even
number of offsets, 10, hence calculate the area between 1 and 9 by Simpson’s rule
and the area between 9 to 10 by the Trapezoidal rule.
Solution:
Area (1 – 9) = 8/3 [0 + 3.1 + 4( 2.3 + 7.9 + 6.9 + 6.2 + 3.1) + 2(5.5 + 8.6 + 7.3
= (8 × 139.1)/3 = 370.9 m2
Area (9 - 10) = 8/2 (3.1 + 0)
= 8/2(3.1 + 0 = 12.4 m2
Therefore,
Total Area (1 – 9) = 370.9 + 12.4 = 383.3 m2
Note the difference between those two results and that obtained using the
Trapezoidal rule and Simpson’s rule. The Simpson’s rule will give the more
accurate result when the boundary is genuinely irregular. The Trapezoidal rule
will give the more accurate result when boundary is almost a series of straight
lines
USES OF MASS HAUL DIAGRAM
During the construction of long engineering project such as roads, railways,
pipelines and canals there may be a consideration quantity of earth required to be
brought on the site to form embankments and to be removed from the site during
the formation of cuttings. The earth brought to form embankments may come
from another section of the site such as a tip formed from excavated material
40
(known as a spoil heap) or may be imported on to the site from a nearby quarry.
Any earth brought on to the site is said to have been borrowed.
The earth excavated to form cuttings may be deposited in tips at regular intervals
along the project to form spoil heaps for later use in embankment formation or
may be wasted either by spreading the earth at right angles to the centre line to
form verges or by carting it away from the site area and depositing it in suitable
local areas.
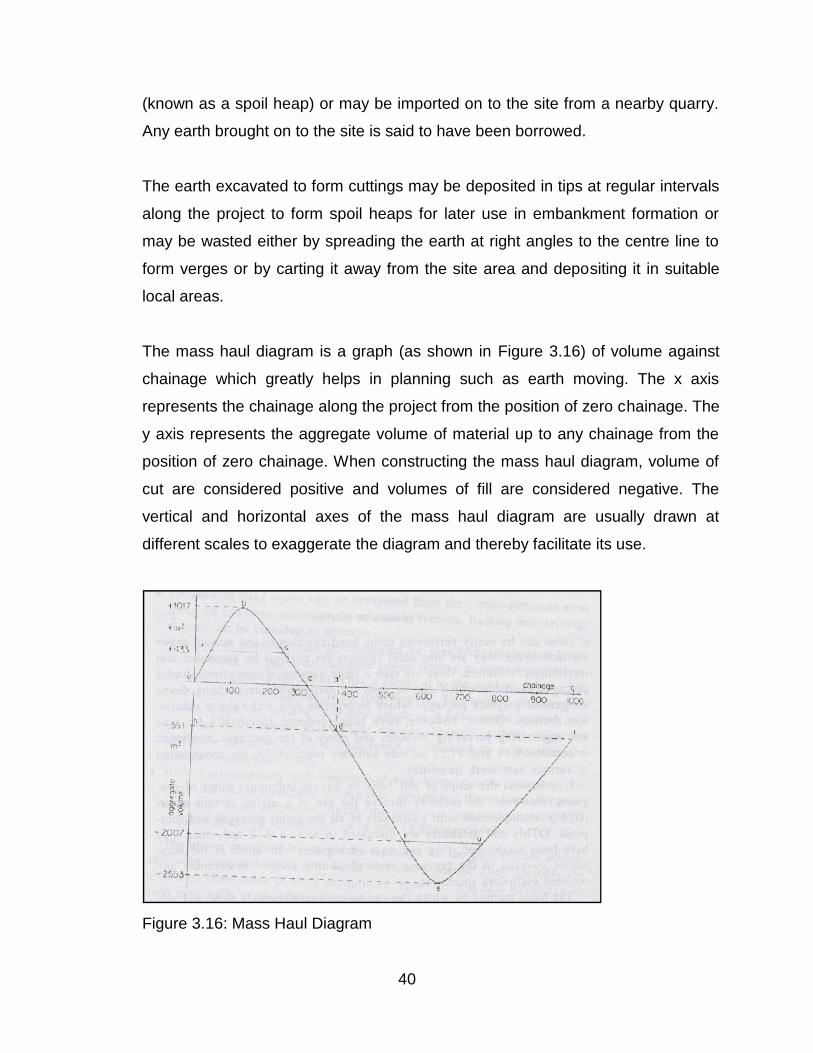
The mass haul diagram is a graph (as shown in Figure 3.16) of volume against
chainage which greatly helps in planning such as earth moving. The x axis
represents the chainage along the project from the position of zero chainage. The
y axis represents the aggregate volume of material up to any chainage from the
position of zero chainage. When constructing the mass haul diagram, volume of
cut are considered positive and volumes of fill are considered negative. The
vertical and horizontal axes of the mass haul diagram are usually drawn at
different scales to exaggerate the diagram and thereby facilitate its use.
Figure 3.16: Mass Haul Diagram
40
(known as a spoil heap) or may be imported on to the site from a nearby quarry.
Any earth brought on to the site is said to have been borrowed.
The earth excavated to form cuttings may be deposited in tips at regular intervals
along the project to form spoil heaps for later use in embankment formation or
may be wasted either by spreading the earth at right angles to the centre line to
form verges or by carting it away from the site area and depositing it in suitable
local areas.
The mass haul diagram is a graph (as shown in Figure 3.16) of volume against
chainage which greatly helps in planning such as earth moving. The x axis
represents the chainage along the project from the position of zero chainage. The
y axis represents the aggregate volume of material up to any chainage from the
position of zero chainage. When constructing the mass haul diagram, volume of
cut are considered positive and volumes of fill are considered negative. The
vertical and horizontal axes of the mass haul diagram are usually drawn at
different scales to exaggerate the diagram and thereby facilitate its use.
Figure 3.16: Mass Haul Diagram
41
Terminology of Mass Haul Diagram
1. Haul distance is the distance from the point of excavation to the point
where the material is to be tippe
2. Average haul distance is the distance from the centre of gravity of the
excavation to the centre of gravity of the tip
3. Free haul distance is that distance, usually specified in the contract, over
which a charge is levied only for the volume of earth excavated and not its
movement.
4. Free haul volume is that volume of material which is moved through the
free haul distance.
5. Overhaul distance – that distance in excess of the free haul distance over
which it may be necessary to transport material.
6. Overhaul volume – that volume of material which is moved in excess of the
free haul distance.
7. Haul is the term used when calculating the costs involved in the earth
moving and is equal to the sum of the products of each volume of material
and the distance through which it is moved.
8. Waste is that volume of material which must be exported from a section of
the site owing to a surplus or unsuitability.
9. Borrow is that volume of material which must be imported into a section of
the site owing to a deficiency of suitable material.
Work example in Mass haul diagram:
In a project for which a section of the mass haul diagram is shown in figure 6a,
the free haul diagram distance is specified as 200m. the earth moving charges as
follows
Cost of free haul volume = RM A per m3
Cost of over haul volume = RM B per m3
Cost of borrowing = RM A per m3
Calculate the costs of borrowing at chainage 1000 m only
42
Solution:
The 200 m free haul diagram distance is added to figure 6a, that is, rs = tu = 200
m. The volumes corresponding to the horizontal line rs and ru are interpolated
from the curve to be + 433 m3 and – 2007 m3 respectively.
When the costs of borrowing at chainage 1000 m, acg is used as a balancing line
and borrow is required at g to close the loop cefgc.
Free haul volume in section ac = 1017 – 433 = 584 m3
Free haul volume in section cg = 2553 – 2007 = 546 m3
Hence,
Total free haul volume = 584 + 546 = 1130 m3
Overhaul volume in section as = 433 m3
Overhaul volume in section cg = 2007 m3
Hence,
Total overhaul volume = 433 + 2007 = 2440 m3
Borrow at g = 591 m3
Therefore,
Cost of borrowing at chainage 1000 m
= 1130 m3 + 2440 m3 + 591 m3
= 4161 m3
43
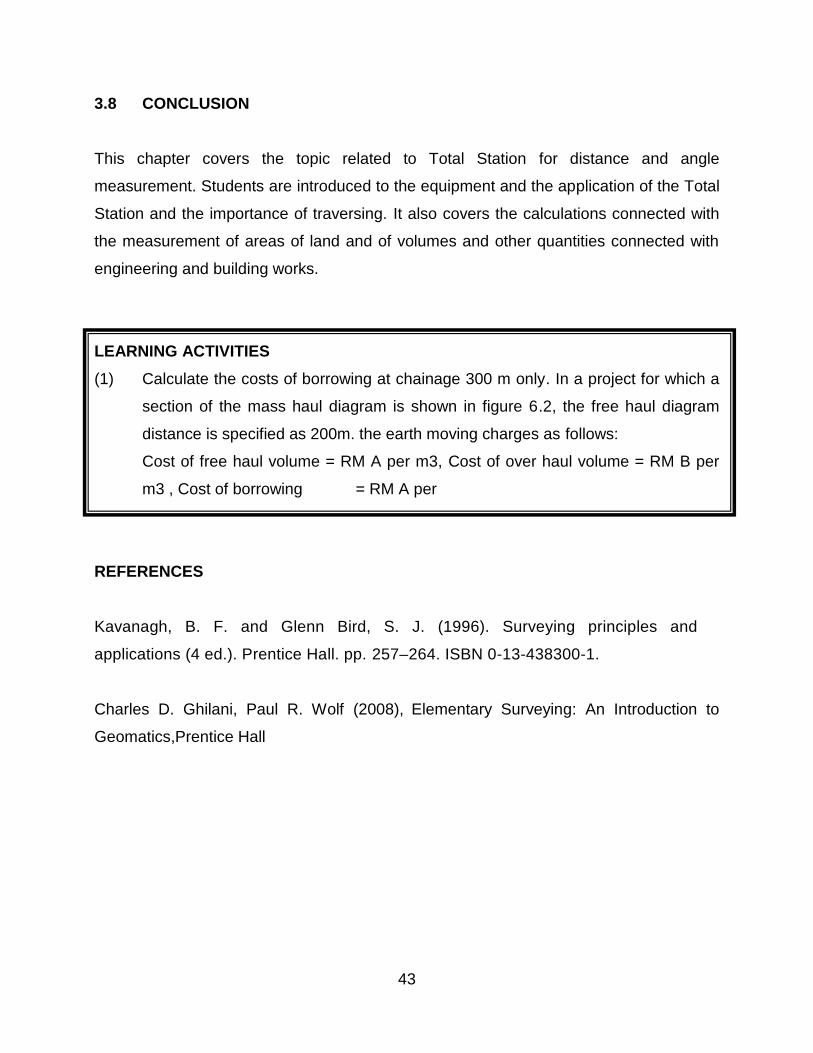
3.8 CONCLUSION
This chapter covers the topic related to Total Station for distance and angle
measurement. Students are introduced to the equipment and the application of the Total
Station and the importance of traversing. It also covers the calculations connected with
the measurement of areas of land and of volumes and other quantities connected with
engineering and building works.
LEARNING ACTIVITIES(1) Calculate the costs of borrowing at chainage 300 m only. In a project for which a
section of the mass haul diagram is shown in figure 6.2, the free haul diagram
distance is specified as 200m. the earth moving charges as follows:
Cost of free haul volume = RM A per m3, Cost of over haul volume = RM B per
m3 , Cost of borrowing = RM A per
REFERENCES
Kavanagh, B. F. and Glenn Bird, S. J. (1996). Surveying principles and
applications (4 ed.). Prentice Hall. pp. 257–264. ISBN 0-13-438300-1.
Charles D. Ghilani, Paul R. Wolf (2008), Elementary Surveying: An Introduction to
Geomatics,Prentice Hall
44
CHAPTER 4WAGE(PAYMENT) CALCULATION FOR SURVEY WORK
4.1 INTRODUCTION
This chapter introduces the wage or payment for survey work. Since land
surveying has many branches, there are bound to be salary variations within the
profession itself. Land surveyors are employed by different types of industries and
salaries are bound to change according to the type of employer. Although the
industries that employ the most land surveyors are architectural related and
engineering related firms
4.2 TYPE OF LAND PURPOSES
For the purpose of survey of land for building, it can be classified as follows:
1. land for residential purposes, e.g. dwelling houses, flats, apartments and
open space for recreation
2. land for commercial purposes, e.g. mixed development for commercial and
residential purposes, shop houses, cinemas, complexes, hotels, hostels,
petrol stations, offices and profit motivated developments.
3. Land for industrial purposes, e.g. mixed development for industries and
others, factories, plants, workshops, mills, printing presses, foundries,
LEARNING OUTCOME
At the end of the chapter, students will be able to:-
(1) Understand the scope of survey work(2) Justify the wage or payment for survey work
45
electrical substations, pump houses, sewerage treatment plants and
oxidation ponds.
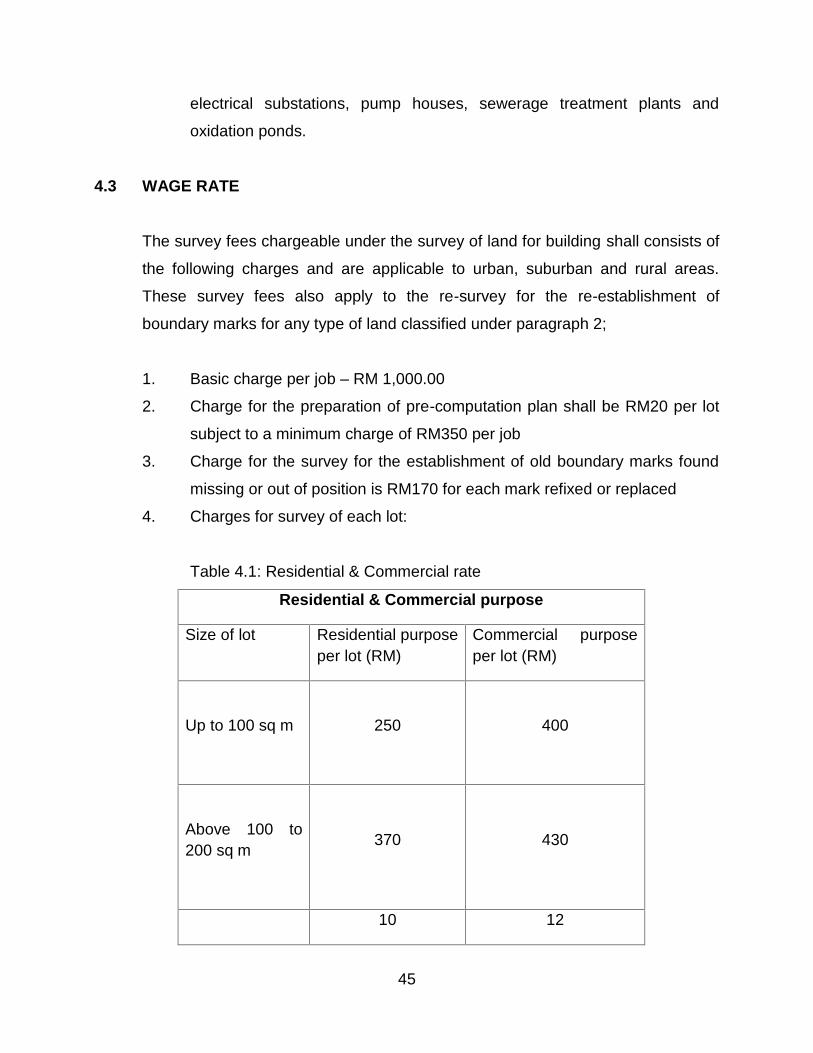
4.3 WAGE RATE
The survey fees chargeable under the survey of land for building shall consists of
the following charges and are applicable to urban, suburban and rural areas.
These survey fees also apply to the re-survey for the re-establishment of
boundary marks for any type of land classified under paragraph 2;
1. Basic charge per job – RM 1,000.00
2. Charge for the preparation of pre-computation plan shall be RM20 per lot
subject to a minimum charge of RM350 per job
3. Charge for the survey for the establishment of old boundary marks found
missing or out of position is RM170 for each mark refixed or replaced
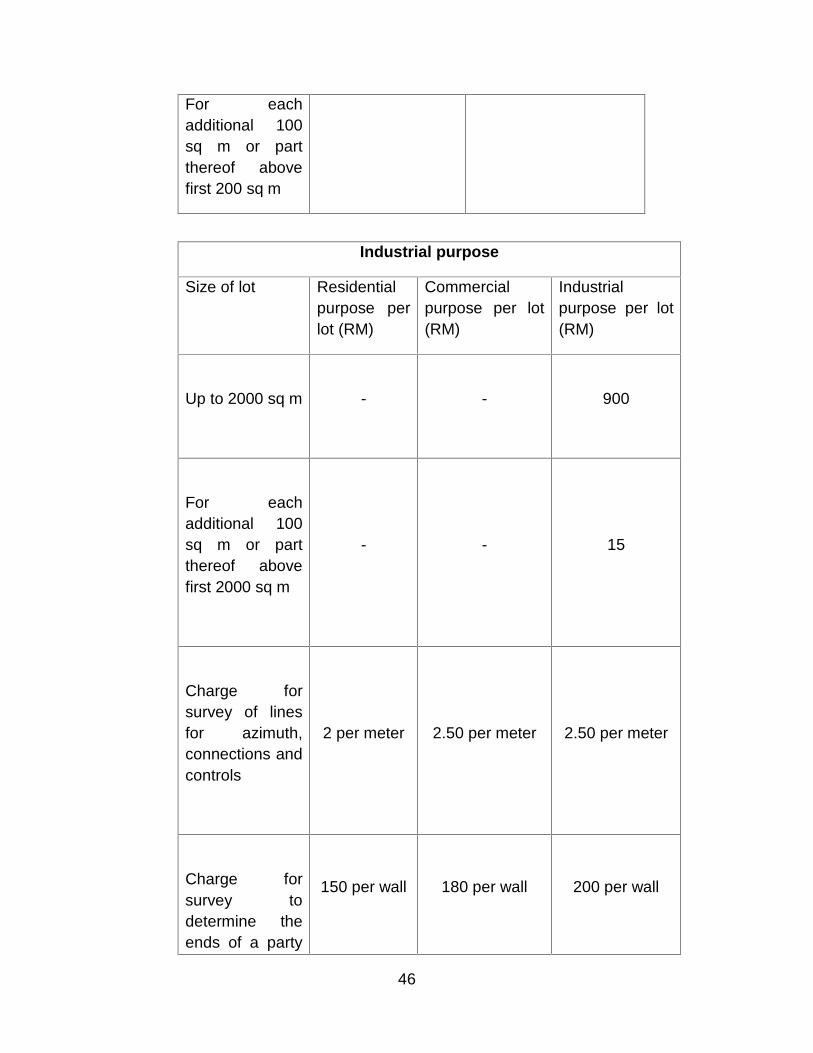
4. Charges for survey of each lot:
Table 4.1: Residential & Commercial rate
Residential & Commercial purpose
Size of lot Residential purposeper lot (RM)
Commercial purposeper lot (RM)
Up to 100 sq m 250 400
Above 100 to200 sq m 370 430
10 12
46
For eachadditional 100sq m or partthereof abovefirst 200 sq m
Industrial purpose
Size of lot Residentialpurpose perlot (RM)
Commercialpurpose per lot(RM)
Industrialpurpose per lot(RM)
Up to 2000 sq m - - 900
For eachadditional 100sq m or partthereof abovefirst 2000 sq m
- - 15
Charge forsurvey of linesfor azimuth,connections andcontrols
2 per meter 2.50 per meter 2.50 per meter
Charge forsurvey todetermine theends of a party
150 per wall 180 per wall 200 per wall
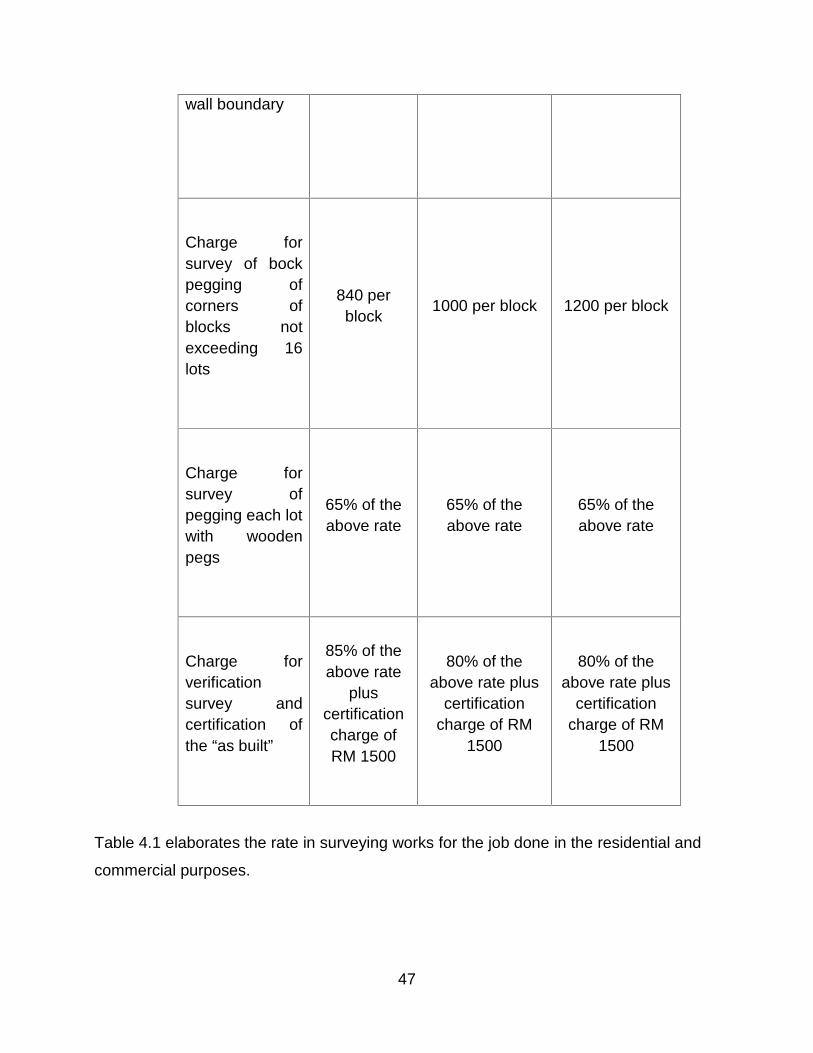
47
wall boundary
Charge forsurvey of bockpegging ofcorners ofblocks notexceeding 16lots
840 perblock 1000 per block 1200 per block
Charge forsurvey ofpegging each lotwith woodenpegs
65% of theabove rate
65% of theabove rate
65% of theabove rate
Charge forverificationsurvey andcertification ofthe “as built”
85% of theabove rate
pluscertificationcharge ofRM 1500
80% of theabove rate plus
certificationcharge of RM
1500
80% of theabove rate plus
certificationcharge of RM
1500
Table 4.1 elaborates the rate in surveying works for the job done in the residential and
commercial purposes.
48
4.4 CONCLUSIONLand surveying and all of its branches have been growing significantly with advances in
technology and consequently, employment and salaries have been increased. Land
surveying as a profession is predicted to grow mainly because of the radical advances
that are being made in technology. Surveying, therefore, is believed to develop into a
more lucrative profession than is presently is.
LEARNING ACTIVITIESDo a search on the wage or payment for land survey in Malaysia through the website.
Select at least 3 types and discuss it in relation to the construction industry.
REFERENCES
Jabatan Ukur dan Pemetaan Malaysia. http://www.jupem.gov.my/
Stephen V Estopinal, 2008, A Guide to Understanding Land Surveys,
Watson et el, 2008, Surveying and Engineering: Principles and Practice, Blackweel
Publishing.
49
CHAPTER 5COORDINATE SYSTEM
5.1 INTRODUCTION
Reference, or control, is a concept that applies to the positions of lines as well as
to their directions. In its simplest form, the position control is an identifiable or
understood point of origin for the lines of a survey. Conveniently, most coordinate
systems have the origin placed west and south of the area to be surveyed so that
all coordinates are positive and in the northeast quadrant.
In all these situations, the surveyor or engineer is concerned with relative
position, to varying degrees of accuracy and over areas of varying extent. In order
to define position to the high accuracies required in engineering survey or
construction survey, a suitable homogeneous coordinate system and reference
datum must be adopted.
5.2 SYSTEM OF GEOGRAPHICAL REFERENCES
It has already mentioned that surveying involves measuring the location of
physical land features relative to one another and relative to a defined reference
on the surface of the earth. In the broadest sense, the earth’s reference system is
composed of the surface divisions denoted by geographic lines of latitude and
LEARNING ACTIVITIES
At the end of the chapter, students will be able to:-
(1) Understand the coordinate system(2) Relate the system with survey work for construction
50
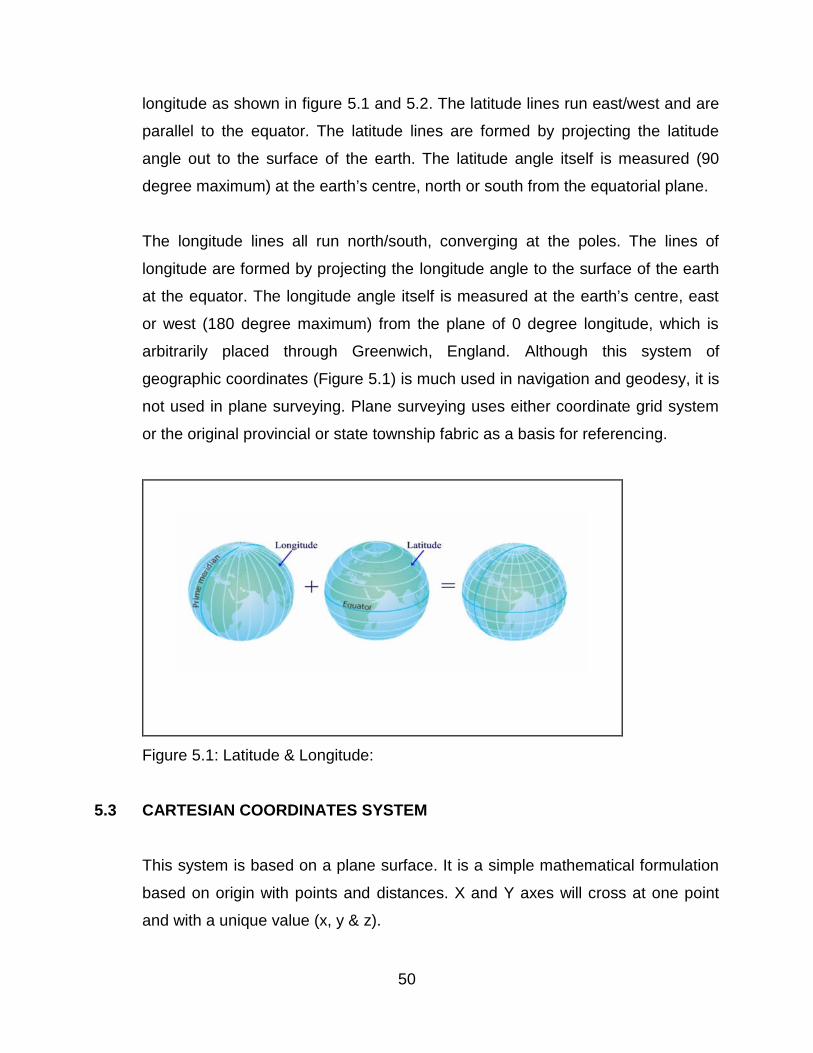
longitude as shown in figure 5.1 and 5.2. The latitude lines run east/west and are
parallel to the equator. The latitude lines are formed by projecting the latitude
angle out to the surface of the earth. The latitude angle itself is measured (90
degree maximum) at the earth’s centre, north or south from the equatorial plane.
The longitude lines all run north/south, converging at the poles. The lines of
longitude are formed by projecting the longitude angle to the surface of the earth
at the equator. The longitude angle itself is measured at the earth’s centre, east
or west (180 degree maximum) from the plane of 0 degree longitude, which is
arbitrarily placed through Greenwich, England. Although this system of
geographic coordinates (Figure 5.1) is much used in navigation and geodesy, it is
not used in plane surveying. Plane surveying uses either coordinate grid system
or the original provincial or state township fabric as a basis for referencing.
Figure 5.1: Latitude & Longitude:
5.3 CARTESIAN COORDINATES SYSTEM
This system is based on a plane surface. It is a simple mathematical formulation
based on origin with points and distances. X and Y axes will cross at one point
and with a unique value (x, y & z).
51
A different coordinate is needed when an area of survey increases. Therefore,
coordinate system is based on the accuracy as well the size of an area involve.
5.4 MALAYSIAN RECTIFIED SKEWED ORTHOMOPHIC (MRSO)
Malaysia is at 1o 15’ N to 6o 10’ N and longitude 99o 30’ E to 103o 45’ E.
Malaysia use MRSO as a map projection and calculated based on Triangulation
system of Malaysian Revised Triangulation (MRT). MRSO is suitable for
Topographic Mapping. It is in the Ellipsoidal Oblique Mercator, which is made by
Martin Hotine in 1947.
By sustaining the same design specification, which is with a small value of error
along the major circle, the MRSO is perfect to be used. It is also suitable to be
used for an area that is representing a peninsular such as New Zealand, Italy and
Peninsular Malaysia.
In Malaysia, the creation and production of official map is the responsibility of
Jabatan Ukur dan Pemetaan Malaysia (JUPEM). There are lots of small scale
map coveting the whole Malaysia and produced by JUPEM, for example
administration map and physical criteria.
There are 3 commom map projections used in Malaysia:
1. Geographical coordination system (Lat-Long)
2. Cassini Soldner
3. Malaysian Rectified Skew Orthomorphic (MRSO)
5.5 CONCLUSION
A map projection is a systematic transformation of points on a sphere, a
revolution ellipsoid or any other reference surface to points on a plane. Map
projections are necessary for creating maps and it is very important for land
52
survey as well as construction industry. Moreover, all map projections distort the
surface in some fashion. Depending on the purpose of the map, some distortions
are acceptable and others are not; therefore different map projections exist in
order to preserve some properties of the sphere-like body at the expense of other
properties. There is no limit to the number of possible map projections and the
important thing is to choose the right one.
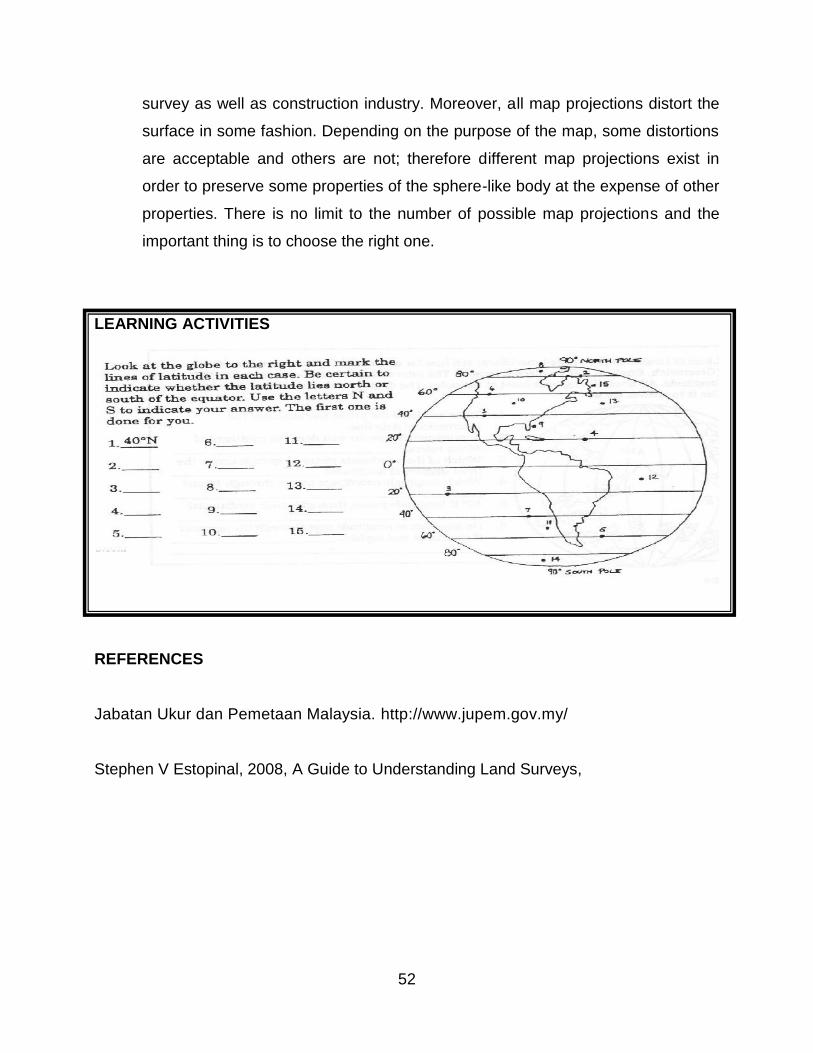
LEARNING ACTIVITIES
REFERENCES
Jabatan Ukur dan Pemetaan Malaysia. http://www.jupem.gov.my/
Stephen V Estopinal, 2008, A Guide to Understanding Land Surveys,
53
CHAPTER 6DISTANCE AND ANGLE MEASUREMENT
6.1 INTRODUCTION
Surveying is typically used to locate and measure property lines; to lay out
buildings, bridges, channels, highways, sewers, and pipelines for construction; to
locate stations for launching and tracking satellites; and to obtain topographic
information for mapping and charting.
Horizontal distances are usually assumed to be parallel to a common plane. Each
measurement has both length and direction. Length is expressed in feet or in
meters. Direction is expressed as a bearing of the azimuthal angle relationship to
a reference meridian, which is the north-south direction. It can be the true
meridian, a grid meridian, or some other assumed meridian. The degree-minute-
second system of angular expression is standard in the United States.
Vertical measurement adds the third dimension to an object's position. This
dimension is expressed as the distance above some reference surface, usually
mean sea level, called a datum. Mean sea level is determined by averaging high
and low tides during a lunar month.
LEARNING OUTCOME
At the end of the chapter, students will be able to:-
(1) Discuss the technique of the measurement(2) Relate to the survey work in construction industry(3) Develop proficiency in basic surveying calculations including area
determination, misclosure evaluation, traverse adjustment, coordinategeometry, and data reduction
54
Making measurements and the subsequent computations utilizing them are
fundamental tasks of surveyors. The process requires a combination of human
skill and mechanical equipment applied with the utmost judgment. Experience
and good physical conditions improve the human factor while superior equipment
enables good operators to do better work with more consistent results and in less
time. Measurements are never exact, however, and no matter how carefully
made, they will always contain errors.
Land Survey is concerned essentially with fixing the position of a point in two or
three dimensions. For example, in the production of a plan or map, one is
concerned in the first instance with the accurate location of the relative position of
survey points forming a framework, from which the position of topographic detail
is fixed. Such a framework of points is referred to as a control network.
The same network used to locate topographic detail may also be used o set out
points, defining the position, size and shape of the designed elements of the
construction project. Precise control networks are also used in the monitoring of
deformation movements on all types of structures.
6.2 TRAVERSING
A land survey method using an angle and a distance to calculate the position of a
new point by bearing and distance from a known point (a survey station). Each
newly calculated point becomes the known point from which the next is calculated
as the traverse is carried forward. The traverse must close onto an existing
station to guard against error. Traversing is faster than triangulation and quickly
replaced it for geodetic surveys, but later gave way to GPS. A survey traverse is
a sequence of lengths and directions of lines between points on the earth,
obtained by or from field measurements and used in determining positions of
the points. A survey traverse may determine the relative positions of the points
55
that it connects in series; and, if tied to control stations based on some
coordinate system, the positions may be referred to that system. From these
computed relative positions, additional data can be measured for layout of
new features, such as buildings and roads.
Traverse operations (actions commonly called TRAVERSING) are conducted
for basic area control; mapping; large construction projects, such as
military installation or air bases; road, railroad, and pipeline alignment;
control of hydrographic surveys; and for many other projects. In general, a
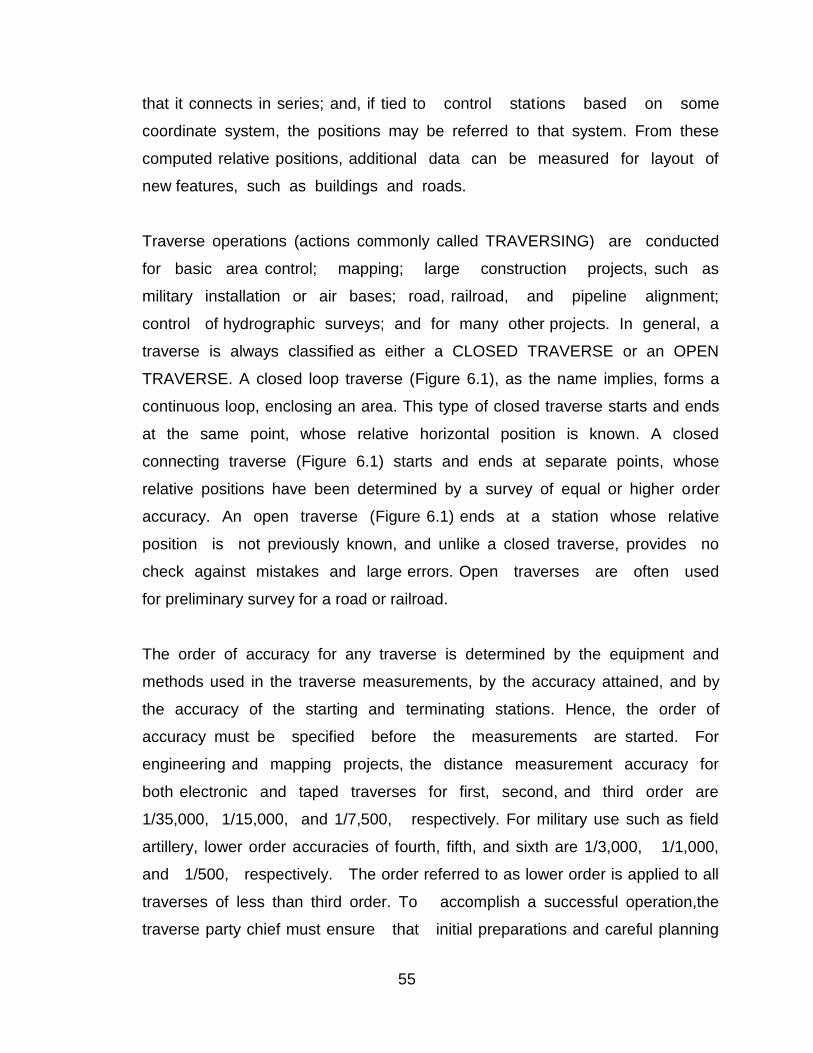
traverse is always classified as either a CLOSED TRAVERSE or an OPEN
TRAVERSE. A closed loop traverse (Figure 6.1), as the name implies, forms a
continuous loop, enclosing an area. This type of closed traverse starts and ends
at the same point, whose relative horizontal position is known. A closed
connecting traverse (Figure 6.1) starts and ends at separate points, whose
relative positions have been determined by a survey of equal or higher order
accuracy. An open traverse (Figure 6.1) ends at a station whose relative
position is not previously known, and unlike a closed traverse, provides no
check against mistakes and large errors. Open traverses are often used
for preliminary survey for a road or railroad.
The order of accuracy for any traverse is determined by the equipment and
methods used in the traverse measurements, by the accuracy attained, and by
the accuracy of the starting and terminating stations. Hence, the order of
accuracy must be specified before the measurements are started. For
engineering and mapping projects, the distance measurement accuracy for
both electronic and taped traverses for first, second, and third order are
1/35,000, 1/15,000, and 1/7,500, respectively. For military use such as field
artillery, lower order accuracies of fourth, fifth, and sixth are 1/3,000, 1/1,000,
and 1/500, respectively. The order referred to as lower order is applied to all
traverses of less than third order. To accomplish a successful operation,the
traverse party chief must ensure that initial preparations and careful planning
56
are done before the actual traversing begins. In the remainder of this chapter,
we will discuss some of the basic procedures normally undertaken by a
transit-tape traverse party.
Figure 6.1: Open and Close Traverse
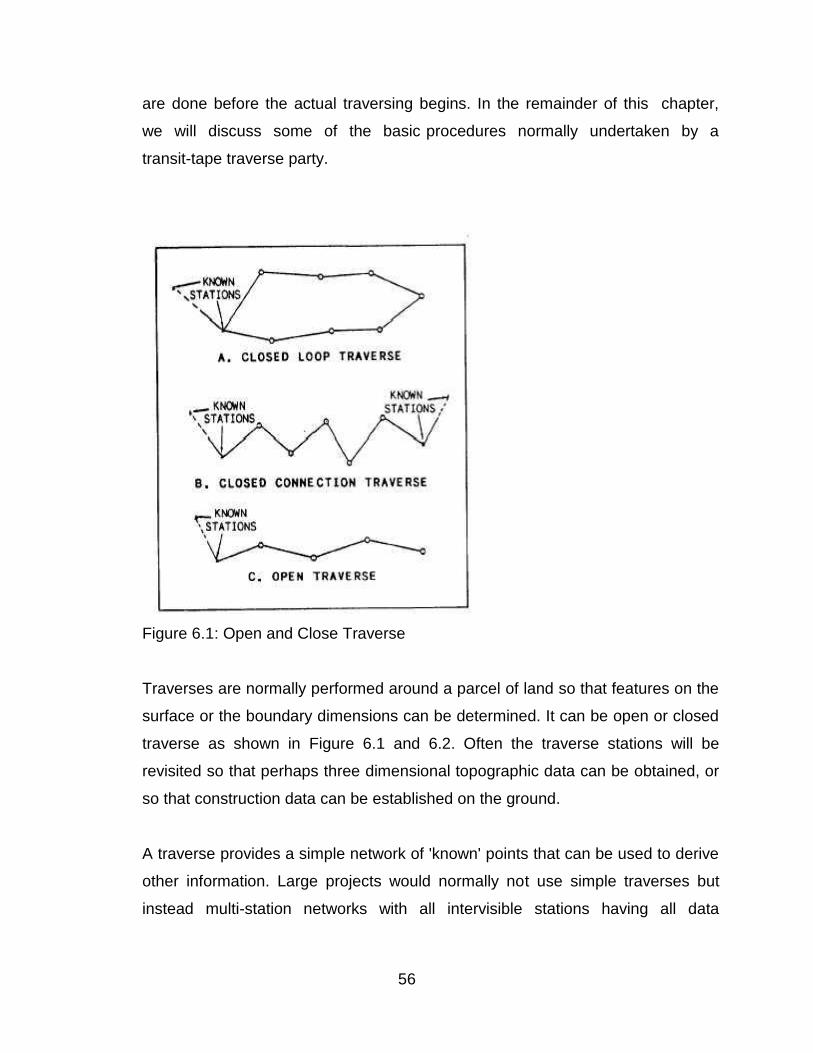
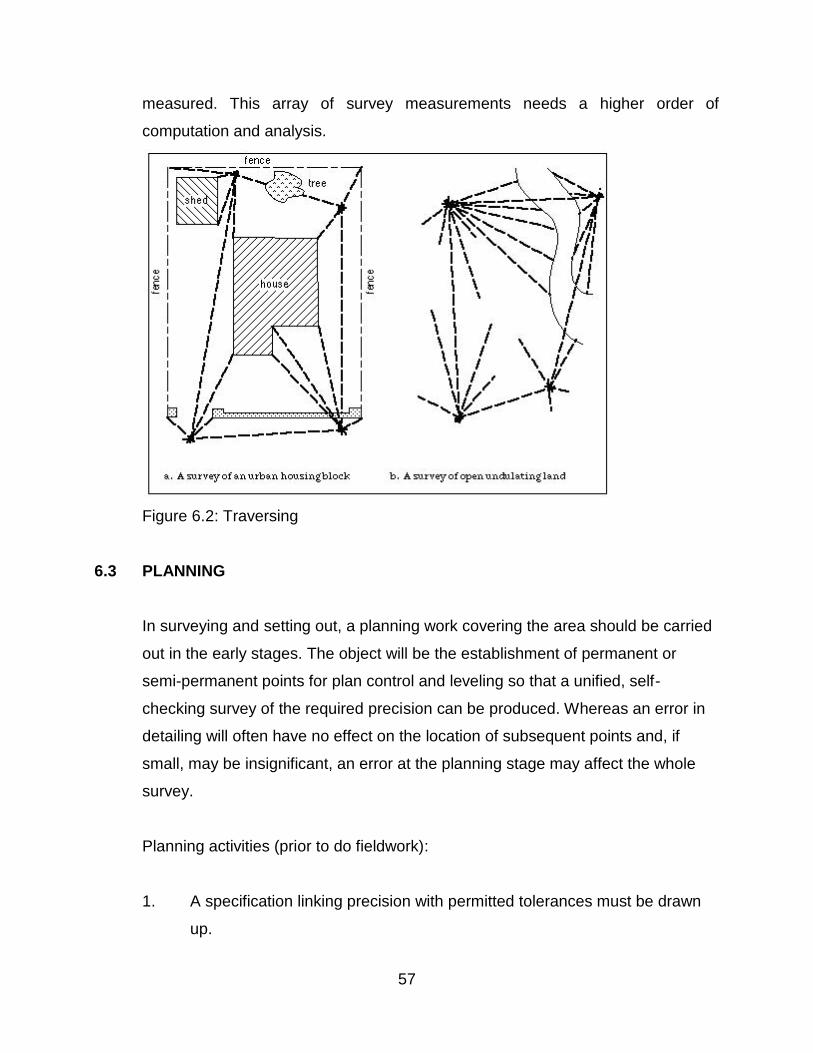
Traverses are normally performed around a parcel of land so that features on the
surface or the boundary dimensions can be determined. It can be open or closed
traverse as shown in Figure 6.1 and 6.2. Often the traverse stations will be
revisited so that perhaps three dimensional topographic data can be obtained, or
so that construction data can be established on the ground.
A traverse provides a simple network of 'known' points that can be used to derive
other information. Large projects would normally not use simple traverses but
instead multi-station networks with all intervisible stations having all data
57
measured. This array of survey measurements needs a higher order of
computation and analysis.
Figure 6.2: Traversing
6.3 PLANNING
In surveying and setting out, a planning work covering the area should be carried
out in the early stages. The object will be the establishment of permanent or
semi-permanent points for plan control and leveling so that a unified, self-
checking survey of the required precision can be produced. Whereas an error in
detailing will often have no effect on the location of subsequent points and, if
small, may be insignificant, an error at the planning stage may affect the whole
survey.
Planning activities (prior to do fieldwork):
1. A specification linking precision with permitted tolerances must be drawn
up.
58
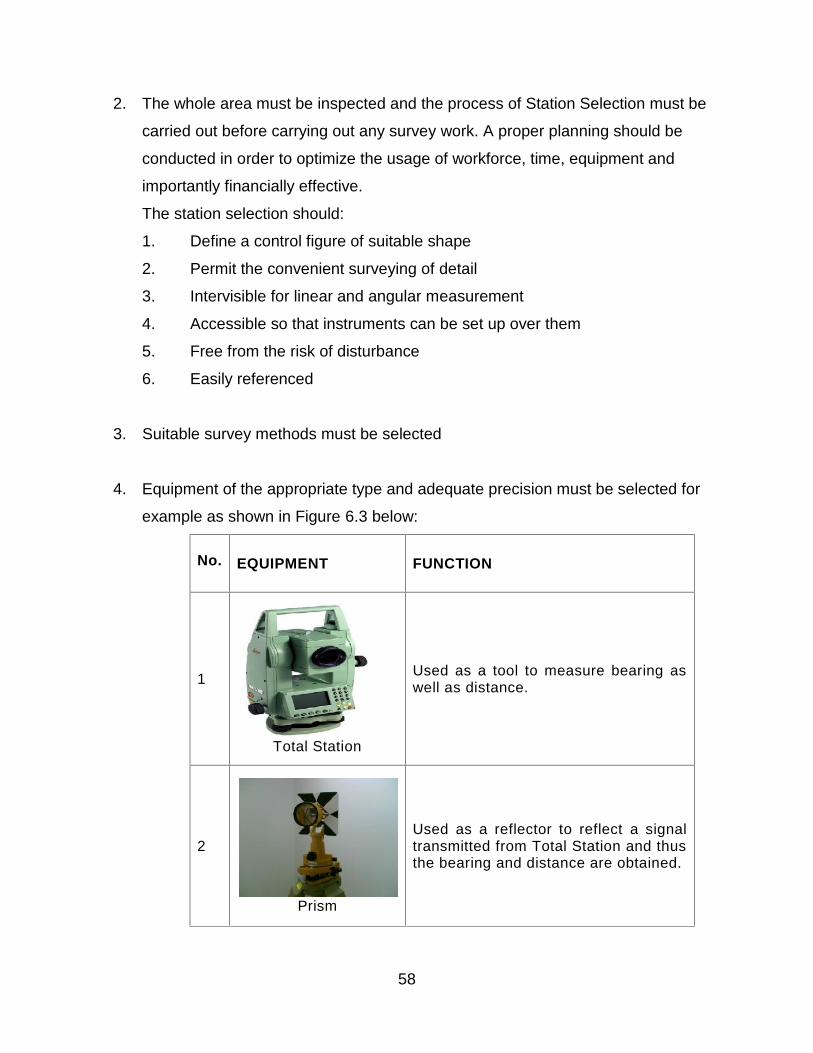
2. The whole area must be inspected and the process of Station Selection must be
carried out before carrying out any survey work. A proper planning should be
conducted in order to optimize the usage of workforce, time, equipment and
importantly financially effective.
The station selection should:
1. Define a control figure of suitable shape
2. Permit the convenient surveying of detail
3. Intervisible for linear and angular measurement
4. Accessible so that instruments can be set up over them
5. Free from the risk of disturbance
6. Easily referenced
3. Suitable survey methods must be selected
4. Equipment of the appropriate type and adequate precision must be selected for
example as shown in Figure 6.3 below:
No. EQUIPMENT FUNCTION
1
Total Station
Used as a tool to measure bearing aswell as distance.
2
Prism
Used as a reflector to reflect a signaltransmitted from Total Station and thusthe bearing and distance are obtained.
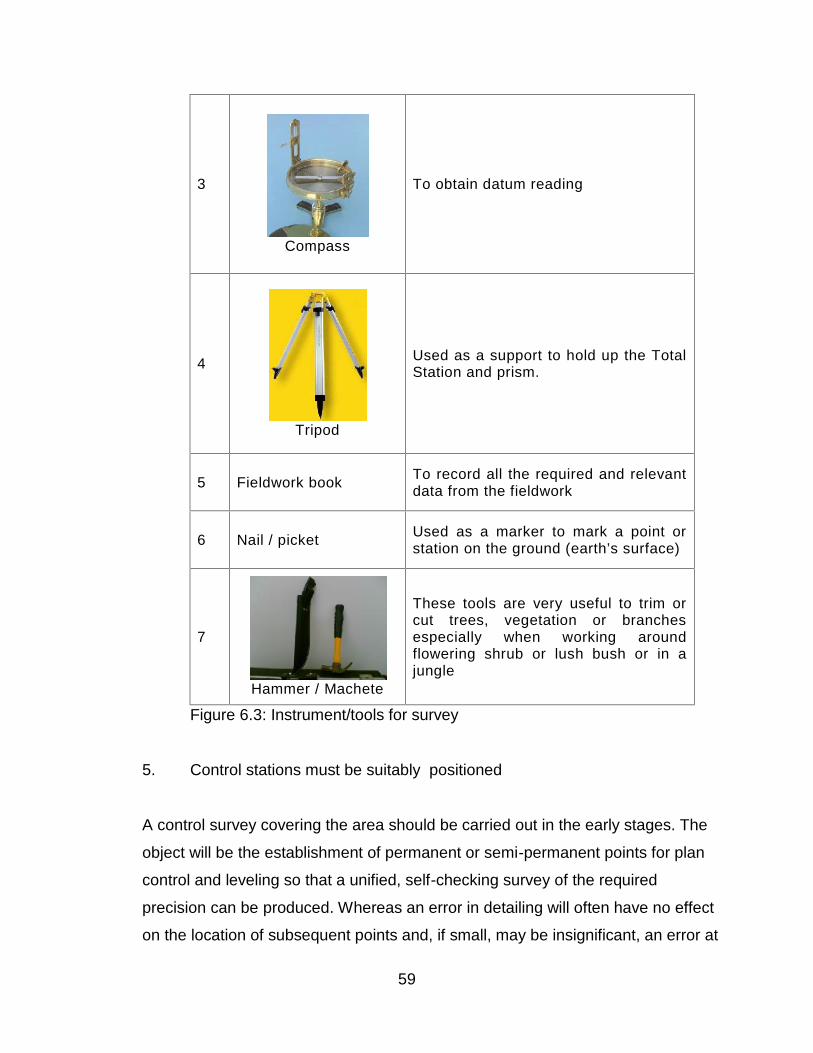
59
3
Compass
To obtain datum reading
4
Tripod
Used as a support to hold up the TotalStation and prism.
5 Fieldwork book To record all the required and relevantdata from the fieldwork
6 Nail / picket Used as a marker to mark a point orstation on the ground (earth’s surface)
7
Hammer / Machete
These tools are very useful to trim orcut trees, vegetation or branchesespecially when working aroundflowering shrub or lush bush or in ajungle
Figure 6.3: Instrument/tools for survey
5. Control stations must be suitably positioned
A control survey covering the area should be carried out in the early stages. The
object will be the establishment of permanent or semi-permanent points for plan
control and leveling so that a unified, self-checking survey of the required
precision can be produced. Whereas an error in detailing will often have no effect
on the location of subsequent points and, if small, may be insignificant, an error at

60
the control stage may affect the whole survey. Most control surveys must be tied
in to existing fixed points.
The existing fixed points that are tied to the control must be from the higher class
from the control survey. That means, first class survey and it is a survey done by
the geodetic survey. Such procedures are in no way designed to compensate for
poor precision in the field.
Traditionally, control surveys have been carried out using linear, angular and
leveling measurements which connect the stations. Control surveys should
incorporate checks (for closure) at several stages. Large discrepancies indicate
that the work (in part or whole) must be repeated. Small discrepancies (after the
correction of systematic errors) within the specified tolerances may be left out, or,
more commonly, may be removed by the adjustment of observations to produce
mathematical consistency.
6. The survey must be self-checking so that its validity can be assessed
7. Acceptably small errors of closure can be neglected or eliminated by
adjustment, as appropriate (large errors will require some or all of the work
to be repeated)
8. For complex projects, an error analysis will indicate whether the specified
precision has been achieved
9. Periodical checks must be made when the stations are in use over a long
time
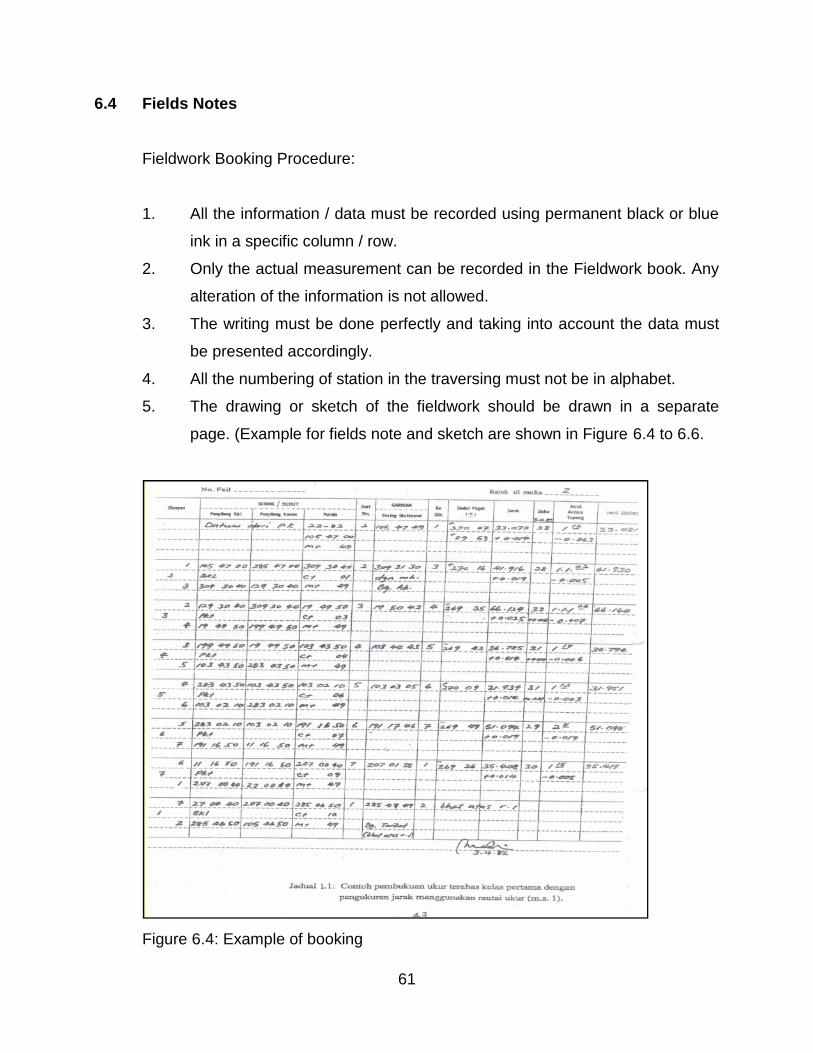
61
6.4 Fields Notes
Fieldwork Booking Procedure:
1. All the information / data must be recorded using permanent black or blue
ink in a specific column / row.
2. Only the actual measurement can be recorded in the Fieldwork book. Any
alteration of the information is not allowed.
3. The writing must be done perfectly and taking into account the data must
be presented accordingly.
4. All the numbering of station in the traversing must not be in alphabet.
5. The drawing or sketch of the fieldwork should be drawn in a separate
page. (Example for fields note and sketch are shown in Figure 6.4 to 6.6.
Figure 6.4: Example of booking
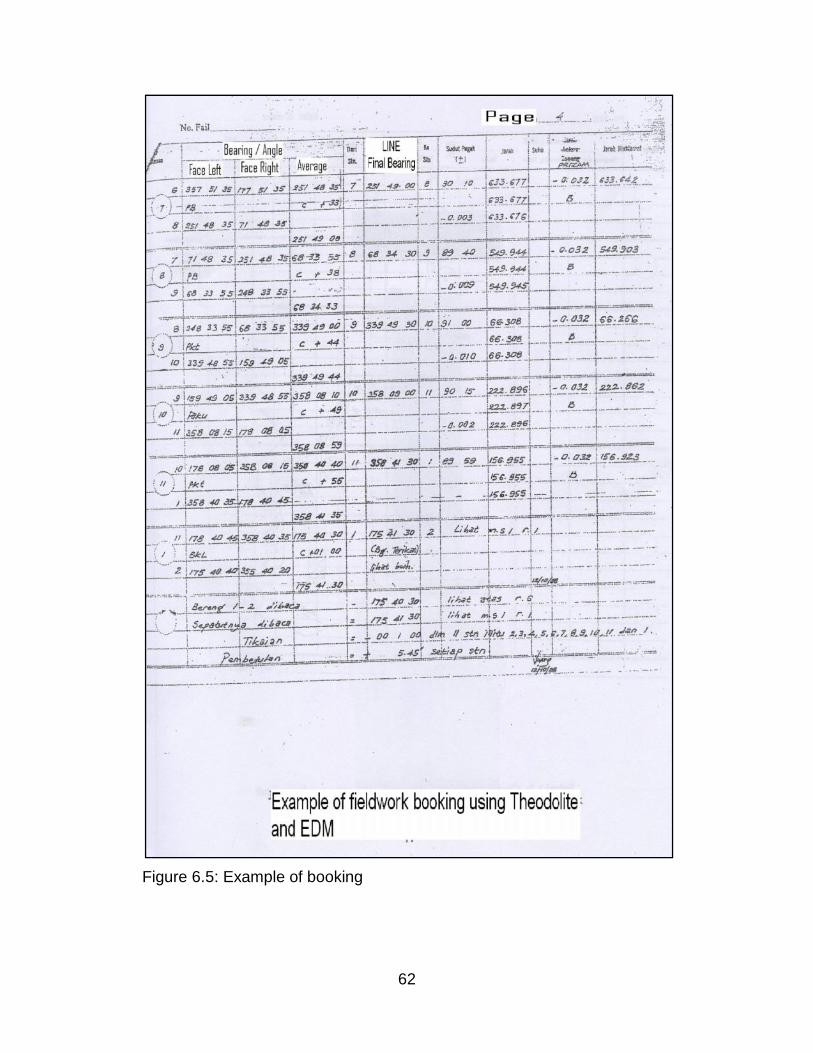
62
Figure 6.5: Example of booking
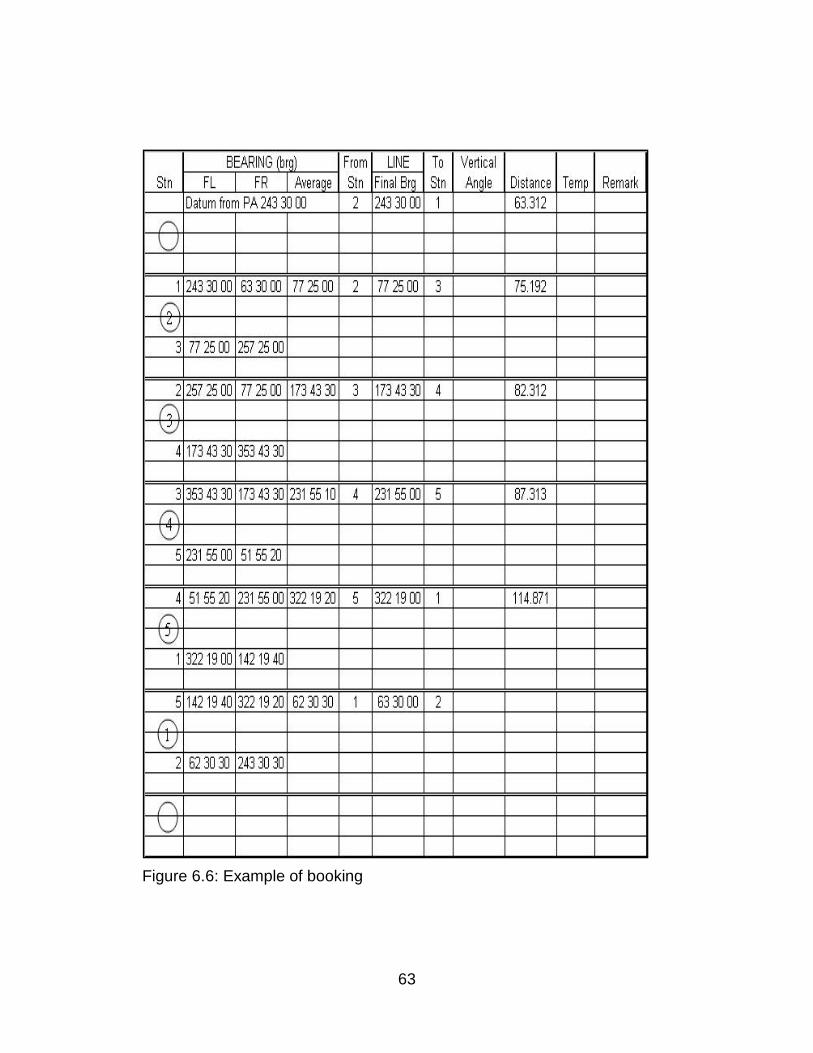
63
Figure 6.6: Example of booking
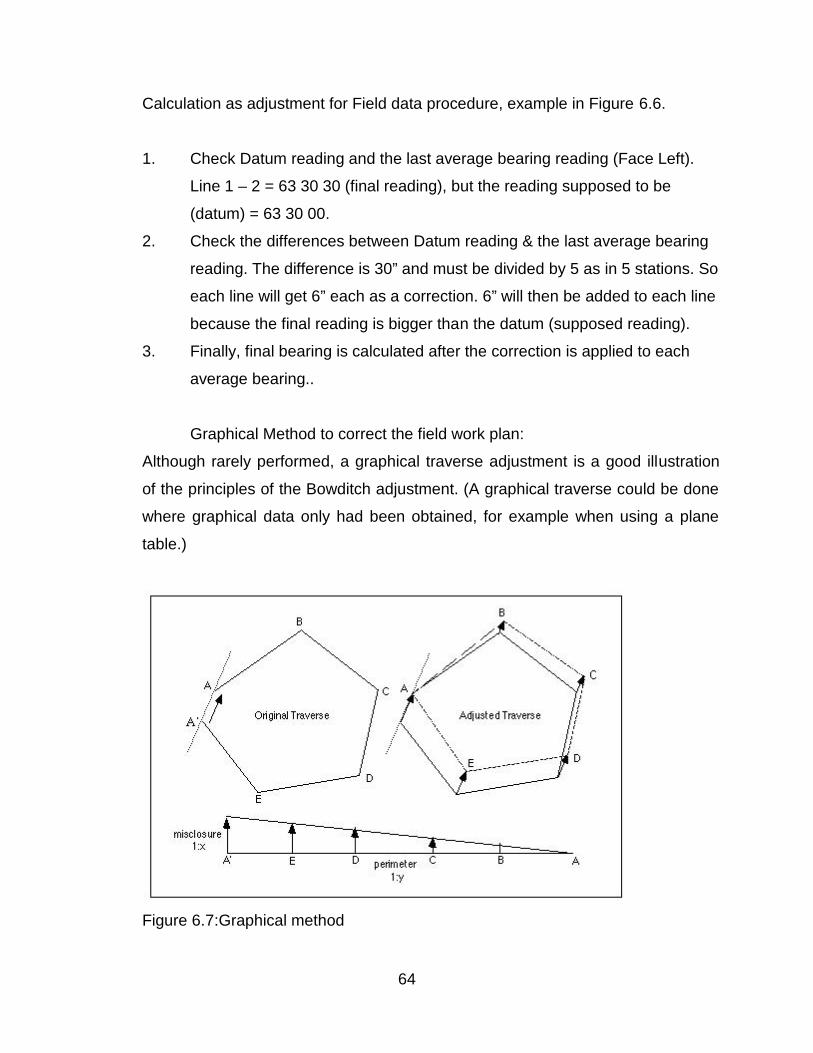
64
Calculation as adjustment for Field data procedure, example in Figure 6.6.
1. Check Datum reading and the last average bearing reading (Face Left).
Line 1 – 2 = 63 30 30 (final reading), but the reading supposed to be
(datum) = 63 30 00.
2. Check the differences between Datum reading & the last average bearing
reading. The difference is 30” and must be divided by 5 as in 5 stations. So
each line will get 6” each as a correction. 6” will then be added to each line
because the final reading is bigger than the datum (supposed reading).
3. Finally, final bearing is calculated after the correction is applied to each
average bearing..
Graphical Method to correct the field work plan:
Although rarely performed, a graphical traverse adjustment is a good illustration
of the principles of the Bowditch adjustment. (A graphical traverse could be done
where graphical data only had been obtained, for example when using a plane
table.)
Figure 6.7:Graphical method
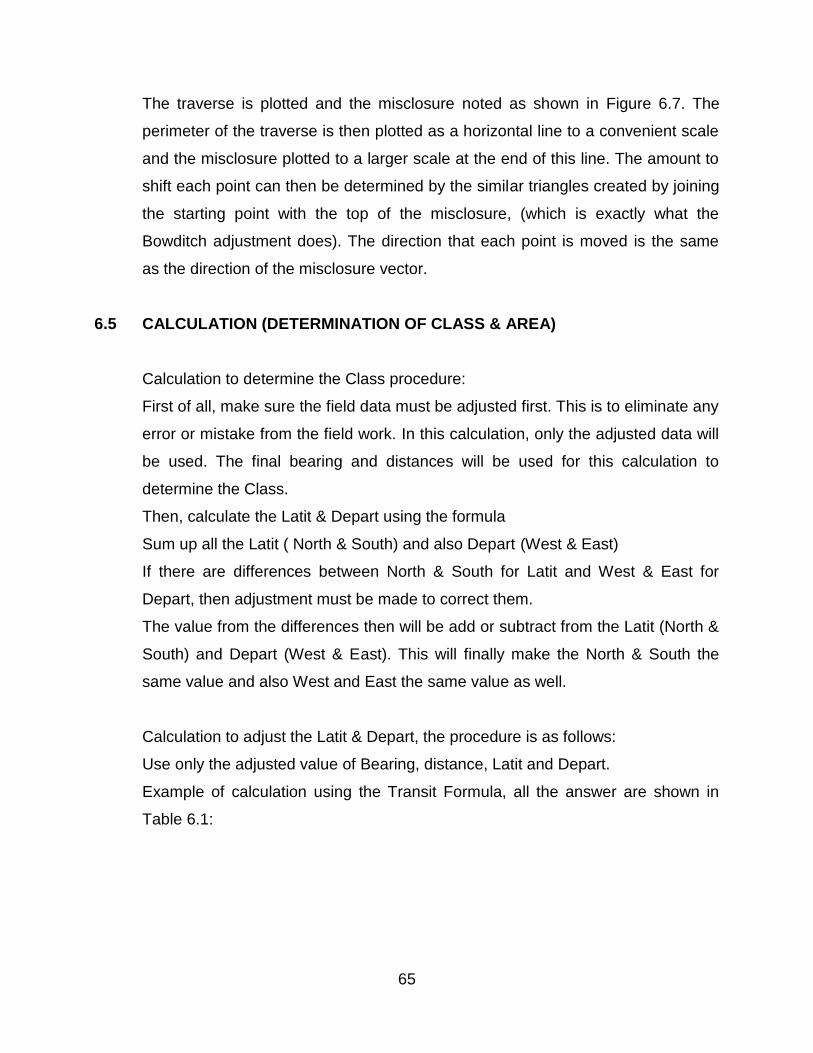
65
The traverse is plotted and the misclosure noted as shown in Figure 6.7. The
perimeter of the traverse is then plotted as a horizontal line to a convenient scale
and the misclosure plotted to a larger scale at the end of this line. The amount to
shift each point can then be determined by the similar triangles created by joining
the starting point with the top of the misclosure, (which is exactly what the
Bowditch adjustment does). The direction that each point is moved is the same
as the direction of the misclosure vector.
6.5 CALCULATION (DETERMINATION OF CLASS & AREA)
Calculation to determine the Class procedure:
First of all, make sure the field data must be adjusted first. This is to eliminate any
error or mistake from the field work. In this calculation, only the adjusted data will
be used. The final bearing and distances will be used for this calculation to
determine the Class.
Then, calculate the Latit & Depart using the formula
Sum up all the Latit ( North & South) and also Depart (West & East)
If there are differences between North & South for Latit and West & East for
Depart, then adjustment must be made to correct them.
The value from the differences then will be add or subtract from the Latit (North &
South) and Depart (West & East). This will finally make the North & South the
same value and also West and East the same value as well.
Calculation to adjust the Latit & Depart, the procedure is as follows:
Use only the adjusted value of Bearing, distance, Latit and Depart.
Example of calculation using the Transit Formula, all the answer are shown in
Table 6.1:
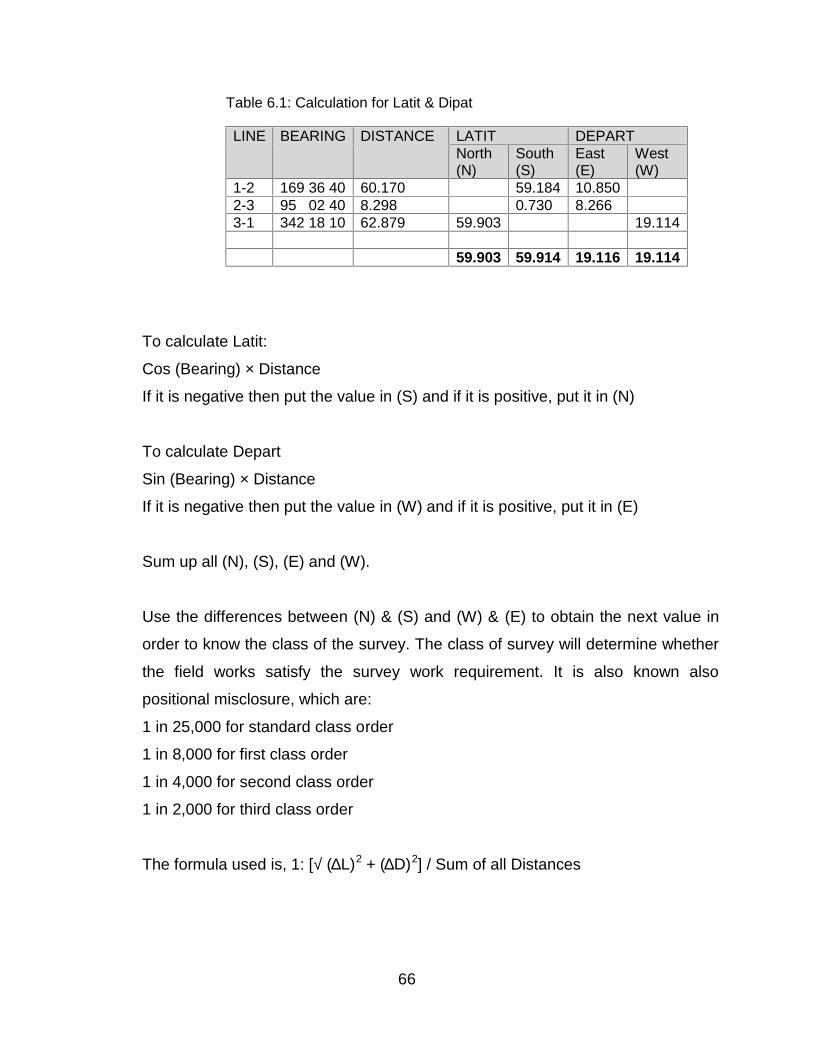
66
Table 6.1: Calculation for Latit & Dipat
LINE BEARING DISTANCE LATIT DEPARTNorth(N)
South(S)
East(E)
West(W)
1-2 169 36 40 60.170 59.184 10.8502-3 95 02 40 8.298 0.730 8.2663-1 342 18 10 62.879 59.903 19.114
59.903 59.914 19.116 19.114
To calculate Latit:
Cos (Bearing) × Distance
If it is negative then put the value in (S) and if it is positive, put it in (N)
To calculate Depart
Sin (Bearing) × Distance
If it is negative then put the value in (W) and if it is positive, put it in (E)
Sum up all (N), (S), (E) and (W).
Use the differences between (N) & (S) and (W) & (E) to obtain the next value in
order to know the class of the survey. The class of survey will determine whether
the field works satisfy the survey work requirement. It is also known also
positional misclosure, which are:
1 in 25,000 for standard class order
1 in 8,000 for first class order
1 in 4,000 for second class order
1 in 2,000 for third class order
The formula used is, 1: [√ (∆L)2 + (∆D)2] / Sum of all Distances
67
If there are differences, then do the adjustment for Latit and Depart using the
formula as follows:
Adjustment for Latit:
For line 1-2 = line × (sum all (N) – sum all (S))
sum all (N) + sum all (S)
Adjustment for Depart:
For line 1-2 = line × (sum all (E) – sum all (W))
sum all (E) + sum all (E)
Repeat the process for other line.
Use the value of the adjustment above to get a new calculated Latit (N ) & (S)
and Depart (W) & (E), for example:
The value of adjustment must be applied to Latit (N) & (S) and Depart (W) & (E)
accordingly depending on the value of sum of all (N) to sum of all (S) as well as
sum of all (W) to sum of all (E). The value of adjustment must be able to correct
the differences between (N) & (S) and (W) & (E).
Then, we get new calculated Latit & Depart as follows in Table 6.2:
Table 6.2: New calculated Latit & Dipat
LINE BEARING DISTANCE LATIT DEPARTNorth(N)
South(S)
East(E)
West(W)
1-2 169 36 40 60.170 59.179 10.8492-3 95 02 40 8.298 0.730 8.2663-1 342 18 10 62.879 59.909 19.115
59.909 59.909 19.115 19.115
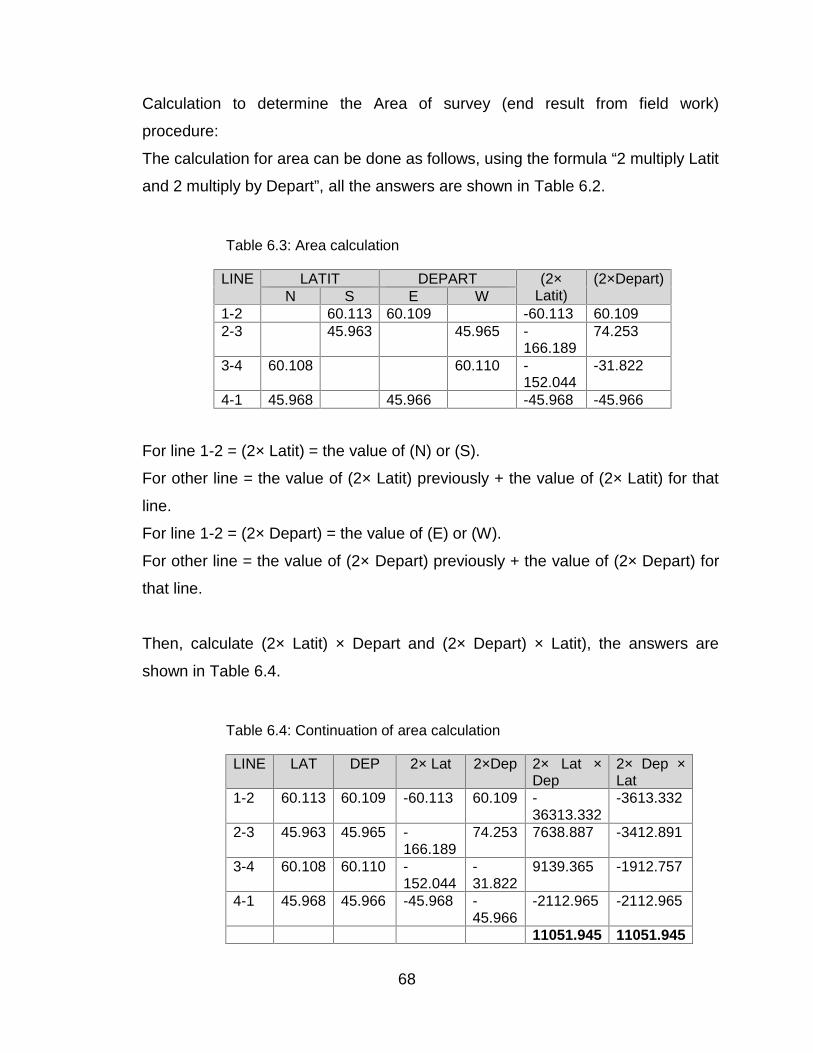
68
Calculation to determine the Area of survey (end result from field work)
procedure:
The calculation for area can be done as follows, using the formula “2 multiply Latit
and 2 multiply by Depart”, all the answers are shown in Table 6.2.
Table 6.3: Area calculation
LINE LATIT DEPART (2×Latit)
(2×Depart)N S E W
1-2 60.113 60.109 -60.113 60.1092-3 45.963 45.965 -
166.18974.253
3-4 60.108 60.110 -152.044
-31.822
4-1 45.968 45.966 -45.968 -45.966
For line 1-2 = (2× Latit) = the value of (N) or (S).
For other line = the value of (2× Latit) previously + the value of (2× Latit) for that
line.
For line 1-2 = (2× Depart) = the value of (E) or (W).
For other line = the value of (2× Depart) previously + the value of (2× Depart) for
that line.
Then, calculate (2× Latit) × Depart and (2× Depart) × Latit), the answers are
shown in Table 6.4.
Table 6.4: Continuation of area calculation
LINE LAT DEP 2× Lat 2×Dep 2× Lat ×Dep
2× Dep ×Lat
1-2 60.113 60.109 -60.113 60.109 -36313.332
-3613.332
2-3 45.963 45.965 -166.189
74.253 7638.887 -3412.891
3-4 60.108 60.110 -152.044
-31.822
9139.365 -1912.757
4-1 45.968 45.966 -45.968 -45.966
-2112.965 -2112.965
11051.945 11051.945
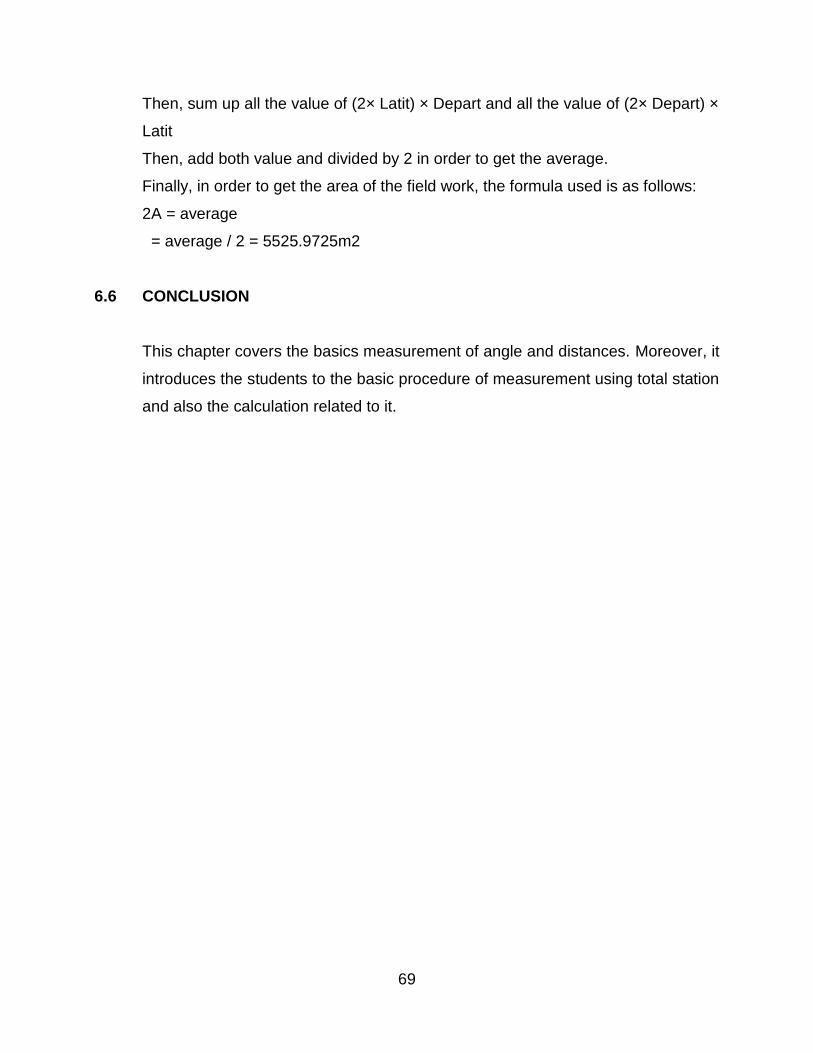
69
Then, sum up all the value of (2× Latit) × Depart and all the value of (2× Depart) ×
Latit
Then, add both value and divided by 2 in order to get the average.
Finally, in order to get the area of the field work, the formula used is as follows:
2A = average
= average / 2 = 5525.9725m2
6.6 CONCLUSION
This chapter covers the basics measurement of angle and distances. Moreover, it
introduces the students to the basic procedure of measurement using total station
and also the calculation related to it.
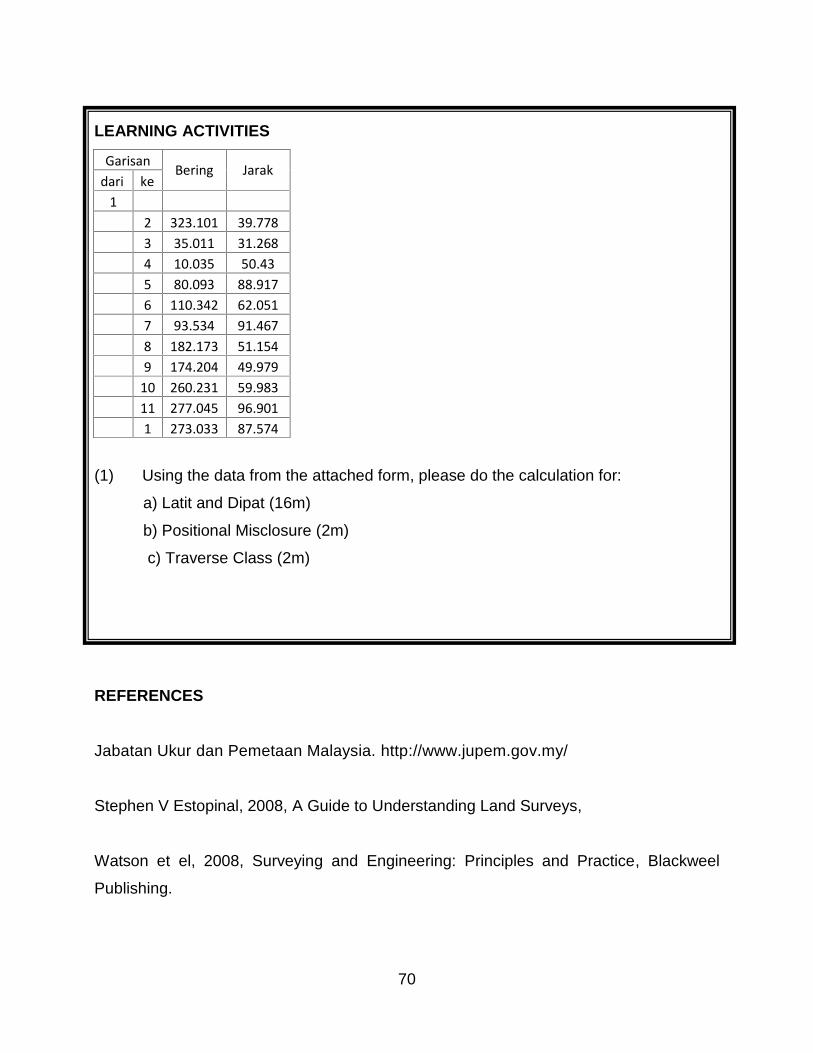
70
LEARNING ACTIVITIES
Garisan Bering Jarakdari ke
12 323.101 39.7783 35.011 31.2684 10.035 50.435 80.093 88.9176 110.342 62.0517 93.534 91.4678 182.173 51.1549 174.204 49.979
10 260.231 59.98311 277.045 96.9011 273.033 87.574
(1) Using the data from the attached form, please do the calculation for:
a) Latit and Dipat (16m)
b) Positional Misclosure (2m)
c) Traverse Class (2m)
REFERENCES
Jabatan Ukur dan Pemetaan Malaysia. http://www.jupem.gov.my/
Stephen V Estopinal, 2008, A Guide to Understanding Land Surveys,
Watson et el, 2008, Surveying and Engineering: Principles and Practice, Blackweel
Publishing.
71
CHAPTER 7HEIGHT MEASUREMENT (LEVELLING)
7.1 INTRODUCTION
Leveling is the procedure used to determine differences in elevation between
points that are remote from each other. An elevation is a vertical distance above
or below a reference datum. In surveying, the reference datum that is universally
employed is that of mean sea level.
In practice, it is possible to measure heights to better than a few millimeters when
leveling and this precision is more than adequate for height measurement on the
majority of civil engineering projects. Specialized equipment is required to
undertake leveling and traditionally this has been an optical level with its tripod
and staff.
7.2 LEVELLING INSTRUMENT
In practice, it is possible to measure heights to better than a few millimeters when
leveling and this precision is more than adequate for height measurement on the
majority of civil engineering projects. Specialized equipment is required to
LEARNING OUTCOME
At the end of the chapter, students will be able to:-
(1) Discuss the measurement with regards to levelling(2) Relate to the construction industry(3) Demonstrate the skill needed for survey(4) Calculate and determine the works in accordance to construction industry
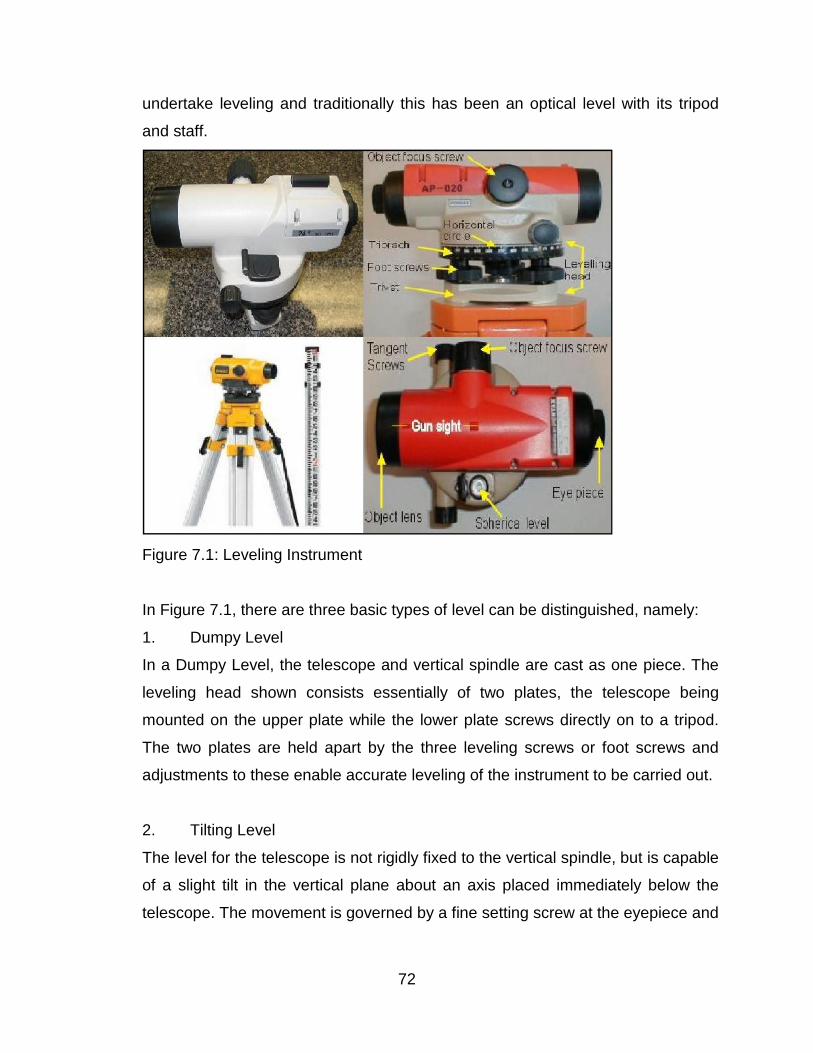
72
undertake leveling and traditionally this has been an optical level with its tripod
and staff.
Figure 7.1: Leveling Instrument
In Figure 7.1, there are three basic types of level can be distinguished, namely:
1. Dumpy Level
In a Dumpy Level, the telescope and vertical spindle are cast as one piece. The
leveling head shown consists essentially of two plates, the telescope being
mounted on the upper plate while the lower plate screws directly on to a tripod.
The two plates are held apart by the three leveling screws or foot screws and
adjustments to these enable accurate leveling of the instrument to be carried out.
2. Tilting Level
The level for the telescope is not rigidly fixed to the vertical spindle, but is capable
of a slight tilt in the vertical plane about an axis placed immediately below the
telescope. The movement is governed by a fine setting screw at the eyepiece and
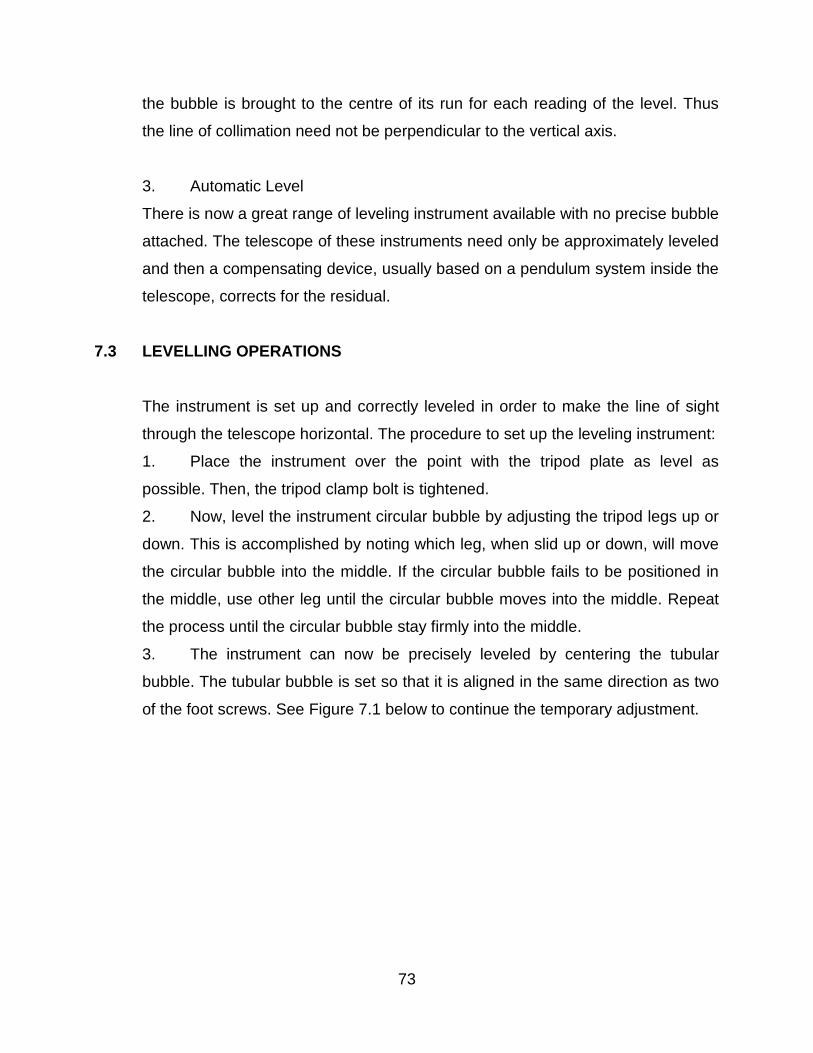
73
the bubble is brought to the centre of its run for each reading of the level. Thus
the line of collimation need not be perpendicular to the vertical axis.
3. Automatic Level
There is now a great range of leveling instrument available with no precise bubble
attached. The telescope of these instruments need only be approximately leveled
and then a compensating device, usually based on a pendulum system inside the
telescope, corrects for the residual.
7.3 LEVELLING OPERATIONS
The instrument is set up and correctly leveled in order to make the line of sight
through the telescope horizontal. The procedure to set up the leveling instrument:
1. Place the instrument over the point with the tripod plate as level as
possible. Then, the tripod clamp bolt is tightened.
2. Now, level the instrument circular bubble by adjusting the tripod legs up or
down. This is accomplished by noting which leg, when slid up or down, will move
the circular bubble into the middle. If the circular bubble fails to be positioned in
the middle, use other leg until the circular bubble moves into the middle. Repeat
the process until the circular bubble stay firmly into the middle.
3. The instrument can now be precisely leveled by centering the tubular
bubble. The tubular bubble is set so that it is aligned in the same direction as two
of the foot screws. See Figure 7.1 below to continue the temporary adjustment.
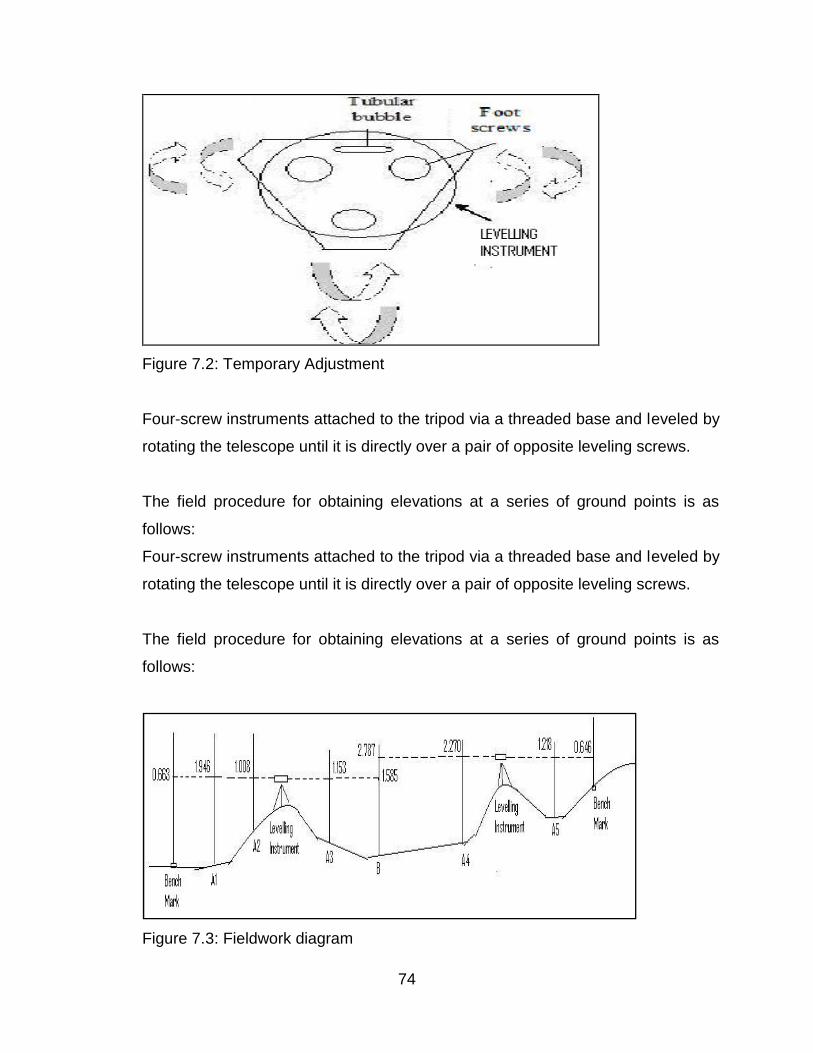
74
Figure 7.2: Temporary Adjustment
Four-screw instruments attached to the tripod via a threaded base and leveled by
rotating the telescope until it is directly over a pair of opposite leveling screws.
The field procedure for obtaining elevations at a series of ground points is as
follows:
Four-screw instruments attached to the tripod via a threaded base and leveled by
rotating the telescope until it is directly over a pair of opposite leveling screws.
The field procedure for obtaining elevations at a series of ground points is as
follows:
Figure 7.3: Fieldwork diagram
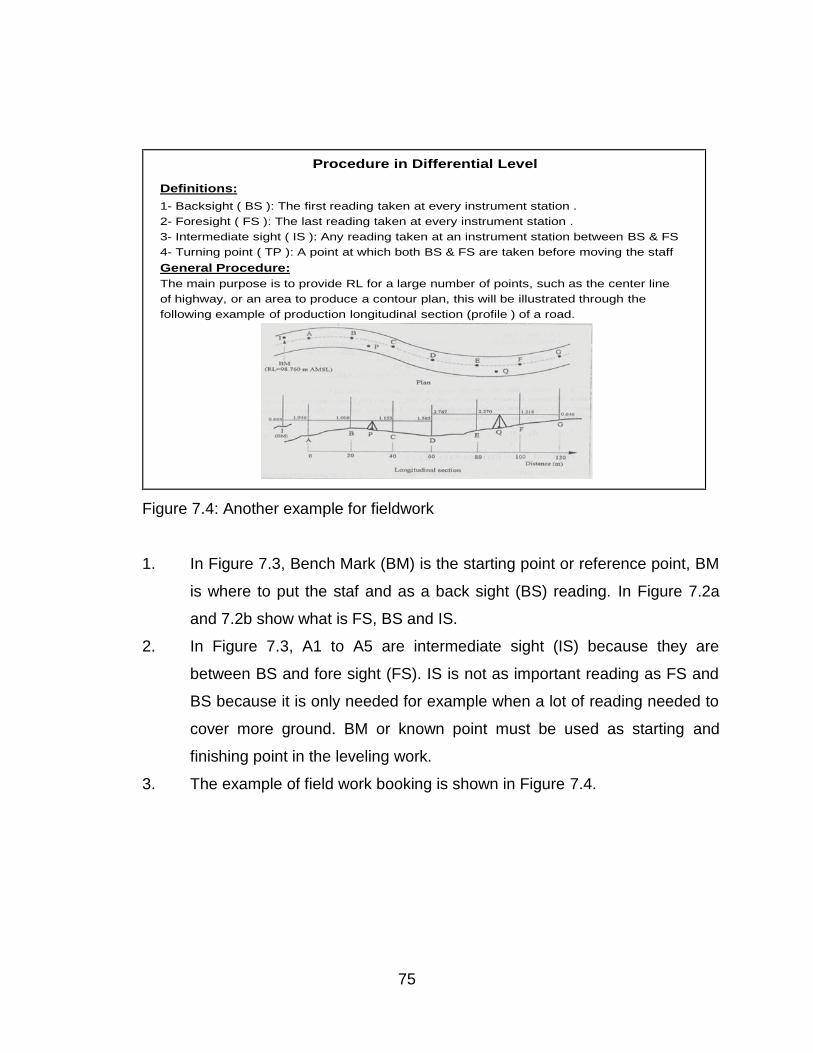
75
Procedure in Differential Level
Definitions:1- Backsight ( BS ): The first reading taken at every instrument station .2- Foresight ( FS ): The last reading taken at every instrument station .3- Intermediate sight ( IS ): Any reading taken at an instrument station between BS & FS4- Turning point ( TP ): A point at which both BS & FS are taken before moving the staffGeneral Procedure:The main purpose is to provide RL for a large number of points, such as the center lineof highway, or an area to produce a contour plan, this will be illustrated through thefollowing example of production longitudinal section (profile ) of a road.
Figure 7.4: Another example for fieldwork
1. In Figure 7.3, Bench Mark (BM) is the starting point or reference point, BM
is where to put the staf and as a back sight (BS) reading. In Figure 7.2a
and 7.2b show what is FS, BS and IS.
2. In Figure 7.3, A1 to A5 are intermediate sight (IS) because they are
between BS and fore sight (FS). IS is not as important reading as FS and
BS because it is only needed for example when a lot of reading needed to
cover more ground. BM or known point must be used as starting and
finishing point in the leveling work.
3. The example of field work booking is shown in Figure 7.4.
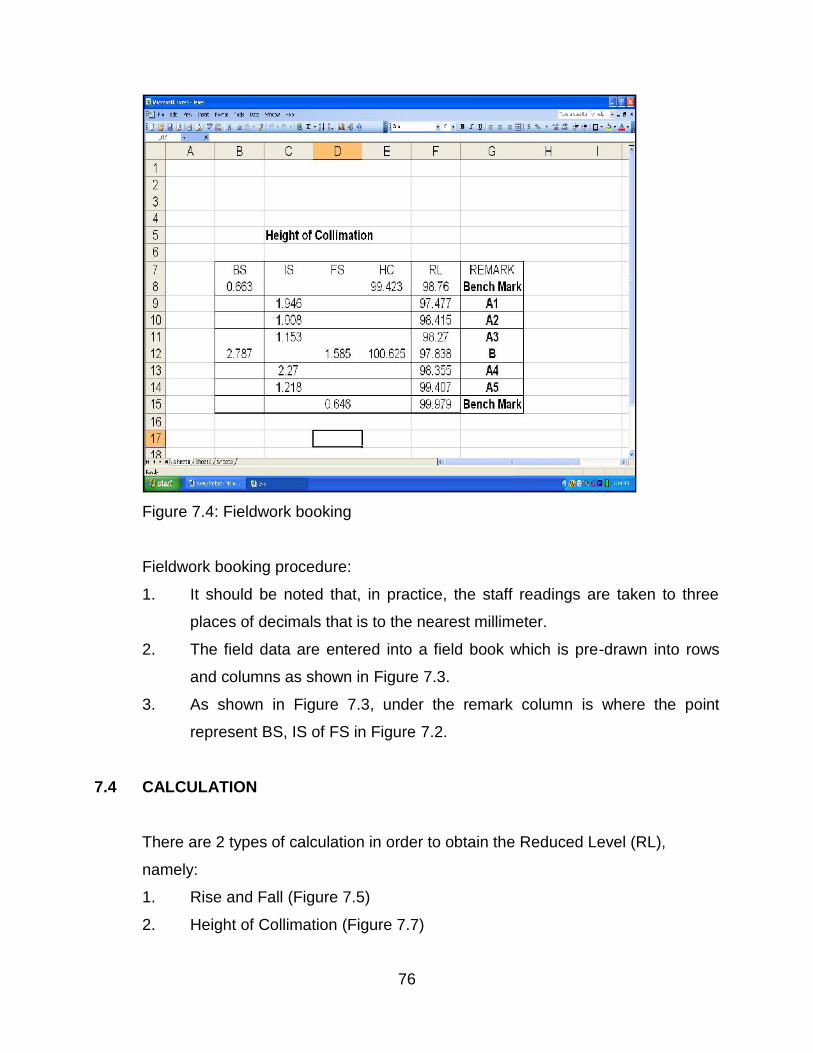
76
Figure 7.4: Fieldwork booking
Fieldwork booking procedure:
1. It should be noted that, in practice, the staff readings are taken to three
places of decimals that is to the nearest millimeter.
2. The field data are entered into a field book which is pre-drawn into rows
and columns as shown in Figure 7.3.
3. As shown in Figure 7.3, under the remark column is where the point
represent BS, IS of FS in Figure 7.2.
7.4 CALCULATION
There are 2 types of calculation in order to obtain the Reduced Level (RL),
namely:
1. Rise and Fall (Figure 7.5)
2. Height of Collimation (Figure 7.7)
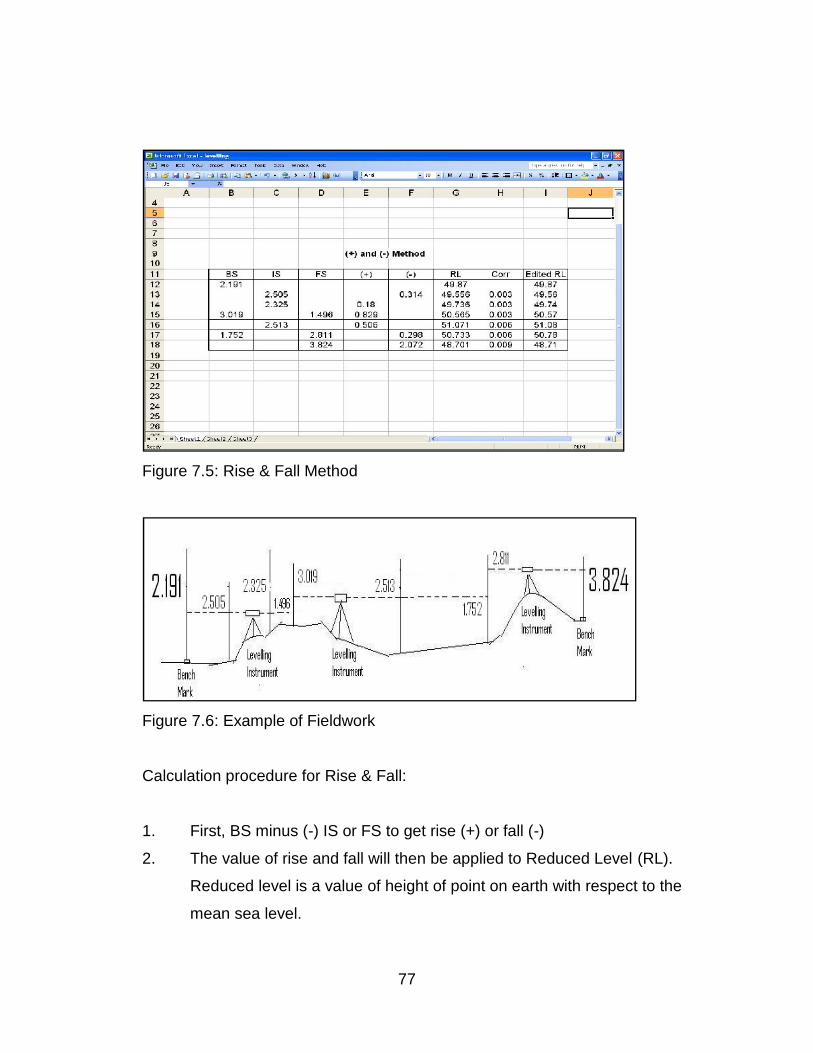
77
Figure 7.5: Rise & Fall Method
Figure 7.6: Example of Fieldwork
Calculation procedure for Rise & Fall:
1. First, BS minus (-) IS or FS to get rise (+) or fall (-)
2. The value of rise and fall will then be applied to Reduced Level (RL).
Reduced level is a value of height of point on earth with respect to the
mean sea level.
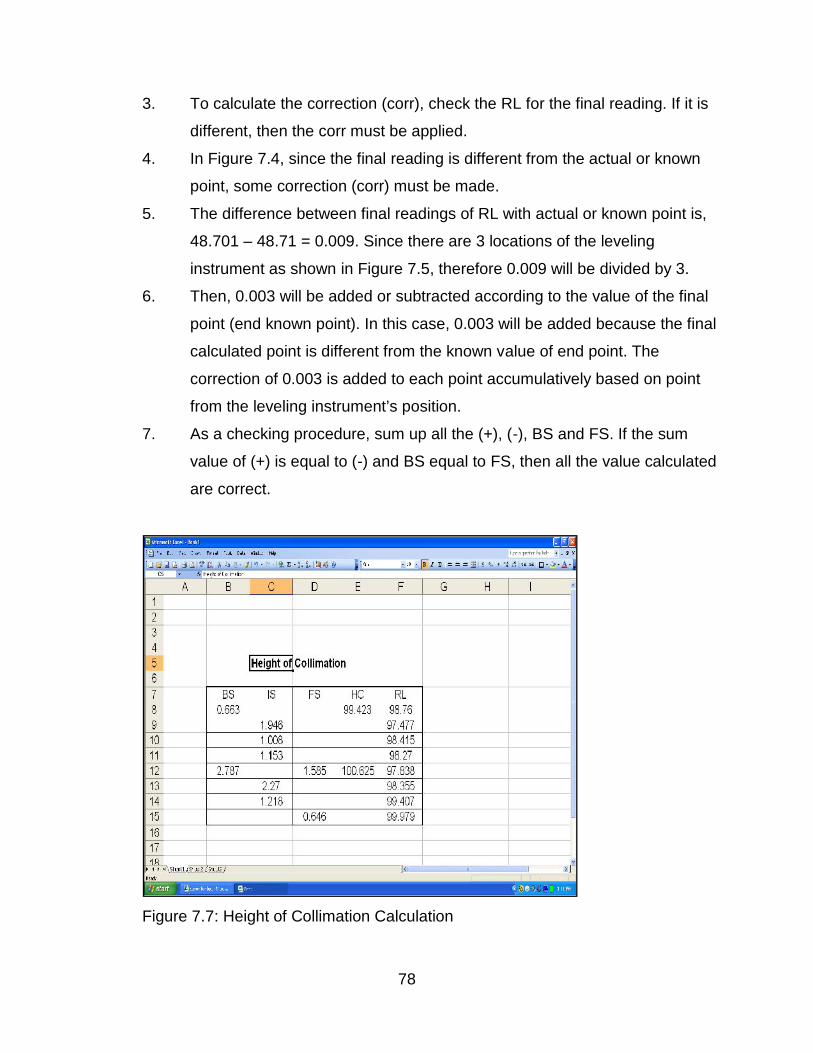
78
3. To calculate the correction (corr), check the RL for the final reading. If it is
different, then the corr must be applied.
4. In Figure 7.4, since the final reading is different from the actual or known
point, some correction (corr) must be made.
5. The difference between final readings of RL with actual or known point is,
48.701 – 48.71 = 0.009. Since there are 3 locations of the leveling
instrument as shown in Figure 7.5, therefore 0.009 will be divided by 3.
6. Then, 0.003 will be added or subtracted according to the value of the final
point (end known point). In this case, 0.003 will be added because the final
calculated point is different from the known value of end point. The
correction of 0.003 is added to each point accumulatively based on point
from the leveling instrument’s position.
7. As a checking procedure, sum up all the (+), (-), BS and FS. If the sum
value of (+) is equal to (-) and BS equal to FS, then all the value calculated
are correct.
Figure 7.7: Height of Collimation Calculation
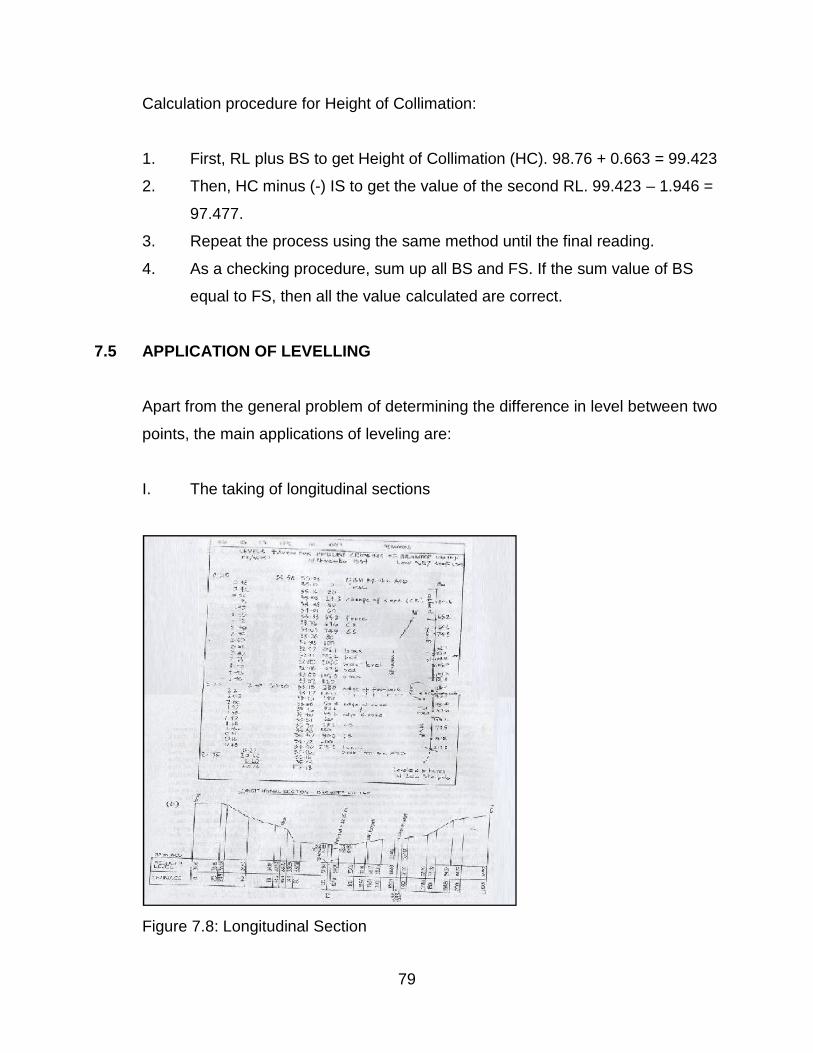
79
Calculation procedure for Height of Collimation:
1. First, RL plus BS to get Height of Collimation (HC). 98.76 + 0.663 = 99.423
2. Then, HC minus (-) IS to get the value of the second RL. 99.423 – 1.946 =
97.477.
3. Repeat the process using the same method until the final reading.
4. As a checking procedure, sum up all BS and FS. If the sum value of BS
equal to FS, then all the value calculated are correct.
7.5 APPLICATION OF LEVELLING
Apart from the general problem of determining the difference in level between two
points, the main applications of leveling are:
I. The taking of longitudinal sections
Figure 7.8: Longitudinal Section
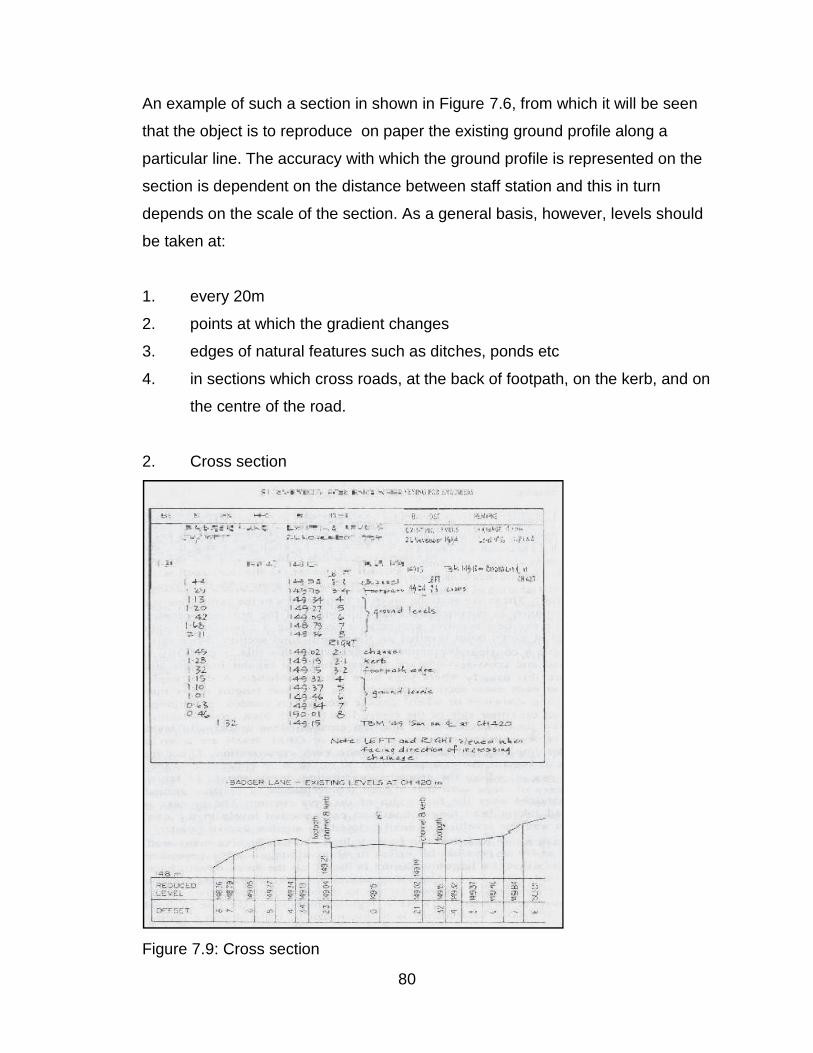
80
An example of such a section in shown in Figure 7.6, from which it will be seen
that the object is to reproduce on paper the existing ground profile along a
particular line. The accuracy with which the ground profile is represented on the
section is dependent on the distance between staff station and this in turn
depends on the scale of the section. As a general basis, however, levels should
be taken at:
1. every 20m
2. points at which the gradient changes
3. edges of natural features such as ditches, ponds etc
4. in sections which cross roads, at the back of footpath, on the kerb, and on
the centre of the road.
2. Cross section
Figure 7.9: Cross section
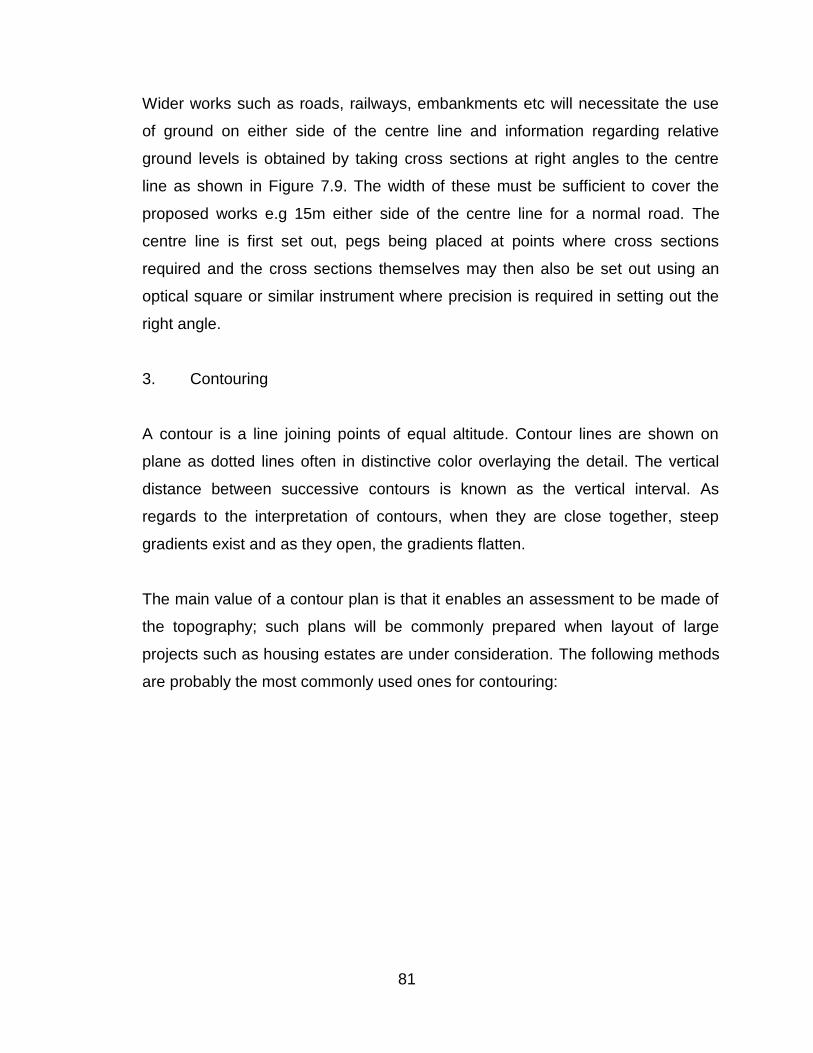
81
Wider works such as roads, railways, embankments etc will necessitate the use
of ground on either side of the centre line and information regarding relative
ground levels is obtained by taking cross sections at right angles to the centre
line as shown in Figure 7.9. The width of these must be sufficient to cover the
proposed works e.g 15m either side of the centre line for a normal road. The
centre line is first set out, pegs being placed at points where cross sections
required and the cross sections themselves may then also be set out using an
optical square or similar instrument where precision is required in setting out the
right angle.
3. Contouring
A contour is a line joining points of equal altitude. Contour lines are shown on
plane as dotted lines often in distinctive color overlaying the detail. The vertical
distance between successive contours is known as the vertical interval. As
regards to the interpretation of contours, when they are close together, steep
gradients exist and as they open, the gradients flatten.
The main value of a contour plan is that it enables an assessment to be made of
the topography; such plans will be commonly prepared when layout of large
projects such as housing estates are under consideration. The following methods
are probably the most commonly used ones for contouring:
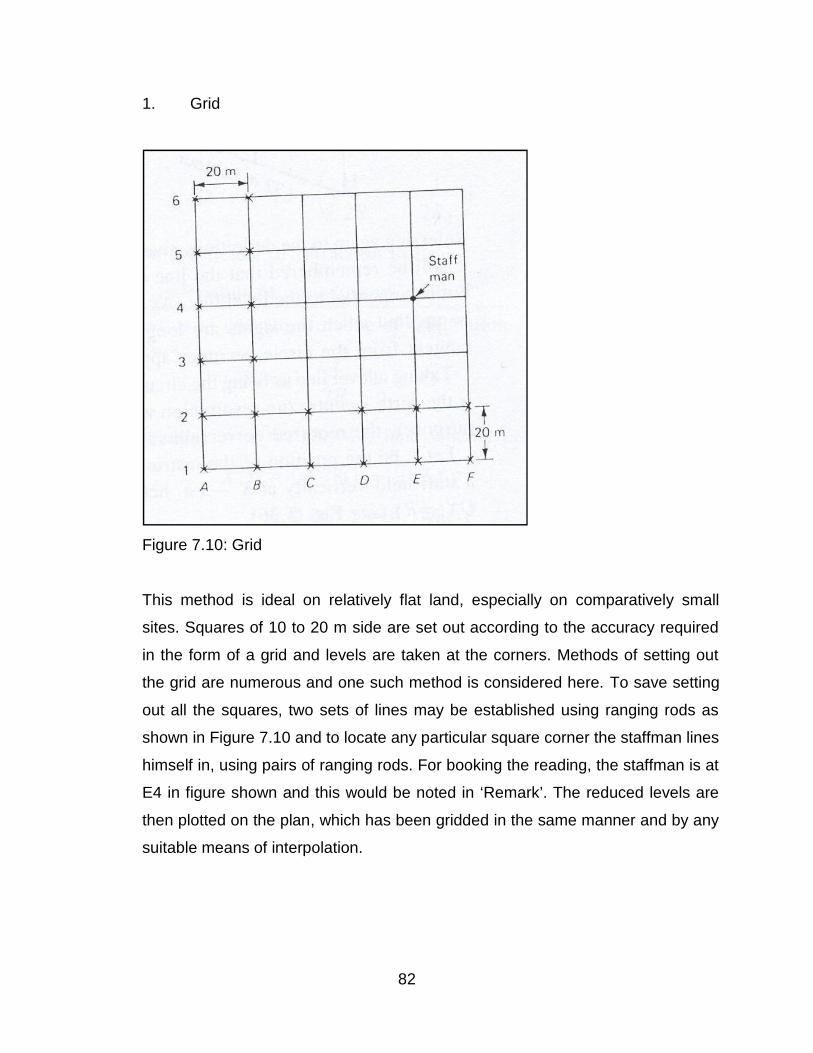
82
1. Grid
Figure 7.10: Grid
This method is ideal on relatively flat land, especially on comparatively small
sites. Squares of 10 to 20 m side are set out according to the accuracy required
in the form of a grid and levels are taken at the corners. Methods of setting out
the grid are numerous and one such method is considered here. To save setting
out all the squares, two sets of lines may be established using ranging rods as
shown in Figure 7.10 and to locate any particular square corner the staffman lines
himself in, using pairs of ranging rods. For booking the reading, the staffman is at
E4 in figure shown and this would be noted in ‘Remark’. The reduced levels are
then plotted on the plan, which has been gridded in the same manner and by any
suitable means of interpolation.
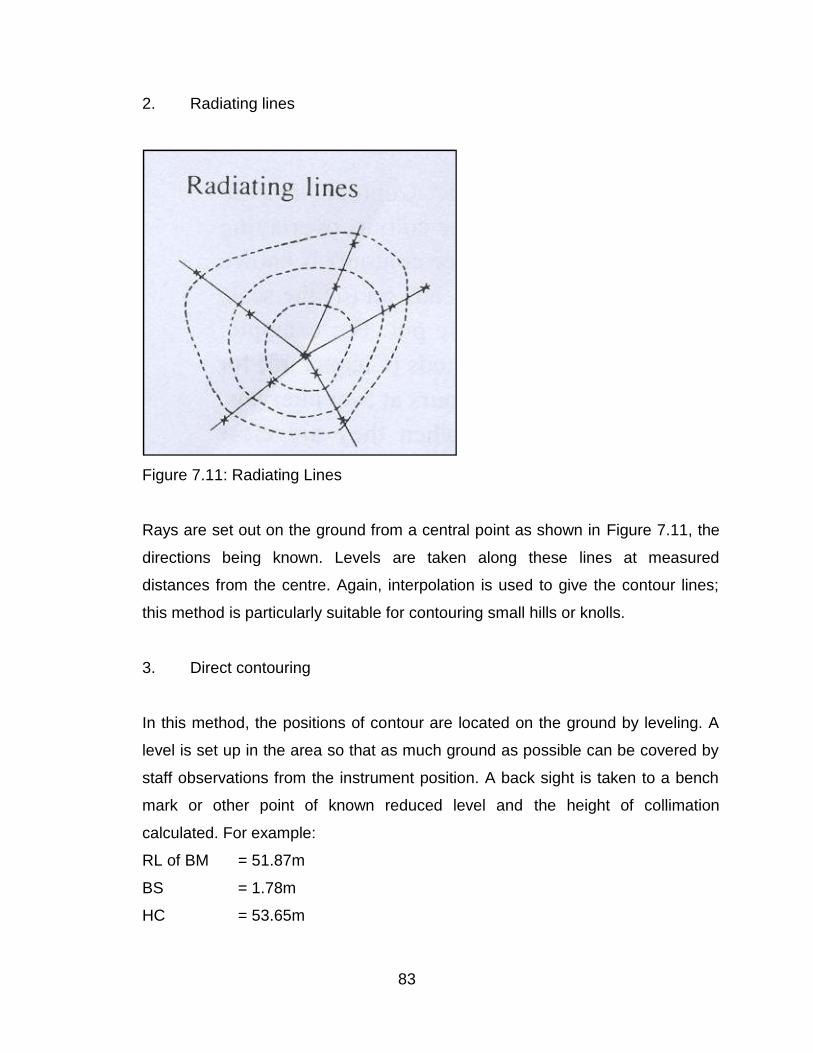
83
2. Radiating lines
Figure 7.11: Radiating Lines
Rays are set out on the ground from a central point as shown in Figure 7.11, the
directions being known. Levels are taken along these lines at measured
distances from the centre. Again, interpolation is used to give the contour lines;
this method is particularly suitable for contouring small hills or knolls.
3. Direct contouring
In this method, the positions of contour are located on the ground by leveling. A
level is set up in the area so that as much ground as possible can be covered by
staff observations from the instrument position. A back sight is taken to a bench
mark or other point of known reduced level and the height of collimation
calculated. For example:
RL of BM = 51.87m
BS = 1.78m
HC = 53.65m
84
Therefore, to locate each contour, the required staff readings are as follow:
At 50m contour = 53.65 – 50.00 = 3.65
51m contour = 53.65 – 50.00 = 2.65
Considering the 51m contour, the surveyor directs the person holding the staff to
move until a staff reading of 2.65m is obtained. At this point, a signal is given by
the surveyor so that the staff position can be marked with a peg or chain arrow.
7.6 SOURCE OF ERROR
The main factors affecting accuracy in leveling are:
1. Reading of staff
2. Bubble not being central
3. Instrument not being in adjustment
4. Differential settlement of the tripod
5. Tilting and settlement of the staff
6. Sensitivity of bubble
To avoid the build up of error:
1. Start work from BM and make use of any nearby BM which lie within the
length being leveled
2. Try to keep BS and FS equal in length to minimize errors which will occur if
the line of collimation is not parallel to bubble tube axis
3. Do not work with the staff extended in high wind
4. Exercise great care when setting up level
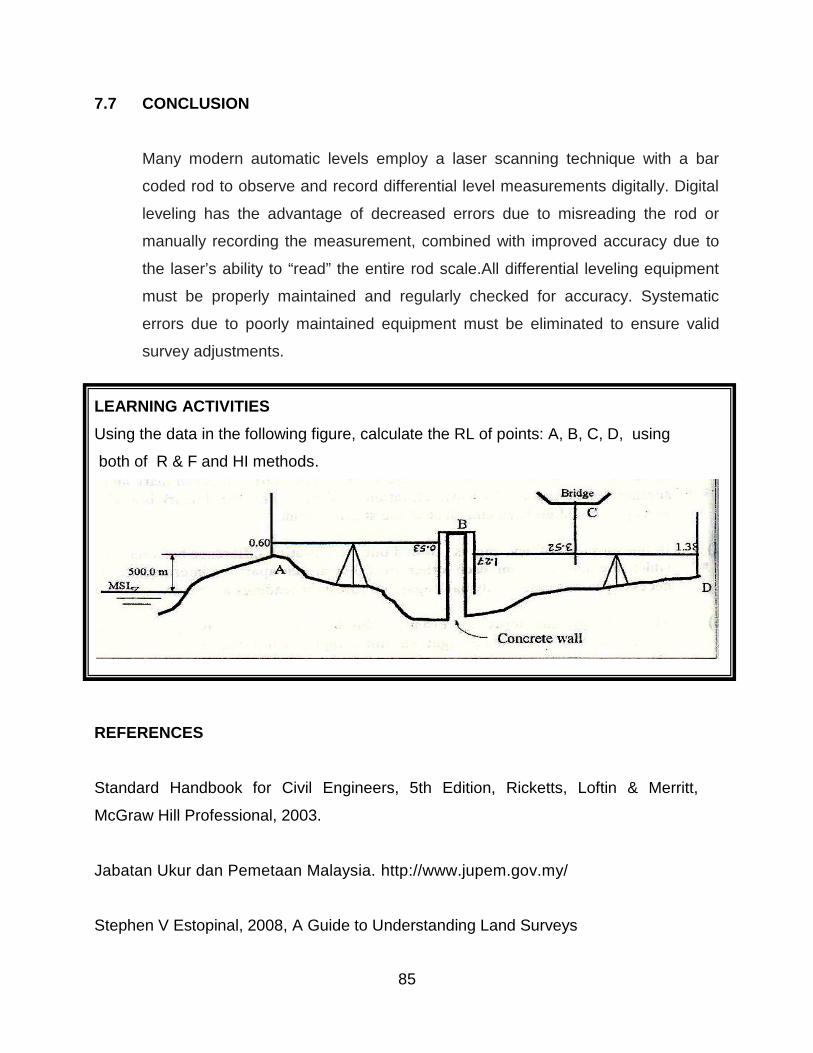
85
7.7 CONCLUSION
Many modern automatic levels employ a laser scanning technique with a bar
coded rod to observe and record differential level measurements digitally. Digital
leveling has the advantage of decreased errors due to misreading the rod or
manually recording the measurement, combined with improved accuracy due to
the laser’s ability to “read” the entire rod scale.All differential leveling equipment
must be properly maintained and regularly checked for accuracy. Systematic
errors due to poorly maintained equipment must be eliminated to ensure valid
survey adjustments.
LEARNING ACTIVITIESUsing the data in the following figure, calculate the RL of points: A, B, C, D, using
both of R & F and HI methods.
REFERENCES
Standard Handbook for Civil Engineers, 5th Edition, Ricketts, Loftin & Merritt,
McGraw Hill Professional, 2003.
Jabatan Ukur dan Pemetaan Malaysia. http://www.jupem.gov.my/
Stephen V Estopinal, 2008, A Guide to Understanding Land Surveys
86
CHAPTER 8GEOGRAPHICAL INFORMATION SYSTEM (GIS)
8.1 INTRODUCTION
Like the field of geography, the term Geographic Information System (GIS) is
hard to define. It represents the integration of many subject areas. Accordingly
there is no absolutely agreed upon definition of a GIS. A broadly accepted
definition of GIS is the one provided by the National Centre of Geographic
Information and Analysis:
“ A GIS is a system of hardware, software and procedures to facilitate the
management, manipulation, analysis, modelling, representation and
display of georeferenced data to solve complex problems regarding
planning and management of resources”
Hence, Geographical Information System (GIS) is a computer-based, which
provides for the acquisition, storage, manipulation, analysis and display of
geographically referenced data. Sources of GIS are from cartography, computer
assisted design (CAD) and computer graphic, surveying and photogrammetry,
spatial analysis, spatial modeling and remote sensing. Meanwhile, the
components of a GIS are computer hardware, GIS software modules and the
organization aspects.
LEARNING OUTCOME
At the end of the chapter, student will be able to:-
(1) Discuss the basic of GIS.(2) Explain the principles of GIS and relate to construction industry.
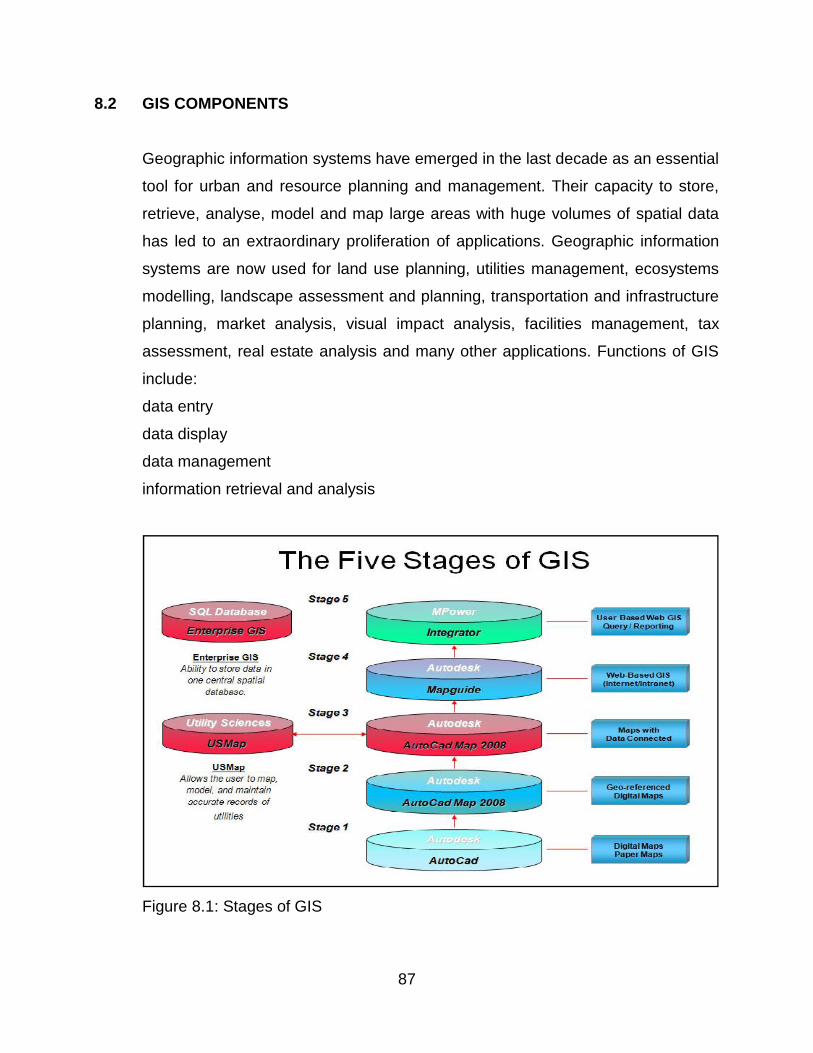
87
8.2 GIS COMPONENTS
Geographic information systems have emerged in the last decade as an essential
tool for urban and resource planning and management. Their capacity to store,
retrieve, analyse, model and map large areas with huge volumes of spatial data
has led to an extraordinary proliferation of applications. Geographic information
systems are now used for land use planning, utilities management, ecosystems
modelling, landscape assessment and planning, transportation and infrastructure
planning, market analysis, visual impact analysis, facilities management, tax
assessment, real estate analysis and many other applications. Functions of GIS
include:
data entry
data display
data management
information retrieval and analysis
Figure 8.1: Stages of GIS
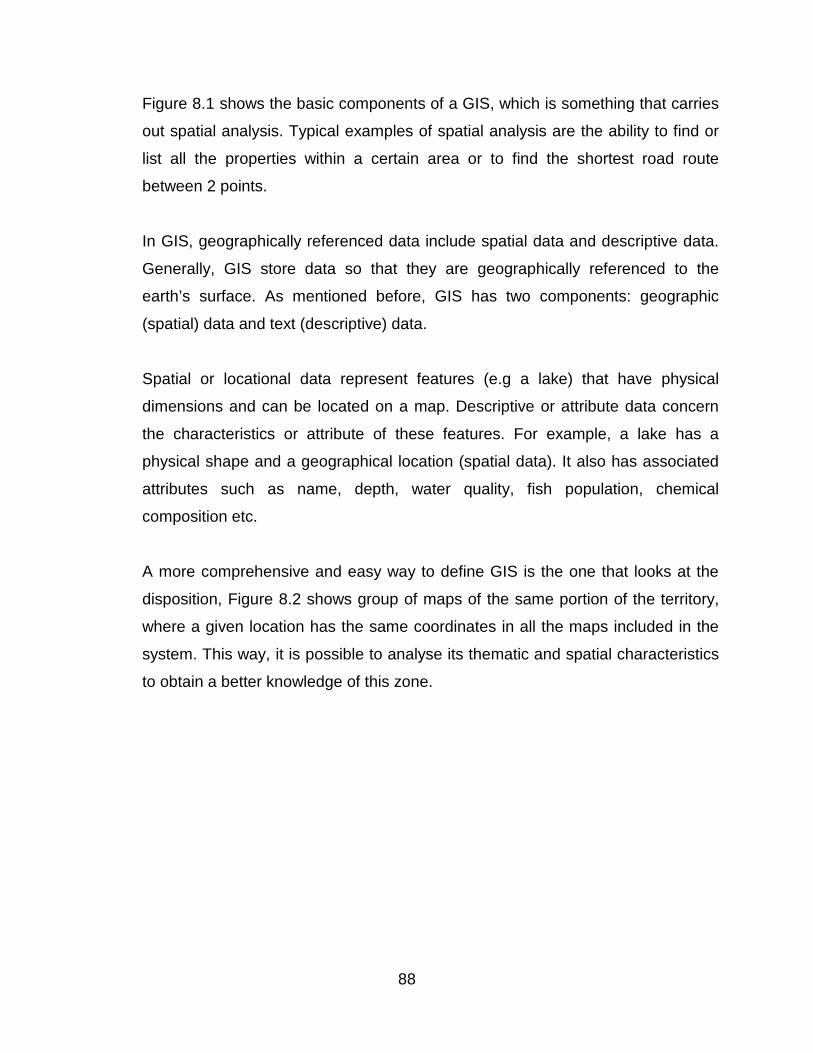
88
Figure 8.1 shows the basic components of a GIS, which is something that carries
out spatial analysis. Typical examples of spatial analysis are the ability to find or
list all the properties within a certain area or to find the shortest road route
between 2 points.
In GIS, geographically referenced data include spatial data and descriptive data.
Generally, GIS store data so that they are geographically referenced to the
earth’s surface. As mentioned before, GIS has two components: geographic
(spatial) data and text (descriptive) data.
Spatial or locational data represent features (e.g a lake) that have physical
dimensions and can be located on a map. Descriptive or attribute data concern
the characteristics or attribute of these features. For example, a lake has a
physical shape and a geographical location (spatial data). It also has associated
attributes such as name, depth, water quality, fish population, chemical
composition etc.
A more comprehensive and easy way to define GIS is the one that looks at the
disposition, Figure 8.2 shows group of maps of the same portion of the territory,
where a given location has the same coordinates in all the maps included in the
system. This way, it is possible to analyse its thematic and spatial characteristics
to obtain a better knowledge of this zone.
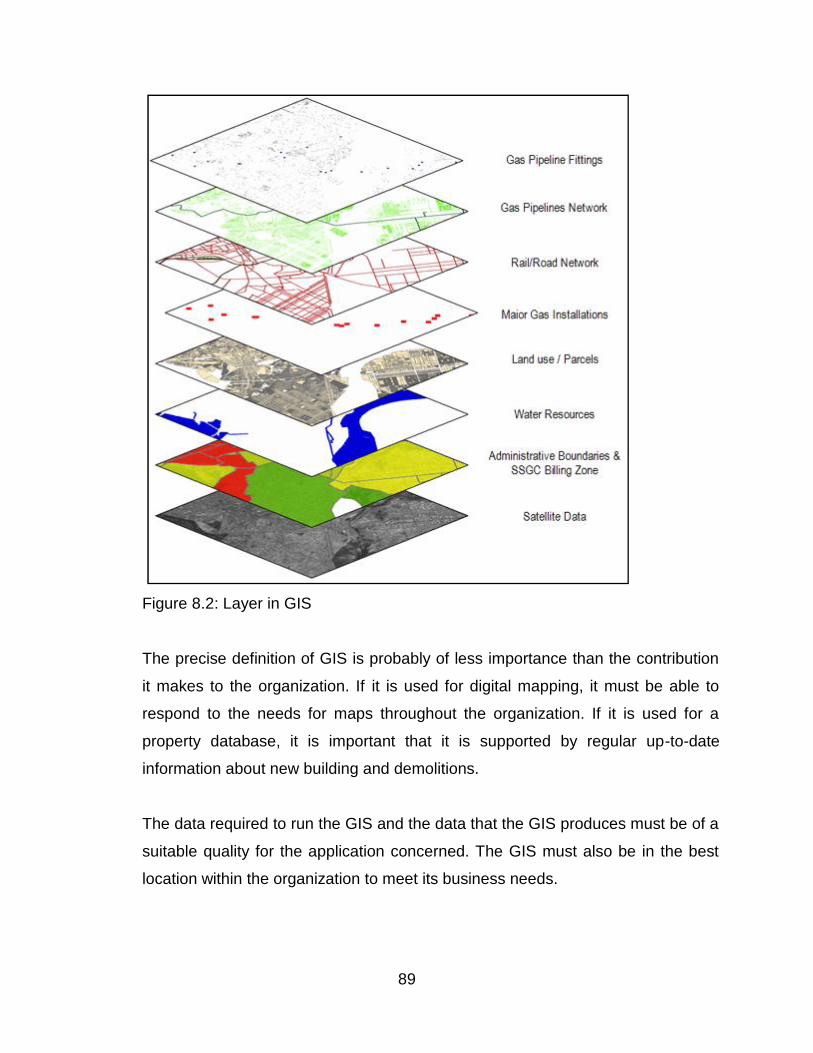
89
Figure 8.2: Layer in GIS
The precise definition of GIS is probably of less importance than the contribution
it makes to the organization. If it is used for digital mapping, it must be able to
respond to the needs for maps throughout the organization. If it is used for a
property database, it is important that it is supported by regular up-to-date
information about new building and demolitions.
The data required to run the GIS and the data that the GIS produces must be of a
suitable quality for the application concerned. The GIS must also be in the best
location within the organization to meet its business needs.
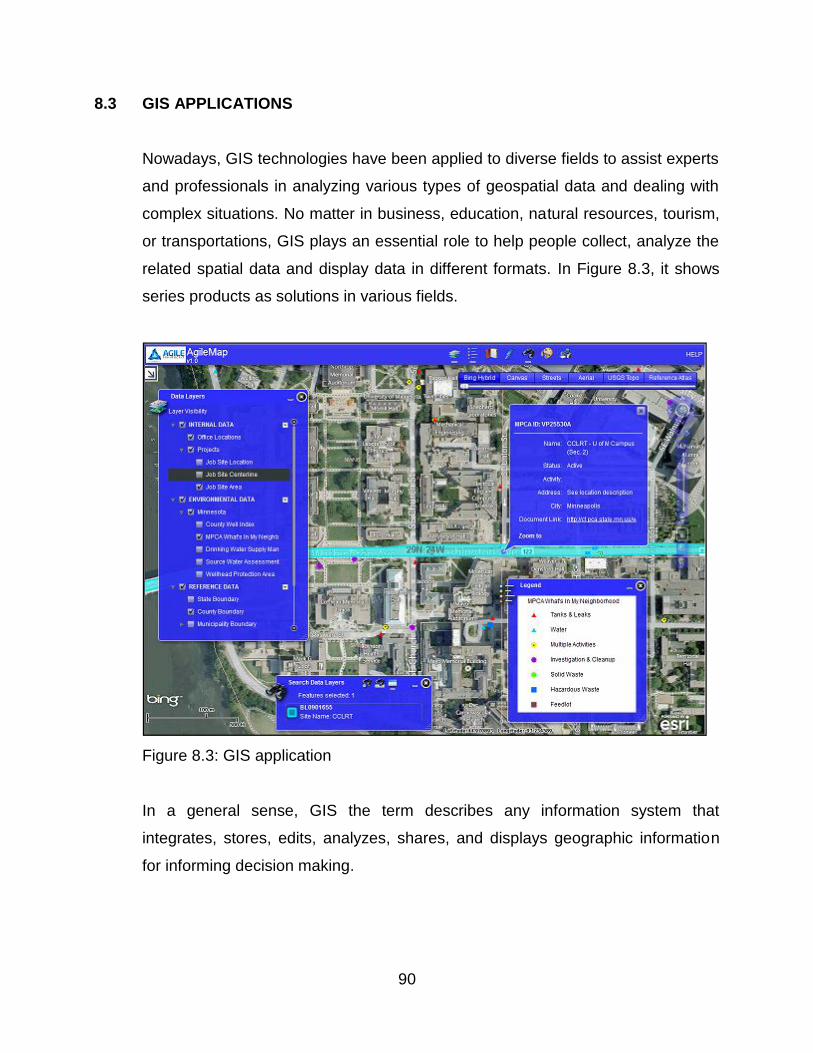
90
8.3 GIS APPLICATIONS
Nowadays, GIS technologies have been applied to diverse fields to assist experts
and professionals in analyzing various types of geospatial data and dealing with
complex situations. No matter in business, education, natural resources, tourism,
or transportations, GIS plays an essential role to help people collect, analyze the
related spatial data and display data in different formats. In Figure 8.3, it shows
series products as solutions in various fields.
Figure 8.3: GIS application
In a general sense, GIS the term describes any information system that
integrates, stores, edits, analyzes, shares, and displays geographic information
for informing decision making.
91
Figure 8.4 shows the examples of fields in which GIS are being used in professional
practice and research. Below are some of the usages:
Mapping locations
GIS can be used to map locations. GIS allows the creation of maps through
automated mapping, data capture, and surveying analysis tools.
Mapping quantities
People map quantities, like where the most and least are, to find places that meet
their criteria and take action, or to see the relationships between places. This gives
an additional level of information beyond simply mapping the locations of features.
Mapping densities
While you can see concentrations by simply mapping the locations of features, in
areas with many features it may be difficult to see which areas have a higher
concentration than others. A density map lets you measure the number of features
using a uniform a real unit, such as acres or square miles, so you can clearly see the
distribution.
Finding distances
GIS can be used to find out what's occurring within a set distance of a feature.
Mapping and monitoring change
GIS can be used to map the change in an area to anticipate future conditions, decide
on a course of action, or to evaluate the results of an action or policy.
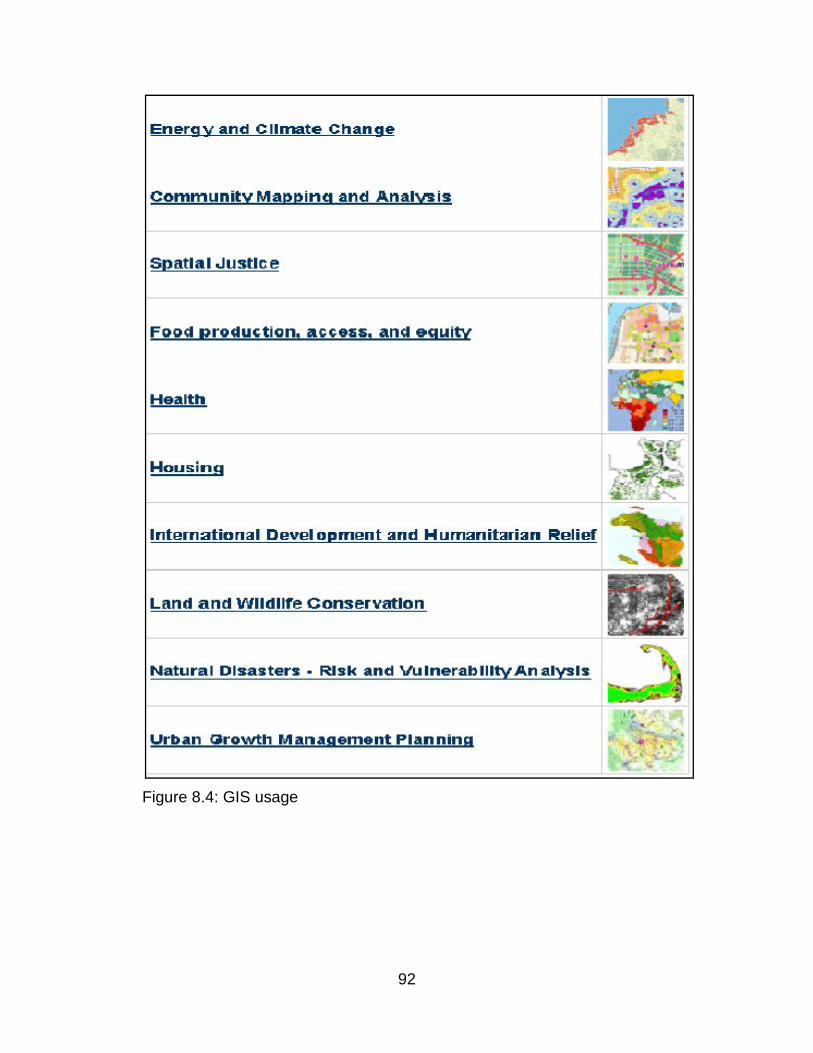
92
Figure 8.4: GIS usage
93
8.4 CONCLUSION
The GIS is based on Geographical Information Science as it is first known to the
French “An important component of this system and the essence of the GIS is the
location of the information”. Since then, the GIS and GPS remote sensors have
been harnessed for civilian use in activities ranging from police and military
security, calamity tracking (such as for landslides and agriculture productivity) to
disease control in Malaysia. Geography Information System technology and its
range of possible applications can address the spectre of unemployment as the
global recession bites.
LEARNING ACTIVITIES(1) What is the role of Land Survey in relation to GIS?
(2). Why GIS can be useful in urban planning and how does it work?
(3) How do you gather data or information to be used in GIS?
REFERENCES
Jabatan Ukur dan Pemetaan Malaysia. http://www.jupem.gov.my/
Stephen V Estopinal, 2008, A Guide to Understanding Land Surveys
Kavanagh, B.F dan Glenn Bird, S.J (2007) “Surveying with Construction Application” 6th
Edition, Prentice Hall, USA
94
CHAPTER 9APLICATION IN CONSTRUCTION
9.1 INTRODUCTION
These terms are used frequently in surveying and by manufacturers when
quoting specifications for their equipment. The terms also widely used when on
site by surveyors and engineers to describe results obtained from fieldwork.
Engineering surveys gather data for use by planners and engineers. The
products resulting from engineering surveys are generally topographic maps
and/or a digital terrain model (DTM). Both conventional (on the ground) and
photogrammetric methods are used to gather data for engineering surveys.
9.2 RESPONSIBILITIES
Successful engineering surveys require close cooperation between
Planning/Design and Surveys.
Project Manager
The Project Manager leads the Project Development Team and is responsible for
overall project planning and completion. It is the responsibility of the Project
Manager to:
Ensure that all survey requests are accurate and specific.
Obtain right of entry, as needed, for surveys
LEARNING OUTCOME
At the end of the chapter, students will be able to:-
(1) Discuss the application of surveying in construction industry(2) Explain the basic technic of the application in construction industry.(3) Justify the appropriate usage of each application.

95
Project Surveyor
The Project Surveyor is appointed by the District Surveys Manager to:
Participate as a member of the Project Development Team.
Coordinate with other functional areas.
Review and schedule each engineering survey request.
Determine the appropriate method to accomplish the requested surveys in
cooperation with the project manager.
Create and maintain a survey project file.
9.3 PREJOB MEETING
As soon as a project is known, e.g., appears on the Status of Projects Report or
an initial survey request is received, the Project Surveyor should schedule a
meeting with the Project Manager to discuss anticipated survey requests. The
meeting with the Project Manager should cover:
Project Schedule
Acquisition of any critical information not included in the initial survey
request such as as-builts, alignments, etc.
Overall project survey needs
Alternative survey methods
Safety considerations
Recommendations for survey methods
Appointment of Project Surveyor to the Project Development Team
• Surveys that might be eliminated because of existing data
Accuracy requirements for the survey
Additional surveys needed (right of way, construction, etc.)
96
9.4 PLANNING
Planning begins with the meeting between the Project Surveyor and the Project
Manager to discuss the proposed survey request. From a planning perspective,
an important part of this meeting is obtaining information about anticipated future
related survey requests for the project. Consideration of future right of way
surveys and construction surveys should be part of the planning process so that
the most efficient survey work plan for the overall project can be formulated.
A work plan for engineering surveys is prepared by the Project Surveyor. This
work plan should contain:
A list of the required engineering survey products
A schedule for the requested project surveys, including critical milestones
Reso urce needs (personnel, equipment, cash overtime, travel expense).
Safety should be a prime consideration in all survey planning and especially with
engineering surveys, which often require work in and around traffic. A key
planning consideration is to reduce (minimize) the overall exposure of surveyors
to traffic. This can be accomplished in part, by carefully selecting the survey
method, choosing the time to perform the survey, and employing special survey
techniques.
9.5 RECONNAISSANCE
Reconnaissance for the engineering surveys should be part of the research for
the overall project. Research for engineering surveys and control surveys should
be undertaken at the same time.
Identify existing survey control in the area.
When necessary, plan a control survey that will meet the requirements
of the initial survey request as well as anticipated future project
surveying needs.
97
Search the records and files of other government agencies, utility companies, and
railroads for information on facilities located in the project area. A simple,
searchable, digital database can be used for this purpose. Each record should
contain the name of the agency or company, address, phone numbers, and the
name of contacts. Special care should be taken to keep contacts friendly. Letters
thanking cooperative staff go a long way to improving research efforts.
9.6 OFFICE PREPARATION
The Project Surveyor, in consultation with the field supervisor and party chief, is
responsible for the development of the necessary instructions and information
(field package) for performing the requested engineering surveys. Surveys office
staff, under the direction of the Project Surveyor, generally prepare the field
package using information obtained from the research, together with other
compiled and computed data. The field package should contain all the necessary
information and data to efficiently complete the field work required by the survey
request. Typical information/data that may be included are:
Copy of survey request (always included)
Special instructions including safety and hazardous waste considerations
(always included)
Control diagram and station listing and as-built plans
Monumentation and right of way maps and monument listing
Maps of record
Utility maps
Utility easement descriptions
Data in digital format
Control data: descriptions, coordinates, elevations
Monumentation data: descriptions, coordinates
Topo data: descriptions, coordinates, elevations
Alignment data
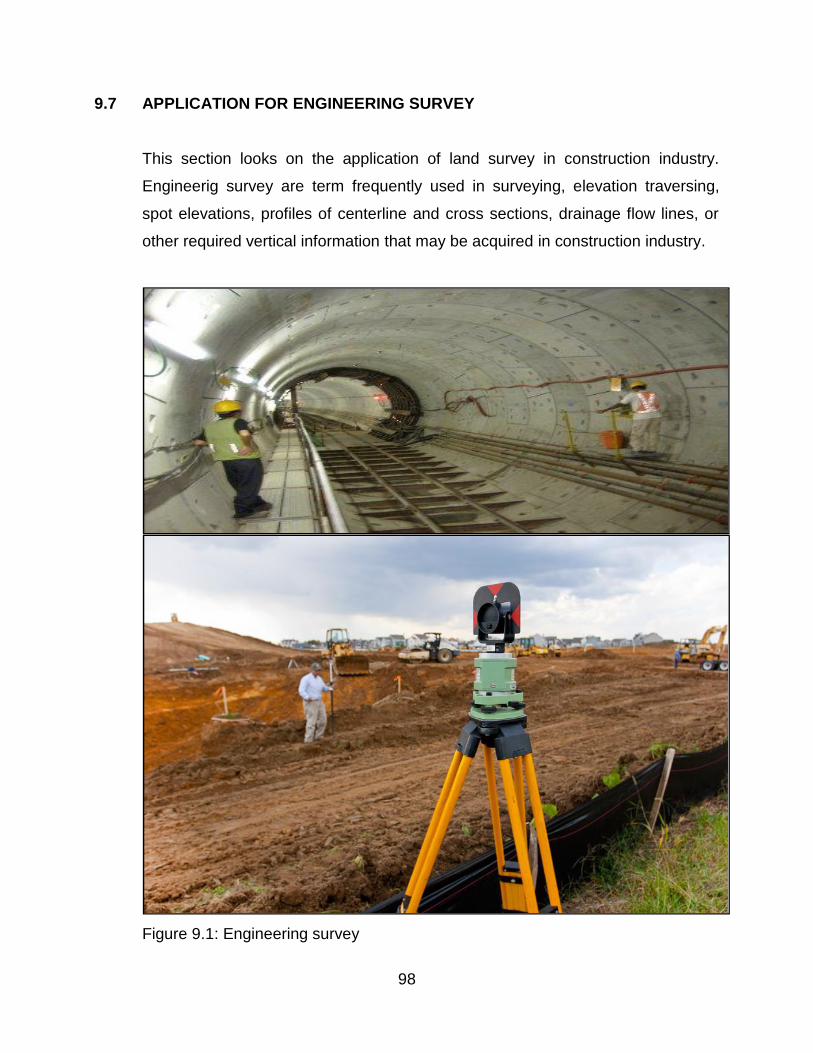
98
9.7 APPLICATION FOR ENGINEERING SURVEY
This section looks on the application of land survey in construction industry.
Engineerig survey are term frequently used in surveying, elevation traversing,
spot elevations, profiles of centerline and cross sections, drainage flow lines, or
other required vertical information that may be acquired in construction industry.
Figure 9.1: Engineering survey
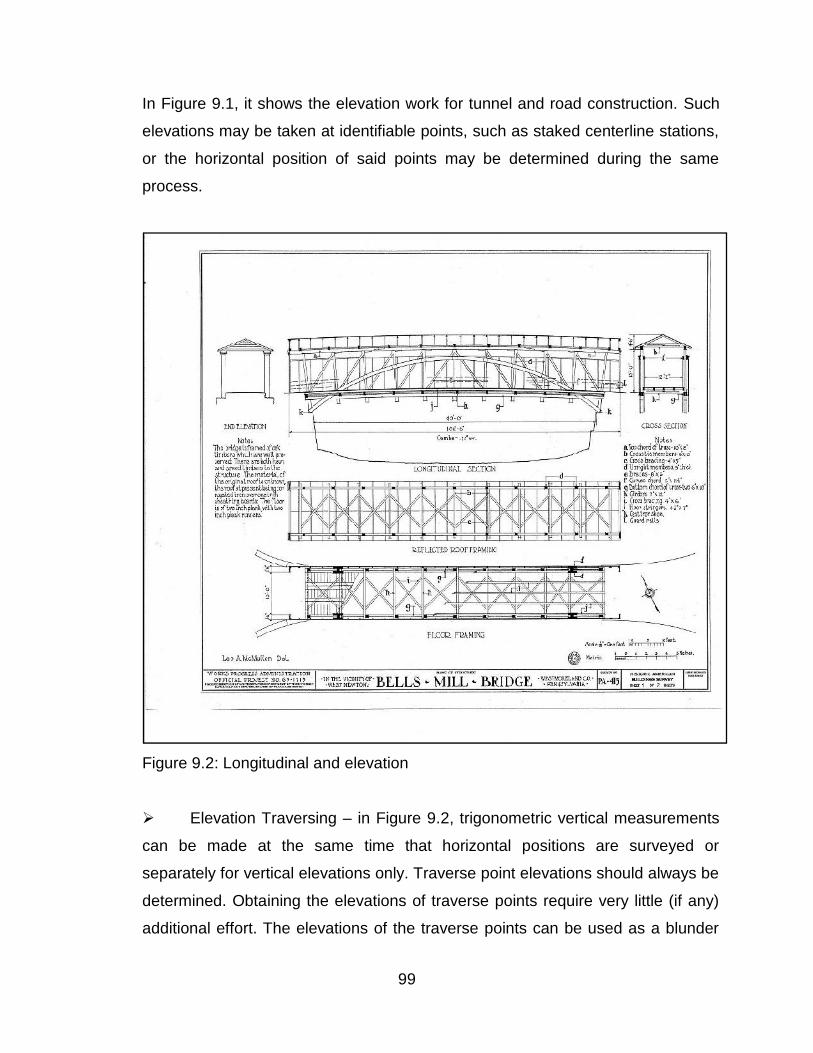
99
In Figure 9.1, it shows the elevation work for tunnel and road construction. Such
elevations may be taken at identifiable points, such as staked centerline stations,
or the horizontal position of said points may be determined during the same
process.
Figure 9.2: Longitudinal and elevation
Elevation Traversing – in Figure 9.2, trigonometric vertical measurements
can be made at the same time that horizontal positions are surveyed or
separately for vertical elevations only. Traverse point elevations should always be
determined. Obtaining the elevations of traverse points require very little (if any)
additional effort. The elevations of the traverse points can be used as a blunder
100
check for more precise leveling of these points. They are also needed for
reducing measurements to the state plane coordinate system,
Vertical Only Traverse - On many occasions the elevation is required on
points where the position is known (bridge ends, profile stations, etc.) or points
that can be identified (wing points, etc.). Such elevations may be obtained by any
of the three computation methods described previously. The accuracy required
and position of the needed point relative to established horizontal and vertical
control will generally determine the type of vertical traverse required.
Centerline Profile - Centerline profiles are normally determined by
differential leveling, but there are situations where trigonometric leveling may be
the most economical. Much of the economy will depend on the location of control
points in relation to the required profiles and the terrain involved. If the terrain is
steep or rolling, requiring numerous "turns" with a level, trigonometric leveling
may become the most economical method to obtain such elevations. Any of the
same procedures as described for vertical measurement to remote points may be
used. If all the spot elevations required are not visible from a nearby control point,
the instrument should be set where one or more control points, and all the
required spot elevations, are visible. In order to increase the reliability of the
elevations, foresights and back sights should not exceed 300 meters (1,000 feet).
All DE’s should be read at least three times.
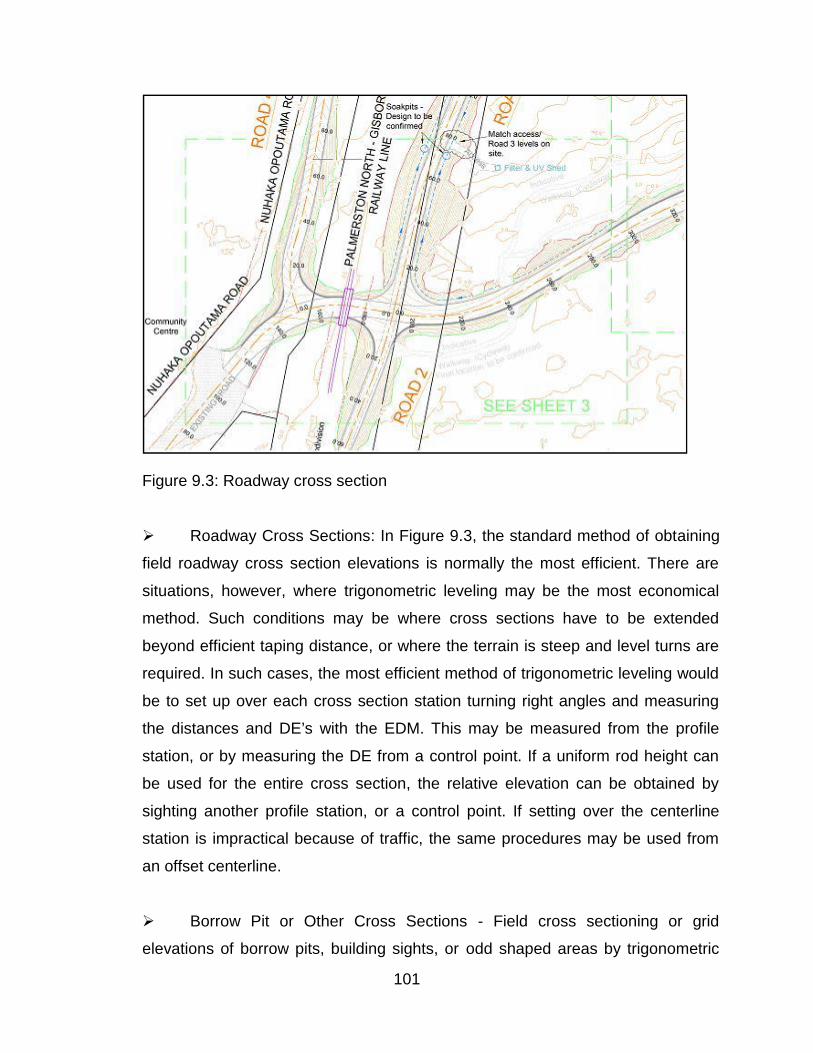
101
Figure 9.3: Roadway cross section
Roadway Cross Sections: In Figure 9.3, the standard method of obtaining
field roadway cross section elevations is normally the most efficient. There are
situations, however, where trigonometric leveling may be the most economical
method. Such conditions may be where cross sections have to be extended
beyond efficient taping distance, or where the terrain is steep and level turns are
required. In such cases, the most efficient method of trigonometric leveling would
be to set up over each cross section station turning right angles and measuring
the distances and DE’s with the EDM. This may be measured from the profile
station, or by measuring the DE from a control point. If a uniform rod height can
be used for the entire cross section, the relative elevation can be obtained by
sighting another profile station, or a control point. If setting over the centerline
station is impractical because of traffic, the same procedures may be used from
an offset centerline.
Borrow Pit or Other Cross Sections - Field cross sectioning or grid
elevations of borrow pits, building sights, or odd shaped areas by trigonometric
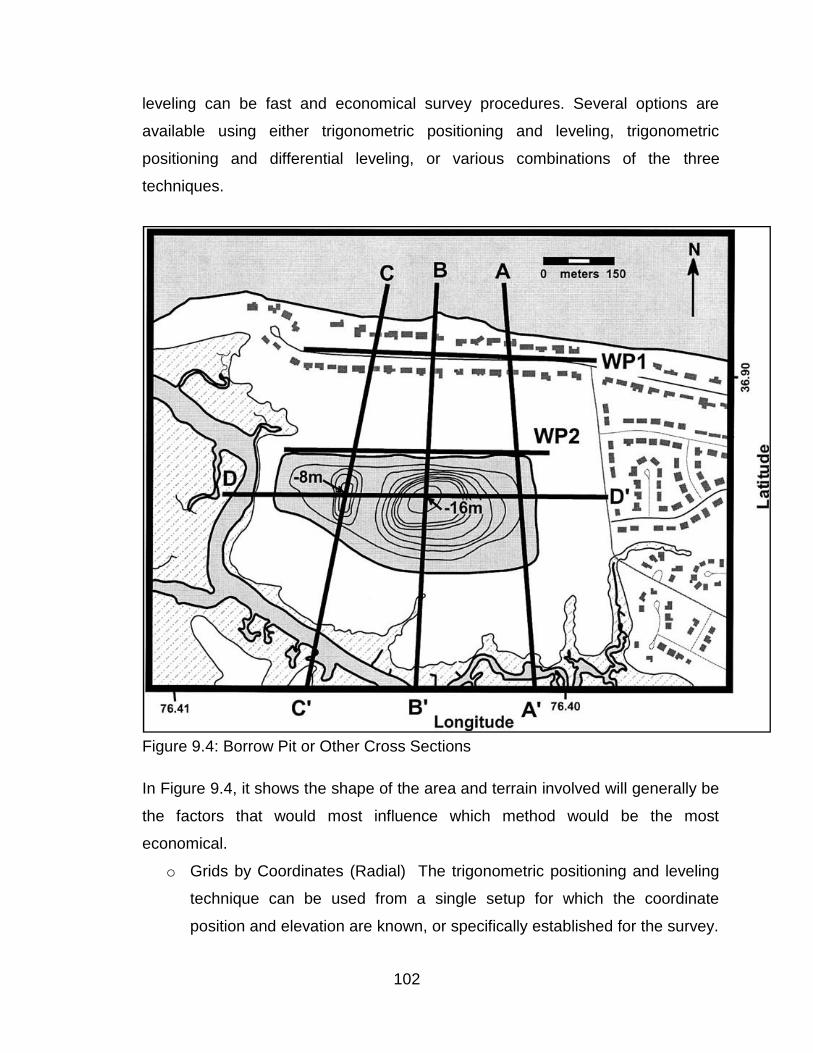
102
leveling can be fast and economical survey procedures. Several options are
available using either trigonometric positioning and leveling, trigonometric
positioning and differential leveling, or various combinations of the three
techniques.
Figure 9.4: Borrow Pit or Other Cross Sections
In Figure 9.4, it shows the shape of the area and terrain involved will generally be
the factors that would most influence which method would be the most
economical.
o Grids by Coordinates (Radial) The trigonometric positioning and leveling
technique can be used from a single setup for which the coordinate
position and elevation are known, or specifically established for the survey.
103
Coordinates for each grid point can be prefigured and the azimuth and
distance from the instrument tabulated for positioning the rod person at
each grid point. Differences in elevations (DE’s) would be read at each
point and an accurate grid elevation computed. Total station tracking mode
speeds up the operation.The primary advantage of this system is that very
few stakes or flags are required and much of the control work can be
prefigured at the office. If the grid area is quite large, additional setup
points may be required.
o Grid by Double Base Lines The trigonometric positioning and leveling
technique is advantageous where the shape and topography of the area
provides good visibility for the rod person. Two rows of grid lath are placed
along one side and one end of the area. The rod person can "eyeball" grid
points for either trigonometric or differential leveling on the unstaked
points. This system requires some time to set up the control lath, but
speeds up the location of grid points for the remainder of the survey.
o Cross Sectioning from Base Line(s) Cross sectioning requires the
establishment of one or more baselines. Normally, the instrument would be
set up at each station and distances and DE’s taken at each break along
the cross sectional profile. Proper positioning of the base line(s) for good
coverage and sights is the most critical part of this type of survey. This
system is most advantageous where the terrain is rough and grids would
not reflect the true topography.
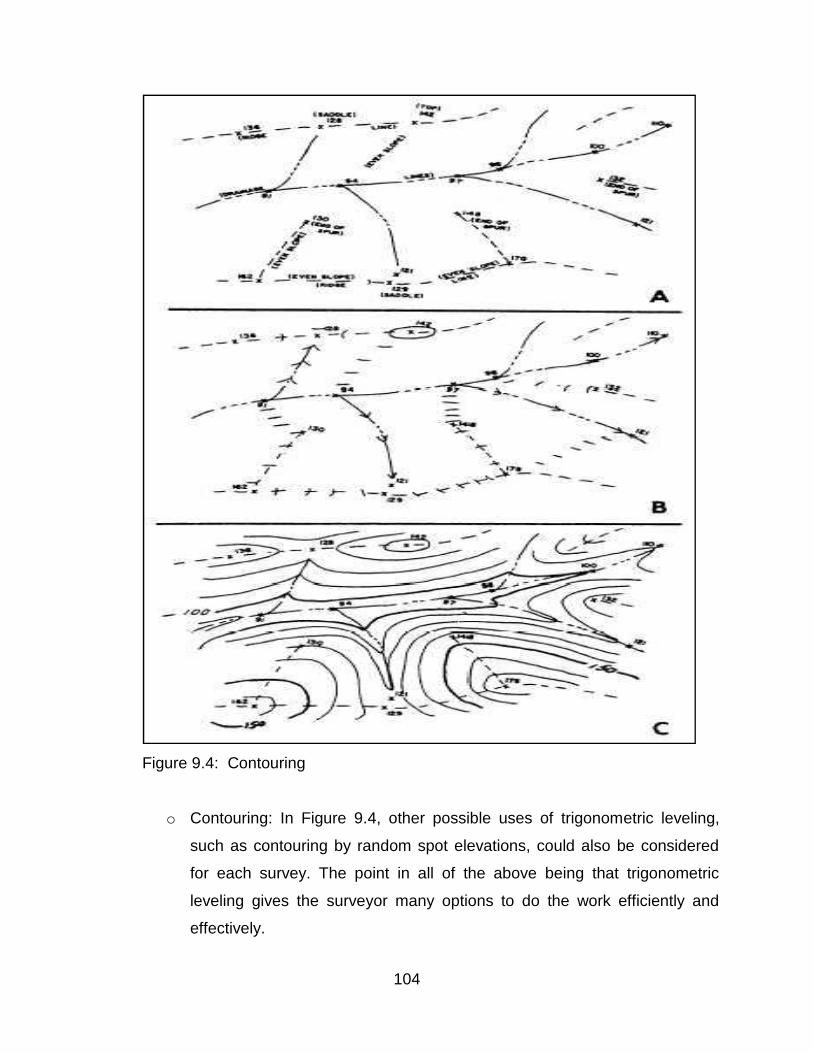
104
Figure 9.4: Contouring
o Contouring: In Figure 9.4, other possible uses of trigonometric leveling,
such as contouring by random spot elevations, could also be considered
for each survey. The point in all of the above being that trigonometric
leveling gives the surveyor many options to do the work efficiently and
effectively.
105
9.8 CONCLUSION
Engineering surveys establish control points by traverse, baseline or other
methods to botain information required for engineering designs and to set out
construction from design drawings by use of these control points. Topographic
surveys and the maps produced by them provide horizontal location information
and elevation needed for the design of structures such as building, dams, canals,
highways, transmission lines and sewers.
LEARNING ACTIVITIES(1) What is the role of Surveyor in relation to road construction surveying?
(2). How do you gather data building surveying?
REFERENCES
Jabatan Ukur dan Pemetaan Malaysia. http://www.jupem.gov.my/
Barry F. Kavanagh, Surveying With Construction Applications, Prentice Hall, Fifth
edition, 2004
Stephen V Estopinal, 2008, A Guide to Understanding Land Surveys