Embed Size (px)
Citation preview

1www.metrostudy.com
Boulder Valley Real Estate ConferenceNovember 15, 2018
Denver Market
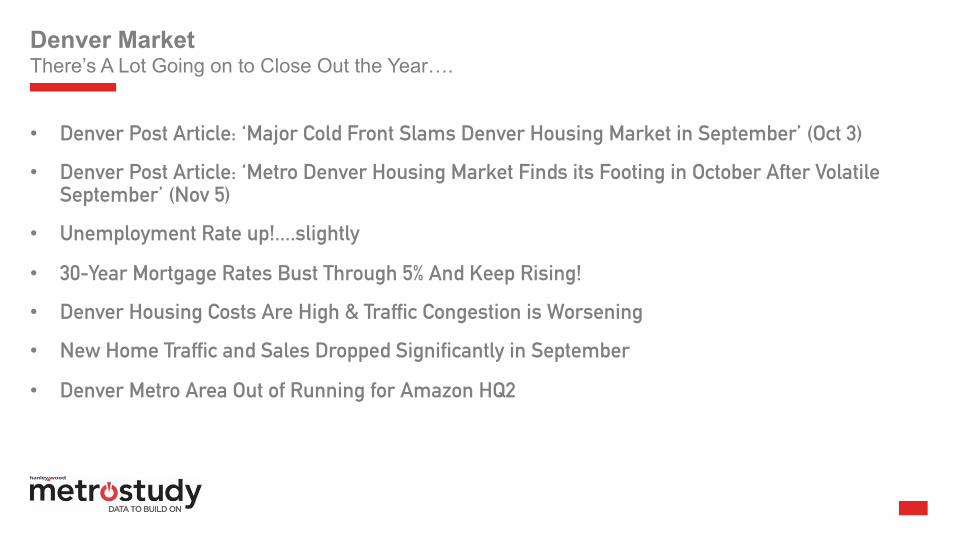
• Denver Post Article: ‘Major Cold Front Slams Denver Housing Market in September’ (Oct 3)
• Denver Post Article: ‘Metro Denver Housing Market Finds its Footing in October After Volatile September’ (Nov 5)
• Unemployment Rate up!....slightly
• 30-Year Mortgage Rates Bust Through 5% And Keep Rising!
• Denver Housing Costs Are High & Traffic Congestion is Worsening
• New Home Traffic and Sales Dropped Significantly in September
• Denver Metro Area Out of Running for Amazon HQ2
There’s A Lot Going on to Close Out the Year….
PAGE 2

Denver Market
• National Housing Permits Fall to Lowest Level in Two Years
• NAHB Builder Sentiment Index at Lowest Level of The Year
• Combined With Rising Interest Rates and Declining Affordability, The Outlook for Housing is Deteriorating
• Mid-Term Elections
• The Denver Broncos Are Not Going to Make the Playoffs….Again
There’s A Lot Going on to Close Out the Year….continued
PAGE 3
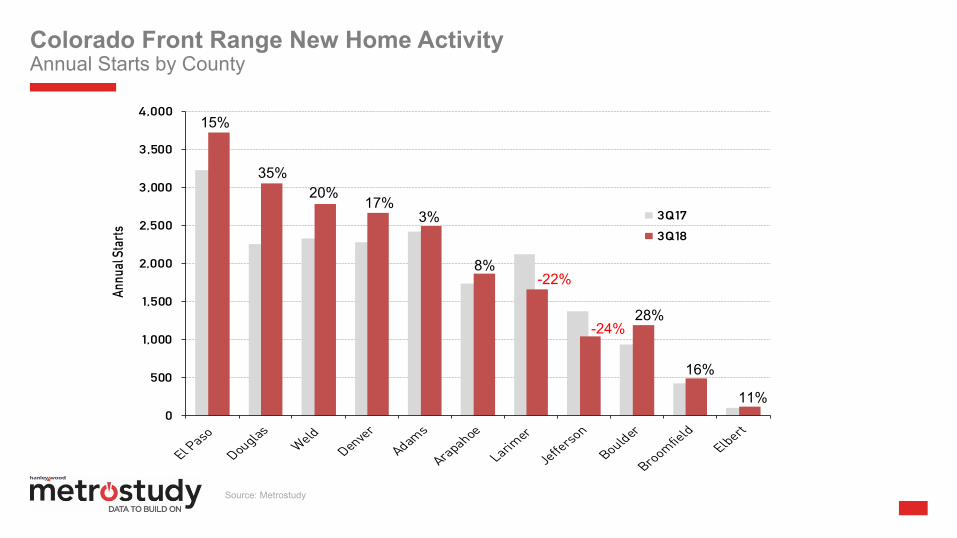
Colorado Front Range New Home ActivityAnnual Starts by County
PAGE 4
Source: Metrostudy
0
500
1,000
1,500
2,000
2,500
3,000
3,500
4,000An
nual
Star
ts
3Q173Q18
15%
20%35%
17%3%
8%-22%
-24%28%
16%
11%

Denver Metro New Home ActivityAnnual Starts by County and Market Share
PAGE 5
Source: Metrostudy
2,492
1,866
1,191
544
2,669
3,053
1,042
0
250
500
750
1,000
1,250
1,500
1,750
2,000
2,250
2,500
2,750
3,000
3,250
Adams Arapahoe Boulder Broomfield Denver Douglas Jefferson
Annu
al St
arts
19%
14%
9%
4%
21%
23%
8%

Denver Metro New Home ActivityMarket Share Trend by County
PAGE 6
Source: Metrostudy
19%
14%
9%
21%
24%
8%
4%
0%
5%
10%
15%
20%
25%
30%
Adams Arapahoe Boulder Broomfield Denver Douglas Jefferson
Mar
ket S
hare
of A
nnua
l Sta
rts3Q13 3Q14 3Q15 3Q16 3Q17 3Q18

Denver Market Traffic & ContractsAverage Weekly Traffic Per Subdivision is Down -1% Compared to YTD 2017
PAGE 7
Source: Metrostudy
0
5
10
15
20
25
J F M A M J J A S O N D
Aver
age W
eekly
Tra
ffic P
er Su
bdivi
sion
2018
2015
2017
2016
Denver HBA Parade of Homes
Traffic Down -17% Aug-Oct
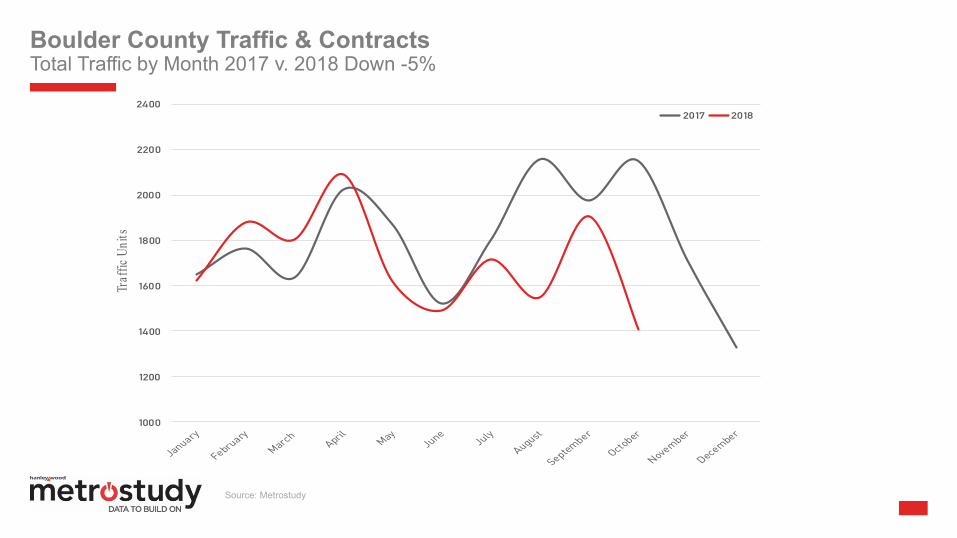
Boulder County Traffic & ContractsTotal Traffic by Month 2017 v. 2018 Down -5%
PAGE 8
Source: Metrostudy
1000
1200
1400
1600
1800
2000
2200
2400
Traf
fic U
nits
2017 2018

Denver Market Traffic & ContractsTotal Traffic by Base Price Range 2014-2018
PAGE 9
Source: Metrostudy
0
5,000
10,000
15,000
20,000
25,000
30,000
35,000
40,000
45,000
50,000
$0-$299 $300-$ 399 $400-$499 $500-$ 599 $600-$ 699 $700-$799 $800+
Traf
fic U
nits
(Jan
-Oct
)
20142015201620172018
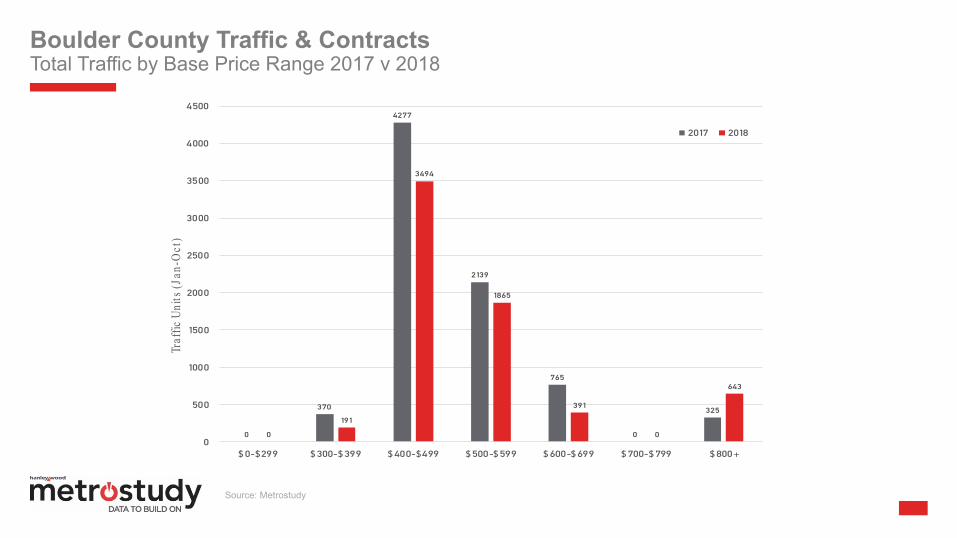
Boulder County Traffic & ContractsTotal Traffic by Base Price Range 2017 v 2018
PAGE 10
Source: Metrostudy
0
370
4277
2139
765
0
325
0
191
3494
1865
391
0
643
0
500
1000
1500
2000
2500
3000
3500
4000
4500
$ 0-$299 $ 300-$ 399 $ 400-$499 $ 500-$ 599 $ 600-$ 699 $ 700-$ 799 $ 800+
Traf
fic U
nits
(Jan
-Oct
)
2017 2018
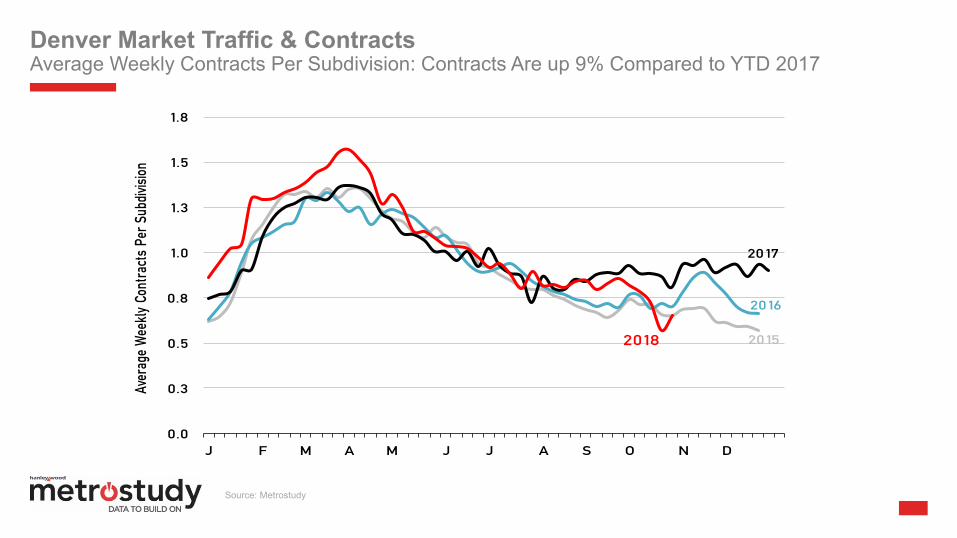
Denver Market Traffic & ContractsAverage Weekly Contracts Per Subdivision: Contracts Are up 9% Compared to YTD 2017
PAGE 11
Source: Metrostudy
0.0
0.3
0.5
0.8
1.0
1.3
1.5
1.8
J F M A M J J A S O N D
Aver
age W
eekly
Con
tracts
Per
Subd
ivisio
n
2016
2017
2018 2015
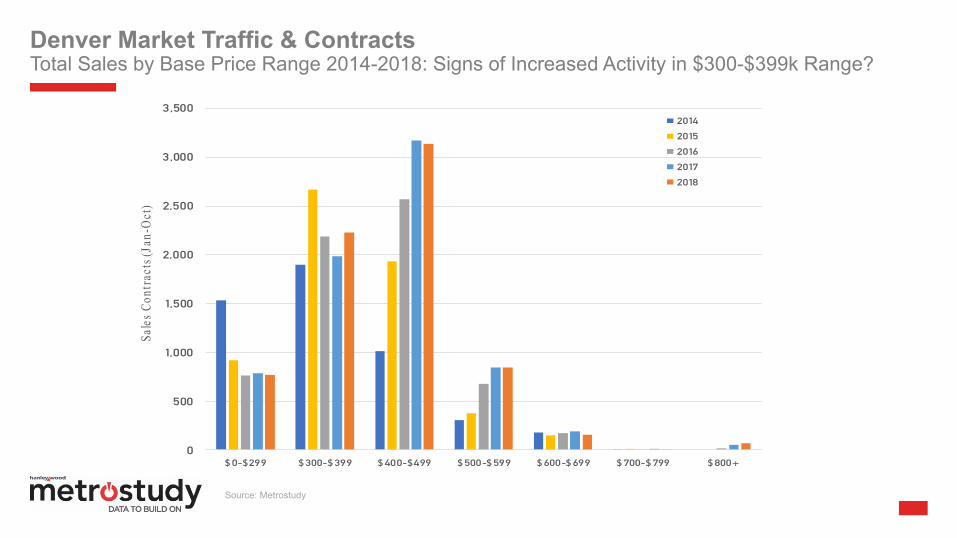
Denver Market Traffic & ContractsTotal Sales by Base Price Range 2014-2018: Signs of Increased Activity in $300-$399k Range?
PAGE 12
Source: Metrostudy
0
500
1,000
1,500
2,000
2,500
3,000
3,500
$0-$299 $300-$ 399 $400-$499 $500-$599 $600-$699 $700-$ 799 $800+
Sales
Con
tract
s (Ja
n-Oc
t)
20142015201620172018

Boulder County Traffic & ContractsTotal Sales by Base Price Range 2017 v. 2018 are Down -3%
PAGE 13
Source: Metrostudy
0
61
245
233
19
0
17
0
35
269
190
100
24
0
50
100
150
200
250
300
$0-$299 $ 300-$ 399 $ 400-$499 $ 500-$ 599 $ 600-$ 699 $ 700-$ 799 $ 800+
Net
Con
trac
ts (J
an-O
ct)
2017 2018

Denver Market Traffic & ContractsAverage Weekly Conversion Rate – Sept ’18 was 7.4% v. Sept ‘17 of 5.3%
PAGE 14
Source: Metrostudy
0.0%
1.0%
2.0%
3.0%
4.0%
5.0%
6.0%
7.0%
8.0%
9.0%
10.0%
J F M A M J J A S O N D
Axis Title
Aver
age W
eekly
Con
vers
ion R
ate
Axis Title
3.245
2016
2017
2018
2015

Denver Market Traffic & ContractsTraffic Conversion Rate by Month 2014-2018
PAGE 15
Source: Metrostudy
0%
1%
2%
3%
4%
5%
6%
7%
8%
9%
10%Co
nver
sion R
ate (
Jan-
Oct)
20142015201620172018

Denver Market Traffic & ContractsTraffic Conversion Rate by Base Price Range 2014-2018
PAGE 16
Source: Metrostudy
0%
2%
4%
6%
8%
10%
12%
14%
16%
$0-$299 $300-$399 $400-$499 $500-$ 599 $600-$ 699 $700-$799 $800+
Conv
ersio
n Rat
e (Ja
n-Oc
t)20142015201620172018

Boulder New Home Activity3Q Starts & Closings Stats (All Product)
PAGE 17
Source: Metrostudy
DENVER METRO Type 3Q17 3Q18 % Change
Qtr Starts Condominium 194 78 -59.8%Townhome/Duplex 797 891 11.8%Detached 2255 2353 4.3%
Total 3246 3322 2.3%
Annual Starts Condominium 505 896 77.4%Townhome/Duplex 2795 3207 14.7%Detached 8158 8865 8.7%
Total 11458 12968 13.2%
Qtr Closings Condominium 77 104 35.1%Townhome/Duplex 546 841 54.0%Detached 1912 2193 14.7%
Total 2535 3138 23.8%
Annual Closings Condominium 175 420 140.0%Townhome/Duplex 2206 2861 29.7%Detached 7844 8407 7.2%
Total 10225 11688 14.3%
BOULDER COUNTY Type 3Q17 3Q18 % Change
Qtr Starts Condominium 12 0 -100.0%Townhome/Duplex 39 89 128.2%Detached 195 206 5.6%
Total 246 295 19.9%
Annual Starts Condominium 53 166 213.2%Townhome/Duplex 178 324 82.0%Detached 701 701 0.0%
Total 932 1191 27.8%
Qtr Closings Condominium 27 22 -18.5%Townhome/Duplex 28 61 117.9%Detached 144 161 11.8%
Total 199 244 22.6%
Annual Closings Condominium 82 135 64.6%Townhome/Duplex 150 192 28.0%Detached 574 726 26.5%
Total 806 1053 30.6%

Boulder New Home ActivityCounty Above Previous Cycle Peak for Home Starts
PAGE 18
Source: Metrostudy
0%
2%
4%
6%
8%
10%
12%
0
200
400
600
800
1,000
1,200
1,400
3Q05 3Q06 3Q07 3Q08 3Q09 3Q10 3Q11 3Q12 3Q13 3Q14 3Q15 3Q16 3Q17 3Q18
Mark
et Sh
are
Annu
al St
arts
Boulder County Annual StartsBoulder % Share of Metro Area

Boulder County New Home ActivityHas a 14.4 Month Supply of Vacant Developed Lots and VDL Count is up +3% From 3Q17
PAGE 19
Source: Metrostudy
0
20
40
60
80
100
120
140
160
180
0
500
1,000
1,500
2,000
2,500
3Q05 3Q06 3Q07 3Q08 3Q09 3Q10 3Q11 3Q12 3Q13 3Q14 3Q15 3Q16 3Q17 3Q18
Mon
ths o
f Sup
ply
Vaca
nt D
evel
oped
Lots
Boulder County VDL InventoryBoulder County VDL Months of Supply

Boulder County New Home ActivityTotal Housing Inventory is up, Months of Supply Remains Balanced
PAGE 20
Source: Metrostudy
0
2
4
6
8
10
12
14
16
18
20
0
200
400
600
800
1,000
1,200
3Q05 3Q06 3Q07 3Q08 3Q09 3Q10 3Q11 3Q12 3Q13 3Q14 3Q15 3Q16 3Q17 3Q18
Mont
hs of
Supp
ly
Inven
tory U
nits
Total Housing Inventory
Total INV Months of Supply

Boulder County New Home ActivityFinished Vacant Home Inventory Months of Supply is Below Equilibrium
PAGE 21
Source: Metrostudy
1.6
0
1
2
3
4
5
6
7
8
9
10
11
12
0
50
100
150
200
250
300
350
400
450
3Q05 3Q06 3Q07 3Q08 3Q09 3Q10 3Q11 3Q12 3Q13 3Q14 3Q15 3Q16 3Q17 3Q18
Mon
ths o
f Sup
ply
Fini
shed
Vaca
nt U
nits
Finished Vacant Finished MOS

Boulder County New Home Activity64% of New Home Starts are Above $500k Base Price v. Denver Market 35% (All Housing)
PAGE 22
Source: Metrostudy
5.9%
9.2%
16.4%
18.4%
15.6%
18.1%
8.7%7.8%
3.1%
8.6%
6.8%
9.2% 8.6%
28.5%
19.1%
16.1%
0%
5%
10%
15%
20%
25%
30%
< $299 $300-$349 $350-$399 $400-$449 $450-$499 $500-$599 $600-$ 699 $700 +
Denver Metro Area
Boulder County

6.9%
24.7%
4.3%
2.2%
7.5%
21.7%20.4%
7.1%
1.8%
3.4%
13.9%
27.2%
0.2%
3.1% 2.7%
18.6%
25.2%
3.0% 3.3%2.9%
0%
5%
10%
15%
20%
25%
30%
% S
hare
of A
nnua
l Sta
rts by
Lot
Fron
tage
Denver Metro AreaBoulder County
Boulder County New Home ActivityAttached Product (41%) and 50-60’ lots (44%) Are the Predominant Size
PAGE 23
Source: Metrostudy
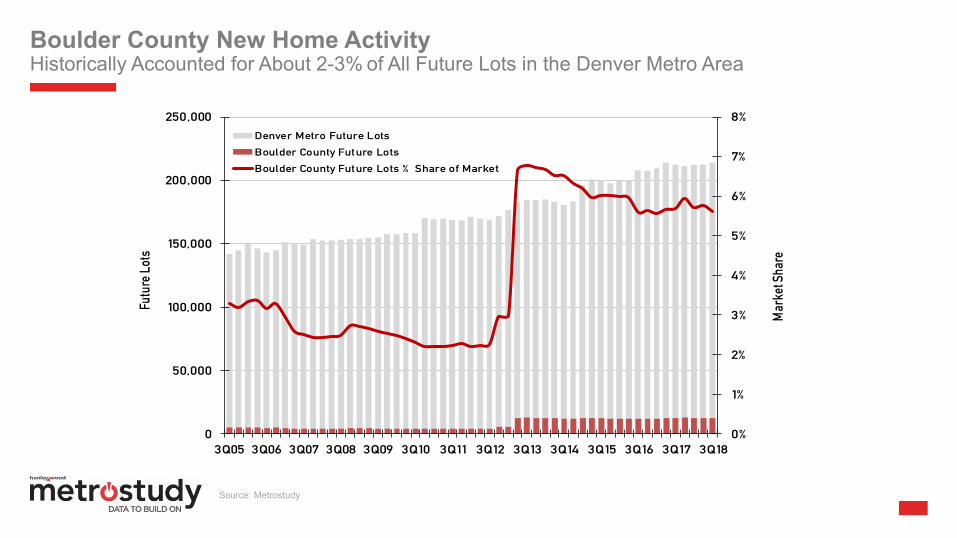
Boulder County New Home ActivityHistorically Accounted for About 2-3% of All Future Lots in the Denver Metro Area
PAGE 24
Source: Metrostudy
0%
1%
2%
3%
4%
5%
6%
7%
8%
0
50,000
100,000
150,000
200,000
250,000
3Q05 3Q06 3Q07 3Q08 3Q09 3Q10 3Q11 3Q12 3Q13 3Q14 3Q15 3Q16 3Q17 3Q18
Mar
ket S
hare
Futu
re Lo
tsDenver Metro Future LotsBoulder County Future LotsBoulder County Future Lots % Share of Market
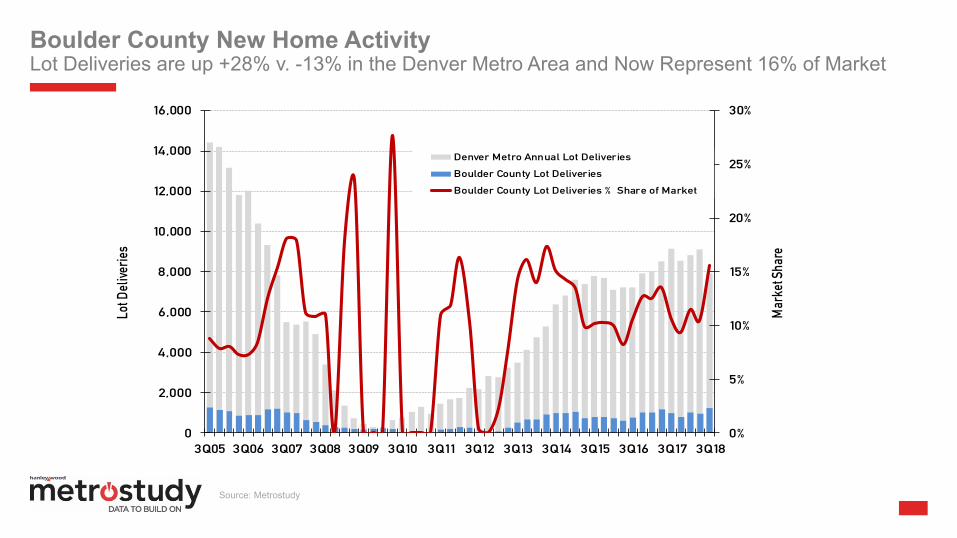
Boulder County New Home ActivityLot Deliveries are up +28% v. -13% in the Denver Metro Area and Now Represent 16% of Market
PAGE 25
Source: Metrostudy
0%
5%
10%
15%
20%
25%
30%
0
2,000
4,000
6,000
8,000
10,000
12,000
14,000
16,000
3Q05 3Q06 3Q07 3Q08 3Q09 3Q10 3Q11 3Q12 3Q13 3Q14 3Q15 3Q16 3Q17 3Q18
Mar
ket S
hare
Lot D
elive
ries
Denver Metro Annual Lot Deliveries
Boulder County Lot Deliveries
Boulder County Lot Deliveries % Share of Market
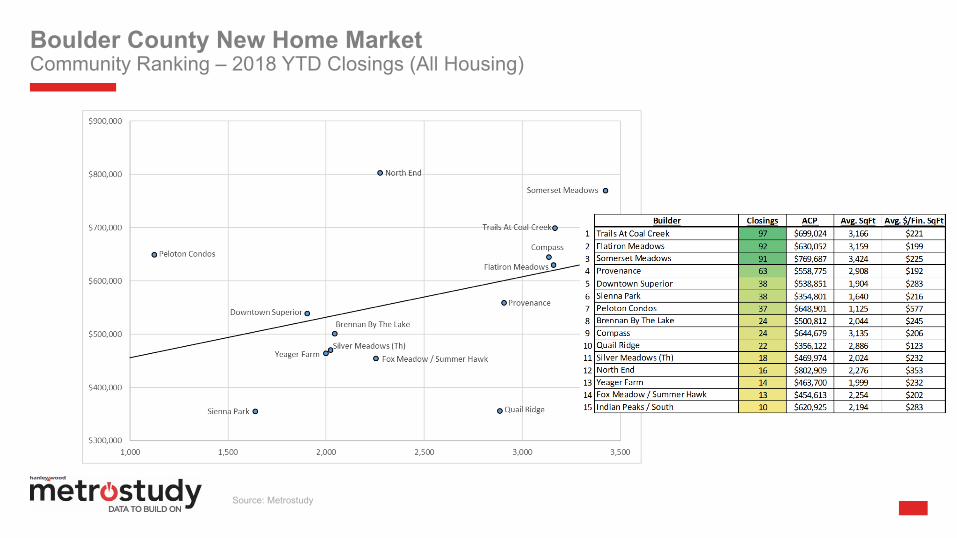
Boulder County New Home MarketCommunity Ranking – 2018 YTD Closings (All Housing)
PAGE 26
Source: Metrostudy

Boulder Housing Market
• High home prices coupled with rising mortgage rates have caused some market turbulence. Prospective buyers are recalibrating. Traffic and sales are down slightly in higher price points (generally), but Metrostudy expects housing demand to remain strong in 2019 and builders to start more homes.
• Fundamentals of Denver & Boulder economy remain very strong with steady in-migration, strong employment gains, low unemployment, healthy resale activity and low inventory. Denver’s population has grown by approximately 500,000 since 2008 fueling the undersupply of housing, thus creating opportunities for development for the next several years.
• Lot deliveries are up and vacant developed lot supplies are down, but with such strong demand to live in Boulder County, expect lot supplies to remain very tight for the foreseeable future.
• The market may have finally hit the price ceiling. But housing production should still grow in 2019. With the market ‘recalibrating’, now is the time to focus on the things you can control, not those you can’t:
ü Re-evaluate existing and future projects – a strong market has a way of covering up mistakes
ü Plan for continued product and price shifts – how are you communicating with your prospective buyers?
ü Look for operational efficiencies including internal, on-site, trade partners, etc. to combat margin compression
ü Re-evaluate and retrain sales team - complacency can erode sales and market share
3Q 2018 Conclusions
PAGE 27

28www.metrostudy.com
Thank You!Now you know…