Embed Size (px)
Citation preview
Assessing the Effects of Organizational Commitment and Job Satisfaction onTurnover: An Event History Approach
Scott D. Camp, Ph.D.Social Science Research Analyst
Office of Research and EvaluationFederal Bureau of Prisons
An earlier version of this paper was presented at the 1993 meeting of the American Society ofCriminology held in Phoenix, Arizona.
The contents of this paper do not necessarily reflect the positionof either the Department of Justice or the Federal Bureau of Prisons.
I would like to acknowledge the helpful criticisms provided by William G. Saylor and twoanonymous reviewers for The Prison Journal. Their suggestions definitely made this a stronger
presentation, although they certainly are not responsible for any remaining shortcomings. I assumethat responsibility.
Appears in The Prison Journal 74: 3: 279-305. Copyright owned by Sage Publications, Inc.

ABSTRACT
Turnover among correctional workers creates persistent staffing problems for correctional
administrators. The present research examines the effects of two types of subjective measurement
of the work environment, job satisfaction and organizational commitment, which are often
thought to be related to turnover. The study examines two separate aspects of organizational
commitment, commitment to the overall organization and commitment to the specific institution.
It is expected that both aspects of organizational commitment should have a greater effect on
turnover than job satisfaction. It is further hypothesized that commitment to the organization, in
this case the Bureau of Prisons, should have a greater impact on turnover than institutional
commitment.
The data for the study come from a subsample (N=3,608) of the 1991 Prison Social
Climate Survey administered annually since 1988 to employees of the Federal Bureau of Prisons.
The Climate data are supplemented with data from the Bureau’s personnel database. The richness
of the combined data sources allows for controlling relevant variables related in prior research to
turnover. Discrete-time event history models are used to analyze the data.
The analysis confirms that the measures of organizational commitment exert an inverse
relationship with turnover. That is, higher levels of organizational commitment are associated with
lower levels of turnover. The effects of the measures of organizational commitment are also
greater than that of job satisfaction which actually turns out to be nonsignificant. However, both
measures of organizational commitment exert about equal influence on turnover with commitment
to the Bureau of Prisons only slightly stronger.

1
Assessing the Effects of Organizational Commitment and Job Satisfaction on Turnover: An Event History Approach
Job satisfaction and organizational commitment receive considerable attention from
industrial and organizational psychologists, management scientists, and sociologists. Three
thousand studies had been done on job satisfaction alone by the time Locke prepared his study
nearly 20 years ago (Locke, 1976). Much of the interest in analyzing job satisfaction and
organizational commitment stems from concern for the behavioral consequences that are
hypothesized to result from job satisfaction and/or organizational commitment. Among other
topics, job satisfaction and/or organizational commitment have been shown or argued to be
related to productivity, attendance at work, turnover, retirement, participation, labor militancy,
sympathy for unions, and psychological withdrawal from work.
Analysts have also given much consideration to identifying, often with an eye to
manipulating, the antecedents of job satisfaction and organizational commitment (Loher, Noe,
Moeller, & Fitzgerald, 1985). In fact, most of the research conducted treats either job satisfaction
and/or organizational commitment as the ultimate dependent variable. The present study, though,
focuses on job satisfaction and organizational commitment as exogenous variables predicting an
outcome of theoretical and practical interest for organizational analysts, labor turnover.
Not all analysts, though, agree that either job satisfaction and organizational commitment
are useful for predicting organizationally relevant behavior, such as turnover. Hodson, for one,
argues that the concept of job satisfaction is severely flawed because “it lacks behavioral referents,
its connection with productivity is based on a naive theory of human behavior, it is too summary a
measure of workers’ complex cognitive structures, and it is too individualistic” (Hodson, 1991:

2
273). Hodson claims that commitment is a step in the right direction as it expresses behavioral
intentions (the intention to remain with the organization being primary), but it too suffers the
problems that beset job satisfaction. Hodson advocates moving away from research based on
attitudes to more behavioral research.
Even researchers who generally favor job satisfaction and/or organizational commitment
cannot agree on the relative merits of job satisfaction and organizational commitment for
explaining behavioral outcomes. Analysts often treat only one or the other in their analyses. Many
researchers place emphasis on organizational commitment rather than job satisfaction. Interesting
cross-cultural research has questioned the nature of the relationship between job satisfaction and
behavioral outcomes in the work place. Cole (1971) found that Japanese workers do not rate high
on measures of job satisfaction when compared to workers in other countries such as the U.S.
However, Japanese workers score “better” on the measures usually hypothesized to result from
higher levels of job satisfaction. Japanese workers have lower rates of absenteeism than American
workers, work longer hours on average, and seldom use all of their allotted vacation time. It has
been argued that such differences are due to higher levels of commitment by Japanese workers to
the economic success of their firms (Lincoln & Kalleberg, 1990).
Lincoln and Kalleberg (1990) hypothesize that differences in organizational commitment
of Japanese and American workers are due to differences in organizational structures and
strategies of Japanese and American firms rather than cultural differences in attitudes toward
work. While their results are not unequivocal, Lincoln and Kalleberg (1990) do generally find
support for their theoretical position that organizational commitment accounts for much of the
difference in organizational behavior noted between American and Japanese workers and that

3
organizational commitment is facilitated by differences in organizational structures and practices
among American and Japanese employers.
On the other hand, Roznowski and Hulin (1992) maintain that well constructed, validated
scales of job satisfaction are “the most informative data an organizational psychologist or manager
can have” for predicting organizationally relevant behavior in individuals. Roznowski and Hulin
maintain that low levels of job satisfaction create one (or a combination) of four types of
undesirable behavior. First, dissatisfied individuals may attempt to increase job outcomes by
stealing, using work time to pursue personal tasks, or by moonlighting. Second, they may
withdraw from the job psychologically as manifested in such behavior as not attending meetings,
drinking on the job, or wandering about trying to look busy. Third, dissatisfied employees may
practice behavioral withdrawal from the job as in absenteeism, turnover, or early retirement.
Finally, employees may undertake specific change behaviors that attempt to alter the work
situation. This may include remaining in a particular job and trying to affect changes through
union or other activity, or it may involve attempts to change the locus of the job through transfer
or demotion (Roznowski & Hulin, 1992: 126-130).
Most studies of the behavioral outcomes of organizational commitment (Randall, 1990:
371) and job satisfaction have focused on white collar, professional workers. The current study
expands the analysis to a wider spectrum of workers and helps address this imbalance while also
building upon the related research of those interested in the job satisfaction and organizational
commitment of workers employed in correctional settings (Saylor & Wright, 1992; Cullen, Link,
Wolf, & Frank, 1985; Jurik & Halemba, 1984; Jurik, Halemba, Musheno, & Boyle, 1987; Plecas
& Maxim, 1991; Rogers, 1991; Wright & Saylor, 1991). The present research extends previous

4
efforts by bringing together in one multivariate analysis an effort to control relevant
organizational, demographic, opportunity, behavioral, and related variables while simultaneously
assessing the contributions of organizational commitment and job satisfaction on turnover. The
data for the present study comes from a sample of correctional workers employed by the Federal
Bureau of Prisons at 65 locations across the United States.
DATA AND VARIABLES
The data for this analysis comes primarily from two sources. The source for the data
measuring workers attitudes about their jobs (e.g., job satisfaction and organizational
commitment) is the 1991 Prison Social Climate Survey (PSCS) developed by and collected under
the supervision of William G. Saylor of the Office of Research and Evaluation (ORE) at the
Federal Bureau of Prisons. Saylor (1984) describes the details involved in developing the PSCS.
Since 1988, ORE has conducted an annual survey using the PSCS to collect data about BOP
employees at correctional facilities in four primary areas: personal safety and security, quality of
life, personal well-being, and work environment.
In October of 1991, 9,340 Bureau of Prisons employees at 65 different locations were
administered one of four versions of the PSCS. To minimize the time burden on respondents, the
PSCS is divided into four versions with each version containing survey items on two of the four
primary areas of data collection. The number of items asked about each primary area does not
make it feasible to have respondents provide information in all four areas. The work environment
section used here, for example, contains 92 separate items. Which version of the PSCS staff
receive depends upon a combination of their birth month and day. For example, staff with an odd

1A comparison of the demographic characteristics of BOP employees employed in October of1991 and PSCS respondents is available from the author upon request.
5
birth month and odd day were given version 4. Staff with an odd birth month and even day
received version 3, and so on. This method produces a fairly even split of staff into four
categories, it is simple to administer, and there is no reason to suspect that it produces any biases.
Employees were assured that their responses are treated as confidential and were given
work time to complete the survey. Overall, 7,764 of those asked to participate in the 1991 PSCS
completed surveys for a response rate of 83%. The respondents generally reflect the demographic
profile of the population of BOP employees.1 Only versions 2 and 4 of the 1991 PSCS contain all
of the work environment items that are used in the analysis here. There are 3,918 respondents
who completed versions 2 and 4 in 1991.
The second source of data employed in the present study is the monthly JUNIPER
database created for internal use at the BOP from data collected and utilized by various BOP
offices (personnel and payroll being the primary sources relevant to the portions of the JUNIPER
data analyzed here). JUNIPER contains personnel and related information about all BOP
employees and is the source of much of the demographic information used in the present analysis.
The two data sets are merged by creating a matching code from demographic information
common to both data sets. Of the 3,918 BOP employees who responded to versions 2 and 4 of
the PSCS, 3,608 are matched to the corresponding information contained in the JUNIPER data
set. The 310 individuals who responded to the PSCS but cannot be matched to the JUNIPER data
do differ slightly from the matched respondents on key variables. Tests of differences in means on
the variables show only small actual differences (that are sometimes statistically significant

6
because of the large sample size). When coupled with the small number of nonmatches, the small
size of the differences in means between the matched and nonmatched respondents on key
variables does not appear to pose a significant threat to the validity of using the merged data
(Camp, 1992).
Dependent Variable
Turnover is the dichotomous dependent variable examined in this study. Turnover is
recorded for those respondents in the 1991 PSCS who voluntarily left the BOP between October
of 1991 and May of 1993 for reasons unrelated to retirement, sickness, dismissal, layoff, or any
other factor that involuntarily removed an employee from the labor force. Those who remained
with the BOP are treated as censored observations and receive a code of 0 as do those who left
the BOP for other reasons. The terms quits and resignations are also often used in the literature to
reference turnover (Price, 1977: 9). Information on employment histories of BOP employees, and
thus turnover, is recorded in the JUNIPER data set.
The turnover rate analyzed here reflects the turnover rate for all workers employed at
BOP correctional facilities. That does not mean that the turnover rate reflects the turnover rate
for all employees of the Federal Bureau of Prisons. The BOP has a large number of employees in
locations other than correctional facilities, primarily the Central Office in Washington, D.C. There
is another point to keep in mind about the turnover rate analyzed here. The measure of turnover
used here is similar to an instability rate as defined by other researchers (Price, 1977: 17). That is,
the rate that is being measured is the percentage of members at the beginning of a time period
who quit their jobs during that period. A turnover rate, or separation rate as it is also called, more

2Four variables were included in models not reported here to test for systematic influence ofself-selection. The variables controlled for the different response rates across region, securitylevel, institution, and sampling cell (of the stratified sampling design). None of the variablesattained significance indicating problems of self-selection. The results are available, upon request,from the author.
7
often refers to the number of members who left during a period of time taken as a proportion of
the average number of employees during the time period (Price, 1977: 15).
Independent Variables
The key independent variables of interest in the present study are organizational
commitment and job satisfaction. However, a number of other types of variables often identified
in the literature as important for understanding turnover and/or working conditions in correctional
facilities specifically are also introduced as controls. These include organizational characteristics,
economic opportunity for changing jobs, demographic characteristics, intended behavior, and
controls for geographic region.2
Organizational Commitment
Organizational commitment has been defined in various ways (Mowday, Porter, & Steers,
1982; Reichers, 1985). In the present study, organizational commitment refers to a congruence
between the goals of the individual and the organization whereby the individual identifies with and
extends effort on behalf of the general goals of the organization. Most previous research has
suggested that organizational commitment is more strongly related to turnover than is job
satisfaction (Koch & Steers, 1978; Parasuraman, 1982; Porter, Steers, Mowday, & Boulian,
1974; Steers, 1977). In a study of restaurant managers, though, DeCotiis and Summers (1987)
found job satisfaction to predict voluntary turnover more strongly than did organizational

3The factor analysis used the principal factors approach with quartimax rotation. Factor resultsavailable upon request from author.
8
commitment.
The Organizational Commitment Questionnaire (OCQ) developed by Porter et al. (1974)
is the most common method of assessing the type of organizational commitment utilized here. The
present study uses different items than those used in the OCQ. As with the OCQ, though, the
intent of the measures of organizational commitment used is to assess the identification of
respondents with the goals of the organization. Organizational commitment is measured at two
levels in this study. Organizational commitment is measured at an abstracted level of commitment
to the Bureau of Prisons and at a more concrete level of commitment to the institution in which
the respondent is currently employed. Commitment to the Bureau, BOPCOM, is a scale created
from five Likert items in the PSCS identified with factor analysis3 that tap respondents’ feelings
toward the Bureau (see Appendix A for a list of the items). The Cronbach α for BOPCOM is .88.
The institutional commitment scale, INSCOM, is created from three items from the PSCS (see
Appendix A). INSCOM has a Cronbach’s α of .80.
Policy at the Federal Bureau of Prisons is designed in such a manner that it should
produce more impact on commitment to the overall Bureau than commitment to individual
institutions, especially for middle and top supervisors. In order to integrate managers into the
BOP “family” and to give them broader experience and perspective with the operations of the
BOP, the BOP commonly transfers people to new locations when they are promoted. Karacki
(1982: 51) documents that for the correctional workers hired in 1963, of those who moved into
higher level positions with significantly higher grade and salary levels, they had moved an average

9
of 4.8 times as compared to an average of 0.5 moves for those that did not advance. At least part
of the reason for this policy of transferring individuals, though unstated, is that it thwarts
tendencies at “empire building” among field staff and helps keep field staff receptive to official
Bureau policies and procedures. The effect should be to promote commitment to the Bureau at
the expense of commitment to individual institutions.
Given the efforts of the BOP and the realization that commitment to the Bureau is a more
abstract measure of the acceptance of Bureau goals than institutional commitment, the following
relationships are expected.
Hypothesis 1: An inverse relationship is expected between both measures of commitment andturnover. That is, higher scores on commitment should lead to a lower probability of turnover.
Hypothesis 2: Commitment to the Bureau, BOPCOM, should be a stronger predictor of turnoverthan institutional commitment, INSCOM.
Hypothesis 3: Given previous research findings (Parasuraman, 1982), it is expected that bothmeasures of commitment will be stronger predictors of turnover than job satisfaction.
Job Satisfaction
Analysts often define job satisfaction with reference to the needs and values of individuals
and the extent to which these needs and values are satisfied in the work place. Such definitions
assume that the needs of individuals are fairly stable (there is often explicit or implicit reliance
upon Maslow’s hierarchy of needs) and that the characteristics of jobs are also fairly stable.
However, there have been those who have questioned the needs-satisfaction model and the
assumptions it is built upon (Hopkins, 1983: 20-21). For example, there has been little empirical
verification of a hierarchy of needs among individuals.
The present study does not rely directly upon a needs-satisfaction conceptualization of job
10
satisfaction. Instead, job satisfaction is more simply conceived of as the response of an individual
to the conditions of work as these perceptions are shaped by objective differences in work
conditions and different interpretations of the conditions.
Analysts typically argue that job satisfaction is multidimensional. The job setting is viewed
as being composed of different constituent parts with which an individual may be either satisfied
or dissatisfied. For example, the Job Descriptive Index developed by Smith, Kendall, and Hulin
(1969) breaks out the overall measure of job satisfaction into satisfaction with supervision,
satisfaction with co-workers, satisfaction with work, satisfaction with pay, and satisfaction with
promotion. Another commonly used measure, the Job Diagnostic Survey of Hackman and
Oldham (1975), maintains that job satisfaction is associated with five core dimensions— skill
variety, task identity, task significance, autonomy, and feedback from the job itself— as well as
two supplementary dimensions— feedback from agents and dealing with others.
Many analysts rely upon the judgement of individuals to give an overall assessment of job
satisfaction where other researchers compute composite measures of job satisfaction from the
different dimensions of the job identified as being important. Each approach has its strengths and
limitations. Measuring the different dimensions of job satisfaction directly allows for pinpointing
specific problem areas. For example, respondents may indicate that they are very satisfied with the
salary they receive but may be dissatisfied with other aspects such as quality of supervision. While
it is always possible to aggregate the individual components of job satisfaction into an overall
measure of job satisfaction, it is not possible to work in the reverse direction if only overall job
satisfaction is measured.
Allowing respondents to assess their overall job satisfaction also has its advantages. First,

11
overall measures of job satisfaction often correlate highly with composite measure of job
satisfaction. Also, creating a composite index of job satisfaction typically necessitates that the
researcher decide on how much weight to give to each individual component when indexing job
satisfaction. Asking a respondent for their overall impression of job satisfaction allows for the
respondent to mentally assess what the respondent feels are relevant dimensions in formulating a
response to the issue of job satisfaction. However, Hopkins notes that critics of facet-free
measures of job satisfaction due claim that they overestimate the degree of job satisfaction
(Hopkins, 1983: 23).
The present study relies upon an index measure of job satisfaction that is computed from
items that directly ask respondents how they feel about the overall nature of their job. The index
contains five Likert items from the PSCS that ask individuals about their overall assessment of
their job such as “My BOP job suits me very well” and “My BOP job is usually very interesting to
me” (see Appendix A for a list of all items.) The five items were originally developed for use with
members of the Air Force (Miller & Medalia, 1955), and the content of the items was modified to
be approriate for use with employees of the BOP. The Cronbach’s α for the job satisfaction index
is .83.
Given previous research, the following relationship is derived. However, it is important to
recall the contrary findings of DeCotiis and Summers (1987).
Hypothesis 4: It is expected that higher levels of job satisfaction will have an inverse impact uponturnover, but this effect will not be as strong as the effect noted for organizational commitment.
Other Work Environment Scales
The Bureau of Prisons collects information about other aspects of the work environment

12
in the Prison Social Climate Survey. While there are no strong theoretical reasons outlined in this
paper for including these measures in the present analysis, there is a strong pragmatic reason to
include them. Namely, the Bureau of Prisons uses these measures internally as part of ongoing
assessment of the performance of its institutions. The Bureau obviously places importance on
these measures, though not necessarily for assessing risk of turnover among staff. It is interesting
to see if any of these measures has a relationship with a very individual decision, the decision to
leave the job.
The scales included measure aspects of institutional/organizational operations (INSTOP),
satisfaction with supervision (SUPSAT), effectiveness in dealing with inmates (INMEFF), and job
stress (JOBSTRES). The items for the scales (presented in detail in Appendix A) were identified
with factor analysis. The Cronbach " for each of the scales is as follows: for INSTOP, .86; for
SUPSAT, .91; for INMEFF, .76; and for JOBSTRES, .86.
The institutional operations measure gets at the flexibility and effectiveness of the
organizational structure of the Bureau of Prisons. Satisfaction with supervision attempts to assess
how well the respondent feels his or her immediate supervisor is performing. Inmate effectiveness
addresses how competent the respondent feels in dealing with inmates. Job stress provides a
simple measure of stress on the job.
Behavioral Variables
Past behavior is often a very good guide to current behavior. A good indicator of past
behavior that may influence turnover is the number to times a person has already changed jobs.
However, that information is not available in the present study. Instead, a measure of intended
behavior is examined.

13
Turnover Intention
Intention to leave is measured by the item JOBLOOK in the PSCS where respondents are
asked to rate on a seven point scale from strongly disagree (coded 0) to strongly agree (coded 6)
the following item: “I am currently looking for or considering another job outside the BOP.”
Presumably, persons indicating they are actively looking for another job are more likely to leave
employment than those not looking for another job.
Economic Opportunity
One of the most commonly utilized measures of economic opportunity is the
unemployment rate. During periods of high unemployment, opportunities for finding alternative
employment are hypothesized to be low. Conversely, during periods of low unemployment, the
opportunities for alternative employment are increased (Muchinsky & Morrow, 1980; Price,
1977: 29-31).
Carsten and Spector (1987) performed a meta-analysis of published studies on the
relationship between turnover and job satisfaction and found that the relationship is influenced by
the unemployment rate. For studies that collected data during periods of high unemployment, the
relationship between job satisfaction and turnover is weaker than that reported in studies where
the data was collected in periods of low unemployment. They found the same pattern when
intention to turnover was treated as the endogenous variable instead of voluntary turnover. Hulin
et al. (1985), in a review of the literature that directly assessed the impact of unemployment rates
on turnover, found that studies that used the actual unemployment rate (whether for industry,
occupation, or geographical region) report strong relationships with intended and actual turnover.
The present study uses the official unemployment rate reported for the county in which the

14
Bureau of Prisons facilities are located as an indicator of economic opportunity. The county
unemployment data used in this study are those compiled by the Local Area Unit at the Bureau of
Labor Statistics. The unemployment rate is expected to exert a negative influence on voluntary
turnover. The unemployment rate is transformed by taking the logarithm of the rate. This is a
fairly common transformation for rate variables with a limited range of values.
Demographic Controls
Several variables are entered into the present analysis as “control” variables for
unmeasured concepts and processes. Past research (Parasuraman, 1982: 117) has demonstrated
that these “personal” variables account for a substantial proportion of the variance in behavioral
intention to turnover. Given this, the present study incorporate gender, age, education, salary,
union status, and job tenure as control variables.
Gender
It is practically a given for social scientists to include the variable gender in any research
conducted on groups containing both males and females. However, the processes that generate
differences between males and females are seldom fully specified or tested. The present study is
no exception and makes no predictions about the effect of gender on actual or intended turnover.
This topic is deserving of analytic treatment in its own right. Not only are the theoretical
perspectives for the effects of gender on turnover rates not fully developed, the empirical findings
are lacking as well. Price (1977: 39-40) notes that the findings on the effects of gender on
turnover rates are far from conclusive with studies finding females, males, or neither with higher
rates of turnover.
The research findings reported by Wright and Saylor (1991) on the perceptions of the

4Analyses, not reported in the present study, were also performed that restricted respondentsto those with 240 months or less of organizational tenure. While some coefficients changeslightly, the results are the same as those reported here allaying any concern that those withgreater than 240 months are biasing the analysis.
15
prison work environment suggest that there is little difference between men and women. These
findings are especially relevant since the Prison Social Climate Survey data were analyzed.
Age and Organizational Tenure
The strong and negative effects of age and organizational tenure on turnover are well
established in the literature (Morrow & McElroy, 1987; Parasuraman, 1982; Price, 1977). The
actual social processes, often conceptualized as career stages, that generate these relationships are
more controversial and are not the object of the present analysis. Given past research, though, it is
expected that age and organizational tenure will exert a strong, negative influence on turnover.
The square of organizational tenure is also included in the statistical models. It is expected that
the effect of organizational tenure becomes smaller at larger values of organizational tenure. In
fact, it is likely that the effects of tenure become positive at some point as most federal
correctional workers are eligible for complete retirement benefits after working 20 years.4
Education
Education is often argued to be an antecedent of both job satisfaction and organizational
commitment. Education may thus have an indirect effect on turnover through this process, though
Rogers (1991) did not find that education had a significant effect upon the job satisfaction of
correctional workers in his study. Education may have a direct impact on actual and intended
turnover in that higher levels of education, all else being equal, may provide greater opportunity
for changing jobs. Parasuraman (1982: 112) notes, though, that the effects of education on

5The largest racial group among the respondents to the 1991 Prison Social Climate Survey arewhite, 77.6%. Blacks comprise 14% of the sample, and other racial groups account for 8.4%. Adifferent coding of race was assessed in analyses not reported here. In them, race was coded withtwo dummy variables indicating black and other with whites serving as thecomparison group. This coding does not produce different results for race than does the simpledichotomization of white and other where other includes blacks.
16
turnover are not consistent in the literature. Price (1977: 35-36) claims that studies generally find
that education has a positive effect on turnover rates, but there are studies that report contrary
findings. As such, no hypothesis is actually advanced in this study that education should have a
positive relationship with turnover.
Race
The effects of race are controlled in the present study. It is not expected that race
contributes to turnover once the effects of the other variables in this study are controlled. Race is
measured as the respondents self-reported race in the PSCS. As used in this study, race indicates
the advantage/disadvantage of being white.5
Ethnicity
The effects of Hispanic ethnicity are controlled for in this study. As for race, it is not
expected that ethnicity adds to models of turnover in the presence of the other variables used in
the present study.
Salary
Higher levels of pay (or salary) are almost always found by those who study turnover to
exert a negative influence on turnover (Price, 1977: 68-70). However, salary is not expected to
exert an independent influence in the present study. Salary, as taken from the Juniper database, is
included in the following analysis to test this expectation.

17
Supervisory Status
Managerial status has been found to exert influence on turnover in previous studies.
Generally, managers have lower rates of turnover than do nonmanagers (Price, 1977: 37). In the
present study, an item asked in the PSCS allows for identification of people claiming supervisory
responsibility. Given previous research, it is expected that supervisory status should have a
negative influence on turnover.
Organizational Control Variables
Despite the commonality that all respondents work for and under the policies of the
Federal Bureau of Prisons, the organizational environment that employees of the BOP find
themselves in varies along key dimensions that may have impact upon the propensity to turnover.
Some of the variables that correctional practitioners often find to be important for various reasons
are security level (both institutional and inmate), misconduct rates, racial and ethnic composition
of the inmate population, gender of inmate population, size, and crowding levels. In this study,
only institutional security level and gender of the inmates at the facility are examined.
Institutional Security Level
An organizational variable that many correctional insiders believe affects work
environment is the security level of the institution. Put simply, the assumption is usually made that
it is much easier, safer, and more pleasant to work in a minimum security institution than a
maximum security institution. Even disregarding the characteristics of the inmate population, the
physical structure of maximum security institutions is more imposing and intimidating than that
found in lower security institutions. Karacki and Howell (1986), in an internal report prepared for
the BOP, found that turnover at Marion, the institution that took over from Alcatraz the function
6An interesting and surprising result reported in Karacki and Howell (1986) is thatpenitentiaries have a lower turnover rate than does the entire BOP. However, it is not clear thatKaracki and Howell partial out the effects of turnover in locations where there are no correctionalworkers. The Central Office of the BOP located in Washington, D.C. has a very high turnoverrate. The turnover rate is probably related both to the cost of living in the Washington, D.C. areaand the large number of non-law enforcement personnel employed there.
18
of housing the most dangerous and troublesome of BOP inmates, found that turnover increased
following serious crisis events such as escapes, assaults, and murders of staff. Since maximum
security institutions are likely to have more of these serious crisis events, it would seem that
working at a maximum security institution should have an effect on turnover.6
The Federal Bureau of Prisons ranks the institutional security level of an institution “based
on seven security features— the presence of external controls, gun towers, security barriers, or
detection devices; type of housing; internal security features; and the inmate-to-correctional
officer ratio, with each feature weighted in order of importance to institution security” (Federal
Bureau of Prisons, 1991: 4). Facilities are rated as minimum, low, medium, and high. There is also
an administrative designation. Administrative facilities are specialized institutions that deal with
specific functions (such as medical or psychiatric functions) and house inmates of different
security levels. Facilities 1991, published by the Bureau of Prisons, provides the source for
institutional security rankings.
Gender of Inmates
There is agreement among correctional practitioners that while the procedures for
incarcerating males and females inmates share many commonalities, each sex creates unique
correctional demands. Men, for example, are more prone to misconduct in prison, especially the
serious forms relating to assault and escape. Women, on the other hand, tend to make more
19
demands on staff in terms of requesting (and receiving) medical attention and involving
correctional staff in interpersonal relationships.
Given these differences in demands on staff in male and female facilities, it seems prudent
to control for whether the institution houses male, female, or a combination of inmates. It is not
clear, however, what the nature of the gender effect should be (if any) for turnover rates. The
gender characteristics of BOP facilities is taken from Facilities 1991 (Federal Bureau of Prisons,
1991).
Geographic Control Variables
Previous research on correctional workers has suggested that geographical factors may be
important (Philliber, 1987). Previous studies of correctional workers, with few exceptions (Plecas
& Maxim, 1991; Saylor & Wright, 1992; Wright & Saylor, 1991), though, are based on
geographically restricted samples. As such, it is not clear that the results of these studies can be
generalized to correctional workers outside of the geographical region in which they were
collected. The work done by Saylor and Wright, drawing upon the same data used here, is based
on a sample of correctional workers from a much broader geographical representation than other
work done on U.S. correctional workers, but it does not pay specific attention to testing for
regional differences. The same is also true of the work done by Plecas and Maxim on correctional
workers in Canada.
Region
The present study controls for region using the classification employed by the Bureau of
Prisons. The Bureau of Prisons is subdivided into six regions for administrative purposes with
each region headed by a regional director that reports to the Central Office in Washington, D.C.

20
The six regions are the Western Region, the North Central Region, the South Central Region, the
Northeast Region, the Mid-Atlantic Region, and the Southeast Region. The regionalization of the
Bureau of Prisons follows fairly closely with other regionalizations of the U.S. (Federal Bureau of
Prisons, 1991). No expectations are drawn for the different geographical regions.
California
In personal communications with managers at the Bureau of Prisons, the claim was put
forward to the author that there is a special problem of turnover among BOP correctional
workers in the state of California. The problem, as perceived by those at the BOP, is that
California pays its state correctional workers a more attractive wage than does the BOP. Many
correctional workers come to work for the BOP, receive training and experience as correctional
workers, and leave the BOP when a more lucrative job becomes available in the California state
system. To test for this effect, a dummy variable is created for the state of California. If the logic
of the BOP managers is correct and greater opportunities for correctional workers indeed exist in
California, the coefficient for the California dummy variable should be positive.
ANALYSIS AND RESULTS
Table 1 presents descriptive statistics for the variables used in this analysis. Only 4.7% of
the sample quit their job during the period of this study. This is a relatively low turnover rate. A
quarter of the sample are female. The Bureau of Prisons has taken steps in recent years to reverse
previous practice and open all jobs to women. Almost 78% of the respondents are white, or
conversely, over 22% are minority members. The workers at the Bureau of Prisons are relatively
well educated. Over 30% of the staff at the field locations have at least a Bachelors degree. By

7The data were also analyzed with Cox’s proportional hazards model, which modelscontinuous time, as implemented in the SAS PHREG procedure. Since there were ties in the timingof events, the exact ties-handling option was specified. The results do not differ substantially fromthe results presented here for the discrete time model, especially with respect to the key variablesof interest— BOP commitment, institutional commitment, and job satisfaction.
21
taking the antilogs of the values presented in Table 1, we see that average age of workers at the
Bureau of Prisons is 34, and workers earn $28,000 a year on average.
The results in Table 1 show that respondents give reasonably favorable ratings to the work
environment measures. On a scale with 6 representing the maximum value, commitment to the
BOP, commitment to the institution, and job satisfaction rate fairly high. Likewise, average rating
of satisfaction with supervision, institutional operations, and effectiveness in dealing with inmates
rate fairly well. The average response for looking for a job is low, indicating that the average
respondent does not put much effort into looking for other work. On the other hand, the relatively
high value for job stress may indicate a problematic area in the work environment.
Event history methods were used to analyze the data. The dependent variable is the hazard
rate for job turnover. A hazard rate is “the probability that an event will occur at a particular time
to a particular individual, given that the individual is at risk at that time” (Allison, 1984: 16). A
discrete time method is employed in which the logit of the hazard rate for turnover is modeled as
a linear function of the explanatory variables including tenure, the time dimension.7 The SAS
logistic regression procedure, LOGISTIC, is used to generate the estimated parameters. An
appropriate person-year data set was created for input into the logistic procedure by following the
techniques outlined in Allison (1984: 18-19) and Yamaguchi (1991: 21-26). All of the

8In a longitudinal design, collection of records for the members of the study group begins whenthe members enter into a period of risk for the event. In a study of turnover, the period of riskbegins when the study members are hired. In this study, a stratified proportional probabilitysample of those individuals employed by the Bureau of Prisons only in September of 1991 wasgenerated. That means that records of an unknown number of contemporaries of the current studygroup are missing from analysis because they terminated employment with the BOP prior toSeptember of 1991. Since we do not know when or how many terminated employment during thisearlier period, it is best to analyze information only for the periodfollowing September of 1991. This does not create any bias (see Allison 1984: 56-57).
So, for example, a member of the current study with 10 years of tenure only contributes “personyear” (monthly) observations to the data set for the period between October of 1991 and May of1993. That person does not contribute monthly observations, primarily on the effects of tenureand age, for the period prior to September of 1991.
9The term “person-year” is typically used in event history parlance. In this study, individualscontribute observations to the data set on a monthly basis until either they experience the event ofinterest (turnover) or are censored.
22
observations in this study are left truncated by the study design,8 so none of the individuals begin
contributing person-year observations9 to the final data set until the time in their careers at which
the survey was administered to them. As Guo (1993) notes, this confluence of procedures allows
for the estimation of a conditional partial likelihood model.
Table 2 presents results for two models. Model 1 considers the commitment and job
satisfaction variables without any controls other than job tenure and the squared value of job
tenure. Job tenure is the major time variable of the present study. Model 2 assesses the effects of
the commitment variables and job satisfaction when the other variables identified in this study as
appropriate controls are entered simultaneously into the model.
The results presented for Model 1 generally conform to Hypotheses 1 through 4. As
predicted in Hypothesis 1, both BOP commitment and institutional commitment are inveresely,
and significantly, related to the hazard rate for turnover. Hypothesis 2 suggested that BOP

23
commitment would have a larger effect on turnover than institutional commitment. The results for
Model 1 do not bear out this hypothesis. The unstandardized coefficient for BOPCOM, -0.181, is
slightly larger than the coefficient for INSCOM, -0.151. However, the standardized coefficients
(not reported in Table 2) for the two variables are virtually identical at -0.121043 for BOPCOM and
-0.121776 for INSCOM. While the coefficient for job satisfaction is negative, as expected in
Hypothesis 4, the effect is not statistically signficant. As expected in Hypothesis 3, then, both
organizational and institutional commitment are more strongly related to turnover than is job
satisfaction.
The same general relationships identified in Model 1 are present in the results for Model 2
where other control variables enter the model. All of the key variables, BOP commitment,
institutional commitment, and job satisfaction are inveresly related to the hazard rate for turnover.
Once again, the effects of BOP commitment and organizational commitment are statistically
significant and larger than the effect of job satisfaction. The effect of job satisfaction is not only
weak, as in Model 1, it does not attain statistical significance. In Model 2, the effect of BOP
commitment does appear to be slightly larger than institutional commitment. This is true even
when the standardized coefficients are examined. The standardized coefficient (not reported in
Table 2) for BOPCOM is -0.134, and for INSCOM it is
-0.106.
The difference between the effects of BOP commitment and institutional commitment is
not large enough to matter much substantively. An increase of one unit on the institutional
commitment scale lowers the hazard of turnover by a little over 12%. Likewise, each unit increase
on the commitment to the Bureau scale decreases the turnover hazard by around 18%. So, even
24
though the BOP commitment variable exhibits a stronger influence than institutional commitment,
the difference in magnitude is not large.
None of the other work environment scales used by the Bureau of Prisons (INSTOP,
SUPSAT, INMEFF, and JOBSTRES) show a significant relationship with turnover.
The variable measuring whether a person is looking for a job outside of the BOP
(JOBLOOK), the measure of intended behavior in this study, has no statistically significant impact
on the hazard for turnover. Likewise, the measure of economic opportunity (LOGUNEMP), the
logarithm of county unemployment rate, does not have a significant impact on turnover.
The other control variables in Model 2 display some interesting results. Several of the
demographic control variables have signficant impacts on turnover. Being female (GENDER) has a
significant impact on turnover. The hazard rate of turnover among females is 57% higher than the
hazard rate for males. Age and tenure also have significant effects. Older individuals are at lower
risks of turnover than younger individuals all other things equal. According to the results of
Model 2, a 1% increase in age means a 2.1% decrease in the hazard for turnover. The effect of
tenure is also negative, meaning that longer organizational tenure decreases the hazard of
turnover, although the results of Model 2 demonstrate that the effect of tenure is not linear. The
positive coefficient for the tenure squared variable means that the negative effect of an additional
month of tenure on turnover gets smaller at larger values of tenure. At month 369, the effect of
tenure becomes positive. However, practically all BOP employees retire before they reach 369
months (almost 31 years) of organizational tenure. Salary has an unexpected impact on turnover.
A 1% increase in salary is associated with a 1.36% increase in the hazard rate for turnover. This is
contrary to previous findings.

10An area of controversy in interpreting logistic regression results involves constructing ameasure analagous to R2 in ordinary least squares regression to assess goodness of fit. Onemeasure often reported constructs R2
L (the L indicates a result derived by logistic procedures)using the following relationship that is known to exist in OLS regression:
R2 . 100(L0 - Lp)/L0 = 100(1 - Lp/L0)
L0 refers to the log-likelihood for the model containing only an intercept term, and Lp referencesthe log-likelihood for a model containing p covariates (Hosmer & Lemeshow, 1989: 148).Hosmer and Lemeshow (1989: 149) warn that this measure of R2 is simply an expression of thelikelihood ratio test instead of being a true measure of goodness of fit. Even though theyrecommend against its use, it does have intuitive appeal to many analysts and is presented here.As seen for Model 2 in Table 2, the R2
L is fairly low at 6.84%.
25
The other demographic variables included in Model 2 do not have a significant impact on
turnover. Education (EDUC), race (RACE), hispanic ethnicity (ETHNIC), and supervisory status
(SUPERVIZ) all fail to affect the hazard rate in a statistically significant manner.
The coefficients for the organizational variables included in Model 2 to control for different types
of prison working environments do show some effect. Respondents at low security institutions
have a hazard rate almost 40% higher than the mean for all institutions. Workers at medium and
high security institutions, on the other hand, appear to be at lower risk of turnover, although this
finding is not statistically significant. These findings are somewhat contrary to the common sense
notion that higher security level institutions have less desirable work environments and should
therefore have higher turnover among staff.
The coefficients for the regional variables suggest that the hazard of turnover is significantly
different in the Southeast and Western Regions. Workers in the Southeast Region have a hazard
rate only 59% that of workers in all regions. Workers in the Western Region, on the other hand,
have a hazard rate almost 57% higher. The other regions do not differ from the group mean in a
significant fashion.10

26
DISCUSSION
The results of this study generally support the hypotheses forwarded concerning the
effects of organizational commitment and job satisfaction on job turnover. Organizational
commitment, as measured by both commitment to the overall organization and the more specific
institution, is inversely related to turnover among correctional workers at the Federal Bureau of
Prisons. The job satisfaction scale, as expected, does not exhibit the same type of relationship with
turnover. In fact, job satisfaction does not even demonstrate a significant relationship with
turnover. The results fail to demonstrate a substantively stronger effect for commitment to the
Bureau as had been expected.
The findings reported here regarding the relative importance of organizational
commitment measures vis-á-vis job satisfaction certainly support the sociological position put
forward by Lincoln and Kalleberg (1990). That is, institutions, including correctional institutions,
may get the most bang for their buck by strengthening organizational strategies that promote
commitment. Exactly what those strategies are has not been the focus of this study, but they
should be further investigated in future research, especially as they pertain to correctional settings.
For example, one of the most commonly noted strategies for developing organizational
commitment in Japanese firms is basing part of workers’ compensation on the performance of the
work unit. In contrast, BOP employees receive almost all of their compensation from traditional
salary. BOP employees are, however, eligible for bonus pay for exceptional service. It would be
interesting to know how this individually based bonus system affects organizational commitment,
especially in comparison to more collectively based schemes.

27
The finding that BOP commitment and institutional commitment have approximately the
same effect on turnover also requires clarification. While the results from factor analysis (not
reported here) suggest that these are indeed two separate components of organizational
commitment, they certainly behave similarly when turnover is the object of examination. It would
be interesting to examine if they behave similarly if other outcome measures, such as performance
or use of sick leave, are examined.
Given the findings of this study on organizational commitment, there would seem to be no
reason to encourage the development of one form of organizational commitment among
employees over the other. Historically, though, the BOP has tended to discourage too much
attachment to individual facilities in an effort to broaden the scope of their managers and to
thwart any tendencies toward empire building.
The results found for the organizational variables, which are intended to measure
contextual effects of the work environment, are somewhat surprising. The simplistic notion that
high security institutions are associated with less satisfying working conditions which in turn lead
to turnover is simply not supported. It is necessary to refine the theory surrounding working
conditions at institutions of different security levels to understand what the effects might be on
outcomes like turnover. As noted previously, some aspects of the work load at maximum security
institutions (especially processing inmates in and out) are lower. Perhaps this helps offset the
more control oriented working environment of a penitentiary. Some very important theoretical
and empirical research needs to be performed to tease out the characteristics of working at
different types of institutions with different types of inmates. Likewise, why there should be any
regional effects needs to be investigated.

28
The effects of organizational tenure and age need to be better conceptualized. The
surprising finding for income, where higher income produces greater risk of turnover, needs to be
examined in greater detail. Since higher paid individuals are typically those with the most
experience and skills, the finding for income may reflect unmeasured aspects of these variables.
None of the topics for further research, though, is more deserving of further investigation
than the differences between males and females concerning the hazard of turnover. The factors
influencing turnover may differ substantially for females and males. It is also likely that models for
turnover need to consider more carefully and consistently variables linked to processes outside of
the work environment. For example, family obligations are probably significantly related to
turnover decisions, especially for females who continue to bear the brunt of responsibility for
household and child care tasks in contemporary U.S. society.
CONCLUSION
Hodson argues that attitudinal measures are severely flawed, and that research should
move away from this emphasis. The present study, as do others, suggests that this is too strong a
claim. Organizational commitment was found to be a significant predictor of organizationally
relevant behavior, in this case, turnover. This certainly lends support to the position of those such
as Lincoln and Kalleberg (1990) who argue for the importance of organizational commitment.
Conversely, there was no evidence from this study of workers in one public sector agency that job
satisfaction has any effect on voluntary turnover.
Hodson is correct in that even when combined with the other relevant control variables,
the explanatory power of the models containing organizational commitment is fairly low. Of
29
course, it should be kept in mind that organizational commitment was typically measured months
before the respondents actually quit work at the BOP. The temporal stability of the attitudinal
measures was never assessed directly in this study. Also, the explanatory power of models of
individual level behavior are generally lower than models of aggregate behavior. Even so, the
results of this and related studies suggest that even though we have additional insight about the
theoretical relevance of organizational commitment, we still do not seem to understand much
about the processes that generate turnover.
Future research on organizational commitment in correctional settings should examine the
factors that contribute to positive assessments of organizational commitment. In particular,
emphasis should be given to identifying those factors that can be manipulated by the organization
to help produce equity in risk of turnover among all employees.

30
Appendix AQuestionnaire Items in the PSCS Used to Create Work Environment Scales
BOPCOM†: Commitment to the Bureau is composed of the following 5 items from the work environment sectionof the Prison Social Climate Survey (PSCS).
1. I have a good opinion of the BOP most of the time.2. Most of the time the BOP is run very well.3. I am usually satisfied with the BOP.4. The BOP is better than any of the other correctional agencies (e.g., State).5. If I remain in corrections, I would prefer to remain the BOP.
INSCOM†: Commitment to the Institution is composed of the following 3 items from the work environmentsection of the PSCS.
1. This facility is the best in whole BOP.2. I would rather be stationed at this facility than any other I know about.3. I would like to continue to work at this facility.
JOBSAT†: Job Satisfaction is composed of the following 5 individual items from the work environment section ofthe PSCS.
1. I would be more satisfied with some other job at this facility than I am with my present job.2. My BOP job is usually interesting to me.3. My BOP job suits me very well.4. My BOP job is usually worthwhile.5. If I have a chance, I will change to some other job at the same rate of pay at this facility.
Note: The negatively oriented items (#1 and #5) are reversed in order to combine them with the other positivelyoriented items.
INSTOP†: Institutional/Organizational Operations is composed of the following 10 items from the workenvironment section of the PSCS.
1. The information I get through formal communications channels helps me to perform my job effectively.2. In the BOP, it is often unclear who has the formal authority to make a decision.3. It's really not possible to change things in the institution.4. I am told promptly when there is a change in policy, rules, or regulations that affects me.5. I have the authority I need to accomplish my work objectives.6. Employees do not have much opportunity to influence what goes on in the BOP.7. Under the present system, promotions are seldom related to employee performance.8. Management at this institution is flexible enough to make changes when necessary.9. In the BOP, authority is clearly delegated.10. In general, this institution is run very well.
Note: The negatively oriented items (#2, 3, 6, and 7) are reversed in order to combine them with the positivelyoriented items.

31
SUPSAT†: Satisfaction with Supervision is composed of the following 10 individual items in the workenvironment section of the PSCS.
1. My supervisor engages me in the planning process, such as developing work methods and procedures for my job.2. My supervisor gives me adequate information on how well I am performing.3. My supervisor asks my opinion when a work-related problem arises.4. I have a great deal of say over what has to be done on my job.5. On my job, I know what my supervisor expects of me.6. The standards used to evaluate my performance have been fair and objective.7. The information I receive about my performance usually comes too late for it to be of any use to me.8. My last annual performance rating presented a fair and accurate picture of my actual job performance.9. My own hard work will lead to recognition as a good performer.10. I often receive feedback from my supervisor for good performance.
Note: The negatively oriented item #7 is reversed in order to combine it with the positively oriented items.
INMEFF†: Effectiveness in dealing with inmates is composed of the following 4 items in the work environmentsection of the PSCS.
1. An ability to deal very effectively with the problems of inmates.2. A feeling that you are positively influencing other people's lives through your work.3. A feeling of accomplishment after working closely with inmates.4. A feeling that you can easily create a relaxed atmosphere with inmates.
JOBSTRES‡: Job Stress is composed of the following 6 individual items in the work environment section of thePSCS.
1. A feeling that you have become harsh toward people since you took this job.2. A feeling of worry that this job is hardening you emotionally.3. A feeling of being emotionally drained at the end of the workday.4. A feeling that you treat some inmates as if they were impersonal objects.5. A feeling that working with people all day is really a strain for you.6. A feeling of being fatigued when you get up in the morning and have to face another day on the job.
†The items for this scale are measured on a 7 point Likert scale: strongly disagree (coded 0), disagree, somewhatdisagree, undecided, somewhat agree, agree, and strongly agree (coded 6).
‡The items for this scale are measured on a 7 point Likert scale: never (coded 0), very rarely, rarely, now and then,often, very often, and all the time (coded 6).

32
References
Allison, P. (1984). Event History Analysis: Regression for Longitudinal Event Data. Newbury
Park, CA: Sage.
Camp, S. D. (1992). Documentation of the Procedures for Creating the Merged Climate-Juniper
Data Set. Unpublished Research Report. Federal Bureau of Prisons.
Carsten, J. M., & Spector, P. E. (1987). Unemployment, Job Satisfaction, and Employee
Turnover: A Meta-Analytic Test of the Muchinsky Model. Journal of Applied Psychology,
72(3), 374-381.
Cole, R. E. (1971). Japanese Blue Collar: The Changing Tradition. Berkeley: University of
California Press.
Cullen, F. T., Link, B. G., Wolf, N. T., & Frank, J. (1985). The Social Dimensions of
Correctional Officer Stress. Justice Quarterly, 2(4), 507-533.
DeCotiis, T. A., & Summers, T. P. (1987). A Path Analysis of a Model of the Antecedents and
Consequences of Organizational Commitment. Human Relations, 40(7), 445-470.
Federal Bureau of Prisons (1991). Facilities 1991. Washington, D.C.: U.S. Department of Justice.
Guo, G. (1993). Event-History Analysis for Left-Truncated Data. In P. V. Marsden (Eds.),
Sociological Methodology (pp. 217-243). Cambridge, MA: Blackwell Publishers.
Hackman, J. R., & Oldham, G. R. (1975). Development of the Job Diagnostic Survey. Journal of
Applied Psychology, 60(2), 159-170.
Hodson, R. (1991). Workplace Behaviors: Good Soldiers, Smooth Operators, and Saboteurs.
33
Work and Occupations, 18(3), 271-290.
Hopkins, A. (1983). Work and Job Satisfaction in the Public Sector. Totowa, NJ: Rowman and
Allanheld.
Hosmer, D. W., & Lemeshow, S. (1989). Applied Logistic Regression. New York: John Wiley &
Sons.
Hulin, C. L., Roznowski, M., & Hachiya, D. (1985). Alternative Opportunities and Withdrawal
Decisions: Empirical and Theoretical Discrepancies and an Integration. Psychological
Bulletin, 97(2), 233-250.
Jurik, N. C., & Halemba, G. J. (1984). Gender, Working Conditions and the Job Satisfaction of
Women in a Non-Traditional Occupation: Female Correctional Officers in Men's Prisons.
Sociological Quarterly, 25, 551-566.
Jurik, N. C., Halemba, G. J., Musheno, M. C., & Boyle, B. V. (1987). Educational Attainment,
Job Satisfaction, and the Professionalization of Correctional Officers. Work and
Occupations, 14(1), 106-125.
Karacki, L. (1982). Class of ’63: Career Patterns of Federal Prison Correctional Officers Who
Entered Service During 1963. Federal Probation, 46(3), 49-53.
Karacki, L., & Howell, S. (1986). An Examination of Staff Turnover Rates for USP Marion:
1972-1985. Unpublished Research Report. Federal Bureau of Prisons.
Koch, J. D., & Steers, R. M. (1978). Job Attachment, Satisfaction, and Turrnover among Public
Sector Employees. Journal of Vocational Behavior, 12, 119-128.
Lincoln, J. R., & Kalleberg, A. L. (1990). Culture, Control, and Commitment: A Study of Work
Organization and Work Attitudes in the United States and Japan. New York: Cambridge

34
University Press.
Locke, E. A. (1976). The Nature and Causes of Job Satisfaction. In M. D. Dunnette (Eds.),
Handbook of Industrial and Organizational Psychology (pp. 1297-1349). Chicago: Rand
McNally.
Loher, B. T., Noe, R. A., Moeller, N. L., & Fitzgerald, M. P. (1985). A Meta-Analysis of the
Relation of Job Characteristics to Job Satisfaction. Journal of Applied Psychology, 70(2),
280-289.
Miller, D. C., & Medalia, N. Z. (1955). Efficiency, Leadership, and Morale in Small Military
Organizations. Sociological Review, 3, 93-107.
Morrow, P. C., & McElroy, J. C. (1987). Work Commitment and Job Satisfaction over Three
Career Stages. Journal of Vocational Behavior, 30, 330-346.
Mowday, R. T., Porter, L. W., & Steers, R. M. (1982). Employee-Organization Linkages: The
Psychology of Commitment, Absenteeism, and Turnover. New York: Academic Press.
Muchinsky, P. M., & Morrow, P. C. (1980). A Multidisciplinary Model of Voluntary Employee
Turnover. Journal of Vocational Behavior, 17, 263-290.
Parasuraman, S. (1982). Predicting Turnover Intentions and Turnover Behavior: A Multivariate
Analysis. Journal of Vocational Behavior, 21, 111-121.
Philliber, S. (1987). Thy Brother’s Keeper: A Review of the Literature on Correctional Officers.
Justice Quarterly, 4(1), 9-37.
Plecas, D., & Maxim, P. (1991). Correctional Officer Career Development Study: A Six-Year
Longitudinal Study of 527 Correctional Officer Recruits Hired by the Correctional Service
of Canada in 1984 and 1985. Correctional Service of Canada.

35
Porter, L. W., Steers, R. M., Mowday, R. T., & Boulian, P. V. (1974). Organizational
Commitment, Job Satisfaction and Turnover Among Psychiatric Technicians. Journal of
Applied Psychology, 59(5), 603-609.
Price, J. L. (1977). The Study of Turnover. Ames, IA: The Iowa State University Press.
Randall, D. M. (1990). The Consequences of Organizational Commitment: Methodological
Investigation. Journal of Organizational Behavior, 11, 361-378.
Reichers, A. E. (1985). A Review and Reconceptualization of Organizational Commitment.
Academy of Management Review, 10(3), 465-476.
Rogers, R. (1991). The Effects of Educational Level on Correctional Officer Job Satisfaction.
Journal of Criminal Justice, 19(2), 123-137.
Roznowski, M., & Hulin, C. (1992). The Scientific Merit of Valid Measures of General
Constructs with Special Reference to Job Satisfaction and Job Withdrawal. In C. J.
Cranny, P. C. Smith, & E. F. Stone (Eds.), Job Satisfaction: How People Feel about Their
Jobs and How it Affects Their Performance (pp. 123-163). New York: Lexington Books.
Saylor, W. G. (1984). Surveying Prison Environments. Unpublished Research Report. Federal
Bureau of Prisons.
Saylor, W. G., & Wright, K. N. (1992). Status, Longevity, and Perceptions of the Work
Environment among Federal Prison Employees. Journal of Offender Rehabilitation,
17(3/4), 133-160.
Smith, P. C., Kendall, L. M., & Hulin, C. L. (1969). The Measurement of Satisfaction in Work
and Retirement: A Strategy for the Study of Attitudes. Chicago: Rand McNally.
Steers, R. M. (1977). Antecedents and Outcomes of Organizational Commitment. Administrative

36
Science Quarterly, 22(1), 46-56.
Wright, K. N., & Saylor, W. G. (1991). Male and Female Employees’ Perceptions of Prison
Work: Is There a Difference. Justice Quarterly, 8(4), 505-524.
Yamaguchi, K. (1991). Event History Analysis. Newbury Park, CA: Sage.
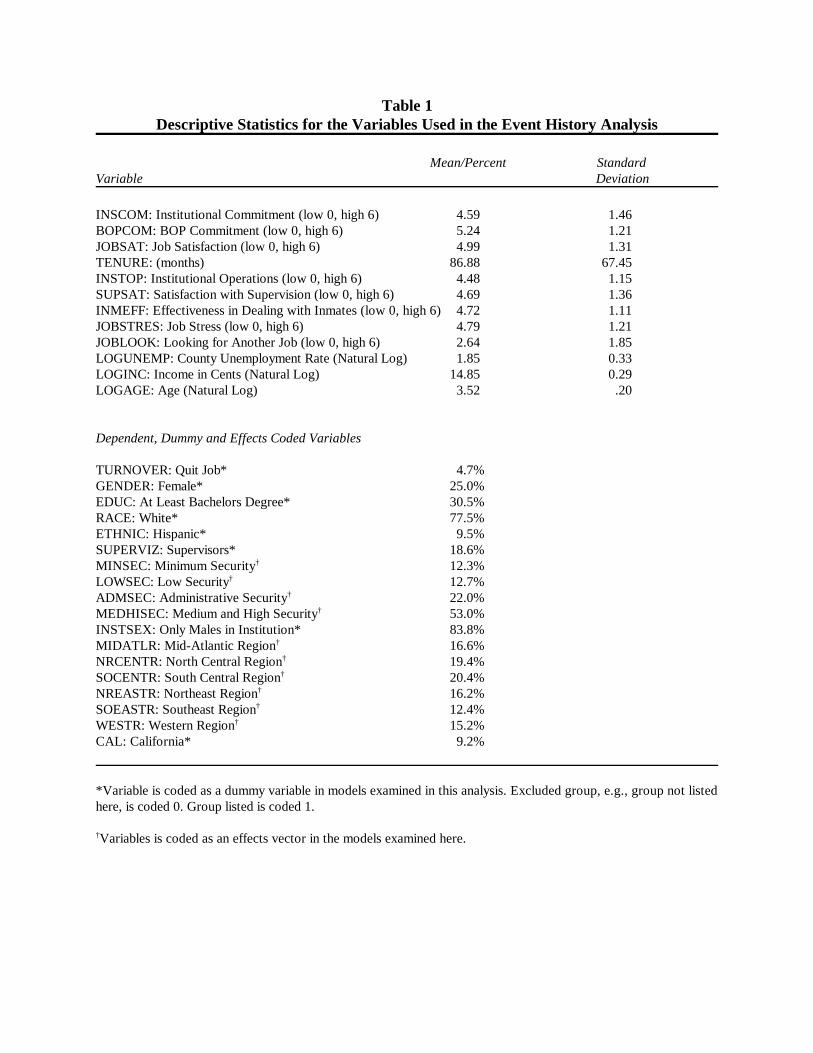
Table 1Descriptive Statistics for the Variables Used in the Event History Analysis
Mean/Percent StandardVariable Deviation
INSCOM: Institutional Commitment (low 0, high 6) 4.59 1.46BOPCOM: BOP Commitment (low 0, high 6) 5.24 1.21JOBSAT: Job Satisfaction (low 0, high 6) 4.99 1.31TENURE: (months) 86.88 67.45INSTOP: Institutional Operations (low 0, high 6) 4.48 1.15SUPSAT: Satisfaction with Supervision (low 0, high 6) 4.69 1.36INMEFF: Effectiveness in Dealing with Inmates (low 0, high 6) 4.72 1.11JOBSTRES: Job Stress (low 0, high 6) 4.79 1.21JOBLOOK: Looking for Another Job (low 0, high 6) 2.64 1.85LOGUNEMP: County Unemployment Rate (Natural Log) 1.85 0.33LOGINC: Income in Cents (Natural Log) 14.85 0.29LOGAGE: Age (Natural Log) 3.52 .20
Dependent, Dummy and Effects Coded Variables
TURNOVER: Quit Job* 4.7%GENDER: Female* 25.0%EDUC: At Least Bachelors Degree* 30.5%RACE: White* 77.5%ETHNIC: Hispanic* 9.5%SUPERVIZ: Supervisors* 18.6%MINSEC: Minimum Security† 12.3%LOWSEC: Low Security† 12.7%ADMSEC: Administrative Security† 22.0%MEDHISEC: Medium and High Security† 53.0%INSTSEX: Only Males in Institution* 83.8%MIDATLR: Mid-Atlantic Region† 16.6%NRCENTR: North Central Region† 19.4%SOCENTR: South Central Region† 20.4%NREASTR: Northeast Region† 16.2%SOEASTR: Southeast Region† 12.4%WESTR: Western Region† 15.2%CAL: California* 9.2%
*Variable is coded as a dummy variable in models examined in this analysis. Excluded group, e.g., group not listedhere, is coded 0. Group listed is coded 1.
†Variables is coded as an effects vector in the models examined here.
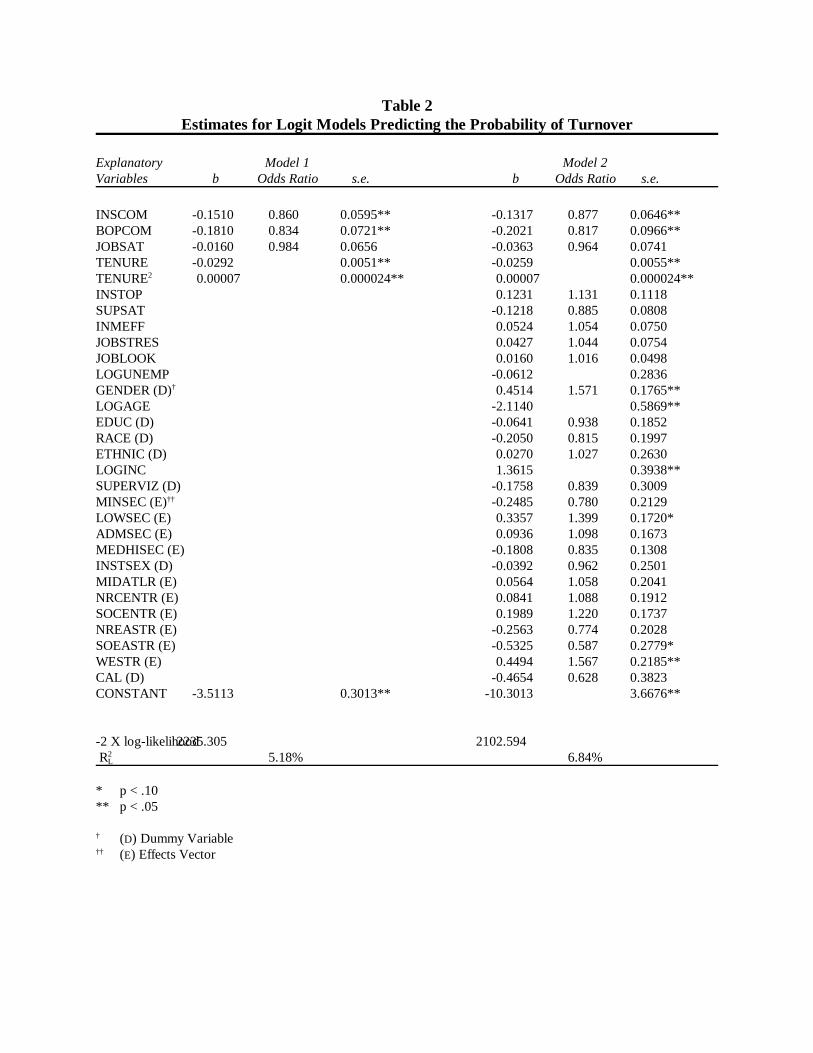
Table 2Estimates for Logit Models Predicting the Probability of Turnover
Explanatory Model 1 Model 2Variables b Odds Ratio s.e. b Odds Ratio s.e.
INSCOM -0.1510 0.860 0.0595** -0.1317 0.877 0.0646**BOPCOM -0.1810 0.834 0.0721** -0.2021 0.817 0.0966**JOBSAT -0.0160 0.984 0.0656 -0.0363 0.964 0.0741TENURE -0.0292 0.0051** -0.0259 0.0055**TENURE2 0.00007 0.000024** 0.00007 0.000024**INSTOP 0.1231 1.131 0.1118SUPSAT -0.1218 0.885 0.0808INMEFF 0.0524 1.054 0.0750JOBSTRES 0.0427 1.044 0.0754JOBLOOK 0.0160 1.016 0.0498LOGUNEMP -0.0612 0.2836GENDER (D)† 0.4514 1.571 0.1765**LOGAGE -2.1140 0.5869**EDUC (D) -0.0641 0.938 0.1852RACE (D) -0.2050 0.815 0.1997ETHNIC (D) 0.0270 1.027 0.2630LOGINC 1.3615 0.3938**SUPERVIZ (D) -0.1758 0.839 0.3009MINSEC (E)†† -0.2485 0.780 0.2129LOWSEC (E) 0.3357 1.399 0.1720*ADMSEC (E) 0.0936 1.098 0.1673MEDHISEC (E) -0.1808 0.835 0.1308INSTSEX (D) -0.0392 0.962 0.2501MIDATLR (E) 0.0564 1.058 0.2041NRCENTR (E) 0.0841 1.088 0.1912SOCENTR (E) 0.1989 1.220 0.1737NREASTR (E) -0.2563 0.774 0.2028SOEASTR (E) -0.5325 0.587 0.2779*WESTR (E) 0.4494 1.567 0.2185**CAL (D) -0.4654 0.628 0.3823CONSTANT -3.5113 0.3013** -10.3013 3.6676**
-2 X log-likelihood2235.305 2102.594 R2
L 5.18% 6.84%
* p < .10** p < .05
† (D) Dummy Variable†† (E) Effects Vector