Embed Size (px)
Citation preview

Facts Monthly fund analysis and market reviews
Figures inApril 2018
2
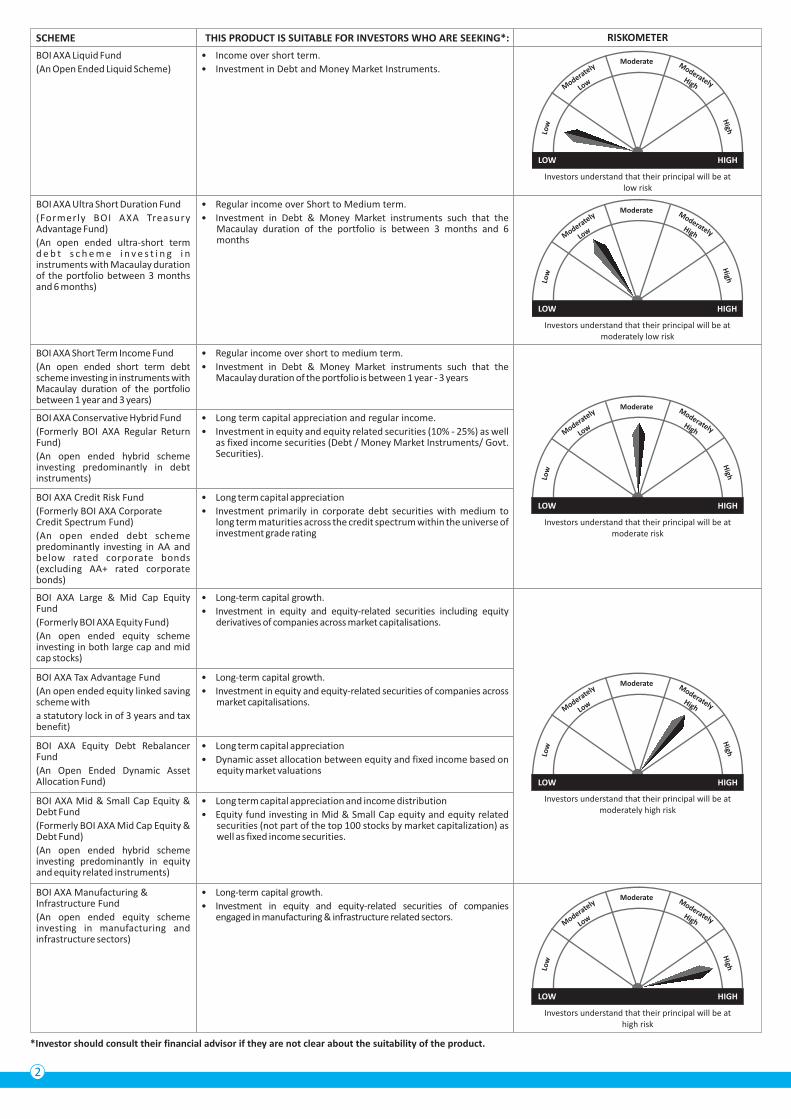
SCHEME THIS PRODUCT IS SUITABLE FOR INVESTORS WHO ARE SEEKING*:
BOI AXA Short Term Income Fund
(An open ended short term debt scheme investing in instruments with Macaulay duration of the portfolio between 1 year and 3 years)
• Regular income over short to medium term.
• Investment in Debt & Money Market instruments such that the Macaulay duration of the portfolio is between 1 year - 3 years
BOI AXA Conservative Hybrid Fund
(Formerly BOI AXA Regular Return Fund)
(An open ended hybrid scheme investing predominantly in debt instruments)
• Long term capital appreciation and regular income.
• Investment in equity and equity related securities (10% - 25%) as well as fixed income securities (Debt / Money Market Instruments/ Govt. Securities).
BOI AXA Credit Risk Fund
(Formerly BOI AXA Corporate Credit Spectrum Fund)
(An open ended debt scheme predominantly investing in AA and below rated corporate bonds (excluding AA+ rated corporate bonds)
• Long term capital appreciation
• Investment primarily in corporate debt securities with medium to long term maturities across the credit spectrum within the universe of investment grade rating
RISKOMETER
BOI AXA Large & Mid Cap Equity Fund
(Formerly BOI AXA Equity Fund)
(An open ended equity scheme investing in both large cap and mid cap stocks)
• Long-term capital growth.
• Investment in equity and equity-related securities including equity derivatives of companies across market capitalisations.
BOI AXA Tax Advantage Fund
(An open ended equity linked saving scheme with
a statutory lock in of 3 years and tax benefit)
• Long-term capital growth.
• Investment in equity and equity-related securities of companies across market capitalisations.
BOI AXA Equity Debt Rebalancer Fund
(An Open Ended Dynamic Asset Allocation Fund)
• Long term capital appreciation
• Dynamic asset allocation between equity and fixed income based on equity market valuations
BOI AXA Liquid Fund
(An Open Ended Liquid Scheme)
• Income over short term.
• Investment in Debt and Money Market Instruments.Moderate
Low
High
Moderately
Low
ModeratelyHigh
Investors understand that their principal will be at low risk
LOW HIGH
Moderate
Low
High
Moderately
Low
ModeratelyHigh
Investors understand that their principal will be at moderately low risk
LOW HIGH
BOI AXA Mid & Small Cap Equity & Debt Fund
(Formerly BOI AXA Mid Cap Equity & Debt Fund)
(An open ended hybrid scheme investing predominantly in equity and equity related instruments)
• Long term capital appreciation and income distribution
• Equity fund investing in Mid & Small Cap equity and equity related securities (not part of the top 100 stocks by market capitalization) as well as fixed income securities.
*Investor should consult their financial advisor if they are not clear about the suitability of the product.
BOI AXA Manufacturing & Infrastructure Fund
(An open ended equity scheme investing in manufacturing and infrastructure sectors)
• Long-term capital growth.
• Investment in equity and equity-related securities of companies engaged in manufacturing & infrastructure related sectors.
Moderate
Low
High
Moderately
Low
ModeratelyHigh
Investors understand that their principal will be at high risk
LOW HIGH
BOI AXA Ultra Short Duration Fund
(Formerly BOI AXA Treasury Advantage Fund)
(An open ended ultra-short term d e b t s c h e m e i n v e s t i n g i n instruments with Macaulay duration of the portfolio between 3 months and 6 months)
• Regular income over Short to Medium term.
• Investment in Debt & Money Market instruments such that the Macaulay duration of the portfolio is between 3 months and 6 months
Moderate
Low
High
Moderately
Low
ModeratelyHigh
Investors understand that their principal will be at moderate risk
LOW HIGH
Moderate
Low
High
Moderately
Low
ModeratelyHigh
Investors understand that their principal will be at moderately high risk
LOW HIGH
3
Alok SinghCHIEF INVESTMENT OFFICERMARKET UPDATE
In recent months, the market volatility has been on the higher side. The anxiety around Karnataka election
results is considered to the main contributor for the same. Despite this induced volatility, equity markets
recovered from their recent lows primarily due to continued domestic inflows into the market.
The overall growth in the economy remains robust. Most high-frequency growth indicators continue to point
towards a further recovery in growth momentum. Consumption growth remained robust, however, export
growth slowed YoY largely due to base effects. Investment growth indicators have also begun to show some signs
of recovery. Inflation in the economy moderated - CPI inflation was reported at 4.3% YoY in March as food
inflation decelerated. However, core measures of inflation picked up.
The recently released Monetary Policy Committee (MPC) minutes revealed that Dr. Viral Acharya signaled that
he is “likely to shift decisively to vote for a beginning of withdrawal of accommodation” in the June meeting.
However, we think this might not be enough to tilt the MPC into a rate hike just yet, but will change the vote
pattern from 5-1 to 4-2 in favor of the status quo. We still think that RBI will continue to be in prolonged pause
mode. However, any spike in inflation may trigger earlier-than-expected rate increase. The level of monsoon
actively and crude oil prices will play an important role in defining the inflation trajectory going forward.
The 10 year bond yield also moderated from its recent highs. The announcement of OMO came as positive
surprise to the market, especially at time when liquidity in the banking system has dried out.
The economy continues to track in line with our base case view of a further recovery in growth. We continue to
expect private capex to recover this year as demand pickup is resulting in rising capacity utilization. We continue
to believe that earnings momentum will continue in Q4 also. This being an election year, the market is expected
to remain crowed with news and this may induce some volatility. But at the same time, we don’t expect any
excessive amount volatility and equity market is expected to remain a beneficiary of global growth and earnings
revival.
Source: RBI, Bloomberg (Unless indicated otherwise); Dated: May 8, 2018
L
A
R
G
E
&
M
I
D
C
A
P
F
U
N
D
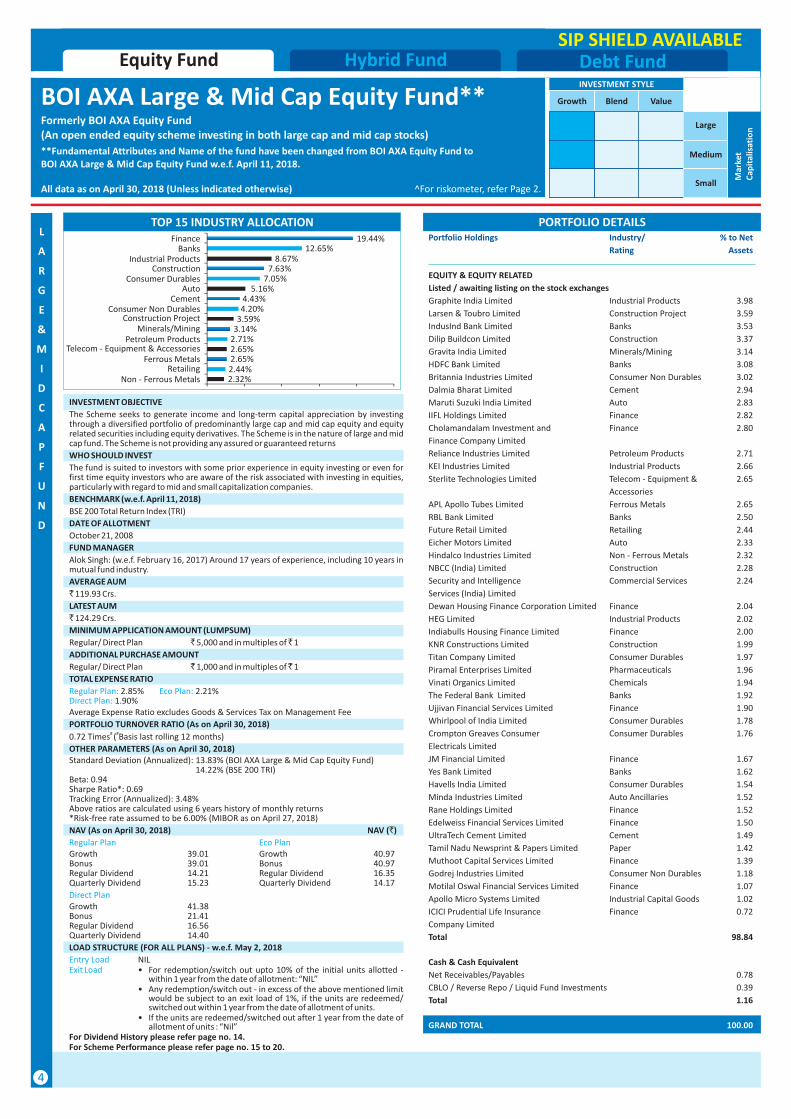
PORTFOLIO DETAILSPortfolio Holdings Industry/ % to Net
Rating Assets
EQUITY & EQUITY RELATED
Listed / awaiting listing on the stock exchanges
Graphite India Limited Industrial Products 3.98
Larsen & Toubro Limited Construction Project 3.59
IndusInd Bank Limited Banks 3.53
Dilip Buildcon Limited Construction 3.37
Gravita India Limited Minerals/Mining 3.14
HDFC Bank Limited Banks 3.08
Britannia Industries Limited Consumer Non Durables 3.02
Dalmia Bharat Limited Cement 2.94
Maruti Suzuki India Limited Auto 2.83
IIFL Holdings Limited Finance 2.82
Cholamandalam Investment and Finance 2.80
Finance Company Limited
Reliance Industries Limited Petroleum Products 2.71
KEI Industries Limited Industrial Products 2.66
Sterlite Technologies Limited Telecom - Equipment & 2.65
Accessories
APL Apollo Tubes Limited Ferrous Metals 2.65
RBL Bank Limited Banks 2.50
Future Retail Limited Retailing 2.44
Eicher Motors Limited Auto 2.33
Hindalco Industries Limited Non - Ferrous Metals 2.32
NBCC (India) Limited Construction 2.28
Security and Intelligence Commercial Services 2.24
Services (India) Limited
Dewan Housing Finance Corporation Limited Finance 2.04
HEG Limited Industrial Products 2.02
Indiabulls Housing Finance Limited Finance 2.00
KNR Constructions Limited Construction 1.99
Titan Company Limited Consumer Durables 1.97
Piramal Enterprises Limited Pharmaceuticals 1.96
Vinati Organics Limited Chemicals 1.94
The Federal Bank Limited Banks 1.92
Ujjivan Financial Services Limited Finance 1.90
Whirlpool of India Limited Consumer Durables 1.78
Crompton Greaves Consumer Consumer Durables 1.76
Electricals Limited
JM Financial Limited Finance 1.67
Yes Bank Limited Banks 1.62
Havells India Limited Consumer Durables 1.54
Minda Industries Limited Auto Ancillaries 1.52
Rane Holdings Limited Finance 1.52
Edelweiss Financial Services Limited Finance 1.50
UltraTech Cement Limited Cement 1.49
Tamil Nadu Newsprint & Papers Limited Paper 1.42
Muthoot Capital Services Limited Finance 1.39
Godrej Industries Limited Consumer Non Durables 1.18
Motilal Oswal Financial Services Limited Finance 1.07
Apollo Micro Systems Limited Industrial Capital Goods 1.02
ICICI Prudential Life Insurance Finance 0.72
Company Limited
Total 98.84
Cash & Cash Equivalent
Net Receivables/Payables 0.78
CBLO / Reverse Repo / Liquid Fund Investments 0.39
Total 1.16
GRAND TOTAL 100.00
4
INVESTMENT STYLE
Growth Blend Value
Small
Medium
Large
Mar
ket
Cap
ital
isat
ion
SIP SHIELD AVAILABLE
TOP 15 INDUSTRY ALLOCATION
INVESTMENT OBJECTIVE
The Scheme seeks to generate income and long-term capital appreciation by investing through a diversified portfolio of predominantly large cap and mid cap equity and equity related securities including equity derivatives. The Scheme is in the nature of large and mid cap fund. The Scheme is not providing any assured or guaranteed returns
WHO SHOULD INVEST
The fund is suited to investors with some prior experience in equity investing or even for first time equity investors who are aware of the risk associated with investing in equities, particularly with regard to mid and small capitalization companies.
BENCHMARK (w.e.f. April 11, 2018)
BSE 200 Total Return Index (TRI)
DATE OF ALLOTMENT
October 21, 2008
FUND MANAGER
Alok Singh: (w.e.f. February 16, 2017) Around 17 years of experience, including 10 years in mutual fund industry.
AVERAGE AUM
` 119.93 Crs.
LATEST AUM
` 124.29 Crs.
MINIMUM APPLICATION AMOUNT (LUMPSUM)
Regular/ Direct Plan ` 5,000 and in multiples of ̀ 1
ADDITIONAL PURCHASE AMOUNT
Regular/ Direct Plan ` 1,000 and in multiples of ̀ 1
TOTAL EXPENSE RATIO
2.85% 2.21%1.90%
Average Expense Ratio excludes Goods & Services Tax on Management Fee
PORTFOLIO TURNOVER RATIO (As on April 30, 2018)# #0.72 Times ( Basis last rolling 12 months)
OTHER PARAMETERS (As on April 30, 2018)Standard Deviation (Annualized): 13.83% (BOI AXA Large & Mid Cap Equity Fund)
14.22% (BSE 200 TRI)Beta: 0.94Sharpe Ratio*: 0.69Tracking Error (Annualized): 3.48%Above ratios are calculated using 6 years history of monthly returns*Risk-free rate assumed to be 6.00% (MIBOR as on April 27, 2018)
NAV (As on April 30, 2018) NAV (`)
Growth 39.01 Growth 40.97Bonus 39.01 Bonus 40.97Regular Dividend 14.21 Regular Dividend 16.35Quarterly Dividend 15.23 Quarterly Dividend 14.17
Growth 41.38Bonus 21.41Regular Dividend 16.56Quarterly Dividend 14.40
LOAD STRUCTURE (FOR ALL PLANS) - w.e.f. May 2, 2018
NIL• For redemption/switch out upto 10% of the initial units allotted -
within 1 year from the date of allotment: “NIL”• Any redemption/switch out - in excess of the above mentioned limit
would be subject to an exit load of 1%, if the units are redeemed/ switched out within 1 year from the date of allotment of units.
• If the units are redeemed/switched out after 1 year from the date of allotment of units : “Nil”
For Dividend History please refer page no. 14.For Scheme Performance please refer page no. 15 to 20.
Regular Plan: Eco Plan: Direct Plan:
Regular Plan Eco Plan
Direct Plan
Entry LoadExit Load
^For riskometer, refer Page 2.All data as on April 30, 2018 (Unless indicated otherwise)
BOI AXA Large & Mid Cap Equity Fund**Formerly BOI AXA Equity Fund(An open ended equity scheme investing in both large cap and mid cap stocks)
**Fundamental Attributes and Name of the fund have been changed from BOI AXA Equity Fund to BOI AXA Large & Mid Cap Equity Fund w.e.f. April 11, 2018.
Debt FundHybrid FundEquity Fund
2.32%2.44%2.65%2.65%2.71%3.14%3.59%4.20%4.43%
5.16%7.05%
7.63%8.67%
12.65%19.44%
Non - Ferrous MetalsRetailing
Ferrous MetalsTelecom - Equipment & Accessories
Petroleum ProductsMinerals/Mining
Construction ProjectConsumer Non Durables
CementAuto
Consumer DurablesConstruction
Industrial ProductsBanks
Finance
E
Q
U
I
T
Y
L
I
N
K
E
D
S
A
V
I
N
G
S
C
H
E
M
E
80C Benefit
5
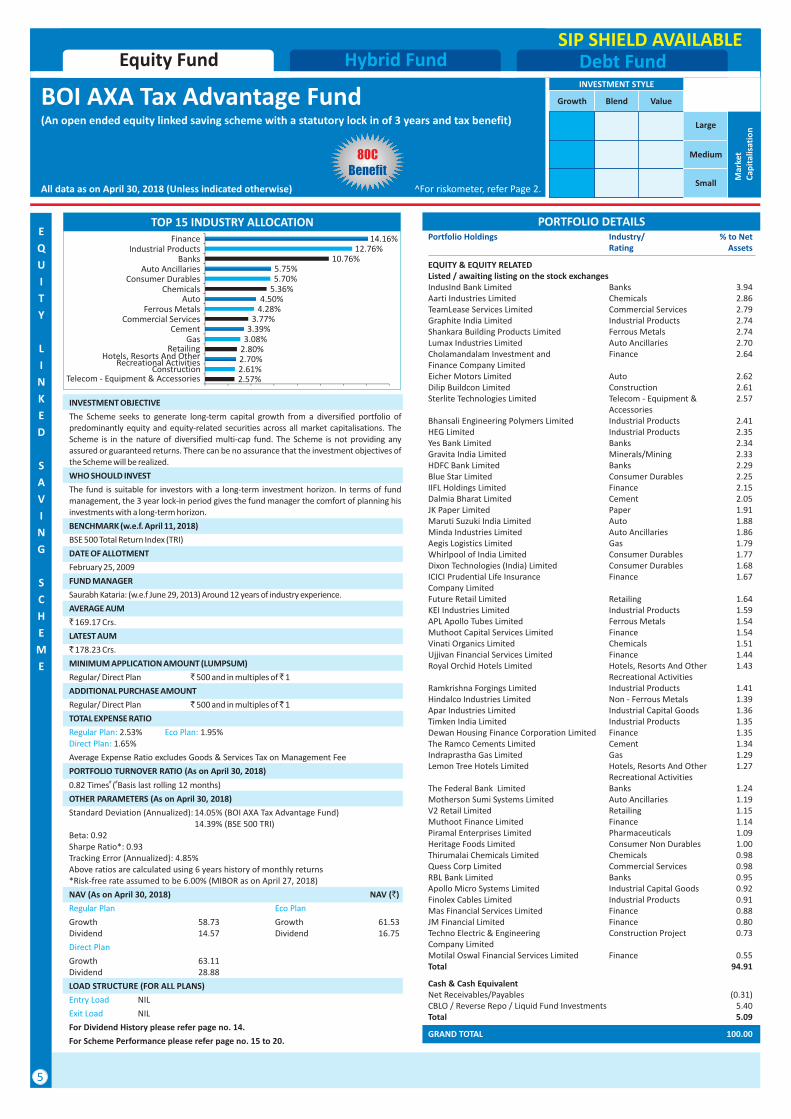
PORTFOLIO DETAILSPortfolio Holdings Industry/ % to Net
Rating Assets
EQUITY & EQUITY RELATEDListed / awaiting listing on the stock exchangesIndusInd Bank Limited Banks 3.94Aarti Industries Limited Chemicals 2.86TeamLease Services Limited Commercial Services 2.79Graphite India Limited Industrial Products 2.74Shankara Building Products Limited Ferrous Metals 2.74Lumax Industries Limited Auto Ancillaries 2.70Cholamandalam Investment and Finance 2.64Finance Company LimitedEicher Motors Limited Auto 2.62Dilip Buildcon Limited Construction 2.61Sterlite Technologies Limited Telecom - Equipment & 2.57
AccessoriesBhansali Engineering Polymers Limited Industrial Products 2.41HEG Limited Industrial Products 2.35Yes Bank Limited Banks 2.34Gravita India Limited Minerals/Mining 2.33HDFC Bank Limited Banks 2.29Blue Star Limited Consumer Durables 2.25IIFL Holdings Limited Finance 2.15Dalmia Bharat Limited Cement 2.05JK Paper Limited Paper 1.91Maruti Suzuki India Limited Auto 1.88Minda Industries Limited Auto Ancillaries 1.86Aegis Logistics Limited Gas 1.79Whirlpool of India Limited Consumer Durables 1.77Dixon Technologies (India) Limited Consumer Durables 1.68ICICI Prudential Life Insurance Finance 1.67Company LimitedFuture Retail Limited Retailing 1.64KEI Industries Limited Industrial Products 1.59APL Apollo Tubes Limited Ferrous Metals 1.54Muthoot Capital Services Limited Finance 1.54Vinati Organics Limited Chemicals 1.51Ujjivan Financial Services Limited Finance 1.44Royal Orchid Hotels Limited Hotels, Resorts And Other 1.43
Recreational ActivitiesRamkrishna Forgings Limited Industrial Products 1.41Hindalco Industries Limited Non - Ferrous Metals 1.39Apar Industries Limited Industrial Capital Goods 1.36Timken India Limited Industrial Products 1.35Dewan Housing Finance Corporation Limited Finance 1.35The Ramco Cements Limited Cement 1.34Indraprastha Gas Limited Gas 1.29Lemon Tree Hotels Limited Hotels, Resorts And Other 1.27
Recreational ActivitiesThe Federal Bank Limited Banks 1.24Motherson Sumi Systems Limited Auto Ancillaries 1.19V2 Retail Limited Retailing 1.15Muthoot Finance Limited Finance 1.14Piramal Enterprises Limited Pharmaceuticals 1.09Heritage Foods Limited Consumer Non Durables 1.00Thirumalai Chemicals Limited Chemicals 0.98Quess Corp Limited Commercial Services 0.98RBL Bank Limited Banks 0.95Apollo Micro Systems Limited Industrial Capital Goods 0.92Finolex Cables Limited Industrial Products 0.91Mas Financial Services Limited Finance 0.88JM Financial Limited Finance 0.80Techno Electric & Engineering Construction Project 0.73Company LimitedMotilal Oswal Financial Services Limited Finance 0.55Total 94.91
Cash & Cash EquivalentNet Receivables/Payables (0.31)CBLO / Reverse Repo / Liquid Fund Investments 5.40Total 5.09
GRAND TOTAL 100.00
INVESTMENT STYLE
Growth Blend Value
Small
Medium
Large
Mar
ket
Cap
ital
isat
ion
INVESTMENT OBJECTIVE
The Scheme seeks to generate long-term capital growth from a diversified portfolio of predominantly equity and equity-related securities across all market capitalisations. The Scheme is in the nature of diversified multi-cap fund. The Scheme is not providing any assured or guaranteed returns. There can be no assurance that the investment objectives of the Scheme will be realized.
WHO SHOULD INVEST
The fund is suitable for investors with a long-term investment horizon. In terms of fund management, the 3 year lock-in period gives the fund manager the comfort of planning his investments with a long-term horizon.
BENCHMARK (w.e.f. April 11, 2018)
BSE 500 Total Return Index (TRI)
DATE OF ALLOTMENT
February 25, 2009
FUND MANAGER
Saurabh Kataria: (w.e.f June 29, 2013) Around 12 years of industry experience.
AVERAGE AUM
` 169.17 Crs.
LATEST AUM
` 178.23 Crs.
MINIMUM APPLICATION AMOUNT (LUMPSUM)
Regular/ Direct Plan ` 500 and in multiples of ̀ 1
ADDITIONAL PURCHASE AMOUNT
Regular/ Direct Plan ` 500 and in multiples of ̀ 1
TOTAL EXPENSE RATIO
2.53% 1.95% 1.65%
Average Expense Ratio excludes Goods & Services Tax on Management Fee
PORTFOLIO TURNOVER RATIO (As on April 30, 2018)# #0.82 Times ( Basis last rolling 12 months)
OTHER PARAMETERS (As on April 30, 2018)
Standard Deviation (Annualized): 14.05% (BOI AXA Tax Advantage Fund)14.39% (BSE 500 TRI)
Beta: 0.92Sharpe Ratio*: 0.93Tracking Error (Annualized): 4.85%Above ratios are calculated using 6 years history of monthly returns*Risk-free rate assumed to be 6.00% (MIBOR as on April 27, 2018)
NAV (As on April 30, 2018) NAV (`)
Growth 58.73 Growth 61.53Dividend 14.57 Dividend 16.75
Growth 63.11Dividend 28.88
LOAD STRUCTURE (FOR ALL PLANS)
NIL
NIL
For Dividend History please refer page no. 14.
For Scheme Performance please refer page no. 15 to 20.
Regular Plan: Eco Plan: Direct Plan:
Regular Plan Eco Plan
Direct Plan
Entry Load
Exit Load
SIP SHIELD AVAILABLE
TOP 15 INDUSTRY ALLOCATION
^For riskometer, refer Page 2.All data as on April 30, 2018 (Unless indicated otherwise)
BOI AXA Tax Advantage Fund(An open ended equity linked saving scheme with a statutory lock in of 3 years and tax benefit)
Debt FundHybrid FundEquity Fund
2.57%2.61%2.70%2.80%3.08%3.39%
3.77%4.28%4.50%
5.36%5.70%5.75%
10.76%12.76%
14.16%
Telecom - Equipment & AccessoriesConstruction
Hotels, Resorts And Other Recreational Activities
RetailingGas
CementCommercial Services
Ferrous MetalsAuto
ChemicalsConsumer Durables
Auto AncillariesBanks
Industrial ProductsFinance
S
E
C
T
O
R
A
L
S
C
H
E
M
E
PORTFOLIO DETAILSPortfolio Holdings Industry/ % to Net
Rating Assets
EQUITY & EQUITY RELATEDListed / awaiting listing on the stock exchangesLarsen & Toubro Limited Construction Project 5.14Dilip Buildcon Limited Construction 4.62H.G. Infra Engineering Limited Construction Project 3.30Graphite India Limited Industrial Products 3.23Power Grid Corporation of India Limited Power 3.00Gravita India Limited Minerals/Mining 2.99KNR Constructions Limited Construction 2.87APL Apollo Tubes Limited Ferrous Metals 2.75Sterlite Technologies Limited Telecom - Equipment & 2.64
AccessoriesShankara Building Products Limited Ferrous Metals 2.56Ahluwalia Contracts (India) Limited Construction 2.43JK Paper Limited Paper 2.42Shakti Pumps (India) Limited Industrial Products 2.32Bhansali Engineering Polymers Limited Industrial Products 2.28IFB Industries Limited Consumer Durables 2.11Apar Industries Limited Industrial Capital Goods 2.08Techno Electric & Engineering Construction Project 2.07Company LimitedEicher Motors Limited Auto 2.04R.P.P. Infra Projects Limited Construction 2.02PNC Infratech Limited Construction 2.00Rane Holdings Limited Finance 1.89Blue Star Limited Consumer Durables 1.87Lumax Industries Limited Auto Ancillaries 1.86GPT Infraprojects Limited Construction 1.85Apollo Micro Systems Limited Industrial Capital Goods 1.78HEG Limited Industrial Products 1.76Kamdhenu Limited Ferrous Metals 1.74JMC Projects (India) Limited Construction 1.72NBCC (India) Limited Construction 1.67Aarti Industries Limited Chemicals 1.54Timken India Limited Industrial Products 1.45Kalpataru Power Transmission Limited Power 1.39Hindalco Industries Limited Non - Ferrous Metals 1.37Dixon Technologies (India) Limited Consumer Durables 1.31Maithan Alloys Limited Ferrous Metals 1.28Havells India Limited Consumer Durables 1.28KEI Industries Limited Industrial Products 1.19Greaves Cotton Limited Industrial Products 1.08VA Tech Wabag Limited Engineering Services 1.05Astral Poly Technik Limited Industrial Products 1.03Maruti Suzuki India Limited Auto 1.03Orient Refractories Limited Industrial Products 0.97AIA Engineering Limited Industrial Products 0.96LT Foods Limited Consumer Non Durables 0.92Ruchira Papers Limited Paper 0.83Skipper Limited Industrial Capital Goods 0.81Torrent Power Limited Power 0.74ITI Limited Telecom - Equipment & 0.43
AccessoriesAstra Microwave Products Limited Telecom - Equipment & 0.40
AccessoriesTotal 92.08
NON-CONVERTIBLE DEBENTURESNTPC Limited CRISIL AAA 0.05Total 0.05
Cash & Cash EquivalentNet Receivables/Payables 0.55CBLO / Reverse Repo / Liquid Fund Investments 7.32Total 7.87
All corporate ratings are assigned by rating agencies like CRISIL, CARE, ICRA, India Rating, Brickwork.
GRAND TOTAL 100.00
6
INVESTMENT STYLE
Growth Blend Value
Small
Medium
Large
Mar
ket
Cap
ital
isat
ion
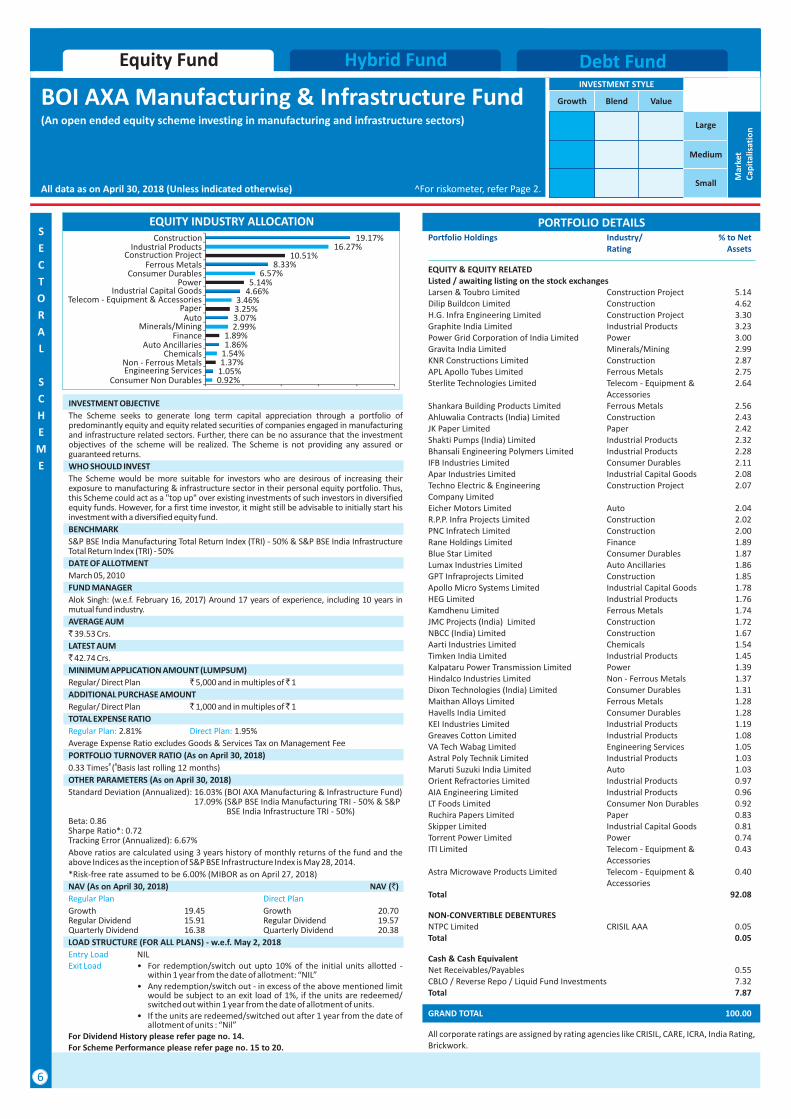
EQUITY INDUSTRY ALLOCATION
INVESTMENT OBJECTIVE
The Scheme seeks to generate long term capital appreciation through a portfolio of predominantly equity and equity related securities of companies engaged in manufacturing and infrastructure related sectors. Further, there can be no assurance that the investment objectives of the scheme will be realized. The Scheme is not providing any assured or guaranteed returns.
WHO SHOULD INVEST
The Scheme would be more suitable for investors who are desirous of increasing their exposure to manufacturing & infrastructure sector in their personal equity portfolio. Thus, this Scheme could act as a "top up" over existing investments of such investors in diversified equity funds. However, for a first time investor, it might still be advisable to initially start his investment with a diversified equity fund.
BENCHMARK
S&P BSE India Manufacturing Total Return Index (TRI) - 50% & S&P BSE India Infrastructure Total Return Index (TRI) - 50%
DATE OF ALLOTMENT
March 05, 2010
FUND MANAGER
Alok Singh: (w.e.f. February 16, 2017) Around 17 years of experience, including 10 years in mutual fund industry.
AVERAGE AUM
` 39.53 Crs.
LATEST AUM
` 42.74 Crs.
MINIMUM APPLICATION AMOUNT (LUMPSUM)
Regular/ Direct Plan ` 5,000 and in multiples of ̀ 1
ADDITIONAL PURCHASE AMOUNT
Regular/ Direct Plan ` 1,000 and in multiples of ̀ 1
TOTAL EXPENSE RATIO
2.81% 1.95%
Average Expense Ratio excludes Goods & Services Tax on Management Fee
PORTFOLIO TURNOVER RATIO (As on April 30, 2018)# #0.33 Times ( Basis last rolling 12 months)
OTHER PARAMETERS (As on April 30, 2018)
Standard Deviation (Annualized): 16.03% (BOI AXA Manufacturing & Infrastructure Fund)17.09% (S&P BSE India Manufacturing TRI - 50% & S&P
BSE India Infrastructure TRI - 50%)Beta: 0.86Sharpe Ratio*: 0.72Tracking Error (Annualized): 6.67%
Above ratios are calculated using 3 years history of monthly returns of the fund and the above Indices as the inception of S&P BSE Infrastructure Index is May 28, 2014.
*Risk-free rate assumed to be 6.00% (MIBOR as on April 27, 2018)
NAV (As on April 30, 2018) NAV (`)
Growth 19.45 Growth 20.70Regular Dividend 15.91 Regular Dividend 19.57Quarterly Dividend 16.38 Quarterly Dividend 20.38
Regular Plan: Direct Plan:
Regular Plan Direct Plan
LOAD STRUCTURE (FOR ALL PLANS) - w.e.f. May 2, 2018
NIL• For redemption/switch out upto 10% of the initial units allotted -
within 1 year from the date of allotment: “NIL”• Any redemption/switch out - in excess of the above mentioned limit
would be subject to an exit load of 1%, if the units are redeemed/ switched out within 1 year from the date of allotment of units.
• If the units are redeemed/switched out after 1 year from the date of allotment of units : “Nil”
For Dividend History please refer page no. 14.For Scheme Performance please refer page no. 15 to 20.
Entry LoadExit Load
^For riskometer, refer Page 2.All data as on April 30, 2018 (Unless indicated otherwise)
BOI AXA Manufacturing & Infrastructure Fund(An open ended equity scheme investing in manufacturing and infrastructure sectors)
Debt FundHybrid FundEquity Fund
0.92%1.05%1.37%1.54%1.86%1.89%
2.99%3.07%3.25%3.46%
4.66%5.14%
6.57%8.33%
10.51%16.27%
19.17%
Consumer Non DurablesEngineering ServicesNon - Ferrous Metals
ChemicalsAuto Ancillaries
FinanceMinerals/Mining
AutoPaper
Telecom - Equipment & AccessoriesIndustrial Capital Goods
PowerConsumer Durables
Ferrous MetalsConstruction Project
Industrial ProductsConstruction
A
G
G
R
E
S
S
I
V
E
H
Y
B
R
I
D
F
U
N
D
PORTFOLIO DETAILSPortfolio Holdings Industry/ % to Net
Rating Assets
EQUITY & EQUITY RELATEDListed / awaiting listing on the stock exchangesDilip Buildcon Limited Construction 3.87HEG Limited Industrial Products 3.41Graphite India Limited Industrial Products 3.00Sterlite Technologies Limited Telecom - Equipment & 2.89
AccessoriesGravita India Limited Minerals/Mining 2.76hansali Engineering Polymers Limited Industrial Products 2.54Lemon Tree Hotels Limited Hotels, Resorts And Other 2.40
Recreational ActivitiesAarti Industries Limited Chemicals 2.16TeamLease Services Limited Commercial Services 2.08KEI Industries Limited Industrial Products 1.98KNR Constructions Limited Construction 1.94Ujjivan Financial Services Limited Finance 1.86Blue Star Limited Consumer Durables 1.83Shankara Building Products Limited Ferrous Metals 1.74Apar Industries Limited Industrial Capital Goods 1.70Vinati Organics Limited Chemicals 1.68Heritage Foods Limited Consumer Non Durables 1.67APL Apollo Tubes Limited Ferrous Metals 1.61Rane Holdings Limited Finance 1.57JK Paper Limited Paper 1.57Future Retail Limited Retailing 1.56V2 Retail Limited Retailing 1.55Maithan Alloys Limited Ferrous Metals 1.54JM Financial Limited Finance 1.43Techno Electric & Engineering Construction Project 1.42Company LimitedKalpataru Power Transmission Limited Power 1.34Astral Poly Technik Limited Industrial Products 1.30Dixon Technologies (India) Limited Consumer Durables 1.29Thirumalai Chemicals Limited Chemicals 1.27Minda Industries Limited Auto Ancillaries 1.18LT Foods Limited Consumer Non Durables 1.16Kamdhenu Limited Ferrous Metals 1.16Apollo Micro Systems Limited Industrial Capital Goods 1.13ICICI Prudential Life Insurance Finance 1.08Company LimitedDewan Housing Finance Corporation Limited Finance 1.06Lumax Industries Limited Auto Ancillaries 1.03The Federal Bank Limited Banks 0.98V-Mart Retail Limited Retailing 0.90Orient Refractories Limited Industrial Products 0.83Somany Ceramics Limited Construction 0.78Indraprastha Gas Limited Gas 0.76Timken India Limited Industrial Products 0.67Skipper Limited Industrial Capital Goods 0.66Cera Sanitaryware Limited Construction 0.64AIA Engineering Limited Industrial Products 0.58Shoppers Stop Limited Retailing 0.58VA Tech Wabag Limited Engineering Services 0.56Crompton Greaves Consumer Consumer Durables 0.49Electricals LimitedNavin Fluorine International Limited Chemicals 0.44RBL Bank Limited Banks 0.40Sintex Plastics Technology Limited Industrial Products 0.36Finolex Industries Limited Industrial Products 0.34Total 74.74
BONDS & NCDsSintex-BAPL Limited BWR AA- 6.68Dewan Housing Finance Corporation Limited CARE AAA 4.83Power Finance Corporation Limited CRISIL AAA 1.28Total 12.79
MONEY MARKET INSTRUMENTS##Commercial Paper
Wadhawan Global Capital Pvt Limited CARE A1+ 3.76National Bank For Agriculture and ICRA A1+ 0.64Rural DevelopmentTotal 4.40
GOVERNMENT BONDGovernment of India SOV 5.27Total 5.27
Cash & Cash Equivalent Net Receivables/Payables 0.58CBLO / Reverse Repo Investments 2.22Total 2.80
##Thinly traded/Non traded securities and illiquid securities as defined in SEBI Regulations and Guidelines.
All corporate ratings are assigned by rating agencies like CRISIL, CARE, ICRA, India Rating, Brickwork.
GRAND TOTAL 100.00
7
INVESTMENT STYLE
Growth Blend Value
Small
Medium
Large
Mar
ket
Cap
ital
isat
ion
INVESTMENT OBJECTIVE
The scheme's objective is to provide capital appreciation and income distribution to investors from a portfolio constituting of mid and small cap equity and equity related securities as well as fixed income securities. However there can be no assurance that the income can be generated, regular or otherwise, or the investment objectives of the Scheme will be realized.
BENCHMARK (w.e.f. April 11, 2018)
NIFTY MidSmallcap 400 TRI: 70%; CRISIL Short Term Bond Fund Index: 30%
DATE OF ALLOTMENT
July 20, 2016
FUND MANAGER
Alok Singh: (w.e.f. February 16, 2017) Around 17 years of experience, including 10 years in mutual fund industry.
Ajay Khandelwal (Assistant Fund Manager): (w.e.f. December 1, 2017) - Around 10 years of experience, including 7 years in mutual fund industry.
AVERAGE AUM
` 379.49 Crs.
LATEST AUM
` 393.09 Crs.
MINIMUM APPLICATION AMOUNT (LUMPSUM)
Regular/ Direct Plan ` 5,000 and in multiples of ̀ 1
ADDITIONAL PURCHASE AMOUNT
Regular/ Direct Plan ` 1,000 and in multiples of ̀ 1
TOTAL EXPENSE RATIO
2.67% 1.96%
Average Expense Ratio excludes Goods & Services Tax on Management Fee
PORTFOLIO TURNOVER RATIO (As on April 30, 2018)# #1.43 Times ( Basis last rolling 12 months)
OTHER PARAMETERS (As on April 30, 2018)
Standard Deviation (Annualized): 8.93% (BOI AXA Mid & Small Cap Equity & Debt Fund)10.30% (Nifty Midsmall cap 400 TRI - 70% &
CRISIL Short Term Bond Fund Index - 30%)Beta: 0.80Sharpe Ratio*: 2.26Tracking Error (Annualized): 3.97%
Above ratios are calculated using 1 year history of monthly returns
*Risk-free rate assumed to be 6.00% (MIBOR as on April 27, 2018)
NAV (As on April 30, 2018) NAV (`)
Growth 14.71 Growth 14.93Regular Dividend 13.00 Regular Dividend 13.08
Regular Plan: Direct Plan:
Regular Plan Direct Plan
LOAD STRUCTURE (FOR ALL PLANS) - w.e.f. May 2, 2018
NIL
• For redemption/switch out upto 10% of the initial units allotted -within 1 year from the date of allotment: “NIL”
• Any redemption/switch out - in excess of the above mentioned limit would be subject to an exit load of 1%, if the units are redeemed/ switched out within 1 year from the date of allotment of units.
• If the units are redeemed/switched out after 1 year from the date of allotment of units : “Nil”
For Dividend History please refer page no. 14.
For Scheme Performance please refer page no. 15 to 20.
Entry Load
Exit Load
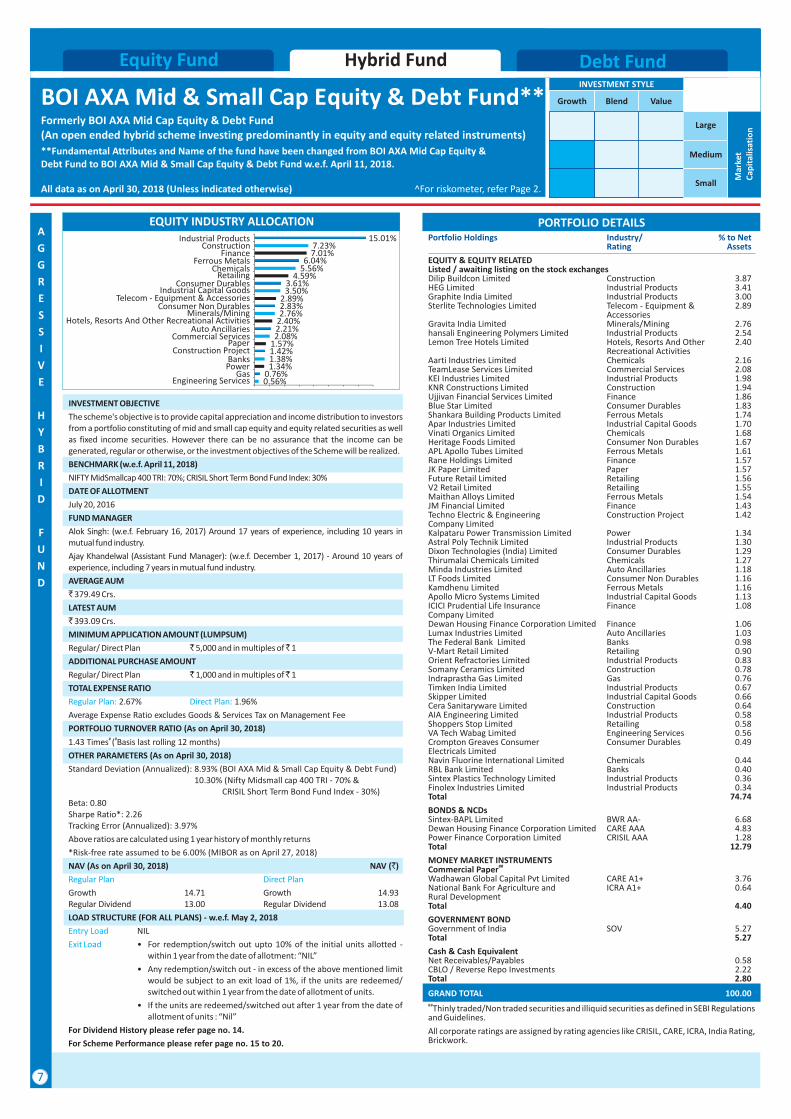
EQUITY INDUSTRY ALLOCATION
^For riskometer, refer Page 2.All data as on April 30, 2018 (Unless indicated otherwise)
BOI AXA Mid & Small Cap Equity & Debt Fund**Formerly BOI AXA Mid Cap Equity & Debt Fund(An open ended hybrid scheme investing predominantly in equity and equity related instruments)
**Fundamental Attributes and Name of the fund have been changed from BOI AXA Mid Cap Equity & Debt Fund to BOI AXA Mid & Small Cap Equity & Debt Fund w.e.f. April 11, 2018.
Debt FundHybrid FundEquity Fund
0.56%0.76%
1.34%1.38%1.42%1.57%2.08%2.21%2.40%2.76%2.83%2.89%
3.50%3.61%
4.59%5.56%6.04%
7.01%7.23%
15.01%
Engineering ServicesGas
PowerBanks
Construction ProjectPaper
Commercial ServicesAuto Ancillaries
Hotels, Resorts And Other Recreational ActivitiesMinerals/Mining
Consumer Non DurablesTelecom - Equipment & Accessories
Industrial Capital GoodsConsumer Durables
RetailingChemicals
Ferrous MetalsFinance
ConstructionIndustrial Products
D
Y
N
A
M
I
C
A
S
S
E
T
A
L
L
O
C
A
T
I
O
N
S
C
H
E
M
E
8
EQUITY INDUSTRY ALLOCATION
INVESTMENT STYLE
Growth Blend Value
Small
Medium
Large
Mar
ket
Cap
ital
isat
ion
PORTFOLIO DETAILSPortfolio Holdings Industry/ % to Net % to Nav
Rating Assets Derivatives
Portfolio Holdings Industry/ % to Net % to Nav Rating Assets Derivatives
EQUITY HOLDINGS (UNHEDGED)Listed / awaiting listing on the stock exchangesIndusind Bank Ltd Banks 2.61Bajaj Finance Ltd Finance 2.36Yes Bank Limited Banks 1.93Maruti Suzuki India Ltd Auto 1.90Ashok Leyland Ltd Auto 1.70HDFC Bank Ltd Banks 1.67Eicher Motors Ltd Auto 1.64Larsen & Toubro Ltd Construction Project 1.57Motherson Sumi Systems Ltd Auto Ancillaries 1.46Hindalco Industries Ltd Non - Ferrous Metals 1.42Titan Company Limited Consumer Durables 1.35Britannia Industries Ltd Consumer Non Durables 1.35Aurobindo Pharma Ltd Pharmaceuticals 1.33Piramal Enterprises Ltd Pharmaceuticals 1.21TVS Motor Company Ltd Auto 1.15Avenue Supermarts Limited Retailing 1.08ICICI Prudential Life Insurance Finance 1.03Company LimitedReliance Industries Ltd Petroleum Products 0.99Havells India Ltd Consumer Durables 0.85L&T Finance Holdings Ltd Finance 0.83PNB Housing Finance Limited Finance 0.72ICICI Bank Ltd Banks 0.43Equity Holdings (Unhedged) Total 30.58
EQUITY HOLDINGS (HEDGED)Vedanta Ltd Non - Ferrous Metals 4.60Vedanta Ltd - FUTURE (4.63)DLF Ltd Construction 4.22DLF Ltd - FUTURE (4.24)Aurobindo Pharma Ltd Pharmaceuticals 3.11Aurobindo Pharma Ltd - FUTURE (3.12)Dr Reddys Laboratories Ltd Pharmaceuticals 2.98Dr Reddys Laboratories Ltd - FUTURE (3.00)Bharti Airtel Ltd Telecom - Services 2.87
Bharti Airtel Ltd - FUTURE (2.89)Other Equity Holding (Hedged) 17.67Other Stock Futures Holding (Hedged) (17.78)Equity Holdings (Hedged) Total 35.45 (35.66)Equity Holdings Total 66.03
BONDS & NCDsSintex-BAPL Limited BWR AA- 8.69Dewan Housing Finance CARE AAA 3.10Corporation LimitedTotal 11.79
##Commercial PaperChennai Petroleum Corporation Limited CRISIL A1+ 8.25Total 8.25
MONEY MARKET INSTRUMENTSGOVERNMENT BONDGovernment of India SOV 5.34Total 5.34
FIXED DEPOSITS (MARGIN)HDFC Bank Limited 0.58Total 0.58
Cash & Cash EquivalentNet Receivables/(Payables) after 7.22adjusting for futuresCBLO / Reverse Repo / Liquid Fund Investments 0.79Total 8.01
##Thinly traded/Non traded securities and illiquid securities as defined in SEBI Regulations and Guidelines.
All corporate ratings are assigned by rating agencies like CRISIL, CARE, ICRA, India Rating, Brickwork.
GRAND TOTAL 100.00
INVESTMENT OBJECTIVE
The Scheme aims at generating long term returns with lower volatility by following a disciplined allocation between equity and debt securities. The equity allocation will be determined based on the month end P/E ratio of the Nifty 50 Index. There is no assurance that the investment objectives of the Scheme will be realized and the Scheme does not assure or guarantee any returns.
BENCHMARK
Nifty 50 Total Return Index (TRI) - 50% & CRISIL Short Term Bond Fund Index - 50%
DATE OF ALLOTMENT
March 14, 2014
FUND MANAGER
Saurabh Kataria (for Equity): (w.e.f. September 11, 2014) Around 12 years of industry experience.
Piyush Baranwal (For Debt): (w.e.f. December 1, 2017) - Over 9 years' of experience, in Portfolio Management and trading in Fixed Income Securities.
AVERAGE AUM
` 294.27 Crs.
LATEST AUM
` 290.68 Crs.
MINIMUM APPLICATION AMOUNT (LUMPSUM)
Regular/ Direct Plan ` 5,000 and in multiples of ̀ 1
ADDITIONAL PURCHASE AMOUNT
Regular/ Direct Plan ` 1,000 and in multiples of ̀ 1
TOTAL EXPENSE RATIO
2.25% 1.72%
Average Expense Ratio excludes Goods & Services Tax on Management Fee
AVERAGE MATURITY & MODIFIED DURATION (As on April 27, 2018)
Average Maturity: 2.96 YearsModified Duration: 2.35
NAV (As on April 30, 2018) NAV (`)
Growth 15.0117 Growth 15.3155Dividend 10.8762 Dividend 12.1796
Regular Plan:Direct Plan:
Regular Plan Direct Plan
LOAD STRUCTURE (FOR ALL PLANS) - w.e.f. May 2, 2018
NIL
• For redemption/switch out upto 10% of the initial units allotted -within 1 year from the date of allotment: “NIL”
• Any redemption/switch out - in excess of the above mentioned limit would be subject to an exit load of 1%, if the units are redeemed/ switched out within 1 year from the date of allotment of units.
• If the units are redeemed/switched out after 1 year from the date of allotment of units : “Nil”
For Dividend History please refer page no. 14.
For Scheme Performance please refer page no. 15 to 20.
Entry Load
Exit Load
^For riskometer, refer Page 2.All data as on April 30, 2018 (Unless indicated otherwise)
BOI AXA Equity Debt Rebalancer Fund**(An open ended dynamic asset allocation fund)
**Fundamental Attributes of the fund have been changed w.e.f. April 11, 2018.
Debt FundHybrid FundEquity Fund
0.99%1.08%
1.35%1.41%1.46%1.57%
2.87%3.76%
4.22%4.73%4.95%
6.02%8.52%
10.71%12.39%
Petroleum ProductsRetailing
Consumer Non DurablesCement
Auto AncillariesConstruction Project
Telecom - ServicesFerrous Metals
ConstructionConsumer Durables
FinanceNon - Ferrous Metals
AutoBanks
Pharmaceuticals

PORTFOLIO DETAILS
C
O
N
S
E
R
V
A
T
I
V
E
H
Y
B
R
I
D
F
U
N
D
Portfolio Holdings Industry/ % to Net Rating Assets
Portfolio Holdings Industry/ % to Net Rating Assets
EQUITY & EQUITY RELATEDListed / awaiting listing on the stock exchangesHEG Limited Industrial Products 1.06Dilip Buildcon Limited Construction 1.04Graphite India Limited Industrial Products 1.02ICICI Prudential Life Insurance Company Limited Finance 1.00Larsen & Toubro Limited Construction Project 0.94Bhansali Engineering Polymers Limited Industrial Products 0.92Sterlite Technologies Limited Telecom - Equipment & 0.88
AccessoriesLemon Tree Hotels Limited Hotels, Resorts And Other 0.83
Recreational ActivitiesDalmia Bharat Limited Cement 0.82Rane Holdings Limited Finance 0.76Apar Industries Limited Industrial Capital Goods 0.72Shree Cements Limited Cement 0.60Vinati Organics Limited Chemicals 0.59Gravita India Limited Minerals/Mining 0.59Ujjivan Financial Services Limited Finance 0.58RBL Bank Limited Banks 0.56Future Retail Limited Retailing 0.56Shankara Building Products Limited Ferrous Metals 0.54Dixon Technologies (India) Limited Consumer Durables 0.53Thirumalai Chemicals Limited Chemicals 0.52JM Financial Limited Finance 0.51Hindalco Industries Limited Non - Ferrous Metals 0.51Blue Star Limited Consumer Durables 0.47KNR Constructions Limited Construction 0.44Timken India Limited Industrial Products 0.43Yes Bank Limited Banks 0.42Tamil Nadu Newsprint & Papers Limited Paper 0.42Piramal Enterprises Limited Pharmaceuticals 0.41Dewan Housing Finance Corporation Limited Finance 0.41Minda Industries Limited Auto Ancillaries 0.39Maruti Suzuki India Limited Auto 0.37Astral Poly Technik Limited Industrial Products 0.35Apollo Micro Systems Limited Industrial Capital Goods 0.32KEI Industries Limited Industrial Products 0.32Orient Refractories Limited Industrial Products 0.28V-Mart Retail Limited Retailing 0.27The Federal Bank Limited Banks 0.26Shoppers Stop Limited Retailing 0.24Crompton Greaves Consumer Electricals Limited Consumer Durables 0.22Motilal Oswal Financial Services Limited Finance 0.21Galaxy Surfactants Limited Chemicals 0.21Somany Ceramics Limited Construction 0.13Total 22.63
BONDS & NCDsSintex-BAPL Limited BWR AA- 8.68Dewan Housing Finance Corporation Limited CARE AAA 7.06Karuna Healthcare Private Limited IVR A(SO) 6.20Piramal Enterprises Limited ICRA AA 6.11Aadhar Housing Finance Limited CARE AA+(SO) 2.79Power Finance Corporation Limited CRISIL AAA 2.36Dewan Housing Finance Corporation Limited CARE AAA 1.31NTPC Limited CRISIL AAA 0.01Total 34.51MONEY MARKET INSTRUMENTSCertificate of DepositBandhan Bank Limited ICRA A1+ 3.27ICICI Bank Limited ICRA A1+ 1.40Total 4.67
##Commercial PaperWadhawan Global Capital Pvt Limited CARE A1+ 6.35Shapoorji Pallonji and Company Pvt Limited ICRA A1+ 4.61PTC India Financial Services Limited CRISIL A1+ 2.34Cox & Kings Limited CARE A1+ 2.33Shriram City Union Finance Limited CARE A1+ 2.33Total 17.95GOVERNMENT BONDGovernment of India SOV 9.39Total 9.39Cash & Cash EquivalentNet Receivables/Payables 1.68CBLO / Reverse Repo Investments 9.17Total 10.85
##Thinly traded/Non traded securities and illiquid securities as defined in SEBI Regulations and Guidelines.All corporate ratings are assigned by rating agencies like CRISIL, CARE, ICRA, India Rating, Brickwork.
GRAND TOTAL 100.00
9
INVESTMENT STYLE
Growth Blend Value
Small
Medium
Large
Mar
ket
Cap
ital
isat
ion
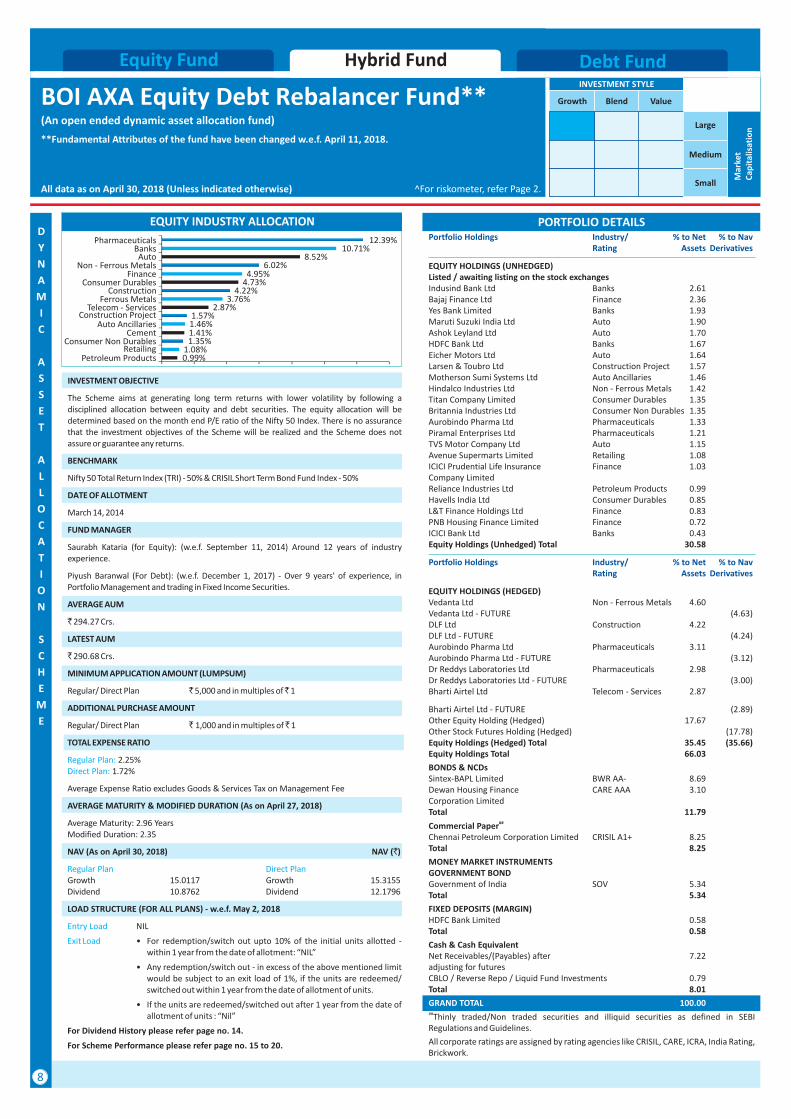
34.51%
17.95%
COMPOSITION BY ASSETSEQUITY INDUSTRY ALLOCATION
INVESTMENT OBJECTIVE
The Scheme seeks to generate regular income through investments in fixed income securities and also to generate long term capital appreciation by investing a portion in equity and equity related instruments. However, there can be no assurance that the income can be generated, regular or otherwise, or the investment objectives of the Scheme will be realized.
BENCHMARK (w.e.f. February 1, 2018)
CRISIL Hybrid 85 + 15 - Conservative Index
DATE OF ALLOTMENT
March 18, 2009
FUND MANAGER
Alok Singh: (w.e.f. May 21, 2012) Around 17 years of experience, including 10 years in mutual fund industry.
AVERAGE AUM
` 209.18 Crs.
LATEST AUM
` 213.24 Crs.
MINIMUM APPLICATION AMOUNT (LUMPSUM)
Regular/ Direct Plan ` 10,000 and in multiples of ̀ 1
ADDITIONAL PURCHASE AMOUNT
Regular/ Direct Plan ` 1,000 and in multiples of ̀ 1
TOTAL EXPENSE RATIO
2.01% 1.76% 1.50%
Average Expense Ratio excludes Goods & Services Tax on Management Fee
AVERAGE MATURITY & MODIFIED DURATION (As on April 27, 2018)
Average Maturity: 1.91 YearsModified Duration: 1.49
NAV (As on April 27, 2018) NAV (`)
Growth 21.2169 Growth 21.5423Monthly Dividend 12.3250 Monthly Dividend 18.0889Quarterly Dividend 11.4905 Quarterly Dividend 10.8128Annual Dividend 10.8115 Annual Dividend -
Growth 21.7089Monthly Dividend 10.3859Quarterly Dividend 11.6869Annual Dividend 11.4741
LOAD STRUCTURE (FOR ALL PLANS)
NIL
• For redemption/switch out -of up to 10% of the initial units allotted - within 1 year from the date of allotment: “NIL”.
• Any redemption/switch out-in excess of the above mentioned limit would be subject to an exit load of 1%, if the units are switched out within 1 year from the date of allotment of units.
• If the units are redeemed/switched out after 1 year from the date of allotment of units : “NIL”.
For Dividend History please refer page no. 14.
For Scheme Performance please refer page no. 15 to 20.
Regular Plan: Eco Plan: Direct Plan:
Regular Plan Eco Plan
Direct Plan
Entry Load
Exit Load
Cash & Cash Equivalent Government Bond
Bonds & NCDs Equity & equity related securities Commercial Paper
22.63%
4.67%
9.39%
Certificate of Deposit
10.85%
^For riskometer, refer Page 2.All data as on April 30, 2018 (Unless indicated otherwise)
BOI AXA Conservative Hybrid Fund**Formerly BOI AXA Regular Return Fund(An open ended hybrid scheme investing predominantly in debt instruments)
**Fundamental Attributes and Name of the fund have been changed from BOI AXA Regular Return Fund to BOI AXA Conservative Hybrid Fund w.e.f. April 11, 2018.
Debt FundHybrid FundEquity Fund
0.37%0.39%0.41%0.42%0.51%0.54%0.59%
0.83%0.88%0.94%1.03%1.07%1.22%1.25%1.32%1.42%
1.61%3.47%
4.37%
AutoAuto Ancillaries
PharmaceuticalsPaper
Non - Ferrous MetalsFerrous Metals
Minerals/MiningHotels, Resorts And Other Recreational Activities
Telecom - Equipment & AccessoriesConstruction Project
Industrial Capital GoodsRetailing
Consumer DurablesBanks
ChemicalsCement
ConstructionFinance
Industrial Products
10
C
R
E
D
I
T
R
I
S
K
F
U
N
D
PORTFOLIO DETAILSPortfolio Holdings Industry/ % to Net
Rating Assets
BONDS & NCDsListed / awaiting listing on the stock exchangesSintex-BAPL Limited BWR AA- 9.96Dewan Housing Finance Corporation Limited CARE AAA 9.42Karuna Healthcare Private Limited IVR A(SO) 9.22Coffee Day Natural Resources Private Limited BWR A-(SO) 6.19Accelarating Education and Development BWR A-(SO) 5.87Private LimitedNorthern Arc Capital Limited ICRA A+ 5.00Radiant Life Care Pvt. Ltd. IVR A- 4.67Kwality Limited BWR A+ 4.09DRSR Logistics Private Limited UNRATED 3.90LIC Housing Finance Limited CRISIL AAA 3.39Avendus Finance Private Limited CRISIL A+ 3.34RKV Enterprise Private Limited UNRATED 3.27Marck Remedies Private Limited UNRATED 2.59IDFC Bank Limited ICRA AAA 2.54Avantha Holdings Limited UNRATED 2.40Classic Stripes Pvt. Ltd. BWR A-(SO) 1.65Enzen Global Solutions Pvt Limited CRISIL A- 1.59Aadhar Housing Finance Limited CARE AA+(SO) 0.66Bhavya Cements Limited IND BBB- 0.46Piramal Finance Limited ICRA AA 0.40Amanta Healthcare Limited UNRATED 0.38Dinram Holdings Private Limited UNRATED 0.34Shriram Transport Finance Company Limited CRISIL AA+ 0.33Piramal Enterprises Limited ICRA AA 0.07Indian Railway Finance Corporation Limited CRISIL AAA 0.03Total 81.75
MONEY MARKET INSTRUMENTSCertificate of DepositKotak Mahindra Bank Limited CRISIL A1+ 1.72Axis Bank Limited CRISIL A1+ 1.42ICICI Bank Limited ICRA A1+ 0.66Total 3.81
##Commercial PaperExport Import Bank of India CRISIL A1+ 9.27Indiabulls Housing Finance Limited CRISIL A1+ 1.60ECL Finance Limited CRISIL A1+ 1.26Bajaj Finance Limited CRISIL A1+ 0.33National Bank For Agriculture and ICRA A1+ 0.33Rural DevelopmentTotal 12.80
Cash & Cash EquivalentNet Receivables/Payables 1.60CBLO / Reverse Repo / Liquid Fund Investments 0.04Total 1.64
##Thinly traded/Non traded securities and illiquid securities as defined in SEBI Regulations and Guidelines.
All corporate ratings are assigned by rating agencies like CRISIL, CARE, ICRA, India Rating, Brickwork.
GRAND TOTAL 100.00
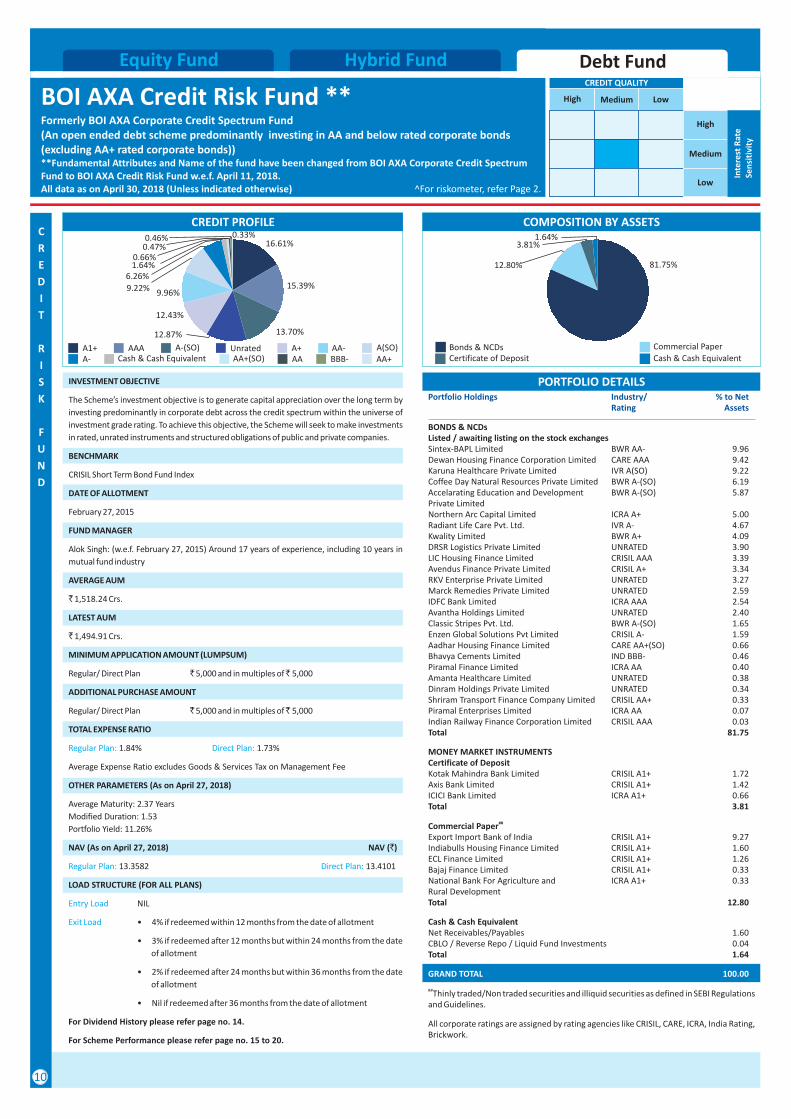
CREDIT PROFILE
CREDIT QUALITY
High Medium Low
Low
Medium
High
Inte
rest
Rat
eSe
nsi
tivi
ty
0.47% 16.61%
9.96%9.22%
12.43%
15.39%
10
INVESTMENT OBJECTIVE
The Scheme’s investment objective is to generate capital appreciation over the long term by
investing predominantly in corporate debt across the credit spectrum within the universe of
investment grade rating. To achieve this objective, the Scheme will seek to make investments
in rated, unrated instruments and structured obligations of public and private companies.
BENCHMARK
CRISIL Short Term Bond Fund Index
DATE OF ALLOTMENT
February 27, 2015
FUND MANAGER
Alok Singh: (w.e.f. February 27, 2015) Around 17 years of experience, including 10 years in
mutual fund industry
AVERAGE AUM
` 1,518.24 Crs.
LATEST AUM
` 1,494.91 Crs.
MINIMUM APPLICATION AMOUNT (LUMPSUM)
Regular/ Direct Plan ` 5,000 and in multiples of ̀ 5,000
ADDITIONAL PURCHASE AMOUNT
Regular/ Direct Plan ` 5,000 and in multiples of ̀ 5,000
TOTAL EXPENSE RATIO
1.84% 1.73%
Average Expense Ratio excludes Goods & Services Tax on Management Fee
OTHER PARAMETERS (As on April 27, 2018)
Average Maturity: 2.37 Years
Modified Duration: 1.53
Portfolio Yield: 11.26%
NAV (As on April 27, 2018) NAV (`)
13.3582 13.4101
LOAD STRUCTURE (FOR ALL PLANS)
NIL
• 4% if redeemed within 12 months from the date of allotment
• 3% if redeemed after 12 months but within 24 months from the date
of allotment
• 2% if redeemed after 24 months but within 36 months from the date
of allotment
• Nil if redeemed after 36 months from the date of allotment
For Dividend History please refer page no. 14.
For Scheme Performance please refer page no. 15 to 20.
Regular Plan: Direct Plan:
Regular Plan: Direct Plan:
Entry Load
Exit Load
0.46%
0.66%
AA+(SO)A-
0.33%
BBB-
1.64%
AA+
6.26%
COMPOSITION BY ASSETS
81.75%
1.64%
12.80%
AA
13.70%
A1+ AAA A-(SO) Unrated A+ AA- A(SO)Cash & Cash Equivalent
12.87%
^For riskometer, refer Page 2.All data as on April 30, 2018 (Unless indicated otherwise)
BOI AXA Credit Risk Fund **Formerly BOI AXA Corporate Credit Spectrum Fund(An open ended debt scheme predominantly investing in AA and below rated corporate bonds (excluding AA+ rated corporate bonds))**Fundamental Attributes and Name of the fund have been changed from BOI AXA Corporate Credit Spectrum Fund to BOI AXA Credit Risk Fund w.e.f. April 11, 2018.
Debt FundHybrid FundEquity Fund
Cash & Cash EquivalentBonds & NCDs Commercial Paper
Certificate of Deposit
3.81%
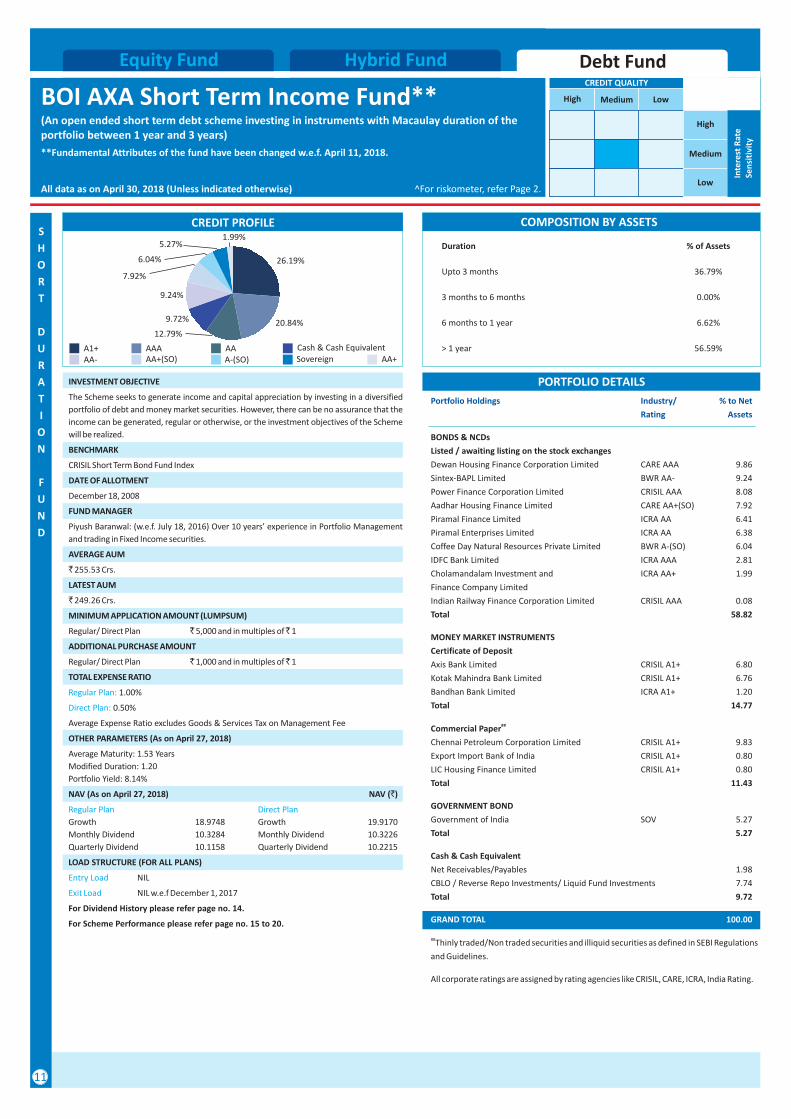
Duration % of Assets
Upto 3 months 36.79%
3 months to 6 months 0.00%
6 months to 1 year 6.62%
> 1 year 56.59%
S
H
O
R
T
D
U
R
A
T
I
O
N
F
U
N
D
PORTFOLIO DETAILS
Portfolio Holdings Industry/ % to Net
Rating Assets
BONDS & NCDs
Listed / awaiting listing on the stock exchanges
Dewan Housing Finance Corporation Limited CARE AAA 9.86
Sintex-BAPL Limited BWR AA- 9.24
Power Finance Corporation Limited CRISIL AAA 8.08
Aadhar Housing Finance Limited CARE AA+(SO) 7.92
Piramal Finance Limited ICRA AA 6.41
Piramal Enterprises Limited ICRA AA 6.38
Coffee Day Natural Resources Private Limited BWR A-(SO) 6.04
IDFC Bank Limited ICRA AAA 2.81
Cholamandalam Investment and ICRA AA+ 1.99
Finance Company Limited
Indian Railway Finance Corporation Limited CRISIL AAA 0.08
Total 58.82
MONEY MARKET INSTRUMENTS
Certificate of Deposit
Axis Bank Limited CRISIL A1+ 6.80
Kotak Mahindra Bank Limited CRISIL A1+ 6.76
Bandhan Bank Limited ICRA A1+ 1.20
Total 14.77
##Commercial Paper
Chennai Petroleum Corporation Limited CRISIL A1+ 9.83
Export Import Bank of India CRISIL A1+ 0.80
LIC Housing Finance Limited CRISIL A1+ 0.80
Total 11.43
GOVERNMENT BOND
Government of India SOV 5.27
Total 5.27
Cash & Cash Equivalent
Net Receivables/Payables 1.98
CBLO / Reverse Repo Investments/ Liquid Fund Investments 7.74
Total 9.72
##Thinly traded/Non traded securities and illiquid securities as defined in SEBI Regulations
and Guidelines.
All corporate ratings are assigned by rating agencies like CRISIL, CARE, ICRA, India Rating.
GRAND TOTAL 100.00
11
CREDIT QUALITY
High Medium Low
Low
Medium
High
Inte
rest
Rat
eSe
nsi
tivi
ty
COMPOSITION BY ASSETSCREDIT PROFILE
INVESTMENT OBJECTIVE
The Scheme seeks to generate income and capital appreciation by investing in a diversified
portfolio of debt and money market securities. However, there can be no assurance that the
income can be generated, regular or otherwise, or the investment objectives of the Scheme
will be realized.
BENCHMARK
CRISIL Short Term Bond Fund Index
DATE OF ALLOTMENT
December 18, 2008
FUND MANAGER
Piyush Baranwal: (w.e.f. July 18, 2016) Over 10 years’ experience in Portfolio Management
and trading in Fixed Income securities.
AVERAGE AUM
` 255.53 Crs.
LATEST AUM
` 249.26 Crs.
MINIMUM APPLICATION AMOUNT (LUMPSUM)
Regular/ Direct Plan ` 5,000 and in multiples of ̀ 1
ADDITIONAL PURCHASE AMOUNT
Regular/ Direct Plan ` 1,000 and in multiples of ̀ 1
TOTAL EXPENSE RATIO
1.00%
0.50%
Average Expense Ratio excludes Goods & Services Tax on Management Fee
OTHER PARAMETERS (As on April 27, 2018)
Average Maturity: 1.53 Years
Modified Duration: 1.20
Portfolio Yield: 8.14%
NAV (As on April 27, 2018) NAV (`)
Growth 18.9748 Growth 19.9170
Monthly Dividend 10.3284 Monthly Dividend 10.3226
Quarterly Dividend 10.1158 Quarterly Dividend 10.2215
LOAD STRUCTURE (FOR ALL PLANS)
NIL
NIL w.e.f December 1, 2017
For Dividend History please refer page no. 14.
For Scheme Performance please refer page no. 15 to 20.
Regular Plan:
Direct Plan:
Regular Plan Direct Plan
Entry Load
Exit Load
SovereignA1+ AAA AA
AA+(SO) A-(SO)AA-
Cash & Cash EquivalentAA+
6.04% 26.19%
9.24%
20.84%
7.92%
1.99%
9.72%
5.27%
12.79%
^For riskometer, refer Page 2.All data as on April 30, 2018 (Unless indicated otherwise)
BOI AXA Short Term Income Fund**(An open ended short term debt scheme investing in instruments with Macaulay duration of the portfolio between 1 year and 3 years)
**Fundamental Attributes of the fund have been changed w.e.f. April 11, 2018.
Debt FundHybrid FundEquity Fund
U
L
T
R
A
S
H
O
R
T
D
U
R
A
T
I
O
N
F
U
N
D
12
PORTFOLIO DETAILSPortfolio Holdings Industry/ % to Net
Rating Assets
BONDS & NCDs
Listed / awaiting listing on the stock exchanges
Piramal Enterprises Limited ICRA AA 12.63
Dewan Housing Finance Corporation Limited CARE AAA 9.96
Power Finance Corporation Limited CRISIL AAA 8.45
Cholamandalam Investment and Finance ICRA AA+ 5.77
Company Limited
Aadhar Housing Finance Limited CARE AA+(SO) 5.03
IDFC Bank Limited ICRA AAA 3.62
Mahindra & Mahindra Financial Services Limited IND AAA 3.23
Total 48.68
MONEY MARKET INSTRUMENTS
Certificate of Deposit
Axis Bank Limited CRISIL A1+ 7.44
Kotak Mahindra Bank Limited CRISIL A1+ 3.20
Total 10.64
##Commercial Paper
Wadhawan Global Capital Pvt Limited CARE A1+ 8.95
Shapoorji Pallonji and Company Pvt Limited ICRA A1+ 8.25
S.D. Corporation Pvt Limited ICRA A1+(SO) 6.40
National Bank For Agriculture and Rural Development ICRA A1+ 5.71
Sterling and Wilson Pvt Limited IND A1+ 3.21
JM Financial Asset Reconstruction Company Limited CRISIL A1+ 3.20
Indiabulls Housing Finance Limited CRISIL A1+ 2.06
Total 37.77
Cash & Cash Equivalent
Net Receivables/Payables 2.89
CBLO / Reverse Repo Investments 0.02
Total 2.91
##Thinly traded/Non traded securities and illiquid securities as defined in SEBI Regulations
and Guidelines.
All corporate ratings are assigned by rating agencies like CRISIL, CARE, ICRA, India Rating.
GRAND TOTAL 100.00
CREDIT QUALITY
High Medium Low
Low
Medium
High
Inte
rest
Rat
eSe
nsi
tivi
ty
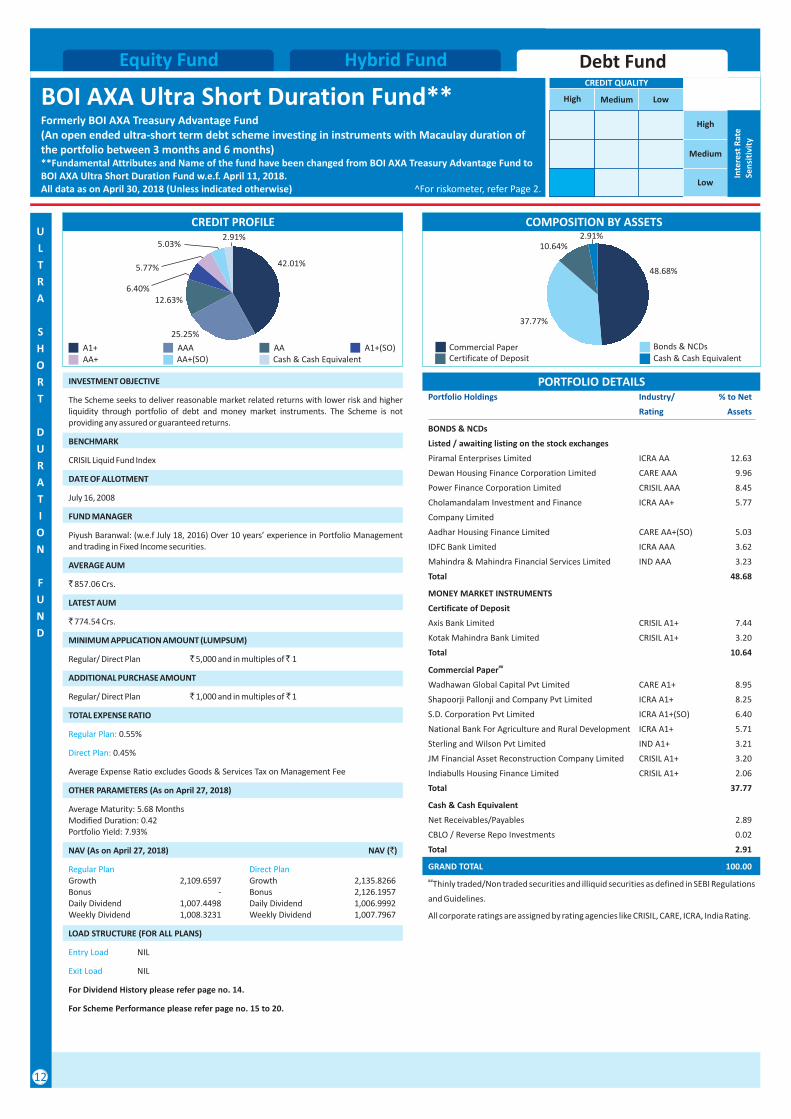
INVESTMENT OBJECTIVE
The Scheme seeks to deliver reasonable market related returns with lower risk and higher liquidity through portfolio of debt and money market instruments. The Scheme is not providing any assured or guaranteed returns.
BENCHMARK
CRISIL Liquid Fund Index
DATE OF ALLOTMENT
July 16, 2008
FUND MANAGER
Piyush Baranwal: (w.e.f July 18, 2016) Over 10 years’ experience in Portfolio Management and trading in Fixed Income securities.
AVERAGE AUM
` 857.06 Crs.
LATEST AUM
` 774.54 Crs.
MINIMUM APPLICATION AMOUNT (LUMPSUM)
Regular/ Direct Plan ` 5,000 and in multiples of ̀ 1
ADDITIONAL PURCHASE AMOUNT
Regular/ Direct Plan ` 1,000 and in multiples of ̀ 1
TOTAL EXPENSE RATIO
0.55%
0.45%
Average Expense Ratio excludes Goods & Services Tax on Management Fee
OTHER PARAMETERS (As on April 27, 2018)
Average Maturity: 5.68 MonthsModified Duration: 0.42Portfolio Yield: 7.93%
NAV (As on April 27, 2018) NAV (`)
Growth 2,109.6597 Growth 2,135.8266Bonus - Bonus 2,126.1957Daily Dividend 1,007.4498 Daily Dividend 1,006.9992Weekly Dividend 1,008.3231 Weekly Dividend 1,007.7967
LOAD STRUCTURE (FOR ALL PLANS)
NIL
NIL
For Dividend History please refer page no. 14.
For Scheme Performance please refer page no. 15 to 20.
Regular Plan:
Direct Plan:
Regular Plan Direct Plan
Entry Load
Exit Load
CREDIT PROFILE
42.01%
6.40%
25.25%
5.77%
2.91%5.03%
12.63%
A1+AA+(SO)AAA AA A1+(SO)
AA+ Cash & Cash Equivalent
COMPOSITION BY ASSETS
48.68%
2.91%10.64%
Cash & Cash EquivalentCommercial Paper Bonds & NCDs
Certificate of Deposit
37.77%
^For riskometer, refer Page 2.All data as on April 30, 2018 (Unless indicated otherwise)
BOI AXA Ultra Short Duration Fund** Formerly BOI AXA Treasury Advantage Fund(An open ended ultra-short term debt scheme investing in instruments with Macaulay duration of the portfolio between 3 months and 6 months)**Fundamental Attributes and Name of the fund have been changed from BOI AXA Treasury Advantage Fund to BOI AXA Ultra Short Duration Fund w.e.f. April 11, 2018.
Debt FundHybrid FundEquity Fund
Debt FundHybrid FundEquity Fund
L
I
Q
U
I
D
F
U
N
D
# Disclaimer for CRISIL AAAmfs: The assigned rating AAAmfs is valid only for “BOI AXA Liquid Fund”. The rating of CRISIL is not an opinion of the Asset Management Company’s willingness or ability to make timely payments to the investor. The rating is also not an opinion on the stability of the NAV of the Fund, which could vary with market developments.The rating indicates that the funds' portfolios will provide 'very strong' protection against losses from credit default. CRISIL's assessment of a rated fund's credit quality is based on the creditworthiness of the fund's portfolio. CRISIL reserves the right to suspend, withdraw or revise the ratings assigned to the scheme at any time on the basis of new information, or unavailability of information or other circumstances, which CRISIL believes, may have an impact on the rating. For detail methodology, please visit CRISIL's website www.crisil.com. Past performance is no guarantee of the future results.$Disclaimer for ICRA AAAmfs: Schemes with this rating are considered to have the highest degree of safety regarding timely receipt of payments from the investments that they have made. This rating should however, not be construed as an indication of the performance of the Mutual Fund scheme or of volatility in its returns. The rating should not be treated as a recommendation to buy, sell or hold units issued by the Mutual Fund.
PORTFOLIO DETAILSPortfolio Holdings Industry/ % to Net
Rating Assets
BONDS & NCDsListed / awaiting listing on the stock exchangesHousing Development Finance Corporation Limited CRISIL AAA 7.23Total 7.23
MONEY MARKET INSTRUMENTSCertificate of DepositICICI Bank Limited ICRA A1+ 7.17IndusInd Bank Limited CRISIL A1+ 6.24Axis Bank Limited CRISIL A1+ 3.13Kotak Mahindra Bank Limited CRISIL A1+ 3.11Axis Bank Limited CRISIL A1+ 1.77IDFC Bank Limited ICRA A1+ 1.56Total 22.99
##Commercial PaperNational Bank For Agriculture and Rural Development ICRA A1+ 9.72ECL Finance Limited CRISIL A1+ 7.88Export Import Bank of India CRISIL A1+ 6.83IL&FS Financial Services Limited IND A1+ 6.22LIC Housing Finance Limited CRISIL A1+ 6.12Shriram Transport Finance Company Limited CRISIL A1+ 5.30Shapoorji Pallonji and Company Pvt Limited ICRA A1+ 4.38Dewan Housing Finance Corporation Limited CRISIL A1+ 3.13S.D. Corporation Pvt Limited ICRA A1+(SO) 3.11PTC India Financial Services Limited CRISIL A1+ 3.10KEC International Limited CRISIL A1+ 2.50Chennai Petroleum Corporation Limited CRISIL A1+ 1.66Sterling and Wilson Pvt Limited IND A1+ 1.56Forbes & Company Limited ICRA A1+ 0.62Total 62.15
FIXED DEPOSITS (MARGIN)Bandhan Bank Limited 3.14Ujjivan Small Finance Bank Limited 3.14Total 6.28
Treasury BillGovernment of India SOV 0.94Total 0.94
Cash & Cash EquivalentNet Receivables/Payables 0.42CBLO / Reverse Repo Investments 0.00Total 0.42
##Thinly traded/Non traded securities and illiquid securities as defined in SEBI Regulations and Guidelines.
All corporate ratings are assigned by rating agencies like CRISIL, CARE, ICRA, India Rating.
GRAND TOTAL 100.00
13
CREDIT QUALITY
High Medium Low
Low
Medium
High
Inte
rest
Rat
eSe
nsi
tivi
ty
CREDIT PROFILE
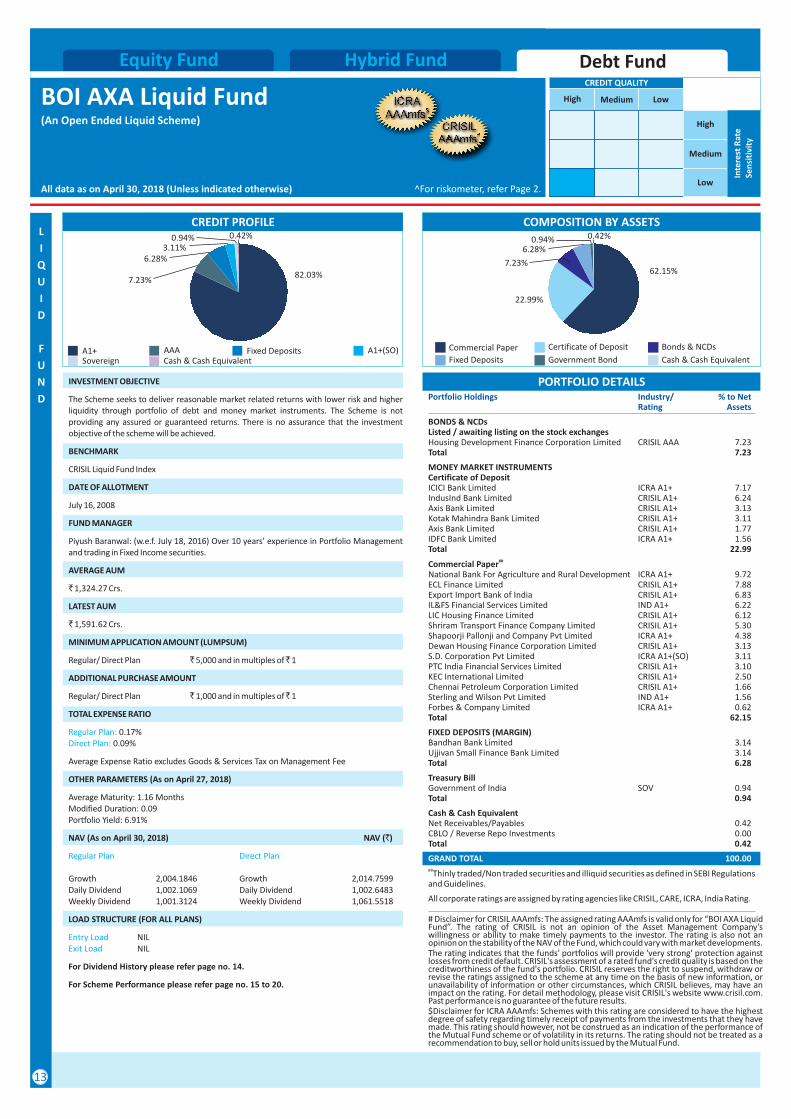
INVESTMENT OBJECTIVE
The Scheme seeks to deliver reasonable market related returns with lower risk and higher liquidity through portfolio of debt and money market instruments. The Scheme is not providing any assured or guaranteed returns. There is no assurance that the investment objective of the scheme will be achieved.
BENCHMARK
CRISIL Liquid Fund Index
DATE OF ALLOTMENT
July 16, 2008
FUND MANAGER
Piyush Baranwal: (w.e.f. July 18, 2016) Over 10 years’ experience in Portfolio Management and trading in Fixed Income securities.
AVERAGE AUM
` 1,324.27 Crs.
LATEST AUM
` 1,591.62 Crs.
MINIMUM APPLICATION AMOUNT (LUMPSUM)
Regular/ Direct Plan ` 5,000 and in multiples of ̀ 1
ADDITIONAL PURCHASE AMOUNT
Regular/ Direct Plan ` 1,000 and in multiples of ̀ 1
TOTAL EXPENSE RATIO
0.17% 0.09%
Average Expense Ratio excludes Goods & Services Tax on Management Fee
OTHER PARAMETERS (As on April 27, 2018)
Average Maturity: 1.16 MonthsModified Duration: 0.09Portfolio Yield: 6.91%
NAV (As on April 30, 2018) NAV (`)
Growth 2,004.1846 Growth 2,014.7599Daily Dividend 1,002.1069 Daily Dividend 1,002.6483Weekly Dividend 1,001.3124 Weekly Dividend 1,061.5518
LOAD STRUCTURE (FOR ALL PLANS)
NILNIL
For Dividend History please refer page no. 14.
For Scheme Performance please refer page no. 15 to 20.
Regular Plan:Direct Plan:
Regular Plan Direct Plan
Entry LoadExit Load
AAAA1+ A1+(SO)
82.03%
0.42%
6.28%3.11%
7.23%
COMPOSITION BY ASSETS
62.15%
0.42%
6.28%0.94%
Certificate of DepositCommercial Paper
Cash & Cash EquivalentFixed Deposits Government Bond
Bonds & NCDs
22.99%
7.23%
^For riskometer, refer Page 2.All data as on April 30, 2018 (Unless indicated otherwise)
BOI AXA Liquid Fund(An Open Ended Liquid Scheme)
0.94%
Cash & Cash EquivalentSovereignFixed Deposits
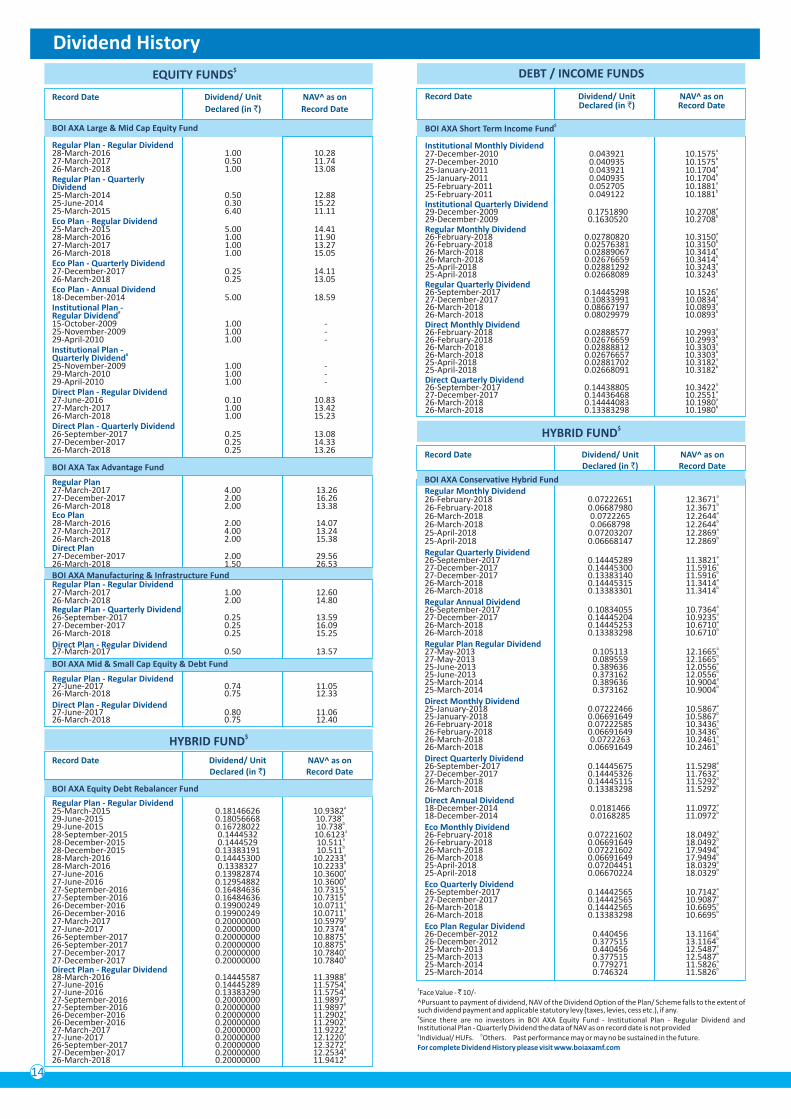
Dividend History$EQUITY FUNDS
Record Date Dividend/ Unit NAV^ as on
Declared (in `) Record Date
BOI AXA Large & Mid Cap Equity Fund
Regular Plan - Regular Dividend
Regular Plan - Quarterly Dividend
Eco Plan - Regular Dividend
Eco Plan - Quarterly Dividend
Eco Plan - Annual Dividend
Institutional Plan - #Regular Dividend
Institutional Plan - #Quarterly Dividend
Direct Plan - Regular Dividend
Direct Plan - Quarterly Dividend
28-March-2016 1.00 10.2827-March-2017 0.50 11.7426-March-2018 1.00 13.08
25-March-2014 0.50 12.8825-June-2014 0.30 15.2225-March-2015 6.40 11.11
25-March-2015 5.00 14.4128-March-2016 1.00 11.9027-March-2017 1.00 13.2726-March-2018 1.00 15.05
27-December-2017 0.25 14.1126-March-2018 0.25 13.05
18-December-2014 5.00 18.59
15-October-2009 1.00 - 25-November-2009 1.00 - 29-April-2010 1.00 -
25-November-2009 1.00 - 29-March-2010 1.00 - 29-April-2010 1.00 -
27-June-2016 0.10 10.8327-March-2017 1.00 13.4226-March-2018 1.00 15.23
26-September-2017 0.25 13.0827-December-2017 0.25 14.3326-March-2018 0.25 13.26
$Face Value - ̀ 10/- ^Pursuant to payment of dividend, NAV of the Dividend Option of the Plan/ Scheme falls to the extent of such dividend payment and applicable statutory levy (taxes, levies, cess etc.), if any. #Since there are no investors in BOI AXA Equity Fund - Institutional Plan - Regular Dividend and Institutional Plan - Quarterly Dividend the data of NAV as on record date is not provideda bIndividual/ HUFs. Others. Past performance may or may no be sustained in the future.
For complete Dividend History please visit www.boiaxamf.com
DEBT / INCOME FUNDS
Record Date Dividend/ Unit NAV^ as onDeclared (in `) Record Date
$BOI AXA Short Term Income Fund
Institutional Monthly Dividend
Institutional Quarterly Dividend
Regular Monthly Dividend
Regular Quarterly Dividend
Direct Monthly Dividend
Direct Quarterly Dividend
a27-December-2010 0.043921 10.1575b27-December-2010 0.040935 10.1575a25-January-2011 0.043921 10.1704b25-January-2011 0.040935 10.1704a25-February-2011 0.052705 10.1881b25-February-2011 0.049122 10.1881
a29-December-2009 0.1751890 10.2708b29-December-2009 0.1630520 10.2708
a26-February-2018 0.02780820 10.3150b26-February-2018 0.02576381 10.3150a26-March-2018 0.02889067 10.3414b26-March-2018 0.02676659 10.3414a25-April-2018 0.02881292 10.3243b25-April-2018 0.02668089 10.3243
a26-September-2017 0.14445298 10.1526a27-December-2017 0.10833991 10.0834a26-March-2018 0.08667197 10.0893b26-March-2018 0.08029979 10.0893
a26-February-2018 0.02888577 10.2993b26-February-2018 0.02676659 10.2993a26-March-2018 0.02888812 10.3303b26-March-2018 0.02676657 10.3303a25-April-2018 0.02881702 10.3182b25-April-2018 0.02668091 10.3182
a26-September-2017 0.14438805 10.3422a27-December-2017 0.14436468 10.2551a26-March-2018 0.14444083 10.1980b26-March-2018 0.13383298 10.1980
$HYBRID FUND
Record Date Dividend/ Unit NAV^ as onDeclared (in `) Record Date
BOI AXA Conservative Hybrid FundRegular Monthly Dividend
Regular Quarterly Dividend
Regular Annual Dividend
Regular Plan Regular Dividend
Direct Monthly Dividend
Direct Quarterly Dividend
Direct Annual Dividend
Eco Monthly Dividend
Eco Quarterly Dividend
Eco Plan Regular Dividend
a26-February-2018 0.07222651 12.3671b26-February-2018 0.06687980 12.3671a26-March-2018 0.0722265 12.2644b26-March-2018 0.0668798 12.2644a25-April-2018 0.07203207 12.2869b25-April-2018 0.06668147 12.2869
a26-September-2017 0.14445289 11.3821a27-December-2017 0.14445300 11.5916b27-December-2017 0.13383140 11.5916a26-March-2018 0.14445315 11.3414b26-March-2018 0.13383301 11.3414
a26-September-2017 0.10834055 10.7364a27-December-2017 0.14445204 10.9235a26-March-2018 0.14445253 10.6710b26-March-2018 0.13383298 10.6710
a27-May-2013 0.105113 12.1665b27-May-2013 0.089559 12.1665a25-June-2013 0.389636 12.0556b25-June-2013 0.373162 12.0556a25-March-2014 0.389636 10.9004b25-March-2014 0.373162 10.9004
a25-January-2018 0.07222466 10.5867b25-January-2018 0.06691649 10.5867a26-February-2018 0.07222585 10.3436b26-February-2018 0.06691649 10.3436a26-March-2018 0.0722263 10.2461b26-March-2018 0.06691649 10.2461
a26-September-2017 0.14445675 11.5298a27-December-2017 0.14445326 11.7632a26-March-2018 0.14445115 11.5292b26-March-2018 0.13383298 11.5292
a18-December-2014 0.0181466 11.0972b18-December-2014 0.0168285 11.0972
a26-February-2018 0.07221602 18.0492b26-February-2018 0.06691649 18.0492a26-March-2018 0.07221602 17.9494b26-March-2018 0.06691649 17.9494a25-April-2018 0.07204451 18.0329b25-April-2018 0.06670224 18.0329
a26-September-2017 0.14442565 10.7142a27-December-2017 0.14442565 10.9087a26-March-2018 0.14442565 10.6695b26-March-2018 0.13383298 10.6695
a26-December-2012 0.440456 13.1164b26-December-2012 0.377515 13.1164a25-March-2013 0.440456 12.5487b25-March-2013 0.377515 12.5487a25-March-2014 0.779271 11.5826b25-March-2014 0.746324 11.5826
14
$HYBRID FUND
Record Date Dividend/ Unit NAV^ as onDeclared (in `) Record Date
BOI AXA Equity Debt Rebalancer Fund
Regular Plan - Regular Dividend
Direct Plan - Regular Dividend
a25-March-2015 0.18146626 10.9382a29-June-2015 0.18056668 10.738b29-June-2015 0.16728022 10.738
a28-September-2015 0.1444532 10.6123a28-December-2015 0.1444529 10.511b28-December-2015 0.13383191 10.511a28-March-2016 0.14445300 10.2233b28-March-2016 0.1338327 10.2233a27-June-2016 0.13982874 10.3600b27-June-2016 0.12954882 10.3600a27-September-2016 0.16484636 10.7315b27-September-2016 0.16484636 10.7315a26-December-2016 0.19900249 10.0711b26-December-2016 0.19900249 10.0711a27-March-2017 0.20000000 10.5979a27-June-2017 0.20000000 10.7374a26-September-2017 0.20000000 10.8875b26-September-2017 0.20000000 10.8875a27-December-2017 0.20000000 10.7840b27-December-2017 0.20000000 10.7840
a28-March-2016 0.14445587 11.3988a27-June-2016 0.14445289 11.5754b27-June-2016 0.13383290 11.5754a27-September-2016 0.20000000 11.9897b27-September-2016 0.20000000 11.9897a26-December-2016 0.20000000 11.2902b26-December-2016 0.20000000 11.2902a27-March-2017 0.20000000 11.9222a27-June-2017 0.20000000 12.1220a26-September-2017 0.20000000 12.3272a27-December-2017 0.20000000 12.2534a26-March-2018 0.20000000 11.9412
BOI AXA Tax Advantage Fund
BOI AXA Manufacturing & Infrastructure Fund
BOI AXA Mid & Small Cap Equity & Debt Fund
Regular Plan
Eco Plan
Direct Plan
Regular Plan - Regular Dividend
Regular Plan - Quarterly Dividend
Direct Plan - Regular Dividend
Regular Plan - Regular Dividend
Direct Plan - Regular Dividend
27-March-2017 4.00 13.2627-December-2017 2.00 16.2626-March-2018 2.00 13.38
28-March-2016 2.00 14.0727-March-2017 4.00 13.2426-March-2018 2.00 15.38
27-December-2017 2.00 29.5626-March-2018 1.50 26.53
27-March-2017 1.00 12.6026-March-2018 2.00 14.80
26-September-2017 0.25 13.5927-December-2017 0.25 16.0926-March-2018 0.25 15.25
27-March-2017 0.50 13.57
27-June-2017 0.74 11.0526-March-2018 0.75 12.33
27-June-2017 0.80 11.0626-March-2018 0.75 12.40
15
Fund - Manager wise Scheme PerformanceAll data as on April 30, 2018 (Unless indicated otherwise)
@Period Scheme Returns
(%) ^
Benchmark Returns
(BSE 200 TRI)(%)
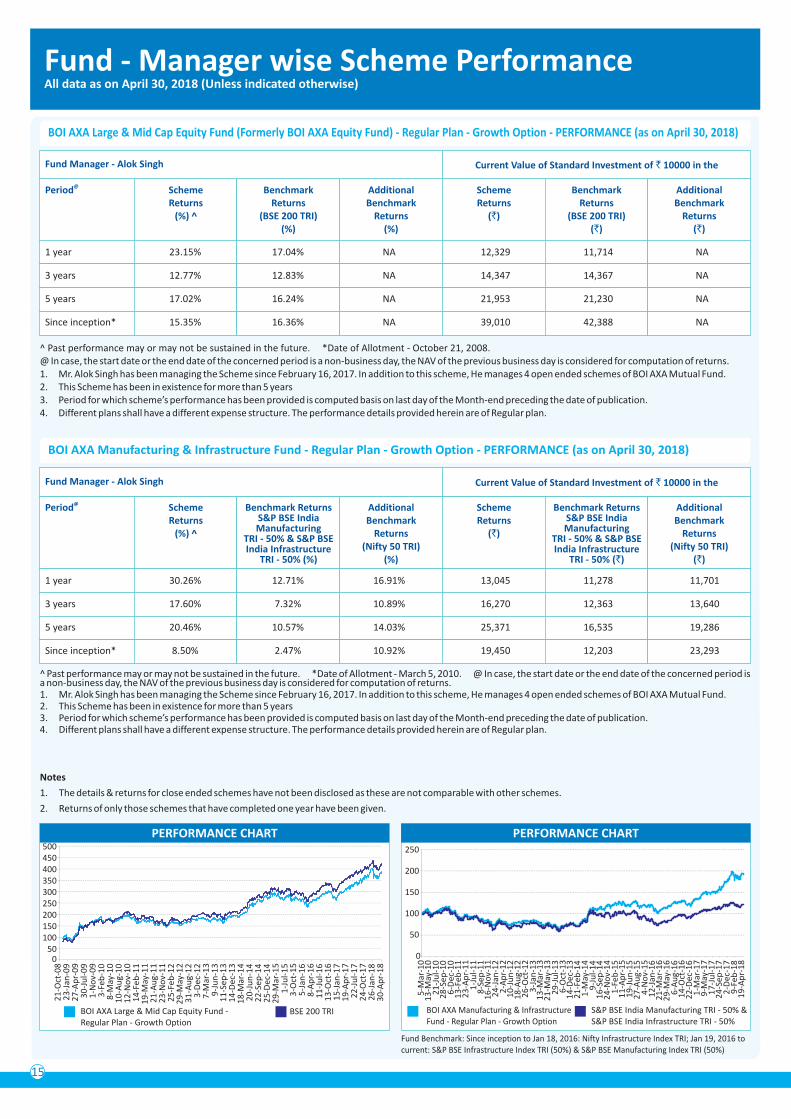
^ Past performance may or may not be sustained in the future. *Date of Allotment - October 21, 2008.@ In case, the start date or the end date of the concerned period is a non-business day, the NAV of the previous business day is considered for computation of returns.1. Mr. Alok Singh has been managing the Scheme since February 16, 2017. In addition to this scheme, He manages 4 open ended schemes of BOI AXA Mutual Fund.2. This Scheme has been in existence for more than 5 years 3. Period for which scheme’s performance has been provided is computed basis on last day of the Month-end preceding the date of publication.4. Different plans shall have a different expense structure. The performance details provided herein are of Regular plan.
BOI AXA Large & Mid Cap Equity Fund (Formerly BOI AXA Equity Fund) - Regular Plan - Growth Option - PERFORMANCE (as on April 30, 2018)
PERFORMANCE CHART
BOI AXA Large & Mid Cap Equity Fund - Regular Plan - Growth Option
BSE 200 TRI
Additional Benchmark
Returns(%)
Scheme Returns
(`)
Benchmark Returns
(BSE 200 TRI)(`)
Additional Benchmark
Returns(`)
1 year 23.15% 17.04% NA 12,329 11,714 NA
3 years 12.77% 12.83% NA 14,347 14,367 NA
5 years 17.02% 16.24% NA 21,953 21,230 NA
Since inception* 15.35% 16.36% NA 39,010 42,388 NA
Current Value of Standard Investment of ` 10000 in the
@Period Scheme Returns
(%) ^
Benchmark Returns S&P BSE India Manufacturing
TRI - 50% & S&P BSE India Infrastructure
TRI - 50% (%)
^ Past performance may or may not be sustained in the future. *Date of Allotment - March 5, 2010. @ In case, the start date or the end date of the concerned period is a non-business day, the NAV of the previous business day is considered for computation of returns.1. Mr. Alok Singh has been managing the Scheme since February 16, 2017. In addition to this scheme, He manages 4 open ended schemes of BOI AXA Mutual Fund.2. This Scheme has been in existence for more than 5 years 3. Period for which scheme’s performance has been provided is computed basis on last day of the Month-end preceding the date of publication.4. Different plans shall have a different expense structure. The performance details provided herein are of Regular plan.
BOI AXA Manufacturing & Infrastructure Fund - Regular Plan - Growth Option - PERFORMANCE (as on April 30, 2018)
Additional Benchmark
Returns (Nifty 50 TRI)
(%)
Scheme Returns
(`)
Benchmark Returns S&P BSE India Manufacturing
TRI - 50% & S&P BSE India Infrastructure
TRI - 50% (`)
Additional Benchmark
Returns (Nifty 50 TRI)
(`)
1 year 30.26% 12.71% 16.91% 13,045 11,278 11,701
3 years 17.60% 7.32% 10.89% 16,270 12,363 13,640
5 years 20.46% 10.57% 14.03% 25,371 16,535 19,286
Since inception* 8.50% 2.47% 10.92% 19,450 12,203 23,293
Current Value of Standard Investment of ` 10000 in the
Notes
1. The details & returns for close ended schemes have not been disclosed as these are not comparable with other schemes.
2. Returns of only those schemes that have completed one year have been given.
PERFORMANCE CHART
BOI AXA Manufacturing & InfrastructureFund - Regular Plan - Growth Option
S&P BSE India Manufacturing TRI - 50% &S&P BSE India Infrastructure TRI - 50%
0
50
100
250
150
Fund Manager - Alok Singh
Fund Manager - Alok Singh
200
050
100150200250300350400450500
21
-Oct
-08
23
-Jan
-09
27
-Ap
r-0
93
0-J
ul-
09
1-N
ov-
09
3-F
eb-1
08
-May
-10
10
-Au
g-1
01
2-N
ov-
10
14
-Feb
-11
19
-May
-11
21
-Au
g-1
12
3-N
ov-
11
25
-Feb
-12
29
-May
-12
31
-Au
g-1
23
-Dec
-12
7-M
ar-1
39
-Ju
n-1
31
1-S
ep-1
31
4-D
ec-1
31
8-M
ar-1
42
0-J
un
-14
22
-Sep
-14
25
-Dec
-14
29
-Mar
-15
1-J
ul-
15
3-O
ct-1
55
-Jan
-16
8-A
pr-
16
11
-Ju
l-1
61
3-O
ct-1
61
5-J
an-1
71
9-A
pr-
17
22
-Ju
l-1
72
4-O
ct-1
72
6-J
an-1
83
0-A
pr-
18
5-M
ar-1
01
3-M
ay-1
02
1-J
ul-
10
28
-Sep
-10
6-D
ec-1
01
3-F
eb-1
12
3-A
pr-
11
1-J
ul-
11
8-S
ep-1
11
6-N
ov-
11
24
-Jan
-12
2-A
pr-
12
10
-Ju
n-1
21
8-A
ug-
12
26
-Oct
-12
3-J
an-1
31
3-M
ar-1
32
1-M
ay-1
32
9-J
ul-
13
6-O
ct-1
31
4-D
ec-1
32
1-F
eb-1
41
-May
-14
9-J
ul-
14
16
-Sep
-14
24
-No
v-1
41
-Feb
-15
11
-Ap
r-1
51
9-J
un
-15
27
-Au
g-1
54
-No
v-1
51
2-J
an-1
62
1-M
ar-1
62
9-M
ay-1
66
-Au
g-1
61
4-O
ct-1
62
2-D
ec-1
61
-Mar
-17
9-M
ay-1
71
7-J
ul-
17
24
-Sep
-17
2-D
ec-1
79
-Feb
-18
19
-Ap
r-1
8
Fund Benchmark: Since inception to Jan 18, 2016: Nifty Infrastructure Index TRI; Jan 19, 2016 to current: S&P BSE Infrastructure Index TRI (50%) & S&P BSE Manufacturing Index TRI (50%)
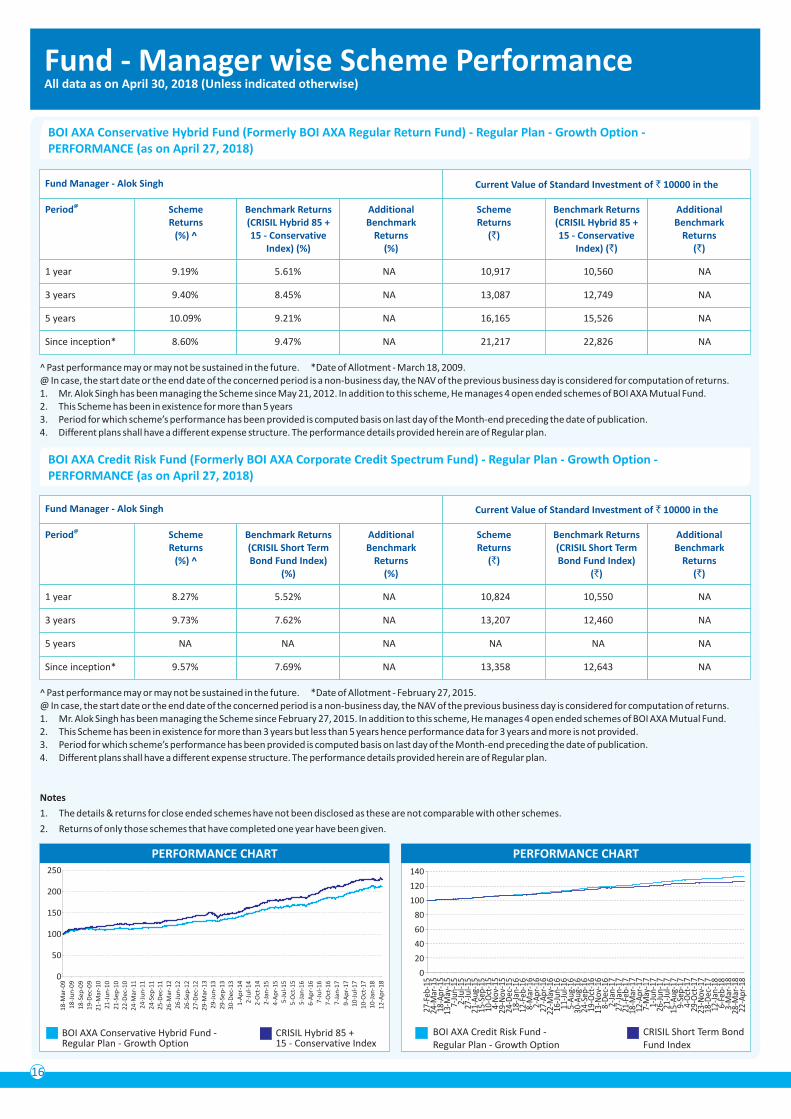
16
Fund - Manager wise Scheme PerformanceAll data as on April 30, 2018 (Unless indicated otherwise)
@Period Scheme Returns
(%) ^
Benchmark Returns(CRISIL Hybrid 85 + 15 - Conservative
Index) (%)
^ Past performance may or may not be sustained in the future. *Date of Allotment - March 18, 2009.@ In case, the start date or the end date of the concerned period is a non-business day, the NAV of the previous business day is considered for computation of returns.1. Mr. Alok Singh has been managing the Scheme since May 21, 2012. In addition to this scheme, He manages 4 open ended schemes of BOI AXA Mutual Fund.2. This Scheme has been in existence for more than 5 years 3. Period for which scheme’s performance has been provided is computed basis on last day of the Month-end preceding the date of publication.4. Different plans shall have a different expense structure. The performance details provided herein are of Regular plan.
BOI AXA Conservative Hybrid Fund (Formerly BOI AXA Regular Return Fund) - Regular Plan - Growth Option -PERFORMANCE (as on April 27, 2018)
Additional Benchmark
Returns(%)
Scheme Returns
(`)
Benchmark Returns(CRISIL Hybrid 85 + 15 - Conservative
Index) (`)
Additional Benchmark
Returns(`)
1 year 9.19% 5.61% NA 10,917 10,560 NA
3 years 9.40% 8.45% NA 13,087 12,749 NA
5 years 10.09% 9.21% NA 16,165 15,526 NA
Since inception* 8.60% 9.47% NA 21,217 22,826 NA
Current Value of Standard Investment of ` 10000 in the
Notes
1. The details & returns for close ended schemes have not been disclosed as these are not comparable with other schemes.
2. Returns of only those schemes that have completed one year have been given.
PERFORMANCE CHART
BOI AXA Conservative Hybrid Fund -Regular Plan - Growth Option
CRISIL Hybrid 85 + 15 - Conservative Index
0
50
100
150
200
250
Fund Manager - Alok Singh
@Period Scheme Returns
(%) ^
Benchmark Returns(CRISIL Short TermBond Fund Index)
(%)
^ Past performance may or may not be sustained in the future. *Date of Allotment - February 27, 2015. @ In case, the start date or the end date of the concerned period is a non-business day, the NAV of the previous business day is considered for computation of returns.1. Mr. Alok Singh has been managing the Scheme since February 27, 2015. In addition to this scheme, He manages 4 open ended schemes of BOI AXA Mutual Fund.2. This Scheme has been in existence for more than 3 years but less than 5 years hence performance data for 3 years and more is not provided. 3. Period for which scheme’s performance has been provided is computed basis on last day of the Month-end preceding the date of publication.4. Different plans shall have a different expense structure. The performance details provided herein are of Regular plan.
BOI AXA Credit Risk Fund (Formerly BOI AXA Corporate Credit Spectrum Fund) - Regular Plan - Growth Option -PERFORMANCE (as on April 27, 2018)
Additional Benchmark
Returns(%)
Scheme Returns
(`)
Benchmark Returns(CRISIL Short TermBond Fund Index)
(`)
Additional Benchmark
Returns(`)
1 year 8.27% 5.52% NA 10,824 10,550 NA
3 years 9.73% 7.62% NA 13,207 12,460 NA
5 years NA NA NA NA NA NA
Since inception* 9.57% 7.69% NA 13,358 12,643 NA
Current Value of Standard Investment of ` 10000 in theFund Manager - Alok Singh
BOI AXA Credit Risk Fund -Regular Plan - Growth Option
CRISIL Short Term BondFund Index
PERFORMANCE CHART
0
20
40
60
80
100
120
140
18
-Mar
-09
18
-Ju
n-0
9
18
-Sep
-09
19
-Dec
-09
21
-Mar
-10
21
-Ju
n-1
0
21
-Sep
-10
22
-Dec
-10
24
-Mar
-11
24
-Ju
n-1
1
24
-Sep
-11
25
-Dec
-11
26
-Mar
-12
26
-Ju
n-1
2
26
-Sep
-12
27
-Dec
-12
29
-Mar
-13
29
-Ju
n-1
3
29
-Sep
-13
30
-Dec
-13
1-A
pr-
14
2-J
ul-
14
2-O
ct-1
4
2-J
an-1
5
4-A
pr-
15
5-J
ul-
15
5-O
ct-1
5
5-J
an-1
6
6-A
pr-
16
7-J
ul-
16
7-O
ct-1
6
7-J
an-1
7
9-A
pr-
17
10
-Ju
l-1
7
10
-Oct
-17
10
-Jan
-18
12
-Ap
r-1
8
27-F
eb-1
524
-Mar
-15
18-A
pr-1
513
-May
-15
7-Ju
n-15
2-Ju
l-15
27-J
ul-1
521
-Aug
-15
15-S
ep-1
510
-Oct
-15
4-N
ov-1
529
-Nov
-15
24-D
ec-1
518
-Jan
-16
12-F
eb-1
68-
Mar
-16
2-A
pr-1
627
-Apr
-16
22-M
ay-1
616
-Jun
-16
11-J
ul-1
65-
Aug
-16
30-A
ug-1
624
-Sep
-16
19-O
ct-1
613
-Nov
-16
8-D
ec-1
62-
Jan-
1727
-Jan
-17
21-F
eb-1
718
-Mar
-17
12-A
pr-1
77-
May
-17
1-Ju
n-17
26-J
un-1
721
-Jul
-17
15-A
ug-1
79-
Sep-
174-
Oct
-17
29-O
ct-1
723
-Nov
-17
18-D
ec-1
712
-Jan
-18
6-Fe
b-18
3-M
ar-1
828
-Mar
-18
22-A
pr-1
8
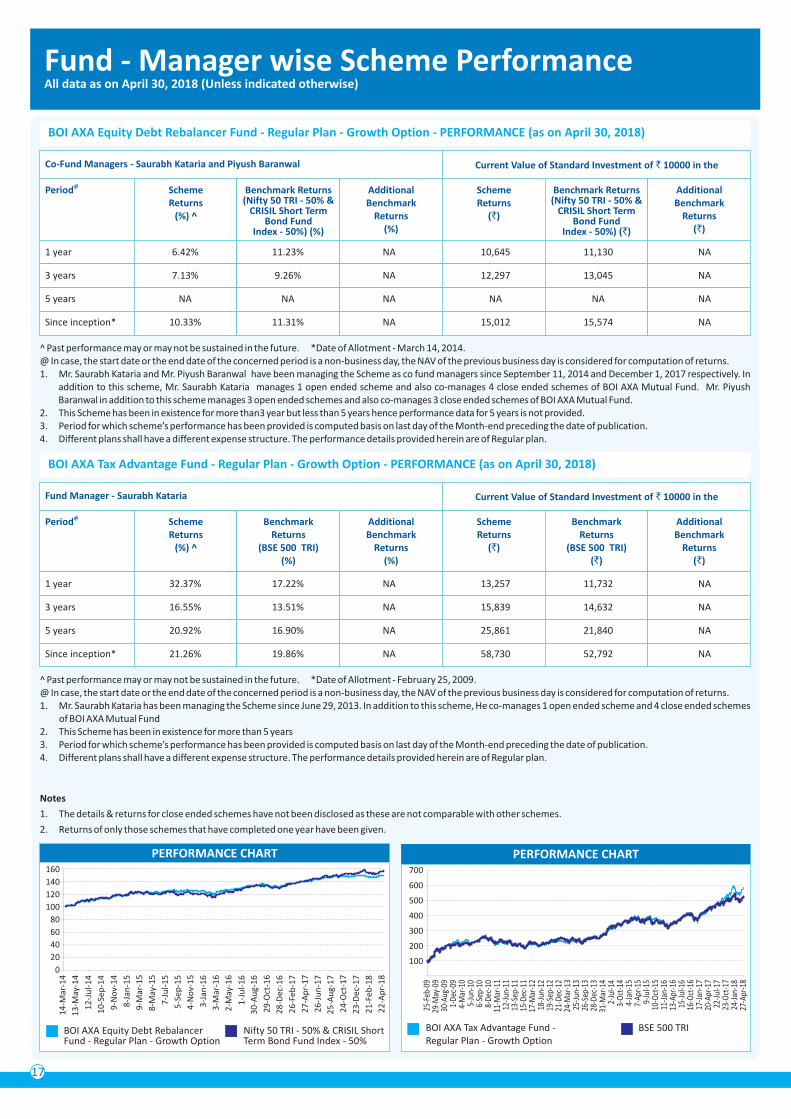
17
Fund - Manager wise Scheme PerformanceAll data as on April 30, 2018 (Unless indicated otherwise)
@Period Scheme Returns
(%) ^
Benchmark Returns(Nifty 50 TRI - 50% &
CRISIL Short Term Bond Fund
Index - 50%) (%)
^ Past performance may or may not be sustained in the future. *Date of Allotment - March 14, 2014. @ In case, the start date or the end date of the concerned period is a non-business day, the NAV of the previous business day is considered for computation of returns.1. Mr. Saurabh Kataria and Mr. Piyush Baranwal have been managing the Scheme as co fund managers since September 11, 2014 and December 1, 2017 respectively. In
addition to this scheme, Mr. Saurabh Kataria manages 1 open ended scheme and also co-manages 4 close ended schemes of BOI AXA Mutual Fund. Mr. Piyush Baranwal in addition to this scheme manages 3 open ended schemes and also co-manages 3 close ended schemes of BOI AXA Mutual Fund.
2. This Scheme has been in existence for more than3 year but less than 5 years hence performance data for 5 years is not provided.3. Period for which scheme’s performance has been provided is computed basis on last day of the Month-end preceding the date of publication.4. Different plans shall have a different expense structure. The performance details provided herein are of Regular plan.
BOI AXA Equity Debt Rebalancer Fund - Regular Plan - Growth Option - PERFORMANCE (as on April 30, 2018)
Additional Benchmark
Returns(%)
Scheme Returns
(`)
Benchmark Returns(Nifty 50 TRI - 50% &
CRISIL Short Term Bond Fund
Index - 50%) (`)
Additional Benchmark
Returns(`)
1 year 6.42% 11.23% NA 10,645 11,130 NA
3 years 7.13% 9.26% NA 12,297 13,045 NA
5 years NA NA NA NA NA NA
Since inception* 10.33% 11.31% NA 15,012 15,574 NA
Current Value of Standard Investment of ` 10000 in the
Notes
1. The details & returns for close ended schemes have not been disclosed as these are not comparable with other schemes.
2. Returns of only those schemes that have completed one year have been given.
BOI AXA Equity Debt Rebalancer Fund - Regular Plan - Growth Option
Nifty 50 TRI - 50% & CRISIL Short Term Bond Fund Index - 50%
PERFORMANCE CHART
0
20
40
60
80
100
120
160
Co-Fund Managers - Saurabh Kataria and Piyush Baranwal
@Period Scheme Returns
(%) ^
Benchmark Returns
(BSE 500 TRI)(%)
^ Past performance may or may not be sustained in the future. *Date of Allotment - February 25, 2009. @ In case, the start date or the end date of the concerned period is a non-business day, the NAV of the previous business day is considered for computation of returns.1. Mr. Saurabh Kataria has been managing the Scheme since June 29, 2013. In addition to this scheme, He co-manages 1 open ended scheme and 4 close ended schemes
of BOI AXA Mutual Fund2. This Scheme has been in existence for more than 5 years 3. Period for which scheme’s performance has been provided is computed basis on last day of the Month-end preceding the date of publication.4. Different plans shall have a different expense structure. The performance details provided herein are of Regular plan.
BOI AXA Tax Advantage Fund - Regular Plan - Growth Option - PERFORMANCE (as on April 30, 2018)
Additional Benchmark
Returns(%)
Scheme Returns
(`)
Benchmark Returns
(BSE 500 TRI)(`)
Additional Benchmark
Returns(`)
1 year 32.37% 17.22% NA 13,257 11,732 NA
3 years 16.55% 13.51% NA 15,839 14,632 NA
5 years 20.92% 16.90% NA 25,861 21,840 NA
Since inception* 21.26% 19.86% NA 58,730 52,792 NA
Current Value of Standard Investment of ` 10000 in theFund Manager - Saurabh Kataria
BOI AXA Tax Advantage Fund - Regular Plan - Growth Option
BSE 500 TRI
100
200
300
400
700
PERFORMANCE CHART
500
140 600
14
-Mar
-14
13
-May
-14
12
-Ju
l-1
4
10
-Sep
-14
9-N
ov-
14
8-J
an-1
5
9-M
ar-1
5
8-M
ay-1
5
7-J
ul-
15
5-S
ep-1
5
4-N
ov-
15
3-J
an-1
6
3-M
ar-1
6
2-M
ay-1
6
1-J
ul-
16
30
-Au
g-1
6
29
-Oct
-16
28
-Dec
-16
26
-Feb
-17
27
-Ap
r-1
7
26
-Ju
n-1
7
25
-Au
g-1
7
24
-Oct
-17
23
-Dec
-17
21
-Feb
-18
22
-Ap
r-1
8
25-F
eb-0
929
-May
-09
30-A
ug-0
91-
Dec
-09
4-M
ar-1
05-
Jun-
106-
Sep-
108-
Dec
-10
11-M
ar-1
112
-Jun
-11
13-S
ep-1
115
-Dec
-11
17-M
ar-1
218
-Jun
-12
19-S
ep-1
221
-Dec
-12
24-M
ar-1
325
-Jun
-13
26-S
ep-1
328
-Dec
-13
31-M
ar-1
42-
Jul-1
43-
Oct
-14
4-Ja
n-15
7-Ap
r-15
9-Ju
l-15
10-O
ct-1
511
-Jan
-16
13-A
pr-1
615
-Jul
-16
16-O
ct-1
617
-Jan
-17
20-A
pr-1
722
-Jul
-17
23-O
ct-1
724
-Jan
-18
27-A
pr-1
8
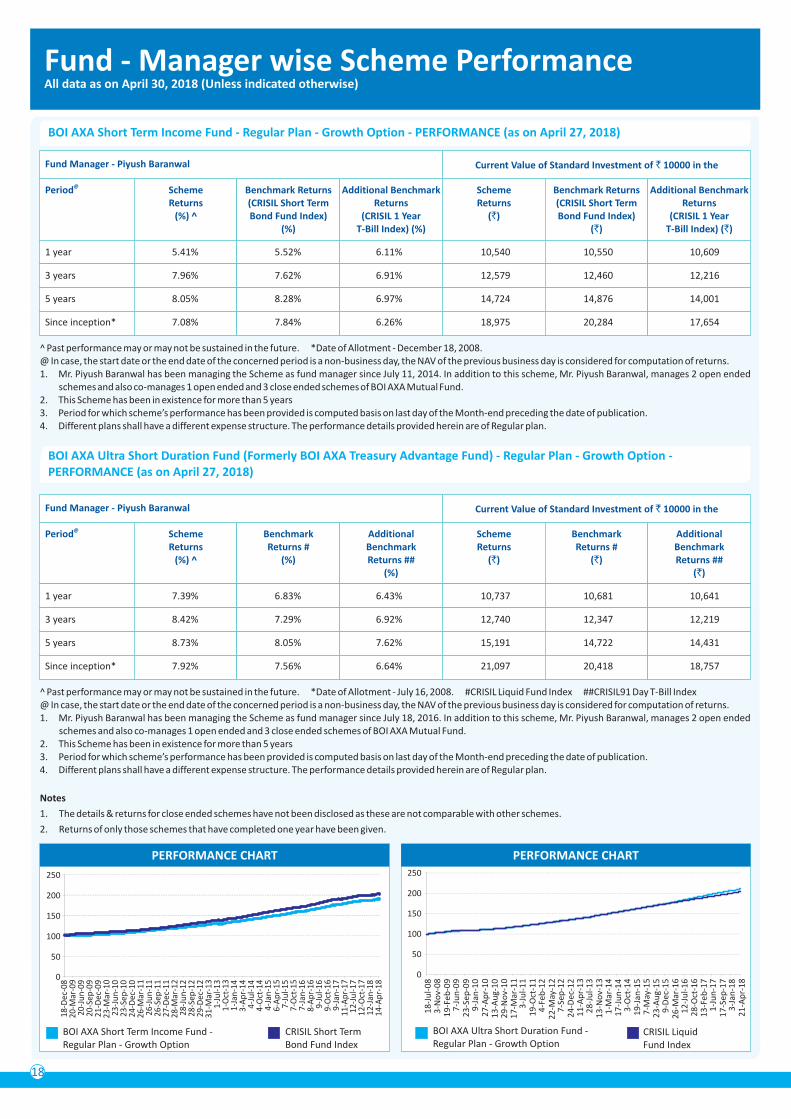
18
Fund - Manager wise Scheme PerformanceAll data as on April 30, 2018 (Unless indicated otherwise)
@Period Scheme Returns
(%) ^
Benchmark Returns(CRISIL Short Term Bond Fund Index)
(%)
^ Past performance may or may not be sustained in the future. *Date of Allotment - December 18, 2008. @ In case, the start date or the end date of the concerned period is a non-business day, the NAV of the previous business day is considered for computation of returns.1. Mr. Piyush Baranwal has been managing the Scheme as fund manager since July 11, 2014. In addition to this scheme, Mr. Piyush Baranwal, manages 2 open ended
schemes and also co-manages 1 open ended and 3 close ended schemes of BOI AXA Mutual Fund.2. This Scheme has been in existence for more than 5 years 3. Period for which scheme’s performance has been provided is computed basis on last day of the Month-end preceding the date of publication.4. Different plans shall have a different expense structure. The performance details provided herein are of Regular plan.
BOI AXA Short Term Income Fund - Regular Plan - Growth Option - PERFORMANCE (as on April 27, 2018)
Additional Benchmark Returns
(CRISIL 1 Year T-Bill Index) (%)
Scheme Returns
(`)
Benchmark Returns(CRISIL Short Term Bond Fund Index)
(`)
Additional Benchmark Returns
(CRISIL 1 Year T-Bill Index) (`)
1 year 5.41% 5.52% 6.11% 10,540 10,550 10,609
3 years 7.96% 7.62% 6.91% 12,579 12,460 12,216
5 years 8.05% 8.28% 6.97% 14,724 14,876 14,001
Since inception* 7.08% 7.84% 6.26% 18,975 20,284 17,654
Current Value of Standard Investment of ` 10000 in the
Notes
1. The details & returns for close ended schemes have not been disclosed as these are not comparable with other schemes.
2. Returns of only those schemes that have completed one year have been given.
Fund Manager - Piyush Baranwal
BOI AXA Ultra Short Duration Fund - Regular Plan - Growth Option
CRISIL Liquid Fund Index
PERFORMANCE CHART
0
50
100
150
200
250
@Period Scheme Returns
(%) ^
Benchmark Returns #
(%)
^ Past performance may or may not be sustained in the future. *Date of Allotment - July 16, 2008. #CRISIL Liquid Fund Index ##CRISIL91 Day T-Bill Index@ In case, the start date or the end date of the concerned period is a non-business day, the NAV of the previous business day is considered for computation of returns.1. Mr. Piyush Baranwal has been managing the Scheme as fund manager since July 18, 2016. In addition to this scheme, Mr. Piyush Baranwal, manages 2 open ended
schemes and also co-manages 1 open ended and 3 close ended schemes of BOI AXA Mutual Fund.2. This Scheme has been in existence for more than 5 years 3. Period for which scheme’s performance has been provided is computed basis on last day of the Month-end preceding the date of publication.4. Different plans shall have a different expense structure. The performance details provided herein are of Regular plan.
BOI AXA Ultra Short Duration Fund (Formerly BOI AXA Treasury Advantage Fund) - Regular Plan - Growth Option -PERFORMANCE (as on April 27, 2018)
Additional Benchmark Returns ##
(%)
Scheme Returns
(`)
Benchmark Returns #
(`)
Additional Benchmark Returns ##
(`)
1 year 7.39% 6.83% 6.43% 10,737 10,681 10,641
3 years 8.42% 7.29% 6.92% 12,740 12,347 12,219
5 years 8.73% 8.05% 7.62% 15,191 14,722 14,431
Since inception* 7.92% 7.56% 6.64% 21,097 20,418 18,757
Current Value of Standard Investment of ` 10000 in theFund Manager - Piyush Baranwal
PERFORMANCE CHART
BOI AXA Short Term Income Fund - Regular Plan - Growth Option
CRISIL Short Term Bond Fund Index
0
50
100
150
250
200
18-D
ec-0
820
-Mar
-09
20-J
un
-09
20-S
ep-0
921
-Dec
-09
23-M
ar-1
023
-Ju
n-1
023
-Sep
-10
24-D
ec-1
026
-Mar
-11
26-J
un
-11
26-S
ep-1
127
-Dec
-11
28-M
ar-1
228
-Ju
n-1
228
-Sep
-12
29-D
ec-1
231
-Mar
-13
1-Ju
l-13
1-O
ct-1
31-
Jan
-14
3-A
pr-
144-
Jul-
144-
Oct
-14
4-Ja
n-1
56-
Ap
r-15
7-Ju
l-15
7-O
ct-1
57-
Jan
-16
8-A
pr-
169-
Jul-
169-
Oct
-16
9-Ja
n-1
711
-Ap
r-17
12-J
ul-
1712
-Oct
-17
12-J
an-1
814
-Ap
r-18
18
-Ju
l-0
83
-No
v-0
81
9-F
eb-0
97
-Ju
n-0
92
3-S
ep-0
99
-Jan
-10
27
-Ap
r-1
01
3-A
ug-
10
29
-No
v-1
01
7-M
ar-1
13
-Ju
l-1
11
9-O
ct-1
14
-Feb
-12
22
-May
-12
7-S
ep-1
22
4-D
ec-1
21
1-A
pr-
13
28
-Ju
l-1
31
3-N
ov-
13
1-M
ar-1
41
7-J
un
-14
3-O
ct-1
41
9-J
an-1
57
-May
-15
23
-Au
g-1
59
-Dec
-15
26
-Mar
-16
12
-Ju
l-1
62
8-O
ct-1
61
3-F
eb-1
71
-Ju
n-1
71
7-S
ep-1
73
-Jan
-18
21
-Ap
r-1
8
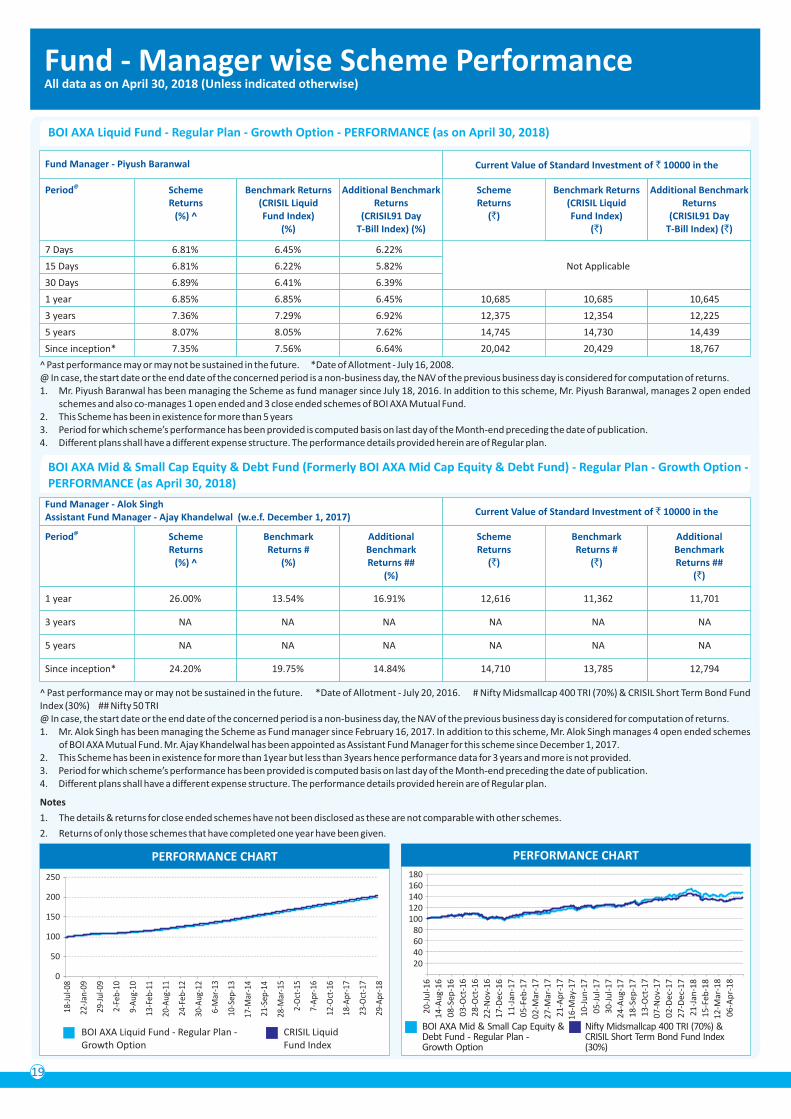
Fund - Manager wise Scheme PerformanceAll data as on April 30, 2018 (Unless indicated otherwise)
19
@Period Scheme Returns
(%) ^
Benchmark Returns(CRISIL Liquid Fund Index)
(%)
^ Past performance may or may not be sustained in the future. *Date of Allotment - July 16, 2008.@ In case, the start date or the end date of the concerned period is a non-business day, the NAV of the previous business day is considered for computation of returns.1. Mr. Piyush Baranwal has been managing the Scheme as fund manager since July 18, 2016. In addition to this scheme, Mr. Piyush Baranwal, manages 2 open ended
schemes and also co-manages 1 open ended and 3 close ended schemes of BOI AXA Mutual Fund.2. This Scheme has been in existence for more than 5 years 3. Period for which scheme’s performance has been provided is computed basis on last day of the Month-end preceding the date of publication.4. Different plans shall have a different expense structure. The performance details provided herein are of Regular plan.
BOI AXA Liquid Fund - Regular Plan - Growth Option - PERFORMANCE (as on April 30, 2018)
Additional Benchmark Returns
(CRISIL91 Day T-Bill Index) (%)
Scheme Returns
(`)
Benchmark Returns (CRISIL Liquid Fund Index)
(`)
Additional Benchmark Returns
(CRISIL91 Day T-Bill Index) (`)
Current Value of Standard Investment of ` 10000 in the
Notes
1. The details & returns for close ended schemes have not been disclosed as these are not comparable with other schemes.
2. Returns of only those schemes that have completed one year have been given.
Fund Manager - Piyush Baranwal
@Period Scheme Returns
(%) ^
Benchmark Returns #
(%)
^ Past performance may or may not be sustained in the future. *Date of Allotment - July 20, 2016. # Nifty Midsmallcap 400 TRI (70%) & CRISIL Short Term Bond Fund Index (30%) ## Nifty 50 TRI@ In case, the start date or the end date of the concerned period is a non-business day, the NAV of the previous business day is considered for computation of returns.1. Mr. Alok Singh has been managing the Scheme as Fund manager since February 16, 2017. In addition to this scheme, Mr. Alok Singh manages 4 open ended schemes
of BOI AXA Mutual Fund. Mr. Ajay Khandelwal has been appointed as Assistant Fund Manager for this scheme since December 1, 2017.2. This Scheme has been in existence for more than 1year but less than 3years hence performance data for 3 years and more is not provided.3. Period for which scheme’s performance has been provided is computed basis on last day of the Month-end preceding the date of publication.4. Different plans shall have a different expense structure. The performance details provided herein are of Regular plan.
BOI AXA Mid & Small Cap Equity & Debt Fund (Formerly BOI AXA Mid Cap Equity & Debt Fund) - Regular Plan - Growth Option - PERFORMANCE (as April 30, 2018)
Additional Benchmark Returns ##
(%)
Scheme Returns
(`)
Benchmark Returns #
(`)
Additional Benchmark Returns ##
(`)
1 year 26.00% 13.54% 16.91% 12,616 11,362 11,701
3 years NA NA NA NA NA NA
5 years NA NA NA NA NA NA
Since inception* 24.20% 19.75% 14.84% 14,710 13,785 12,794
Current Value of Standard Investment of ` 10000 in theFund Manager - Alok Singh Assistant Fund Manager - Ajay Khandelwal (w.e.f. December 1, 2017)
BOI AXA Mid & Small Cap Equity & Debt Fund - Regular Plan - Growth Option
Nifty Midsmallcap 400 TRI (70%) &CRISIL Short Term Bond Fund Index(30%)
PERFORMANCE CHARTPERFORMANCE CHART
BOI AXA Liquid Fund - Regular Plan - Growth Option
CRISIL Liquid Fund Index
0
50
100
150
200
250
7 Days 6.81% 6.45% 6.22%
15 Days 6.81% 6.22% 5.82% Not Applicable
30 Days 6.89% 6.41% 6.39%
1 year 6.85% 6.85% 6.45% 10,685 10,685 10,645
3 years 7.36% 7.29% 6.92% 12,375 12,354 12,225
5 years 8.07% 8.05% 7.62% 14,745 14,730 14,439
Since inception* 7.35% 7.56% 6.64% 20,042 20,429 18,767
20406080
100120
180
140160
18-J
ul-0
8
22-J
an-0
9
29-J
ul-0
9
2-Fe
b-10
9-A
ug-1
0
13-F
eb-1
1
20-A
ug-1
1
24-F
eb-1
2
30-A
ug-1
2
6-M
ar-1
3
10-S
ep-1
3
17-M
ar-1
4
21-S
ep-1
4
28-M
ar-1
5
2-O
ct-1
5
7-A
pr-1
6
12-O
ct-1
6
18-A
pr-1
7
23-O
ct-1
7
29-A
pr-1
8
20
-Ju
l-1
6
14
-Au
g-1
6
08
-Sep
-16
03
-Oct
-16
28
-Oct
-16
22
-No
v-1
6
17
-Dec
-16
11
-Jan
-17
05
-Feb
-17
02
-Mar
-17
27
-Mar
-17
21
-Ap
r-1
7
16
-May
-17
10
-Ju
n-1
7
05
-Ju
l-1
7
30
-Ju
l-1
7
24
-Au
g-1
7
18
-Sep
-17
13
-Oct
-17
07
-No
v-1
7
02
-Dec
-17
27
-Dec
-17
21
-Jan
-18
15
-Feb
-18
12
-Mar
-18
06
-Ap
r-1
8
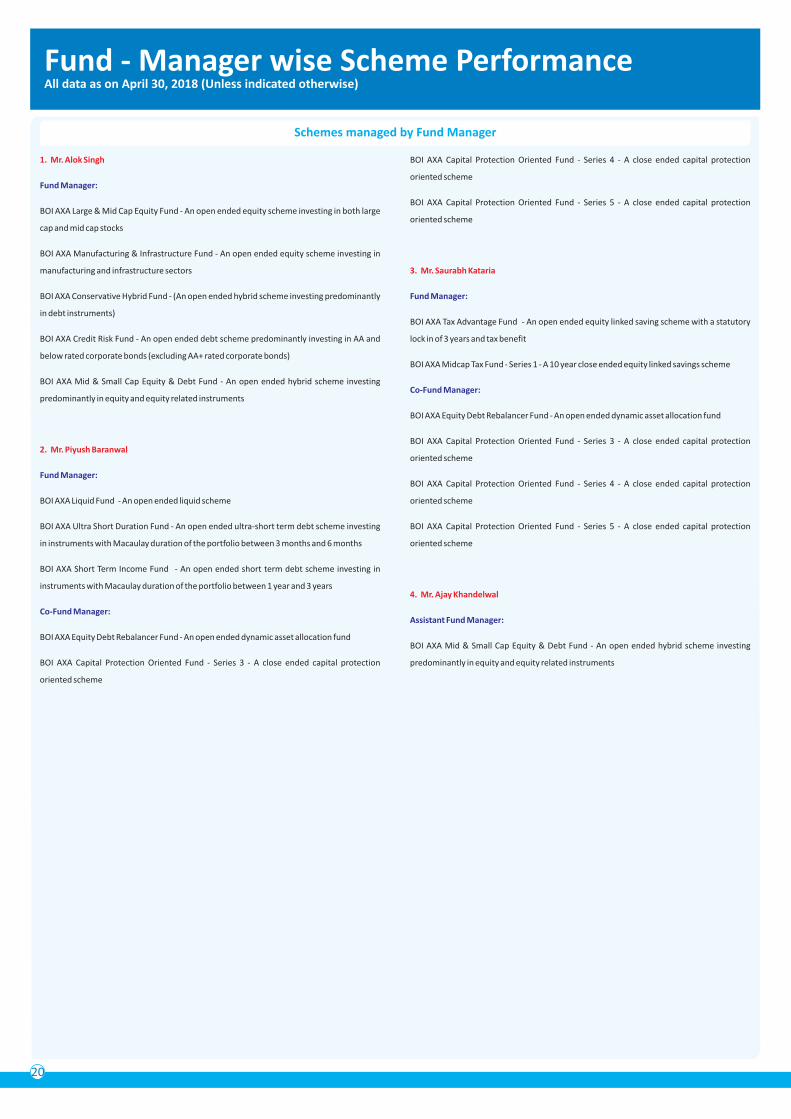
Fund - Manager wise Scheme PerformanceAll data as on April 30, 2018 (Unless indicated otherwise)
20
Schemes managed by Fund Manager
1. Mr. Alok Singh
2. Mr. Piyush Baranwal
Fund Manager:
Fund Manager:
Co-Fund Manager:
BOI AXA Large & Mid Cap Equity Fund - An open ended equity scheme investing in both large
cap and mid cap stocks
BOI AXA Manufacturing & Infrastructure Fund - An open ended equity scheme investing in
manufacturing and infrastructure sectors
BOI AXA Conservative Hybrid Fund - (An open ended hybrid scheme investing predominantly
in debt instruments)
BOI AXA Credit Risk Fund - An open ended debt scheme predominantly investing in AA and
below rated corporate bonds (excluding AA+ rated corporate bonds)
BOI AXA Mid & Small Cap Equity & Debt Fund - An open ended hybrid scheme investing
predominantly in equity and equity related instruments
BOI AXA Liquid Fund - An open ended liquid scheme
BOI AXA Ultra Short Duration Fund - An open ended ultra-short term debt scheme investing
in instruments with Macaulay duration of the portfolio between 3 months and 6 months
BOI AXA Short Term Income Fund - An open ended short term debt scheme investing in
instruments with Macaulay duration of the portfolio between 1 year and 3 years
BOI AXA Equity Debt Rebalancer Fund - An open ended dynamic asset allocation fund
BOI AXA Capital Protection Oriented Fund - Series 3 - A close ended capital protection
oriented scheme
BOI AXA Capital Protection Oriented Fund - Series 4 - A close ended capital protection
oriented scheme
BOI AXA Capital Protection Oriented Fund - Series 5 - A close ended capital protection
oriented scheme
BOI AXA Tax Advantage Fund - An open ended equity linked saving scheme with a statutory
lock in of 3 years and tax benefit
BOI AXA Midcap Tax Fund - Series 1 - A 10 year close ended equity linked savings scheme
BOI AXA Equity Debt Rebalancer Fund - An open ended dynamic asset allocation fund
BOI AXA Capital Protection Oriented Fund - Series 3 - A close ended capital protection
oriented scheme
BOI AXA Capital Protection Oriented Fund - Series 4 - A close ended capital protection
oriented scheme
BOI AXA Capital Protection Oriented Fund - Series 5 - A close ended capital protection
oriented scheme
BOI AXA Mid & Small Cap Equity & Debt Fund - An open ended hybrid scheme investing
predominantly in equity and equity related instruments
3. Mr. Saurabh Kataria
4. Mr. Ajay Khandelwal
Fund Manager:
Co-Fund Manager:
Assistant Fund Manager:
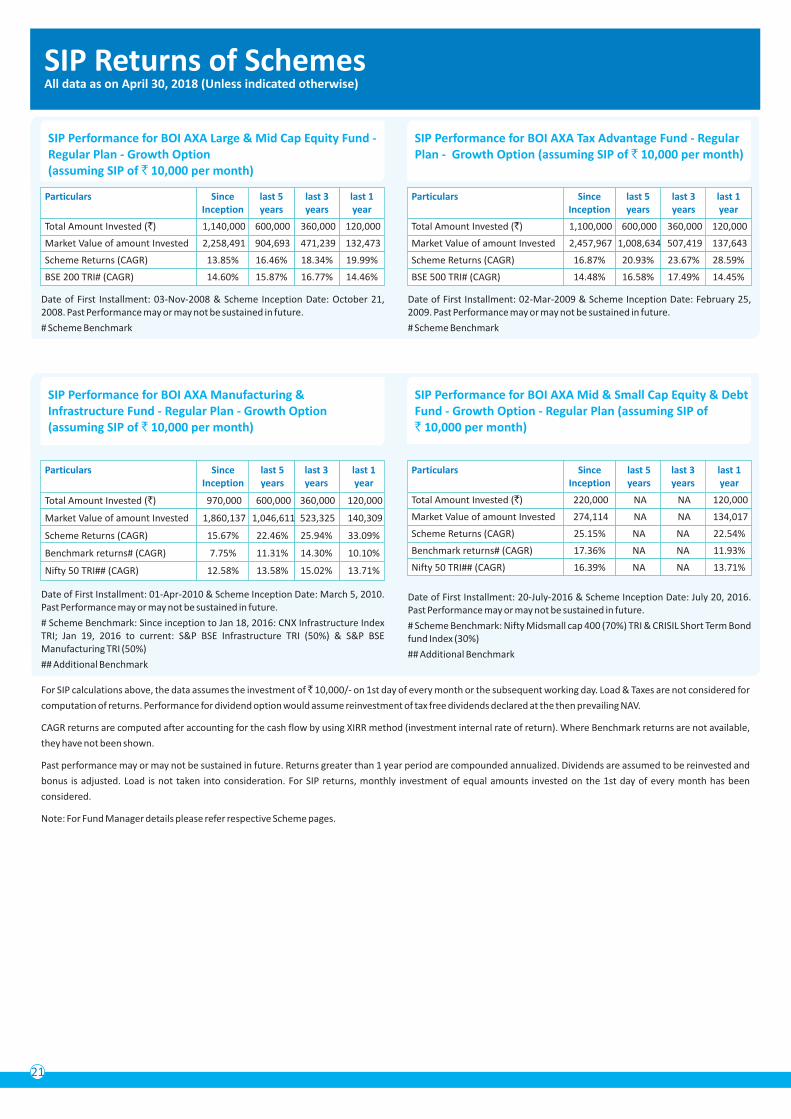
21
SIP Returns of SchemesAll data as on April 30, 2018 (Unless indicated otherwise)
Date of First Installment: 03-Nov-2008 & Scheme Inception Date: October 21, 2008. Past Performance may or may not be sustained in future.
# Scheme Benchmark
SIP Performance for BOI AXA Large & Mid Cap Equity Fund - Regular Plan - Growth Option (assuming SIP of ` 10,000 per month)
Particulars Since last 5 last 3 last 1 Inception years years year
Total Amount Invested (`) 1,140,000 600,000 360,000 120,000
Market Value of amount Invested 2,258,491 904,693 471,239 132,473
Scheme Returns (CAGR) 13.85% 16.46% 18.34% 19.99%
BSE 200 TRI# (CAGR) 14.60% 15.87% 16.77% 14.46%
Date of First Installment: 02-Mar-2009 & Scheme Inception Date: February 25, 2009. Past Performance may or may not be sustained in future.
# Scheme Benchmark
Particulars Since last 5 last 3 last 1 Inception years years year
Total Amount Invested (`) 1,100,000 600,000 360,000 120,000
Market Value of amount Invested 2,457,967 1,008,634 507,419 137,643
Scheme Returns (CAGR) 16.87% 20.93% 23.67% 28.59%
BSE 500 TRI# (CAGR) 14.48% 16.58% 17.49% 14.45%
SIP Performance for BOI AXA Mid & Small Cap Equity & Debt Fund - Growth Option - Regular Plan (assuming SIP of ` 10,000 per month)
Date of First Installment: 20-July-2016 & Scheme Inception Date: July 20, 2016. Past Performance may or may not be sustained in future.
# Scheme Benchmark: Nifty Midsmall cap 400 (70%) TRI & CRISIL Short Term Bond fund Index (30%)
## Additional Benchmark
For SIP calculations above, the data assumes the investment of ̀ 10,000/- on 1st day of every month or the subsequent working day. Load & Taxes are not considered for
computation of returns. Performance for dividend option would assume reinvestment of tax free dividends declared at the then prevailing NAV.
CAGR returns are computed after accounting for the cash flow by using XIRR method (investment internal rate of return). Where Benchmark returns are not available,
they have not been shown.
Past performance may or may not be sustained in future. Returns greater than 1 year period are compounded annualized. Dividends are assumed to be reinvested and
bonus is adjusted. Load is not taken into consideration. For SIP returns, monthly investment of equal amounts invested on the 1st day of every month has been
considered.
Note: For Fund Manager details please refer respective Scheme pages.
Date of First Installment: 01-Apr-2010 & Scheme Inception Date: March 5, 2010. Past Performance may or may not be sustained in future.
# Scheme Benchmark: Since inception to Jan 18, 2016: CNX Infrastructure Index TRI; Jan 19, 2016 to current: S&P BSE Infrastructure TRI (50%) & S&P BSE Manufacturing TRI (50%)
## Additional Benchmark
SIP Performance for BOI AXA Manufacturing & Infrastructure Fund - Regular Plan - Growth Option (assuming SIP of ` 10,000 per month)
Particulars Since last 5 last 3 last 1 Inception years years year
Total Amount Invested (`) 970,000 600,000 360,000 120,000
Market Value of amount Invested 1,860,137 1,046,611 523,325 140,309
Scheme Returns (CAGR) 15.67% 22.46% 25.94% 33.09%
Benchmark returns# (CAGR) 7.75% 11.31% 14.30% 10.10%
Nifty 50 TRI## (CAGR) 12.58% 13.58% 15.02% 13.71%
SIP Performance for BOI AXA Tax Advantage Fund - RegularPlan - Growth Option (assuming SIP of ` 10,000 per month)
Particulars Since last 5 last 3 last 1 Inception years years year
Total Amount Invested (`) 220,000 NA NA 120,000
Market Value of amount Invested 274,114 NA NA 134,017
Scheme Returns (CAGR) 25.15% NA NA 22.54%
Benchmark returns# (CAGR) 17.36% NA NA 11.93%
Nifty 50 TRI## (CAGR) 16.39% NA NA 13.71%
How to read Factsheet
Fund Manager
Application Amount for Fresh Subscription
Minimum Additional Amount
Yield to Maturity
SIP
NAV
Benchmark
Entry Load
Exit Load
An employee of the asset management company such as a mutual
fund or life insurer, who manages investments of the scheme. He is
usually part of a larger team of fund managers and research analysts.
This is the minimum investment amount for a new investor in a mutual
fund scheme.
This is the minimum investment amount for an existing investor in a
mutual fund scheme.
The Yield to Maturity or the YTM is the rate of return anticipated on a
bond if held until maturity. YTM is expressed as an annual rate. The
YTM factors in the bond's current market price, par value, coupon
interest rate and time to maturity.
SIP or systematic investment plan works on the principle of making
periodic investments of a fixed sum. It works similar to a recurring
bank deposit. For instance, an investor may opt for an SIP that invests
Rs 500 every 15th of the month in an equity fund for a period of three
years.
The NAV or the net asset value is the total asset value per unit of the
mutual fund after deducting all related and permissible expenses. The
NAV is calculated at the end of every business day. It is the value at
which the investor enters or exits the mutual fund.
A group of securities, usually a market index, whose performance is
used as a standard or benchmark to measure investment performance
of mutual funds, among other investments. Some typical benchmarks
include the Nifty, Sensex, BSE200, BSE500, 10-Year Gsec.
A mutual fund may have a sales charge or load at the time of entry
and/or exit to compensate the distributor/agent. Entry load is charged
at the time an investor purchases the units of a mutual fund. The entry
load is added to the prevailing NAV at the time of investment. For
instance, if the NAV is Rs. 100 and the entry load is 1%, the investor will
enter the fund at Rs. 101.
Note: SEBI, vide circular dated June 30, 2009 has abolished entry load
and mandated that the upfront commission to distributors will be paid
by the investor directly to the distributor, based on his assessment of
various factors including the service rendered by the distributor.
Exit load is charged at the time an investor redeems the units of a
mutual fund. The exit load is deducted from the prevailing NAV at the
time of redemption. For instance, if the NAV is Rs. 100 and the exit
load is 1%, the redemption price would be Rs.99 per unit.
Modified Duration
Standard Deviation
Sharpe Ratio
Beta
AUM
Holdings
Nature of Scheme
Rating Profile
Modified duration is the price sensitivity and the percentage change in
price for a unit change in yield.
Standard deviation is a statistical measure of the range of an
investment’s performance. When a mutual fund has a high standard
deviation, its means its range of performance is wide, implying greater
volatility.
The Sharpe Ratio, named after its founder, the Nobel Laureate William
Sharpe, is a measure of risk-adjusted returns. It is calculated using
standard deviation and excess return to determine reward per unit of
risk.
Beta is a measure of an investment’s volatility vis-à-vis the market.
Beta of less than 1 means that the security will be less volatile than the
market. A beta of greater than 1 implies that the security's price will be
more volatile than the market.
AUM or assets under management refers to the recent / updated
cumulative market value of investments managed by a mutual fund or
any investment firm.
The holdings or the portfolio is a mutual fund’s latest or updated
reported statement of investments/securities. These are usually
displayed in terms of percentage to net assets or the rupee value or
both. The objective is to give investors an idea of where their money is
being invested by the fund manager.
The investment objective and underlying investments determine the
nature of the mutual fund scheme. For instance, a mutual fund that
aims at generating capital appreciation by investing in stock markets is
an equity fund or growth fund. Likewise, a mutual fund that aims at
capital preservation by investing in debt markets is a debt fund or
income fund. Each of these categories may have sub-categories.
Mutual funds invest in securities after evaluating their
creditworthiness as disclosed by the ratings. A depiction of the mutual
fund in various investments based on their ratings becomes the rating
profile of the fund. Typically, this is a feature of debt funds.
22
23
Disclaimer/Statutory DetailsThe data in the Factsheet is updated up to May 09, 2018 unless indicated otherwise. Statements relating to outlook and forecast are the opinions of the Author. The views expressed by the author are personal and are not necessarily that of BOI AXA Investment Managers Private Limited (AMC). This report is for information purpose only and is not intended to be any investment advice. Please make independent research/ obtain professional help before taking any decision of investment/ sale. AMC makes no representation as to the quality, liquidity or market perception of any securities/ issuer/ borrower, if described in the report above, nor does it provide any guarantee whatsoever. Information and material used in this report are believed to be from reliable sources. However, AMC does not warrant the accuracy, reasonableness and/or completeness of any information. AMC does not undertake to update any information or material in this report. Decisions taken by you based on the information provided in this report are to your own account and risk. AMC and any of its officers, directors and employees shall not be liable for any loss or damage of any nature, as also any loss of profit in any way arising from the use of this material in any manner. AMC or its directors, officers and employees, including author of this report/ persons involved in the preparation or issuance of this report may, from time to time, have long or short positions in, and buy or sell the securities, if any, mentioned herein or have other potential conflict of interest with respect to any recommendation and related information and opinions given in the report/ report. This report, or any part of it, should not be duplicated, or contents altered/ modified, in whole or in part in any form and or re-distributed without AMC’s prior written consent. © BOI AXA Investment Managers Private Limited 2018.
Mutual Fund investments are subject to market risks, read all scheme related documents carefully.
AMC Website: www.boiaxamf.com is also an Investor Service Centre (for online transactions)
B/204, Tower 1, Peninsula Corporate Park, Ganpatrao Kadam Marg, Lower Parel, Mumbai - 400 013.
Toll free number : 1800-103-2263 & 1800-266-2676 • Alternate number : 020-4011 2300 & 020-6685 4100 • Website : www.boiaxamf.com • Email : [email protected]
BOI AXA Investment Managers Pvt. Ltd.(Investment Manager for BOI AXA Mutual Fund)
BOI AXA Investment Managers’ Branches - Investor Service Centers (ISC's)
• Ahmedabad - Shop No.:- 405, 4th Floor, Zodiac Plaza, H. L. College Road, Navrangpura, Ahmedabad - 380 009. • Bangalore - 957, Regus Business Centre, Bangalore Pvt. Ltd., Level 9, Raheja Towers, 26 - 27, Mahatma Gandhi Road, Bangalore - 560 001. • Bhopal - F. F. 16, Part B, Mansarover Complex, Near Habibganj Railway Station, Bhopal - 462 016. • Chandigarh - 205, Megabyte Business Centre, SCO-333-334, Ist Floor, Sec-35B Chandigarh - 160 022. • Chennai - Cabin No. 203, Apeejay Business Center No: 39/12, Haddows Road, Nungambakkam, Chennai - 600 034. • Hyderabad - Cabin No. 23, Apeejay Business Centre, Tresorie, The Park, 22 Rajbhavan Road, Somajiguda, Hyderabad - 500 082. • Jaipur - Office no.154, 1st Floor, Ganpati Plaza,M I Road, Jaipur - 302 001. • Kolkata - Cabin 06, Block - A, 8th Floor, Apeejay House, 15 Park Street, Kolkata - 700 016. • Lucknow - Office No-504, 5th Floor, Sriram Tower, 13 Ashok Marg, Hazratganj, Lucknow - 226 001. • Mumbai - B/204, Tower 1, Peninsula Corporate Park, Ganpatrao Kadam Marg, Lower Parel, Mumbai - 400 013. • New Delhi - Room No. 610, Avanta Business Center, 4th Floor, Statesman House, Barakhamba Road, Connaught Place, New Delhi - 110 001. • Pune - Apeejay Business Centre, 1st Floor, Pride House, S.No. 108/7, Shivajinagar, University Road, Pune - 411 016. • Vadodara - 118, 1st Floor, Siddharth Complex, R C Dutt Road, Alkapuri, Vadodara - 390 005.
• Agra: 1st Floor, Deepak Wasan Plaza, Behind Holiday Inn, Sanjay Place, Agra - 282 002. • Ahmedabad: 201/202, Shail Complex, Opp: Madhusudan House, B/H Girish Cold Drink, Off C G Road, Navrangpura, Ahmedabad - 380 006. • Akola: Yamuna Tarang Complex, Shop No 30, Ground Floor, N.H. No- 06, Murtizapur Road, Opp Radhakrishna Talkies, Akola - 444 004. • Allahabad: Rsa Towers, 2nd Floor, Above Sony Tv Showroom, 57, S P Marg, Civil Lines, Allahabad - 211 001. • Ambala: 6349, Nicholson Road, Adjacent Kos Hospital, Ambala Cant, Ambala - 133 001. • Amritsar: 72-A, Taylor'S Road, Opp Aga Heritage Club, Amritsar - 143 001. • Anand: B-42, Vaibhav Commercial Center, Nr Tvs Down Town Shrow Room, Grid Char Rasta, Anand - 380 001. • Andheri: 6 & 7, 131 Andheri Industrial Estate, Veera Desai Road, Andheri (West), Mumbai - 400 053. • Asansol: 114/71, G T Road, Bhanga Panchil, Near Nokia Care, Asansol - 713 303. • Aurangabad: Ramkunj Niwas, Railway Station Road, Near Osmanpura Circle, Aurangabad - 431 005. • Bangalore: 59, Skanda Puttanna Road, Basavanagudi, Bangalore - 560 004. • Baroda: 203, Corner Point, Jetalpur Road, Baroda - 390 007. • Belgaum: Cts No 3939/ A2 A1, Above Raymonds Show Room, Beside Harsha Appliances, Club Road, Belgaum - 590 001. • Bhagalpur: 2nd Floor, Chandralok Complex, Ghantaghar, Radha Rani Sinha Road, Bhagalpur - 812 001. • Bhavnagar: Krushna Darshan Complex, Parimal Chowk, Office No. 306-307, 3rd Floor, Above Jed Blue Show Room, Bhavnagar - 364 002. • Bhopal: Kay Kay Business Centre, 133, Zone I, Mp Nagar, Above City Bank, Bhopal - 462 011. • Bhubaneswar: A/181, Back Side of Shivam Honda Show Room, Saheed Nagar, Bhubaneswar - 751 007. • Bilaspur: Shop No - 225, 226 & 227, 2nd Floor, Narayan Plaza, Link Road, Bilaspur - 495 001. • Bokaro: B-1, 1St Floor, City Centre, Sector- 4, Near Sona Chandi Jwellars, Bokaro - 827 004. • Borivali: Gomati Smuti, Ground Floor, Jambli Gully, Near Railway Station, Borivali, Mumbai - 400 092. • Calicut: 2nd Floor, Soubhagya Shopping Complex, Arayidathpalam, Mavoor Road, Calicut - 673 004. • Chandigarh: Sco- 2423-2424, Above Mirchi Restaurent, New Aroma Hotel, First Floor, Sector 22-C, Chandigarh - 160 022. • Chembur: Shop No 4, Ground Floor, Shram Saflya Bldg, N G Acharya Marg, Chembur, Mumbai - 400 071. • Chennai: F-11, Akshaya Plaza, 1st Floor, 108, Adhithanar Salai, Egmore, Opp To Chief Metropolitan Court, Chennai - 600 002. • Cochin: Ali Arcade, 1st Floor, Kizhavana Road, Panampilly Nagar, Near Atlantis Junction, Ernakualm - 682 036. • Coimbatore: 3rd Floor, Jaya Enclave, 1057 Avinashi Road, Coimbatore - 641 018. • Dalhousie: 2nd Floor, Room No-226, R N Mukherjee Road, Kolkata - 700 001. • Dehradun: Kaulagarh Road, Near Sirmaur Margabove, Reliance Webworld, Dehradun - 248 001. • Dhanbad: 208 New Market, 2nd Floor, Bank More, Dhanbad - 826 001. • Durgapur: MWAV-16, Bengal Ambuja, 2nd Floor, City Centre, Distt. Burdwan, Durgapur - 713 216. • Erode: No: 4, Veerappan Traders Complex, KMY Salai, Sathy Road, Opp. Erode Bus Stand, Erode - 638003. • Faridabad: A-2B, 1st Floor, Nehru Ground, Neelam Bata Road, NIT, Faridabad - 121001. • Gandhinagar: 123, First Floor, Megh Malhar Complex, Opp. Vijay Petrol Pump, Sector - 11, Gandhinagar - 382 011. • Ghaziabad: 1St Floor C-7, Lohia Nagar, Ghaziabad - 201 001. • Gorakhpur: Above V.I.P. House Ajdacent, A.D. Girls College, Bank Road, Gorakpur - 273 001. • Gurgaon: Shop No.18, Ground Floor, Sector - 14, Opp. Akd Tower, Near Huda Office, Gurgaon - 122 001. • Guwahati: 1st Floor, Bajrangbali Building, Near Bora Service Station, GS Road, Guwahati - 781 007. • Gwalior: 2nd Floor, Rajeev Plaza, Jayendra Ganj, Lashkar, Gwalior - 474 009. • Hubli: CTC No.483/A1/A2, Ground Floor, Shri Ram Palza, Behind Kotak Mahindra Bank, Club Road, Hubli - 580 029. • Hyderabad: KARVY HOUSE, No:46, 8-2-609/K, Avenue 4, Street No. 1, Banjara Hills, Hyderabad - 500 034. • Hyderabad (Gachibowli): KARVY Selenium, Plot No: 31 & 32, Tower B, Survey No.115/22, 115/24, 115/25, Financial District, Gachibowli, Nanakramguda, Serilimgampally Mandal, Hyderabad - 500 032. • Indore: 2nd Floor, 203-205 Balaji Corporate House, Above ICICI Bank, 19/1 New Palasia, NearCurewell Hospital, Janjeerwala Square, Indore - 452 001. • Jabalpur: Grover Chamber, 43 Naya Bazar, Malviya Chowk, Opp Shyam Market, Jabalpur - 482 002. • Jaipur: S16/A, IIIrd Floor, Land Mark Building, Opp Jai Club, Mahaver Marg, C Scheme, Jaipur - 302 001. • Jalandhar: 1st Floor, Shanti Towers, SCO No. 37, PUDA Complex, Opposite Tehsil Complex, Jalandhar - 144 001. • Jammu: Gupta’s Tower, 2nd Floor, CB-12, Rail Head Complex, Jammu - 180 012.• Jamshedpur: 2nd Floor, R R Square, SB Shop Area, Near Relaance Foot Print & Hotel- BS Park Plaza, Main Road, Bistupur, Jamshedpur - 831 001. • Jodhpur: 203, Modi Arcade, Chopasni Road, Jodhpur - 342 001. • Kanpur: 15/46, B, Ground Floor, Opp : Muir Mills, Civil Lines, Kanpur - 208 001. • Kolhapur: 605/1/4 E Ward, Shahupuri 2nd Lane, Laxmi Niwas, Near Sultane Chambers, Kolhapur - 416 001. • Kolkata: Apeejay House (Beside Park Hotel), C Block, 3rd Floor, 15 Park Street, Kolkata - 700 016. • Lucknow: Ist Floor, A. A. Complex, 5 Park Road, Hazratganj, Thaper House, Lucknow - 226 001. • Ludhiana: Sco - 136, 1st Floor, Above Airtel Showroom, Feroze Gandhi Market, Ludhiana - 141 001. • Madurai: Rakesh Towers, 30-C, Ist Floor, Bye Pass Road, Opp Nagappa Motors, Madurai - 625 010. • Margoa: 2nd Floor, Dalal Commercial Complex, Pajifond, Margao - 403 601. • Meerut: 1st Floor, Medi Centre, Opp. ICICI Bank, Hapur Road, Near Bachha Park, Meerut - 250 002. • Moradabad: Om Arcade, Parker Road, Above Syndicate Bank, Chowk Tari Khana, Moradabad - 244 001. • Mumbai: 24/B, Raja Bahadur Compound, Ambalal Doshi Marg, Behind BSE Bldg, Fort - 400 001. • Muzaffarpur: First Floor, Shukla Complex, Near ICICI Bank, Civil Court Branch, Company Bagh, Muzaffarpur - 842 001. • Nagpur: Plot No 2/1, House No 102/1, Mata Mandir Road, Mangaldeep Appartment, Opp Khandelwal Jewelers, Dharampeth, Nagpur - 440 010. • Nanded: Shop No. 4, Santakripa Market, G G Road, Opp.Bank o f India, Nanded - 431 601. • Nasik: S-9, Second Floor, Suyojit Sankul, Sharanpur Road, Nasik - 422 002. • New Delhi: 305, New Delhi House, 27 Barakhamba Road, New Delhi - 110 001. • Noida: 405, 4th Floor, Vishal Chamber, Plot No.1, Sector-18, Noida - 201 301. • Panipat: JAVA Complex, 1st Floor, Above Vijaya Bank, G T Road, Panipat - 132 103. • Panjim: Flat No.1-A, H. No. 13/70, Timotio Bldg, Heliodoro Salgado Road, Next to Navhind Bhavan (Market Area), Panjim - 403 001. • Patna: 3A, 3rd Floor, Anand Tower, Exhibition Road, Opp ICICI Bank, Patna - 800 001. • Pune: Mozaic Bldg, CTS No.1216/1, Final Plot No.576/1 TP, Scheme No.1, F C Road, Bhamburda, Shivaji Nagar, Pune - 411 004. • Raipur: Office No S-13, Second Floor, Reheja Tower, Fafadih Chowk, Jail Road, Raipur - 492 001. • Rajkot: 302, Metro Plaza, Near Moti Tanki Chowk, Rajkot, Gujarat - 360 001. • Ranchi: Room No 307, 3rd Floor, Commerce Tower, Beside Mahabir Tower, Ranchi - 834 001. • Rourkela: 1st Floor, Sandhu Complex, Kachery Road, Uditnagar, Rourekla - 769 012. • Secunderabad: Crystal Plaza, 2nd Floor, Manday Lane, Near Sunshine Hospital, P G Road, Secunderabad - 500 003. • Shillong: Annex Mani Bhawan, Lower Thana Road, Near R K M Lp School, Shillong - 793 001. • Siliguri: Nanak Complex, Sevoke Road, Siliguri - 734 001. • Solapur: Block No 06, Vaman Nagar, Opp D-Mart, Jule Solapur, Solapur - 413 004. • Surat: Office No. 516, 5th Floor, Empire State Building, Near Udhna Darwaja, Ring Road, Surat - 395002. • T Nagar: G1, Ground Floor, No 22, Vijayaraghava Road, Swathi Court, T Nagar, Chennai - 600 017. • Thane: 101, Yaswant Tower, 1st Floor, Opposite Puja Hotel, Ram Maruti Road, Naupada, Thane (West), Mumbai - 400 602. • Udaipur: 201-202, Madhav Chambers, Opp G P O, Chetak Circle, Udaipur -313 001. • Ujjain: 101 Aashta Tower, 13/1 Dhanwantri Marg, Freeganj, Ujjain - 456 010. • Varanasi: D-64/132, 1st Floor, Anant Complex, Sigra, Varanashi - 221 010. • Vashi: Shop No.43-A, Ground Floor, Vashi Plaza, Sector-17, Near Apna Bazar, Vashi, Mumbai - 400 705. • Vijayawada: 39-10-7, Opp : Municipal Water Tank, Labbipet, Vijayawada - 520 010. • Vile Parle: 104, Sangam Arcade, V P Road, Opp: Railway Station, Above Axis Bank Atm, Vile Parle (West), Mumbai - 400 056. • Visakhapatnam: Door No: 48-8-7, Dwaraka Diamond, Ground Floor, Srinagar, Visakhapatnam - 530 016.
Karvy Computershare Private Limited Branches - Investor Service Centers (ISC's)
Date of Publication: 9/5/2018
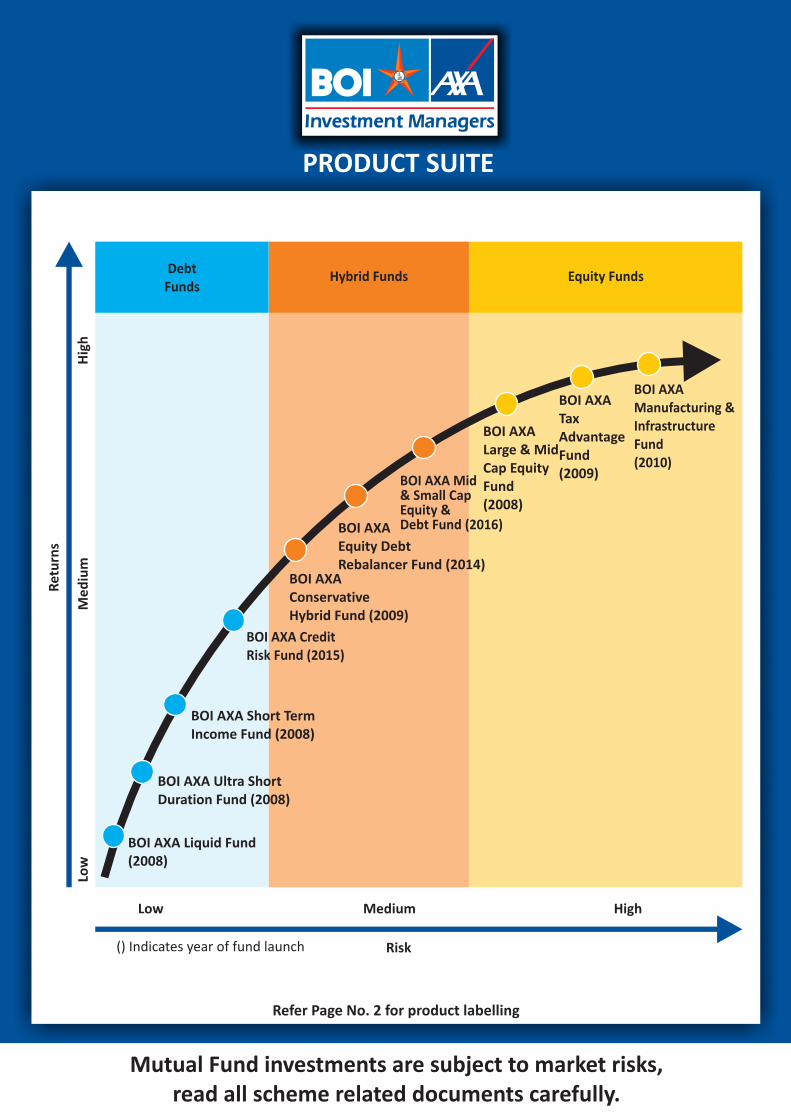
PRODUCT SUITE
Mutual Fund investments are subject to market risks, read all scheme related documents carefully.
Refer Page No. 2 for product labelling
Risk
Low Medium High
() Indicates year of fund launch
Equity FundsHybrid FundsDebt
Funds
Low
Me
diu
mH
igh
Ret
urn
s
BOI AXA Conservative Hybrid Fund (2009)
BOI AXA Credit Risk Fund (2015)
BOI AXA Manufacturing & Infrastructure Fund(2010)
BOI AXA Tax Advantage Fund (2009)
BOI AXA Large & Mid Cap Equity Fund(2008)
BOI AXA Mid & Small Cap Equity & Debt Fund (2016)BOI AXA
Equity Debt Rebalancer Fund (2014)
BOI AXA Short Term Income Fund (2008)
BOI AXA Ultra Short Duration Fund (2008)
BOI AXA Liquid Fund (2008)


![Axa Magnet - Presentasi AXA Magnet [ Maestro Global Network ] Terbaru](https://img.dokumen.tips/doc/110x75/55d2ed27bb61ebdd398b462f/axa-magnet-presentasi-axa-magnet-maestro-global-network-terbaru.jpg)