Embed Size (px)
Citation preview
Canadian Red Cross
Croix-Rouge canadienne
BOATINGImmersion and TraumaDeaths in Canada16 years of research
BOATINGImmersion and TraumaDeaths in Canada16 years of research
2
© Transport Canada and The Canadian Red Cross Society, 2010
Boating Immersion and Trauma Deaths in Canada: 16 Years of Research
This recreational boating surveillance report was developed and written by Dr. Peter Barss incollaboration with the Canadian Red Cross. Jane Hamilton, MSc. Epidemiology, carried outthe data analysis and tables, Sophie Lapointe data management, Cait Beattie design, charts andfigures, and review of data. Peter Barss reviewed, coded, verified, and corrected data for eachdeath and coordinated the research.
Data collectors included volunteers and staff of the Canadian Red Cross and the LifesavingSociety. Data collection was made possible through the assistance and co-operation of provincialcoroners, medical examiners, their statistical staff, and the National Association of Coroners.Financing of the work was done collaboratively by sharing resources and staff. Data collectionmainly involved the Canadian Red Cross, the Lifesaving Society, and provincial coroners. The Canadian Red Cross translation department supervised translation with the assistance ofCait Beattie.
Transport Canada sponsored and helped monitor progress of the current report and researchfor 2005-2006 data, together with reformulation and reanalysis of 1991-2004 data. ShelleyDalke of the Canadian Red Cross managed this project in collaboration with Myke Dwyer ofTransport Canada’s Office of Boating Safety.
The National Search and Rescue Secretariat and the Canadian Red Cross funded data analysisand writing, as well as editing, design, and layout for the earlier 10-year modular report onwhich this 16-year report is based. Rosemary Hong, former coordinator for drowning researchat the Canadian Red Cross, initiated the 10-year modular project that was a foundation for thisreport. Data management was supported in earlier years by the Canadian Red Cross and theLifesaving Society, and Isabelle Masson made an important contribution to that process.
The Research Institute of the McGill University Health Centre provided administrative supportfor data management during the initial 15 years of the research. For the first six years, theNational Drowning Report and related special interest reports were supported by The InjuryPrevention Module of the Régie régionale de la santé et des services sociaux de Montréal-Centre, a member of the World Health Organization’s Collaborating Centre for InjuryPrevention and Safety Promotion.
This report has drawn upon the Canadian Red Cross 10-year research modules on boating and cold immersion deaths, which received the Canadian Marine Safety Award from TransportCanada in 2009. Many recommendations are the same, but there are additions based upon thecurrent research, which incorporates an additional six years of national data and reanalyses ofthe entire database.
Design, layout, and cover photo: Cait Beattie and Jean Louis Martin, Résolutique globaleTranslation: Monique Edwards (text), Résolutique globale (figures)
Ce rapport est aussi publié en français.
T A B L E O F C O N T E N T S
3
4 INTRODUCTION
6 METHODS
RESULTS
8 Boating
10 Recreational Boating
13 Immersion
24 Trauma
28 Personal Watercraft
32 Tables
57 DISCUSSION & RECOMMENDATIONS
67 REFERENCES
Boating Immersion and Trauma Deaths in Canada:16 Years of Research (1991-2006)
4
I N T R O D U C T I O N
While canoes, kayaks and sailing vessels were all necessary for various environments andactivities, and continue to be popular with many Canadians, at present powered boats aremore numerous. Powerboats are used for three main purpose: recreation, occupation, and activities of daily life, including travel and subsistence fishing and hunting. At presentrecreational activities, including fishing and powerboating, predominate.
The marine environment can be harsh to the unprepared boater, and so year after yearabout 40% of drowning deaths from immersion in Canada involve boaters, and boating isthe leading cause of fatalities from immersion and other water-related injuries.
This report includes an overview of 16 years of research data on all deaths involving boats in Canada, with the main emphasis on recreational incidents. For the purposes of this report recreational and activities of daily life have been combined as recreational. This is justifiable in terms of international injury coding practices of the World HealthOrganisation and since the distinction between these categories is often unclear. The reportfocuses on activities and incidents associated with deaths, and on personal, equipment, and environmental risk factors. Readers with an interest in details of deaths associated withspecific types of boats should also consult the 10-year modules on which this report wasbased, at the Canadian Red Cross website.
In the 10-year modules, according to files from all provincial and territorial coroners’ andmedical examiners’ offices, there were 1,952 boating fatalities in Canada during 1991-2000, including 1,803 drownings, and 149 water-related non-drowning deaths resultingprimarily from trauma (98) and hypothermia (51) (Canadian Red Cross 2009). Afterverification with coroners in several provinces, the data for this period were believed toinclude greater than 95% of all boating deaths. Boating accounted for 33% of drowningsand 41% of non-drowning deaths. When land and air transport were excluded, boatingrepresented 39% of drownings and 50% of other water-related fatalities.
Sadly, year after year boaters continue to remain unaware of or ignore fundamental yetsimple principles of boating safety, and many die. Canadians who faithfully fasten theirsafety belts and avoid alcohol in the much less dangerous traffic environment embark ontothe water without the protection of a properly worn flotation device, often in boats that areunsafe except in ideal conditions. Many boaters are weak swimmers or cannot swim at all.Although alcohol is ill advised while boating for both operators and passengers, purchasingand loading supplies of alcohol into the boat frequently takes priority over a visit to areputable boating shop to ensure that the operator and all passengers are fitted with a safeand comfortable flotation device, appropriate to the nature of the boating activity.
Similarly, while many drivers assess weather and road conditions prior to travel by road, fewverify marine weather and water temperatures before setting off in their boats. Boaters arealso unable to easily access safety reviews of boats and flotation devices prior to purchase,including performance under adverse weather conditions such as wind, waves, and cold.Safety performance data for motor vehicles and for related safety equipment such as seatbelts, airbags, and child restraints are available at various sources such as Transport Canadaand the U.S. Insurance Institute for Highway Safety.
From the results of detailed epidemiologic studies, including this and earlier reports, it isevident that injuries such as drowning do not strike randomly as thunderbolts from the sky.While the exact moment of a tragic incident is not always predictable, usual combinationsof circumstances are generally predictable and preventable.
In the belief that knowledge of the circumstances of water-related deaths offers a source of prevention for all boaters, this report on the circumstances of death for nearly 3,000Canadian boaters is provided as a guide to survival for decision makers, as well as futureboaters, operators and passengers, since we all carry at least partial responsibility for ourown security when we choose to step into a boat, be it at anchor, wharf or underway.
I N T R O D U C T I O N
5
It is hoped that the wearing of an appropriate flotation device supplemented whennecessary by protection against cold immersion, together with careful assessment ofprevailing and predicted water temperatures, wind, waves, and darkness, will become aroutine for all users of boats. No boater should embark on the waters without the specifictraining, safety equipment, safe boat, and swimming ability, all of which are essential fortheir chosen activity.
Decision makers carry a heavy burden of responsibility for the survival of boatingpopulations, especially in Canada with so many vulnerable people at risk. Political leadersand their civil servants have a duty to act, ensuring that legislation and enforcement areready and effective for the universal protection of all Canadians, including the naive, from their own folly during boating, with special attention to the need for all boaters towear an appropriate flotation device.
It is astounding to note that in exposure to boating, where the most frequent injuryincidents involve capsizing and falling overboard, non-swimmers and weak swimmerscontinue to boat without a flotation device, and drown as a result. No one should receivethe death penalty for ignorance. Special attention should also be given to regulationsgoverning the manufacture of small open boats to ensure that they are safe to operate evenwhen sudden changes of wind and waves pose a threat to survival, and that they provide a reasonable safety platform and the possibility of self-rescue even when swamped oroverturned.
This report has been prepared to provide an epidemiologic profile for prevention. Injuryincidents are often multifactorial. Nevertheless, a favourable change in a single factor canbe sufficient to tip the balance sufficiently away from danger in favour of safety to preventan incident from occurring. This is pre-emptive action in the pre-event phase. The use ofappropriate safety equipment or action can prevent injury even if an incident does occur; in this case, injury is aborted or reduced in the event phase. Finally, post-event phaseactivities such as rapid intervention with lifesaving, first aid, appropriate methods ofrewarming, CPR, and so forth after an injury has occurred can minimize, stop, or reversethe progression of damage from any injuries sustained during the event phase.
The results are based upon annual data abstraction of information about each incidentcollected by thousands of coroners and police, and recorded in provincial and territorialcoroners’ files across Canada. The data required nearly 20 years of dedicated work byvoluntary Red Cross and other data collectors, guided by project managers and researchprofessionals. Details of each incident were recorded in 15-page structured questionnairesand converted into electronic format for analysis. Each year’s data collection,transformation into electronic format, and analysis require about two years’ work. The analysis of 16 years of data has been much more complex than for a single year. Our hope is that this report will help to prevent fatalities and reduce economic losses dueto immersion and trauma during recreational boating, an important activity for manyCanadians.
M E T H O D S
6
STUDY POPULATION AND TIME PERIOD All drownings and other water-related injury deaths inCanada were monitored between 1 January 1991 and 31 December 2006. In the 2001census, the total population of Canada was 30 million. Thus, boating deaths in 1991-2006occurred on the background of about 50 million person years of exposure to risk for all ages.
DEFINITIONS
IMMERSION DEATHS: DROWNING & IMMERSION HYPOTHERMIA For the purposes of this report,immersion death includes death by drowning and/or immersion hypothermia. Animmersion death was classified as a drowning if drowning was included in the coroner’sreport, based upon the autopsy or other findings. The death was classified as hypothermiawithout drowning only if the coroner’s report excluded drowning as among the causes ofdeath based on lack of autopsy findings of drowning, and contained other supportingfactors that exclude drowning, such as wearing of a flotation device. Reporting was doneon all immersions as a single category because, as evident from the Canadian Red Cross10-year module on cold immersion, cold is a factor in at least 38% of boating immersiondeaths, and hypothermia is reported inconsistently due to lack of clear criteria for such a diagnosis, as well as lack of training in immersion death on the part of some coroners and police. Risk factors for both types of immersion death tend to be similar.
TRAUMA DEATHS As in the World Health Organisation’s International Classification ofDiseases, trauma deaths are reported as a separate category. Causes of death include bluntand penetrating trauma, mainly from external causes such as various types of collisions and falls. Types of injury include head and spinal injury, fractures, severe lacerations, andmultiple injuries.
TYPES OF BOATS For the purposes of this report, powerboats are boats that are mainlypropelled by a motor. Unpowered boats are not really unpowered, just not mainly poweredby a motor. They are generally propelled by human or wind power, although largersailboats do have a motor. The cut-off between small and large powerboats was 5.5 metreswhen surveillance reporting began in 1991. This has changed recently with someorganizations, but the original classification has been retained. It is seldom that police orcoroners record the exact length of boats. Hence the most frequent category of powerboatgenerally specified is small open fishing type boats, most of which are mass produced inaluminum for ease of transport, which is not necessarily conducive to safety in adverseconditions. Most of the powerboats reported only as unknown probably also fall into thiscategory. Boats designated as personal watercraft (PWCs) by Transport Canada arereferred to as jet skis in the World Health Organisation’s International Classification ofDiseases, 10th edition. Unpowered paddle boats or pedalos (French), also known as watercycles, are referred to as pedal boats in this report.
OTHER DEFINITIONS Boating refers to being in a boat, boarding or leaving a boat, falling from or jumping from a boat (to retrieve a person, animal, or object), and being towed by a boat (e.g. water-skier, tuber). Swimmers and waders struck by a boat or propeller are also included in the report. In accord with the World Health Organisation’s 10th edition of the International Classification of Diseases (World Health Organisation, 2007), personsvoluntarily swimming or diving from a boat are excluded from boating, as these are aquaticactivities. For the purposes of this report, recreational boating includes activities of dailylife, such as boat travel and subsistence fishing. Occupational boating refers to boating aspart of professional life. Rescue refers to an attempt to rescue another person or an animalsuch as a dog. The term fishing was used when fishing was the main objective of theactivity; fishing includes travelling to and from the fishing site. Powerboating refers tooperating a power boat, including a PWC, as an end in itself. Sailing, canoeing, kayaking,rafting, rowing, etc. refer to the activity rather than the type of boat (i.e. fishing from acanoe is categorized as fishing rather than canoeing.) Capsized means that the boatoverturned. Swamped indicates that the boat took on water. Collision means that the boatstruck or was struck by another boat, or struck a fixed object (e.g. a rock, stump, or dock)or a person (e.g. swimmer, water-skier, tuber). Fell or thrown overboard (or was ejected)refers to an incident in which the person ended up in the water but the boat remainedupright and intact (i.e. without capsizing, swamping or collision).
M E T H O D S
7
ETHNICITY Because of greater exposure among aboriginal peoples to boat travel, andcommunities or homes near the water, the proportion of victims among First Nations andInuit peoples is provided. Aboriginal status was considered definite if the victim wasclassified as such in the coroner, police, or autopsy files by coroner, police, or pathologist.Probable aboriginal status was assigned if the address corresponded to a known reserve andif the family name was known to be aboriginal. The definition of aboriginal varies, but theyprobably represent at least three to four percent of the Canadian population. Since Ontariohas not consistently facilitated reporting on aboriginal status, data are incomplete for thelargest province for several years, affecting overall reporting. Hence the true proportion ofaboriginal drowning is undoubtedly substantially greater than reported.
NATIONAL SURVEILLANCE DATABASE In the early 1990’s, the Canadian Red Cross implementeda national drowning surveillance database. This was developed with the collaboration ofpublic health injury prevention professionals, all provincial coroners, and other water-safetyorganizations including the Coast Guard and Lifesaving Society. The database was fundedto provide a sound research basis for national water-safety programs, by monitoring theincidence and circumstances of all water-related injury deaths in Canada on an annual basis.It includes annual information from 1991 onwards (Canadian Red Cross, 2001). Anepidemiologic profile of all water-related injury deaths is available (Red Cross 2003, 2005).The completeness of the database was affected during 2005 and 2006 as discussed below.
DATA COLLECTION The surveillance database relies upon annual structured reviews of themandatory coroner and police reports for all water-related deaths. A questionnaire with48 questions is used to obtain data on cause of death, activity and purpose of activity, along with personal, equipment, and environment risk factors. Project managers supervisedvolunteer data collectors in each province with the collaboration and joint management of the Red Cross and Lifesaving Society between 1991-2004. During 2005 and 2006, data collection was carried out and/or supervised by a for-profit group known as theWater-Related Injury Alliance. We believe this group closed out data collection earlier thanin previous years, and they did shorten the data questionnaire. During 2001-2005 andespecially during 2006, the proportion of estimated missing deaths rose significantly, asreported in the results section of this report. Missing data for available 2005-2006 deathfiles for questions relating to alcohol and other key issues were collected by the CanadianRed Cross from coroners so validity of blood alcohol could be assessed when recovery ofthe body was delayed. However, access to retrospectively collected death files missing fromthe surveillance database was not possible for most provinces. Hence while population-based incidence rates were calculated for the Canadian Red Cross 10-year modular reportsfor 1999-2000, this has not been done for the current report and the number of deaths for 2005 and 2006 should be considered incomplete.
DATA VERIFICATION AND ANALYSIS All completed questionnaires are verified and corrected at the national level by a medically trained injury epidemiologist. Verification is highlystructured and includes such issues as admissibility, completeness, internal consistency ofresponses, and consistency from year to year. Data entry is done with appropriate qualitycontrol, including double entry and compare. Data are analyzed annually, but for thisreport 16 years of data were used. Since coroners take a year or more to finalize all cases,and data collection and analysis nearly another year, reporting tends to lag behind theincidents by about two years. This is not of major consequence for prevention, since major trends usually occur slowly. Due to concern about missing deaths under new datacollection policies during 2005-2006, each province and territory’s coroner/medicalexaminer statistical staff were surveyed using a one-page structured questionnaire to assessthe number of boating deaths in each jurisdiction. This was done to provide an estimate ofincomplete data collection by year from 1991-2006.
In the early development years, the analytical work was considered research. In later years,it became a mix of surveillance and research. Detailed reports on new topics, such as thepresent report on recreational boating deaths, fall into this category. Hence it is possible toprovide a sound basis for new programming. Recommendations have also been supportedby periodic monitoring of the scientific literature on injury prevention in internationaldatabases.
B O A T I N G
8
RESULTS
OVERVIEW OF ALL BOATING FATALITIES
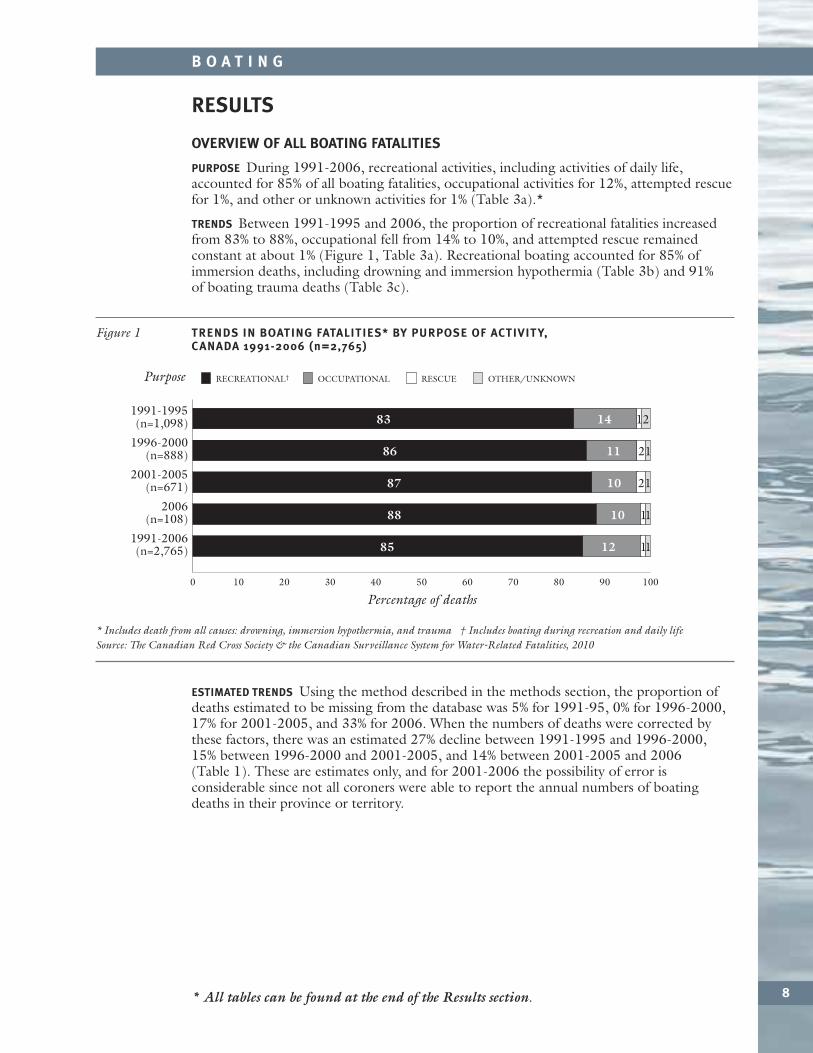
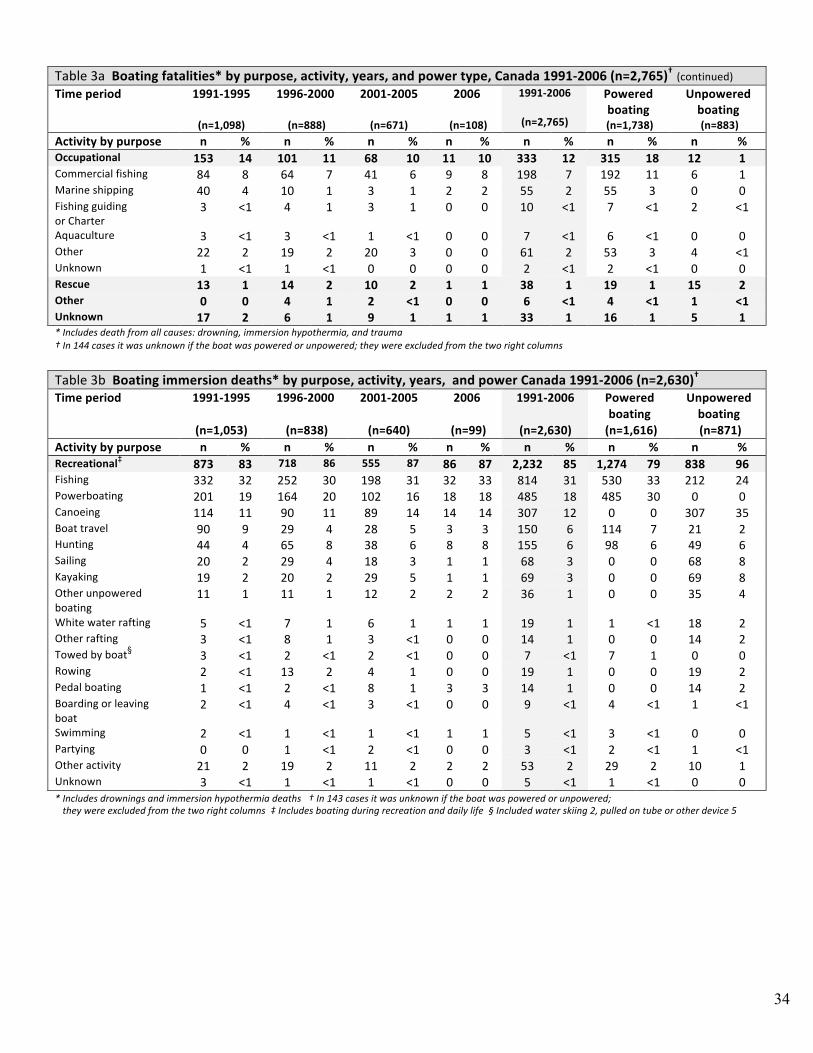
PURPOSE During 1991-2006, recreational activities, including activities of daily life,accounted for 85% of all boating fatalities, occupational activities for 12%, attempted rescuefor 1%, and other or unknown activities for 1% (Table 3a).*
TRENDS Between 1991-1995 and 2006, the proportion of recreational fatalities increasedfrom 83% to 88%, occupational fell from 14% to 10%, and attempted rescue remainedconstant at about 1% (Figure 1, Table 3a). Recreational boating accounted for 85% ofimmersion deaths, including drowning and immersion hypothermia (Table 3b) and 91% of boating trauma deaths (Table 3c).
* Includes death from all causes: drowning, immersion hypothermia, and trauma † Includes boating during recreation and daily lifeSource: The Canadian Red Cross Society & the Canadian Surveillance System for Water-Related Fatalities, 2010
Figure 1 TRENDS IN BOATING FATALITIES* BY PURPOSE OF ACTIVITY, CANADA 1991-2006 (n=2,765)
0 20 3010 40 50 60 70 80 90 100
Percentage of deaths
1991-2006(n=2,765)
1996-2000(n=888)
2001-2005(n=671)
2006(n=108)
85
Purpose RECREATIONAL† OCCUPATIONAL RESCUE OTHER/UNKNOWN
12 11
1991-1995(n=1,098) 83 14 21
86 11 12
87 10 21
88 10 11
ESTIMATED TRENDS Using the method described in the methods section, the proportion ofdeaths estimated to be missing from the database was 5% for 1991-95, 0% for 1996-2000,17% for 2001-2005, and 33% for 2006. When the numbers of deaths were corrected bythese factors, there was an estimated 27% decline between 1991-1995 and 1996-2000,15% between 1996-2000 and 2001-2005, and 14% between 2001-2005 and 2006(Table 1). These are estimates only, and for 2001-2006 the possibility of error isconsiderable since not all coroners were able to report the annual numbers of boatingdeaths in their province or territory.
* All tables can be found at the end of the Results section.
B O A T I N G
9
* Includes death from all causes: drowning, immersion hypothermia, and traumaSource: The Canadian Red Cross Society & the Canadian Surveillance System for Water-Related Fatalities, 2010
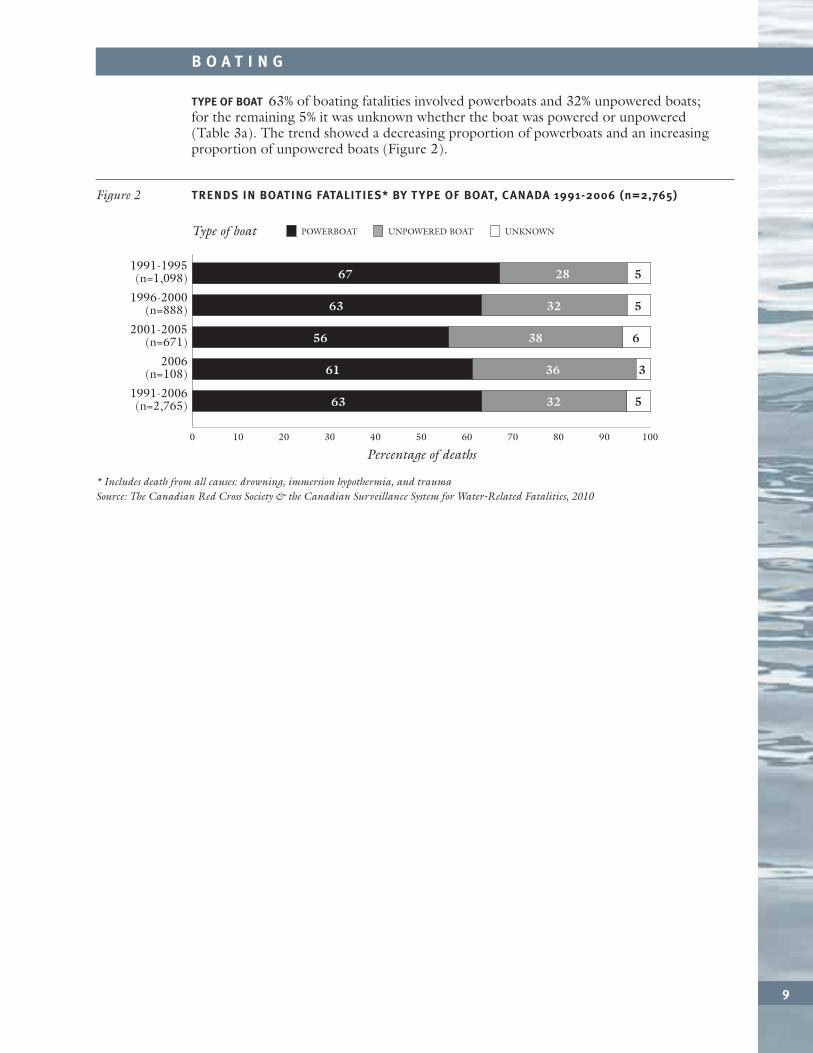
Figure 2 TRENDS IN BOATING FATALITIES* BY TYPE OF BOAT, CANADA 1991-2006 (n=2,765)
0 20 3010 40 50 60 70 80 90 100
Percentage of deaths
63
Type of boat POWERBOAT UNPOWERED BOAT UNKNOWN
32 5
67 28 5
63 32 5
56 38 6
61 36 3
1991-2006(n=2,765)
1996-2000(n=888)
2001-2005(n=671)
2006(n=108)
1991-1995(n=1,098)
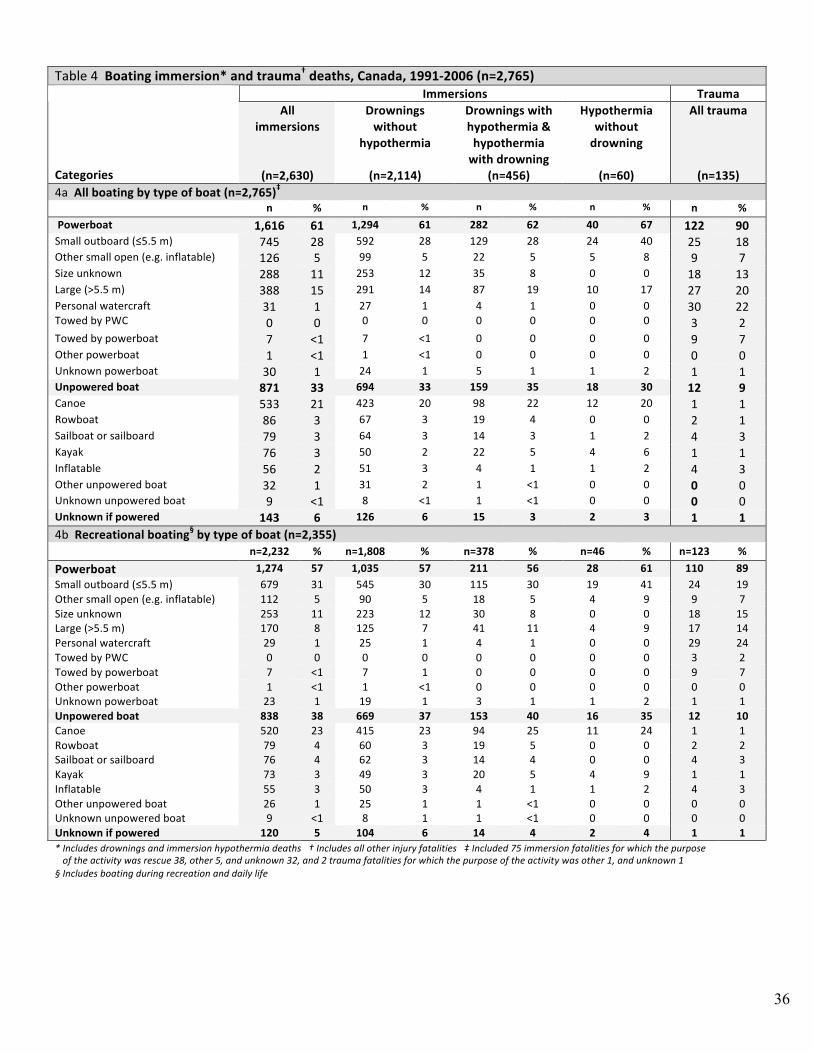
TYPE OF BOAT 63% of boating fatalities involved powerboats and 32% unpowered boats; for the remaining 5% it was unknown whether the boat was powered or unpowered (Table 3a). The trend showed a decreasing proportion of powerboats and an increasingproportion of unpowered boats (Figure 2).
R E C R E A T I O N A L B O A T I N G
10
* Includes boating during recreation and daily life † Includes death from all causes: drowning, immersion hypothermia, and traumaSource: The Canadian Red Cross Society & the Canadian Surveillance System for Water-Related Fatalities, 2010
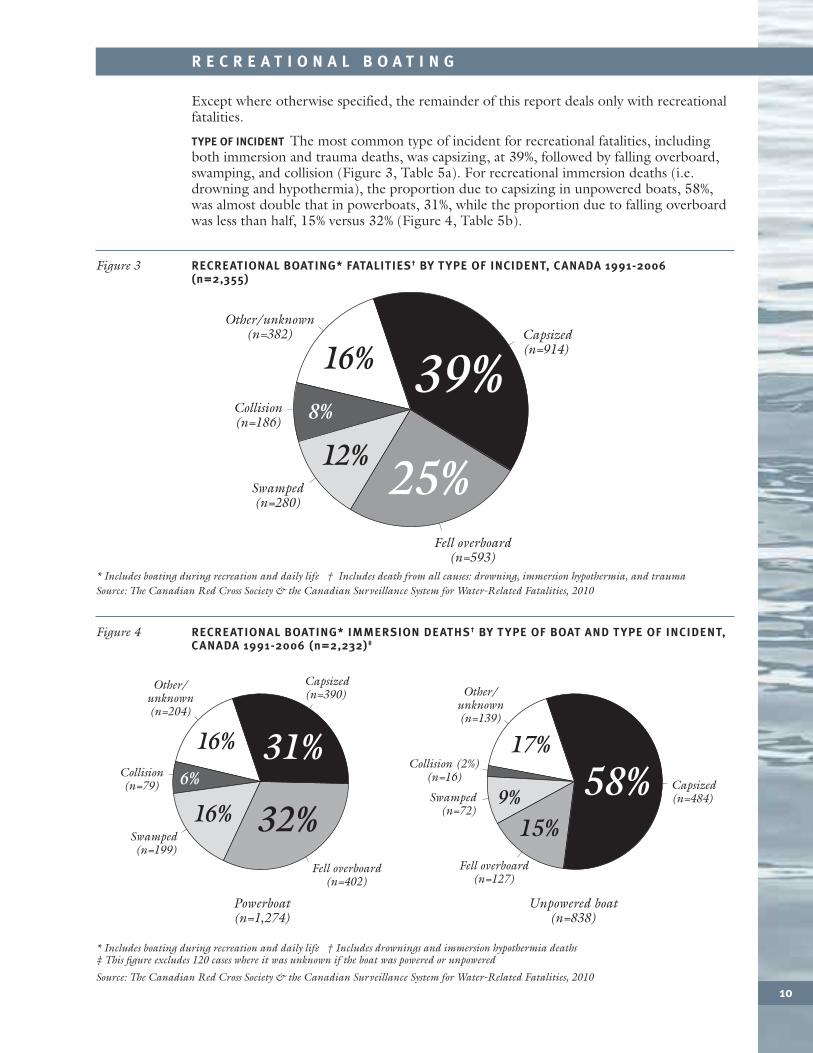
Figure 3 RECREATIONAL BOATING* FATALITIES† BY TYPE OF INCIDENT, CANADA 1991-2006(n=2,355)
Fell overboard(n=593)
Capsized(n=914)
Swamped(n=280)
Other/unknown(n=382)
Collision(n=186)
39%
25%
8%
16%
12%
Except where otherwise specified, the remainder of this report deals only with recreationalfatalities.
TYPE OF INCIDENT The most common type of incident for recreational fatalities, includingboth immersion and trauma deaths, was capsizing, at 39%, followed by falling overboard,swamping, and collision (Figure 3, Table 5a). For recreational immersion deaths (i.e.drowning and hypothermia), the proportion due to capsizing in unpowered boats, 58%,was almost double that in powerboats, 31%, while the proportion due to falling overboardwas less than half, 15% versus 32% (Figure 4, Table 5b).
* Includes boating during recreation and daily life † Includes drownings and immersion hypothermia deaths‡ This figure excludes 120 cases where it was unknown if the boat was powered or unpowered
Source: The Canadian Red Cross Society & the Canadian Surveillance System for Water-Related Fatalities, 2010
Figure 4 RECREATIONAL BOATING* IMMERSION DEATHS† BY TYPE OF BOAT AND TYPE OF INCIDENT,CANADA 1991-2006 (n=2,232)‡
Fell overboard(n=402)
Capsized(n=390)
Swamped(n=199)
Other/unknown(n=204)
Collision(n=79)
31%
32%6%
16%
16%
Fell overboard(n=127)
Capsized(n=484)Swamped
(n=72)
Other/unknown(n=139)
Collision (2%)(n=16) 58%
15%
17%
9%
Powerboat(n=1,274)
Unpowered boat(n=838)
R E C R E A T I O N A L B O A T I N G
11
* Includes boating during recreation and daily life † Includes drownings and immersion hypothermia deaths Source: The Canadian Red Cross Society & the Canadian Surveillance System for Water-Related Fatalities, 2010
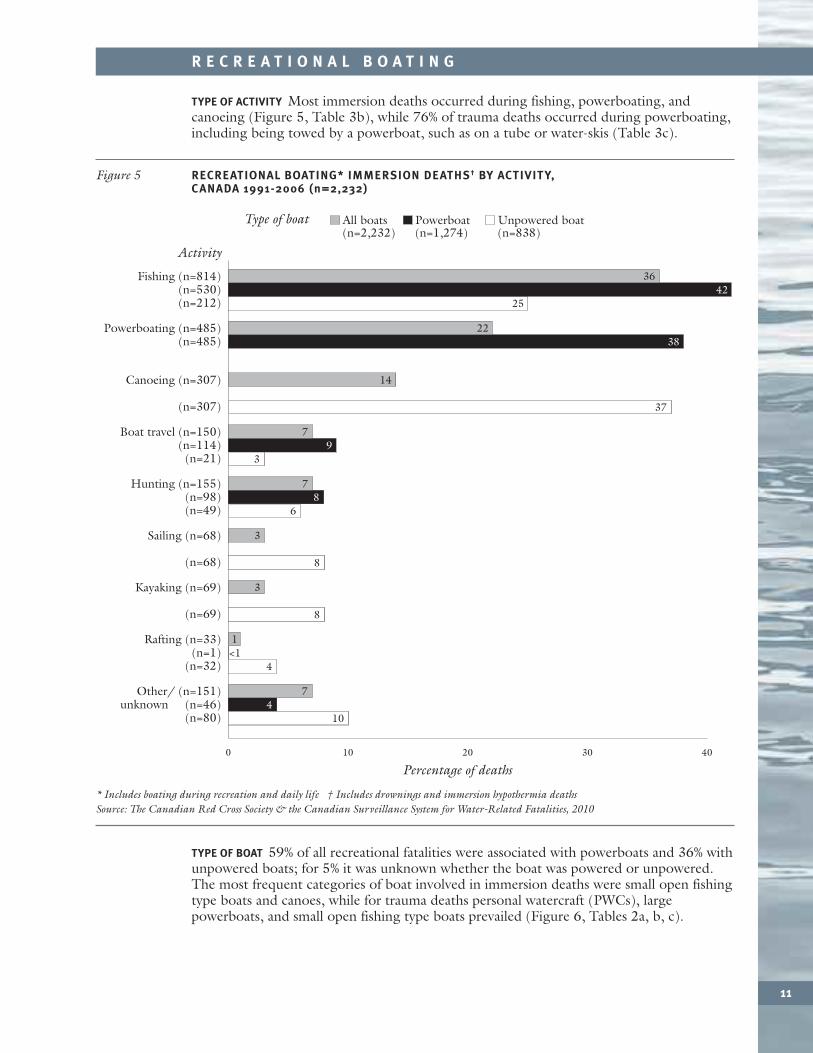
Figure 5 RECREATIONAL BOATING* IMMERSION DEATHS† BY ACTIVITY,CANADA 1991-2006 (n=2,232)
Fishing (n=814)(n=530)(n=212)
Powerboating (n=485)(n=485)
Canoeing (n=307)
(n=307)
Boat travel (n=150)(n=114)
(n=21)
Sailing (n=68)
(n=68)
Kayaking (n=69)
(n=69)
Activity
Type of boat Powerboat(n=1,274)
Unpowered boat (n=838)
All boats(n=2,232)
Other/ (n=151)unknown (n=46)
(n=80)
Rafting (n=33)(n=1)
(n=32)
Hunting (n=155)(n=98)(n=49)
0 10 20 30 40
Percentage of deaths
36
25
37
42
7
3
3
8
3
8
1
4
9
7
68
7
104
<1
22
14
38
TYPE OF ACTIVITY Most immersion deaths occurred during fishing, powerboating, andcanoeing (Figure 5, Table 3b), while 76% of trauma deaths occurred during powerboating,including being towed by a powerboat, such as on a tube or water-skis (Table 3c).
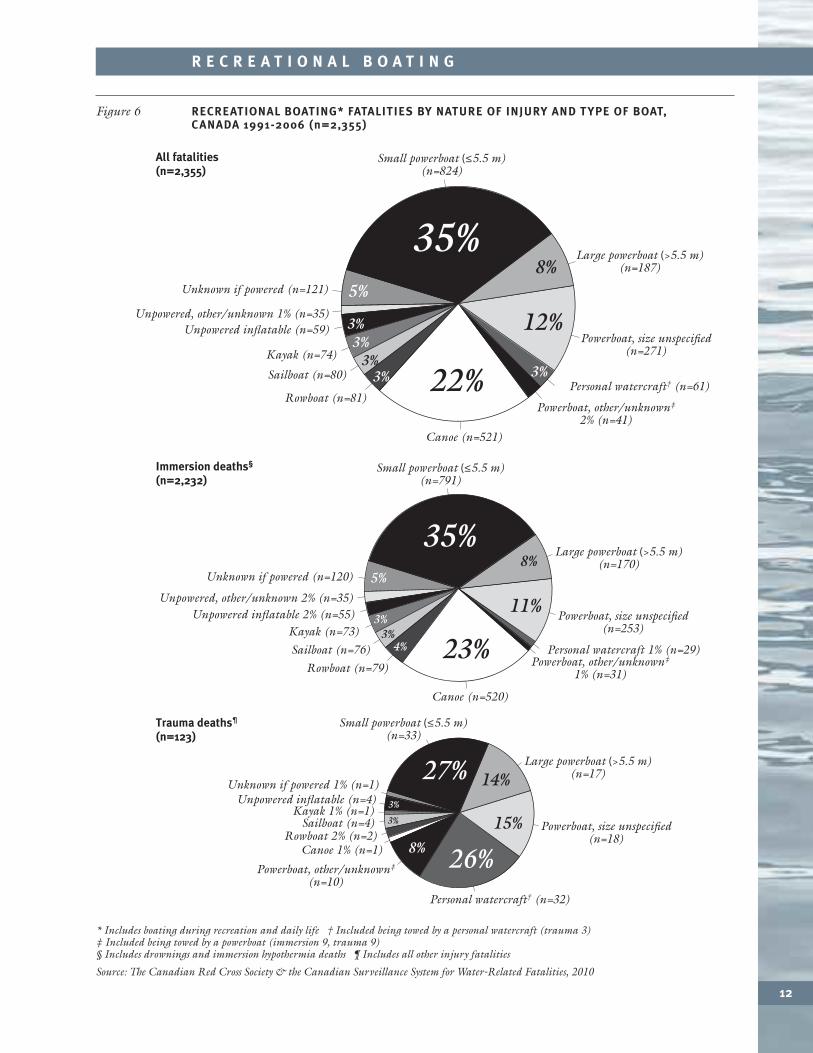
TYPE OF BOAT 59% of all recreational fatalities were associated with powerboats and 36% withunpowered boats; for 5% it was unknown whether the boat was powered or unpowered.The most frequent categories of boat involved in immersion deaths were small open fishingtype boats and canoes, while for trauma deaths personal watercraft (PWCs), largepowerboats, and small open fishing type boats prevailed (Figure 6, Tables 2a, b, c).
R E C R E A T I O N A L B O A T I N G
12
* Includes boating during recreation and daily life † Included being towed by a personal watercraft (trauma 3) ‡ Included being towed by a powerboat (immersion 9, trauma 9)§ Includes drownings and immersion hypothermia deaths ¶ Includes all other injury fatalities
Source: The Canadian Red Cross Society & the Canadian Surveillance System for Water-Related Fatalities, 2010
Figure 6 RECREATIONAL BOATING* FATALITIES BY NATURE OF INJURY AND TYPE OF BOAT,CANADA 1991-2006 (n=2,355)
22%
8%5%
3%3%
3%3%
3% 12%
35%
Small powerboat (≤5.5 m)(n=824)
Large powerboat (>5.5 m)(n=187)
Powerboat, size unspecified(n=271)
Powerboat, other/unknown‡
2% (n=41)
Personal watercraft† (n=61)
Canoe (n=521)
Rowboat (n=81)
Sailboat (n=80)
Kayak (n=74)
Unpowered, other/unknown 1% (n=35)
Unknown if powered (n=121)
Unpowered inflatable (n=59)
23%
8%5%
3%3%
4%
11%
35%
26%
14%
3%
3%
8%
15%
27%
Small powerboat (≤5.5 m)(n=791)
Small powerboat (≤5.5 m)(n=33)
Large powerboat (>5.5 m)(n=170)
Powerboat, size unspecified(n=253)
Large powerboat (>5.5 m)(n=17)
Powerboat, size unspecified(n=18)
Powerboat, other/unknown‡
1% (n=31)
Powerboat, other/unknown‡
(n=10)
Personal watercraft 1% (n=29)
Personal watercraft† (n=32)
Canoe (n=520)
Canoe 1% (n=1)
Rowboat (n=79)Sailboat (n=76)Kayak (n=73)
Unpowered, other/unknown 2% (n=35)
Unknown if powered (n=120)
Unpowered inflatable 2% (n=55)
Rowboat 2% (n=2)Sailboat (n=4)
Kayak 1% (n=1)
Unknown if powered 1% (n=1)Unpowered inflatable (n=4)
All fatalities(n=2,355)
Immersion deaths§
(n=2,232)
Trauma deaths¶
(n=123)

I M M E R S I O N
13
* Legal limit is 80 mg% † Includes drownings and immersion hypothermia deaths ‡ Includes boating during recreation and daily life§ This figure excludes 39 victims; decomposition rendered blood alcohol unreliable ¶ 106 at 1-49 mg %, 80 at 50-80 mg %, 98 unspecified
Source: The Canadian Red Cross Society & the Canadian Surveillance System for Water-Related Fatalities, 2010
Figure 7 BLOOD ALCOHOL LEVELS* FOR IMMERSION DEATHS† DURING RECREATIONAL BOATING,‡
CANADA 1991-2006 (VICTIMS ≥15 YEARS OF AGE; n=2,165)§
101-150 mg % (n=132)
81-100 mg % (n=28)
151-200 mg % (n=133)
201-250 mg % (n=111)
251-300 mg % (n=72)
>300 mg % (n=67)
36%
18%7% 13%
26%24%
20%
12%
13%
24 %5%
Above limit( (n=547)
Unknown(n=382)
Alcohol suspected(n=149)
Below limit¶
(n=284)
No alcohol(n=764)
Unspecified 1% (n=4)
There were 2,232 immersion deaths, including drowning and immersion hypothermia,accounting for 95% of recreational boating fatalities during 1991-2006.
PERSONAL FACTORS
AGE & SEX Persons between 15 and 74 years old accounted for 93% of recreational boatingimmersion deaths, and 93% were males. Children less than 15 years old accounted for lessthan 4% of deaths. The proportion of fatalities by 10-year age groups was similar for ages15 to 54 (Table 7a). However, the proportion of fatalities for unpowered boaters was morethan double that for powerboats among males 15-24 years-old.
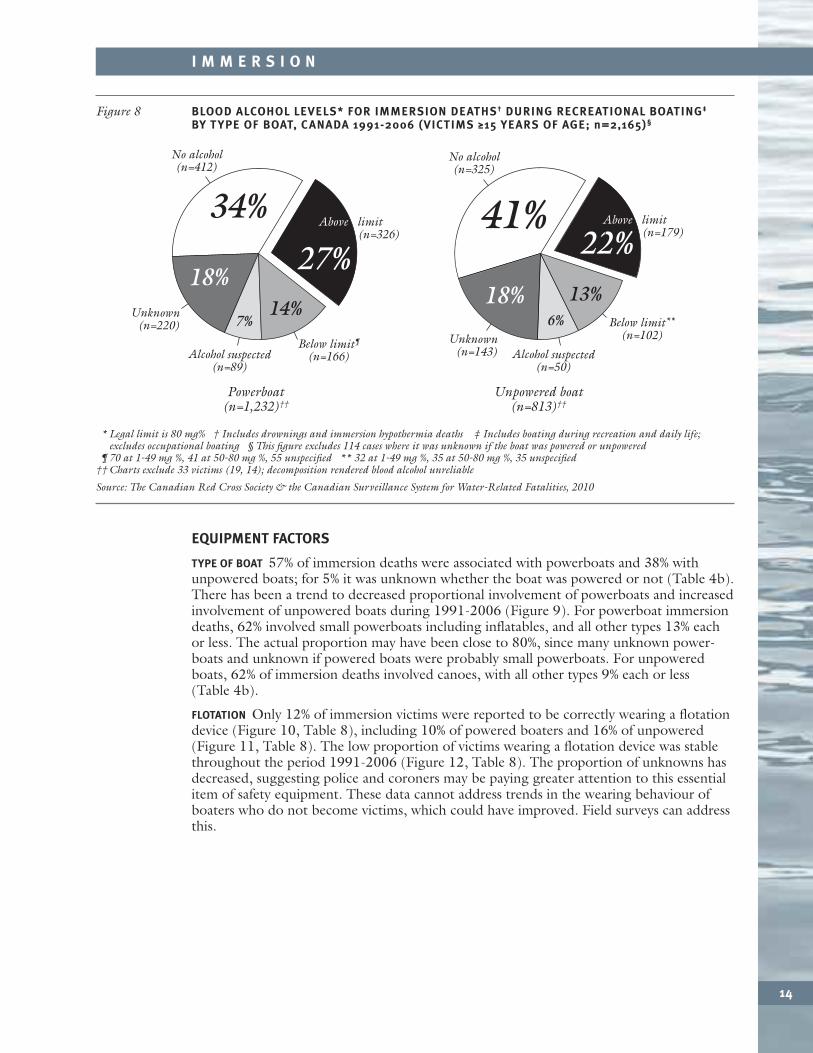
ALCOHOL & ILLEGAL DRUGS Alcohol was present or suspected in 46% of recreational boatingimmersion deaths for victims 15 years of age and older, with 18% unknown (Figure 7,Table 7b). If deaths with alcohol classified as unknown are excluded, alcohol would bepresent or suspected for 55%, and so the true figure may lie between 46% and 55%, possiblyclose to or exceeding 50%. There was greater involvement of alcohol among powerboatvictims (Figure 8). Illegal drugs were present or suspected in 7% of deaths of persons 15and older (Table 7b). When unknowns were excluded (50%), this rose to 14%, so the truefigure could lie between these values.
SWIMMING ABILITY This was unknown for 66%; 52% of the remainder were weak or non-swimmers (Table 7a).
BOATING EXPERIENCE This was unknown for 68%, while 67% of the remainder were reportedas experienced boaters and 33% as occasional or inexperienced boaters (Table 6a).
ETHNICITY Although aboriginals account for about 4% of the Canadian population, at least16% of boating victims were aboriginal, probably substantially more since ethnicity wasunreported for many victims (28%), especially in Ontario since 1996.
I M M E R S I O N
14
EQUIPMENT FACTORS
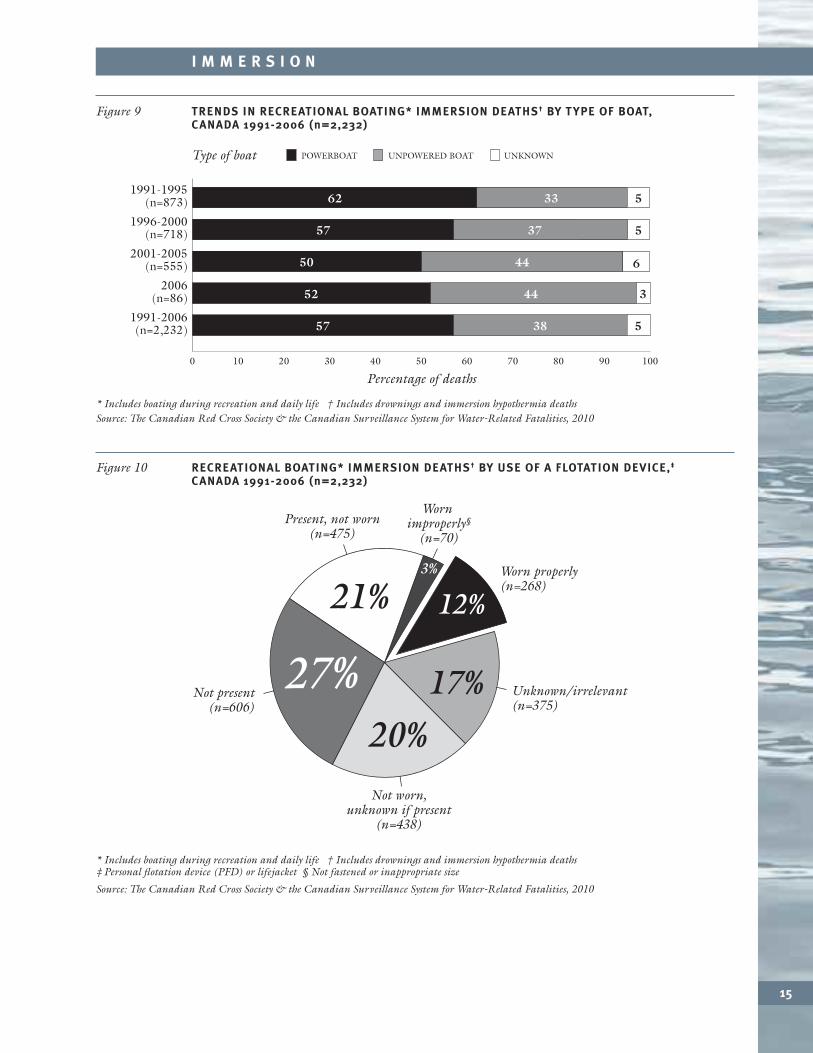
TYPE OF BOAT 57% of immersion deaths were associated with powerboats and 38% withunpowered boats; for 5% it was unknown whether the boat was powered or not (Table 4b).There has been a trend to decreased proportional involvement of powerboats and increasedinvolvement of unpowered boats during 1991-2006 (Figure 9). For powerboat immersiondeaths, 62% involved small powerboats including inflatables, and all other types 13% eachor less. The actual proportion may have been close to 80%, since many unknown power -boats and unknown if powered boats were probably small powerboats. For unpoweredboats, 62% of immersion deaths involved canoes, with all other types 9% each or less(Table 4b).
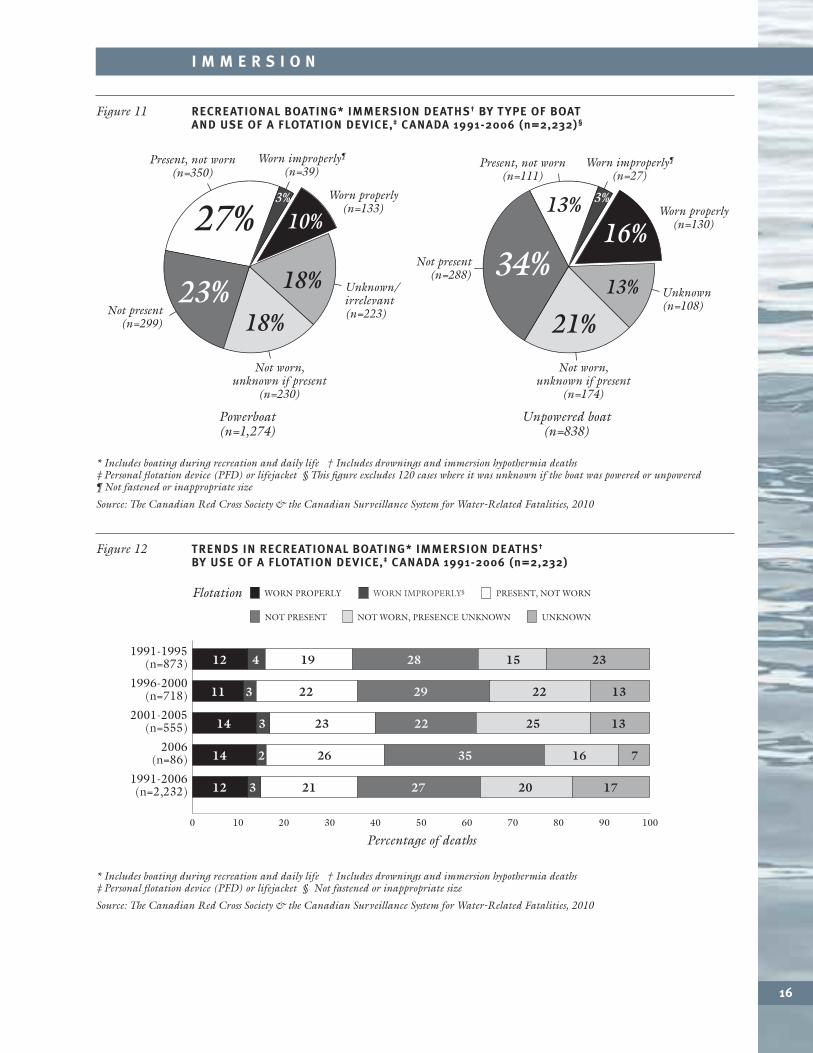
FLOTATION Only 12% of immersion victims were reported to be correctly wearing a flotationdevice (Figure 10, Table 8), including 10% of powered boaters and 16% of unpowered(Figure 11, Table 8). The low proportion of victims wearing a flotation device was stablethroughout the period 1991-2006 (Figure 12, Table 8). The proportion of unknowns hasdecreased, suggesting police and coroners may be paying greater attention to this essentialitem of safety equipment. These data cannot address trends in the wearing behaviour ofboaters who do not become victims, which could have improved. Field surveys can addressthis.
* Legal limit is 80 mg% † Includes drownings and immersion hypothermia deaths ‡ Includes boating during recreation and daily life; excludes occupational boating § This figure excludes 114 cases where it was unknown if the boat was powered or unpowered
¶ 70 at 1-49 mg %, 41 at 50-80 mg %, 55 unspecified ** 32 at 1-49 mg %, 35 at 50-80 mg %, 35 unspecified††Charts exclude 33 victims (19, 14); decomposition rendered blood alcohol unreliable
Source: The Canadian Red Cross Society & the Canadian Surveillance System for Water-Related Fatalities, 2010
Figure 8 BLOOD ALCOHOL LEVELS* FOR IMMERSION DEATHS† DURING RECREATIONAL BOATING‡
BY TYPE OF BOAT, CANADA 1991-2006 (VICTIMS ≥15 YEARS OF AGE; n=2,165)§
Powerboat(n=1,232)††
Below limit¶
(n=166)
Unknown(n=220)
Alcohol suspected(n=89)
34%
18%14%
7%
27%
Unpowered boat(n=813)††
41%
18% 13%6%
22%
No alcohol(n=412)
No alcohol(n=325)
Above limit( (n=326)
Below limit**
(n=102)Unknown(n=143) Alcohol suspected
(n=50)
Above limit( (n=179)
I M M E R S I O N
15
* Includes boating during recreation and daily life † Includes drownings and immersion hypothermia deaths‡Personal flotation device (PFD) or lifejacket § Not fastened or inappropriate size
Source: The Canadian Red Cross Society & the Canadian Surveillance System for Water-Related Fatalities, 2010
Figure 10 RECREATIONAL BOATING* IMMERSION DEATHS† BY USE OF A FLOTATION DEVICE,‡
CANADA 1991-2006 (n=2,232)
27%
12%3%
17%
20%
21%
Unknown/irrelevant(n=375)
Not worn,unknown if present
(n=438)
Not present(n=606)
Present, not worn(n=475)
Worn properly(n=268)
Worn improperly§
(n=70)
* Includes boating during recreation and daily life † Includes drownings and immersion hypothermia deathsSource: The Canadian Red Cross Society & the Canadian Surveillance System for Water-Related Fatalities, 2010
Figure 9 TRENDS IN RECREATIONAL BOATING* IMMERSION DEATHS† BY TYPE OF BOAT,CANADA 1991-2006 (n=2,232)
0 20 3010 40 50 60 70 80 90 100
Percentage of deaths
57
Type of boat POWERBOAT UNPOWERED BOAT UNKNOWN
38 5
562 33
57 37 5
650 44
52 44 3
1991-2006(n=2,232)
1996-2000(n=718)
2001-2005(n=555)
2006(n=86)
1991-1995(n=873)
I M M E R S I O N
16
* Includes boating during recreation and daily life † Includes drownings and immersion hypothermia deaths‡Personal flotation device (PFD) or lifejacket § This figure excludes 120 cases where it was unknown if the boat was powered or unpowered¶ Not fastened or inappropriate size
Source: The Canadian Red Cross Society & the Canadian Surveillance System for Water-Related Fatalities, 2010
Figure 11 RECREATIONAL BOATING* IMMERSION DEATHS† BY TYPE OF BOATAND USE OF A FLOTATION DEVICE,‡ CANADA 1991-2006 (n=2,232)§
Powerboat(n=1,274)
23%
10%3%
18%
18%
27%
Unknown/irrelevant(n=223)
Not worn,unknown if present
(n=230)
Not present(n=299)
Present, not worn(n=350)
Worn properly(n=133)
Worn improperly¶
(n=39)
Unpowered boat(n=838)
34%16%
3%
13%
21%
13%
Unknown(n=108)
Not worn,unknown if present
(n=174)
Not present(n=288)
Present, not worn(n=111)
Worn properly(n=130)
Worn improperly¶
(n=27)
* Includes boating during recreation and daily life † Includes drownings and immersion hypothermia deaths‡Personal flotation device (PFD) or lifejacket § Not fastened or inappropriate size
Source: The Canadian Red Cross Society & the Canadian Surveillance System for Water-Related Fatalities, 2010
Figure 12 TRENDS IN RECREATIONAL BOATING* IMMERSION DEATHS†
BY USE OF A FLOTATION DEVICE,‡ CANADA 1991-2006 (n=2,232)
0 20 3010 40 50 60 70 80 90 100
Percentage of deaths
Flotation WORN PROPERLY WORN IMPROPERLY§
NOT WORN, PRESENCE UNKNOWN UNKNOWN
PRESENT, NOT WORN
NOT PRESENT
1912 4 28 2315
2211 3 29 1322
2314 3 22 1325
2614 2 35 716
2112 3 27 17201991-2006(n=2,232)
1996-2000(n=718)
2001-2005(n=555)
2006(n=86)
1991-1995(n=873)
I M M E R S I O N
17
ENVIRONMENTAL FACTORS
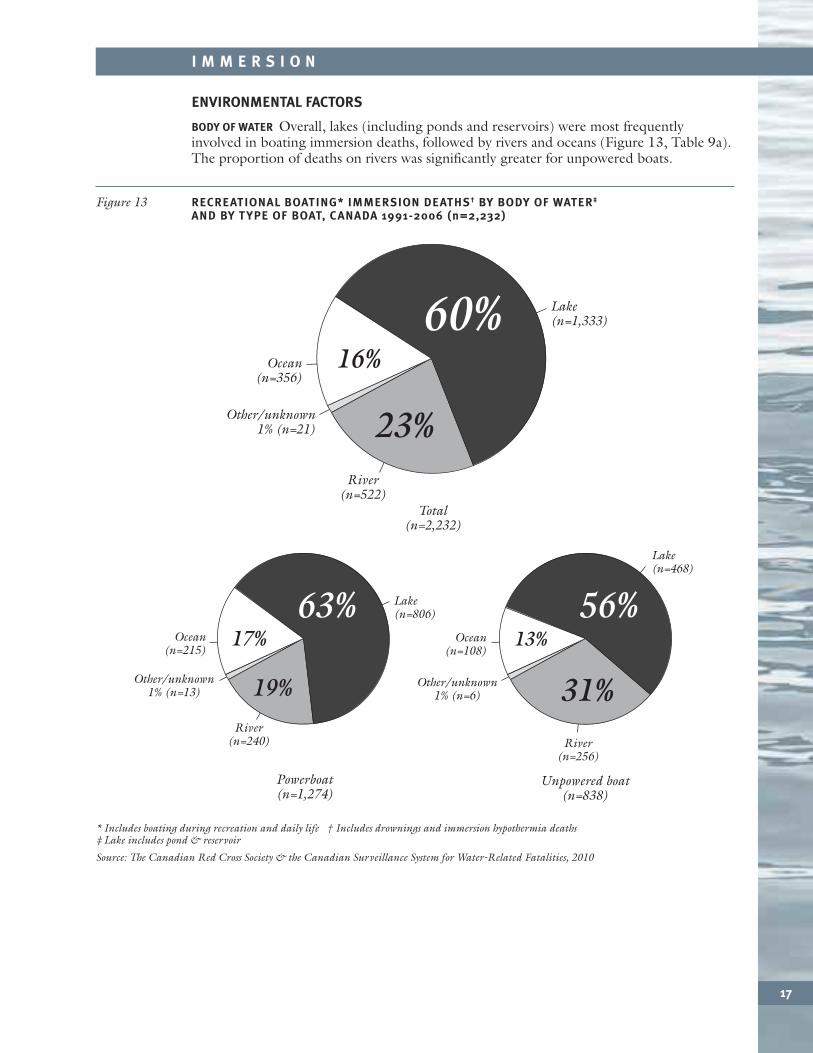
BODY OF WATER Overall, lakes (including ponds and reservoirs) were most frequentlyinvolved in boating immersion deaths, followed by rivers and oceans (Figure 13, Table 9a).The proportion of deaths on rivers was significantly greater for unpowered boats.
* Includes boating during recreation and daily life † Includes drownings and immersion hypothermia deaths‡Lake includes pond & reservoir
Source: The Canadian Red Cross Society & the Canadian Surveillance System for Water-Related Fatalities, 2010
Figure 13 RECREATIONAL BOATING* IMMERSION DEATHS† BY BODY OF WATER‡
AND BY TYPE OF BOAT, CANADA 1991-2006 (n=2,232)
60%
23%
16%Ocean(n=356)
River(n=522)
Other/unknown1% (n=21)
Lake(n=1,333)
63%
19%
17%
Powerboat(n=1,274)
Total(n=2,232)
Unpowered boat(n=838)
River(n=240)
Lake(n=806)
Ocean(n=215)
Other/unknown
1% (n=13)
56%
31%
13%
River(n=256)
Lake(n=468)
Ocean(n=108)
Other/unknown
1% (n=6)
I M M E R S I O N
18
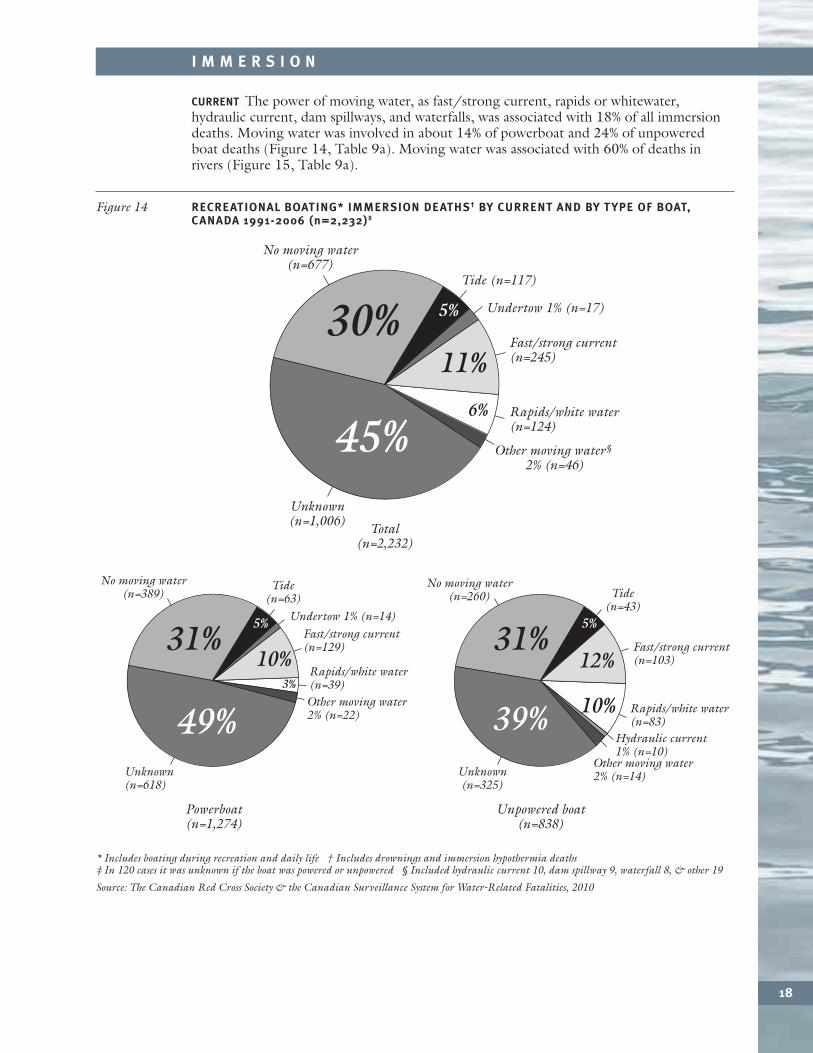
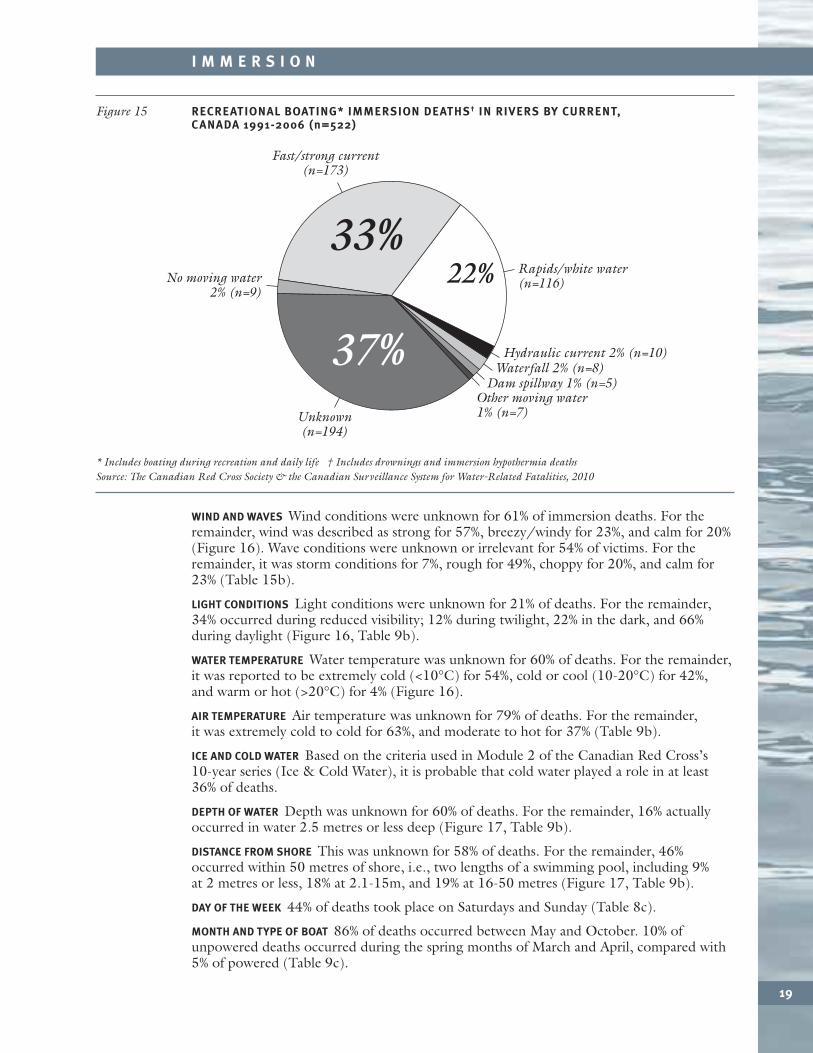
CURRENT The power of moving water, as fast/strong current, rapids or whitewater,hydraulic current, dam spillways, and waterfalls, was associated with 18% of all immersiondeaths. Moving water was involved in about 14% of powerboat and 24% of unpoweredboat deaths (Figure 14, Table 9a). Moving water was associated with 60% of deaths inrivers (Figure 15, Table 9a).
* Includes boating during recreation and daily life † Includes drownings and immersion hypothermia deaths‡ In 120 cases it was unknown if the boat was powered or unpowered § Included hydraulic current 10, dam spillway 9, waterfall 8, & other 19
Source: The Canadian Red Cross Society & the Canadian Surveillance System for Water-Related Fatalities, 2010
Figure 14 RECREATIONAL BOATING* IMMERSION DEATHS† BY CURRENT AND BY TYPE OF BOAT,CANADA 1991-2006 (n=2,232)‡
30%
45%
11%
5%
6%
Unknown(n=1,006)
Rapids/white water(n=124)
Undertow 1% (n=17)
Tide (n=117)
No moving water(n=677)
Other moving water§ 2% (n=46)
Fast/strong current(n=245)
31%
49%
10%
5%
3%
Unknown(n=618)
Rapids/white water(n=39)
Undertow 1% (n=14)
Tide(n=63)
No moving water(n=389)
Other moving water2% (n=22)
Fast/strong current(n=129) 31%
39%
12%
10%
5%
Unknown(n=325)
Rapids/white water(n=83)
Hydraulic current 1% (n=10)
Tide(n=43)
No moving water(n=260)
Other moving water 2% (n=14)
Fast/strong current(n=103)
Powerboat(n=1,274)
Total(n=2,232)
Unpowered boat(n=838)
I M M E R S I O N
19
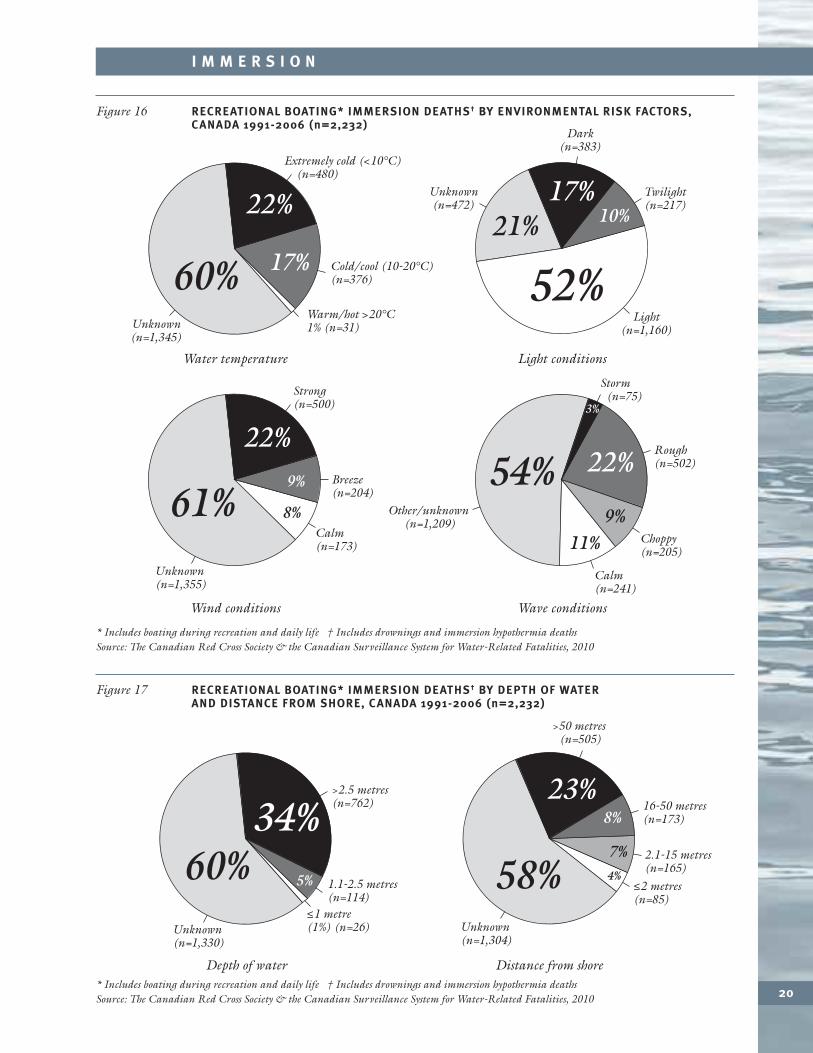
WIND AND WAVES Wind conditions were unknown for 61% of immersion deaths. For theremainder, wind was described as strong for 57%, breezy/windy for 23%, and calm for 20%(Figure 16). Wave conditions were unknown or irrelevant for 54% of victims. For theremainder, it was storm conditions for 7%, rough for 49%, choppy for 20%, and calm for23% (Table 15b).
LIGHT CONDITIONS Light conditions were unknown for 21% of deaths. For the remainder,34% occurred during reduced visibility; 12% during twilight, 22% in the dark, and 66%during daylight (Figure 16, Table 9b).
WATER TEMPERATURE Water temperature was unknown for 60% of deaths. For the remainder,it was reported to be extremely cold (<10°C) for 54%, cold or cool (10-20°C) for 42%, and warm or hot (>20°C) for 4% (Figure 16).
AIR TEMPERATURE Air temperature was unknown for 79% of deaths. For the remainder, it was extremely cold to cold for 63%, and moderate to hot for 37% (Table 9b).
ICE AND COLD WATER Based on the criteria used in Module 2 of the Canadian Red Cross’s10-year series (Ice & Cold Water), it is probable that cold water played a role in at least36% of deaths.
DEPTH OF WATER Depth was unknown for 60% of deaths. For the remainder, 16% actuallyoccurred in water 2.5 metres or less deep (Figure 17, Table 9b).
DISTANCE FROM SHORE This was unknown for 58% of deaths. For the remainder, 46%occurred within 50 metres of shore, i.e., two lengths of a swimming pool, including 9% at 2 metres or less, 18% at 2.1-15m, and 19% at 16-50 metres (Figure 17, Table 9b).
DAY OF THE WEEK 44% of deaths took place on Saturdays and Sunday (Table 8c).
MONTH AND TYPE OF BOAT 86% of deaths occurred between May and October. 10% ofunpowered deaths occurred during the spring months of March and April, compared with 5% of powered (Table 9c).
* Includes boating during recreation and daily life † Includes drownings and immersion hypothermia deathsSource: The Canadian Red Cross Society & the Canadian Surveillance System for Water-Related Fatalities, 2010
Figure 15 RECREATIONAL BOATING* IMMERSION DEATHS† IN RIVERS BY CURRENT, CANADA 1991-2006 (n=522)
33%
37%
22%
Unknown(n=194)
Rapids/white water(n=116)
Waterfall 2% (n=8)Hydraulic current 2% (n=10)
Dam spillway 1% (n=5)
No moving water2% (n=9)
Other moving water1% (n=7)
Fast/strong current(n=173)
I M M E R S I O N
20
* Includes boating during recreation and daily life † Includes drownings and immersion hypothermia deathsSource: The Canadian Red Cross Society & the Canadian Surveillance System for Water-Related Fatalities, 2010
Figure 16 RECREATIONAL BOATING* IMMERSION DEATHS† BY ENVIRONMENTAL RISK FACTORS,CANADA 1991-2006 (n=2,232)
60%
22%
17%
Unknown(n=1,345)
Warm/hot >20°C1% (n=31)
Cold/cool (10-20°C)(n=376)
Extremely cold (<10°C) (n=480)
52%21%
17%10%
Unknown(n=472)
Light(n=1,160)
Twilight(n=217)
Dark(n=383)
Strong (n=500)
Breeze (n=204)
Calm (n=173)
Calm (n=241)
Water temperature Light conditions
61%
22%9%
8%
Unknown (n=1,355)
54% 22%
9%11%
Other/unknown (n=1,209)
Rough (n=502)
Choppy (n=205)
Storm (n=75)
Wind conditions Wave conditions
3%
* Includes boating during recreation and daily life † Includes drownings and immersion hypothermia deathsSource: The Canadian Red Cross Society & the Canadian Surveillance System for Water-Related Fatalities, 2010
Figure 17 RECREATIONAL BOATING* IMMERSION DEATHS† BY DEPTH OF WATERAND DISTANCE FROM SHORE, CANADA 1991-2006 (n=2,232)
60%34%
5%
Unknown (n=1,330)
Unknown (n=1,304)
≤1 metre (1%) (n=26)
1.1-2.5 metres(n=114)
16-50 metres (n=173)
2.1-15 metres (n=165)
≤2 metres (n=85)
>2.5 metres (n=762)
>50 metres (n=505)
Depth of water Distance from shore
23%8%
7%4%58%
I M M E R S I O N
21
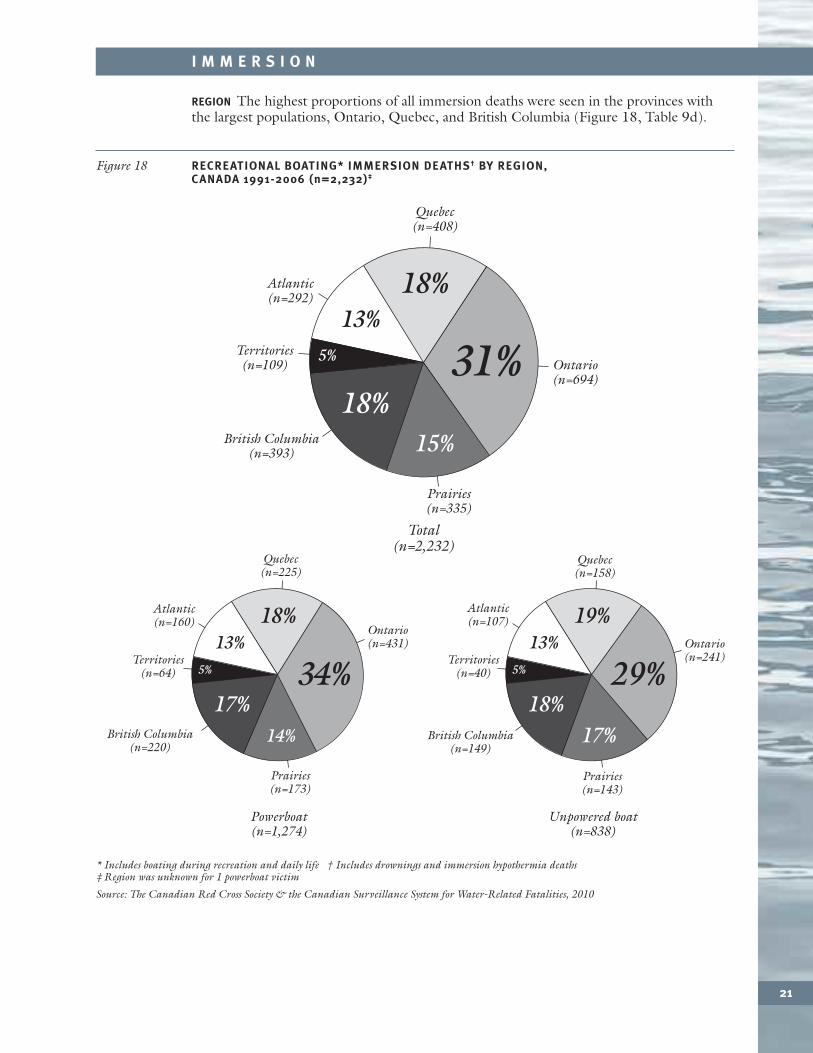
REGION The highest proportions of all immersion deaths were seen in the provinces withthe largest populations, Ontario, Quebec, and British Columbia (Figure 18, Table 9d).
* Includes boating during recreation and daily life † Includes drownings and immersion hypothermia deaths‡Region was unknown for 1 powerboat victim
Source: The Canadian Red Cross Society & the Canadian Surveillance System for Water-Related Fatalities, 2010
Figure 18 RECREATIONAL BOATING* IMMERSION DEATHS† BY REGION, CANADA 1991-2006 (n=2,232)‡
13%
15%
5%
18%
18%31%
Prairies(n=335)
British Columbia(n=393)
Atlantic(n=292)
Quebec(n=408)
Territories(n=109)
Ontario(n=694)
13%
14%
5%
18%
17%34%
Prairies(n=173)
British Columbia(n=220)
Atlantic(n=160)
Quebec(n=225)
Powerboat(n=1,274)
Total(n=2,232)
Territories(n=64)
Ontario(n=431) 13%
17%
5%
19%
18%29%
Prairies(n=143)
British Columbia(n=149)
Atlantic(n=107)
Quebec(n=158)
Unpowered boat(n=838)
Territories(n=40)
Ontario(n=241)
I M M E R S I O N
22
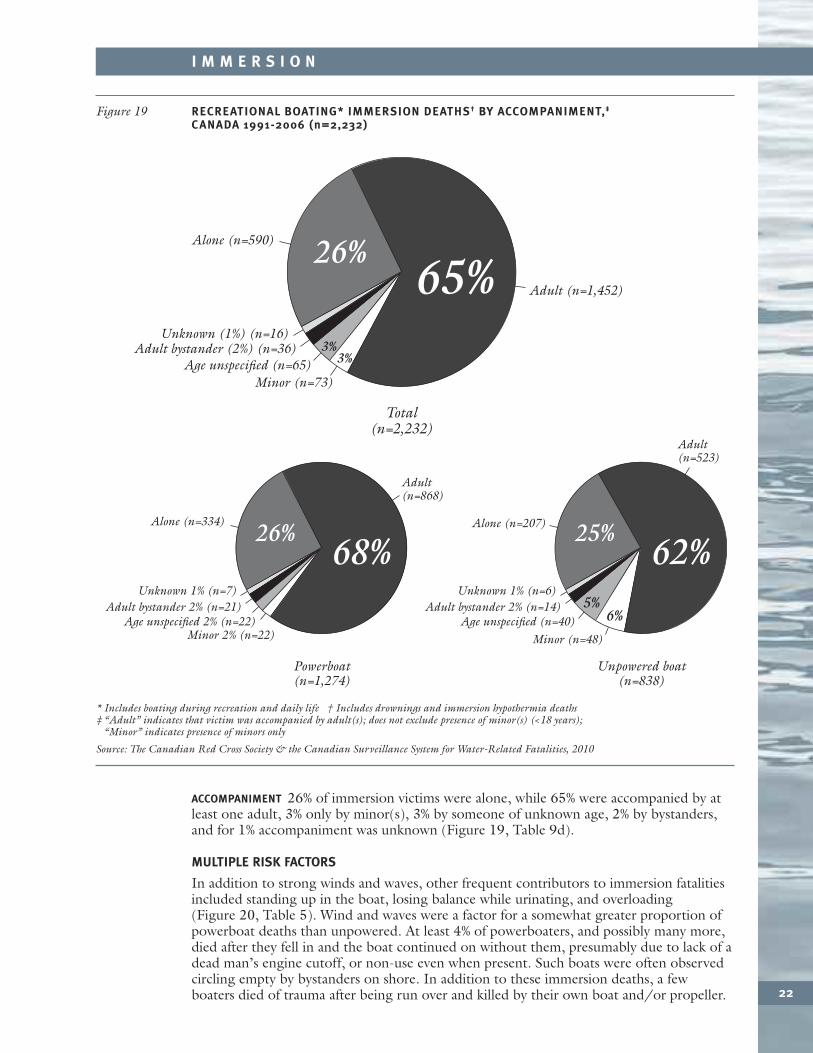
ACCOMPANIMENT 26% of immersion victims were alone, while 65% were accompanied by atleast one adult, 3% only by minor(s), 3% by someone of unknown age, 2% by bystanders,and for 1% accompaniment was unknown (Figure 19, Table 9d).
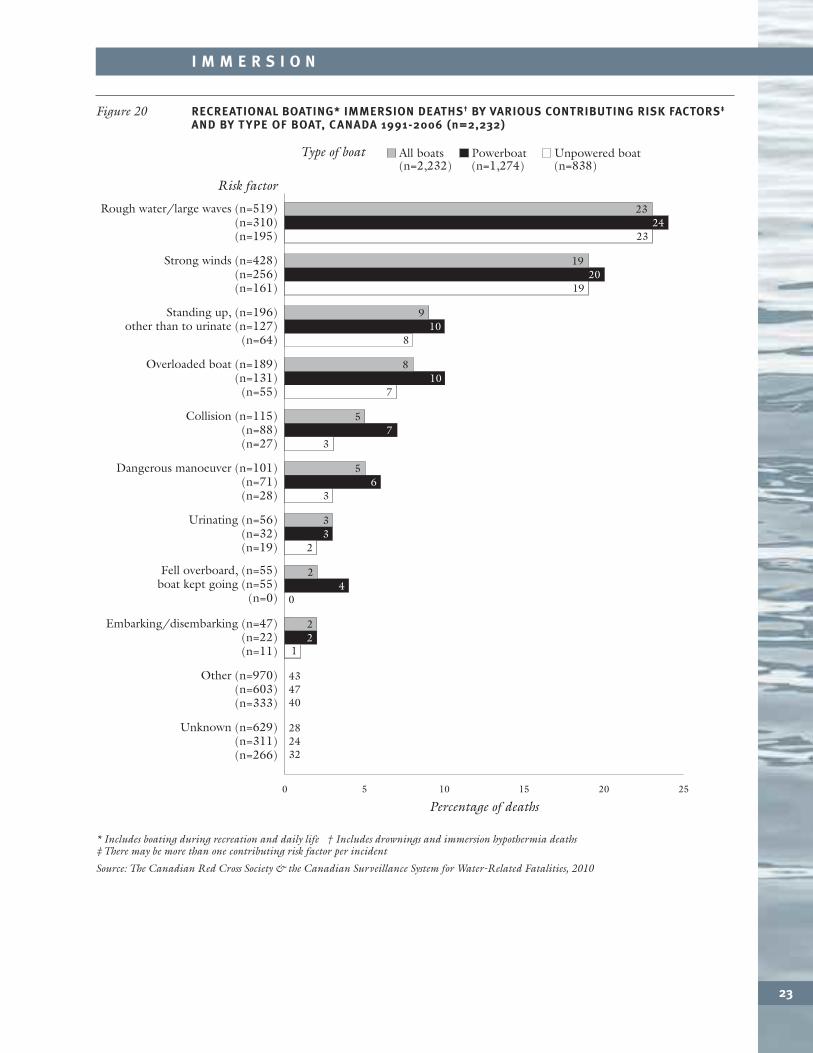
MULTIPLE RISK FACTORS
In addition to strong winds and waves, other frequent contributors to immersion fatalitiesincluded standing up in the boat, losing balance while urinating, and overloading(Figure 20, Table 5). Wind and waves were a factor for a somewhat greater proportion ofpowerboat deaths than unpowered. At least 4% of powerboaters, and possibly many more,died after they fell in and the boat continued on without them, presumably due to lack of adead man’s engine cutoff, or non-use even when present. Such boats were often observedcircling empty by bystanders on shore. In addition to these immersion deaths, a fewboaters died of trauma after being run over and killed by their own boat and/or propeller.
* Includes boating during recreation and daily life † Includes drownings and immersion hypothermia deaths‡ “Adult” indicates that victim was accompanied by adult(s); does not exclude presence of minor(s) (<18 years);“Minor” indicates presence of minors only
Source: The Canadian Red Cross Society & the Canadian Surveillance System for Water-Related Fatalities, 2010
Figure 19 RECREATIONAL BOATING* IMMERSION DEATHS† BY ACCOMPANIMENT,‡
CANADA 1991-2006 (n=2,232)
65%26%
3%3%
Age unspecified (n=65)Adult bystander (2%) (n=36)
Alone (n=590)
Adult (n=1,452)
Unknown (1%) (n=16)
Minor (n=73)
68%26%
Age unspecified 2% (n=22)Adult bystander 2% (n=21)
Alone (n=334)
Adult (n=868)
Unknown 1% (n=7)
Minor 2% (n=22)
Powerboat(n=1,274)
62%25%
Age unspecified (n=40)Adult bystander 2% (n=14)
Alone (n=207)
Adult(n=523)
Unknown 1% (n=6)
Minor (n=48)
Unpowered boat(n=838)
Total(n=2,232)
6%5%
I M M E R S I O N
23
* Includes boating during recreation and daily life † Includes drownings and immersion hypothermia deaths‡There may be more than one contributing risk factor per incident
Source: The Canadian Red Cross Society & the Canadian Surveillance System for Water-Related Fatalities, 2010
Figure 20 RECREATIONAL BOATING* IMMERSION DEATHS† BY VARIOUS CONTRIBUTING RISK FACTORS‡
AND BY TYPE OF BOAT, CANADA 1991-2006 (n=2,232)
Strong winds (n=428)(n=256)(n=161)
Standing up, (n=196)other than to urinate (n=127)
(n=64)
Overloaded boat (n=189)(n=131)(n=55)
Rough water/large waves (n=519)(n=310)(n=195)
Collision (n=115)(n=88)(n=27)
Urinating (n=56)(n=32)(n=19)
Dangerous manoeuver (n=101)(n=71)(n=28)
Risk factor
Type of boat Powerboat(n=1,274)
Unpowered boat (n=838)
All boats(n=2,232)
Other (n=970)(n=603)(n=333)
Unknown (n=629)(n=311)(n=266)
Embarking/disembarking (n=47)(n=22)(n=11)
Fell overboard, (n=55)boat kept going (n=55)
(n=0)
0 5 10 15 20 25
Percentage of deaths
23
2324
19
1920
9
810
8
710
5
36
5
37
3
23
2
04
2
12
434740
282432
T R A U M A
24
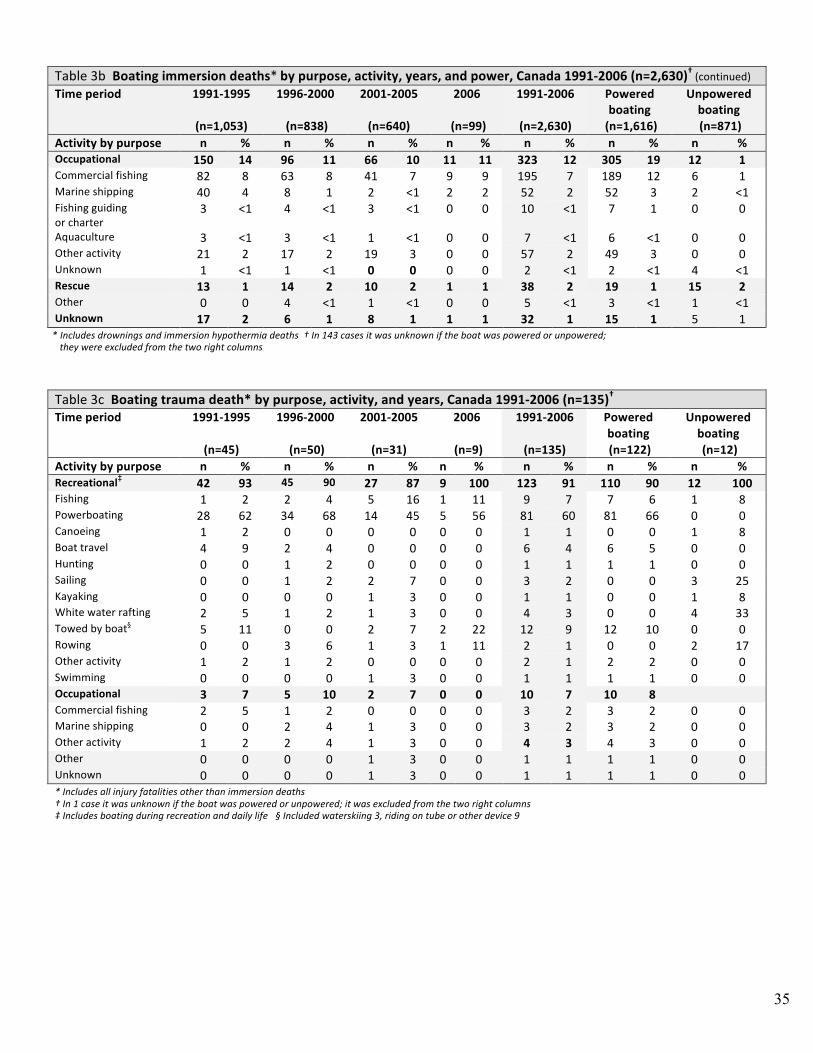
Trauma deaths, including all injury fatalities other than immersions, accounted for 5% of boating fatalities (135/2,765) during 1991-2006.
PURPOSE 123 trauma deaths (91%) were recreational, 10 (7%) were occupational, and for 2 (1%) the purpose was other/unknown. Only recreational incidents are discussed here.
TYPE OF BOAT 89% of recreational trauma deaths involved powerboats and 10% unpowered;for the remaining 1% it was unknown whether the boat was powered or not (Table 3c).
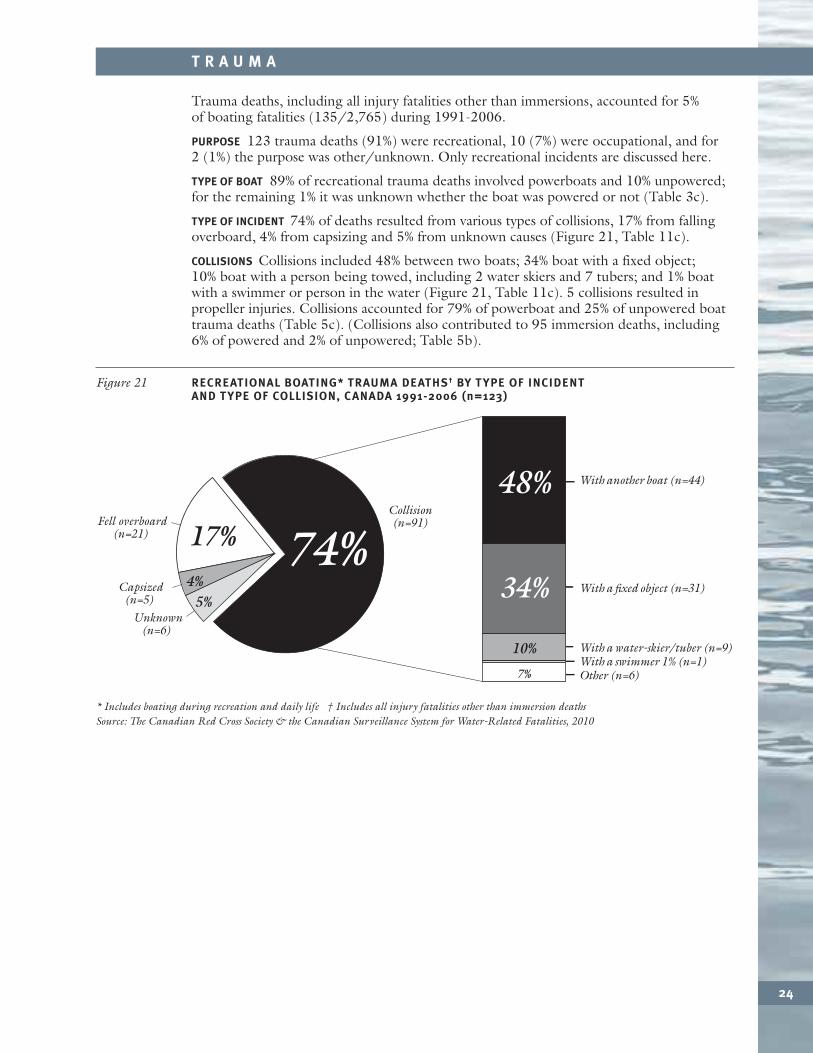
TYPE OF INCIDENT 74% of deaths resulted from various types of collisions, 17% from fallingoverboard, 4% from capsizing and 5% from unknown causes (Figure 21, Table 11c).
COLLISIONS Collisions included 48% between two boats; 34% boat with a fixed object; 10% boat with a person being towed, including 2 water skiers and 7 tubers; and 1% boatwith a swimmer or person in the water (Figure 21, Table 11c). 5 collisions resulted inpropeller injuries. Collisions accounted for 79% of powerboat and 25% of unpowered boattrauma deaths (Table 5c). (Collisions also contributed to 95 immersion deaths, including6% of powered and 2% of unpowered; Table 5b).
* Includes boating during recreation and daily life † Includes all injury fatalities other than immersion deathsSource: The Canadian Red Cross Society & the Canadian Surveillance System for Water-Related Fatalities, 2010
Figure 21 RECREATIONAL BOATING* TRAUMA DEATHS† BY TYPE OF INCIDENTAND TYPE OF COLLISION, CANADA 1991-2006 (n=123)
With another boat (n=44)
With a fixed object (n=31)
With a water-skier/tuber (n=9) With a swimmer 1% (n=1) Other (n=6)
17%4%
5%
74%48%
10%
7%
Unknown(n=6)
Capsized(n=5)
Fell overboard(n=21)
Collision(n=91)
34%
T R A U M A
25
TYPE OF INJURY Traumatic incidents frequently resulted in head injury, which contributed to at least 44% of boating trauma deaths, 44% of powered and 50% of unpowered. Other injuries included spinal injury in 9%, fractures in 15%, and major lacerations in 24%(Table 10c). Victims often sustained multiple injuries.
PERSONAL FACTORS
AGE AND SEX Children less than 15 years old were disproportionally involved in trauma ascompared with immersions, accounting for 13% of trauma deaths, compared with 3% ofimmersion deaths (Tables 16a, 7a). The same applied to females, who represented 25% of trauma deaths compared with only 7% of immersion deaths. Children and females werealso overrepresented among personal watercraft (PWC) trauma deaths (Table 16a).
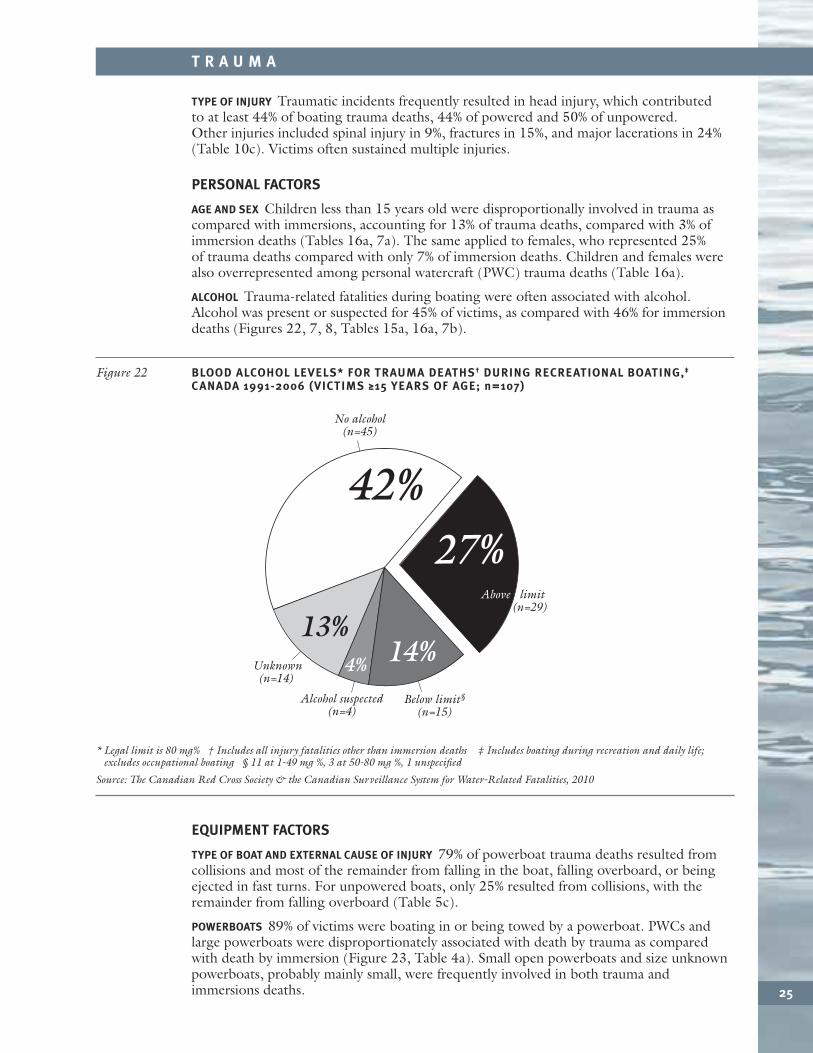
ALCOHOL Trauma-related fatalities during boating were often associated with alcohol. Alcohol was present or suspected for 45% of victims, as compared with 46% for immersiondeaths (Figures 22, 7, 8, Tables 15a, 16a, 7b).
* Legal limit is 80 mg% † Includes all injury fatalities other than immersion deaths ‡ Includes boating during recreation and daily life;excludes occupational boating § 11 at 1-49 mg %, 3 at 50-80 mg %, 1 unspecified
Source: The Canadian Red Cross Society & the Canadian Surveillance System for Water-Related Fatalities, 2010
Figure 22 BLOOD ALCOHOL LEVELS* FOR TRAUMA DEATHS† DURING RECREATIONAL BOATING,‡
CANADA 1991-2006 (VICTIMS ≥15 YEARS OF AGE; n=107)
42%
4% 14%13%
27%Above limit (n=29)
Unknown(n=14)
Alcohol suspected(n=4)
Below limit§
(n=15)
No alcohol(n=45)
EQUIPMENT FACTORS
TYPE OF BOAT AND EXTERNAL CAUSE OF INJURY 79% of powerboat trauma deaths resulted fromcollisions and most of the remainder from falling in the boat, falling overboard, or beingejected in fast turns. For unpowered boats, only 25% resulted from collisions, with theremainder from falling overboard (Table 5c).
POWERBOATS 89% of victims were boating in or being towed by a powerboat. PWCs andlarge powerboats were disproportionately associated with death by trauma as comparedwith death by immersion (Figure 23, Table 4a). Small open powerboats and size unknownpowerboats, probably mainly small, were frequently involved in both trauma andimmersions deaths.

T R A U M A
26
PERSONAL WATERCRAFT While PWCs accounted for only 2% of powerboat immersion deaths,they were involved in 29% of powerboat trauma fatalities, including 3% of cases where theperson was being towed by a PWC (Figure 23, Table 4b). Furthermore, PWCs contributedto some of the unpowered trauma deaths: in one case, a canoeist was fatally injured afterbeing struck by a PWC.
POWERBOAT TRAUMA & SWIMMERS Powerboats including PWCs also pose a risk of blunttrauma or massive propeller chop lacerations to people already in the water, such asswimmers, boaters who have fallen in, and others involved in aquatic activities such asdiving and wading. There were at least 7 such victims.
SAFETY HELMET While safety helmets are used by many river kayakers, they are rarely seen on powerboaters, even in high speed jetboats and PWCs. Data are not available forwhether any of the PWC or other high speed powerboat victims were wearing a safetyhelmet.
OTHER EQUIPMENT FACTORS Absent or inappropriate lighting is another risk factor forcollisions. A number of collisions did involve boats travelling without lights; however,coroner and police data are incomplete for this variable so it cannot be quantified. Anotherissue is the lack of steerability and control of a PWC when the throttle and power jet arecut without any rudder to steer the vessel; the frequency of this factor in fatal collisions isunknown. Finally, few high speed powerboats have safety restraints, air bags, dash padding,or collapsible bows to absorb kinetic energy and prevent death in the event of a high-speedcrash.
* Includes boating during recreation and daily life † Includes all injury fatalities other than immersion deathsSource: The Canadian Red Cross Society & the Canadian Surveillance System for Water-Related Fatalities, 2010
Figure 23 RECREATIONAL BOATING* TRAUMA DEATHS† BY TYPE OF BOAT,CANADA 1991-2006 (n=123)
Powerboat(n=110)
Unpowered boat (n=12)
Large powerboat (>5.5m) (n=17)
Powerboat,size unspecified (n=18)
Personal watercraft (n=29)
Towed by powerboat (n=9)Towed by personal watercraft (n=3)Unknown 1% (n=1)
Small powerboat (≤5.5m)(n=33)
10% 89%
30%
15%
26%
16%
8%3%
Unknown1% (n=1)
T R A U M A
27
ENVIRONMENTAL FACTORS
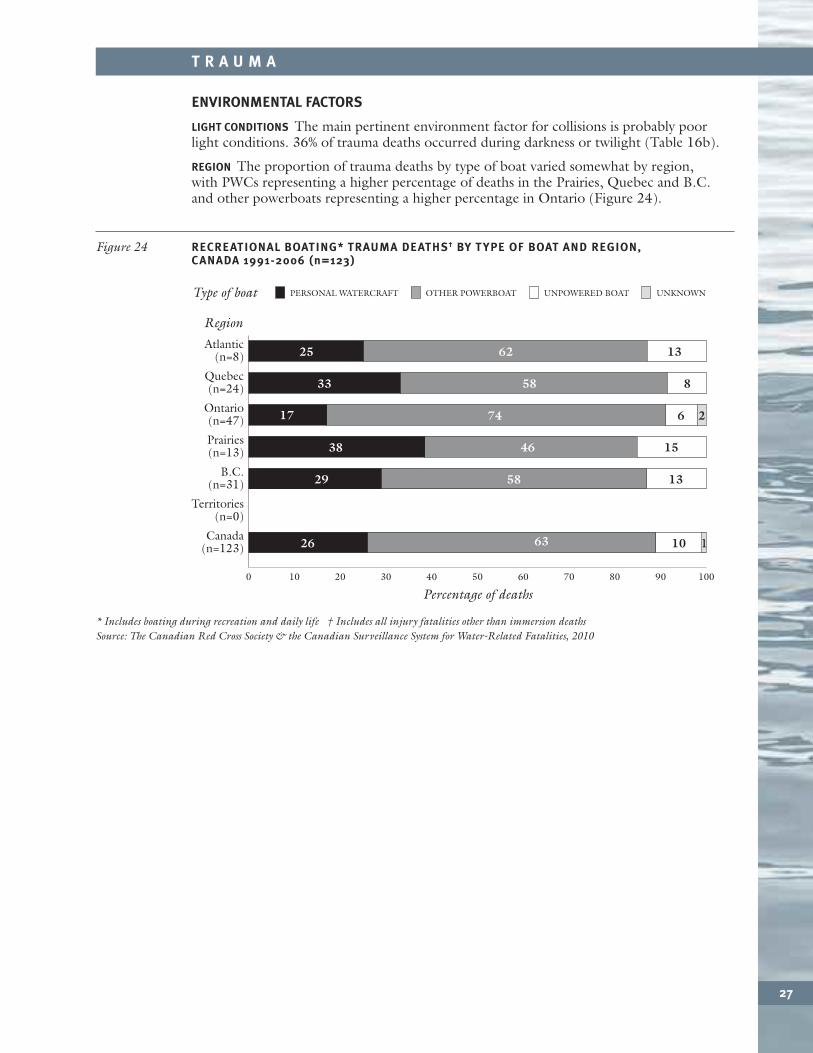
LIGHT CONDITIONS The main pertinent environment factor for collisions is probably poorlight conditions. 36% of trauma deaths occurred during darkness or twilight (Table 16b).
REGION The proportion of trauma deaths by type of boat varied somewhat by region, with PWCs representing a higher percentage of deaths in the Prairies, Quebec and B.C. and other powerboats representing a higher percentage in Ontario (Figure 24).
* Includes boating during recreation and daily life † Includes all injury fatalities other than immersion deathsSource: The Canadian Red Cross Society & the Canadian Surveillance System for Water-Related Fatalities, 2010
Figure 24 RECREATIONAL BOATING* TRAUMA DEATHS† BY TYPE OF BOAT AND REGION,CANADA 1991-2006 (n=123)
0
Region
20 3010 40 50 60 70 80 90 100
Percentage of deaths
Atlantic(n=8)
Quebec(n=24)
Ontario(n=47)
Prairies(n=13)
B.C.(n=31)
Territories(n=0)
Canada(n=123)
1325
5833
74 6 2
46 15
17
135829
10 16326
38
Type of boat PERSONAL WATERCRAFT OTHER POWERBOAT UNPOWERED BOAT UNKNOWN
62
8
P E R S O N A L W A T E R C R A F T
28
There were 64 fatalities involving personal watercraft (PWC, jet ski) during 1991-2006,including 31 immersions and 33 trauma deaths (Table 4a) from head injury, multipleinjuries, major lacerations (e.g. from propeller injury when a PWC operator fell in near alarger powerboat), and spinal injury.
PURPOSE 95% died during recreational activities, 2% during occupational activities and 3% during other/unknown activities. Only recreational fatalities will be discussed here.
IMMERSIONS AND TRAUMA
There were 61 recreational fatalities involving PWC, including 29 immersion deaths and32 trauma deaths (including 3 cases where the person was being towed by a PWC). PWCsaccounted for 1% of all immersion deaths, 2% of powerboat immersion deaths, 26% of alltrauma deaths and 29% of powerboat trauma deaths.
Given the small number of immersion fatalities and the large proportion of trauma victims,this section will combine discussion of immersion and trauma deaths.
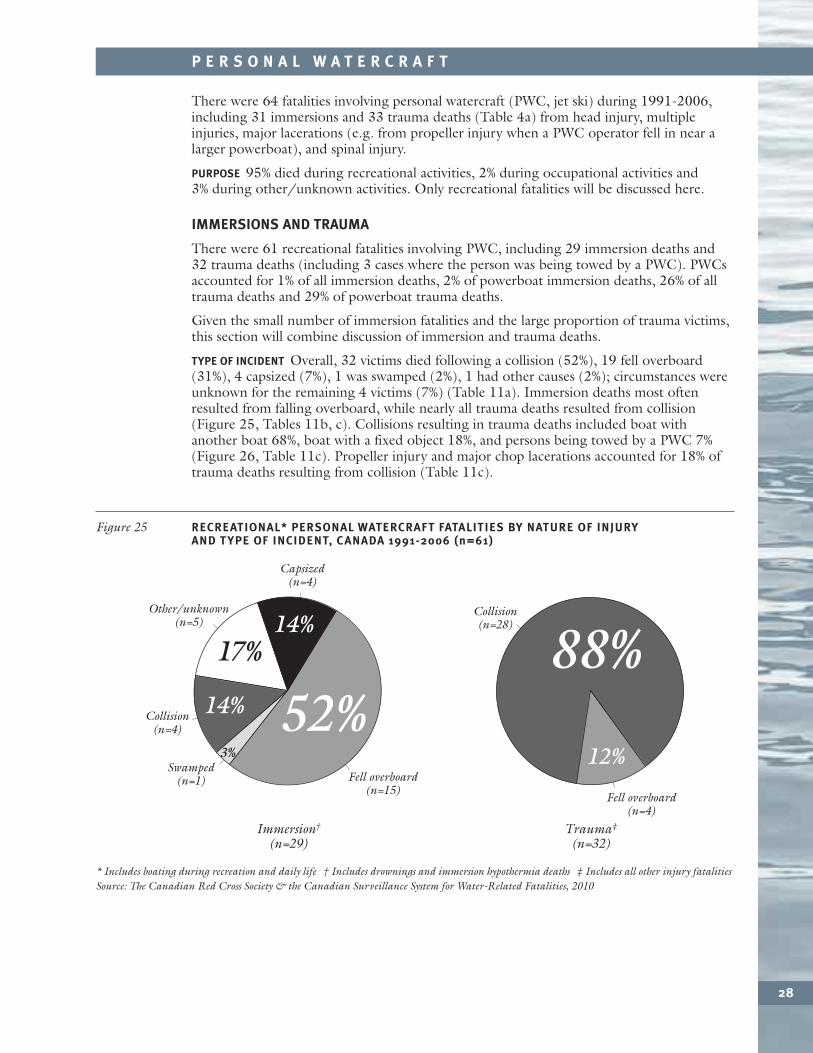
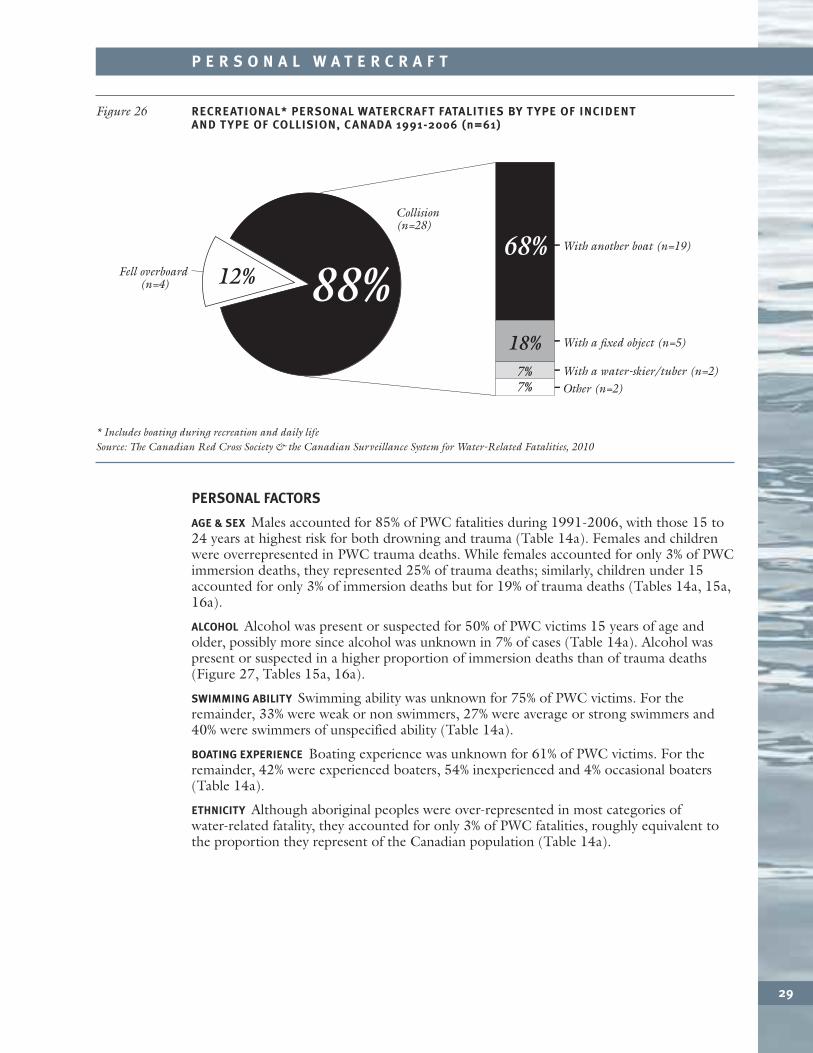
TYPE OF INCIDENT Overall, 32 victims died following a collision (52%), 19 fell overboard(31%), 4 capsized (7%), 1 was swamped (2%), 1 had other causes (2%); circumstances wereunknown for the remaining 4 victims (7%) (Table 11a). Immersion deaths most oftenresulted from falling overboard, while nearly all trauma deaths resulted from collision(Figure 25, Tables 11b, c). Collisions resulting in trauma deaths included boat withanother boat 68%, boat with a fixed object 18%, and persons being towed by a PWC 7%(Figure 26, Table 11c). Propeller injury and major chop lacerations accounted for 18% oftrauma deaths resulting from collision (Table 11c).
* Includes boating during recreation and daily life † Includes drownings and immersion hypothermia deaths ‡ Includes all other injury fatalities Source: The Canadian Red Cross Society & the Canadian Surveillance System for Water-Related Fatalities, 2010
Figure 25 RECREATIONAL* PERSONAL WATERCRAFT FATALITIES BY NATURE OF INJURY AND TYPE OF INCIDENT, CANADA 1991-2006 (n=61)
Fell overboard(n=15)
Capsized(n=4)
Swamped(n=1)
Immersion†
(n=29)
Other/unknown(n=5)
Collision(n=4)
14%
52%14%
17%
3%
Fell overboard(n=4)
Trauma‡
(n=32)
Collision(n=28)
12%
88%
P E R S O N A L W A T E R C R A F T
29
PERSONAL FACTORS
AGE & SEX Males accounted for 85% of PWC fatalities during 1991-2006, with those 15 to24 years at highest risk for both drowning and trauma (Table 14a). Females and childrenwere overrepresented in PWC trauma deaths. While females accounted for only 3% of PWCimmersion deaths, they represented 25% of trauma deaths; similarly, children under 15accounted for only 3% of immersion deaths but for 19% of trauma deaths (Tables 14a, 15a,16a).
ALCOHOL Alcohol was present or suspected for 50% of PWC victims 15 years of age andolder, possibly more since alcohol was unknown in 7% of cases (Table 14a). Alcohol was present or suspected in a higher proportion of immersion deaths than of trauma deaths(Figure 27, Tables 15a, 16a).
SWIMMING ABILITY Swimming ability was unknown for 75% of PWC victims. For theremainder, 33% were weak or non swimmers, 27% were average or strong swimmers and40% were swimmers of unspecified ability (Table 14a).
BOATING EXPERIENCE Boating experience was unknown for 61% of PWC victims. For theremainder, 42% were experienced boaters, 54% inexperienced and 4% occasional boaters(Table 14a).
ETHNICITY Although aboriginal peoples were over-represented in most categories ofwater-related fatality, they accounted for only 3% of PWC fatalities, roughly equivalent tothe proportion they represent of the Canadian population (Table 14a).
* Includes boating during recreation and daily lifeSource: The Canadian Red Cross Society & the Canadian Surveillance System for Water-Related Fatalities, 2010
Figure 26 RECREATIONAL* PERSONAL WATERCRAFT FATALITIES BY TYPE OF INCIDENTAND TYPE OF COLLISION, CANADA 1991-2006 (n=61)
Fell overboard (n=4)
With a fixed object (n=5)
With a water-skier/tuber (n=2)Other (n=2)
Collision(n=28)
With another boat (n=19)68%
18%7%7%
12% 88%
P E R S O N A L W A T E R C R A F T
30
EQUIPMENT FACTORS
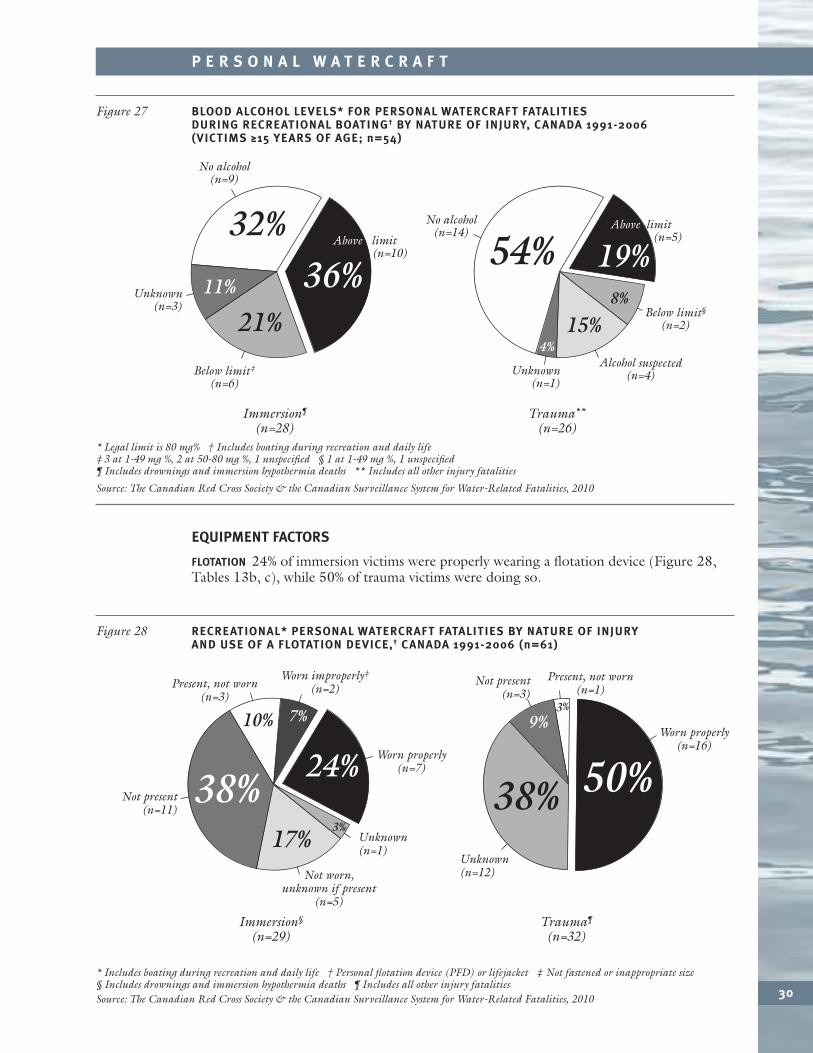
FLOTATION 24% of immersion victims were properly wearing a flotation device (Figure 28,Tables 13b, c), while 50% of trauma victims were doing so.
* Includes boating during recreation and daily life † Personal flotation device (PFD) or lifejacket ‡ Not fastened or inappropriate size§ Includes drownings and immersion hypothermia deaths ¶ Includes all other injury fatalities Source: The Canadian Red Cross Society & the Canadian Surveillance System for Water-Related Fatalities, 2010
Figure 28 RECREATIONAL* PERSONAL WATERCRAFT FATALITIES BY NATURE OF INJURY AND USE OF A FLOTATION DEVICE,† CANADA 1991-2006 (n=61)
Immersion§
(n=29)
38%24%
7%
3%17%
10%
Unknown(n=1)
Not worn,unknown if present
(n=5)
Not present(n=11)
Present, not worn(n=3)
Worn properly(n=7)
Worn improperly‡
(n=2)
Trauma¶
(n=32)
9%
50%38%
3%
Unknown(n=12)
Not present(n=3)
Present, not worn(n=1)
Worn properly(n=16)
* Legal limit is 80 mg% † Includes boating during recreation and daily life ‡ 3 at 1-49 mg %, 2 at 50-80 mg %, 1 unspecified § 1 at 1-49 mg %, 1 unspecified¶ Includes drownings and immersion hypothermia deaths ** Includes all other injury fatalities
Source: The Canadian Red Cross Society & the Canadian Surveillance System for Water-Related Fatalities, 2010
Figure 27 BLOOD ALCOHOL LEVELS* FOR PERSONAL WATERCRAFT FATALITIESDURING RECREATIONAL BOATING† BY NATURE OF INJURY, CANADA 1991-2006(VICTIMS ≥15 YEARS OF AGE; n=54)
Immersion¶
(n=28)
Below limit‡
(n=6)
Unknown(n=3)
32%
11%
21%
36%
Trauma**
(n=26)
54%8%
4%15%
19%
No alcohol(n=9)
No alcohol(n=14)
Above limit( (n=10)
Below limit§
(n=2)
Unknown(n=1)
Alcohol suspected(n=4)
Above limit( (n=5)
P E R S O N A L W A T E R C R A F T
31
ENVIRONMENTAL FACTORS
BODY OF WATER 69% of fatalities occurred in lakes, 18% in rivers, 10% in the ocean, 2% in canals/other locations, and 2% were in an unknown location (Table 14b).
WIND AND WAVES Wind conditions were unknown for 80% of fatalities (Table 15b, 16b). For the remainder, wind was described as strong for 8%, breezy for 58% and calm for 33%.Wave conditions were unknown or other for 75% of victims (Table 15b, 16b). For theremainder, it was calm for 40%, choppy for 40% and rough for 20%; no storm weather wasreported.
The next 3 factors were not considered for trauma victims, as water and air temperatures were not significant factors for traumatic incidents.
WATER TEMPERATURE Water temperature was unknown for 69% of PWC immersion fatalities.For the remainder, it was reported to be extremely cold (<10°C) for 44%, cold or cool(10-20°C) for 33%, and warm or hot (>20°C) for 22% (Table 15b).
AIR TEMPERATURE Air temperature was unknown for 76% of PWC immersion deaths. For the remainder, it was cold for 29%, moderate for 29%, warm for 29% and hot for 14%;no extremely cold air temperatures were reported (Table 15b).
ICE AND COLD WATER Based on the criteria used in Module 2 of the 1991-2000 series (Ice &Cold Water), it is probable that cold water was a factor in 17% of PWC immersion deaths.
LIGHT CONDITIONS Light conditions were unknown for 10% of PWC immersion victims. For the remainder 73% of deaths occurred during daylight, 15% at twilight and 12% indarkness (Table 15b). As for PWC trauma deaths, light conditions were unknown for 6%.For the remainder 83% of deaths occurred during daylight, 10% at twilight and 7% indarkness (Table 16b).
MONTH AND DAY All fatalities occurred between April and October, 89% between May and August. 70% of deaths took place between Friday and Sunday (Table 14b).
REGION The highest proportion of immersion fatalities was seen in Quebec and the Prairieprovinces, followed by Ontario. The highest proportion of trauma fatalities was seen inBritish Columbia. There were no PWC deaths identified in the northern territories during1991-2006, but there were 5 immersion deaths in the northern territories where the typeof boat was unknown (Tables 15b, 16b).
ACCOMPANIMENT 17% of immersion victims were alone, while 66% were accompanied by atleast one adult, 7% only by minor(s) and 10% by someone of unknown age. 6% of traumavictims were alone, while 72% were accompanied by at least one adult, 9% only by minor(s)and 13% by someone of unknown age (Tables 15b, 16b). For children less than 15 yearsold who died from trauma or immersion, none was alone, 71% were accompanied by atleast one adult, 14% only by minor(s), and 14% by someone of unknown age.
32
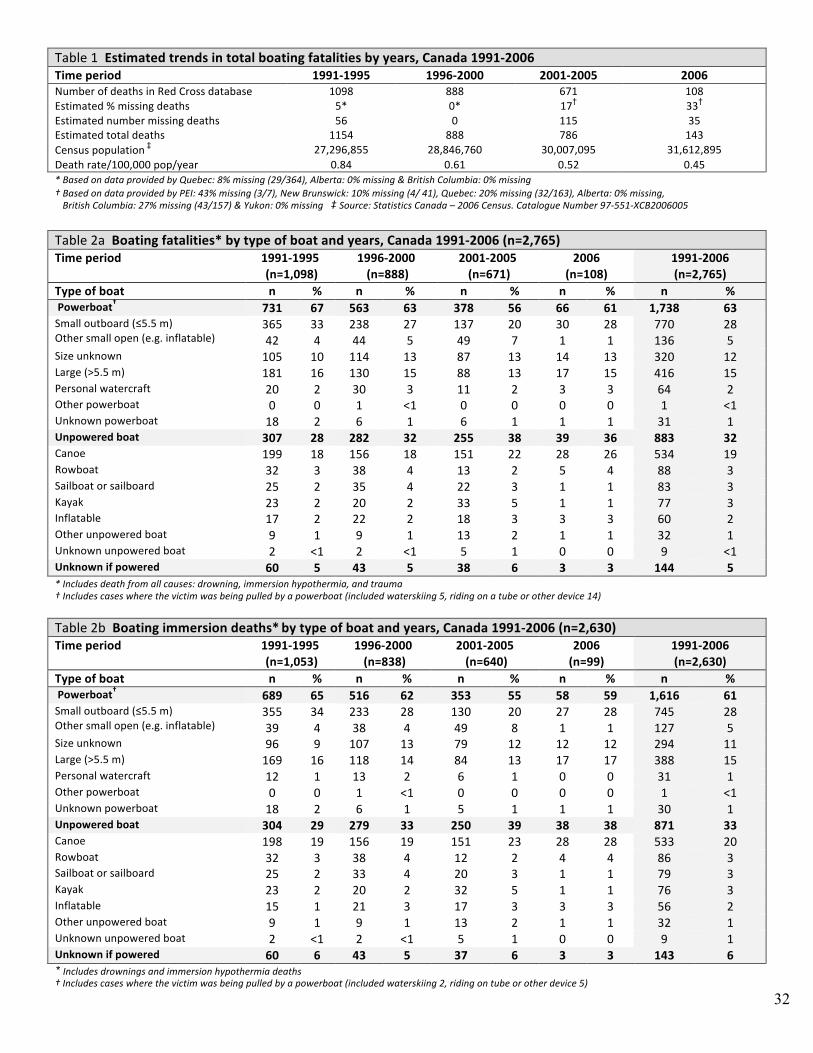
Table 1 Estimated trends in total boating fatalities by years, Canada 1991‐2006 Time period 1991‐1995 1996‐2000 2001‐2005 2006 Number of deaths in Red Cross database 1098 888 671 108 Estimated % missing deaths 5* 0* 17† 33† Estimated number missing deaths 56 0 115 35 Estimated total deaths 1154 888 786 143 Census population ‡ 27,296,855 28,846,760 30,007,095 31,612,895 Death rate/100,000 pop/year 0.84 0.61 0.52 0.45 * Based on data provided by Quebec: 8% missing (29/364), Alberta: 0% missing & British Columbia: 0% missing † Based on data provided by PEI: 43% missing (3/7), New Brunswick: 10% missing (4/ 41), Quebec: 20% missing (32/163), Alberta: 0% missing, British Columbia: 27% missing (43/157) & Yukon: 0% missing ‡ Source: Statistics Canada – 2006 Census. Catalogue Number 97‐551‐XCB2006005
Table 2a Boating fatalities* by type of boat and years, Canada 1991‐2006 (n=2,765) Time period
1991‐1995 (n=1,098)
1996‐2000 (n=888)
2001‐2005 (n=671)
2006 (n=108)
1991‐2006 (n=2,765)
Type of boat n % n % n % n % n % Powerboat† 731 67 563 63 378 56 66 61 1,738 63 Small outboard (≤5.5 m) Other small open (e.g. inflatable)
365 42
33 4
238 44
27 5
137 49
20 7
30 1
28 1
770 136
28 5
Size unknown 105 10 114 13 87 13 14 13 320 12 Large (>5.5 m) 181 16 130 15 88 13 17 15 416 15 Personal watercraft 20 2 30 3 11 2 3 3 64 2 Other powerboat 0 0 1 <1 0 0 0 0 1 <1 Unknown powerboat 18 2 6 1 6 1 1 1 31 1 Unpowered boat 307 28 282 32 255 38 39 36 883 32 Canoe 199 18 156 18 151 22 28 26 534 19 Rowboat 32 3 38 4 13 2 5 4 88 3 Sailboat or sailboard 25 2 35 4 22 3 1 1 83 3 Kayak 23 2 20 2 33 5 1 1 77 3 Inflatable 17 2 22 2 18 3 3 3 60 2 Other unpowered boat 9 1 9 1 13 2 1 1 32 1 Unknown unpowered boat 2 <1 2 <1 5 1 0 0 9 <1 Unknown if powered 60 5 43 5 38 6 3 3 144 5 * Includes death from all causes: drowning, immersion hypothermia, and trauma † Includes cases where the victim was being pulled by a powerboat (included waterskiing 5, riding on a tube or other device 14) Table 2b Boating immersion deaths* by type of boat and years, Canada 1991‐2006 (n=2,630) Time period
1991‐1995 (n=1,053)
1996‐2000 (n=838)
2001‐2005 (n=640)
2006 (n=99)
1991‐2006 (n=2,630)
Type of boat n % n % n % n % n % Powerboat† 689 65 516 62 353 55 58 59 1,616 61 Small outboard (≤5.5 m) Other small open (e.g. inflatable)
355 39
34 4
233 38
28 4
130 49
20 8
27 1
28 1
745 127
28 5
Size unknown 96 9 107 13 79 12 12 12 294 11 Large (>5.5 m) 169 16 118 14 84 13 17 17 388 15 Personal watercraft 12 1 13 2 6 1 0 0 31 1 Other powerboat 0 0 1 <1 0 0 0 0 1 <1 Unknown powerboat 18 2 6 1 5 1 1 1 30 1 Unpowered boat 304 29 279 33 250 39 38 38 871 33 Canoe 198 19 156 19 151 23 28 28 533 20 Rowboat 32 3 38 4 12 2 4 4 86 3 Sailboat or sailboard 25 2 33 4 20 3 1 1 79 3 Kayak 23 2 20 2 32 5 1 1 76 3 Inflatable 15 1 21 3 17 3 3 3 56 2 Other unpowered boat 9 1 9 1 13 2 1 1 32 1 Unknown unpowered boat 2 <1 2 <1 5 1 0 0 9 1 Unknown if powered 60 6 43 5 37 6 3 3 143 6 * Includes drownings and immersion hypothermia deaths † Includes cases where the victim was being pulled by a powerboat (included waterskiing 2, riding on tube or other device 5)
33
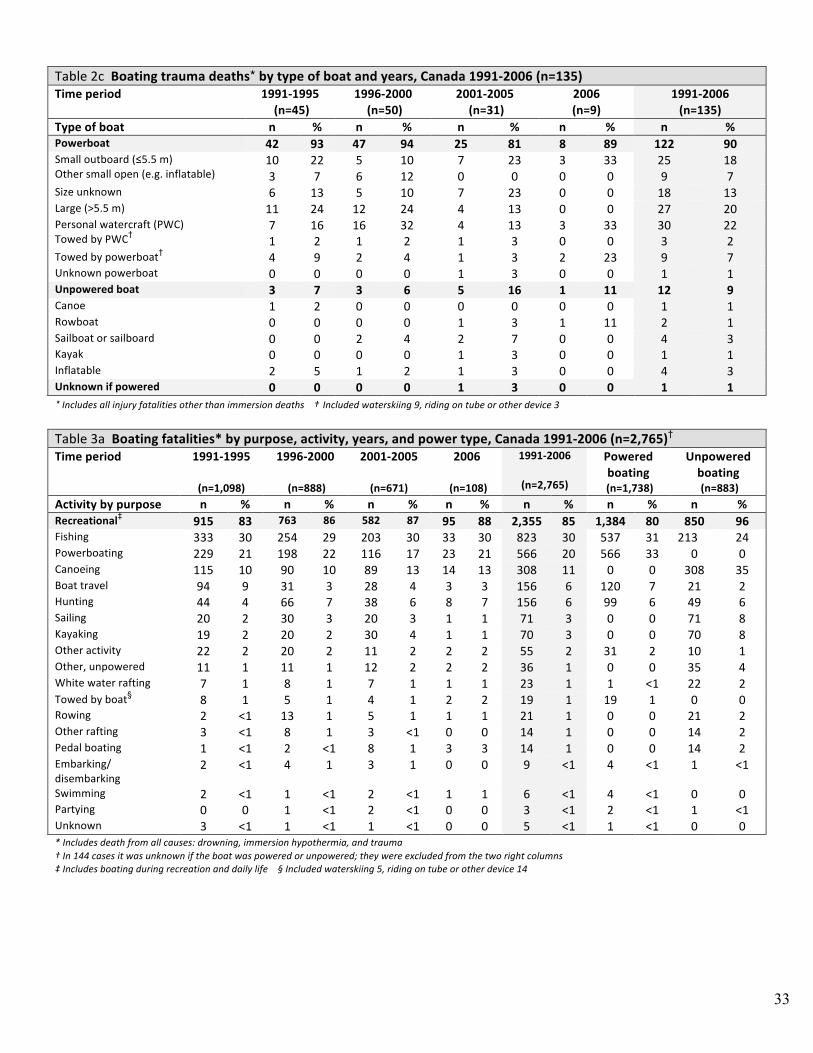
Table 2c Boating trauma deaths* by type of boat and years, Canada 1991‐2006 (n=135) Time period
1991‐1995 (n=45)
1996‐2000 (n=50)
2001‐2005 (n=31)
2006 (n=9)
1991‐2006 (n=135)
Type of boat n % n % n % n % n % Powerboat 42 93 47 94 25 81 8 89 122 90 Small outboard (≤5.5 m) Other small open (e.g. inflatable)
10 3
22 7
5 6
10 12
7 0
23 0
3 0
33 0
25 9
18 7
Size unknown 6 13 5 10 7 23 0 0 18 13 Large (>5.5 m) 11 24 12 24 4 13 0 0 27 20 Personal watercraft (PWC) Towed by PWC†
7 1
16 2
16 1
32 2
4 1
13 3
3 0
33 0
30 3
22 2
Towed by powerboat† 4 9 2 4 1 3 2 23 9 7 Unknown powerboat 0 0 0 0 1 3 0 0 1 1 Unpowered boat 3 7 3 6 5 16 1 11 12 9 Canoe 1 2 0 0 0 0 0 0 1 1 Rowboat 0 0 0 0 1 3 1 11 2 1 Sailboat or sailboard 0 0 2 4 2 7 0 0 4 3 Kayak 0 0 0 0 1 3 0 0 1 1 Inflatable 2 5 1 2 1 3 0 0 4 3 Unknown if powered 0 0 0 0 1 3 0 0 1 1 * Includes all injury fatalities other than immersion deaths † Included waterskiing 9, riding on tube or other device 3
Table 3a Boating fatalities* by purpose, activity, years, and power type, Canada 1991‐2006 (n=2,765)† Time period 1991‐1995
(n=1,098)
1996‐2000
(n=888)
2001‐2005
(n=671)
2006
(n=108)
1991‐2006
(n=2,765)
Powered boating (n=1,738)
Unpowered boating (n=883)
Activity by purpose n % n % n % n % n % n % n % Recreational‡ 915 83 763 86 582 87 95 88 2,355 85 1,384 80 850 96 Fishing 333 30 254 29 203 30 33 30 823 30 537 31 213 24 Powerboating 229 21 198 22 116 17 23 21 566 20 566 33 0 0 Canoeing 115 10 90 10 89 13 14 13 308 11 0 0 308 35 Boat travel 94 9 31 3 28 4 3 3 156 6 120 7 21 2 Hunting 44 4 66 7 38 6 8 7 156 6 99 6 49 6 Sailing 20 2 30 3 20 3 1 1 71 3 0 0 71 8 Kayaking 19 2 20 2 30 4 1 1 70 3 0 0 70 8 Other activity 22 2 20 2 11 2 2 2 55 2 31 2 10 1 Other, unpowered 11 1 11 1 12 2 2 2 36 1 0 0 35 4 White water rafting 7 1 8 1 7 1 1 1 23 1 1 <1 22 2 Towed by boat§ 8 1 5 1 4 1 2 2 19 1 19 1 0 0 Rowing 2 <1 13 1 5 1 1 1 21 1 0 0 21 2 Other rafting 3 <1 8 1 3 <1 0 0 14 1 0 0 14 2 Pedal boating 1 <1 2 <1 8 1 3 3 14 1 0 0 14 2 Embarking/ disembarking
2 <1 4 1 3 1 0 0 9 <1 4 <1 1 <1
Swimming 2 <1 1 <1 2 <1 1 1 6 <1 4 <1 0 0 Partying 0 0 1 <1 2 <1 0 0 3 <1 2 <1 1 <1 Unknown 3 <1 1 <1 1 <1 0 0 5 <1 1 <1 0 0 * Includes death from all causes: drowning, immersion hypothermia, and trauma † In 144 cases it was unknown if the boat was powered or unpowered; they were excluded from the two right columns ‡ Includes boating during recreation and daily life § Included waterskiing 5, riding on tube or other device 14
34
Table 3a Boating fatalities* by purpose, activity, years, and power type, Canada 1991‐2006 (n=2,765)† (continued) Time period 1991‐1995
(n=1,098)
1996‐2000
(n=888)
2001‐2005
(n=671)
2006
(n=108)
1991‐2006
(n=2,765)
Powered boating (n=1,738)
Unpowered boating (n=883)
Activity by purpose n % n % n % n % n % n % n % Occupational 153 14 101 11 68 10 11 10 333 12 315 18 12 1 Commercial fishing 84 8 64 7 41 6 9 8 198 7 192 11 6 1 Marine shipping 40 4 10 1 3 1 2 2 55 2 55 3 0 0 Fishing guiding or Charter
3 <1 4 1 3 1 0 0 10 <1 7 <1 2 <1
Aquaculture 3 <1 3 <1 1 <1 0 0 7 <1 6 <1 0 0 Other 22 2 19 2 20 3 0 0 61 2 53 3 4 <1 Unknown 1 <1 1 <1 0 0 0 0 2 <1 2 <1 0 0 Rescue 13 1 14 2 10 2 1 1 38 1 19 1 15 2 Other 0 0 4 1 2 <1 0 0 6 <1 4 <1 1 <1 Unknown 17 2 6 1 9 1 1 1 33 1 16 1 5 1 * Includes death from all causes: drowning, immersion hypothermia, and trauma † In 144 cases it was unknown if the boat was powered or unpowered; they were excluded from the two right columns
Table 3b Boating immersion deaths* by purpose, activity, years, and power Canada 1991‐2006 (n=2,630)† Time period 1991‐1995
(n=1,053)
1996‐2000
(n=838)
2001‐2005
(n=640)
2006
(n=99)
1991‐2006
(n=2,630)
Powered boating
(n=1,616)
Unpowered boating (n=871)
Activity by purpose n % n % n % n % n % n % n % Recreational‡ 873 83 718 86 555 87 86 87 2,232 85 1,274 79 838 96 Fishing 332 32 252 30 198 31 32 33 814 31 530 33 212 24 Powerboating 201 19 164 20 102 16 18 18 485 18 485 30 0 0 Canoeing 114 11 90 11 89 14 14 14 307 12 0 0 307 35 Boat travel 90 9 29 4 28 5 3 3 150 6 114 7 21 2 Hunting 44 4 65 8 38 6 8 8 155 6 98 6 49 6 Sailing 20 2 29 4 18 3 1 1 68 3 0 0 68 8 Kayaking 19 2 20 2 29 5 1 1 69 3 0 0 69 8 Other unpowered boating
11 1 11 1 12 2 2 2 36 1 0 0 35 4
White water rafting 5 <1 7 1 6 1 1 1 19 1 1 <1 18 2 Other rafting 3 <1 8 1 3 <1 0 0 14 1 0 0 14 2 Towed by boat§ 3 <1 2 <1 2 <1 0 0 7 <1 7 1 0 0 Rowing 2 <1 13 2 4 1 0 0 19 1 0 0 19 2 Pedal boating 1 <1 2 <1 8 1 3 3 14 1 0 0 14 2 Boarding or leaving boat
2 <1 4 <1 3 <1 0 0 9 <1 4 <1 1 <1
Swimming 2 <1 1 <1 1 <1 1 1 5 <1 3 <1 0 0 Partying 0 0 1 <1 2 <1 0 0 3 <1 2 <1 1 <1 Other activity 21 2 19 2 11 2 2 2 53 2 29 2 10 1 Unknown 3 <1 1 <1 1 <1 0 0 5 <1 1 <1 0 0 * Includes drownings and immersion hypothermia deaths † In 143 cases it was unknown if the boat was powered or unpowered; they were excluded from the two right columns ‡ Includes boating during recreation and daily life § Included water skiing 2, pulled on tube or other device 5
35
Table 3b Boating immersion deaths* by purpose, activity, years, and power, Canada 1991‐2006 (n=2,630)† (continued) Time period 1991‐1995
(n=1,053)
1996‐2000
(n=838)
2001‐2005
(n=640)
2006
(n=99)
1991‐2006
(n=2,630)
Powered boating
(n=1,616)
Unpowered boating (n=871)
Activity by purpose n % n % n % n % n % n % n % Occupational 150 14 96 11 66 10 11 11 323 12 305 19 12 1 Commercial fishing 82 8 63 8 41 7 9 9 195 7 189 12 6 1 Marine shipping 40 4 8 1 2 <1 2 2 52 2 52 3 2 <1 Fishing guiding or charter
3 <1 4 <1 3 <1 0 0 10 <1 7 1 0 0
Aquaculture 3 <1 3 <1 1 <1 0 0 7 <1 6 <1 0 0 Other activity 21 2 17 2 19 3 0 0 57 2 49 3 0 0 Unknown 1 <1 1 <1 0 0 0 0 2 <1 2 <1 4 <1 Rescue 13 1 14 2 10 2 1 1 38 2 19 1 15 2 Other 0 0 4 <1 1 <1 0 0 5 <1 3 <1 1 <1 Unknown 17 2 6 1 8 1 1 1 32 1 15 1 5 1 * Includes drownings and immersion hypothermia deaths † In 143 cases it was unknown if the boat was powered or unpowered; they were excluded from the two right columns
Table 3c Boating trauma death* by purpose, activity, and years, Canada 1991‐2006 (n=135)† Time period 1991‐1995
(n=45)
1996‐2000
(n=50)
2001‐2005
(n=31)
2006
(n=9)
1991‐2006
(n=135)
Powered boating (n=122)
Unpowered boating (n=12)
Activity by purpose n % n % n % n % n % n % n % Recreational‡ 42 93 45 90 27 87 9 100 123 91 110 90 12 100 Fishing 1 2 2 4 5 16 1 11 9 7 7 6 1 8 Powerboating 28 62 34 68 14 45 5 56 81 60 81 66 0 0 Canoeing 1 2 0 0 0 0 0 0 1 1 0 0 1 8 Boat travel 4 9 2 4 0 0 0 0 6 4 6 5 0 0 Hunting 0 0 1 2 0 0 0 0 1 1 1 1 0 0 Sailing 0 0 1 2 2 7 0 0 3 2 0 0 3 25 Kayaking 0 0 0 0 1 3 0 0 1 1 0 0 1 8 White water rafting 2 5 1 2 1 3 0 0 4 3 0 0 4 33 Towed by boat§ 5 11 0 0 2 7 2 22 12 9 12 10 0 0 Rowing 0 0 3 6 1 3 1 11 2 1 0 0 2 17 Other activity 1 2 1 2 0 0 0 0 2 1 2 2 0 0 Swimming 0 0 0 0 1 3 0 0 1 1 1 1 0 0 Occupational 3 7 5 10 2 7 0 0 10 7 10 8 Commercial fishing 2 5 1 2 0 0 0 0 3 2 3 2 0 0 Marine shipping 0 0 2 4 1 3 0 0 3 2 3 2 0 0 Other activity 1 2 2 4 1 3 0 0 4 3 4 3 0 0 Other 0 0 0 0 1 3 0 0 1 1 1 1 0 0 Unknown 0 0 0 0 1 3 0 0 1 1 1 1 0 0 * Includes all injury fatalities other than immersion deaths † In 1 case it was unknown if the boat was powered or unpowered; it was excluded from the two right columns ‡ Includes boating during recreation and daily life § Included waterskiing 3, riding on tube or other device 9
36
Table 4 Boating immersion* and trauma† deaths, Canada, 1991‐2006 (n=2,765)
Immersions Trauma Categories
All immersions
(n=2,630)
Drownings without
hypothermia
(n=2,114)
Drownings with hypothermia & hypothermia with drowning
(n=456)
Hypothermia without drowning
(n=60)
All trauma
(n=135) 4a All boating by type of boat (n=2,765)‡ n % n % n % n % n % Powerboat 1,616 61 1,294 61 282 62 40 67 122 90 Small outboard (≤5.5 m) 745 28 592 28 129 28 24 40 25 18 Other small open (e.g. inflatable) 126 5 99 5 22 5 5 8 9 7 Size unknown 288 11 253 12 35 8 0 0 18 13 Large (>5.5 m) 388 15 291 14 87 19 10 17 27 20 Personal watercraft Towed by PWC
31 0
1 0
27 0
1 0
4 0
1 0
0 0
0 0
30 3
22 2
Towed by powerboat 7 <1 7 <1 0 0 0 0 9 7 Other powerboat 1 <1 1 <1 0 0 0 0 0 0 Unknown powerboat 30 1 24 1 5 1 1 2 1 1 Unpowered boat 871 33 694 33 159 35 18 30 12 9 Canoe 533 21 423 20 98 22 12 20 1 1 Rowboat 86 3 67 3 19 4 0 0 2 1 Sailboat or sailboard 79 3 64 3 14 3 1 2 4 3 Kayak 76 3 50 2 22 5 4 6 1 1 Inflatable 56 2 51 3 4 1 1 2 4 3 Other unpowered boat 32 1 31 2 1 <1 0 0 0 0 Unknown unpowered boat 9 <1 8 <1 1 <1 0 0 0 0 Unknown if powered 143 6 126 6 15 3 2 3 1 1 4b Recreational boating§ by type of boat (n=2,355) n=2,232 % n=1,808 % n=378 % n=46 % n=123 %
Powerboat 1,274 57 1,035 57 211 56 28 61 110 89 Small outboard (≤5.5 m) 679 31 545 30 115 30 19 41 24 19 Other small open (e.g. inflatable) 112 5 90 5 18 5 4 9 9 7 Size unknown 253 11 223 12 30 8 0 0 18 15 Large (>5.5 m) 170 8 125 7 41 11 4 9 17 14 Personal watercraft Towed by PWC
29 0
1 0
25 0
1 0
4 0
1 0
0 0
0 0
29 3
24 2
Towed by powerboat 7 <1 7 1 0 0 0 0 9 7 Other powerboat 1 <1 1 <1 0 0 0 0 0 0 Unknown powerboat 23 1 19 1 3 1 1 2 1 1 Unpowered boat 838 38 669 37 153 40 16 35 12 10 Canoe 520 23 415 23 94 25 11 24 1 1 Rowboat 79 4 60 3 19 5 0 0 2 2 Sailboat or sailboard 76 4 62 3 14 4 0 0 4 3 Kayak 73 3 49 3 20 5 4 9 1 1 Inflatable 55 3 50 3 4 1 1 2 4 3 Other unpowered boat 26 1 25 1 1 <1 0 0 0 0 Unknown unpowered boat 9 <1 8 1 1 <1 0 0 0 0 Unknown if powered 120 5 104 6 14 4 2 4 1 1 * Includes drownings and immersion hypothermia deaths † Includes all other injury fatalities ‡ Included 75 immersion fatalities for which the purpose of the activity was rescue 38, other 5, and unknown 32, and 2 trauma fatalities for which the purpose of the activity was other 1, and unknown 1
§ Includes boating during recreation and daily life
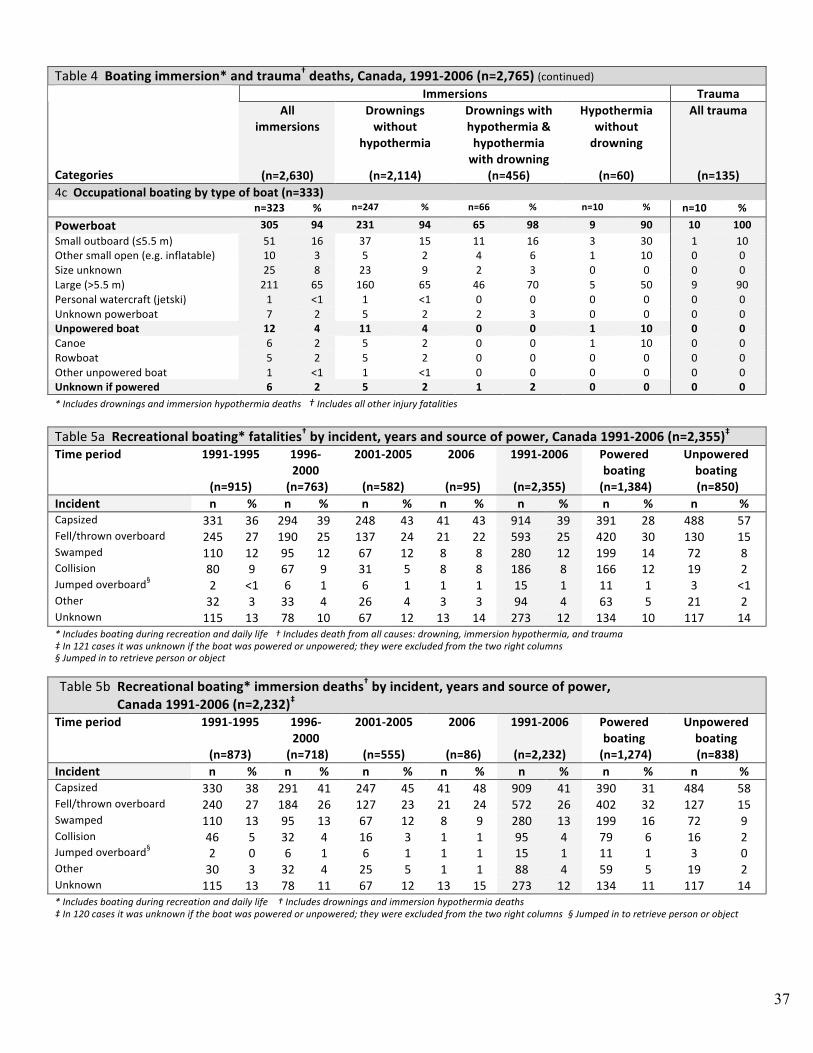
37
Table 4 Boating immersion* and trauma† deaths, Canada, 1991‐2006 (n=2,765) (continued)
Immersions Trauma Categories
All immersions
(n=2,630)
Drownings without
hypothermia
(n=2,114)
Drownings with hypothermia & hypothermia with drowning
(n=456)
Hypothermia without drowning
(n=60)
All trauma
(n=135) 4c Occupational boating by type of boat (n=333) n=323 % n=247 % n=66 % n=10 % n=10 %
Powerboat 305 94 231 94 65 98 9 90 10 100 Small outboard (≤5.5 m) 51 16 37 15 11 16 3 30 1 10 Other small open (e.g. inflatable) 10 3 5 2 4 6 1 10 0 0 Size unknown 25 8 23 9 2 3 0 0 0 0 Large (>5.5 m) 211 65 160 65 46 70 5 50 9 90 Personal watercraft (jetski) 1 <1 1 <1 0 0 0 0 0 0 Unknown powerboat 7 2 5 2 2 3 0 0 0 0 Unpowered boat 12 4 11 4 0 0 1 10 0 0 Canoe 6 2 5 2 0 0 1 10 0 0 Rowboat 5 2 5 2 0 0 0 0 0 0 Other unpowered boat 1 <1 1 <1 0 0 0 0 0 0 Unknown if powered 6 2 5 2 1 2 0 0 0 0 * Includes drownings and immersion hypothermia deaths † Includes all other injury fatalities
Table 5a Recreational boating* fatalities† by incident, years and source of power, Canada 1991‐2006 (n=2,355)‡ Time period 1991‐1995
(n=915)
1996‐2000
(n=763)
2001‐2005
(n=582)
2006
(n=95)
1991‐2006
(n=2,355)
Powered boating
(n=1,384)
Unpowered boating (n=850)
Incident n % n % n % n % n % n % n % Capsized 331 36 294 39 248 43 41 43 914 39 391 28 488 57 Fell/thrown overboard 245 27 190 25 137 24 21 22 593 25 420 30 130 15 Swamped 110 12 95 12 67 12 8 8 280 12 199 14 72 8 Collision 80 9 67 9 31 5 8 8 186 8 166 12 19 2 Jumped overboard§ 2 <1 6 1 6 1 1 1 15 1 11 1 3 <1 Other 32 3 33 4 26 4 3 3 94 4 63 5 21 2 Unknown 115 13 78 10 67 12 13 14 273 12 134 10 117 14 * Includes boating during recreation and daily life † Includes death from all causes: drowning, immersion hypothermia, and trauma ‡ In 121 cases it was unknown if the boat was powered or unpowered; they were excluded from the two right columns § Jumped in to retrieve person or object
Table 5b Recreational boating* immersion deaths† by incident, years and source of power, Canada 1991‐2006 (n=2,232)‡
Time period 1991‐1995
(n=873)
1996‐2000
(n=718)
2001‐2005
(n=555)
2006
(n=86)
1991‐2006
(n=2,232)
Powered boating
(n=1,274)
Unpowered boating (n=838)
Incident n % n % n % n % n % n % n % Capsized 330 38 291 41 247 45 41 48 909 41 390 31 484 58 Fell/thrown overboard 240 27 184 26 127 23 21 24 572 26 402 32 127 15 Swamped 110 13 95 13 67 12 8 9 280 13 199 16 72 9 Collision 46 5 32 4 16 3 1 1 95 4 79 6 16 2 Jumped overboard§ 2 0 6 1 6 1 1 1 15 1 11 1 3 0 Other 30 3 32 4 25 5 1 1 88 4 59 5 19 2 Unknown 115 13 78 11 67 12 13 15 273 12 134 11 117 14 * Includes boating during recreation and daily life † Includes drownings and immersion hypothermia deaths ‡ In 120 cases it was unknown if the boat was powered or unpowered; they were excluded from the two right columns § Jumped in to retrieve person or object
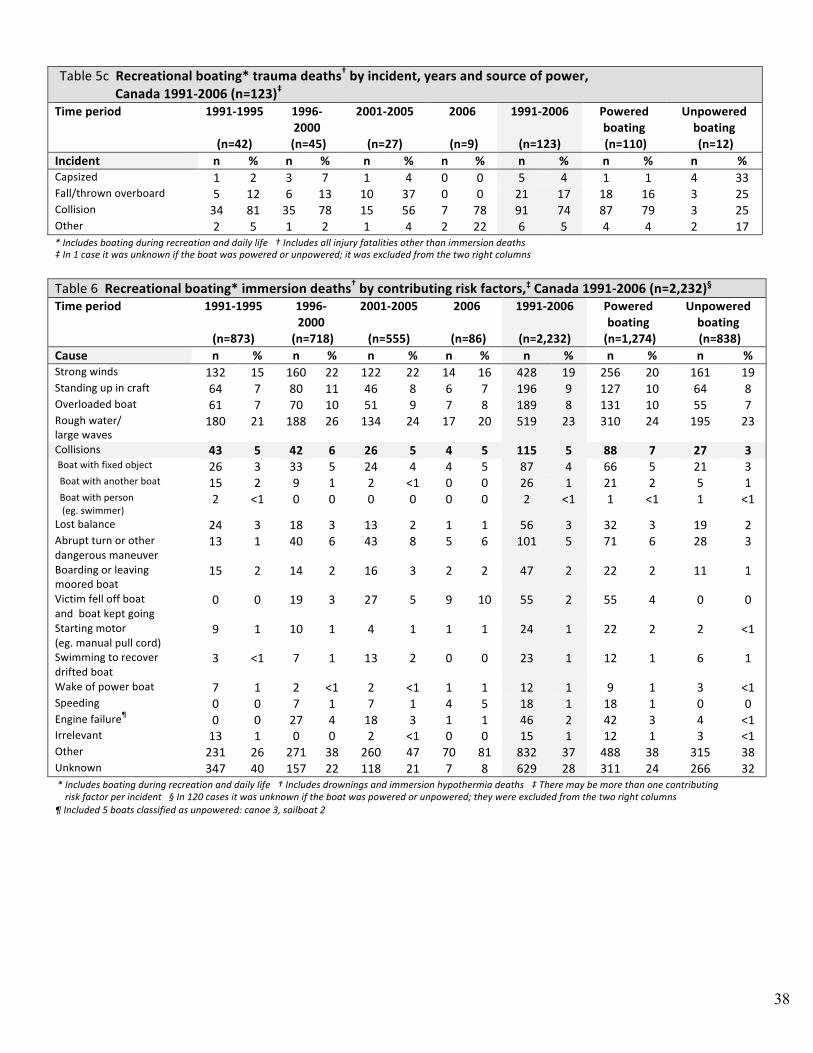
38
Table 5c Recreational boating* trauma deaths† by incident, years and source of power,
Canada 1991‐2006 (n=123)‡ Time period 1991‐1995
(n=42)
1996‐2000 (n=45)
2001‐2005
(n=27)
2006
(n=9)
1991‐2006
(n=123)
Powered boating (n=110)
Unpowered boating (n=12)
Incident n % n % n % n % n % n % n % Capsized 1 2 3 7 1 4 0 0 5 4 1 1 4 33 Fall/thrown overboard 5 12 6 13 10 37 0 0 21 17 18 16 3 25 Collision 34 81 35 78 15 56 7 78 91 74 87 79 3 25 Other 2 5 1 2 1 4 2 22 6 5 4 4 2 17 * Includes boating during recreation and daily life † Includes all injury fatalities other than immersion deaths ‡ In 1 case it was unknown if the boat was powered or unpowered; it was excluded from the two right columns
Table 6 Recreational boating* immersion deaths† by contributing risk factors,‡ Canada 1991‐2006 (n=2,232)§ Time period 1991‐1995
(n=873)
1996‐2000
(n=718)
2001‐2005
(n=555)
2006
(n=86)
1991‐2006
(n=2,232)
Powered boating
(n=1,274)
Unpowered boating (n=838)
Cause n % n % n % n % n % n % n % Strong winds 132 15 160 22 122 22 14 16 428 19 256 20 161 19 Standing up in craft 64 7 80 11 46 8 6 7 196 9 127 10 64 8 Overloaded boat 61 7 70 10 51 9 7 8 189 8 131 10 55 7 Rough water/ large waves
180 21 188 26 134 24 17 20 519 23 310 24 195 23
Collisions 43 5 42 6 26 5 4 5 115 5 88 7 27 3 Boat with fixed object 26 3 33 5 24 4 4 5 87 4 66 5 21 3 Boat with another boat 15 2 9 1 2 <1 0 0 26 1 21 2 5 1 Boat with person (eg. swimmer)
2 <1 0 0 0 0 0 0 2 <1 1 <1 1 <1
Lost balance 24 3 18 3 13 2 1 1 56 3 32 3 19 2 Abrupt turn or other dangerous maneuver
13 1 40 6 43 8 5 6 101 5 71 6 28 3
Boarding or leaving moored boat
15 2 14 2 16 3 2 2 47 2 22 2 11 1
Victim fell off boat and boat kept going
0 0 19 3 27 5 9 10 55 2 55 4 0 0
Starting motor (eg. manual pull cord)
9 1 10 1 4 1 1 1 24 1 22 2 2 <1
Swimming to recover drifted boat
3 <1 7 1 13 2 0 0 23 1 12 1 6 1
Wake of power boat 7 1 2 <1 2 <1 1 1 12 1 9 1 3 <1 Speeding 0 0 7 1 7 1 4 5 18 1 18 1 0 0 Engine failure¶ 0 0 27 4 18 3 1 1 46 2 42 3 4 <1 Irrelevant 13 1 0 0 2 <1 0 0 15 1 12 1 3 <1 Other 231 26 271 38 260 47 70 81 832 37 488 38 315 38 Unknown 347 40 157 22 118 21 7 8 629 28 311 24 266 32 * Includes boating during recreation and daily life † Includes drownings and immersion hypothermia deaths ‡ There may be more than one contributing risk factor per incident § In 120 cases it was unknown if the boat was powered or unpowered; they were excluded from the two right columns
¶ Included 5 boats classified as unpowered: canoe 3, sailboat 2
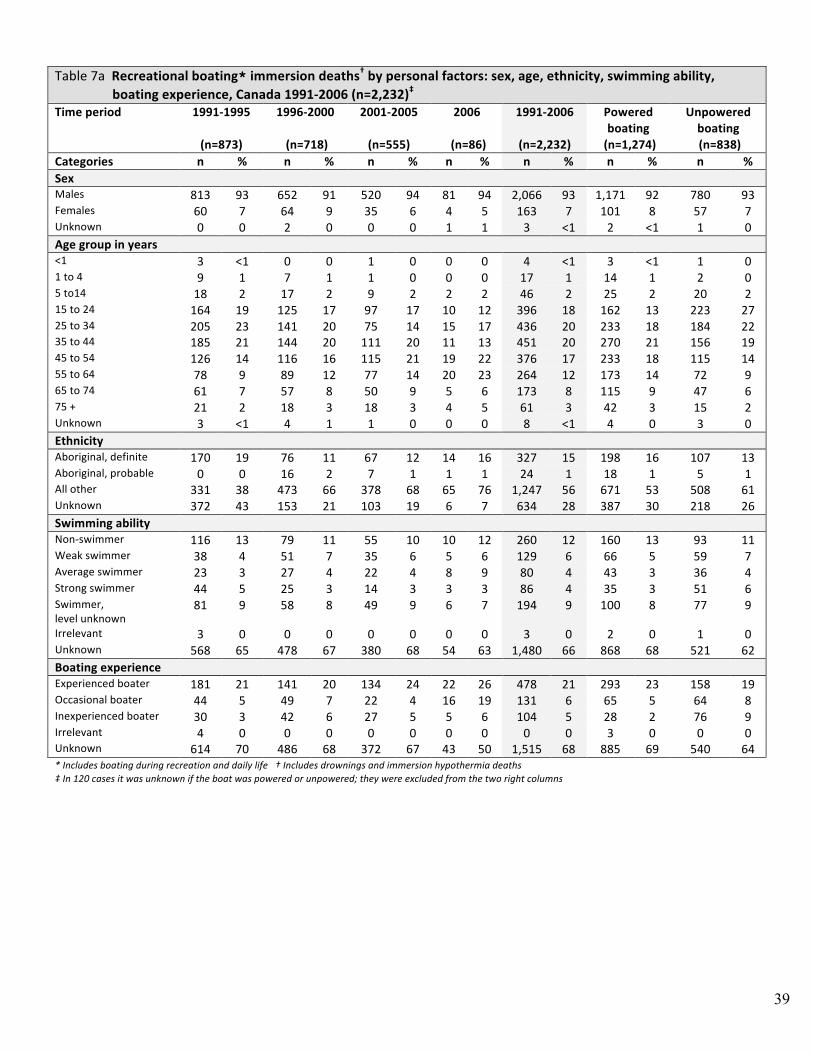
39
Table 7a Recreational boating* immersion deaths† by personal factors: sex, age, ethnicity, swimming ability,
boating experience, Canada 1991‐2006 (n=2,232)‡ Time period
1991‐1995
(n=873)
1996‐2000
(n=718)
2001‐2005
(n=555)
2006
(n=86)
1991‐2006
(n=2,232)
Powered boating
(n=1,274)
Unpowered boating (n=838)
Categories n % n % n % n % n % n % n % Sex Males 813 93 652 91 520 94 81 94 2,066 93 1,171 92 780 93 Females 60 7 64 9 35 6 4 5 163 7 101 8 57 7 Unknown 0 0 2 0 0 0 1 1 3 <1 2 <1 1 0 Age group in years <1 3 <1 0 0 1 0 0 0 4 <1 3 <1 1 0 1 to 4 9 1 7 1 1 0 0 0 17 1 14 1 2 0 5 to14 18 2 17 2 9 2 2 2 46 2 25 2 20 2 15 to 24 164 19 125 17 97 17 10 12 396 18 162 13 223 27 25 to 34 205 23 141 20 75 14 15 17 436 20 233 18 184 22 35 to 44 185 21 144 20 111 20 11 13 451 20 270 21 156 19 45 to 54 126 14 116 16 115 21 19 22 376 17 233 18 115 14 55 to 64 78 9 89 12 77 14 20 23 264 12 173 14 72 9 65 to 74 61 7 57 8 50 9 5 6 173 8 115 9 47 6 75 + 21 2 18 3 18 3 4 5 61 3 42 3 15 2 Unknown 3 <1 4 1 1 0 0 0 8 <1 4 0 3 0 Ethnicity Aboriginal, definite 170 19 76 11 67 12 14 16 327 15 198 16 107 13 Aboriginal, probable 0 0 16 2 7 1 1 1 24 1 18 1 5 1 All other 331 38 473 66 378 68 65 76 1,247 56 671 53 508 61 Unknown 372 43 153 21 103 19 6 7 634 28 387 30 218 26 Swimming ability Non‐swimmer 116 13 79 11 55 10 10 12 260 12 160 13 93 11 Weak swimmer 38 4 51 7 35 6 5 6 129 6 66 5 59 7 Average swimmer 23 3 27 4 22 4 8 9 80 4 43 3 36 4 Strong swimmer 44 5 25 3 14 3 3 3 86 4 35 3 51 6 Swimmer, level unknown
81 9 58 8 49 9 6 7 194 9 100 8 77 9
Irrelevant 3 0 0 0 0 0 0 0 3 0 2 0 1 0 Unknown 568 65 478 67 380 68 54 63 1,480 66 868 68 521 62 Boating experience Experienced boater 181 21 141 20 134 24 22 26 478 21 293 23 158 19 Occasional boater 44 5 49 7 22 4 16 19 131 6 65 5 64 8 Inexperienced boater 30 3 42 6 27 5 5 6 104 5 28 2 76 9 Irrelevant 4 0 0 0 0 0 0 0 0 0 3 0 0 0 Unknown 614 70 486 68 372 67 43 50 1,515 68 885 69 540 64 * Includes boating during recreation and daily life † Includes drownings and immersion hypothermia deaths ‡ In 120 cases it was unknown if the boat was powered or unpowered; they were excluded from the two right columns
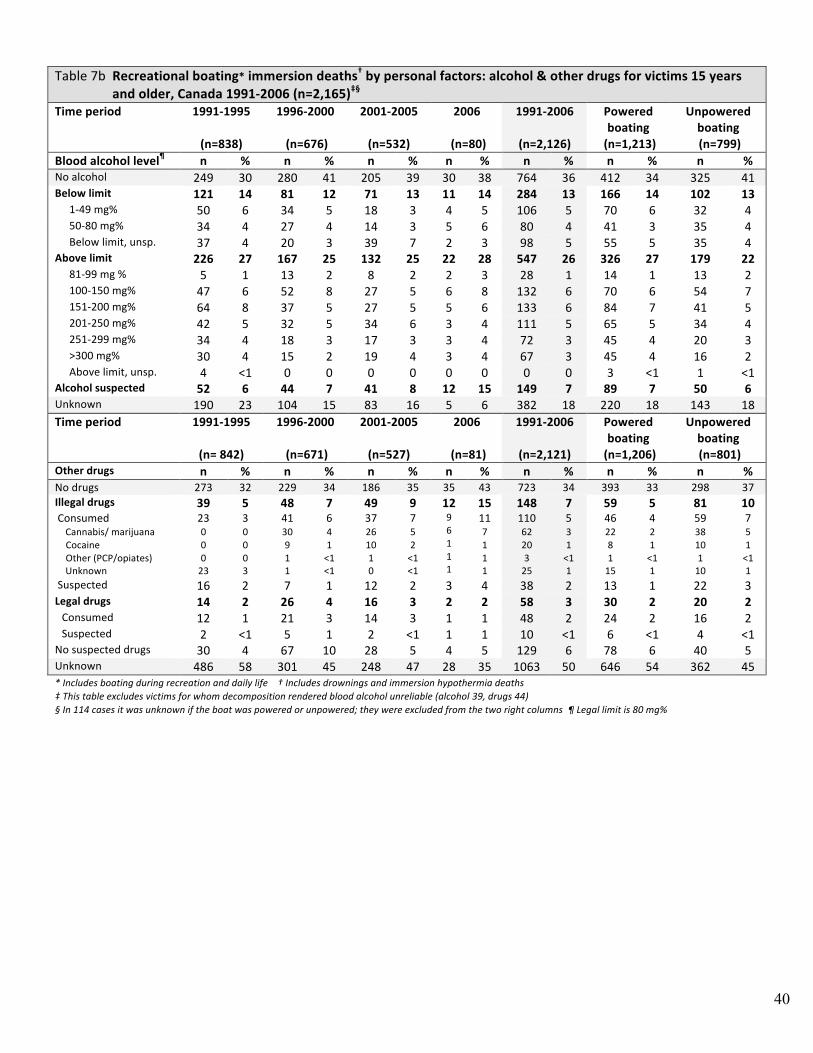
40
Table 7b Recreational boating* immersion deaths† by personal factors: alcohol & other drugs for victims 15 years
and older, Canada 1991‐2006 (n=2,165)‡§ Time period
1991‐1995
(n=838)
1996‐2000
(n=676)
2001‐2005
(n=532)
2006
(n=80)
1991‐2006
(n=2,126)
Powered boating
(n=1,213)
Unpowered boating (n=799)
Blood alcohol level¶ n % n % n % n % n % n % n % No alcohol 249 30 280 41 205 39 30 38 764 36 412 34 325 41 Below limit 121 14 81 12 71 13 11 14 284 13 166 14 102 13
1‐49 mg% 50 6 34 5 18 3 4 5 106 5 70 6 32 4 50‐80 mg% 34 4 27 4 14 3 5 6 80 4 41 3 35 4 Below limit, unsp. 37 4 20 3 39 7 2 3 98 5 55 5 35 4
Above limit 226 27 167 25 132 25 22 28 547 26 326 27 179 22 81‐99 mg % 5 1 13 2 8 2 2 3 28 1 14 1 13 2 100‐150 mg% 47 6 52 8 27 5 6 8 132 6 70 6 54 7 151‐200 mg% 64 8 37 5 27 5 5 6 133 6 84 7 41 5 201‐250 mg% 42 5 32 5 34 6 3 4 111 5 65 5 34 4 251‐299 mg% 34 4 18 3 17 3 3 4 72 3 45 4 20 3 >300 mg% 30 4 15 2 19 4 3 4 67 3 45 4 16 2 Above limit, unsp. 4 <1 0 0 0 0 0 0 0 0 3 <1 1 <1
Alcohol suspected 52 6 44 7 41 8 12 15 149 7 89 7 50 6 Unknown 190 23 104 15 83 16 5 6 382 18 220 18 143 18 Time period
1991‐1995
(n= 842)
1996‐2000
(n=671)
2001‐2005
(n=527)
2006
(n=81)
1991‐2006
(n=2,121)
Powered boating
(n=1,206)
Unpowered boating (n=801)
Other drugs n % n % n % n % n % n % n % No drugs 273 32 229 34 186 35 35 43 723 34 393 33 298 37 Illegal drugs 39 5 48 7 49 9 12 15 148 7 59 5 81 10 Consumed Cannabis/ marijuana Cocaine Other (PCP/opiates) Unknown
23 0 0 0 23
3 0 0 0 3
41 30 9 1 1
6 4 1 <1 <1
37 26 10 1 0
7 5 2 <1 <1
9 6 1 1 1
11 7 1 1 1
110 62 20 3 25
5 3 1 <1 1
46 22 8 1 15
4 2 1 <1 1
59 38 10 1 10
7 5 1 <1 1
Suspected 16 2 7 1 12 2 3 4 38 2 13 1 22 3 Legal drugs 14 2 26 4 16 3 2 2 58 3 30 2 20 2 Consumed 12 1 21 3 14 3 1 1 48 2 24 2 16 2 Suspected 2 <1 5 1 2 <1 1 1 10 <1 6 <1 4 <1 No suspected drugs 30 4 67 10 28 5 4 5 129 6 78 6 40 5 Unknown 486 58 301 45 248 47 28 35 1063 50 646 54 362 45 * Includes boating during recreation and daily life † Includes drownings and immersion hypothermia deaths ‡ This table excludes victims for whom decomposition rendered blood alcohol unreliable (alcohol 39, drugs 44) § In 114 cases it was unknown if the boat was powered or unpowered; they were excluded from the two right columns ¶ Legal limit is 80 mg%
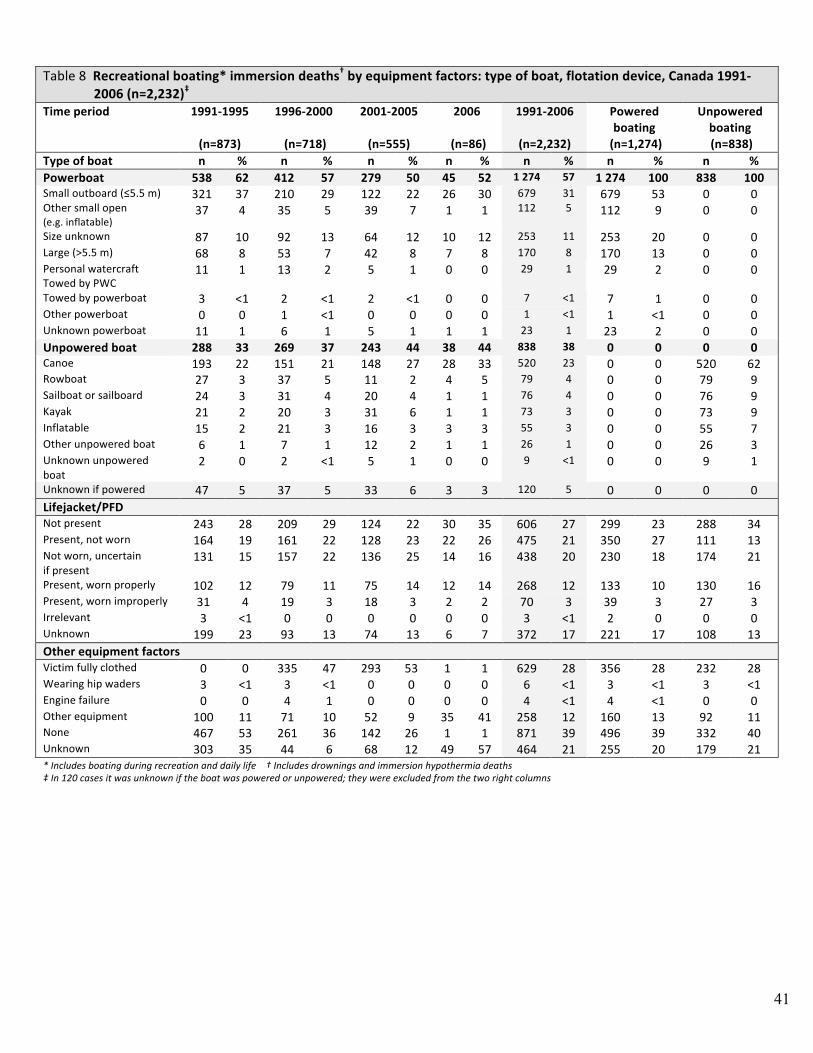
41
Table 8 Recreational boating* immersion deaths† by equipment factors: type of boat, flotation device, Canada 1991‐
2006 (n=2,232)‡ Time period 1991‐1995
(n=873)
1996‐2000
(n=718)
2001‐2005
(n=555)
2006
(n=86)
1991‐2006
(n=2,232)
Powered boating
(n=1,274)
Unpowered boating (n=838)
Type of boat n % n % n % n % n % n % n % Powerboat 538 62 412 57 279 50 45 52 1 274 57 1 274 100 838 100 Small outboard (≤5.5 m) Other small open (e.g. inflatable)
321 37
37 4
210 35
29 5
122 39
22 7
26 1
30 1
679 112
31 5
679 112
53 9
0 0
0 0
Size unknown 87 10 92 13 64 12 10 12 253 11 253 20 0 0 Large (>5.5 m) 68 8 53 7 42 8 7 8 170 8 170 13 0 0 Personal watercraft Towed by PWC
11 1 13 2 5 1 0 0 29 1 29 2 0 0
Towed by powerboat 3 <1 2 <1 2 <1 0 0 7 <1 7 1 0 0 Other powerboat 0 0 1 <1 0 0 0 0 1 <1 1 <1 0 0 Unknown powerboat 11 1 6 1 5 1 1 1 23 1 23 2 0 0 Unpowered boat 288 33 269 37 243 44 38 44 838 38 0 0 0 0 Canoe 193 22 151 21 148 27 28 33 520 23 0 0 520 62 Rowboat 27 3 37 5 11 2 4 5 79 4 0 0 79 9 Sailboat or sailboard 24 3 31 4 20 4 1 1 76 4 0 0 76 9 Kayak 21 2 20 3 31 6 1 1 73 3 0 0 73 9 Inflatable 15 2 21 3 16 3 3 3 55 3 0 0 55 7 Other unpowered boat 6 1 7 1 12 2 1 1 26 1 0 0 26 3 Unknown unpowered boat
2 0 2 <1 5 1 0 0 9 <1 0 0 9 1
Unknown if powered 47 5 37 5 33 6 3 3 120 5 0 0 0 0 Lifejacket/PFD Not present 243 28 209 29 124 22 30 35 606 27 299 23 288 34 Present, not worn 164 19 161 22 128 23 22 26 475 21 350 27 111 13 Not worn, uncertain if present
131 15 157 22 136 25 14 16 438 20 230 18 174 21
Present, worn properly 102 12 79 11 75 14 12 14 268 12 133 10 130 16 Present, worn improperly 31 4 19 3 18 3 2 2 70 3 39 3 27 3 Irrelevant 3 <1 0 0 0 0 0 0 3 <1 2 0 0 0 Unknown 199 23 93 13 74 13 6 7 372 17 221 17 108 13 Other equipment factors Victim fully clothed 0 0 335 47 293 53 1 1 629 28 356 28 232 28 Wearing hip waders 3 <1 3 <1 0 0 0 0 6 <1 3 <1 3 <1 Engine failure 0 0 4 1 0 0 0 0 4 <1 4 <1 0 0 Other equipment 100 11 71 10 52 9 35 41 258 12 160 13 92 11 None 467 53 261 36 142 26 1 1 871 39 496 39 332 40 Unknown 303 35 44 6 68 12 49 57 464 21 255 20 179 21 * Includes boating during recreation and daily life † Includes drownings and immersion hypothermia deaths ‡ In 120 cases it was unknown if the boat was powered or unpowered; they were excluded from the two right columns
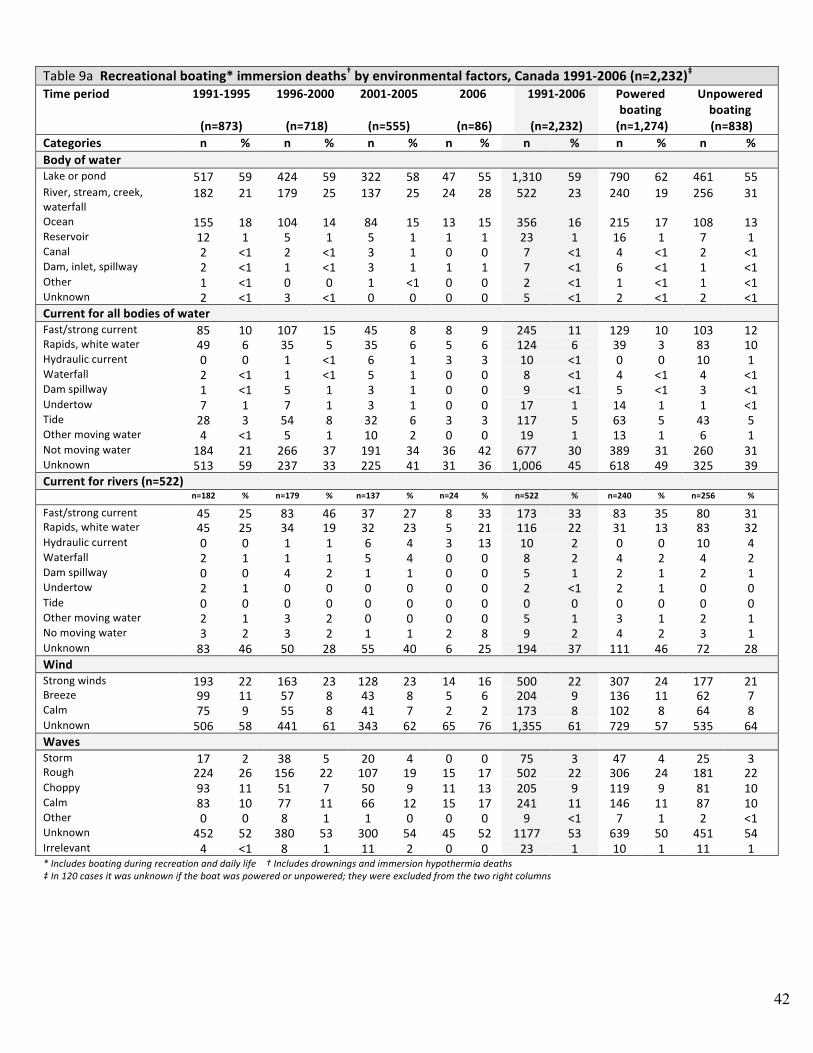
42
Table 9a Recreational boating* immersion deaths† by environmental factors, Canada 1991‐2006 (n=2,232)‡ Time period 1991‐1995
(n=873)
1996‐2000
(n=718)
2001‐2005
(n=555)
2006
(n=86)
1991‐2006
(n=2,232)
Powered boating
(n=1,274)
Unpowered boating (n=838)
Categories n % n % n % n % n % n % n % Body of water Lake or pond 517 59 424 59 322 58 47 55 1,310 59 790 62 461 55 River, stream, creek, waterfall
182 21 179 25 137 25 24 28 522 23 240 19 256 31
Ocean 155 18 104 14 84 15 13 15 356 16 215 17 108 13 Reservoir Retention pond
12 1 5 1 5 1 1 1 23 1 16 1 7 1 Canal 2 <1 2 <1 3 1 0 0 7 <1 4 <1 2 <1 Dam, inlet, spillway 2 <1 1 <1 3 1 1 1 7 <1 6 <1 1 <1 Other 1 <1 0 0 1 <1 0 0 2 <1 1 <1 1 <1 Unknown 2 <1 3 <1 0 0 0 0 5 <1 2 <1 2 <1 Current for all bodies of water Fast/strong current 85 10 107 15 45 8 8 9 245 11 129 10 103 12 Rapids, white water 49 6 35 5 35 6 5 6 124 6 39 3 83 10 Hydraulic current 0 0 1 <1 6 1 3 3 10 <1 0 0 10 1 Waterfall 2 <1 1 <1 5 1 0 0 8 <1 4 <1 4 <1 Dam spillway 1 <1 5 1 3 1 0 0 9 <1 5 <1 3 <1 Undertow 7 1 7 1 3 1 0 0 17 1 14 1 1 <1 Tide 28 3 54 8 32 6 3 3 117 5 63 5 43 5 Other moving water 4 <1 5 1 10 2 0 0 19 1 13 1 6 1 Not moving water 184 21 266 37 191 34 36 42 677 30 389 31 260 31 Unknown 513 59 237 33 225 41 31 36 1,006 45 618 49 325 39 Current for rivers (n=522) n=182 % n=179 % n=137 % n=24 % n=522 % n=240 % n=256 %
Fast/strong current 45 25 83 46 37 27 8 33 173 33 83 35 80 31 Rapids, white water 45 25 34 19 32 23 5 21 116 22 31 13 83 32 Hydraulic current 0 0 1 1 6 4 3 13 10 2 0 0 10 4 Waterfall 2 1 1 1 5 4 0 0 8 2 4 2 4 2 Dam spillway 0 0 4 2 1 1 0 0 5 1 2 1 2 1 Undertow 2 1 0 0 0 0 0 0 2 <1 2 1 0 0 Tide 0 0 0 0 0 0 0 0 0 0 0 0 0 0 Other moving water 2 1 3 2 0 0 0 0 5 1 3 1 2 1 No moving water 3 2 3 2 1 1 2 8 9 2 4 2 3 1 Unknown 83 46 50 28 55 40 6 25 194 37 111 46 72 28 Wind Strong winds 193 22 163 23 128 23 14 16 500 22 307 24 177 21 Breeze 99 11 57 8 43 8 5 6 204 9 136 11 62 7 Calm 75 9 55 8 41 7 2 2 173 8 102 8 64 8 Unknown 506 58 441 61 343 62 65 76 1,355 61 729 57 535 64 Waves Storm 17 2 38 5 20 4 0 0 75 3 47 4 25 3 Rough 224 26 156 22 107 19 15 17 502 22 306 24 181 22 Choppy 93 11 51 7 50 9 11 13 205 9 119 9 81 10 Calm 83 10 77 11 66 12 15 17 241 11 146 11 87 10 Other 0 0 8 1 1 0 0 0 9 <1 7 1 2 <1 Unknown 452 52 380 53 300 54 45 52 1177 53 639 50 451 54 Irrelevant 4 <1 8 1 11 2 0 0 23 1 10 1 11 1 * Includes boating during recreation and daily life † Includes drownings and immersion hypothermia deaths ‡ In 120 cases it was unknown if the boat was powered or unpowered; they were excluded from the two right columns
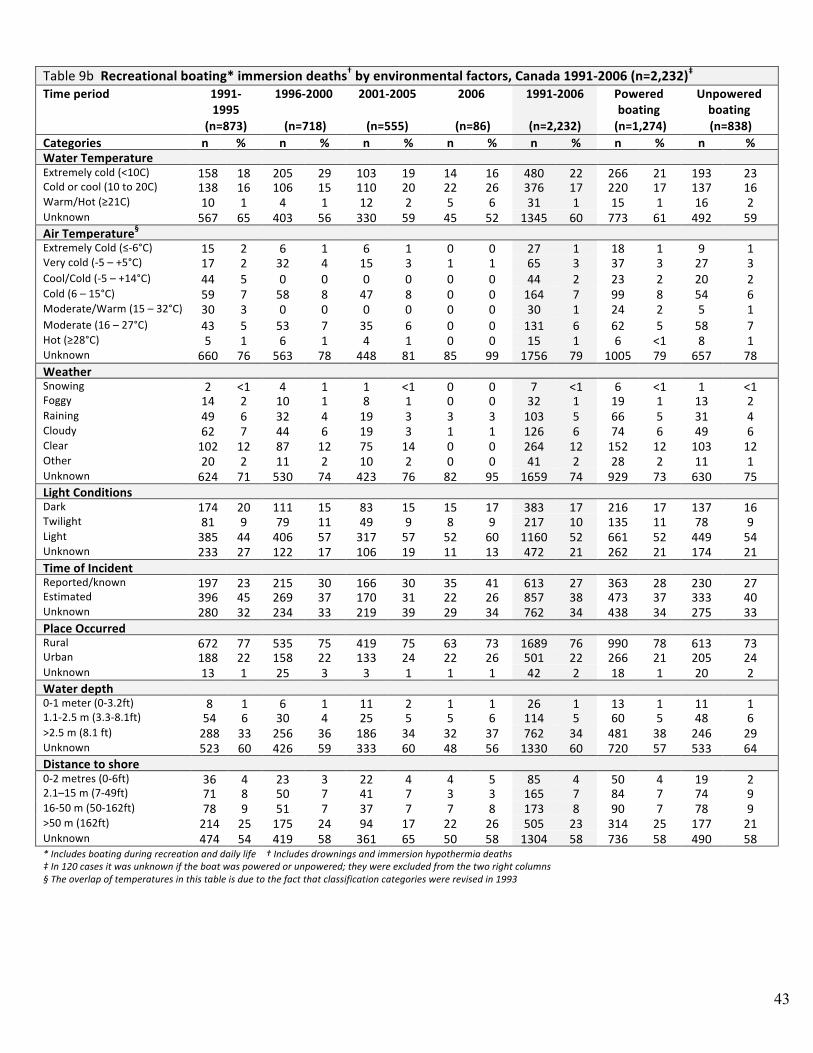
43
Table 9b Recreational boating* immersion deaths† by environmental factors, Canada 1991‐2006 (n=2,232)‡ Time period 1991‐
1995 (n=873)
1996‐2000
(n=718)
2001‐2005
(n=555)
2006
(n=86)
1991‐2006
(n=2,232)
Powered boating
(n=1,274)
Unpowered boating (n=838)
Categories n % n % n % n % n % n % n % Water Temperature Extremely cold (<10C) 158 18 205 29 103 19 14 16 480 22 266 21 193 23 Cold or cool (10 to 20C) 138 16 106 15 110 20 22 26 376 17 220 17 137 16 Warm/Hot (≥21C) 10 1 4 1 12 2 5 6 31 1 15 1 16 2 Unknown 567 65 403 56 330 59 45 52 1345 60 773 61 492 59 Air Temperature§ Extremely Cold (≤‐6°C) 15 2 6 1 6 1 0 0 27 1 18 1 9 1 Very cold (‐5 – +5°C) 17 2 32 4 15 3 1 1 65 3 37 3 27 3 Cool/Cold (‐5 – +14°C) 44 5 0 0 0 0 0 0 44 2 23 2 20 2 Cold (6 – 15°C) 59 7 58 8 47 8 0 0 164 7 99 8 54 6 Moderate/Warm (15 – 32°C) 30 3 0 0 0 0 0 0 30 1 24 2 5 1 Moderate (16 – 27°C) 43 5 53 7 35 6 0 0 131 6 62 5 58 7 Hot (≥28°C) 5 1 6 1 4 1 0 0 15 1 6 <1 8 1 Unknown 660 76 563 78 448 81 85 99 1756 79 1005 79 657 78 Weather Snowing 2 <1 4 1 1 <1 0 0 7 <1 6 <1 1 <1 Foggy 14 2 10 1 8 1 0 0 32 1 19 1 13 2 Raining 49 6 32 4 19 3 3 3 103 5 66 5 31 4 Cloudy 62 7 44 6 19 3 1 1 126 6 74 6 49 6 Clear 102 12 87 12 75 14 0 0 264 12 152 12 103 12 Other 20 2 11 2 10 2 0 0 41 2 28 2 11 1 Unknown 624 71 530 74 423 76 82 95 1659 74 929 73 630 75 Light Conditions Dark 174 20 111 15 83 15 15 17 383 17 216 17 137 16 Twilight 81 9 79 11 49 9 8 9 217 10 135 11 78 9 Light 385 44 406 57 317 57 52 60 1160 52 661 52 449 54 Unknown 233 27 122 17 106 19 11 13 472 21 262 21 174 21 Time of Incident Reported/known 197 23 215 30 166 30 35 41 613 27 363 28 230 27 Estimated 396 45 269 37 170 31 22 26 857 38 473 37 333 40 Unknown 280 32 234 33 219 39 29 34 762 34 438 34 275 33 Place Occurred Rural 672 77 535 75 419 75 63 73 1689 76 990 78 613 73 Urban 188 22 158 22 133 24 22 26 501 22 266 21 205 24 Unknown 13 1 25 3 3 1 1 1 42 2 18 1 20 2 Water depth 0‐1 meter (0‐3.2ft) 8 1 6 1 11 2 1 1 26 1 13 1 11 1 1.1‐2.5 m (3.3‐8.1ft) 54 6 30 4 25 5 5 6 114 5 60 5 48 6 >2.5 m (8.1 ft) 288 33 256 36 186 34 32 37 762 34 481 38 246 29 Unknown 523 60 426 59 333 60 48 56 1330 60 720 57 533 64 Distance to shore 0‐2 metres (0‐6ft) 36 4 23 3 22 4 4 5 85 4 50 4 19 2 2.1–15 m (7‐49ft) 71 8 50 7 41 7 3 3 165 7 84 7 74 9 16‐50 m (50‐162ft) 78 9 51 7 37 7 7 8 173 8 90 7 78 9 >50 m (162ft) 214 25 175 24 94 17 22 26 505 23 314 25 177 21 Unknown 474 54 419 58 361 65 50 58 1304 58 736 58 490 58 * Includes boating during recreation and daily life † Includes drownings and immersion hypothermia deaths ‡ In 120 cases it was unknown if the boat was powered or unpowered; they were excluded from the two right columns § The overlap of temperatures in this table is due to the fact that classification categories were revised in 1993
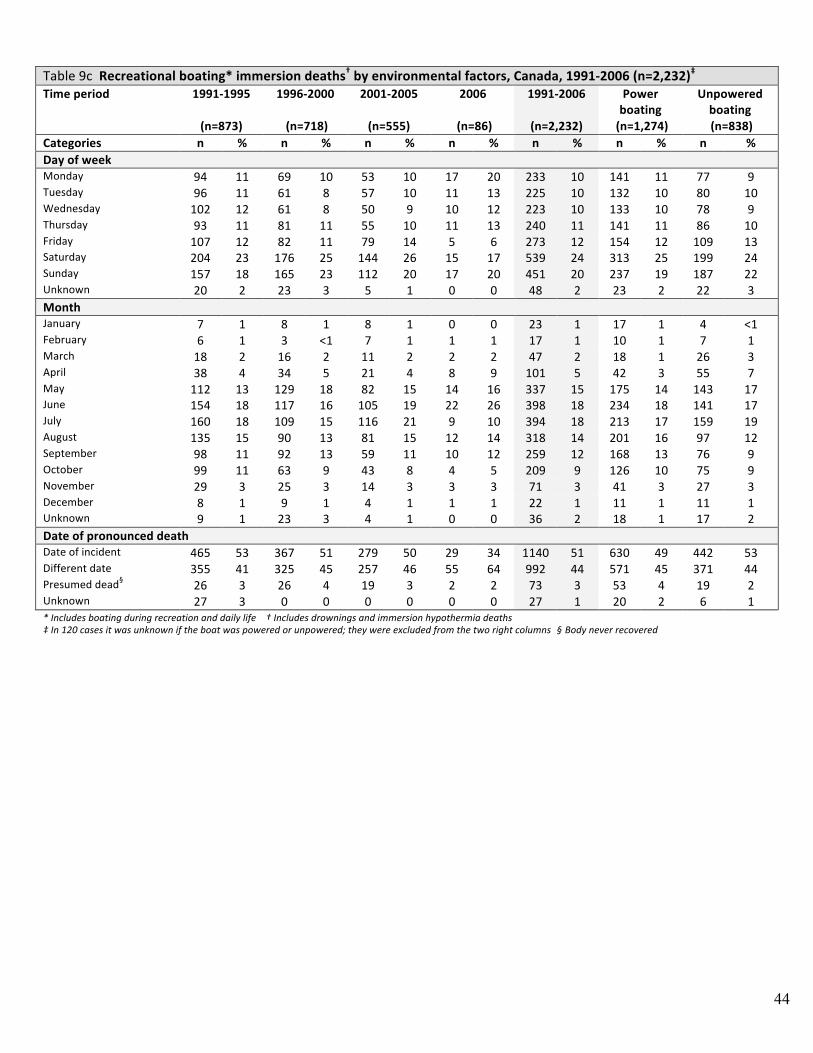
44
Table 9c Recreational boating* immersion deaths† by environmental factors, Canada, 1991‐2006 (n=2,232)‡ Time period 1991‐1995
(n=873)
1996‐2000
(n=718)
2001‐2005
(n=555)
2006
(n=86)
1991‐2006
(n=2,232)
Power boating
(n=1,274)
Unpowered boating (n=838)
Categories n % n % n % n % n % n % n % Day of week Monday 94 11 69 10 53 10 17 20 233 10 141 11 77 9 Tuesday 96 11 61 8 57 10 11 13 225 10 132 10 80 10 Wednesday 102 12 61 8 50 9 10 12 223 10 133 10 78 9 Thursday 93 11 81 11 55 10 11 13 240 11 141 11 86 10 Friday 107 12 82 11 79 14 5 6 273 12 154 12 109 13 Saturday 204 23 176 25 144 26 15 17 539 24 313 25 199 24 Sunday 157 18 165 23 112 20 17 20 451 20 237 19 187 22 Unknown 20 2 23 3 5 1 0 0 48 2 23 2 22 3 Month January 7 1 8 1 8 1 0 0 23 1 17 1 4 <1 February 6 1 3 <1 7 1 1 1 17 1 10 1 7 1 March 18 2 16 2 11 2 2 2 47 2 18 1 26 3 April 38 4 34 5 21 4 8 9 101 5 42 3 55 7 May 112 13 129 18 82 15 14 16 337 15 175 14 143 17 June 154 18 117 16 105 19 22 26 398 18 234 18 141 17 July 160 18 109 15 116 21 9 10 394 18 213 17 159 19 August 135 15 90 13 81 15 12 14 318 14 201 16 97 12 September 98 11 92 13 59 11 10 12 259 12 168 13 76 9 October 99 11 63 9 43 8 4 5 209 9 126 10 75 9 November 29 3 25 3 14 3 3 3 71 3 41 3 27 3 December 8 1 9 1 4 1 1 1 22 1 11 1 11 1 Unknown 9 1 23 3 4 1 0 0 36 2 18 1 17 2 Date of pronounced death Date of incident 465 53 367 51 279 50 29 34 1140 51 630 49 442 53 Different date 355 41 325 45 257 46 55 64 992 44 571 45 371 44 Presumed dead§ 26 3 26 4 19 3 2 2 73 3 53 4 19 2 Unknown 27 3 0 0 0 0 0 0 27 1 20 2 6 1 * Includes boating during recreation and daily life † Includes drownings and immersion hypothermia deaths ‡ In 120 cases it was unknown if the boat was powered or unpowered; they were excluded from the two right columns § Body never recovered
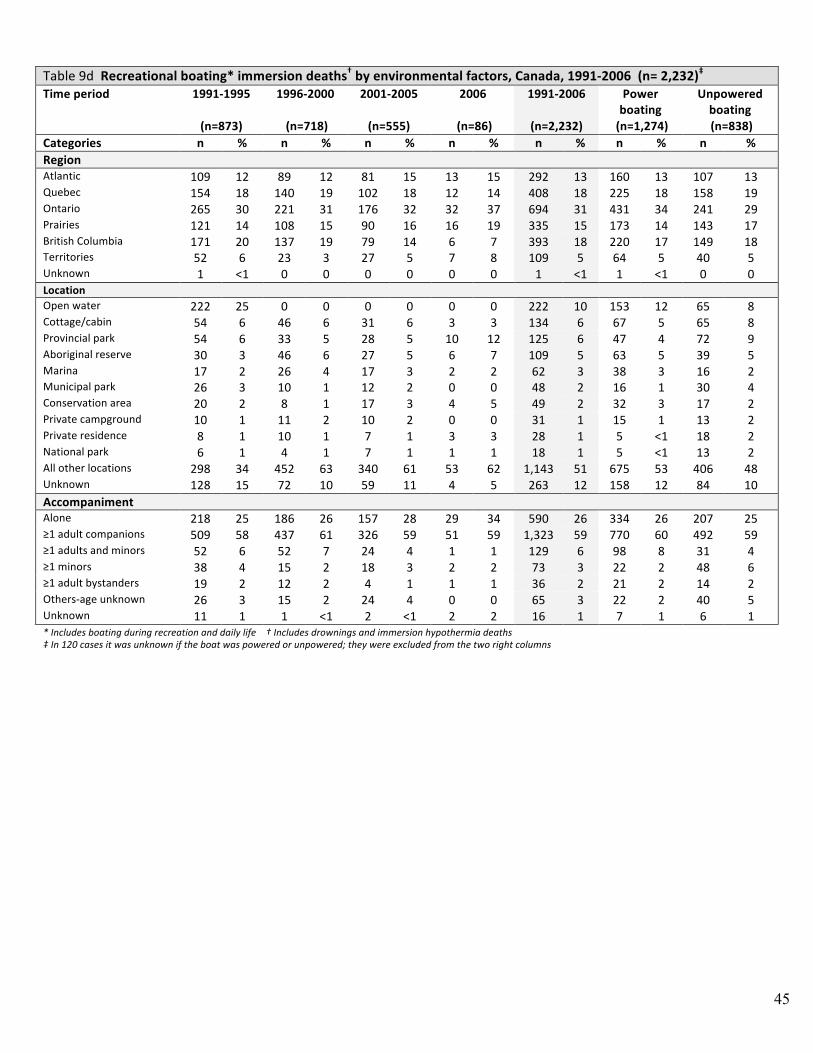
45
Table 9d Recreational boating* immersion deaths† by environmental factors, Canada, 1991‐2006 (n= 2,232)‡ Time period 1991‐1995
(n=873)
1996‐2000
(n=718)
2001‐2005
(n=555)
2006
(n=86)
1991‐2006
(n=2,232)
Power boating
(n=1,274)
Unpowered boating (n=838)
Categories n % n % n % n % n % n % n % Region Atlantic 109 12 89 12 81 15 13 15 292 13 160 13 107 13 Quebec 154 18 140 19 102 18 12 14 408 18 225 18 158 19 Ontario 265 30 221 31 176 32 32 37 694 31 431 34 241 29 Prairies 121 14 108 15 90 16 16 19 335 15 173 14 143 17 British Columbia 171 20 137 19 79 14 6 7 393 18 220 17 149 18 Territories 52 6 23 3 27 5 7 8 109 5 64 5 40 5 Unknown 1 <1 0 0 0 0 0 0 1 <1 1 <1 0 0 Location Open water 222 25 0 0 0 0 0 0 222 10 153 12 65 8 Cottage/cabin 54 6 46 6 31 6 3 3 134 6 67 5 65 8 Provincial park 54 6 33 5 28 5 10 12 125 6 47 4 72 9 Aboriginal reserve 30 3 46 6 27 5 6 7 109 5 63 5 39 5 Marina 17 2 26 4 17 3 2 2 62 3 38 3 16 2 Municipal park 26 3 10 1 12 2 0 0 48 2 16 1 30 4 Conservation area 20 2 8 1 17 3 4 5 49 2 32 3 17 2 Private campground 10 1 11 2 10 2 0 0 31 1 15 1 13 2 Private residence 8 1 10 1 7 1 3 3 28 1 5 <1 18 2 National park 6 1 4 1 7 1 1 1 18 1 5 <1 13 2 All other locations 298 34 452 63 340 61 53 62 1,143 51 675 53 406 48 Unknown 128 15 72 10 59 11 4 5 263 12 158 12 84 10 Accompaniment Alone 218 25 186 26 157 28 29 34 590 26 334 26 207 25 ≥1 adult companions 509 58 437 61 326 59 51 59 1,323 59 770 60 492 59 ≥1 adults and minors 52 6 52 7 24 4 1 1 129 6 98 8 31 4 ≥1 minors 38 4 15 2 18 3 2 2 73 3 22 2 48 6 ≥1 adult bystanders 19 2 12 2 4 1 1 1 36 2 21 2 14 2 Others‐age unknown 26 3 15 2 24 4 0 0 65 3 22 2 40 5 Unknown 11 1 1 <1 2 <1 2 2 16 1 7 1 6 1 * Includes boating during recreation and daily life † Includes drownings and immersion hypothermia deaths ‡ In 120 cases it was unknown if the boat was powered or unpowered; they were excluded from the two right columns
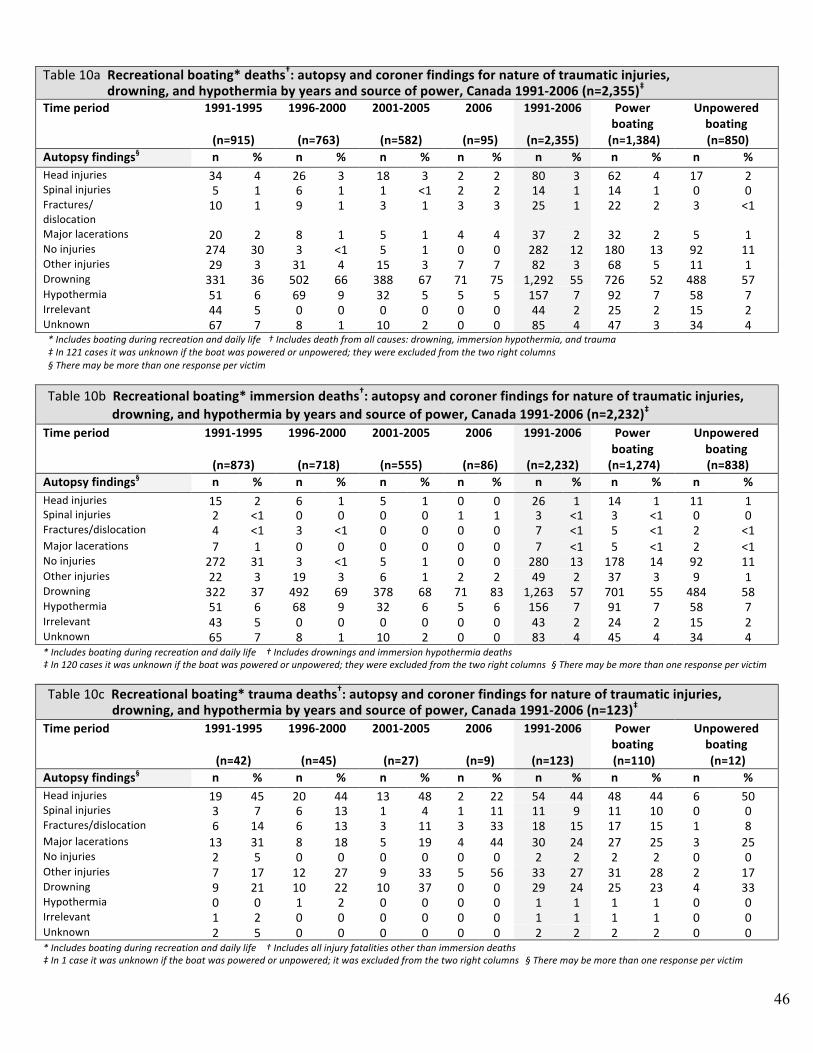
46
Table 10a Recreational boating* deaths†: autopsy and coroner findings for nature of traumatic injuries,
drowning, and hypothermia by years and source of power, Canada 1991‐2006 (n=2,355)‡ Time period 1991‐1995
(n=915)
1996‐2000
(n=763)
2001‐2005
(n=582)
2006
(n=95)
1991‐2006
(n=2,355)
Power boating
(n=1,384)
Unpowered boating (n=850)
Autopsy findings§ n % n % n % n % n % n % n % Head injuries 34 4 26 3 18 3 2 2 80 3 62 4 17 2 Spinal injuries 5 1 6 1 1 <1 2 2 14 1 14 1 0 0 Fractures/ dislocation
10 1 9 1 3 1 3 3 25 1 22 2 3 <1
Major lacerations 20 2 8 1 5 1 4 4 37 2 32 2 5 1 No injuries 274 30 3 <1 5 1 0 0 282 12 180 13 92 11 Other injuries 29 3 31 4 15 3 7 7 82 3 68 5 11 1 Drowning 331 36 502 66 388 67 71 75 1,292 55 726 52 488 57 Hypothermia 51 6 69 9 32 5 5 5 157 7 92 7 58 7 Irrelevant 44 5 0 0 0 0 0 0 44 2 25 2 15 2 Unknown 67 7 8 1 10 2 0 0 85 4 47 3 34 4 * Includes boating during recreation and daily life † Includes death from all causes: drowning, immersion hypothermia, and trauma ‡ In 121 cases it was unknown if the boat was powered or unpowered; they were excluded from the two right columns § There may be more than one response per victim
Table 10b Recreational boating* immersion deaths†: autopsy and coroner findings for nature of traumatic injuries, drowning, and hypothermia by years and source of power, Canada 1991‐2006 (n=2,232)‡
Time period 1991‐1995
(n=873)
1996‐2000
(n=718)
2001‐2005
(n=555)
2006
(n=86)
1991‐2006
(n=2,232)
Power boating
(n=1,274)
Unpowered boating (n=838)
Autopsy findings§ n % n % n % n % n % n % n % Head injuries 15 2 6 1 5 1 0 0 26 1 14 1 11 1 Spinal injuries 2 <1 0 0 0 0 1 1 3 <1 3 <1 0 0 Fractures/dislocation 4 <1 3 <1 0 0 0 0 7 <1 5 <1 2 <1 Major lacerations 7 1 0 0 0 0 0 0 7 <1 5 <1 2 <1 No injuries 272 31 3 <1 5 1 0 0 280 13 178 14 92 11 Other injuries 22 3 19 3 6 1 2 2 49 2 37 3 9 1 Drowning 322 37 492 69 378 68 71 83 1,263 57 701 55 484 58 Hypothermia 51 6 68 9 32 6 5 6 156 7 91 7 58 7 Irrelevant 43 5 0 0 0 0 0 0 43 2 24 2 15 2 Unknown 65 7 8 1 10 2 0 0 83 4 45 4 34 4 * Includes boating during recreation and daily life † Includes drownings and immersion hypothermia deaths ‡ In 120 cases it was unknown if the boat was powered or unpowered; they were excluded from the two right columns § There may be more than one response per victim
Table 10c Recreational boating* trauma deaths†: autopsy and coroner findings for nature of traumatic injuries, drowning, and hypothermia by years and source of power, Canada 1991‐2006 (n=123)‡
Time period 1991‐1995
(n=42)
1996‐2000
(n=45)
2001‐2005
(n=27)
2006
(n=9)
1991‐2006
(n=123)
Power boating (n=110)
Unpowered boating (n=12)
Autopsy findings§ n % n % n % n % n % n % n % Head injuries 19 45 20 44 13 48 2 22 54 44 48 44 6 50 Spinal injuries 3 7 6 13 1 4 1 11 11 9 11 10 0 0 Fractures/dislocation 6 14 6 13 3 11 3 33 18 15 17 15 1 8 Major lacerations 13 31 8 18 5 19 4 44 30 24 27 25 3 25 No injuries 2 5 0 0 0 0 0 0 2 2 2 2 0 0 Other injuries 7 17 12 27 9 33 5 56 33 27 31 28 2 17 Drowning 9 21 10 22 10 37 0 0 29 24 25 23 4 33 Hypothermia 0 0 1 2 0 0 0 0 1 1 1 1 0 0 Irrelevant 1 2 0 0 0 0 0 0 1 1 1 1 0 0 Unknown 2 5 0 0 0 0 0 0 2 2 2 2 0 0 * Includes boating during recreation and daily life † Includes all injury fatalities other than immersion deaths ‡ In 1 case it was unknown if the boat was powered or unpowered; it was excluded from the two right columns § There may be more than one response per victim
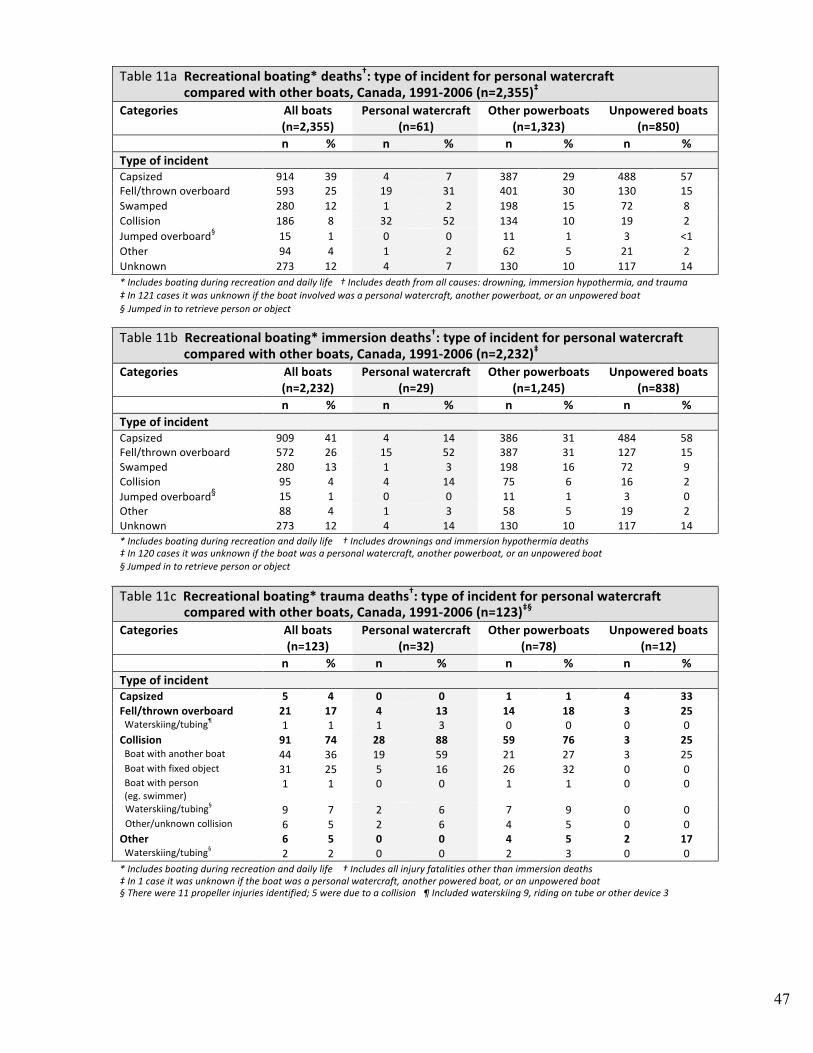
47
Table 11a Recreational boating* deaths†: type of incident for personal watercraft
compared with other boats, Canada, 1991‐2006 (n=2,355)‡ Categories All boats
(n=2,355) Personal watercraft
(n=61) Other powerboats
(n=1,323) Unpowered boats
(n=850) n % n % n % n % Type of incident Capsized 914 39 4 7 387 29 488 57 Fell/thrown overboard 593 25 19 31 401 30 130 15 Swamped 280 12 1 2 198 15 72 8 Collision 186 8 32 52 134 10 19 2 Jumped overboard§ 15 1 0 0 11 1 3 <1 Other 94 4 1 2 62 5 21 2 Unknown 273 12 4 7 130 10 117 14 * Includes boating during recreation and daily life † Includes death from all causes: drowning, immersion hypothermia, and trauma ‡ In 121 cases it was unknown if the boat involved was a personal watercraft, another powerboat, or an unpowered boat § Jumped in to retrieve person or object
Table 11b Recreational boating* immersion deaths†: type of incident for personal watercraft compared with other boats, Canada, 1991‐2006 (n=2,232)‡
Categories All boats (n=2,232)
Personal watercraft (n=29)
Other powerboats (n=1,245)
Unpowered boats (n=838)
n % n % n % n % Type of incident Capsized 909 41 4 14 386 31 484 58 Fell/thrown overboard 572 26 15 52 387 31 127 15 Swamped 280 13 1 3 198 16 72 9 Collision 95 4 4 14 75 6 16 2 Jumped overboard§ 15 1 0 0 11 1 3 0 Other 88 4 1 3 58 5 19 2 Unknown 273 12 4 14 130 10 117 14 * Includes boating during recreation and daily life † Includes drownings and immersion hypothermia deaths ‡ In 120 cases it was unknown if the boat was a personal watercraft, another powerboat, or an unpowered boat § Jumped in to retrieve person or object
Table 11c Recreational boating* trauma deaths†: type of incident for personal watercraft compared with other boats, Canada, 1991‐2006 (n=123)‡§
Categories All boats (n=123)
Personal watercraft (n=32)
Other powerboats (n=78)
Unpowered boats (n=12)
n % n % n % n % Type of incident Capsized 5 4 0 0 1 1 4 33 Fell/thrown overboard 21 17 4 13 14 18 3 25 Waterskiing/tubing¶ 1 1 1 3 0 0 0 0 Collision 91 74 28 88 59 76 3 25 Boat with another boat 44 36 19 59 21 27 3 25 Boat with fixed object 31 25 5 16 26 32 0 0 Boat with person (eg. swimmer)
1 1 0 0 1 1 0 0
Waterskiing/tubing§ 9 7 2 6 7 9 0 0 Other/unknown collision 6 5 2 6 4 5 0 0 Other 6 5 0 0 4 5 2 17 Waterskiing/tubing§ 2 2 0 0 2 3 0 0 * Includes boating during recreation and daily life † Includes all injury fatalities other than immersion deaths ‡ In 1 case it was unknown if the boat was a personal watercraft, another powered boat, or an unpowered boat § There were 11 propeller injuries identified; 5 were due to a collision ¶ Included waterskiing 9, riding on tube or other device 3
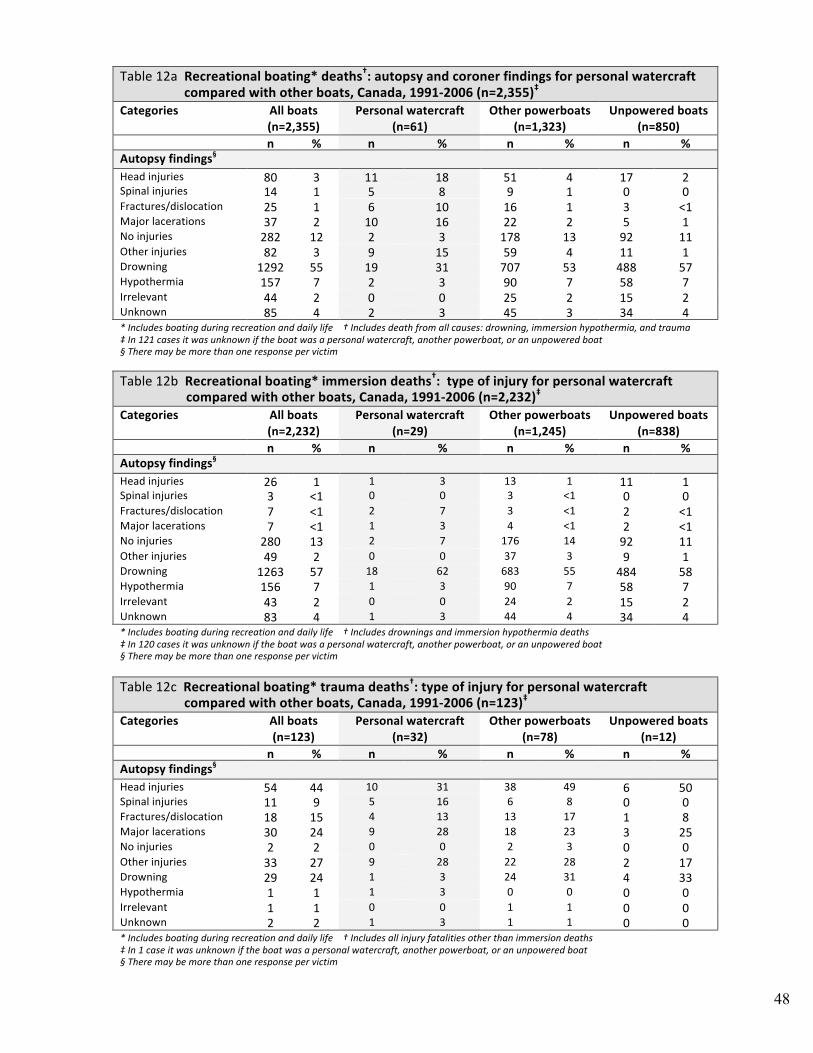
48
Table 12a Recreational boating* deaths†: autopsy and coroner findings for personal watercraft
compared with other boats, Canada, 1991‐2006 (n=2,355)‡ Categories All boats
(n=2,355) Personal watercraft
(n=61) Other powerboats
(n=1,323) Unpowered boats
(n=850) n % n % n % n % Autopsy findings§ Head injuries 80 3 11 18 51 4 17 2 Spinal injuries 14 1 5 8 9 1 0 0 Fractures/dislocation 25 1 6 10 16 1 3 <1 Major lacerations 37 2 10 16 22 2 5 1 No injuries 282 12 2 3 178 13 92 11 Other injuries 82 3 9 15 59 4 11 1 Drowning 1292 55 19 31 707 53 488 57 Hypothermia 157 7 2 3 90 7 58 7 Irrelevant 44 2 0 0 25 2 15 2 Unknown 85 4 2 3 45 3 34 4 * Includes boating during recreation and daily life † Includes death from all causes: drowning, immersion hypothermia, and trauma ‡ In 121 cases it was unknown if the boat was a personal watercraft, another powerboat, or an unpowered boat § There may be more than one response per victim
Table 12b Recreational boating* immersion deaths†: type of injury for personal watercraft compared with other boats, Canada, 1991‐2006 (n=2,232)‡
Categories All boats (n=2,232)
Personal watercraft (n=29)
Other powerboats (n=1,245)
Unpowered boats (n=838)
n % n % n % n % Autopsy findings§ Head injuries 26 1 1 3 13 1 11 1 Spinal injuries 3 <1 0 0 3 <1 0 0 Fractures/dislocation 7 <1 2 7 3 <1 2 <1 Major lacerations 7 <1 1 3 4 <1 2 <1 No injuries 280 13 2 7 176 14 92 11 Other injuries 49 2 0 0 37 3 9 1 Drowning 1263 57 18 62 683 55 484 58 Hypothermia 156 7 1 3 90 7 58 7 Irrelevant 43 2 0 0 24 2 15 2 Unknown 83 4 1 3 44 4 34 4 * Includes boating during recreation and daily life † Includes drownings and immersion hypothermia deaths ‡ In 120 cases it was unknown if the boat was a personal watercraft, another powerboat, or an unpowered boat § There may be more than one response per victim
Table 12c Recreational boating* trauma deaths†: type of injury for personal watercraft compared with other boats, Canada, 1991‐2006 (n=123)‡
Categories All boats (n=123)
Personal watercraft (n=32)
Other powerboats (n=78)
Unpowered boats (n=12)
n % n % n % n % Autopsy findings§ Head injuries 54 44 10 31 38 49 6 50 Spinal injuries 11 9 5 16 6 8 0 0 Fractures/dislocation 18 15 4 13 13 17 1 8 Major lacerations 30 24 9 28 18 23 3 25 No injuries 2 2 0 0 2 3 0 0 Other injuries 33 27 9 28 22 28 2 17 Drowning 29 24 1 3 24 31 4 33 Hypothermia 1 1 1 3 0 0 0 0 Irrelevant 1 1 0 0 1 1 0 0 Unknown 2 2 1 3 1 1 0 0 * Includes boating during recreation and daily life † Includes all injury fatalities other than immersion deaths ‡ In 1 case it was unknown if the boat was a personal watercraft, another powerboat, or an unpowered boat § There may be more than one response per victim
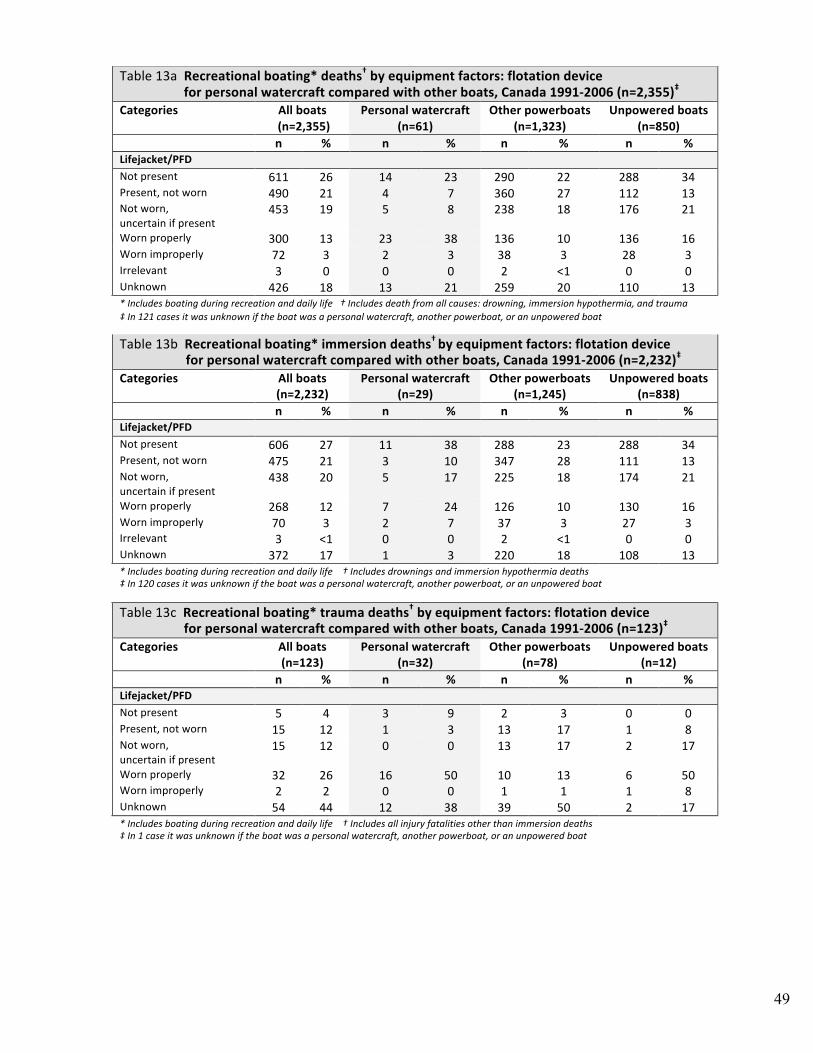
49
Table 13a Recreational boating* deaths† by equipment factors: flotation device
for personal watercraft compared with other boats, Canada 1991‐2006 (n=2,355)‡ Categories All boats
(n=2,355) Personal watercraft
(n=61) Other powerboats
(n=1,323) Unpowered boats
(n=850) n % n % n % n % Lifejacket/PFD Not present 611 26 14 23 290 22 288 34 Present, not worn 490 21 4 7 360 27 112 13 Not worn, uncertain if present
453 19 5 8 238 18 176 21
Worn properly 300 13 23 38 136 10 136 16 Worn improperly 72 3 2 3 38 3 28 3 Irrelevant 3 0 0 0 2 <1 0 0 Unknown 426 18 13 21 259 20 110 13 * Includes boating during recreation and daily life † Includes death from all causes: drowning, immersion hypothermia, and trauma ‡ In 121 cases it was unknown if the boat was a personal watercraft, another powerboat, or an unpowered boat Table 13b Recreational boating* immersion deaths† by equipment factors: flotation device
for personal watercraft compared with other boats, Canada 1991‐2006 (n=2,232)‡ Categories All boats
(n=2,232) Personal watercraft
(n=29) Other powerboats
(n=1,245) Unpowered boats
(n=838) n % n % n % n % Lifejacket/PFD Not present 606 27 11 38 288 23 288 34 Present, not worn 475 21 3 10 347 28 111 13 Not worn, uncertain if present
438 20 5 17 225 18 174 21
Worn properly 268 12 7 24 126 10 130 16 Worn improperly 70 3 2 7 37 3 27 3 Irrelevant 3 <1 0 0 2 <1 0 0 Unknown 372 17 1 3 220 18 108 13 * Includes boating during recreation and daily life † Includes drownings and immersion hypothermia deaths ‡ In 120 cases it was unknown if the boat was a personal watercraft, another powerboat, or an unpowered boat
Table 13c Recreational boating* trauma deaths† by equipment factors: flotation device for personal watercraft compared with other boats, Canada 1991‐2006 (n=123)‡
Categories All boats (n=123)
Personal watercraft (n=32)
Other powerboats (n=78)
Unpowered boats (n=12)
n % n % n % n % Lifejacket/PFD Not present 5 4 3 9 2 3 0 0 Present, not worn 15 12 1 3 13 17 1 8 Not worn, uncertain if present
15 12 0 0 13 17 2 17
Worn properly 32 26 16 50 10 13 6 50 Worn improperly 2 2 0 0 1 1 1 8 Unknown 54 44 12 38 39 50 2 17 * Includes boating during recreation and daily life † Includes all injury fatalities other than immersion deaths ‡ In 1 case it was unknown if the boat was a personal watercraft, another powerboat, or an unpowered boat
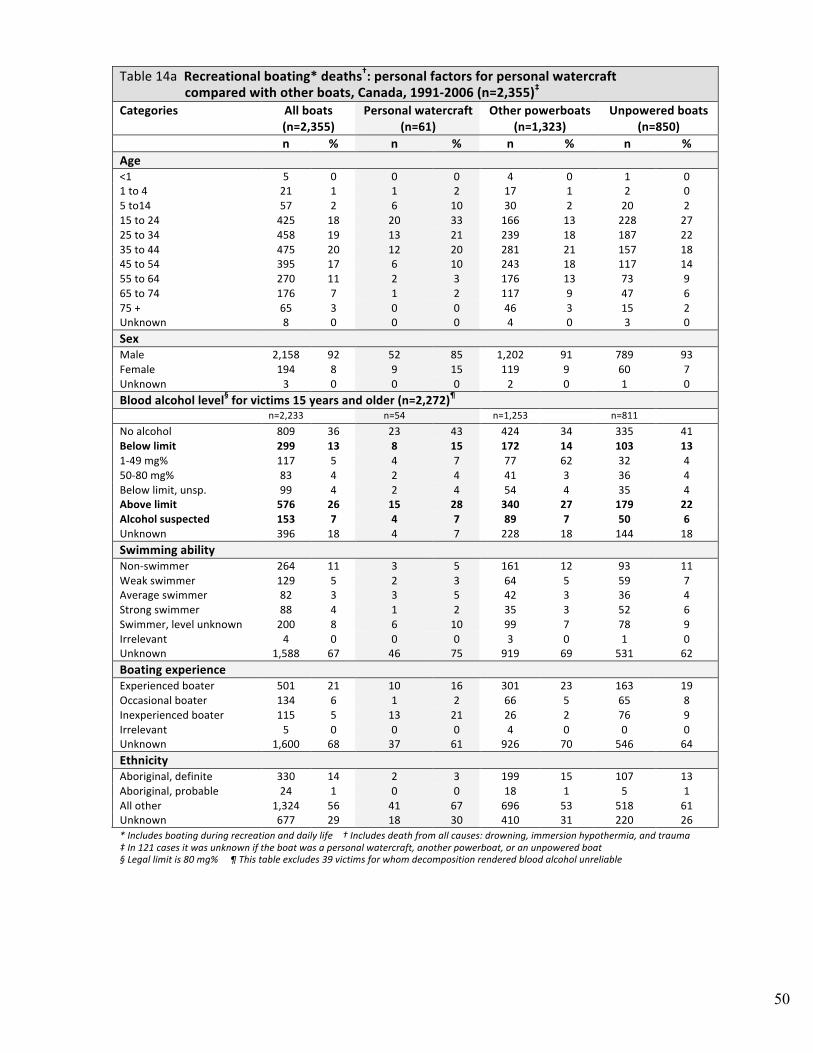
50
Table 14a Recreational boating* deaths†: personal factors for personal watercraft
compared with other boats, Canada, 1991‐2006 (n=2,355)‡ Categories All boats
(n=2,355) Personal watercraft
(n=61) Other powerboats
(n=1,323) Unpowered boats
(n=850) n % n % n % n % Age <1 5 0 0 0 4 0 1 0 1 to 4 21 1 1 2 17 1 2 0 5 to14 57 2 6 10 30 2 20 2 15 to 24 425 18 20 33 166 13 228 27 25 to 34 458 19 13 21 239 18 187 22 35 to 44 475 20 12 20 281 21 157 18 45 to 54 395 17 6 10 243 18 117 14 55 to 64 270 11 2 3 176 13 73 9 65 to 74 176 7 1 2 117 9 47 6 75 + 65 3 0 0 46 3 15 2 Unknown 8 0 0 0 4 0 3 0 Sex Male 2,158 92 52 85 1,202 91 789 93 Female 194 8 9 15 119 9 60 7 Unknown 3 0 0 0 2 0 1 0 Blood alcohol level§ for victims 15 years and older (n=2,272)¶
n=2,233 n=54 n=1,253 n=811
No alcohol 809 36 23 43 424 34 335 41 Below limit 299 13 8 15 172 14 103 13 1‐49 mg% 117 5 4 7 77 62 32 4 50‐80 mg% 83 4 2 4 41 3 36 4 Below limit, unsp. 99 4 2 4 54 4 35 4 Above limit 576 26 15 28 340 27 179 22 Alcohol suspected 153 7 4 7 89 7 50 6 Unknown 396 18 4 7 228 18 144 18 Swimming ability Non‐swimmer 264 11 3 5 161 12 93 11 Weak swimmer 129 5 2 3 64 5 59 7 Average swimmer 82 3 3 5 42 3 36 4 Strong swimmer 88 4 1 2 35 3 52 6 Swimmer, level unknown 200 8 6 10 99 7 78 9 Irrelevant 4 0 0 0 3 0 1 0 Unknown 1,588 67 46 75 919 69 531 62 Boating experience Experienced boater 501 21 10 16 301 23 163 19 Occasional boater 134 6 1 2 66 5 65 8 Inexperienced boater 115 5 13 21 26 2 76 9 Irrelevant 5 0 0 0 4 0 0 0 Unknown 1,600 68 37 61 926 70 546 64 Ethnicity Aboriginal, definite 330 14 2 3 199 15 107 13 Aboriginal, probable 24 1 0 0 18 1 5 1 All other 1,324 56 41 67 696 53 518 61 Unknown 677 29 18 30 410 31 220 26 * Includes boating during recreation and daily life † Includes death from all causes: drowning, immersion hypothermia, and trauma ‡ In 121 cases it was unknown if the boat was a personal watercraft, another powerboat, or an unpowered boat § Legal limit is 80 mg% ¶ This table excludes 39 victims for whom decomposition rendered blood alcohol unreliable
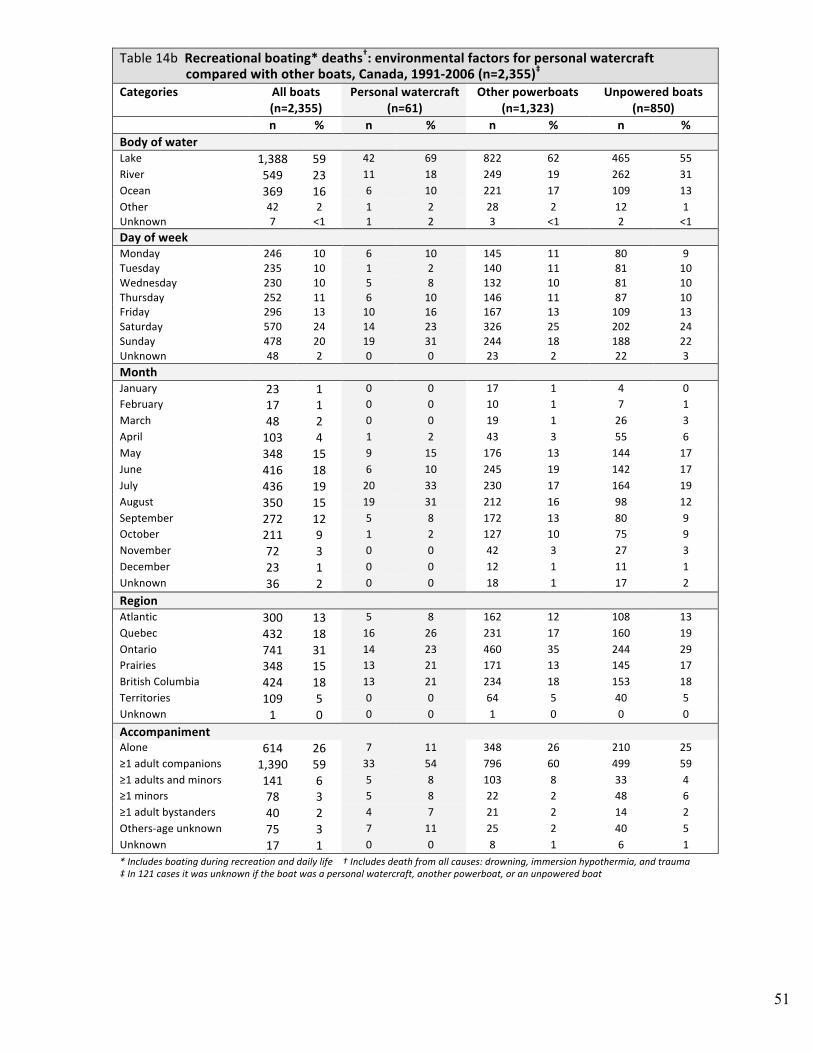
51
Table 14b Recreational boating* deaths†: environmental factors for personal watercraft compared with other boats, Canada, 1991‐2006 (n=2,355)‡
Categories All boats (n=2,355)
Personal watercraft (n=61)
Other powerboats (n=1,323)
Unpowered boats (n=850)
n % n % n % n % Body of water Lake 1,388 59 42 69 822 62 465 55 River 549 23 11 18 249 19 262 31 Ocean 369 16 6 10 221 17 109 13 Other 42 2 1 2 28 2 12 1 Unknown 7 <1 1 2 3 <1 2 <1 Day of week Monday 246 10 6 10 145 11 80 9 Tuesday 235 10 1 2 140 11 81 10 Wednesday 230 10 5 8 132 10 81 10 Thursday 252 11 6 10 146 11 87 10 Friday 296 13 10 16 167 13 109 13 Saturday 570 24 14 23 326 25 202 24 Sunday 478 20 19 31 244 18 188 22 Unknown 48 2 0 0 23 2 22 3 Month January 23 1 0 0 17 1 4 0 February 17 1 0 0 10 1 7 1 March 48 2 0 0 19 1 26 3 April 103 4 1 2 43 3 55 6 May 348 15 9 15 176 13 144 17 June 416 18 6 10 245 19 142 17 July 436 19 20 33 230 17 164 19 August 350 15 19 31 212 16 98 12 September 272 12 5 8 172 13 80 9 October 211 9 1 2 127 10 75 9 November 72 3 0 0 42 3 27 3 December 23 1 0 0 12 1 11 1 Unknown 36 2 0 0 18 1 17 2
Region Atlantic 300 13 5 8 162 12 108 13 Quebec 432 18 16 26 231 17 160 19 Ontario 741 31 14 23 460 35 244 29 Prairies 348 15 13 21 171 13 145 17 British Columbia 424 18 13 21 234 18 153 18 Territories 109 5 0 0 64 5 40 5 Unknown 1 0 0 0 1 0 0 0
Accompaniment Alone 614 26 7 11 348 26 210 25 ≥1 adult companions 1,390 59 33 54 796 60 499 59 ≥1 adults and minors 141 6 5 8 103 8 33 4 ≥1 minors 78 3 5 8 22 2 48 6 ≥1 adult bystanders 40 2 4 7 21 2 14 2 Others‐age unknown 75 3 7 11 25 2 40 5 Unknown 17 1 0 0 8 1 6 1 * Includes boating during recreation and daily life † Includes death from all causes: drowning, immersion hypothermia, and trauma ‡ In 121 cases it was unknown if the boat was a personal watercraft, another powerboat, or an unpowered boat
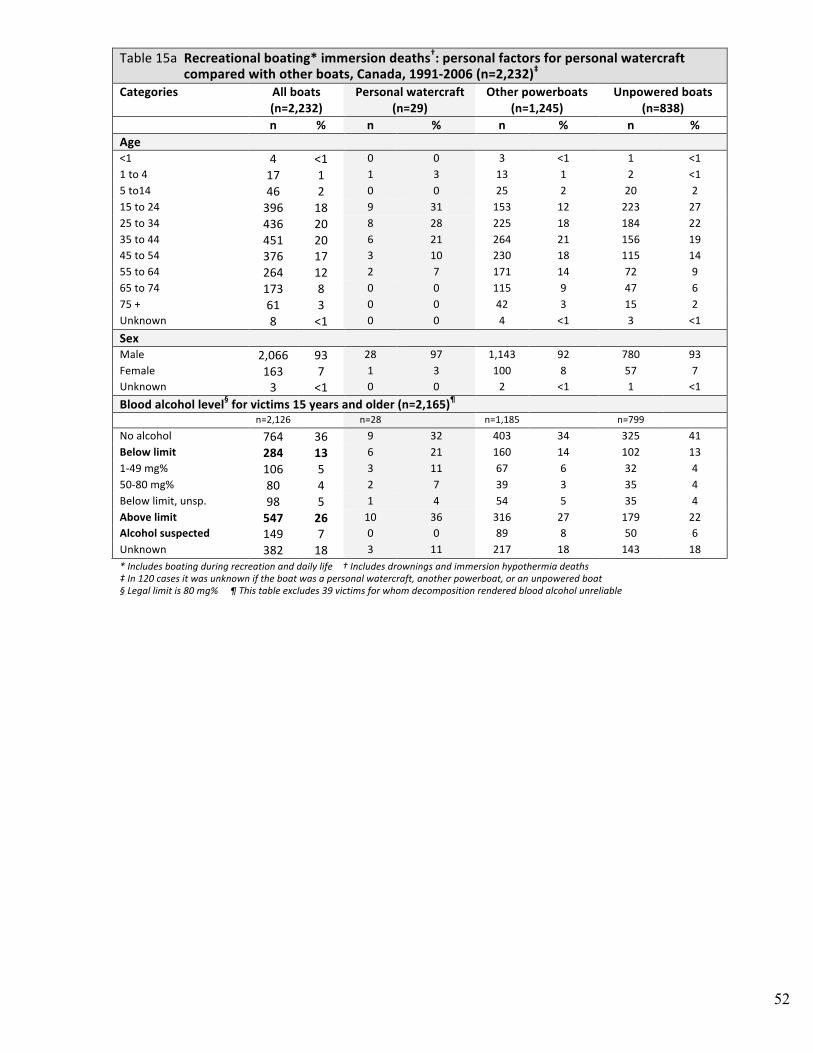
52
Table 15a Recreational boating* immersion deaths†: personal factors for personal watercraft compared with other boats, Canada, 1991‐2006 (n=2,232)‡
Categories All boats (n=2,232)
Personal watercraft (n=29)
Other powerboats (n=1,245)
Unpowered boats (n=838)
n % n % n % n % Age <1 4 <1 0 0 3 <1 1 <1 1 to 4 17 1 1 3 13 1 2 <1 5 to14 46 2 0 0 25 2 20 2 15 to 24 396 18 9 31 153 12 223 27 25 to 34 436 20 8 28 225 18 184 22 35 to 44 451 20 6 21 264 21 156 19 45 to 54 376 17 3 10 230 18 115 14 55 to 64 264 12 2 7 171 14 72 9 65 to 74 173 8 0 0 115 9 47 6 75 + 61 3 0 0 42 3 15 2 Unknown 8 <1 0 0 4 <1 3 <1
Sex Male 2,066 93 28 97 1,143 92 780 93 Female 163 7 1 3 100 8 57 7 Unknown 3 <1 0 0 2 <1 1 <1
Blood alcohol level§ for victims 15 years and older (n=2,165)¶
n=2,126 n=28 n=1,185 n=799 No alcohol 764 36 9 32 403 34 325 41 Below limit 284 13 6 21 160 14 102 13 1‐49 mg% 106 5 3 11 67 6 32 4 50‐80 mg% 80 4 2 7 39 3 35 4 Below limit, unsp. 98 5 1 4 54 5 35 4 Above limit 547 26 10 36 316 27 179 22 Alcohol suspected 149 7 0 0 89 8 50 6 Unknown 382 18 3 11 217 18 143 18 * Includes boating during recreation and daily life † Includes drownings and immersion hypothermia deaths ‡ In 120 cases it was unknown if the boat was a personal watercraft, another powerboat, or an unpowered boat § Legal limit is 80 mg% ¶ This table excludes 39 victims for whom decomposition rendered blood alcohol unreliable
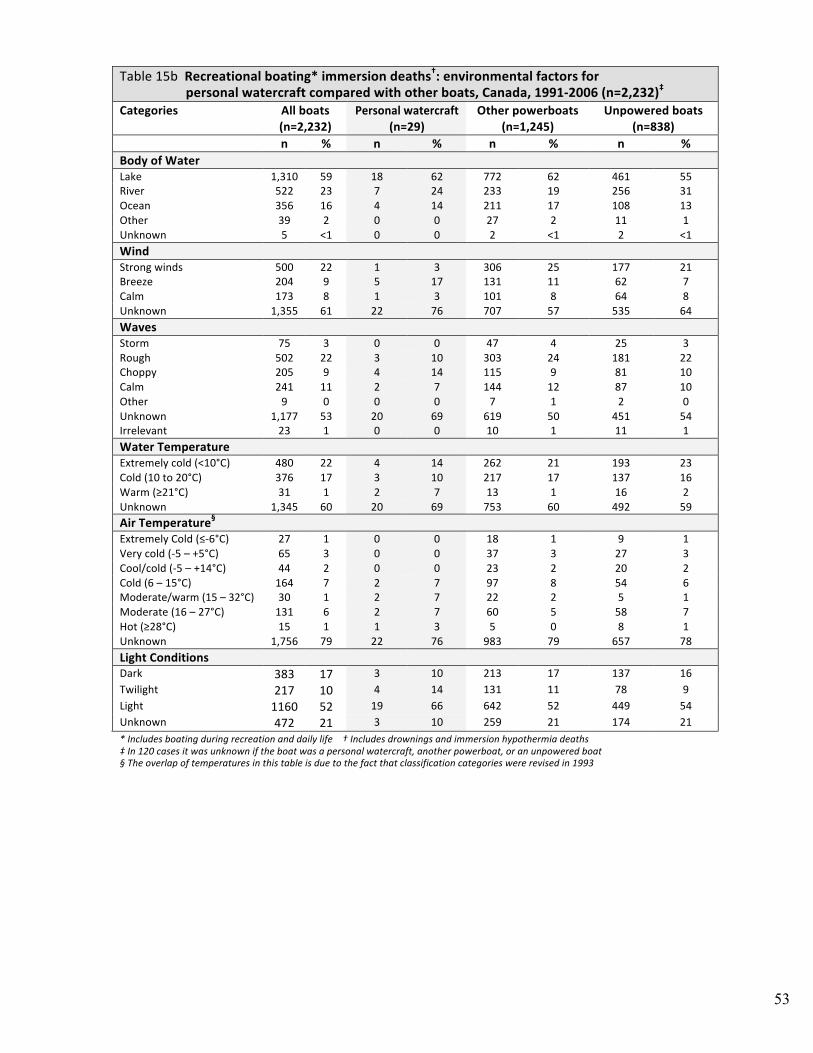
53
Table 15b Recreational boating* immersion deaths†: environmental factors for
personal watercraft compared with other boats, Canada, 1991‐2006 (n=2,232)‡ Categories All boats
(n=2,232) Personal watercraft
(n=29) Other powerboats
(n=1,245) Unpowered boats
(n=838) n % n % n % n % Body of Water Lake 1,310 59 18 62 772 62 461 55 River 522 23 7 24 233 19 256 31 Ocean 356 16 4 14 211 17 108 13 Other 39 2 0 0 27 2 11 1 Unknown 5 <1 0 0 2 <1 2 <1 Wind Strong winds 500 22 1 3 306 25 177 21 Breeze 204 9 5 17 131 11 62 7 Calm 173 8 1 3 101 8 64 8 Unknown 1,355 61 22 76 707 57 535 64 Waves Storm 75 3 0 0 47 4 25 3 Rough 502 22 3 10 303 24 181 22 Choppy 205 9 4 14 115 9 81 10 Calm 241 11 2 7 144 12 87 10 Other 9 0 0 0 7 1 2 0 Unknown 1,177 53 20 69 619 50 451 54 Irrelevant 23 1 0 0 10 1 11 1 Water Temperature Extremely cold (<10°C) 480 22 4 14 262 21 193 23 Cold (10 to 20°C) 376 17 3 10 217 17 137 16 Warm (≥21°C) 31 1 2 7 13 1 16 2 Unknown 1,345 60 20 69 753 60 492 59 Air Temperature§ Extremely Cold (≤‐6°C) 27 1 0 0 18 1 9 1 Very cold (‐5 – +5°C) 65 3 0 0 37 3 27 3 Cool/cold (‐5 – +14°C) 44 2 0 0 23 2 20 2 Cold (6 – 15°C) 164 7 2 7 97 8 54 6 Moderate/warm (15 – 32°C) 30 1 2 7 22 2 5 1 Moderate (16 – 27°C) 131 6 2 7 60 5 58 7 Hot (≥28°C) 15 1 1 3 5 0 8 1 Unknown 1,756 79 22 76 983 79 657 78 Light Conditions Dark 383 17 3 10 213 17 137 16 Twilight 217 10 4 14 131 11 78 9 Light 1160 52 19 66 642 52 449 54 Unknown 472 21 3 10 259 21 174 21 * Includes boating during recreation and daily life † Includes drownings and immersion hypothermia deaths ‡ In 120 cases it was unknown if the boat was a personal watercraft, another powerboat, or an unpowered boat § The overlap of temperatures in this table is due to the fact that classification categories were revised in 1993
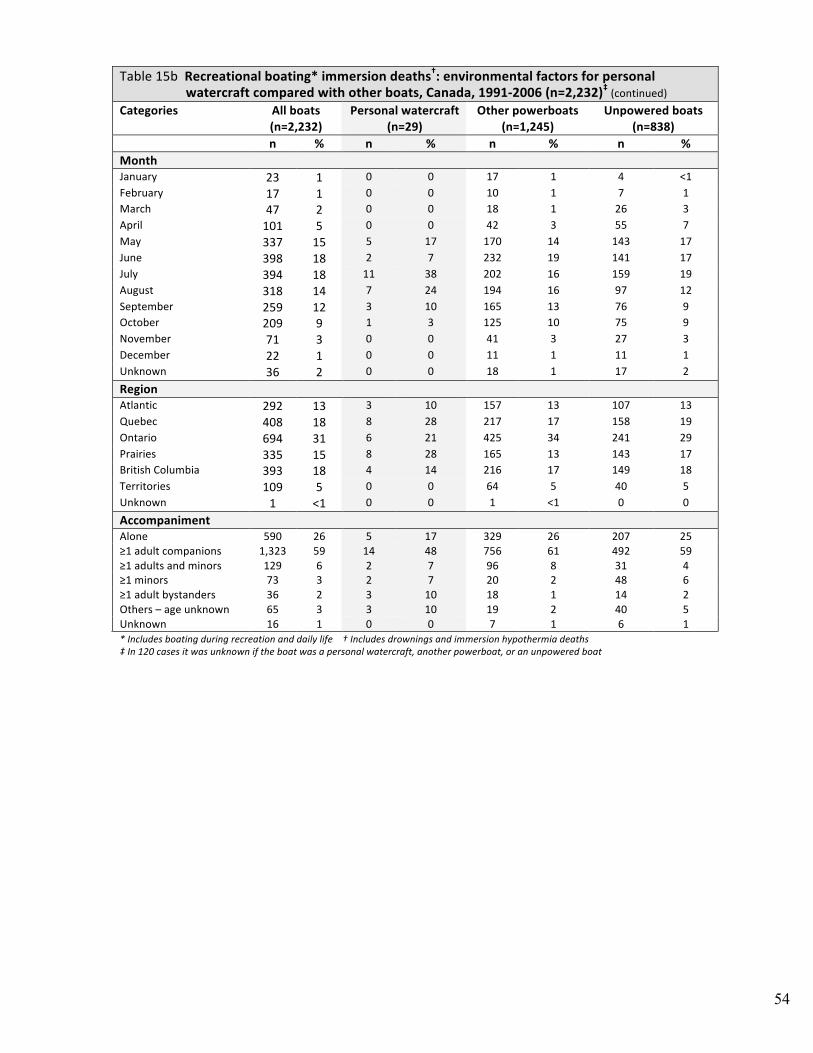
54
Table 15b Recreational boating* immersion deaths†: environmental factors for personal
watercraft compared with other boats, Canada, 1991‐2006 (n=2,232)‡ (continued) Categories All boats
(n=2,232) Personal watercraft
(n=29) Other powerboats
(n=1,245) Unpowered boats
(n=838) n % n % n % n % Month January 23 1 0 0 17 1 4 <1 February 17 1 0 0 10 1 7 1 March 47 2 0 0 18 1 26 3 April 101 5 0 0 42 3 55 7 May 337 15 5 17 170 14 143 17 June 398 18 2 7 232 19 141 17 July 394 18 11 38 202 16 159 19 August 318 14 7 24 194 16 97 12 September 259 12 3 10 165 13 76 9 October 209 9 1 3 125 10 75 9 November 71 3 0 0 41 3 27 3 December 22 1 0 0 11 1 11 1 Unknown 36 2 0 0 18 1 17 2
Region Atlantic 292 13 3 10 157 13 107 13 Quebec 408 18 8 28 217 17 158 19 Ontario 694 31 6 21 425 34 241 29 Prairies 335 15 8 28 165 13 143 17 British Columbia 393 18 4 14 216 17 149 18 Territories 109 5 0 0 64 5 40 5 Unknown 1 <1 0 0 1 <1 0 0
Accompaniment Alone 590 26 5 17 329 26 207 25 ≥1 adult companions 1,323 59 14 48 756 61 492 59 ≥1 adults and minors 129 6 2 7 96 8 31 4 ≥1 minors 73 3 2 7 20 2 48 6 ≥1 adult bystanders 36 2 3 10 18 1 14 2 Others – age unknown 65 3 3 10 19 2 40 5 Unknown 16 1 0 0 7 1 6 1 * Includes boating during recreation and daily life † Includes drownings and immersion hypothermia deaths ‡ In 120 cases it was unknown if the boat was a personal watercraft, another powerboat, or an unpowered boat
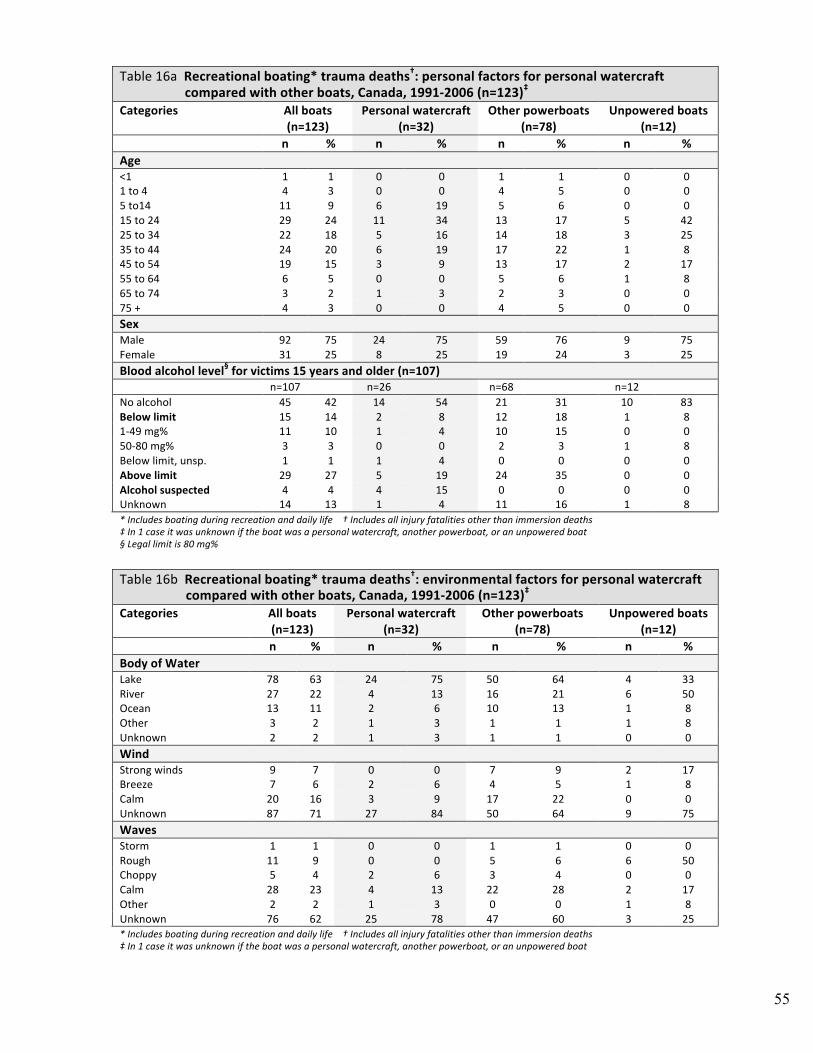
55
Table 16a Recreational boating* trauma deaths†: personal factors for personal watercraft
compared with other boats, Canada, 1991‐2006 (n=123)‡ Categories All boats
(n=123) Personal watercraft
(n=32) Other powerboats
(n=78) Unpowered boats
(n=12) n % n % n % n % Age <1 1 1 0 0 1 1 0 0 1 to 4 4 3 0 0 4 5 0 0 5 to14 11 9 6 19 5 6 0 0 15 to 24 29 24 11 34 13 17 5 42 25 to 34 22 18 5 16 14 18 3 25 35 to 44 24 20 6 19 17 22 1 8 45 to 54 19 15 3 9 13 17 2 17 55 to 64 6 5 0 0 5 6 1 8 65 to 74 3 2 1 3 2 3 0 0 75 + 4 3 0 0 4 5 0 0 Sex Male 92 75 24 75 59 76 9 75 Female 31 25 8 25 19 24 3 25 Blood alcohol level§ for victims 15 years and older (n=107)
n=107 n=26 n=68 n=12 No alcohol 45 42 14 54 21 31 10 83 Below limit 15 14 2 8 12 18 1 8 1‐49 mg% 11 10 1 4 10 15 0 0 50‐80 mg% 3 3 0 0 2 3 1 8 Below limit, unsp. 1 1 1 4 0 0 0 0 Above limit 29 27 5 19 24 35 0 0 Alcohol suspected 4 4 4 15 0 0 0 0 Unknown 14 13 1 4 11 16 1 8 * Includes boating during recreation and daily life † Includes all injury fatalities other than immersion deaths ‡ In 1 case it was unknown if the boat was a personal watercraft, another powerboat, or an unpowered boat § Legal limit is 80 mg% Table 16b Recreational boating* trauma deaths†: environmental factors for personal watercraft
compared with other boats, Canada, 1991‐2006 (n=123)‡ Categories All boats
(n=123) Personal watercraft
(n=32) Other powerboats
(n=78) Unpowered boats
(n=12) n % n % n % n % Body of Water Lake 78 63 24 75 50 64 4 33 River 27 22 4 13 16 21 6 50 Ocean 13 11 2 6 10 13 1 8 Other 3 2 1 3 1 1 1 8 Unknown 2 2 1 3 1 1 0 0 Wind Strong winds 9 7 0 0 7 9 2 17 Breeze 7 6 2 6 4 5 1 8 Calm 20 16 3 9 17 22 0 0 Unknown 87 71 27 84 50 64 9 75 Waves Storm 1 1 0 0 1 1 0 0 Rough 11 9 0 0 5 6 6 50 Choppy 5 4 2 6 3 4 0 0 Calm 28 23 4 13 22 28 2 17 Other 2 2 1 3 0 0 1 8 Unknown 76 62 25 78 47 60 3 25 * Includes boating during recreation and daily life † Includes all injury fatalities other than immersion deaths ‡ In 1 case it was unknown if the boat was a personal watercraft, another powerboat, or an unpowered boat
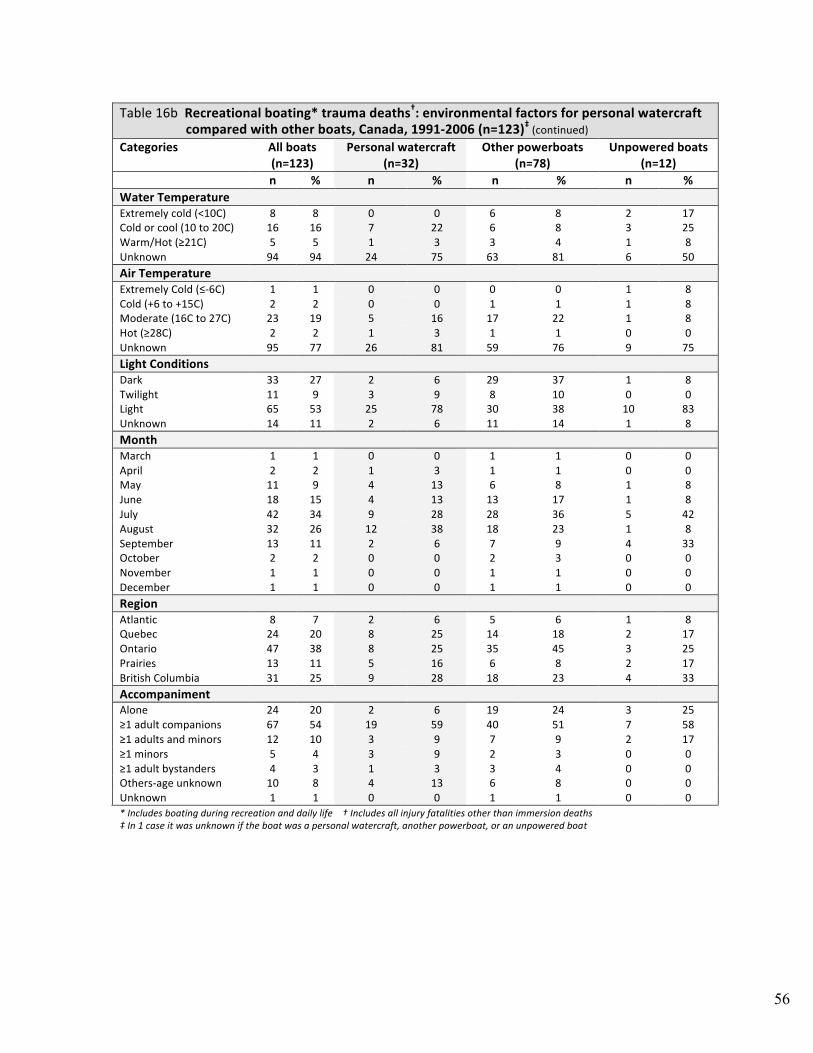
56
Table 16b Recreational boating* trauma deaths†: environmental factors for personal watercraft
compared with other boats, Canada, 1991‐2006 (n=123)‡ (continued) Categories All boats
(n=123) Personal watercraft
(n=32) Other powerboats
(n=78) Unpowered boats
(n=12) n % n % n % n % Water Temperature Extremely cold (<10C) 8 8 0 0 6 8 2 17 Cold or cool (10 to 20C) 16 16 7 22 6 8 3 25 Warm/Hot (≥21C) 5 5 1 3 3 4 1 8 Unknown 94 94 24 75 63 81 6 50 Air Temperature Extremely Cold (≤‐6C) 1 1 0 0 0 0 1 8 Cold (+6 to +15C) 2 2 0 0 1 1 1 8 Moderate (16C to 27C) 23 19 5 16 17 22 1 8 Hot (≥28C) 2 2 1 3 1 1 0 0 Unknown 95 77 26 81 59 76 9 75 Light Conditions Dark 33 27 2 6 29 37 1 8 Twilight 11 9 3 9 8 10 0 0 Light 65 53 25 78 30 38 10 83 Unknown 14 11 2 6 11 14 1 8 Month March 1 1 0 0 1 1 0 0 April 2 2 1 3 1 1 0 0 May 11 9 4 13 6 8 1 8 June 18 15 4 13 13 17 1 8 July 42 34 9 28 28 36 5 42 August 32 26 12 38 18 23 1 8 September 13 11 2 6 7 9 4 33 October 2 2 0 0 2 3 0 0 November 1 1 0 0 1 1 0 0 December 1 1 0 0 1 1 0 0 Region Atlantic 8 7 2 6 5 6 1 8 Quebec 24 20 8 25 14 18 2 17 Ontario 47 38 8 25 35 45 3 25 Prairies 13 11 5 16 6 8 2 17 British Columbia 31 25 9 28 18 23 4 33 Accompaniment Alone 24 20 2 6 19 24 3 25 ≥1 adult companions 67 54 19 59 40 51 7 58 ≥1 adults and minors 12 10 3 9 7 9 2 17 ≥1 minors 5 4 3 9 2 3 0 0 ≥1 adult bystanders 4 3 1 3 3 4 0 0 Others‐age unknown 10 8 4 13 6 8 0 0 Unknown 1 1 0 0 1 1 0 0 * Includes boating during recreation and daily life † Includes all injury fatalities other than immersion deaths ‡ In 1 case it was unknown if the boat was a personal watercraft, another powerboat, or an unpowered boat
D I S C U S S I O N A N D R E C O M M E N D A T I O N S
57
OVERVIEW OF ACTIVITIES & RISK FACTORS FOR ALL BOATS
Boating accounted for an estimated total of nearly 3,000 injury deaths in Canada during1991-2006, of which the purpose of activity was 85% recreational, including activities of daily life, 12% occupational, and the remainder other purposes such as rescue. For recreational boating, 95% of deaths resulted from immersion including drowning with or without cold exposure, and 5% by trauma such as head injury from incidents such as collisions and falls. Boating was associated with about 40% of water-related injurydeaths (excluding land and air transport). Thus boating is by far the most frequent type of activity leading to water-related injury fatality in Canada.
RECREATIONAL BOATING
For recreational boating, deaths associated with powerboats accounted for 59% of deathsand unpowered boats for 36%; for the remaining 5% it was unknown whether the boat was powered or unpowered. The most frequent recreational boating activity was fishing,accounting for 36% of immersion deaths. Other activities included powerboating 22%,canoeing 14%, boat travel 7%, hunting 7%, sailing 3%, kayaking 3%, rafting 1% andother/unknown 7%.
The type of incident leading to immersion death varied between categories of boating.Type of incident during powered boating included falling overboard 32%, capsizing 31%,swamping 16%, collision 6%, and other/unknown 16%, while for unpowered boatingincidents included capsizing 58%, falling overboard 15%, swamping 9%, collision 2%, and other/unknown 17%. Type of incident also varied between immersion and traumafatalities; while collisions accounted for only 4% of immersion deaths, they resulted in74% of trauma deaths. A disproportionate number of collision deaths involved personalwatercraft (PWCs).
Considering personal factors such as age, sex, and alcohol consumption, the peak of risk for powerboating immersions was a plateau for males between 25 and 74 years, contrastingwith unpowered boating where there was a peak at 15-24 years with deaths tapering offsomewhat for older age groups. Children under 15 years accounted for only 3% ofimmersion deaths, females of all ages for only 8%. Hence males 15 and older accounted for about 90% of victims, making them the key target group for prevention. On the otherhand, children under 15 accounted for 13% of trauma deaths. Alcohol was associated withnearly 50% of recreational immersion deaths — possibly more, since alcohol was unknownfor 18% of victims, and was more frequently found among powerboaters than non-powerboaters.
As for equipment factors, small powerboats predominated in recreational immersiondeaths, most probably accounting for about 45% considering that most unknown boatswere likely mainly small ones, followed by canoes at 23%. For trauma deaths, smallpowerboats probably accounted for about 40%, PWCs for 26%, and large powerboats forabout 15%. 44% of powerboating trauma fatalities had sustained a head injury, with noreports of helmet use.
Clearly the most fundamental item of safety equipment for prevention of immersion deathsis a properly worn flotation device; this was borne out by the fact that only 12% of allrecreational immersion victims were known to have worn one, including 10% of poweredand 16% of unpowered victims, with another 3% improperly wearing one. Even fewernon-swimmers and weak swimmers were reported to have worn flotation. It is difficult toimagine how a boater experiencing the shock of a fall overboard, capsize, or swamping,especially under the adverse wind, wave, cold water, and light conditions when suchincidents frequently occur, could manage to retrieve and properly don a flotation device.Furthermore, without the initial buoyancy of worn flotation, the first moment ofimmersion could be fatal due to hyperventilation and inhalation of water, as discussedbelow in the section entitled “Understanding hazards and prevention of cold immersion”.Unfortunately, there was no change in the proportion of victims wearing flotation during1991-2006.
D I S C U S S I O N A N D R E C O M M E N D A T I O N S
58
A key environmental factor for boating immersion deaths in Canada is cold water, which has been associated with at least 38% of fatalities. Most recreational incidentsoccurred on lakes, followed by rivers. For lakes and oceans, strong winds and waves arefrequent environmental factors, while current was a factor for at least 60% of deaths inrivers. Wind, waves, extremely cold water, and twilight or darkness were associated withmany recreational boating deaths. 86% of deaths occurred between May and October. Atleast 19% and possibly many more boating immersion victims died within about 50 metres from shore, and should have been able to swim to shore if wearing a flotation device.
The possibility of rescue plus resuscitation was available for only about 1 in 8 victims,emphasizing the importance of personal knowledge and preparedness for pre-event andevent phases of potential injury incidents, especially avoiding boating during adverseconditions, in unsafe boats, and with lack of safety equipment such as properly wornflotation.
As for trends, there was a 27% decrease in the rate of all boating fatalities between1991-1995 and 1996-2000. The trends during 2001-2006 are less clear due to anincreased proportion of deaths missing from the surveillance database during this period,but estimates suggest at least a small decrease.
In summary, the main personal risk factors for boating deaths included ages 15 years andolder, male gender, and alcohol; very few women or children were involved. Failure towear a flotation device was an equipment factor for up to 90% of victims, and for an evenhigher proportion of non-swimmers and those who had consumed alcohol. Importantenvironmental factors were extremely cold water, wind, waves, current and darkness.Fishing was the most frequent activity associated with boating immersion deaths.
ACTIVITIES & RISK FACTORS FOR PERSONAL WATERCRAFT
For all types of boat, immersion (i.e. drowning and/or hypothermia) accounted for 95% of deaths and trauma for only 5%; however, the situation was quite different for PWCs,where trauma accounted for 52% and immersion for 48%. A high proportion of immersiondeaths, 52%, resulted from falling or being ejected from the PWC, whereas for traumadeaths, 88% followed a collision and 12% resulted from falling off the PWC. Nearly half of the incidents resulted from dangerous manoeuvres such as abrupt turns. Collisionsaccounted for 52% of all PWC deaths, suggesting that even when death was attributed toimmersion, victims may have incurred inapparent injuries such as mild traumatic braindamage sufficient to cause drowning.
Considering personal factors, the age profile was younger and more females were involvedthan for other categories of recreational boating; 11% of victims were less than 15 yearsold, 84% were between 5 and 44 years old, and 15% were female.
Alcohol was associated with at least 50% of PWC deaths. For PWC operators, lower levelsof alcohol may be sufficient to trigger a fatal incident, suggesting a higher baseline level ofrisk for this type of boat.
As for equipment factors, PWCs differ from other powerboats in a number of ways. For one thing, boaters ride on rather than in the craft, making them more susceptible to falling off, and more vulnerable to injury in the event of a collision. In addition, this type of boat has no propeller or rudder. Instead, the engine drives a water jet pumpwhich provides both power and steering. Without a rudder, the operator can only steerwhen the throttle is engaged. In the event of a potential collision, the intuitive tendency —particularly for an inexperienced operator — is to cut the gas and turn away from the otherboat or object. But since gas is required for steering, the craft will not turn but simplycontinue on its original trajectory. This lack of off-throttle steering capacity may help toexplain why so many PWC fatalities resulted from collisions.

D I S C U S S I O N A N D R E C O M M E N D A T I O N S
59
PWCs have engines of up to 250 horsepower that can accelerate to 80 km per hour within3 seconds and attain maximum speeds in excess of 100 km per hour, so clearly power andspeed were probable factors in many incidents, although such details are not routinelyrecorded by police and coroners.
Flotation devices were worn properly by 24% of immersion victims, about double that forother boaters; however, the data are based on small numbers. Wearing of flotation was 50%among victims of trauma from collisions and falling off the PWC.
Although the type of flotation device is not specified in police and coroner reports, it isprobable that most were personal flotation devices (PFDs) and not lifejackets, which arecapable of supporting the victim’s mouth and nose clear of the water during temporary loss of consciousness. Helmets were also not routinely mentioned in PWC death reports;however, the high proportion of victims with head injury suggests that few if any worehelmets.
Environment factors such as wind, waves, cold water, current and darkness were rarelyassociated with deaths involving PWCs, compared with other types of boat.
HOW TO AVOID BOATING INJURIES
Sixteen years of research across Canada show that the vast majority of boaters who die —whether in powered or unpowered boats — have neglected basic principles of boatingsafety such as always wearing a flotation device, using protective equipment against coldimmersion, and verifying weather conditions such as wind, waves, and water temperature.It is probable that most victims failed to obtain appropriate training in boating safety, and that many had inadequate swimming skills to cope with unexpected immersion.Furthermore, most victims died of immersion on lakes in small open powerboats andcanoes. Such boats are generally not designed to a standard level of safety so as to facilitatesurvival in adverse wind, wave, and cold conditions. Such conditions can rapidly arise onopen bodies of water such as lakes.
While certain types of boating — such as running river rapids, with its associated hazards— require specialised training, skills, and equipment, most boating deaths result fromneglect of basic principles with which every boater should be familiar, and from poorlydesigned small boats. Most deaths described in this report could have been averted if thefollowing fundamentals had been respected:
• Immersions during boating are sudden unexpected events requiring advance preparationby proper wearing of a comfortable flotation device appropriate to the type of boatingactivity;
• All adverse conditions, especially water temperatures 15°C or less, necessitate wearing of supplementary hypothermia protection;
• Sudden wind, waves and cold arise frequently and are a major threat for boaters far from sheltered waters in lakes and on the ocean; therefore, advance verification ofweather, including wind and wave conditions, is required, and only boats with approveddesigns should be used where such conditions are to be expected;
• River currents, especially when concentrated around rocks, bridge pilings, and inhydraulics at the base of dams, have enormous kinetic energy that can trap the unwary;
• Since many boating deaths occur from unexpected events such as falls into water andwind and waves, operators and passengers who have consumed even small amounts ofalcohol increase their risk. Current federal BAC levels may be adequate. Probably moreimportant is improved enforcement, especially at popular sites for high speedpowerboats including PWCs, and at holiday events where many boats may congregate.
On the other hand, it has been found that errors people make tend to be related to thetype of boat they habitually use (McKnight et al., 2006), as well as to the specific hazardsof different bodies of water. Therefore, general training on key safety issues needs to be
D I S C U S S I O N A N D R E C O M M E N D A T I O N S
60
followed up by specific information and practice for the boat(s) of main interest for thetrainee, and knowledge about issues related to the body of water where boating will occur.In illustration, ocean boaters require navigational skills, and data on tides and currents intheir region, while river boaters must be aware of hazards such as fallen log strainers, damhydraulics, and large rocks, how to avoid them, and what to do if they cannot be avoided.
Effectiveness of educational interventions is not well proven for injury prevention, and they require frequent repetition, so it is not wise to rely on such measures alone. However,swimming training (Brenner et al., 2009) and research-based water safety training(Canadian Red Cross, Module 1, 2006) appear to help prevention of immersion deaths ofchildren, and should help more adult boaters to survive. Boating and swimming instructionshould include practical experience with cold and current in the requirements. Writtenexaminations should be supplemented by research-based training on the hazards of current and of cold immersion and how to prevent problems with them, including thevalue of flotation devices. Piloting and evaluation of water safety training in high schoolsshould be considered for targeting older students, including immigrants who may not havesufficient information about the hazards of cold immersion and river current, swimmingtraining, and flotation devices. Since basic swimming ability is protective against immersiondeaths (Brenner et al., 2009), pilot programmes are needed to test mandatory basic swimtesting at school entry, followed by school-based training sufficient for the student to swima pool length, so as to be able to survive a fall into water, whether from a boat that hascapsized or swamped, or from shore or pool side.
Population-based survey and experimental research is also needed to assess the effect ofcurrent mandatory boating licensing and training requirements on knowledge, attitude,and practices at intervals after testing. It would be helpful if a national database of personstaking current and improved boating examinations and training could be linked withnational coroner data from Statistics Canada to verify training status of deceased boaters.Improved research-based programmes with training in swimming, cold exposure, andcoping with current should be piloted and evaluated.
A structured comprehensive approach to prevention is essential. Modern principles ofinjury prevention include careful assessment of personal, equipment, and environment riskfactors for different time phases of potential injury incidents, including pre-event, event,and post-event phases. Pre-event phase interventions include evidence-based personaltraining of all boaters in open-water boating hazards and skills so that life-threateningimmersions do not occur. A well designed boat can help avoid immersion, and shouldpromote rapid reentry and survival even if immersion occurs. A flotation device is an itemof safety equipment; when worn by a boater, it helps to prevent injury (drowning and/orhypothermia) during an immersion in water due to swamping or capsizing, i.e., the eventphase of an incident. A properly worn and activity-appropriate flotation device is the singlemost valuable and essential item of safety equipment; other safety equipment includes bagswith throw ropes for rescue, and cold-protective equipment such as wet and dry suits toenhance survival of cold water immersions. Post-event phase interventions include personalrescue skills for retrieving boaters safely from high seas or current, and cardiopulmonaryresuscitation (CPR) for revival if needed.
Small open powerboats are the most frequent type of boat associated with recreationalboating fatalities. Such boats are frequently manufactured in stackable form for easytransport and sale. As a result, many include minimal flotation insufficient to keep the boat well out of the water when swamped or overturned, especially with a heavy engineattached and possibly other heavy loads aboard. Such boats also lack design features tofacilitate re-entry and emptying the vessel of water in the event of a swamping, or to get out onto an overturned vessel in order to keep the boater’s body out of cold water. Since wind and waves are frequent on lakes where such boats tend to be used, strict safety requirements should be mandatory and proven by laboratory and field testing.Experimental research should be funded to test different designs of small open fishingboats for such survivability design issues. This could be done at the defence and civilenvironmental labs in Toronto, at other suitable laboratories elsewhere in Canada, or at
D I S C U S S I O N A N D R E C O M M E N D A T I O N S
61
private survival research and training companies such as in Halifax. Field testing under real conditions would also be essential. Safety ratings should then be required based on afull load or preferably a slight overload including engine to simulate real-life conditions,provided to all potential purchasers, and be clearly visible to the operators in large letters.
Other experimental research could include development and evaluation of watertemperature sensors as a research basis for subsequent legislation to make them mandatoryon all standard powerboats, small and large, with visible warnings at 15°C (orange) forsevere cold and 10°C (red) for extreme cold. This could provide a research basis forlegislation. PWCs lose steering capability when power is cut. Some means of steering otherthan the power jet might help to avoid collisions. Research could help with this issue andprovide a basis for legislation. Dead man’s controls not easily disabled are needed for allpowerboats. Experimental research with different designs of dead man’s controls could alsobe complemented by field surveys to verify acceptability, functionality, and use. Population-based survey research could also assess reasons why they are not used, or are disabled bymany boaters. This could provide a sound research basis for legislation and enforcement formandatory use. Other research could focus on energy absorbing padded dashes, operatorareas, possible automatic release safety belts for high speed jetboats and similar modelswhere high energy crashes are to be expected, as well as on the safety of powerboats thathave open bow areas with seating. Similar research on padding and other protectivestructures could be useful for PWCs.
For flotation devices, experiments with users and non-users could help to create designsthat are comfortable and cool enough for different seasons and activities, and others thatoffer at least partial protection in the event of cold weather immersion, while retainingcomfort and functionality for different activities. Field research and programmes for loaneror free or subsidised flotation devices in northern and aboriginal communities should beassessed, and continued or expanded if effective in increasing wearing.
It has been difficult to conduct national epidemiologic research on risk factors andprevention of boating deaths for aboriginal populations with frequent exposure to risk offatalities in water-related activities. All provincial and territorial coroners, particularly in thelargest province of Ontario, should require the collection and making available of data onaboriginal ethnicity in anonymous form for aggregate use in research and prevention ofwater-related injury fatalities.
For traumatic injuries, even momentary minor injury or concussion of the brain ispotentially fatal on the water, so helmets and padded dashboards are needed where a blowto the head is likely, such as for travel on PWCs and other high speed boats, and in kayaksor canoes in high grade rapids. Helmets are already required by all reputable clubs andinstructors for most white water kayaking, rafting and some canoeing. Fatalities involvingPWCs, including immersions and trauma, mainly resulted from collisions. Most passengerson high speed boats, as on motorcycles and snowmobiles, do not wear safety restraints;therefore, helmets should be required as on other high-speed transport where passengersare unrestrained. Head injury could occur from falling off, and a brief loss of consciousnessaccompanied by immersion could be fatal. Therefore, as well as lifejackets, powerboaterswho travel at high speed need helmets that will keep their head out of the water in theevent of brain injury. Our findings confirm that head injuries are frequent among victims ofboating trauma deaths. Hospital studies of trauma among PWC users in the United Statesfound that about half of the victims sustained head injury; mandatory helmet use wasrecommended (Rubin et al., 2003, Jones 2000). Due to many fatal head and multipleinjuries in children and adults on personal watercraft in Canada, helmets should beobligatory, and specialised flotation devices assessed for protection against chest andabdominal injuries.
D I S C U S S I O N A N D R E C O M M E N D A T I O N S
62
PERCEPTION OF RISK
A key issue in prevention is perception of risk for different activities. Actual risk of water-related injury and death per exposure to water tends to be much higher than commonlyperceived. Thus while the risk of death or severe injury from a motor vehicle crash is quitelow per trip, nearly all drivers and passengers in Canada now wear a safety belt and avoidalcohol. On the other hand, people are often seen loading their boat with alcohol, andforgetting to bring or sitting on their flotation devices rather than wearing them. Strangelyenough, the research has shown that non-swimmers were even less likely than otherboating victims to correctly wear flotation — particularly alarming given that manyunpowered boats are small and narrow, and hence relatively unstable and easily capsizable.The lesson for those who train and educate the public is that a first priority should be todiscuss risk perception. Only then can misperceptions be corrected so that each individualhas a realistic appreciation of the risk of injury for boating activities. At that point, thediscussion can move on to risk factors for specific activities and environments, and essentialtraining and equipment. In the end, risk of injury needs to be reduced to a sensible andreasonable level. Otherwise, boating makes no sense.
BOAT SMART
Wearing rates for flotation devices in boats lag far behind those for seatbelts in cars: only12% of recreational boaters who drowned during 1991-2006 were wearing a flotationdevice. This is a major opportunity for prevention by good legislation and enforcement,and of course individual safety practices such as taking time in advance to choose andpurchase an appropriate flotation device for the activity that is planned, to ensure that thedevice is cool and comfortable and will be worn. Nearly all victims of boating drowning aremales 15 years and older, so this is the key target group for prevention. It is best to focuson youth and adult male or family wearing, rather than child wearing; in order to help andprotect any children who may be present in boats, adults first need to protect themselvesby wearing their own flotation.
UNDERSTANDING HAZARDS AND PREVENTION OF COLD IMMERSION
The overall trend for Canada in cold-water boating immersions has been discouraging,with a rate of 0.28 deaths per 100,000 population per year in 1991-1995 and 0.26 during1996-2000 (Canadian Red Cross, Module 2, 2006). It is probable that the only highlyeffective means of bringing about a major reduction in the overall cold-water boatingimmersion death rate is legislation and enforcement to ensure wearing of appropriatepersonal protective equipment. While research-based education and training are essential,on their own they have proven relatively ineffective, as for other injury prevention measuressuch as safety belts in cars.
Users of all boats, especially those who travel on the ocean, large lakes, and fast rivers, and during spring and fall when the hazards of cold immersion are greater, should befamiliar with how to avoid cold immersion and how to respond when it occurs. It is highly recommended that all boaters review Module 2 of the Canadian Red Cross 10-yearresearch, Ice & Cold Water. A brief summary of its main points is reproduced here.
The four stages of death from cold immersion (Brooks/Transport Canada, 2003; Golden& Hervey, 1984), include:
STAGE 1. Gasping and cold shockSTAGE 2. Swimming failureSTAGE 3. HypothermiaSTAGE 4. Post-rescue collapse
D I S C U S S I O N A N D R E C O M M E N D A T I O N S
63
Most cold-water immersion deaths occur during the first two stages, rather than fromgeneralized hypothermia. Knowledge of the effects of these stages is essential forprevention, and should be well understood by all boaters. Unexpected falls frompowerboats are frequent, while unpowered boats are relatively unstable and immersion can occur at any time without warning. Because immersion in cold water at ≤15°C can kill almost immediately without the presence and proper use of flotation equipment, any immersion is potentially fatal and should be avoided if at all possible.
For larger boats, life rafts are strongly recommended to help avoid immersion (Brooks/Transport Canada 2003), but since this is impractical for many small powerboats and mostunpowered boats, flotation is essential to minimize the degree of immersion as well as toprevent submersion of the airways. Prevention of hypothermia is necessary mainly whereimmersion is prolonged, such as during incidents far from shore on large lakes or oceans,or near dangerous rocks and cliffs in rough seas. Prevention of post-rescue collapse afterprolonged immersion involves appropriate handling of a victim during and after rescue.
Since they are least understood and most important for the general public, now considerdetails of stages 1 and 2 of the event phase of cold immersions:
STAGE 1. GASPING/COLD SHOCK Death can occur rapidly during the first few minutes ofimmersion from so-called cold shock. The use of the term “shock” for this stage could bemisleading, since in most types of clinical shock the blood pressure drops dangerously low,whereas in response to cold it can rise very high. It is helpful to remember that the “shock”or stress of sudden immersion in cold water leads to various responses by the body, themost serious of which is involuntary gasping respirations, which, if the airways are belowthe surface when this response occurs, can lead to aspiration of water resulting indrowning. A temporary decrease in or loss of consciousness due to the effects on the brainof rapid deep breathing (hyperventilation) could also be fatal in the context of immersion(Mantoni et al., 2007). Death may also occur as a result of cardiac arrhythmias. Thebiochemical effects of hyperventilation on muscles might also impair the ability to swim or tread water.
STAGE 2. LOSS OF MANUAL PERFORMANCE Next in the time sequence is loss of strength in the limbsdue to cooling of muscles and nerves. Nerves may fail to signal muscle to contract, andmuscle may be unable to contract (Tipton and Golden, 2006). First to go may be the finemuscles of the hands. Ability to hang on to an overturned boat is lost, the individual isunable to perform activities such as putting on or fastening a flotation device, and, moregradually, loses the ability to swim effectively. The effects of stage two may result fromboth local cooling and from the shutdown of blood to the limbs in response to cold. Limb strength is necessary for a person floating in water to help keep the face turned awayfrom wind and waves so that water is not aspirated into the lungs. If the victim is unable to keep the airways above the surface or away from waves, drowning will occur.
On a positive note, it was found in experiments in Sweden and the United Kingdom thatvolunteers were able to swim for at least an hour in water at 10°C, and most swam for 90minutes (Tipton et al., 1999). Even among volunteers who swam for 90 minutes in waterat 10°C, the problem leading to swim failure was not hypothermia, which by definition isgeneralized and affects the core of the body, but rather local muscle cooling of the limbs.Other experiments with swimmers wearing a personal flotation device (PFD) showed thatthey were able to swim an average of 889 metres in water at 14°C and 650 metres at 10°Cbefore swim failure (Wallingford et al., 2000, Kenny et al., 2000). During another study in Canada of both novice and expert swimmers, it was observed that both groups couldswim for about 45 minutes in 10°C water before incapacitation. The expert swimmerscould swim faster and were able to swim an average 1.4 km, compared with 820 m for thenovices, with an average distance for both groups of 1.1 km (Lounsbury 2004, Lounsburyand Ducharme 2005). However, these results may not always apply to an unexpectedinjury incident in dark and/or stormy conditions.
D I S C U S S I O N A N D R E C O M M E N D A T I O N S
64
Now consider some practical implications of the four stages of death from immersion.First, for people who fall into very cold water, protection of the airway from gaspingassociated with sudden exposure to cold is very important. Otherwise, water can be inhaledand drowning initiated rapidly. Thus from a practical perspective, this stage is a phase of gasping/acute drowning and also of sudden cardiovascular effects. For prevention ofsudden drowning, use of appropriate flotation helps keep the body higher and the mouthand nose out of the water to minimize inhalation, i.e., prevents submersion of the headduring this critical phase. Appropriate flotation should also help to avoid submersion of theairways if consciousness or use of muscles is temporarily impaired due to hyperventilation.Such findings provide strong support for mandatory wearing of a flotation device byboaters, since a submersed boater will be at high risk of immediate death before he hasthe opportunity to find and put on a flotation device, a difficult task even in warm water.Specialized flotation devices are now available to boost the body high out of the waterduring this stage of immersion. Other protection of airways such as splashguards has beenrecommended. Better yet is complete avoidance of immersion by use of a life raft.
Whatever the equipment that happens to be available, the victim of a sudden coldimmersion should concentrate on protecting their airway from cold water inhalation until their breathing stabilizes and gasping stops (Ducharme, 2006). This would includeavoiding swimming for a few minutes during the cold shock period, until the massivegasping, rapid breathing, high blood pressure, and rapid heart rate have a chance tosubside. Only then should the individual decide on a course of action.
Practical implications of the sequence of progression and rapidity of loss of strength ofhands and later limbs, known as the incapacitation phase, include the fact that hanging onto an overturned boat is a reasonable survival strategy only if rescue will be rapid. If rescueis delayed, the immersed person will lose the ability to hang on — this can occur within10-15 minutes — or even to keep the face away from wind and waves, and will drown.Unfortunately, with both nerve conduction and muscle contraction blocked, and with noblood flowing to the limbs, mind cannot control matter.
Therefore, if one is immersed in cold water, unable to climb out of the water onto a stableobject, drifting away from shore, and rapid rescue is unlikely, it may be preferable to swimto safety, especially if the distance is not too great, one is a good swimmer, and wearing aflotation device, i.e., immediate self-rescue. Red Cross drowning data support such anapproach (Sawyer and Barss, 1998). As noted above, it may be feasible to swim up to aboutone kilometre in cold water.
On the other hand, if the distance is great and/or rapid rescue by others is known orprobable, the victim should immediately make every effort to get as much of the body as possible out of the water as quickly as possible if there is something to climb onto;although it may feel colder out of the water than in, it is always better to be out of thewater (Tipton and Golden, 2006). If this cannot be achieved in the first 10 to 20 minutesor so, it may rapidly become impossible due to loss of hand and arm strength. Otheroptions include raising the probability of detection and rescue by immediate use of flaresand other measures (Ducharme, 2006). This must be done right away, as the ability toopen and deploy flares is also rapidly lost in cold water. As noted by Ducharme, the goal or ultimate objective is not to preserve body heat, but to move out of the water as quickly aspossible.
Furthermore, since boaters have been found dead on land after surviving an initial coldimmersion, those who travel in isolated conditions should always carry a change of warmdry clothing in a waterproof float bag so that if immersion does occur, dry clothing can be donned immediately upon reaching shore.
D I S C U S S I O N A N D R E C O M M E N D A T I O N S
65
DON’T UNDERESTIMATE CURRENT
Current was a factor in most river drownings involving unpowered boats, and was aprobable factor for many powerboat drownings as well. As with many sources of powerfulkinetic energy, current can be dangerous for boaters who have not dedicated sufficient timeto the study of river currents, and received expert practical training in navigating withcurrent — ferrying their boat or body by setting a proper angle against the current — and in river rescue.
A boater, swimmer or wader who underestimates the power of current can be swept awayin an instant. At best one may be swept into calmer water and escape to shore, at worst betrapped underwater against an immovable object or in recirculating current. Many a riverpaddler who decided to shoot an innocent-looking small dam, or powerboater who gotswept over a dam, has been trapped underwater by the immense power of a recirculatinghydraulic, to be expected at the base of most such man-made structures. Boaters may alsoat times need to walk in current, so must be familiar with the hazards of foot entrapmentwhen moving about on the rocky bottoms of fast-flowing rivers.
Rivers were the site of drowning for 23% of recreational boating deaths, including 19% ofpowered and 31% of unpowered incidents, resulting in at least 549 deaths over 16 years,and probably more. Current is also a factor in some ocean drownings. Effective evidence-based training in how to manage the hazards of current for boating and — since boaterssometimes end up immersed in current unexpectedly — for swimming, wading, and fallsinto water could have helped avert about 25% of boating immersion deaths per year, savingover 500 lives.
Education and training should include the theory of current and the types of scenarios to be expected based on epidemiologic analysis of the determinants of many incidents.Training needs to include how to safely manoeuvre a boat in current, how to avoid hazardssuch as tree/log strainers and dam hydraulics, how to use the power of current for self-rescue, and how to rescue others. Other important issues include the selection and use ofappropriate boats for river, including a smooth rounded bottom with sufficient rocker forrapid turning in current; adequate freeboard or safety skirts so the boat does not fill withwater in turbulent zones; basic safety equipment such as bow and stern ropes; and, forcanoes and kayaks, flotation bags to keep water out and prevent collapse and pinning.Kayakers, canoeists and rafters who run rapids at high levels of difficulty and hazard alsoneed to protect themselves against brain injury from collision with rocks by always wearinga helmet, since even a momentary loss of consciousness can be fatal in water.
Armed with the right knowledge and training, the individual should be much betterprotected during all time phases of injury, including pre-event, event, and post-event. And, of course, the right attitude is essential to avoid unwise risks.
Research-based water safety instruction and swimming instruction on how to deal withcurrent for high school students, and later reinforcement for youth and young adults,represent a grand opportunity for prevention. In our country, covered with innumerablerivers and streams, every Canadian should be able to safely manoeuvre in current when theneed arises.
D I S C U S S I O N A N D R E C O M M E N D A T I O N S
66
SPECIAL OPPORTUNITIES FOR LARGE GAINS IN PREVENTION
There are several major opportunities for prevention of boating fatalities in Canada whichcould limit the suffering of affected families and reduce the enormous costs associated withthese deaths. While all of the above recommendations would be beneficial and mutuallysupportive in many incidents, the single most effective initiative, based on the research,would be the mandatory wearing of appropriate flotation by all recreational boatersat all times, for an annual cost savings of about $330 million. Mandatory wearingwould render enforcement much simpler, since it would be apparent from a distancewhether or not boaters were wearing flotation. (Enforcement of the current regulation ofcarrying flotation devices in the boat is difficult, since officers must stop the boat and ask tosee the flotation devices. Such enforcement is intrusive, time consuming, and impractical.)
To support this intervention:
• Legislation and enforcement for wearing of a flotation device should include all boats,except perhaps when at anchor or tied up at a wharf. Legislation should include driftingboats, since persons who fall or jump into the water are often unable to regain a driftingboat;
• Operators need to be legally responsible for PFD-wearing by all occupants. For unstablesmall boats such as canoes and kayaks, wearing a PFD at all times is especially critical.Special emphasis and enforcement is necessary for adult males;
• Shops selling flotation devices for all boaters should be required to stock both models for inactive boating (powerboats) and active boating (at least canoeing). For PWCs,specialised models may be needed to help protect from chest and abdominal trauma inhigh speed crashes;
• Comfortable models suitable for hot weather, and others when water temperatures areextremely low, should be available where flotation devices are sold. Cold water modelscould be required early in the season when water temperatures are cold. Specific designsfor kayaking and other activities such as rowing of racing shells could be sold at morespecialised shops.
CONCLUSION
From the above, it is clear that by an appropriate combination of preventive measures, the vast majority of boating deaths could be prevented. Since most boating victims wereeconomically active young to middle-aged adult males, a conservative estimate of theaverage economic loss per victim would be about $2 million direct and indirect costs,including human capital losses of lifetime family earnings, for a total loss of $6 billionduring the period, nearly $400 million per year. If even a proportion of such losses wereallocated by government to research-based prevention, evaluation, training, and education,and especially to legislation and enforcement of flotation-wearing, the economic return oninvestment would be great.
R E F E R E N C E S
67
Barss P (1994). Drownings Among Recreational Boaters in Canada: A Problem of MaleAdults in Small Powerboats and Canoes. Ottawa, ON: The Canadian Red Cross Society.Special Research Report (also published in French).
Barss P, Smith GS, Baker SP, Mohan D (1998). The Epidemiologic Basis for InjuryPrevention. In: Injury Prevention: An International Perspective. Epidemiology,Surveillance, & Policy, pp. 12-25. New York: Oxford University Press.
Brenner RA, Taneja GS, Haynie DL, Trumble AC, Qian C, Klinger RM, Klebanoff MA(2009). Association Between Swimming Lessons and Drowning in Childhood: A Case-Control Study. Arch Pediatr Adolesc Med 163(3):203-210.
Canadian Red Cross (2006). Drownings and Other Water-Related Injuries in Canada: 10 Years of Research. Module 1: Overview. Ottawa, ON: The Canadian Red CrossSociety. Available online at: http://www.redcross.ca/article.asp?id=18117&tid=024f(also published in French).
Canadian Red Cross (2006). Drownings and Other Water-Related Injuries in Canada: 10 Years of Research. Module 2: Ice & Cold Water. Ottawa, ON: The Canadian RedCross Society. Available online at: http://www.redcross.ca/article.asp?id=18117&tid= 024f (also published in French).
Canadian Red Cross (2009). Drownings and Other Water-Related Injuries in Canada: 10 Years of Research. Module 3: Boating and Powerboats. Ottawa, ON: The CanadianRed Cross Society. Available online at: http://www.redcross.ca/article.asp?id= 18117&tid= 024f (also published in French).
Canadian Red Cross (2009). Drownings and Other Water-Related Injuries in Canada: 10 Years of Research. Module 4: Unpowered Boating. Ottawa, ON: The Canadian RedCross Society. Available online at: http://www.redcross.ca/article. asp?id=18117&tid= 024f (also published in French).
Canadian Red Cross (2009). Drownings and Other Water-Related Injuries in Canada: 10 Years of Research. Module 5: Fishing. Ottawa, ON: The Canadian Red Cross Society.Available online at: http://www.redcross.ca/article.asp?id=18117&tid=024f (also published in French).
Ducharme MB, Lounsbury DS (2007). Self-rescue swimming in cold water: the latestadvice. Appl. Physiol. Nutr. Metab 32(4):799–807.
Golden FStC, Hervey GR (1981). The ‘after-drop’ and death after rescue from immersionin cold water. In Adam J (Ed.), Hypothermia Ashore and Afloat. UK: Pergamon Press.Cited in: Brooks CJ, Howard KA, Neifer SK (2005). How much did cold shock andswimming failure contribute to drowning deaths in the fishing industry in BritishColumbia 1976-2002. Occup Med (Lond) 55:459-462.
Haddon W (1980). Advances in the epidemiology of injuries as a basis for public policy.Public Health Rep 95:411-441.
Jones CS (2000). Epidemiology of personal watercraft-related injury on Arkansaswaterways, 1994-1997: identifying priorities for prevention. Accid Anal Prev 32(3):373-6.
Kenny GP, Reardon FD, Ducharme MB, Oksa J (2001). Physiological limitation toswimming in cold water. Toronto: DCIEM, DCIEM Contract Report, 2001-026.Cited in: Ducharme M (2006). Self-Rescue During Accidental Cold Water Immersion.In: Bierens JJLM (Ed.). Handbook on Drowning. Prevention Rescue Treatment,pp. 232-235. Berlin: Springer-Verlag.
Lounsbury DS (2004). Swimming survival – performance and judgement in cold water[MSc thesis]. Toronto: University of Toronto.
Lounsbury DS, Ducharme MB (2005). Self-rescue strategies during accidental cold water immersion: performance and thermal considerations. Proceedings of 11th International Conference on Environmental Ergonomics, 22-26 May, pp. 553-556). Holmer I, Kuklane K, Gao C (Eds.), Ystad, Sweden: Lund University.
R E F E R E N C E S
68
Mantoni T, Belhage B, Pedersen LM, Pott FC (2007). Reduced cerebral perfusion onsudden immersion in ice water: a possible cause of drowning. Aviat Space Environ Med78:374-376.
McKnight AJ, Becker WW, Pettit AJ, McKnight AS (2006). Human error in recreationalboating. Accid Anal Prev ePUb.
Rubin LE, Stein PB, DiScala C, Grottkau BE (2003). Pediatric trauma caused by personalwatercraft: a ten-year retrospective. J Pediatr Surg 38(10):1525-1529.
Sawyer S, Barss P (1998). Stay with the boat or swim for shore? A comparison of drowningvictim and survivor responses to immersion following a capsize or swamping [Abstract].Amsterdam, The Netherlands: Proceedings of the Fourth World Conference on InjuryPrevention and Control. 17-20 May 1998.
Tipton M, Ducharme M (2006). Rescue Collapse Following Cold Water Immersion. In: Bierens JJLM (Ed.), Handbook on Drowning. Prevention Rescue Treatment,pp. 493-496. Berlin: Springer-Verlag.
Tipton M, Eglin C, Gennser M, Golden F (1999). Immersion deaths and deteriorationin swimming performance in cold water. Lancet 354(7179):626-629.
Tipton M, Golden F (2006). The Physiology of Cooling in Cold Water. In: Bierens JJLM (Ed.), Handbook on Drowning. Prevention Rescue Treatment, pp. 485-490. Berlin: Springer-Verlag.
Transport Canada/Brooks CJ (2001). Survival in Cold Waters. Ottawa: Transport Canada – Marine Safety. Available online at: http://www.tc.gc.ca/marinesafety/tp/tp13822/menu.htm.
Wallingford R, Ducharme MB, Pommier E (2000). Factors Limiting Cold-WaterSwimming Distance While Wearing Personal Flotation Devices. Evr J Appl Phsiol82:24-29. Cited in: Transport Canada/Brooks CJ (2001). Survival in Cold Waters.Ottawa: Transport Canada – Marine Safety. Available online at: http://www.tc.gc.ca/marinesafety/ tp/tp13822/executive-sum.htm.
World Health Organisation. International Statistical Classification of Diseases and RelatedHealth Problems, 10th Revision. Tabular List of inclusions and four-charactersubcategories. Chapter XX: External causes of morbidity and mortality, Water transportaccidents (V90-V94). Geneva, Switzerland, Version for 2007. Available online at:http://apps.who.int/classifications/apps/icd/icd10online/ (Accessed 2 August2010)


![Boating - Pleasure Boating - Yachting Industry - Final Report - Ace Global[1]](https://img.dokumen.tips/doc/110x75/577ce6f81a28abf103941100/boating-pleasure-boating-yachting-industry-final-report-ace-global1.jpg)