Embed Size (px)
Citation preview
BME 315 Biomechanics, U. WisconsinMeasurement of Bone Strength and Stiffness using 3-Point Bending
Adapted by R. Lakes from D. Thelen and C. Decker, ’09, adapted from Lakes ’06
Experimental Details
I. Laboratory equipmentThe load frame that we will use to perform our testing is the MTS Sintech Universal Testing
Machine set up in a 3-point bending configuration (Fig. 1). We will use the machine to provide acontrolled, constant rate of deflection at the midpoint between the two supports. A load cell builtinto the crosshead will be used to measure the force applied. The system is interfaced with thelaboratory data acquisition program TestWorks® 4 (Fig. 2), providing for simultaneousmeasurement of deflection and load.
Figure 1: Sintech 10/GL test frame configured for a 3-point bending test.
Figure 2: TestWorks® 4 interface.
BME 315 BiomechanicsMeasurement of Bone Strength and Stiffness using 3-Point Bending
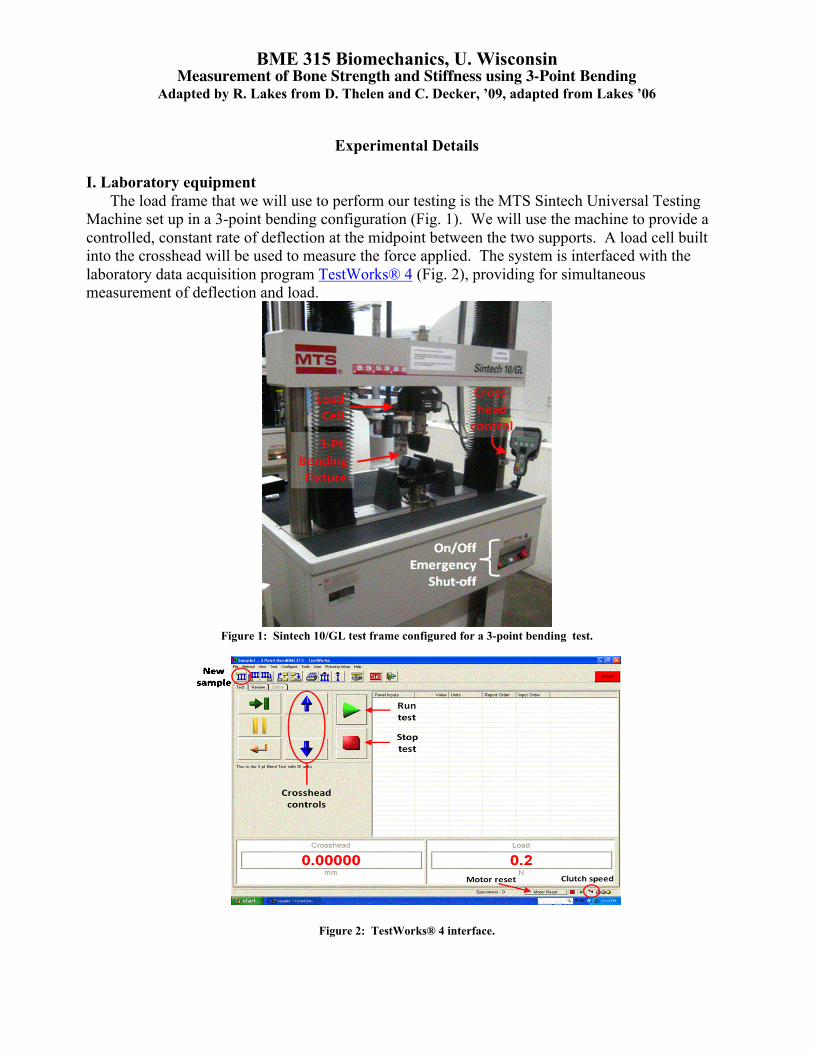
II. Theoretical background3-point bending is a common beam loading situation, with fixed supports under a beam and a
point force in the middle. A free body diagram and the shear and moment diagrams for this loadingdemonstrate that the internal moment reaches a peak value at mid-span (Fig. 3).
Figure 3: Shear force and bending moment (BM) diagrams for 3-point bending with load centered at midpoint [2].
Internal bending moments, M, induce axial stress, σ, in the beam that can be computed using theequation:
(1)
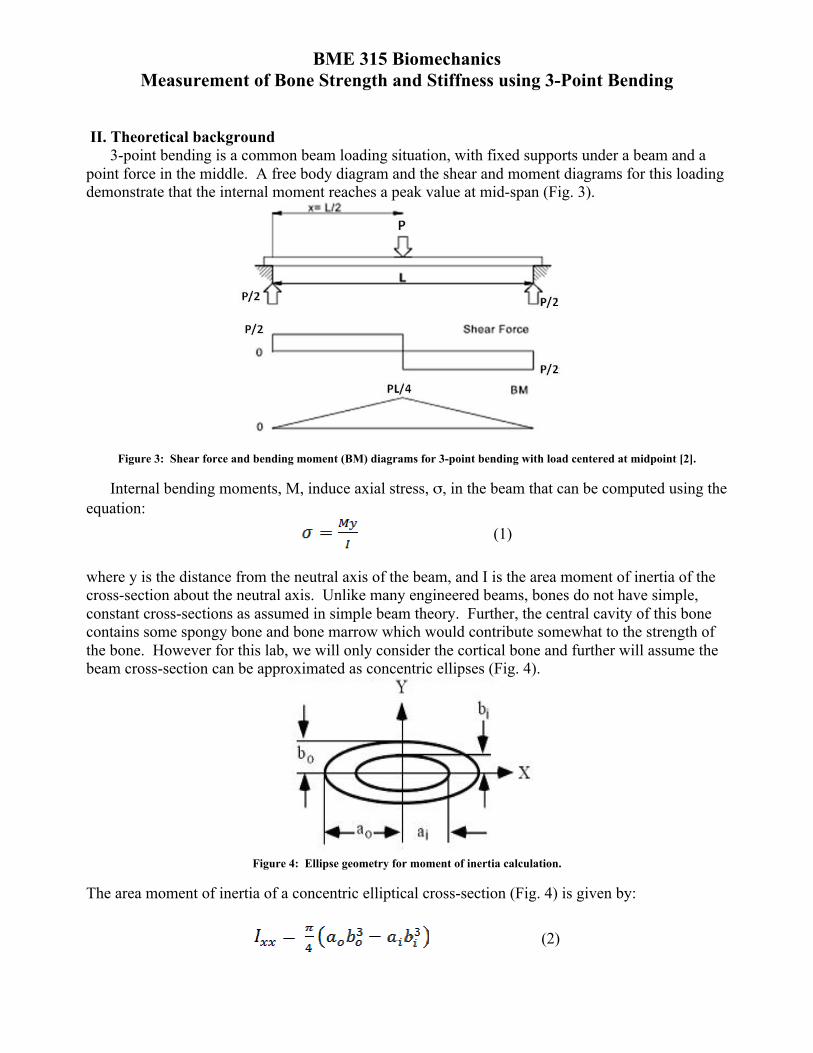
where y is the distance from the neutral axis of the beam, and I is the area moment of inertia of thecross-section about the neutral axis. Unlike many engineered beams, bones do not have simple,constant cross-sections as assumed in simple beam theory. Further, the central cavity of this bonecontains some spongy bone and bone marrow which would contribute somewhat to the strength ofthe bone. However for this lab, we will only consider the cortical bone and further will assume thebeam cross-section can be approximated as concentric ellipses (Fig. 4).
Figure 4: Ellipse geometry for moment of inertia calculation.
The area moment of inertia of a concentric elliptical cross-section (Fig. 4) is given by:
(2)
BME 315 BiomechanicsMeasurement of Bone Strength and Stiffness using 3-Point Bending
From Eq. 1, it follows that the maximum normal stress is found at the maximum distance fromthe neutral axis. We will assume that the neutral axis passes through the midpoint of our specimen,and then set y = bo for calculating the maximum normal (axial) stress.
The elastic equation relating the beam modulus of elasticity E, internal bending moment M, anddeflection v along the length of a beam of constant cross-section is given by:
(3)
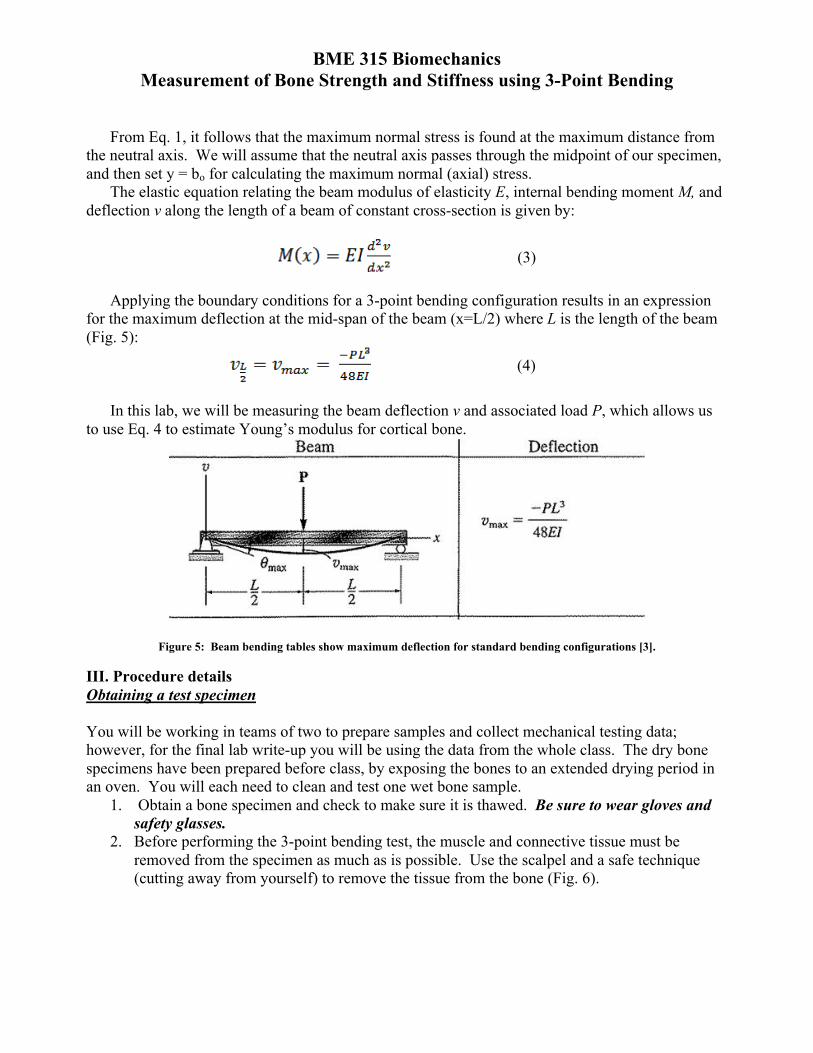
Applying the boundary conditions for a 3-point bending configuration results in an expressionfor the maximum deflection at the mid-span of the beam (x=L/2) where L is the length of the beam(Fig. 5):
(4)
In this lab, we will be measuring the beam deflection v and associated load P, which allows usto use Eq. 4 to estimate Young’s modulus for cortical bone.
Figure 5: Beam bending tables show maximum deflection for standard bending configurations [3].
III. Procedure detailsObtaining a test specimen
You will be working in teams of two to prepare samples and collect mechanical testing data;however, for the final lab write-up you will be using the data from the whole class. The dry bonespecimens have been prepared before class, by exposing the bones to an extended drying period inan oven. You will each need to clean and test one wet bone sample.
1. Obtain a bone specimen and check to make sure it is thawed. Be sure to wear gloves andsafety glasses.
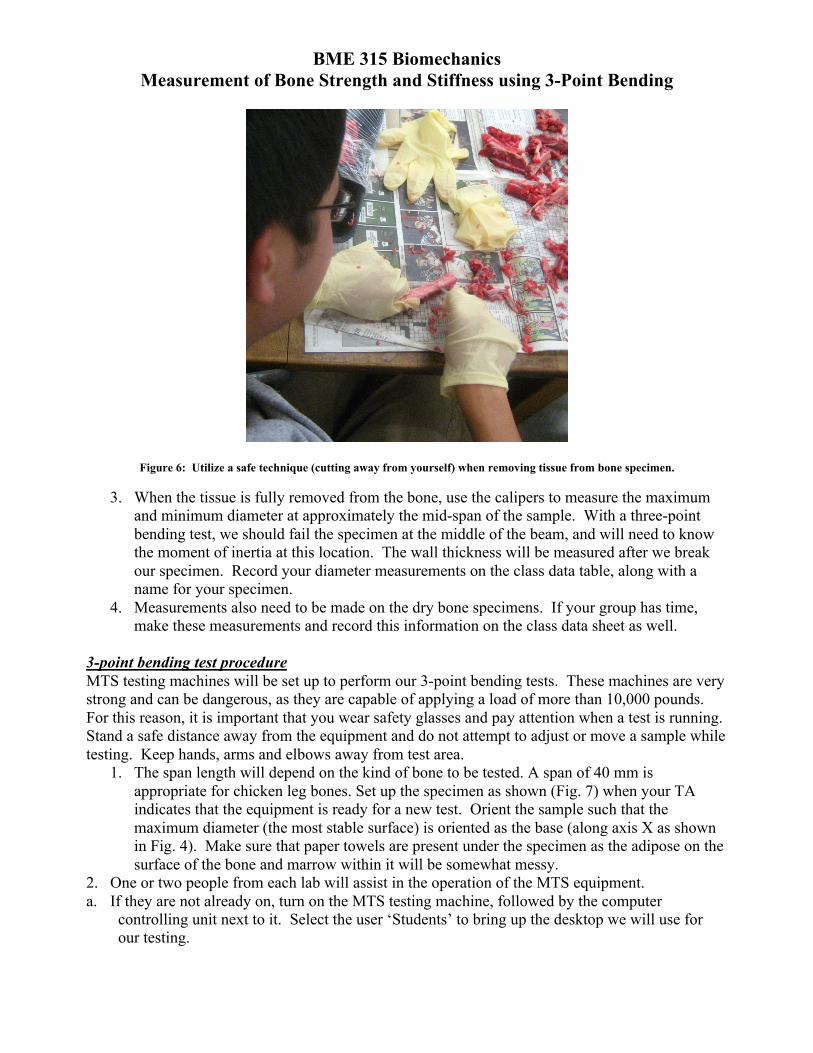
2. Before performing the 3-point bending test, the muscle and connective tissue must beremoved from the specimen as much as is possible. Use the scalpel and a safe technique(cutting away from yourself) to remove the tissue from the bone (Fig. 6).
BME 315 BiomechanicsMeasurement of Bone Strength and Stiffness using 3-Point Bending
Figure 6: Utilize a safe technique (cutting away from yourself) when removing tissue from bone specimen.
3. When the tissue is fully removed from the bone, use the calipers to measure the maximumand minimum diameter at approximately the mid-span of the sample. With a three-pointbending test, we should fail the specimen at the middle of the beam, and will need to knowthe moment of inertia at this location. The wall thickness will be measured after we breakour specimen. Record your diameter measurements on the class data table, along with aname for your specimen.
4. Measurements also need to be made on the dry bone specimens. If your group has time,make these measurements and record this information on the class data sheet as well.
3-point bending test procedureMTS testing machines will be set up to perform our 3-point bending tests. These machines are verystrong and can be dangerous, as they are capable of applying a load of more than 10,000 pounds.For this reason, it is important that you wear safety glasses and pay attention when a test is running.Stand a safe distance away from the equipment and do not attempt to adjust or move a sample whiletesting. Keep hands, arms and elbows away from test area.
1. The span length will depend on the kind of bone to be tested. A span of 40 mm isappropriate for chicken leg bones. Set up the specimen as shown (Fig. 7) when your TAindicates that the equipment is ready for a new test. Orient the sample such that themaximum diameter (the most stable surface) is oriented as the base (along axis X as shownin Fig. 4). Make sure that paper towels are present under the specimen as the adipose on thesurface of the bone and marrow within it will be somewhat messy.
2. One or two people from each lab will assist in the operation of the MTS equipment.a. If they are not already on, turn on the MTS testing machine, followed by the computer
controlling unit next to it. Select the user ‘Students’ to bring up the desktop we will use forour testing.
BME 315 BiomechanicsMeasurement of Bone Strength and Stiffness using 3-Point Bending
b. To conduct a test, open the program TestWorks 4 from the computer desktop if it is not alreadyopen. The login name on the computer is ‘student’ and there is no password.
c. A dropdown window will open from which you should select the file 3PointBendBME315 fromthe folder ‘SMTLab UW MADISON.’ If this dropdown window does not automatically open,you can find it by selecting ‘Open… Open Method’ from the top menu bar.
d. You will indicate to the computer that you will use a new sample each time. To run a newsample select the icon that looks like dog bones (which represent standard tensile specimenbars) in the upper left corner (Fig. 2).
e. To move the crosshead, first select ‘Motor Reset’ from the lower right corner (Fig. 2).f. We first want to zero the load cell. Make sure the load cell is not contacting the specimen or
anything else that might create a load. Click on the ‘Force’ display in the lower right. Rightmouse click to bring up a command window, and select ‘Zero Channel’ to zero the loadreading.
g. When the specimen is set up approximately symmetrically with the diaphysis as the portionbeing tested (Fig. 7), carefully lower the crosshead close to the bone with the computercontrols (Fig. 2). You may operate with the clutch in high when the load foot is far from thespecimen, but you should use a low clutch when the distance is less than 1 cm. It is very easyto accidentally break the specimen when the clutch is in high. The clutch control is found inthe lower right corner of the computer control panel (Fig. 2).
h. Continue to lower the crosshead with the clutch in low until the Force display on screen showsthat a small load of 10 – 20 N has been applied.
i. Click on the ‘Crosshead’ display in the lower left. Right mouse click to bring up a commandwindow, and select ‘Zero Channel’ to zero the displacement reading.
j. You can now initiate the test. The computer will prompt you to enter the geometry of thespecimen, however, it is not necessary to do this as the program is configured to makecalculations for a standard compression or tension test, and not bending. We will be makingour calculations independently after the test is complete. Make sure to enter the specimenname however.
k. When the test begins, the force-deflection curve will display on the computer. Continue the testthrough failure (fracture) of the bone. Click ‘Ok’ to return the crosshead to its originallocation.
NOTE: The testing equipment may stop if it experiences a jump in the load. Testing equipment iscommonly set up like this for safety purposes. If the specimen rotates or experiences a partialfailure, the test equipment may stop. We partially load the specimen before beginning the testto try to prevent this from happening. If this happens, consult with your TA concerning whatto do next.
l. When the specimen has failed, save the data. To save the data select ‘File>Exportpreview>Specimen’ and save the data to the filename that the group selected.
m. Use the computer controls to raise the crosshead. After the crosshead has been raised, thespecimen can be removed.
n. To perform the testing on a new sample, begin with Step 2.d and repeat the procedure.3. Measure the wall thickness of the sample (Fig. 8) and record this information in the class data
sheet, along with other comments concerning the failure. Comments should include if the testslipped, or if the sample did not fail at mid-span. If the failure was not at mid-span, furtherdescribe what occurred.
BME 315 BiomechanicsMeasurement of Bone Strength and Stiffness using 3-Point Bending
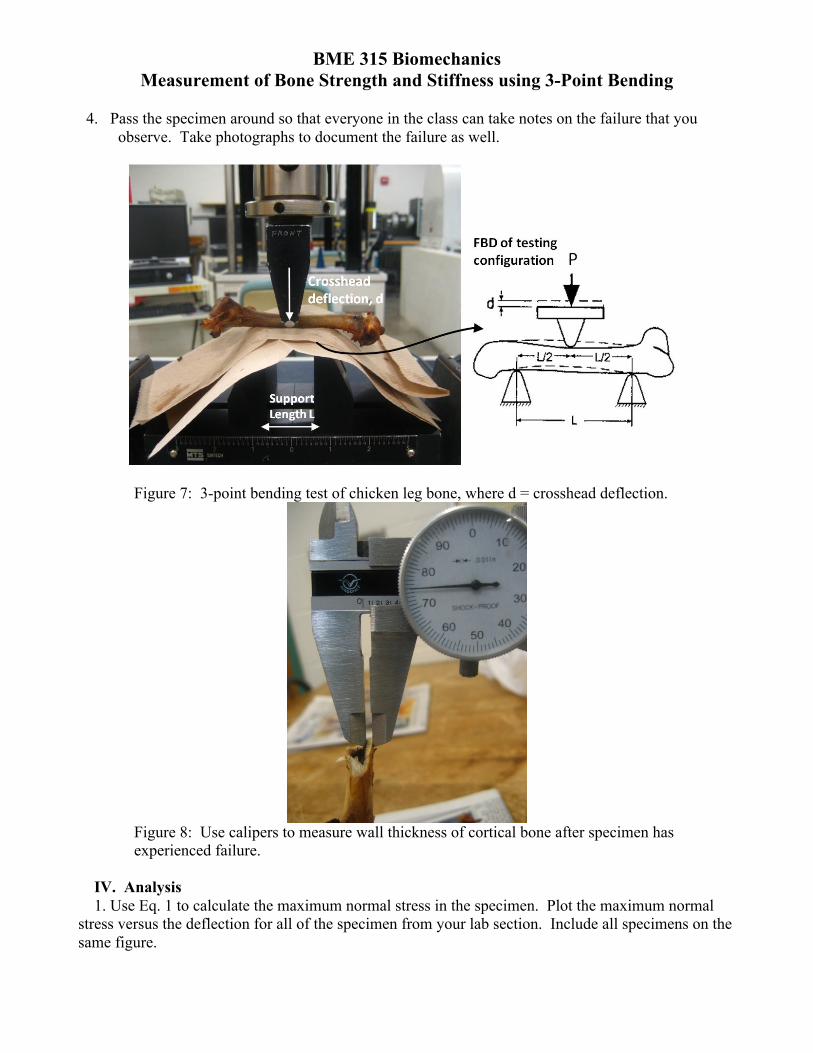
4. Pass the specimen around so that everyone in the class can take notes on the failure that youobserve. Take photographs to document the failure as well.
Figure 7: 3-point bending test of chicken leg bone, where d = crosshead deflection.
Figure 8: Use calipers to measure wall thickness of cortical bone after specimen hasexperienced failure.
IV. Analysis1. Use Eq. 1 to calculate the maximum normal stress in the specimen. Plot the maximum normal
stress versus the deflection for all of the specimen from your lab section. Include all specimens on thesame figure.
BME 315 BiomechanicsMeasurement of Bone Strength and Stiffness using 3-Point Bending
2. Evaluate the normal stress versus deflection curves for each of the specimen and determine theyield strength (end of linear region of the stress/deflection curve) and the ultimate strength (maximumstress). Make a table (to be included in the Appendix of your report) showing the yield and ultimatestrength for each of the specimens.
3. Calculate the average and standard deviation of yield strength and ultimate strength. If there aredata that you feel are outliers (i.e. slippage within the test fixture, failure at a location other than mid-span, etc.) do not include them in your calculation and justify why you chose to do so.
4. Rearrange Eq. 4 to solve for the modulus of elasticity E (Young’s modulus). Determine themodulus of elasticity E (Young’s modulus). Plot the modulus of elasticity versus deflection from thelinear region of the stress versus deflection curve. Include all the specimens on one figure. Be sureto only use the portion of the data in which linearly elastic behavior occurs.Calculate the averagemodulus of elasticity for each specimen (your plots will show a range) and include these values onyour table.
5. Calculate the average and standard deviation of the modulus of elasticity for all of the specimen.Again, if there is an outlier, do not include this in your calculations and justify why you chose to doso.
V. Questions1. How do the values of Young’s modulus, yield strength, and ultimate strength that you
measured compare to values given in your book or other published data? Refer to Lakes [4], Fung[5], Shahnazari [6], and other references you may find. Comment on possible reasons for differencesthat exist.
2. Would you classify the wet bone as brittle or ductile? How about the dry bone? Why is there adifference in material properties between wet and dry bone? Why might one want to know theproperties of both wet and dry bone?
3. Discuss your observations from the tests and the observed failures. Was the failure a result oftensile or compressive stresses? Why?
4. What are the main sources of error in our measurements? Consider some of the assumptionswe made (cross-section geometry, neutral axis, contribution of trabecular bone, slenderness ofspecimen, etc.). How might this affect the calculations we have made?
5. How does the modulus, yield strength, and ultimate strength compare to other materials such assteel and titanium? What are some practical implications of this (i.e. if we are designing jointreplacements or fixturing devices)?
VI. References1. Institute of Applied Mechanics at the University of Paderborn, Germany. Available at
http://www.dhondt.de/examples.htm, accessed on 3/26/10.2. Beardmore, R., “Shear Force and Bending Moment Diagrams,” RoyMech 2009. Available at
http://www.roymech.co.uk/Useful_Tables/Beams/Shear_Bending.html, accessed 6/1/10.3. Hibbeler, R. C. Engineering Mechanics: Statics. Prentice-Hall, Inc., 1995.4. Lakes, R., “Anisotropy of Bone,” University of Wisconsin – Madison, Biomechanics BME 315.
Available at http://silver.neep.wisc.edu/~lakes/BME315Fr.html, accessed 5/17/10.5. Fung, Y.C. (1993). Biomechanics: Mechanical Properties of Living Tissues. New York: Springer-
Verlag New York, Inc.6. Shahnazari, M., et al. “Strontium Administration in Young Chickens Improves Bone Volume and
Architecture but Does not Enhance Bone Structural and Material Strength,” Calcif Tissue Int 80 (2007): 160– 166.