Embed Size (px)
Citation preview
BioMed CentralBMC Bioinformatics
ss
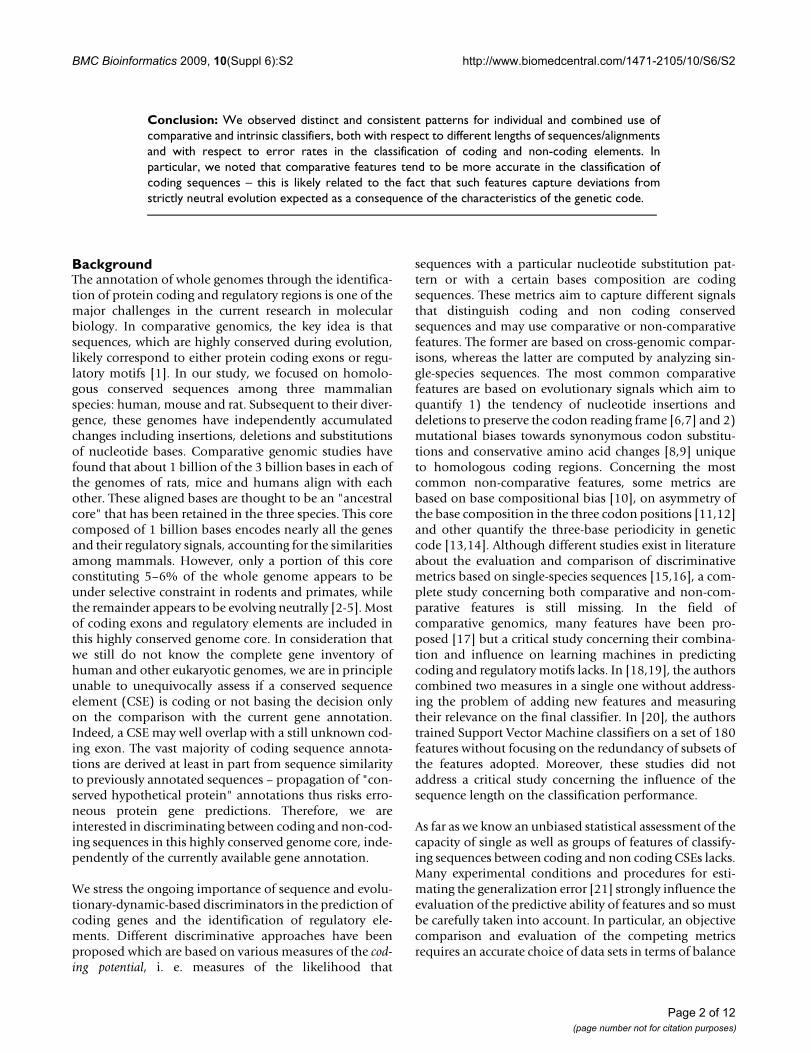
Open AcceProceedingsStatistical assessment of discriminative features for protein-coding and non coding cross-species conserved sequence elementsTeresa M Creanza1,2, David S Horner2, Annarita D'Addabbo1, Rosalia Maglietta1, Flavio Mignone3, Nicola Ancona*1 and Graziano Pesole4,5Address: 1Istituto di Studi sui Sistemi Intelligenti per l'Automazione, CNR, Via Amendola 122/D-I, Bari, Italy, 2Dipartimento di Scienze Biomolecolari e Biotecnologie, Università di Milano, Via Celoria 26, Milano, Italy, 3Dipartimento di Chimica Strutturale e Stereochimica Inorganica, Università di Milano, Via Celoria 26, Milano, Italy, 4Dipartimento di Biochimica e Biologia Molecolare, Università di Bari, Via E. Orabona 4, Bari, Italy and 5Istituto Tecnologie Biomediche, CNR, via Amendola 122/D, Bari, Italy
Email: Teresa M Creanza - [email protected]; David S Horner - [email protected]; Annarita D'Addabbo - [email protected]; Rosalia Maglietta - [email protected]; Flavio Mignone - [email protected]; Nicola Ancona* - [email protected]; Graziano Pesole - [email protected]
* Corresponding author
AbstractBackground: The identification of protein coding elements in sets of mammalian conservedelements is one of the major challenges in the current molecular biology research. Many featureshave been proposed for automatically distinguishing coding and non coding conserved sequences,making so necessary a systematic statistical assessment of their differences. A comprehensive studyshould be composed of an association study, i.e. a comparison of the distributions of the featuresin the two classes, and a prediction study in which the prediction accuracies of classifiers trainedon single and groups of features are analyzed, conditionally to the compared species and to thesequence lengths.
Results: In this paper we compared distributions of a set of comparative and non comparativefeatures and evaluated the prediction accuracy of classifiers trained for discriminating sequenceelements conserved among human, mouse and rat species. The association study showed that theanalyzed features are statistically different in the two classes. In order to study the influence of thesequence lengths on the feature performances, a predictive study was performed on different datasets composed of coding and non coding alignments in equal number and equally long with anascending average length. We found that the most discriminant feature was a comparative measureindicating the proportion of synonymous nucleotide substitutions per synonymous sites. Moreover,linear discriminant classifiers trained by using comparative features in general outperformedclassifiers based on intrinsic ones. Finally, the prediction accuracy of classifiers trained oncomparative features increased significantly by adding intrinsic features to the set of input variables,independently on sequence length (Kolmogorov-Smirnov P-value ≤ 0.05).
from European Molecular Biology Network (EMBnet) Conference 2008: 20th Anniversary CelebrationMartina Franca, Italy. 18–20 September 2008
Published: 16 June 2009
BMC Bioinformatics 2009, 10(Suppl 6):S2 doi:10.1186/1471-2105-10-S6-S2
<supplement> <title> <p>European Molecular Biology Network (EMBnet) Conference 2008: 20th Anniversary Celebration. Leading applications and technologies in bioinformatics</p> </title> <editor>Erik Bongcam-Rudloff, Domenica D'Elia, Andreas Gisel, Sophia Kossida, Kimmo Mattila and Lubos Klucar</editor> <note>Proceedings</note> <url>http://www.biomedcentral.com/content/pdf/1471-2105-10-S6-info.pdf</url> </supplement>
This article is available from: http://www.biomedcentral.com/1471-2105/10/S6/S2
© 2009 Creanza et al; licensee BioMed Central Ltd. This is an open access article distributed under the terms of the Creative Commons Attribution License (http://creativecommons.org/licenses/by/2.0), which permits unrestricted use, distribution, and reproduction in any medium, provided the original work is properly cited.
Page 1 of 12(page number not for citation purposes)
BMC Bioinformatics 2009, 10(Suppl 6):S2 http://www.biomedcentral.com/1471-2105/10/S6/S2
Conclusion: We observed distinct and consistent patterns for individual and combined use ofcomparative and intrinsic classifiers, both with respect to different lengths of sequences/alignmentsand with respect to error rates in the classification of coding and non-coding elements. Inparticular, we noted that comparative features tend to be more accurate in the classification ofcoding sequences – this is likely related to the fact that such features capture deviations fromstrictly neutral evolution expected as a consequence of the characteristics of the genetic code.
BackgroundThe annotation of whole genomes through the identifica-tion of protein coding and regulatory regions is one of themajor challenges in the current research in molecularbiology. In comparative genomics, the key idea is thatsequences, which are highly conserved during evolution,likely correspond to either protein coding exons or regu-latory motifs [1]. In our study, we focused on homolo-gous conserved sequences among three mammalianspecies: human, mouse and rat. Subsequent to their diver-gence, these genomes have independently accumulatedchanges including insertions, deletions and substitutionsof nucleotide bases. Comparative genomic studies havefound that about 1 billion of the 3 billion bases in each ofthe genomes of rats, mice and humans align with eachother. These aligned bases are thought to be an "ancestralcore" that has been retained in the three species. This corecomposed of 1 billion bases encodes nearly all the genesand their regulatory signals, accounting for the similaritiesamong mammals. However, only a portion of this coreconstituting 5–6% of the whole genome appears to beunder selective constraint in rodents and primates, whilethe remainder appears to be evolving neutrally [2-5]. Mostof coding exons and regulatory elements are included inthis highly conserved genome core. In consideration thatwe still do not know the complete gene inventory ofhuman and other eukaryotic genomes, we are in principleunable to unequivocally assess if a conserved sequenceelement (CSE) is coding or not basing the decision onlyon the comparison with the current gene annotation.Indeed, a CSE may well overlap with a still unknown cod-ing exon. The vast majority of coding sequence annota-tions are derived at least in part from sequence similarityto previously annotated sequences – propagation of "con-served hypothetical protein" annotations thus risks erro-neous protein gene predictions. Therefore, we areinterested in discriminating between coding and non-cod-ing sequences in this highly conserved genome core, inde-pendently of the currently available gene annotation.
We stress the ongoing importance of sequence and evolu-tionary-dynamic-based discriminators in the prediction ofcoding genes and the identification of regulatory ele-ments. Different discriminative approaches have beenproposed which are based on various measures of the cod-ing potential, i. e. measures of the likelihood that
sequences with a particular nucleotide substitution pat-tern or with a certain bases composition are codingsequences. These metrics aim to capture different signalsthat distinguish coding and non coding conservedsequences and may use comparative or non-comparativefeatures. The former are based on cross-genomic compar-isons, whereas the latter are computed by analyzing sin-gle-species sequences. The most common comparativefeatures are based on evolutionary signals which aim toquantify 1) the tendency of nucleotide insertions anddeletions to preserve the codon reading frame [6,7] and 2)mutational biases towards synonymous codon substitu-tions and conservative amino acid changes [8,9] uniqueto homologous coding regions. Concerning the mostcommon non-comparative features, some metrics arebased on base compositional bias [10], on asymmetry ofthe base composition in the three codon positions [11,12]and other quantify the three-base periodicity in geneticcode [13,14]. Although different studies exist in literatureabout the evaluation and comparison of discriminativemetrics based on single-species sequences [15,16], a com-plete study concerning both comparative and non-com-parative features is still missing. In the field ofcomparative genomics, many features have been pro-posed [17] but a critical study concerning their combina-tion and influence on learning machines in predictingcoding and regulatory motifs lacks. In [18,19], the authorscombined two measures in a single one without address-ing the problem of adding new features and measuringtheir relevance on the final classifier. In [20], the authorstrained Support Vector Machine classifiers on a set of 180features without focusing on the redundancy of subsets ofthe features adopted. Moreover, these studies did notaddress a critical study concerning the influence of thesequence length on the classification performance.
As far as we know an unbiased statistical assessment of thecapacity of single as well as groups of features of classify-ing sequences between coding and non coding CSEs lacks.Many experimental conditions and procedures for esti-mating the generalization error [21] strongly influence theevaluation of the predictive ability of features and so mustbe carefully taken into account. In particular, an objectivecomparison and evaluation of the competing metricsrequires an accurate choice of data sets in terms of balance
Page 2 of 12(page number not for citation purposes)
BMC Bioinformatics 2009, 10(Suppl 6):S2 http://www.biomedcentral.com/1471-2105/10/S6/S2
in the sizes and in similarity of sequence lengths in thetwo classes.
In this paper we have provided a systematic and unbiasedstatistical assessment of comparative and non compara-tive features for discriminating coding exons from regula-tory motifs. In particular, we assessed the differences ofdistributions by using Wilcoxon-Mann-Whitney non par-ametric tests [22] and we estimated the classification abil-ity of single as well as groups of features by using multiplecross validation strategy, which provides an unbiased esti-mate of the generalization error of learning machines[23,24]. The statistical significance and power of the esti-mated prediction accuracy of Fisher's linear classifierswere estimated by using non parametric permutation tests[25,26]. In particular, in our study we evaluated the influ-ence of the sequence length on the prediction accuracy ofclassifiers trained on balanced data sets. Moreover, byusing Kolmogorov-Smirnov non parametric test [22] weinvestigated if adding non comparative features to thecomparative ones could improve in a statistically signifi-cant way the performances of the classifier. We consideredfeatures already reported in literature as well as novel fea-tures that attempt to capture extra signals of coding poten-tial.
MethodsData set descriptionHomologous genes have been extracted from Homolo-gene database selecting only those genes with an anno-tated reference mRNA (NM_ID) and protein (NP_ID) inall the three organisms considered: human, rat andmouse. Reference mRNA sequences of these genes weremapped on corresponding genomes using BLAT (theBLAST-Like Alignment Tool [27]), then we identifiedgenomic regions corresponding to coding sequence byparsing the BLAT output and the relevant mRNA Genbankentry.
To generate the three-species coding CSE set we run theBLAT search on genomic sequences masked in all non-coding sequences. Conversely, to generate the non-codingset, all annotated coding regions and repetitive elementswere masked. In this way the coding set included CSEscorresponding to coding exons, whereas the non-codingset included 5' and 3'UTRs, introns or other intergenicunique regions.
The hortologous genomic sequences of the coding andnoncoding set were pairwise aligned by using the BLASTalgorithm [28] to generate coding and noncoding con-served sequences, respectively. Conserved core regionsshared by all three organisms were extracted and multi-aligned by ClustalW program (with default parameters)generating our coding and noncoding multi conserved
data sets consisting of 32318 coding and 5438 non codingalignments.
The length distributions of the sequences in the two datasets (coding and non-coding sequences) are very similar:their lower quartiles, medians and upper quartiles arerespectively 83 nt, 114 nt, 154 nt in the coding data setand 74 nt,119 nt,198 nt in the non coding data set.
Discriminative featuresIn this section, we provide a detailed description of themeasures we chose to reveal the differences between thetwo classes.
Comparative featuresThe most common comparative features are based on evo-lutionary signals as mutational biases towards somecodon substitutions. The evolution of highly conservedsequences, both coding and non-coding, is under the con-trol of negative selection. However, their evolutionarydynamics is expected to be quite different for these twoclasses of sequences. Due to the nature of the genetic codethe majority of base substitutions in coding regions tendto be synonymous [29], thus mostly affecting the thirdcodon position, with non-synonymous changes favoringinterconversions between amino-acids with similar chem-ical-physical properties. On the other hand non-codingconserved sequences follow a completely different evolu-tionary dynamics as negative selection, in this case, acts topreserve the binding of regulatory proteins (e.g. transcrip-tion factor binding sites) or regulatory RNAs (e.g. miR-NAs) [8,9]. To quantify these differences, we evaluated thefollowing metrics.
Rate ratioFollowing the Nei-Gojobori approach [29], we computedthe number of codon pairs which differ only for the nucle-otide at the i-th position, i. e. the number of single basechanges:
and the number of codon pairs which differ for two orthree nucleotide differences one of which is at the i-thposition, i. e. the number of multiple base changes:
Si among the substitutions are synonymous. Assum-
ing that the proportion of substitutions in multiple baseswhich are synonymous is equal to the estimated propor-tion of synonymous substitutions among all substitutions
m with iSi= 1 2 3, ,
m with iMi= 1 2 3, , .
mSi
Page 3 of 12(page number not for citation purposes)

BMC Bioinformatics 2009, 10(Suppl 6):S2 http://www.biomedcentral.com/1471-2105/10/S6/S2
in single bases , we computed the number of
synonymous substitutions:
and the number of nonsynonymous substitutions
To compare the two numbers Sd and Nd, we must differ-ently weight them because the number of potential syn-onymous sites is much smaller than the number ofnonsynonymous sites.
To this end, we computed the numbers of synonymousand nonsynonymous substitutions for each codon posi-tion, i. e. for the i-th codon position we evaluated the pro-portion si of possible substitutions in the i-th codonposition which are synonymous and the proportion ni ofpossible substitutions in the i-th codon position whichare nonsynonymous (ni = 1-si). We normalized Sd and Ndby using the average of si and the average of ni over all pairsof aligned triplets, denoted S and N respectively, obtain-ing the following quantities:
known as p-distances [30]. In the study of the evolution-ary divergence, the above computed p-distances are cor-rected to account for multiple substitutions at the samesite by the Jukes-Cantor correction and become
known respectively as synonymous substitution rate and
nonsynonymous substitution rate [31]. The rate ratio
is used as measure of the relative importance of evolution-ary forces that have shaped a particular protein. A rateratio significantly greater than one strongly suggests thatpositive selection has acted on the protein: the nonsynon-ymous substitutions are "relatively" more frequent. Thevalues ds and dn are defined only if psand pn are smaller
than . So we preferred to neglect the Jukes-Cantor cor-
rection and to use the p-distances. Moreover, the ratio
or equivalently becomes infinite when its denomina-
tor is zero. In order to avoid this problem, we defined asmeasure of selective pressure the following substitutionrate ratio:
where ps is the estimated proportion of synonymousnucleotide substitutions per synonymous sites and pndenotes the estimated proportion of nonsynonymousnucleotide substitutions per nonsynonymous sites asabove defined. Our measure is the proportion of synony-mous nucleotide substitutions per synonymous sites nor-malized by using the sum of both proportions of thenucleotide substitutions. A SRR ratio of 0.5 suggests thatthese genes have evolved without constraints, a value ofSRR greater than 0.5 (ps> pn) suggests that nucleotide sub-stitutions that don't change the encoded amino acid (neg-ative selection) are the most frequent substitutions. Onthe contrary, a SRR smaller than 0.5 (ps > pn) indicates thatthe most frequent substitutions are those which changethe encoded amino acid (positive selection). Note that, inthe computation of SRR in 5, we consider only the alignedtriplets without gaps. MRna sequences which differ at themost for gap triplets have SRR equal to infinite. Thesesequences are so similar that we can't establish if the selec-tive pressure is positive, neutral or negative, so weexcluded these sequences from our study. The measureSRR clearly depends on the reading frame and for the pro-tein coding sequences there is only one correct readingframe. We expect the SRR gets the maximum value in cor-respondence of the correct reading frame. To this end, wechose as coding potential score the maximum value ofSRR out of six possible reading frames. On the contrary,for the non coding sequences all the six reading framesshould have similar SRR values and so a smaller disper-sion on the different frames around the maximum value.For this reason, we evaluated this dispersion as follows:
Blosum scoreIn order to quantify amino acid similarity between thetwo aligned sequences, we averaged over the Blosumscores of consecutive triplet pairs for each reading frameBL80(i) [32]. We used a modified version of theBLOSUM80 by assigning a null Blosum score to the cou-ples of two stop codons and to the couples of codons of
π Si
SimSi
=
S m md S M S
ii i i
= + ∗=∑( ) π
1
3
(1)
N m md S M S
ii i i
= + ∗ −=∑( ) ( ).1
1
3
π (2)
pSdS
pNdNs n= =, (3)
d p d ps s n n= − − = − −34
143
34
143
ln( ), ln( ), (4)
dnds
34
dnds
dsdn
SRRps
ps pn=
+(5)
SRR SRR iMi
==max ( )
, ,...,1 2 6(6)
SRR SRR i SRRstd M
i
= −=∑1
52
1
6
( ( ) ) . (7)
Page 4 of 12(page number not for citation purposes)
BMC Bioinformatics 2009, 10(Suppl 6):S2 http://www.biomedcentral.com/1471-2105/10/S6/S2
which one has three gaps codons and the other one hasn'tany gap or has three gaps and a Blosum score of -9 to cou-ples of codons with almost one codon with one or twogaps [9]. As metrics of the coding potential, we selectedthe maximum value on the different frames and its coeffi-cient of variation around the maximum:
Note that, to ensure that the coefficient of variation wasn'tinfinite, we added 9 to the BL80M value at the denomina-tor.
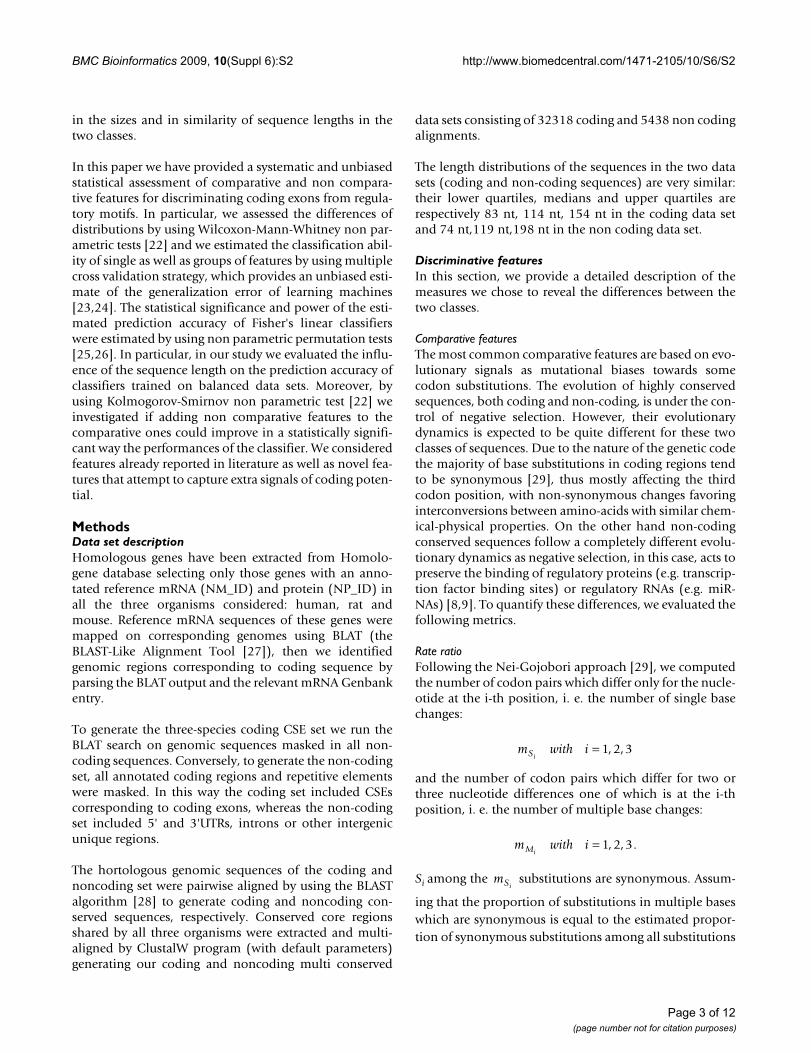
Reading frame conservationIn coding exons of conserved regions, alignment gapsdon't shift the reading frame (id est gap lengths are multi-ple of three bases) or are arranged to let the recovery of theframe. We evaluated the percentage of nucleotides that arein the same frame for each pair of the sequences in thealignment and for each possible offset:
(see Figure 1). In detail, we labeled the nucleotides of thefirst sequence (skipping the gaps) by their codon positionbeginning with the first one, and labeled the nucleotidesof the second sequence beginning once with the first, oncewith the second and once with third codon position. Thenwe counted the percentage of nucleotides equally labeledin each pairwise comparison RFCi and selected the maxi-mum value RFC [6]. We expected that this value wasgreater in the coding sequences data set than in the noncoding one.
Nucleotide Percent IdentityFinally, we considered the percentage of bases which areconserved across each pair of sequences denoted byNucleotide Percent Identity (NPI).
Intrinsic featuresIn the following, we describe the coding potentials whichwere derived from single species sequences.
C+G contentIt's well known that the concentration of genes is corre-lated with a highest C+G density [10]. For this reason, wecounted the C+G content in each sequence in analysis.
Percentage of stop codonMoreover, we expected a smallest percentage of stopcodons in the correct reading frame of a protein codingsequence (just one codon stops the translation) than in anon coding sequence, where the triplets have no meaningfor the amino acid translation. So we counted the percent-age of stop codons (TAA, TGA, TAG) in each readingframe %Stop(i) and selected the smallest such percentageout of six possible reading frames and its dispersionaround the minimum:
Nucleotide compositional skewnessMoreover, in order to capture eventual differences ofskewness in the basis composition of the sequences, wecomputed the following skews:
Note that these measures depend on the reading framedirection, in particular their signs change with the direc-tion. As we don't know whether right frame is direct orinverse, we could only compare ATskew and CGskew in abso-lute value.
Positional composition biasIt's known that for coding sequences in the GenBank,there is a preference for purine in the first codon position(32% G and 28% A) and for weakly bonded pair in thesecond position (31%A and 28% T) [11]. So we com-puted for each sequence the sum of densities of A-G in thefirst codon position and A-T in the second codon positionon each reading frame:
BL BL iMi
80 801 2 6
==max ( ),
, ,...,(8)
BLBL i BL Mi
BL Mstd80
15
80 80 21
6
80 9=
−=∑
+
( ( ) ).
(9)
RFC ii ∀ = { , , },1 2 3 (10)% min % ( ),
,...,Stop Stop im
i=
=1 6(11)
% (% ( ) % ) .Stop Stop i Stopstd m
i
= −=∑1
52
1
6
(12)
ATnA nTnA nT
CGnC nGnC nG
skew skew= −+
= −+
, . (13)
The reading frame conservationFigure 1The reading frame conservation. This figure shows the reading frame conservation test by M. Kellis et al. (2004).
Page 5 of 12(page number not for citation purposes)

BMC Bioinformatics 2009, 10(Suppl 6):S2 http://www.biomedcentral.com/1471-2105/10/S6/S2
where n is the number of codons in each alignedsequence, xi1 and xi2 are the bases in the 1st and 2nd posi-
tion of the ith codon, respectively, and I is the indicator
function, that is .
Then we selected the maximum of among the
six possible reading frames and its relative dispersionaround the maximum:
Discrete Fourier TransformIt's known that there's a three bases periodicity in the cod-ing DNA signal and the power spectrum at frequency of 1/3 is a measure of this periodicity [13].
In detail, each DNA sequence is converted in 4 digital sig-nals, one for each nucleotide α:
where N is the sequence length and nj is the jth base in the
sequence and
The estimator of the power spectrum for the two signals(α, β) is defined as:
the * is the complex coniugate.
The frequency is and k = 0,..., N - 1. To average
power spectra Sαβ (k), we followed the approach in [14]
and defined the power spectrum of each sequence as
Finally, we computed FFT=S( ) to reveal the differences
in the three-bases periodicity between the two classes.
Predictive studyWe adopted Fisher's linear classifiers [26] trained by usingeach feature singularly and sets of them for classifyingCSEs. As measure of classifier performance we used theerror rate, i. e. the fraction of both coding and non codingCSEs incorrectly predicted, or, equally, the accuracy, i. e.the fraction of both coding and non coding CSEs correctlypredicted. The prediction error rate was measured by aholdout cross-validation procedure [33]. The data set wasrandomly split 1000 times into a training set and in aassessment set and the prediction error E was estimated byaveraging on the 1000 errors Ei when each sequence in theassessment set was predicted from the training set:
where s is the number of random splittings in training andassessment data sets.
The statistical significance of the estimated error rate E wasassessed by using a non parametric permutation test [25].This test aims to answer the following question: what isthe probability to obtain, under the null hypothesis H0 of
independent input variables and class labels, an error rateE' less than or equal to the really observed error rate E? Tothis end, we shuffled 1000 times the labels of thesequences and computed the P-value as the percentage of
random classifiers with error rate equal or smaller than
the error E of the classifier trained on the correctly labelleddata:
where r is the number of random label permutations. TheP-value is our estimate of the probability of obtaining anerror rate equal or smaller than the error E under the nullhypothesis H0, i. e. the probability of rejecting H0 when H0is true. Whenever the P-value was less than 0.05, we main-tained that the error rate was statistically significant.
The knowledge of the empirical distribution of the errorrate E, estimated through the cross validation procedure,
allowed to evaluate an estimate of the power π of the test
fI xi A I xi G I xi A I xi T
nAG AT
i
n
( ) ( )
( { } { } { } { })1 2
1 1 2 2
1
= = + = + = + =
=∑
(14)
Iif x y
otherwisex y{ };
.= ==⎧
⎨⎩
1
0
f AG AT( ) ( )1 2
f f iAG AT Mi
AG AT( ) ( ):
( ) ( )max ( )1 2 1 21 6
==
(15)
ff AG AT i f AG AT Mi
f AGAG AT std( ) ( )
( ( ) ( ) ( ) ( ) ( ) )
( )1 2
15 1 2 1 2
21
6
1=
−=∑
(( ).
AT M2
(16)
I for A C G T j Nn j{ } { , , , }, { : }= = =α α 1
Iif n
otherwisenj
j{ };
.= ==⎧
⎨⎩
αα1
0
DTF kN
I eN
I enij k N
j
N
nij k
j jαβ απ
βπ( ) { }
( / ){ }
(=⎛
⎝
⎜⎜
⎞
⎠
⎟⎟=
==
′∑1 12
1
2 // )N
j
N
′=
∗
∑⎛
⎝
⎜⎜
⎞
⎠
⎟⎟
1
(17)
f kN=
DTF k S k( ) ( ).= ∑ ααα
(18)
13
EEis
i
s
==∑
1
(19)
′Ei
P valuer
I E E
i
r
i− = ′ ≤
=∑1
1
{ } (20)
Page 6 of 12(page number not for citation purposes)
BMC Bioinformatics 2009, 10(Suppl 6):S2 http://www.biomedcentral.com/1471-2105/10/S6/S2
with level α. In fact, indicated with the α-quantile of
the empirical distribution E' of the error rate under thenull hypothesis, then:
The larger is the percentage of error rates Ei obtained in
cross-validation that are less than , the more effective
is the classifier.
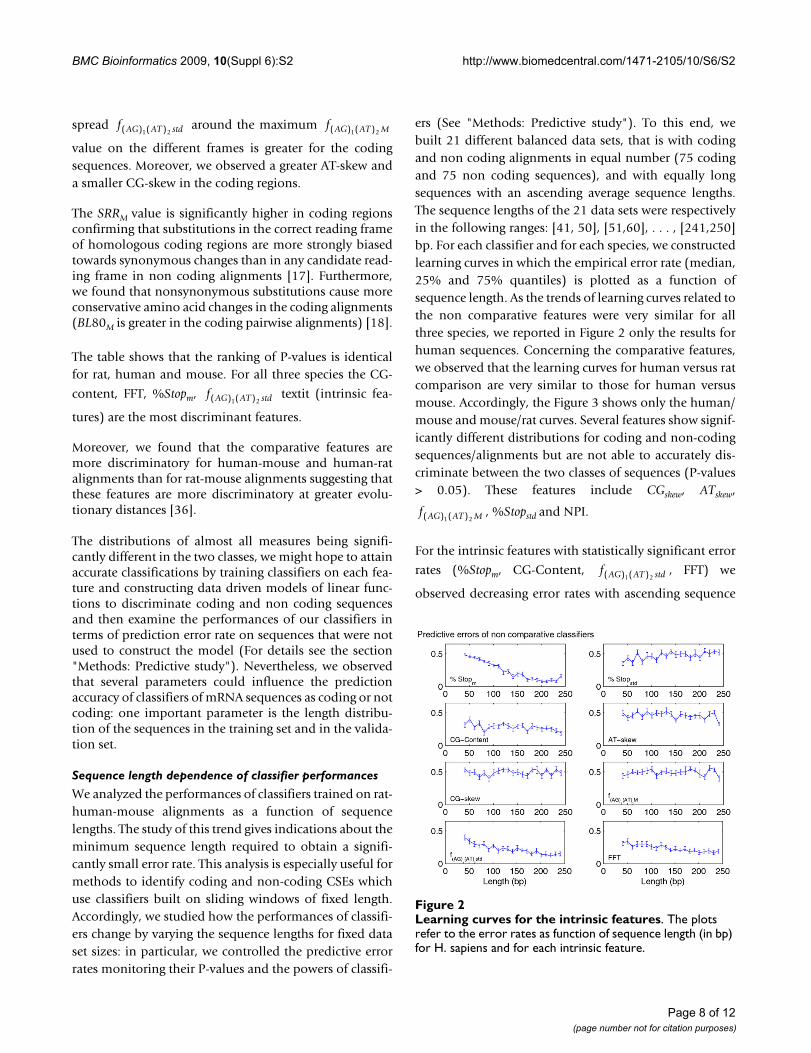
Results and discussionWe characterized the distributions of feature values incoding and non-coding alignments and assessed the sta-tistical significance of their differences using the Wil-coxon-Mann-Whitney (WMW) non-parametric test [22].The results are summarized in Table 1. For each species,the first two columns show the mean values of each vari-able in the two classes and the last one shows the P-valuesof WMW test. The features are ranked for increasing P-val-
ues. We used the Bonferroni correction to control theprobability of obtaining any false positive feature underthe hypothesis that each feature is equally distributed inthe two classes [34]. So we selected a cutoff value dividing0.05 by the number of features. It results that all P-valuesare less than the cutoff value, i. e. the distributions of allfeatures are significantly different in the two classes exceptfor the CGskew and the %Stopstd for M. musculus. The WMW
test applied to our data set confirms some findings presentin the literature. For example CG-content, frequency of A/G at first codon positions and frequency of A/T at the sec-
ond codon position ( ) are all higher for the
coding sequences [10,11]. This is likely due to the higherGC content of coding exons with respect to the back-ground sequences as well as to their compositional perio-dicity related to the triplet codon structure [35].
Unsurprisingly, these phenomena are also much more"frame specific" for the coding sequences: in fact the
′Eα
πα
= ≤ ′=∑1
1s
I E E
i
s
i{ }. (21)
′Eα
f AG AT M( ) ( )1 2
Table 1: The Wilcoxon-Mann-Whitney test P-values
(a) H. sapiens (b) M. musculus (c) R. norvegicusFeatures Coding Non
CodingP-value Features Coding Non
CodingP-values
Features Coding Non Coding
P-values
CG-Content
0.514 0.407 0 CG-Content
0.517 0.419 0 CG-Content
0.517 0.420 0
FFT 0.017 0.007 0 FFT 0.016 0.007 0 FFT 0.016 0.007 0%Stopm 0.086 2.846 0 %Stopm 0.081 2.652 0 %Stopm 0.166 2.623 0
0.263 0.150 0 0.264 0.153 0 0.265 0.154 0
RFC H-M 1.000 0.915 0 RFC H-M 1.000 0.915 0 RFC H-R 0.999 0.915 0BL80M H-M 7.393 5.763 0 BL80M H-M 7.393 5.763 0 BL80M H-R 7.405 5.699 0BL80std H-M
0.132 0.061 0 BL80std H-M
0.132 0.061 0 BL80std H-R 0.133 0.062 0
SRRM H-M 0.938 0.758 0 SRRM H-M 0.938 0.758 0 SRRM H-R 0.939 0.760 0SRRstd H-M 0.672 0.358 0 SRRstd H-M 0.672 0.358 0 SRRstd H-R 0.672 0.354 0RFC H-R 0.999 0.915 0 BL80M M-R 7.513 6.592 0 BL80M M-R 7.513 6.592 0BL80M H-R 7.405 5.699 0 BL80std M-R 0.073 0.048 0 BL80std M-R 0.073 0.048 0BL80std H-R 0.133 0.062 0 SRRM M-R 0.956 0.823 0 SRRM M-R 0.956 0.823 0SRRM H-R 0.940 0.760 0 SRRstd M-R 0.747 0.526 0 SRRstd M-R 0.747 0.526 0SRRstd H-R 0.672 0.354 0 1.178 1.094 10-275 1.169 1.092 10-220
1.179 1.108 10-198 RFC M-R 0.990 0.940 10-205 RFC M-R 0.990 0.940 10-205
ATskew 0.155 0.129 10-46 NPI M-R 92.233 89.585 10-51 NPI M-R 92.233 89.585 10-51
NPI H-M 84.213 85.102 10-14 ATskew 0.157 0.132 10-39 ATskew 0.157 0.132 10-40
CGskew 0.134 0.148 10-7 NPI H-M 84.213 85.102 10-15 NPI H-R 84.248 84.448 0.0002%Stopstd 2.264 2.257 10-6 CGskew 0.136 0.145 0.005 %Stopstd 2.126 2.163 0.0012NPI H-R 84.248 84.450 0.0002 %Stopstd 2.136 2.188 0.007 CGskew 0.135 0.146 0.0017
For each species, the first two columns show the mean values of each variable in the two classes and the last one shows the P-values of Wilcoxon-Mann-Whitney test. The suffices H-M, H-R and H-R indicate the species in comparison. The features are ranked for increasing P-values. Note that all P-values are less than 0.0025 except for the CG-skewness and the stop codon spread %Stopstd for M. musculus.
f AG AT s( ) ( )1 2f AG AT s( ) ( )1 2
f AG AT s( ) ( )1 2
f AG AT M( ) ( )1 2f AG AT M( ) ( )1 2
f AG AT M( ) ( )1 2
Page 7 of 12(page number not for citation purposes)
BMC Bioinformatics 2009, 10(Suppl 6):S2 http://www.biomedcentral.com/1471-2105/10/S6/S2
spread around the maximum
value on the different frames is greater for the codingsequences. Moreover, we observed a greater AT-skew anda smaller CG-skew in the coding regions.
The SRRM value is significantly higher in coding regionsconfirming that substitutions in the correct reading frameof homologous coding regions are more strongly biasedtowards synonymous changes than in any candidate read-ing frame in non coding alignments [17]. Furthermore,we found that nonsynonymous substitutions cause moreconservative amino acid changes in the coding alignments(BL80M is greater in the coding pairwise alignments) [18].
The table shows that the ranking of P-values is identicalfor rat, human and mouse. For all three species the CG-
content, FFT, %Stopm, textit (intrinsic fea-
tures) are the most discriminant features.
Moreover, we found that the comparative features aremore discriminatory for human-mouse and human-ratalignments than for rat-mouse alignments suggesting thatthese features are more discriminatory at greater evolu-tionary distances [36].
The distributions of almost all measures being signifi-cantly different in the two classes, we might hope to attainaccurate classifications by training classifiers on each fea-ture and constructing data driven models of linear func-tions to discriminate coding and non coding sequencesand then examine the performances of our classifiers interms of prediction error rate on sequences that were notused to construct the model (For details see the section"Methods: Predictive study"). Nevertheless, we observedthat several parameters could influence the predictionaccuracy of classifiers of mRNA sequences as coding or notcoding: one important parameter is the length distribu-tion of the sequences in the training set and in the valida-tion set.
Sequence length dependence of classifier performances
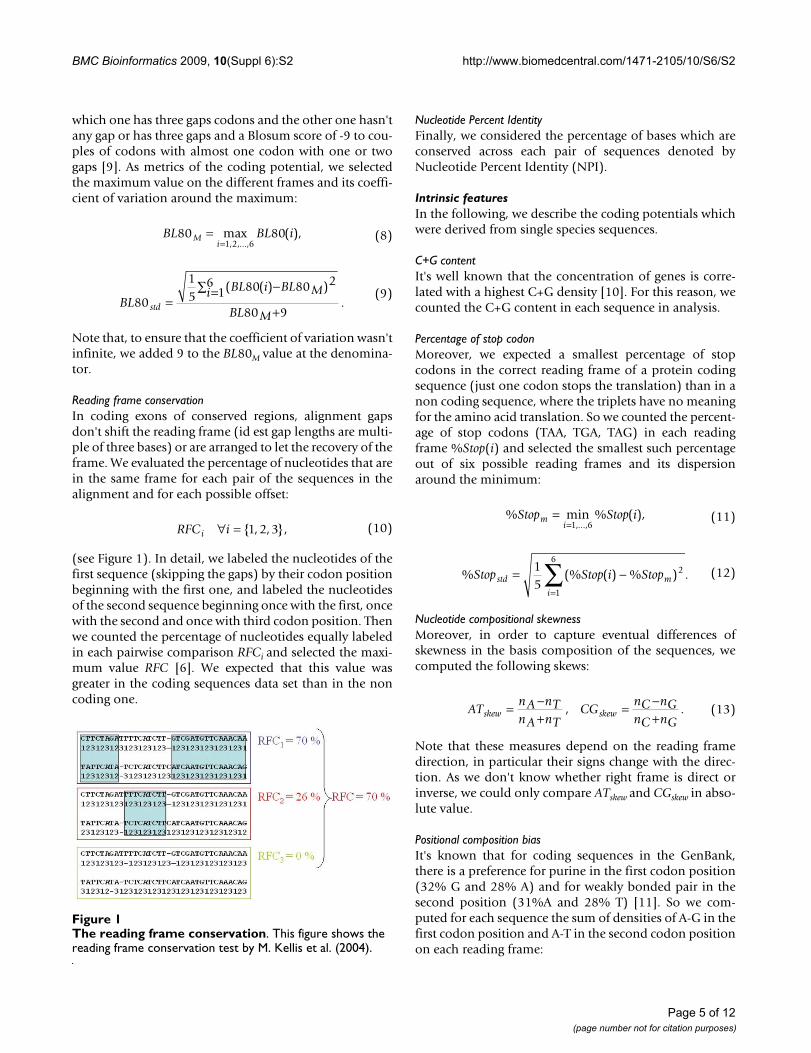
We analyzed the performances of classifiers trained on rat-human-mouse alignments as a function of sequencelengths. The study of this trend gives indications about theminimum sequence length required to obtain a signifi-cantly small error rate. This analysis is especially useful formethods to identify coding and non-coding CSEs whichuse classifiers built on sliding windows of fixed length.Accordingly, we studied how the performances of classifi-ers change by varying the sequence lengths for fixed dataset sizes: in particular, we controlled the predictive errorrates monitoring their P-values and the powers of classifi-
ers (See "Methods: Predictive study"). To this end, webuilt 21 different balanced data sets, that is with codingand non coding alignments in equal number (75 codingand 75 non coding sequences), and with equally longsequences with an ascending average sequence lengths.The sequence lengths of the 21 data sets were respectivelyin the following ranges: [41, 50], [51,60], . . . , [241,250]bp. For each classifier and for each species, we constructedlearning curves in which the empirical error rate (median,25% and 75% quantiles) is plotted as a function ofsequence length. As the trends of learning curves related tothe non comparative features were very similar for allthree species, we reported in Figure 2 only the results forhuman sequences. Concerning the comparative features,we observed that the learning curves for human versus ratcomparison are very similar to those for human versusmouse. Accordingly, the Figure 3 shows only the human/mouse and mouse/rat curves. Several features show signif-icantly different distributions for coding and non-codingsequences/alignments but are not able to accurately dis-criminate between the two classes of sequences (P-values> 0.05). These features include CGskew, ATskew,
, %Stopstd and NPI.
For the intrinsic features with statistically significant error
rates (%Stopm, CG-Content, , FFT) we
observed decreasing error rates with ascending sequence
f AG AT std( ) ( )1 2f AG AT M( ) ( )1 2
f AG AT std( ) ( )1 2
f AG AT M( ) ( )1 2
f AG AT std( ) ( )1 2
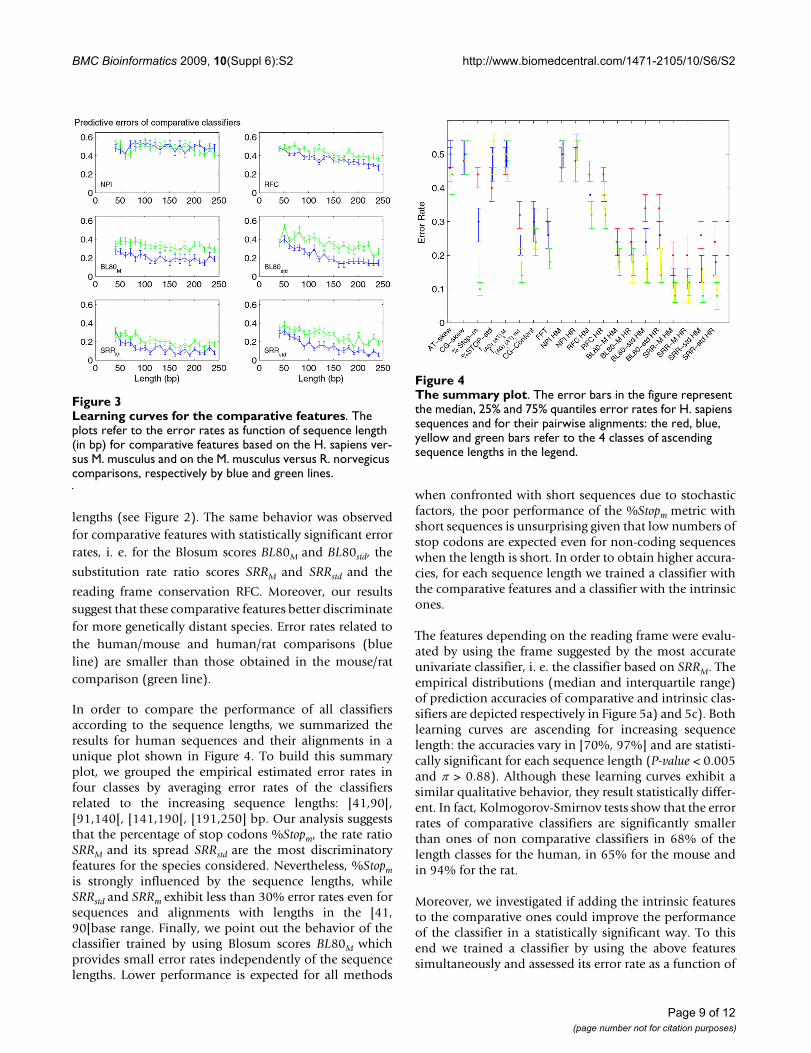
Learning curves for the intrinsic featuresFigure 2Learning curves for the intrinsic features. The plots refer to the error rates as function of sequence length (in bp) for H. sapiens and for each intrinsic feature.
Page 8 of 12(page number not for citation purposes)
BMC Bioinformatics 2009, 10(Suppl 6):S2 http://www.biomedcentral.com/1471-2105/10/S6/S2
lengths (see Figure 2). The same behavior was observedfor comparative features with statistically significant errorrates, i. e. for the Blosum scores BL80M and BL80std, the
substitution rate ratio scores SRRM and SRRstd and the
reading frame conservation RFC. Moreover, our resultssuggest that these comparative features better discriminatefor more genetically distant species. Error rates related tothe human/mouse and human/rat comparisons (blueline) are smaller than those obtained in the mouse/ratcomparison (green line).
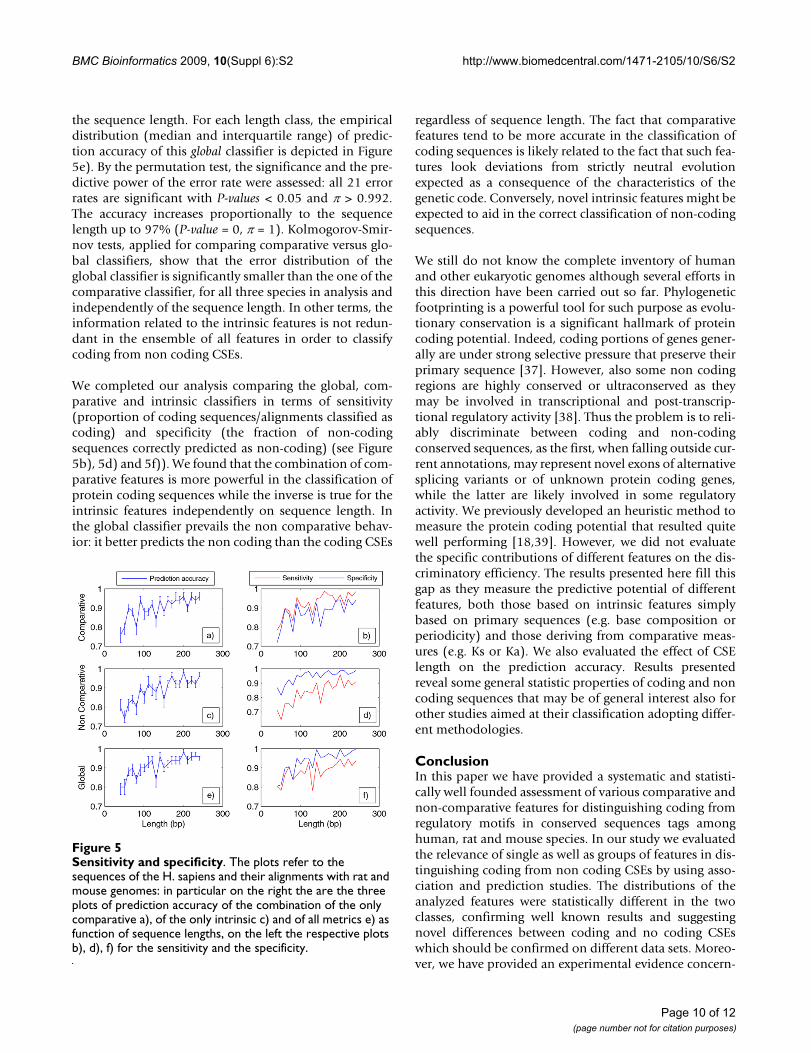
In order to compare the performance of all classifiersaccording to the sequence lengths, we summarized theresults for human sequences and their alignments in aunique plot shown in Figure 4. To build this summaryplot, we grouped the empirical estimated error rates infour classes by averaging error rates of the classifiersrelated to the increasing sequence lengths: [41,90[,[91,140[, [141,190[, [191,250] bp. Our analysis suggeststhat the percentage of stop codons %Stopm, the rate ratioSRRM and its spread SRRstd are the most discriminatoryfeatures for the species considered. Nevertheless, %Stopmis strongly influenced by the sequence lengths, whileSRRstd and SRRm exhibit less than 30% error rates even forsequences and alignments with lengths in the [41,90[base range. Finally, we point out the behavior of theclassifier trained by using Blosum scores BL80M whichprovides small error rates independently of the sequencelengths. Lower performance is expected for all methods
when confronted with short sequences due to stochasticfactors, the poor performance of the %Stopm metric withshort sequences is unsurprising given that low numbers ofstop codons are expected even for non-coding sequenceswhen the length is short. In order to obtain higher accura-cies, for each sequence length we trained a classifier withthe comparative features and a classifier with the intrinsicones.
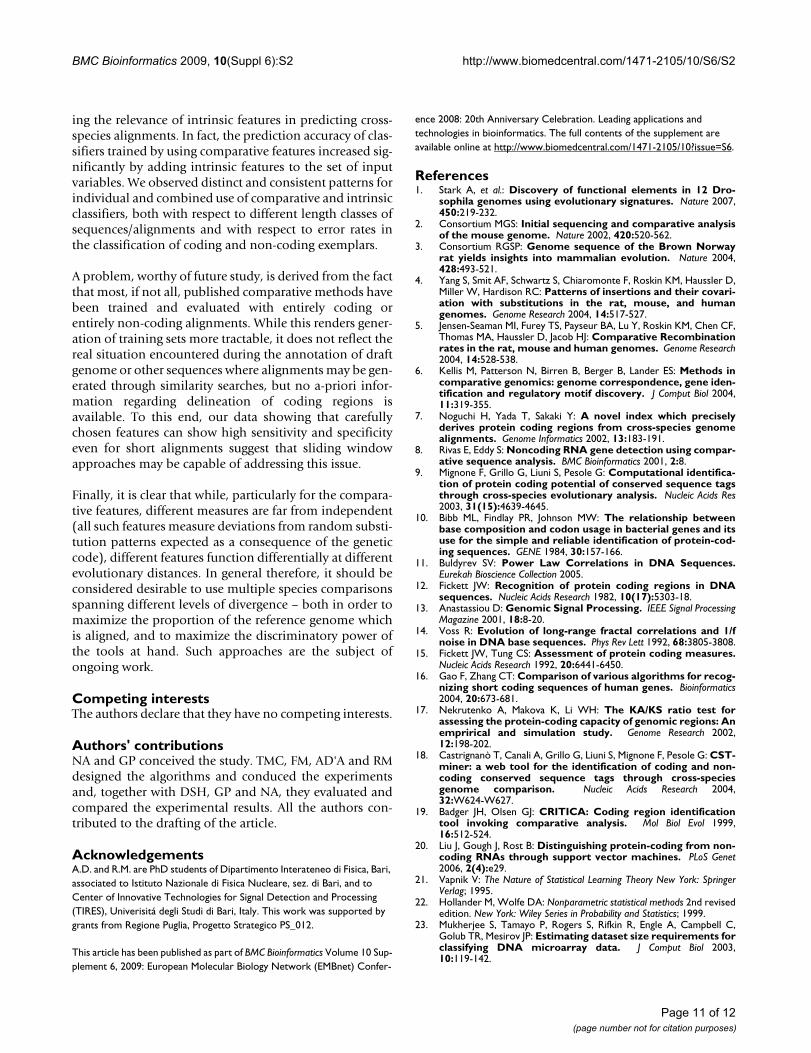
The features depending on the reading frame were evalu-ated by using the frame suggested by the most accurateunivariate classifier, i. e. the classifier based on SRRM. Theempirical distributions (median and interquartile range)of prediction accuracies of comparative and intrinsic clas-sifiers are depicted respectively in Figure 5a) and 5c). Bothlearning curves are ascending for increasing sequencelength: the accuracies vary in [70%, 97%] and are statisti-cally significant for each sequence length (P-value < 0.005and π > 0.88). Although these learning curves exhibit asimilar qualitative behavior, they result statistically differ-ent. In fact, Kolmogorov-Smirnov tests show that the errorrates of comparative classifiers are significantly smallerthan ones of non comparative classifiers in 68% of thelength classes for the human, in 65% for the mouse andin 94% for the rat.
Moreover, we investigated if adding the intrinsic featuresto the comparative ones could improve the performanceof the classifier in a statistically significant way. To thisend we trained a classifier by using the above featuressimultaneously and assessed its error rate as a function of
The summary plotFigure 4The summary plot. The error bars in the figure represent the median, 25% and 75% quantiles error rates for H. sapiens sequences and for their pairwise alignments: the red, blue, yellow and green bars refer to the 4 classes of ascending sequence lengths in the legend.
Learning curves for the comparative featuresFigure 3Learning curves for the comparative features. The plots refer to the error rates as function of sequence length (in bp) for comparative features based on the H. sapiens ver-sus M. musculus and on the M. musculus versus R. norvegicus comparisons, respectively by blue and green lines.
Page 9 of 12(page number not for citation purposes)
BMC Bioinformatics 2009, 10(Suppl 6):S2 http://www.biomedcentral.com/1471-2105/10/S6/S2
the sequence length. For each length class, the empiricaldistribution (median and interquartile range) of predic-tion accuracy of this global classifier is depicted in Figure5e). By the permutation test, the significance and the pre-dictive power of the error rate were assessed: all 21 errorrates are significant with P-values < 0.05 and π > 0.992.The accuracy increases proportionally to the sequencelength up to 97% (P-value = 0, π = 1). Kolmogorov-Smir-nov tests, applied for comparing comparative versus glo-bal classifiers, show that the error distribution of theglobal classifier is significantly smaller than the one of thecomparative classifier, for all three species in analysis andindependently of the sequence length. In other terms, theinformation related to the intrinsic features is not redun-dant in the ensemble of all features in order to classifycoding from non coding CSEs.
We completed our analysis comparing the global, com-parative and intrinsic classifiers in terms of sensitivity(proportion of coding sequences/alignments classified ascoding) and specificity (the fraction of non-codingsequences correctly predicted as non-coding) (see Figure5b), 5d) and 5f)). We found that the combination of com-parative features is more powerful in the classification ofprotein coding sequences while the inverse is true for theintrinsic features independently on sequence length. Inthe global classifier prevails the non comparative behav-ior: it better predicts the non coding than the coding CSEs
regardless of sequence length. The fact that comparativefeatures tend to be more accurate in the classification ofcoding sequences is likely related to the fact that such fea-tures look deviations from strictly neutral evolutionexpected as a consequence of the characteristics of thegenetic code. Conversely, novel intrinsic features might beexpected to aid in the correct classification of non-codingsequences.
We still do not know the complete inventory of humanand other eukaryotic genomes although several efforts inthis direction have been carried out so far. Phylogeneticfootprinting is a powerful tool for such purpose as evolu-tionary conservation is a significant hallmark of proteincoding potential. Indeed, coding portions of genes gener-ally are under strong selective pressure that preserve theirprimary sequence [37]. However, also some non codingregions are highly conserved or ultraconserved as theymay be involved in transcriptional and post-transcrip-tional regulatory activity [38]. Thus the problem is to reli-ably discriminate between coding and non-codingconserved sequences, as the first, when falling outside cur-rent annotations, may represent novel exons of alternativesplicing variants or of unknown protein coding genes,while the latter are likely involved in some regulatoryactivity. We previously developed an heuristic method tomeasure the protein coding potential that resulted quitewell performing [18,39]. However, we did not evaluatethe specific contributions of different features on the dis-criminatory efficiency. The results presented here fill thisgap as they measure the predictive potential of differentfeatures, both those based on intrinsic features simplybased on primary sequences (e.g. base composition orperiodicity) and those deriving from comparative meas-ures (e.g. Ks or Ka). We also evaluated the effect of CSElength on the prediction accuracy. Results presentedreveal some general statistic properties of coding and noncoding sequences that may be of general interest also forother studies aimed at their classification adopting differ-ent methodologies.
ConclusionIn this paper we have provided a systematic and statisti-cally well founded assessment of various comparative andnon-comparative features for distinguishing coding fromregulatory motifs in conserved sequences tags amonghuman, rat and mouse species. In our study we evaluatedthe relevance of single as well as groups of features in dis-tinguishing coding from non coding CSEs by using asso-ciation and prediction studies. The distributions of theanalyzed features were statistically different in the twoclasses, confirming well known results and suggestingnovel differences between coding and no coding CSEswhich should be confirmed on different data sets. Moreo-ver, we have provided an experimental evidence concern-
Sensitivity and specificityFigure 5Sensitivity and specificity. The plots refer to the sequences of the H. sapiens and their alignments with rat and mouse genomes: in particular on the right the are the three plots of prediction accuracy of the combination of the only comparative a), of the only intrinsic c) and of all metrics e) as function of sequence lengths, on the left the respective plots b), d), f) for the sensitivity and the specificity.
Page 10 of 12(page number not for citation purposes)
BMC Bioinformatics 2009, 10(Suppl 6):S2 http://www.biomedcentral.com/1471-2105/10/S6/S2
ing the relevance of intrinsic features in predicting cross-species alignments. In fact, the prediction accuracy of clas-sifiers trained by using comparative features increased sig-nificantly by adding intrinsic features to the set of inputvariables. We observed distinct and consistent patterns forindividual and combined use of comparative and intrinsicclassifiers, both with respect to different length classes ofsequences/alignments and with respect to error rates inthe classification of coding and non-coding exemplars.
A problem, worthy of future study, is derived from the factthat most, if not all, published comparative methods havebeen trained and evaluated with entirely coding orentirely non-coding alignments. While this renders gener-ation of training sets more tractable, it does not reflect thereal situation encountered during the annotation of draftgenome or other sequences where alignments may be gen-erated through similarity searches, but no a-priori infor-mation regarding delineation of coding regions isavailable. To this end, our data showing that carefullychosen features can show high sensitivity and specificityeven for short alignments suggest that sliding windowapproaches may be capable of addressing this issue.
Finally, it is clear that while, particularly for the compara-tive features, different measures are far from independent(all such features measure deviations from random substi-tution patterns expected as a consequence of the geneticcode), different features function differentially at differentevolutionary distances. In general therefore, it should beconsidered desirable to use multiple species comparisonsspanning different levels of divergence – both in order tomaximize the proportion of the reference genome whichis aligned, and to maximize the discriminatory power ofthe tools at hand. Such approaches are the subject ofongoing work.
Competing interestsThe authors declare that they have no competing interests.
Authors' contributionsNA and GP conceived the study. TMC, FM, AD'A and RMdesigned the algorithms and conduced the experimentsand, together with DSH, GP and NA, they evaluated andcompared the experimental results. All the authors con-tributed to the drafting of the article.
AcknowledgementsA.D. and R.M. are PhD students of Dipartimento Interateneo di Fisica, Bari, associated to Istituto Nazionale di Fisica Nucleare, sez. di Bari, and to Center of Innovative Technologies for Signal Detection and Processing (TIRES), Univerisitá degli Studi di Bari, Italy. This work was supported by grants from Regione Puglia, Progetto Strategico PS_012.
This article has been published as part of BMC Bioinformatics Volume 10 Sup-plement 6, 2009: European Molecular Biology Network (EMBnet) Confer-
ence 2008: 20th Anniversary Celebration. Leading applications and technologies in bioinformatics. The full contents of the supplement are available online at http://www.biomedcentral.com/1471-2105/10?issue=S6.
References1. Stark A, et al.: Discovery of functional elements in 12 Dro-
sophila genomes using evolutionary signatures. Nature 2007,450:219-232.
2. Consortium MGS: Initial sequencing and comparative analysisof the mouse genome. Nature 2002, 420:520-562.
3. Consortium RGSP: Genome sequence of the Brown Norwayrat yields insights into mammalian evolution. Nature 2004,428:493-521.
4. Yang S, Smit AF, Schwartz S, Chiaromonte F, Roskin KM, Haussler D,Miller W, Hardison RC: Patterns of insertions and their covari-ation with substitutions in the rat, mouse, and humangenomes. Genome Research 2004, 14:517-527.
5. Jensen-Seaman MI, Furey TS, Payseur BA, Lu Y, Roskin KM, Chen CF,Thomas MA, Haussler D, Jacob HJ: Comparative Recombinationrates in the rat, mouse and human genomes. Genome Research2004, 14:528-538.
6. Kellis M, Patterson N, Birren B, Berger B, Lander ES: Methods incomparative genomics: genome correspondence, gene iden-tification and regulatory motif discovery. J Comput Biol 2004,11:319-355.
7. Noguchi H, Yada T, Sakaki Y: A novel index which preciselyderives protein coding regions from cross-species genomealignments. Genome Informatics 2002, 13:183-191.
8. Rivas E, Eddy S: Noncoding RNA gene detection using compar-ative sequence analysis. BMC Bioinformatics 2001, 2:8.
9. Mignone F, Grillo G, Liuni S, Pesole G: Computational identifica-tion of protein coding potential of conserved sequence tagsthrough cross-species evolutionary analysis. Nucleic Acids Res2003, 31(15):4639-4645.
10. Bibb ML, Findlay PR, Johnson MW: The relationship betweenbase composition and codon usage in bacterial genes and itsuse for the simple and reliable identification of protein-cod-ing sequences. GENE 1984, 30:157-166.
11. Buldyrev SV: Power Law Correlations in DNA Sequences.Eurekah Bioscience Collection 2005.
12. Fickett JW: Recognition of protein coding regions in DNAsequences. Nucleic Acids Research 1982, 10(17):5303-18.
13. Anastassiou D: Genomic Signal Processing. IEEE Signal ProcessingMagazine 2001, 18:8-20.
14. Voss R: Evolution of long-range fractal correlations and 1/fnoise in DNA base sequences. Phys Rev Lett 1992, 68:3805-3808.
15. Fickett JW, Tung CS: Assessment of protein coding measures.Nucleic Acids Research 1992, 20:6441-6450.
16. Gao F, Zhang CT: Comparison of various algorithms for recog-nizing short coding sequences of human genes. Bioinformatics2004, 20:673-681.
17. Nekrutenko A, Makova K, Li WH: The KA/KS ratio test forassessing the protein-coding capacity of genomic regions: Anemprirical and simulation study. Genome Research 2002,12:198-202.
18. Castrignanò T, Canali A, Grillo G, Liuni S, Mignone F, Pesole G: CST-miner: a web tool for the identification of coding and non-coding conserved sequence tags through cross-speciesgenome comparison. Nucleic Acids Research 2004,32:W624-W627.
19. Badger JH, Olsen GJ: CRITICA: Coding region identificationtool invoking comparative analysis. Mol Biol Evol 1999,16:512-524.
20. Liu J, Gough J, Rost B: Distinguishing protein-coding from non-coding RNAs through support vector machines. PLoS Genet2006, 2(4):e29.
21. Vapnik V: The Nature of Statistical Learning Theory New York: SpringerVerlag; 1995.
22. Hollander M, Wolfe DA: Nonparametric statistical methods 2nd revisededition. New York: Wiley Series in Probability and Statistics; 1999.
23. Mukherjee S, Tamayo P, Rogers S, Rifkin R, Engle A, Campbell C,Golub TR, Mesirov JP: Estimating dataset size requirements forclassifying DNA microarray data. J Comput Biol 2003,10:119-142.
Page 11 of 12(page number not for citation purposes)
BMC Bioinformatics 2009, 10(Suppl 6):S2 http://www.biomedcentral.com/1471-2105/10/S6/S2
Publish with BioMed Central and every scientist can read your work free of charge
"BioMed Central will be the most significant development for disseminating the results of biomedical research in our lifetime."
Sir Paul Nurse, Cancer Research UK
Your research papers will be:
available free of charge to the entire biomedical community
peer reviewed and published immediately upon acceptance
cited in PubMed and archived on PubMed Central
yours — you keep the copyright
Submit your manuscript here:http://www.biomedcentral.com/info/publishing_adv.asp
BioMedcentral
24. Michiels S, Koscielny S, Hill C: Predictor of cancer outcome withmicroarrays: a multiple random validation strategy. Lancet2005, 365:488-492.
25. Good P: Permutation tests: a practical guide to resampling methods fortesting hypotheses New York: Springer-Verlag; 1994.
26. Anderson TW: An introduction to multivariate statistical analysis NewYork: John Wiley; 1958.
27. Kent W: BLAT-the BLAST-like alignment tool. Genome Res2002, 12(4):656-64.
28. Altschul S, Madden T, Schaffer A, Zhang J, Zhang Z, Miller W, LipmanD: Gapped BLAST and PSI-BLAST: a new generation of pro-tein database search programs. Nucleic Acids Research 1997,25(17):3389-3402.
29. Nei M, Gojobory T: Simple Methods for Estimating the Num-bers of Synonymous and Nonsynonymous Nucleotide Sub-stitutions. Mol Biol Evol 1986, 3(5):418-426.
30. Nei M, S K: Synonymous and nonsynonymous nucleotide sub-stitutions. Molecular Evolution and Phylogenetics 2000.
31. Jukes TH, Cantor CR: Evolution of protein molecules. In Mam-malian protein metabolism III Edited by: Munro HN. New York: AcademicPress; 1969:21-132.
32. Henikoff S, Henikoff JG: Amino acid substitution matrices fromprotein blocks. Proc Natl Acad Sci USA 1992, 89:10915-10919.
33. Davison AC, Hinkley DV: Bootstrap methods and Their Application Cam-bridge University Press; 1997.
34. Ewens WJ, Grant GR: Statistical Methods in Bioinformatics SecondRevised edition. New York: Springer-Verlag; 2004.
35. Aissani B, et al.: The compositional properties of human genes.J Mol Evol 1991, 32(6):493-503.
36. Lin MF, Deoras AN, Rasmussen MD, Kellis M: Performance andScalability of Discriminative Metrics for Comparative GeneIdentification in 12 Drosophila Genomes. Plos computationalbiology 2008, 4(4):.
37. Ganley A, Kobayashi T: Phylogenetic footprinting to find func-tional DNA elements. Methods Mol Biol 2007, 395:367-80.
38. Siepel A, et al.: Evolutionarily conserved elements in verte-brate, insect, worm, and yeast genomes. Genome Res 2005,15(8):1034-50.
39. Castrignanò T, Meo PDD, Grillo G, Liuni S, Mignone F, Talamo I,Pesole G: GenoMiner: a tool for genome-wide search of cod-ing and non-coding conserved sequence tags. Bioinformatics2006, 22(4):497-499.
Page 12 of 12(page number not for citation purposes)