Embed Size (px)
Citation preview

BLUETOOTH-BASE WORM MODELING AND SIMULATION
by
HAIOU XIANG B.A. Chongqing University, 1998
A thesis submitted in partial fulfillment of the requirements for the degree of Master
in School of Electrical Engineering and Computer Science in College of Engineering and Computer Science
at the University of Central Florida Orlando, Florida
Summer Term 2008

ii
ABSTRACT
Bluetooth is one of the most popular technologies in the world in the new century.
Meanwhile it attracts attackers to develop new worm and malicious code attacking
Bluetooth wireless network. So far the growth of mobile malicious code is very fast and
they have become a great potential threat to our society. In this thesis, we study
Bluetooth worm in Mobile Wireless Network. Firstly we investigate the Bluetooth
technology and several previously appeared Bluetooth worms, e.g. “Caribe”,”Comwar”,
and we find the infection cycle of a Bluetooth worm. Next, we develop a new simulator,
Bluetooth Worm simulator (BTWS), which simulates Bluetooth worm’ behaviors in
Mobile wireless networks. Through analyzing the result, we find i) In ideal environment
the mobility of Bluetooth device can improve the worm’s propagation speed, but
combining mobility and inquiry time issue (what is “inquiry time issue”?) would cause a
Bluetooth worm to slow down its propagation under certain situation. ii) The number of
initial infected Bluetooth devices mostly affects the beginning propagation speed of a
worm, and energy issue can be ignored because the new technology can let Bluetooth
device keeping work for a long time. Iii) Co-channel interference and setting up
monitoring system in public place can improve the security of Bluetooth wireless
network.
Key word: Bluetooth worm, BTWS, Mobile network, worm behaviors, propagation

iii
ACKNOWLEDGMENTS
I wish to thank Dr. Cliff Zou who gives me useful advice for simulating method of worm
and review my thesis.

iv
TABLE OF CONTENTS
LIST OF FIGURES ..........................................................................................................vi
LIST OF TABLES ........................................................................................................... vii
1 CHAPTER ONE: INTRODUCTION ........................................................................... 1
1.1 Background of Internet Worm ........................................................................... 1
1.2 Background of Bluetooth Network Worm .......................................................... 3
1.3 Properties and Characteristics of Bluetooth ...................................................... 5
1.3.1 History of Bluetooth Technology .................................................................... 5
1.3.2 Features of Bluetooth Technology ................................................................. 6
1.3.3 Operation of Bluetooth Technology ............................................................... 7
1.4 Bluetooth Worm Infection .................................................................................. 8
1.5 Wireless Network Simulator Introduction ........................................................ 11
1.6 BTWS (Bluetooth Worm Simulator) ................................................................ 13
1.7 Contribution of Thesis ..................................................................................... 14
2 CHAPTER TWO: RELATED WORK ....................................................................... 15
3 CHAPTER THREE: SIMULATION .......................................................................... 18
3.1 Simulation in Local Wireless Network ............................................................. 20
3.1.1 Propagation Speed ...................................................................................... 21
3.1.2 Density Effect .............................................................................................. 22
3.1.3 Effect of the moving speed of Bluetooth devices ......................................... 24
3.1.4 Operating Range effect ............................................................................... 27
v
3.1.5 Initial Infected Nodes ................................................................................... 29
3.1.6 Contact Degree ........................................................................................... 31
3.1.7 Inquiry Time Effect ....................................................................................... 33
3.1.8 Co-Channel Interference and Failure Rate .................................................. 37
3.1.9 Speed and Inquiry Time Combination .......................................................... 39
3.1.10 Energy Issue ............................................................................................ 40
3.2 Simulation in Wide Wireless Network ............................................................. 41
4 CHAPTER FOUR: DEFENSE ................................................................................. 44
5 CHAPTER FIVE: CONCLUSION ............................................................................ 46
6 REFERENCES ....................................................................................................... 47

vi
LIST OF FIGURES Figure 1 Increase in The Number of Known Mobile Virus Families ................................. 4
Figure 2 Core System Architecture of Bluetooth ............................................................. 7
Figure 3 Messaging at Initial Connection ...................................................................... 10
Figure 4 Bluetooth Worm Infection Life Cycle ............................................................... 11
Figure 5 Bluetooth worm propagation speed per unit time ............................................ 21
Figure 6 Propagation Curve of 50 Nodes (Infected Rate: 95%) .................................... 22
Figure 7 Propagation Curve of 200 Nodes (Infected Rate: 95%) .................................. 23
Figure 8 Propagation Time in Different Density ............................................................. 23
Figure 9 Propagation Curve of Speed: 1 m/s and 2 m/s ................................................ 25
Figure 10 Propagation Curve of Speed: 8m/s, 15 m/s and 20 m/s ................................ 25
Figure 11 Propagation Time in Different Speed ............................................................. 26
Figure 12 Propagation Time of Range Effect................................................................. 28
Figure 13 Propagation Curve in Different Initial Infected Nodes: 1, 5, 10 ...................... 30
Figure 14 Initial Infected Nodes and Propagation Time ................................................. 30
Figure 15 Propagation Time and Healthy Rate (200 Nodes, Speed 2m/s) .................... 32
Figure 16 Infected Rate and Propagation Time (95% nodes are infected) .................... 32
Figure 17 Inquiries Time and Propagation Time (Speed 2 m/s) ..................................... 34
Figure 18 Speed and Propagation Time (Inquiry Time = 1s) ......................................... 35
Figure 19 Propagation Curve in Failure Rate and No Failure Rate ............................... 38
Figure 20 Large Scale Simulation (Max Simulation Time: 2000 s) ................................ 43
vii
LIST OF TABLES
Table 1 Parameter List .................................................................................................. 19
Table 2 Default Parameters Assumption ....................................................................... 19
Table 3 TPN and TPT .................................................................................................... 36
Table 4 Speed and Inquiry Time .................................................................................... 39
Table 5 Power Class...................................................................................................... 40
Table 6 Large Scale Simulation ..................................................................................... 42

1
1 CHAPTER ONE: INTRODUCTION
1.1 Background of Internet Worm
A computer worm is a self-replicating computer program. It uses a network to
sent copies of itself to other nodes (computer terminals on the network) and it may do
so without any user intervention [5]. Unlike a virus, it does not need to attach itself to an
existing program. The first worm, the Christmas Tree EXEC, appeared on a worldwide
network in 1987, which spread across both IBM’s own international network and
BITNET [6]. Actually, Christmas Tree EXEC was technically a Trojan horse. The first
worm that caused massive disruption of the internet was the Morris worm, written by a
computer science graduate student at Cornell University in 1988 [7].
When human enter the 21 century, the worm star its engine and bring internet
disaster. On July 13, 2001, the most famous Internet worm, Code Red [9], was noticed
because of its unbelievable spreading speed. On July 18 Security company eEye Digital
Security discovered the flaw in IIS that Code Red exploits. Code Red worm exploited a
vulnerability in the indexing software distributed with IIS [11] [12], spreading itself using
a common type of vulnerability known as a buffer overflow. It did this by using a long
string of the repeated character ‘N’ to overflow a buffer, allowing the worm to execute
arbitrary code and infect the machine. Then the infected host attempt to connect to TCP
port 80 of randomly generated IP addresses in order to propagate the worm. At the
same time, the worm starts 100 worm threads in memory, when the date is between the
20th and 27th of the month, the worm starts a denial of service attack on

2
www.whitehouse.gov. On July 19, it infected 359,000 [8] [10] hosts in internet. The
worse situation is that more than 2,000 new hosts were infected each minute. 43% of all
infected hosts were in the United State, and 19% of all compromised machines were the
.NET Top Level Domain, followed by .COM with 14% [9].
With the development of computer technology, the Internet worm has different
types as well. Email worm [13] spread via email message, typically, the worm code
contains in attachment or the e-mail may contain a link to an infected website. Once a
user activates the worm, it can use “social engineering”, user’s contact address book, to
propagate itself. In modern society, a lot of younger like to chat in internet, so IRC worm
[14] use the chat channels to spread infected files. Another popular internet tools is P2P
software, File-sharing networks worm place itself in a shared folder and spread via the
P2P network [15]. Internet worm not only disrupt the network traffic, but also it has
payload to implement more kinds of attacking, such as installing backdoor, deleting
system files or encrypting files.
Internet worm has already become a major threaten in internet due to its faster
spreading and its serious devastating. According to the report of London-based market
intelligence firm Mi2g in 2003 ‘Code Red’ worm brought almost $2.6 billion in
productivity cost, and SQL ‘Slammer’ worm cause between $950 million and $1.2 billion
in lost productivity in its first five days worldwide. Those are not including labors costs
and cleanup costs. In 2006, from the FBI’s survey [16] from 2,066 organizations, “This
would be 2.8 million U.S. organizations experiencing at least one computer security
incident. With each of these 2.8 million organizations incurring a $24,000 average loss,
3
this would total $67.2 billion per year.” In this survey, worms, viruses and Trojan horses
was most costly computer crime.
1.2 Background of Bluetooth Network Worm
Wireless has already been one of the most important technologies in 21 Century.
Mobile phone is not just a telephone and becomes an intelligent device with multi-
function. Smart devices, such as PDAs, smart phones, on-board car computers, and
even new generation appliances are now equipped with communications functions.
Nowadays, human live in a huge Wireless network and are entering a wireless era. In
the meantime, wireless technology open a new window to attacker, and parts of
attacking techniques had been immigrated to wireless network.
IEEE 802.11 (Wi-Fi) and Bluetooth are the primary wireless technology in internet.
Although both of technologies were implemented in 1990’s, the first mobile virus
appeared in June 2004, and it was called ‘Caribe’ [17]. Caribe was written for the
Symbian OS and spread via Bluetooth [38]. In July 2004, antivirus company discovered
another mobile virus, ‘Duts’ [18], which is the first mobile virus to infect the Windows CE
OS. One more month later, the first backdoor virus for mobile platforms appeared,
called ‘Brador’. Then several Trojan viruses were developed for Symbian platform, such
as ‘Mosquit’, ‘Locknut’, ‘Dampig’ [39, 40, 41], and so on. Until January 2005, a new
mobile virus, ‘Comwar’ [19], brought new functionality – the first malicious program with
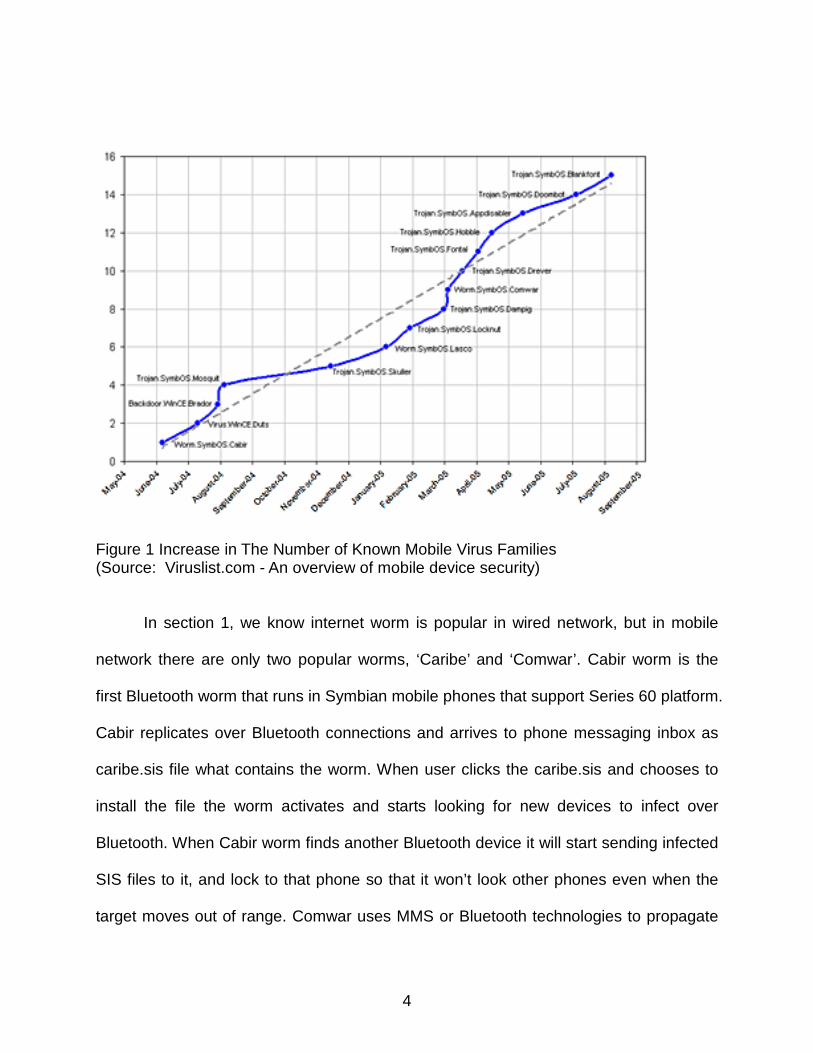
the ability to propagate via MMS. From above introduction, we notice the speed of
increasing number of mobile virus grows significantly. Figure 1.2.1 shows mobile virus,
15 mobile virus and 27 variants were discovered during one year.
4
Figure 1 Increase in The Number of Known Mobile Virus Families (Source: Viruslist.com - An overview of mobile device security)
In section 1, we know internet worm is popular in wired network, but in mobile
network there are only two popular worms, ‘Caribe’ and ‘Comwar’. Cabir worm is the
first Bluetooth worm that runs in Symbian mobile phones that support Series 60 platform.
Cabir replicates over Bluetooth connections and arrives to phone messaging inbox as
caribe.sis file what contains the worm. When user clicks the caribe.sis and chooses to
install the file the worm activates and starts looking for new devices to infect over
Bluetooth. When Cabir worm finds another Bluetooth device it will start sending infected
SIS files to it, and lock to that phone so that it won’t look other phones even when the
target moves out of range. Comwar uses MMS or Bluetooth technologies to propagate
5
that operates on Symbian Series 60 devices, either. CommWarrior not only spread over
Bluetooth but also MMS. If it is the first hour of the 14th of any month, the threat resets
the device.
In 2006, over 600 million Bluetooth enabled devices were shipped [32], and there
are more than a billion Bluetooth units to be installed. People use Bluetooth at home for
internet or intranet, use Bluetooth headset for cell phone, number of Bluetooth hot-spots
also are set up in Coffee, restaurant and cinema. Bluetooth Indeed give people
convenience, but it also provides a chance for attacker to spread worm in wider range.
1.3 Properties and Characteristics of Bluetooth
1.3.1 History of Bluetooth Technology
Bluetooth wireless technology is a short-range communications technology
intended to replace the cables connecting portable and/or fixed devices while
maintaining high levels of security. In 1994, the Swedish company Ericsson initiated the
Bluetooth Technology movement [20]. "The original intention was to make a wireless
connection between something like an earphone and a cordless headset and the mobile
phone," Haartsen said who is Bluetooth co-inventor. In 1998 the Bluetooth Special
Interest Group (SIG) is formed and officially adopts the project name “Bluetooth” as the
name of the technology. From 1999 to 2004, Bluetooth SIG adopts three Bluetooth Core
Specification Versions, now it is Version 2.0 + Enhanced Data Rate [21].

6
1.3.2 Features of Bluetooth Technology
1.3.2.1 Unlicensed Spectrum
Bluetooth Technology operates in the unlicensed industrial, scientific and medical
(ISM) band at 2.4 to 2.485 GHz, using a spread spectrum, frequency hopping, full-
duplex signal at a nominal rate of 1600 hops/sec.
1.3.2.2 Efficient Interference
Adaptive frequency hopping (AFH) capability in Bluetooth Technology reduces
the interference between wireless technologies sharing the 2.4GHz spectrum. This
adaptive hopping allows for more efficient transmission with the spectrum, providing
users with greater performance. The signal hops among 79 frequencies at 1 MHz
intervals to give a high degree of interference immunity.
1.3.2.3 Three Operating Range
Class 3 radios: up to 1 meter
Class 2 radios: 10 meters (most using in mobile devices)
Class 1 radios: 100 meters (industrial use cases)
1.3.2.4 Low Power Consumption
Most users used Class 2 radios, so its power is 2.5mW. In addition, the Bluetooth
device is allowed radios to be power down when inactive.
7
1.3.2.5 Data Rate
In Bluetooth Core Specification Version 1.2, Data Rate is set to 1 Mbps; however,
in Version 2.0 + EDR, it increases to 3 Mbps.
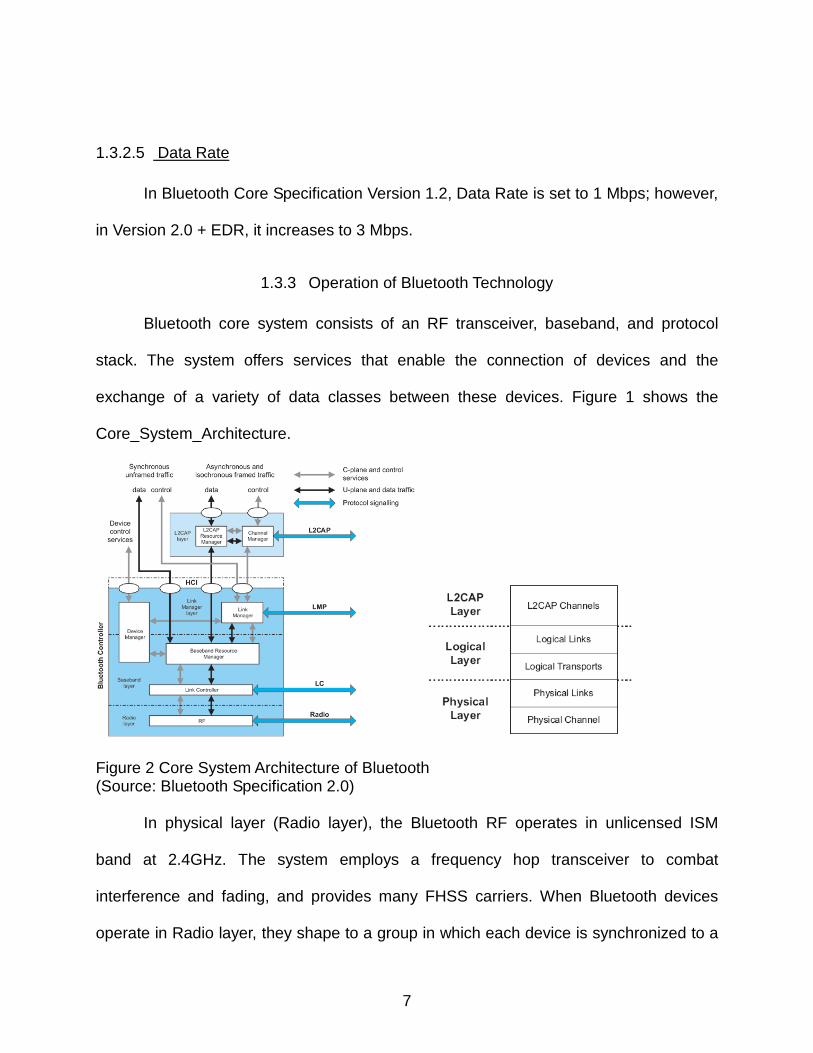
1.3.3 Operation of Bluetooth Technology
Bluetooth core system consists of an RF transceiver, baseband, and protocol
stack. The system offers services that enable the connection of devices and the
exchange of a variety of data classes between these devices. Figure 1 shows the
Core_System_Architecture.
Figure 2 Core System Architecture of Bluetooth (Source: Bluetooth Specification 2.0)
In physical layer (Radio layer), the Bluetooth RF operates in unlicensed ISM
band at 2.4GHz. The system employs a frequency hop transceiver to combat
interference and fading, and provides many FHSS carriers. When Bluetooth devices
operate in Radio layer, they shape to a group in which each device is synchronized to a

8
common clock and frequency hopping pattern. One device is called the master that
provides the synchronization reference. All others are called slaves. The master and the
slaves form a piconet. Devices in a piconet use a specific frequency hopping pattern
that is a pesudo-random ordering of the 79 frequencies in the ISM band. The data is
stored in package and is transmitted by a number of consecutive time slots. In addition,
the physical link is formed between any two devices that transmit packets in either
direction.
Above physical layer there is Logical layer (Baseband layer) and L2CAP layer. In
the Logical layer, logical link can control flow, acknowledgement/repeat mechanisms,
sequence numbering and scheduling behavior, and logical transports carry different
types of logical links.
The highest layer is L2CAP layer that provides a channel-based abstraction to
applications and services. It carries out segmentation and reassembly of application
data and multiplexing and de-multiple channels over a shared logical link. L2CAP has a
protocol control channel that is carried over the default ACL logical transport.
1.4 Bluetooth Worm Infection
Before Bluetooth worm propagate in wireless network, the attacker need discover
vulnerable node. In Bluetooth operations, a Bluetooth enabled device use the inquiry
procedure to discover nearby devices, or to be discovered by devices in their locality.
When a Bluetooth enabled device try to find new devices, it enter inquiry substate. In
this substate, it shall repeatedly transmit the inquiry message at different hop
frequencies. If a Bluetooth enabled device allows itself to be discovered, it shall
9
regularly enter the inquiry scan substate to respond to inquiry messages. When the
inquiry message is received in the inquiry scan substate, the recipient shall return an
inquiry response (FHS) packet containing the recipient’s device address and other
parameters. The entire inquiry procedure is asymmetrical, and does not use any of the
architectural layers above the physical layer.
After neighbors discovering, two Bluetooth enabled devices enter paging
(connecting) procedure. In order to set up a connection between two devices, only the
Bluetooth device address is required. In the page scan substate, the device shall select
the scan frequency according to the page hopping sequence determined by the device’s
address. Because there are master and slave in a piconet, the master enters page
substate in page scan substate. The master tries to coincide with the slave’s scan
activity by repeatedly transmitting the paging message consisting of the slave’s device
access code (DAC) in different hop channels. On receiving the page message, the slave
enters the slave response substate that the salve device transmits a slave page
response message. Then the master receive a slave page response message, it enter
the master response substate. The master shall transmit an FHS packet to slave device.
If the slave’s response is received by the master, the master enters the connection state
and start to transmit data.

10
Figure 3 Messaging at Initial Connection (Source: Bluetooth Specification 2.0)
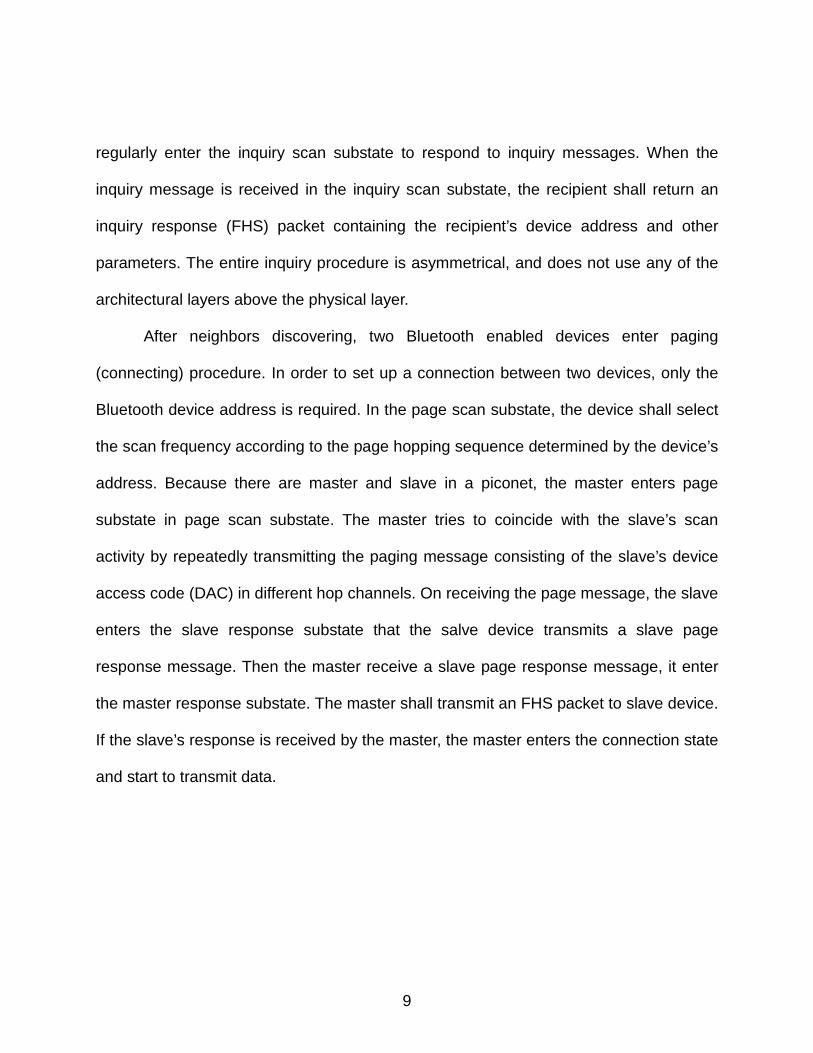
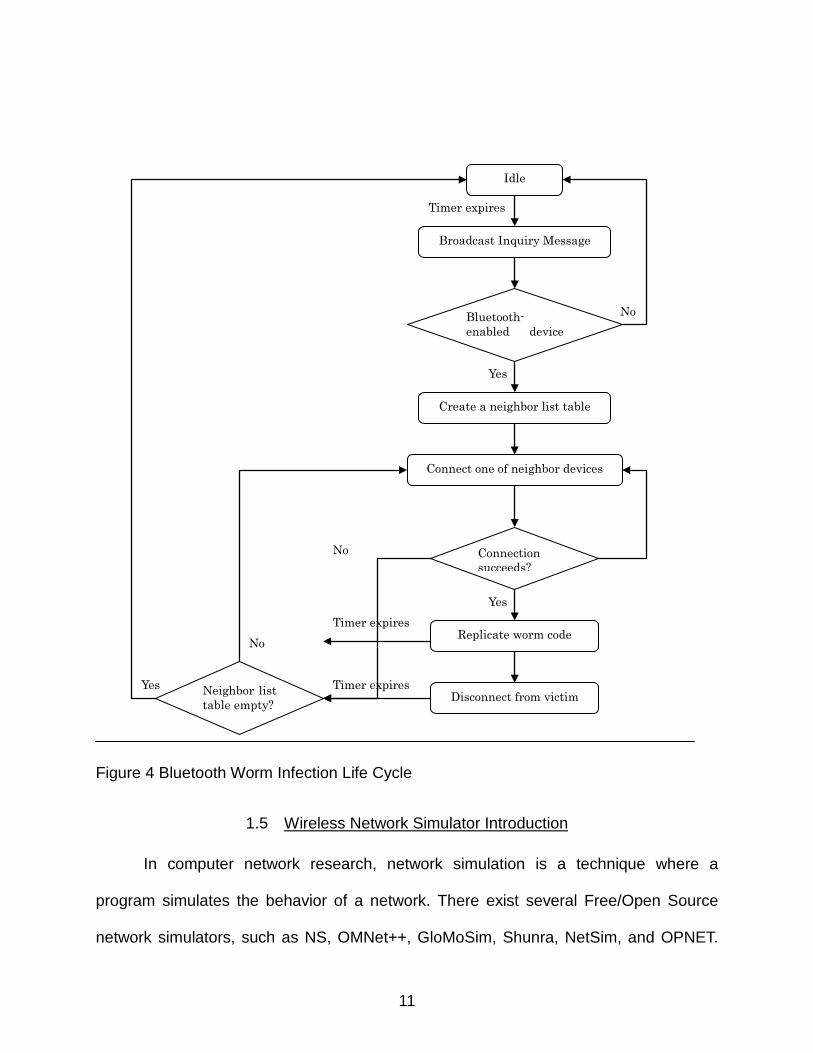
For a regular Bluetooth device, they are usually in Idle (sleep state). In this paper,
however, attacker always is in inquiry state. Firstly it broadcasts the inquiry message.
When Bluetooth enabled devices response the inquiry request, attacker generates a
neighbor list table. It extracts one of neighbor to set up the connection as slave device.
If successful connection, infected file will be sent to vulnerable device. Then attacker
disconnect with infected device. During the process of replicating infected file and
disconnecting, there exists a timer, when the timer expired, the attacker device
automatically stop the connection and try to connect other neighbor in table. If the
neighbor list table is empty, attacker will broadcast a new inquiry message. When the
user of vulnerable device runs the infected file, it is infected and starts to broadcast an
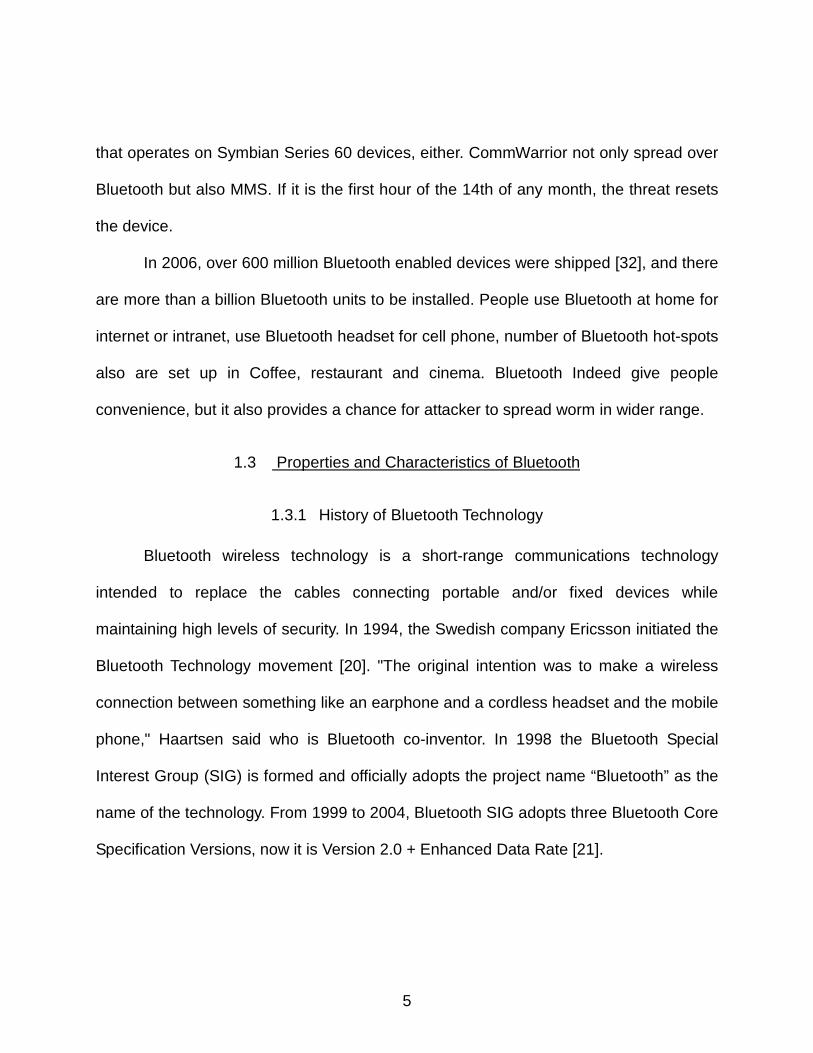
inquiry message to find new vulnerable neighbors. Figure 4 describes the entire
procedure of Bluetooth worm infection.
11
Figure 4 Bluetooth Worm Infection Life Cycle
1.5 Wireless Network Simulator Introduction
In computer network research, network simulation is a technique where a
program simulates the behavior of a network. There exist several Free/Open Source
network simulators, such as NS, OMNet++, GloMoSim, Shunra, NetSim, and OPNET.
Yes
Idle
Broadcast Inquiry Message
Bluetooth-enabled device
Connect one of neighbor devices
Connection succeeds?
Replicate worm code
Disconnect from victim
Create a neighbor list table
Neighbor list table empty?
Yes
Yes
No
No
No
Timer expires
Timer expires
Timer expires
12
Most of them include the wireless network simulation.
In addition, IBM developed BlueHoc [22] simulator that is a Bluetooth extension
for NS (ver2.1b6). It implements basic features of Bluetooth baseband, Logical Link
Control and Adaptation Protocol (L2CAP) and Link Manager Protocol (LMP), and it adds
eight C++ classes to ns to support device discovery, paging and connection
establishment functions, and it has trace support and graphical interface. After BlueHoc,
MIT developed another Bluetooth simulator, Blueware [23]. It is still an ns extension and
is based on the BlueHoc simulator. Therefore, Blueware use the most of original code,
but it adds large number of new code. In particular, Blueware provides an easy-to-
program interface to various scatter net formation, link scheduling schemes and their
related algorithm, TSF and LCS. Blueware works with NS (ver 2.1b7a).
Although BlueHoc and Blueware implement most of basic functions of Bluetooth,
they were developed in 2002 and just work at NS’s old version, the newest NS2 [24] is
ver2.31 released Mar 10, 2007), and also they support Bluetooth specification 1.1, the
newest Bluetooth specification is ver2.0 + Enhanced Data Rate. Because both of above
simulator can not satisfy the new NS2 and Bluetooth specification, University of
Cincinnati developed a new Bluetooth simulator, UCBT [25], which work at NS-2
(ver2.28 even later version) and partially support Bluetooth specification 2.0. As same
features with BlueHoc and Blueware, UCBT is NS-2 based simulator and supports basic
Bluetooth functions as well. It, however, add more than 28,000 lines of C++ codes, and
it adapts to the PAN profile with Bluetooth Network Encapsulation Protocol (BNEP) and
Enhanced Data Rate (EDR) specification, and it takes clock drift into account. UCBT is

13
the most accurate, complete and up-to-date open-source Bluetooth simulator.
1.6 BTWS (Bluetooth Worm Simulator)
From pervious section, we learn that NS-2 and OPNET are so large and complex,
and they are good at simulating small size of network, but for large scale network they
run slowly and low efficiency. BlueHoc and Blueware are too old to compatible for new
C++ complier. UCBT is a full implementation of the Bluetooth protocol stack, but it is
specially developed for Bluetooth scatter net research and does not support worm
propagation model. In our simulation, we focus on propagation of Bluetooth worm.
Simulator need support worm behaviors. Unfortunately, there is no simulator to provide
worm model.
Therefore, I develop new simulator, BTWS (Bluetooth Worm Simulator). In our
research, we mainly consider how the Bluetooth worm propagates quickly in wireless
network and what parameters infect the spreading speed of the worm. In BTWS, we
don’t concern scatter net and energy issue. BTWS uses some NS-2 codes that are
wireless class, so every Bluetooth device is a node with speed, location and
communication range properties. BTWS has several advantages. It can calculate the
worm propagation quickly. It isn’t a NS-2 extension, so its size is so small and support
small and large scale wireless network.
14
1.7 Contribution of Thesis
In this thesis, we research on worm propagation behaviors in wireless network
and focus on Bluetooth technology wireless. Our primary contributions in this thesis are
below:
• From Bluetooth technology specification, we learn the mechanisms of the
Bluetooth worm propagation.
• Develop a new simulation – BTWS (Bluetooth Worm Simulation), which is
based on part of Bluetooth technology specification 2.0 and uses some of NS-2’s code.
• Simulate two sizes of wireless network, Local scale and Wide scale.
--In local scale simulation, we simulate worm propagation with different
properties, such as density, speed, the number of initial infected nodes, contact degree
and inquiry time. Faster speed help worm propagation, but longer inquiry time and co-
channel interference reduce the worm propagation.
--In Wide scale simulation, we implement five scenarios to learn that it is positive
impact that Bluetooth devices often transfer among different group.
In section 1, this paper introduces the background of computer worm in wired
network and wireless mobile network. In section 2 we discuss some related work in
Bluetooth worm. We simulate the worm behaviors in local scale and large scale
network environment in section 3. Then in section 4 we try to find defense method for
Bluetooth worm. Finally in section 5 we present our conclusion.
15
2 CHAPTER TWO: RELATED WORK
Researcher had already done a lot of work on Internet worm including wire and
wireless network, and most of them focus on analyzing, modeling and simulating. But
for Bluetooth wireless network, there are few papers, especially on worm propagation
behaviors analyzing. Yan et al. [1] propose a baseline worm model to analyze the speed
of Bluetooth worm propagation. Yan also use the radio propagation model to calculate
signal attenuation. Through simulation he analyzes the effects of speed, density and
network size and either did dynamics analysis in different scenarios. He found that
mobility may not be key feature for Bluetooth worm propagation, and link instability
owing could reduce the worm spreading speed, and the inference factor even slow
down the worm propagation in high density network. Except of Bluetooth network, Yan
considers the out-of-band propagation. An intelligent attacker can not only use Bluetooth
technology, but also he can use GSM/CDMA and GPRS technology to accelerate worm
spreading [27].
Mickens et al. [2] find the standard worm propagation models can not satisfy with
mobile network, so he introduced new model, called probabilistic queuing. He uses
several examples to demonstrate the failure of the Kephart-White model [30] in mobile
environments, which can not capture the non-trivial connectivity variances and is
insensitive to node speed in mobile environments. Probabilistic queuing model treats
node mobility as a first-order concern. It provides an accurate threshold condition
related with the virulence of malicious code to the likelihood, and it also provide

16
accurate estimates of these persistent infection levels.
Bose et al. [3] notice the growth of the SMS/MMS and Bluetooth technology will
bring the more mobile viruses and worm in mobile environment. They study MMS and
Bluetooth devices vulnerabilities in-depth and developed a fine-grained agent-based
mal-ware modeling (AMM) framework to study the worm propagation. They use the
SMS usage characterization collected call data records and SS7 traces [31] from a
large cellular carrier to simulate the worm spreading. The results show the growth rate
of a mobile virus exploiting SMS messages is small, but the growth rate increases
significantly when these handsets are highly vulnerable to Bluetooth exploits.
Su et al. [4] and other researcher in University of Toronto did a preliminary
investigation of the worm infection in Bluetooth environment. They implement real
experiments, which use PDAs to scan other Bluetooth devices in Mall and subway. The
results of tracing activities show it is very quickly and easy for Bluetooth worm to spread
in a popular place. Moreover, mobility can not impact the worm exploiting vulnerability
and whatever the direction is. In addition, they use trace-driven simulation to do
experiment in a large scale network [29]. They find Bluetooth worm can infect 10,000
devices in a few days and spreads more rapidly in day than does in night. N srl et al. [37]
creates a BlueBag device to convert attack and scan Bluetooth device. They
demonstrate the existence of a very high risk potential, created by low awareness, ever-
increasing functionalities and complexity, and by the feasibility of targeted, covert
attacks through Bluetooth-enabled malware.
17
Other researchers do not study especially in Bluetooth but in other wireless
network. Khayam et al. [33] develop a new model, topologically-aware worm
propagation model for wireless sensor networks. It takes the MAC layer interference into
consideration. In his simulation, he also performs the Box-Muller transformation [34] to
generate Gaussian random variable for simulating the fading affected of neighbor nodes.
Finally, the new model accurately predicts the result of simulation. However this model
just fit in stationary environment. Hoh et al [35] study the worm propagation in ad hoc
with wide-area network. He proposes a new architecture for an intrusion response
system by developing and analyzing location-based quarantine boundary estimation
techniques. The detection probability of this technique is greater than 95% and a false-
alarm rate of less than about 35%. Wagner et al. [36] investigates the behavior of the
worm propagation and design worm simulation to predict its spreading potential in order
to defense worm by early detection.
18
3 CHAPTER THREE: SIMULATION
In my experiment, there are two part, local wireless network and wide wireless
network. Bluetooth technology has a limitation that devices with Bluetooth-enable just
communicate within an operating range, therefore, Bluetooth worm can spread faster in
a high density public place than in a low density walking road. In simulation part, most
experiment simulates the Bluetooth worm in a local group. However, in the real world,
people often transfers from one place to another place, and cell phone carrier covers
range as large as possible in order to achieve the biggest revenue. So I need simulate
the Bluetooth worm propagation in a wide environment as well.
In local wireless network, all nodes (individual Bluetooth device) are arranged in
an area and their movement only is in local network, and no node can move outside,
which means a stationary environment. On the other hand, in wide wireless network,
there exist many groups and nodes in each group can be exchanged, which means a
mutable environment.
19
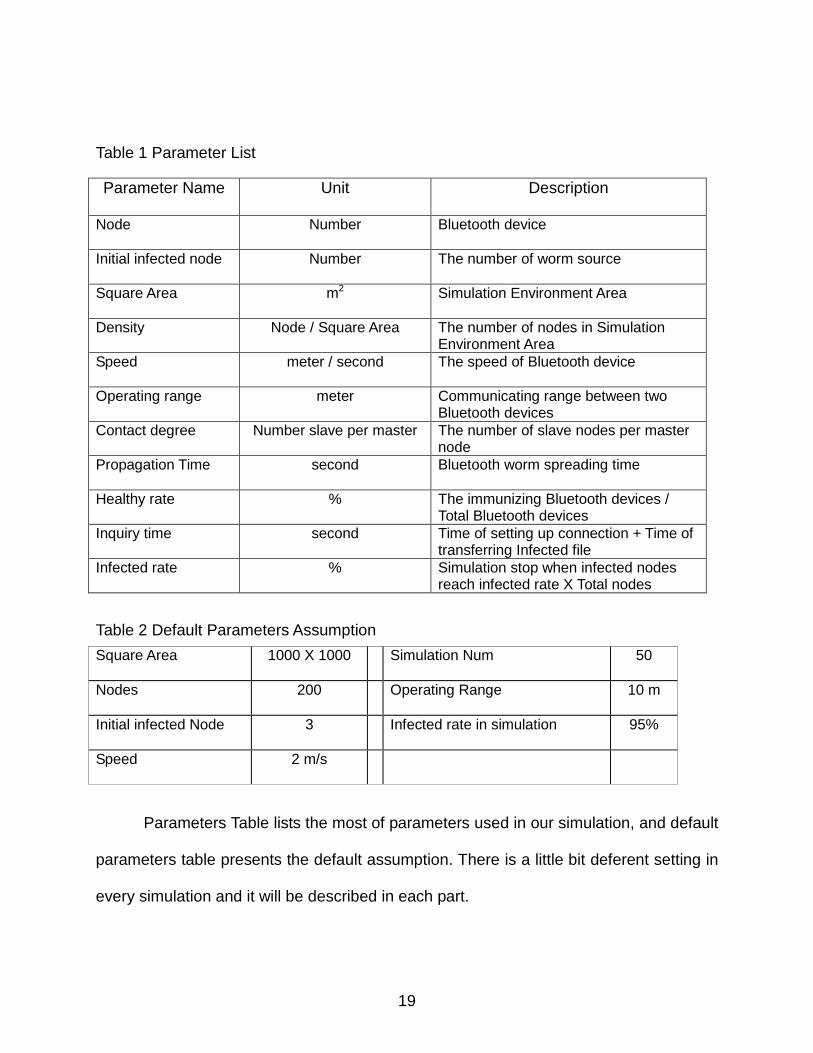
Table 1 Parameter List Parameter Name Unit Description
Node Number Bluetooth device
Initial infected node Number The number of worm source
Square Area m2 Simulation Environment Area
Density Node / Square Area The number of nodes in Simulation Environment Area
Speed meter / second The speed of Bluetooth device
Operating range meter Communicating range between two Bluetooth devices
Contact degree Number slave per master The number of slave nodes per master node
Propagation Time second Bluetooth worm spreading time
Healthy rate % The immunizing Bluetooth devices / Total Bluetooth devices
Inquiry time second Time of setting up connection + Time of transferring Infected file
Infected rate % Simulation stop when infected nodes reach infected rate X Total nodes
Table 2 Default Parameters Assumption
Parameters Table lists the most of parameters used in our simulation, and default
parameters table presents the default assumption. There is a little bit deferent setting in
every simulation and it will be described in each part.
Square Area 1000 X 1000 Simulation Num 50
Nodes 200 Operating Range 10 m
Initial infected Node 3 Infected rate in simulation 95%
Speed 2 m/s
20
3.1 Simulation in Local Wireless Network
I assume the local network is in 1000 X 1000 square areas. Each node
(Individual Bluetooth device) has several properties, such as position, destination
position, and speed and infection status. All nodes in this area are mobility, and they
move from one position to a random destination position, and when node arrive the
destination, it will randomly move to another position and continue this loop. During the
simulation, each node calculates the distance with other nodes, if it finds one node is
within communication range, it adds the neighbor into its neighbor list table. Next it
checks the neighbor’s infection status, if the neighbor node is not infected, it will
establish connection and transfer infected file, otherwise, it iterate other neighbors in
table. In experiment, we simulate Bluetooth worm’s behavior with different parameters,
for example, speed and communication range. In Bluetooth specification, discovering
and paging session is to find neighbors and then set up connection with it, this
procedure is dominate part in Bluetooth communication. Therefore, we consider two
case, ideal case and real case – set up connection time + transfer file time ≈ zero and >
zero. In addition, contact degree is one factor to be simulated, and there are still two
cases, contact degree is one and contact degree is up to seven. Except of node’s
properties, we either simulate different scenarios including different density of the
network, different number of initial infected nodes.
As we known, one of the important factors of Bluetooth technology is energy, but
in our experiment we do not consider energy model, all of simulation are under ideal
energy model that every node is live during the simulation. We will discuss the reasons

21
later.
3.1.1 Propagation Speed
Bluetooth worm has similar properties with other computer worm, which is self-
replicating as fast as possible. The first experiment is to simulate the propagation speed
so that we can study the behavior of the worm spreading process. I use the default
assumption to do experiment, and calculate the number of infected nodes per 100 s. In
Figure 1 the two sides, the beginning and the end of worm propagation, the spreading
speed is low because there are few infected node at the start time and at the end it is
difficult to find un-infected neighbors. The important phase is the middle of worm
propagation, and the infected nodes significantly replicate themselves to attack
vulnerabilities.
Figure 5 Bluetooth worm propagation speed per unit time

22
3.1.2 Density Effect
Density of the group is very important factor. Because we assume the area size
is constant, we change the density by putting different number of nodes in this square
area. In our simulation, we chose 50, 80, 100, 130, 150, 180, 200, 230, 250, 280 and
300 nodes in this square area. The properties and movement of each node are default
setting that is random movement with random speed, and its spreading worm behaviors
follow the rules mentioned before.
Figure 6 Propagation Curve of 50 Nodes (Infected Rate: 95%)
23
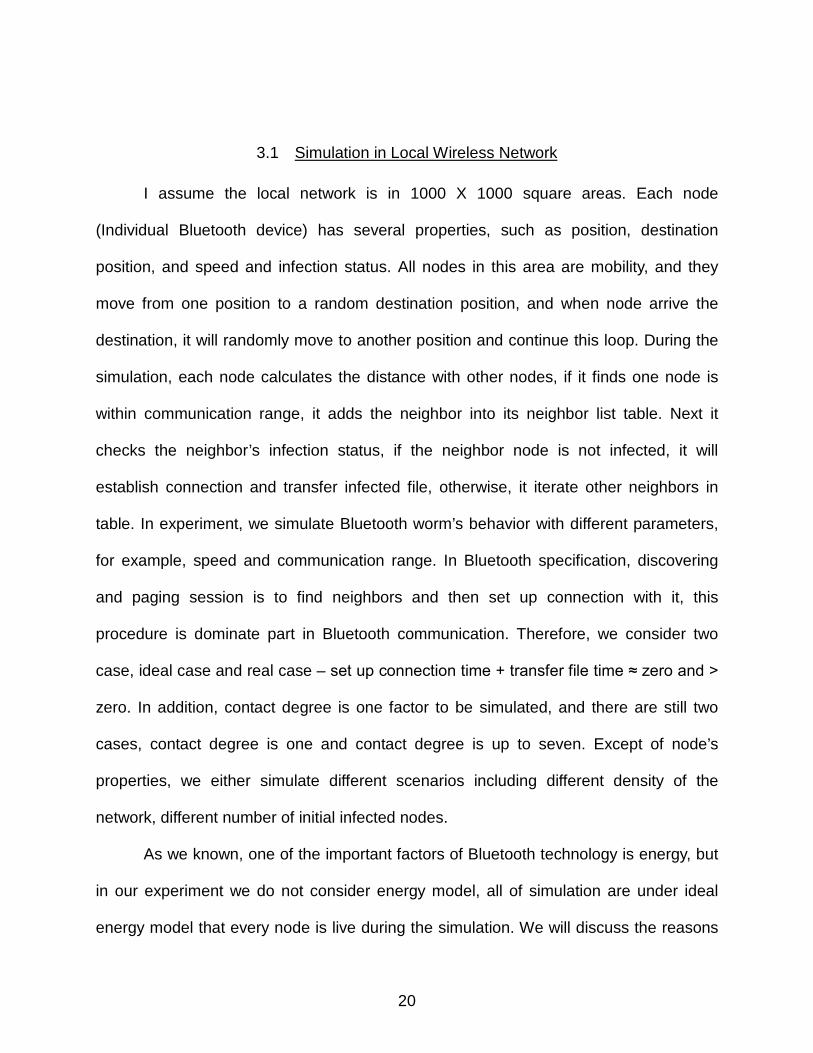
Figure 7 Propagation Curve of 200 Nodes (Infected Rate: 95%)
Figure 8 Propagation Time in Different Density
Figure 5 and Figure 6 describe the relationship between the time of worm

24
propagation and infected nodes. It is the same as first experiment and is the another
way to present worm propagation speed, which is low spreading speed at the beginning
and the end of propagation and in the middle of the worm accelerates propagation the
spreading process. This behavior is the common property with worm in wired network.
Figure 7 presents a curve between infection time and the density of the network.
Obviously, with increasing the density of network, in other word, increasing the number
of nodes, worm spreading speed is faster and more nodes are infected. When only 50
nodes are activity in 1000 X 1000 m square area, the density is 5.00E-5. It is a low
density value, so it takes over 4000 seconds for malicious node to find a vulnerable
node in its neighbor. The number of nodes increases to 80, and the infection time
decrease to 2914 seconds. When the number of nodes is as twice as 50, the infection
time almost is half of the one in 50 nodes. However, the potential tendency stops when
nodes continue increasing. From 200 nodes to 300 nodes, the infection time is greater
than 1000 seconds, and it is hard to forward decreasing the speed of worm propagation.
3.1.3 Effect of the moving speed of Bluetooth devices
This paper discusses worm spread in mobile wireless network, so the speed of
each node is one of important parameter in our simulation. We set the speed as 1, 2, 8,
15, 20, 25, 30, 35, 40, 45 and 50 m/s, these are eleven different maximum speed. The
speed 1 m/s is to simulate people taking a walk, and speed 2 m/s is regular speed of a
person. The maximum speed 8 m/s simulate a runner person. From 15 m/s to 50 m/s,
they can not present any real scenarios and our purpose is to find the trend of node’s
speed argument for worm propagation.

25
Figure 9 Propagation Curve of Speed: 1 m/s and 2 m/s
Figure 10 Propagation Curve of Speed: 8m/s, 15 m/s and 20 m/s
26
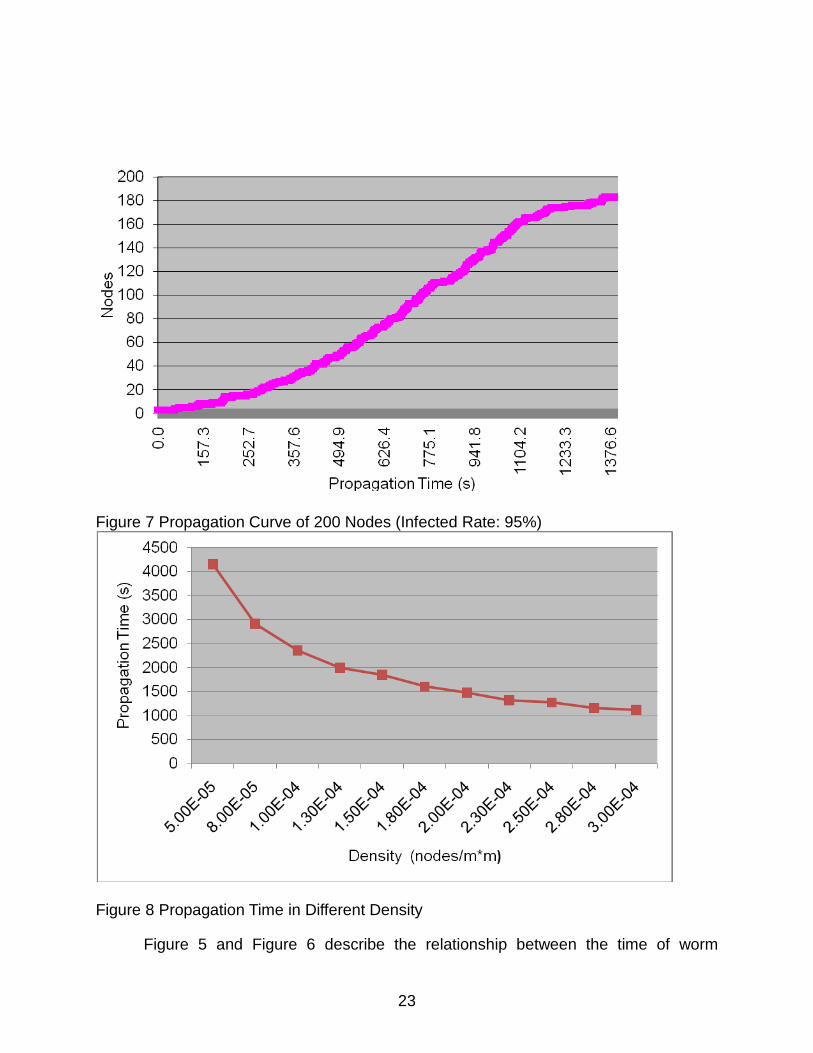
Figure 11 Propagation Time in Different Speed
The key of mobile wireless network is that nodes can move, hence, the speed
indubitably is major factor. Figure 8 and Figure 9 show the comparing curve among
different speeds, and Figure 10 gives us speed and propagation curve. When speed
changes from 1 m/s to 2 m/s and from 2 m/s to 8 m/s, the infected speed has huge
increasing. At the beginning of this curve, there is almost a linear relationship between
the speed of node and infection time. This part is very useful for attacker and they try to
move faster in order to increase the worm propagation. Above 8 m/s, however, speed
seems be not the key parameter to affect the worm propagation. Although infection time
still decreases with the speed increasing, the value is too small to help attacker to infect
rapidly. Therefore, the speed in a certain range (e.g. smaller than 8 m/s) can let the
large number of nodes infected in mobile wireless network.
27
3.1.4 Operating Range effect
Whenever you use which kind of wireless technology, all of them have the
operating range. Only two nodes are within the operating range, they can set up
connection and transfers file each other. Once out of the operating range, they are no
any relationship between them. With the development of wireless technology, operating
range either extend a wide area.
Bluetooth technology has three kind of operating range depends on the device
class:
Class 3 radios – have a range of up to 1 meter or 3 feet;
Class 2 radios – most commonly found in mobile devices – have a range of 10
meters or 30 feet;
Class 1 radios – used primarily in industrial use cases – have a range of 100
meters or 300 feet.
In this set of experiment, we simulate all three standard operating ranges to
predict the effects with the improvement of technology. We set 200 nodes in 1000 X
1000 square areas, the maximum speed is 2 m/s and the initial infected nodes are 3.

28
Figure 12 Propagation Time of Range Effect
Simulation result:
-- Operating Range: 1, Propagation time: 13382.9 s
-- Operating Range: 10, Propagation time: 1488.65 s
-- Operating Range: 100, Propagation time: 274.41 s
Except speed of node, operating range is another unavoidable factor in Bluetooth
network. In modern society, there is the great number of Bluetooth device, most of user
use class 2 that is 10 meter operating range. In table 1, when operating range is 1 meter,
it takes over 3.7 hours (over 13,000 seconds) to infect 191 nodes. If we use class 2
standard operating range, attacker only take 1/10 time to infect the same number of
nodes. This is an unbelievable decreasing, but this is not end of road. In future,
Bluetooth device would change to class 3 that the operating range is up to 100 meters.
29
In our experiment, the infection time value is below 300 seconds to infect 191 nodes.
Operating range increases 10 times from 10 meter to 1 meter, the infected time
increase 10 times either. Although the class 3 doesn’t reach 10 times from class 2, the
infected time is the lowest in our simulation. Therefore, Bluetooth worm is a potential
threaten for next generation Bluetooth device.
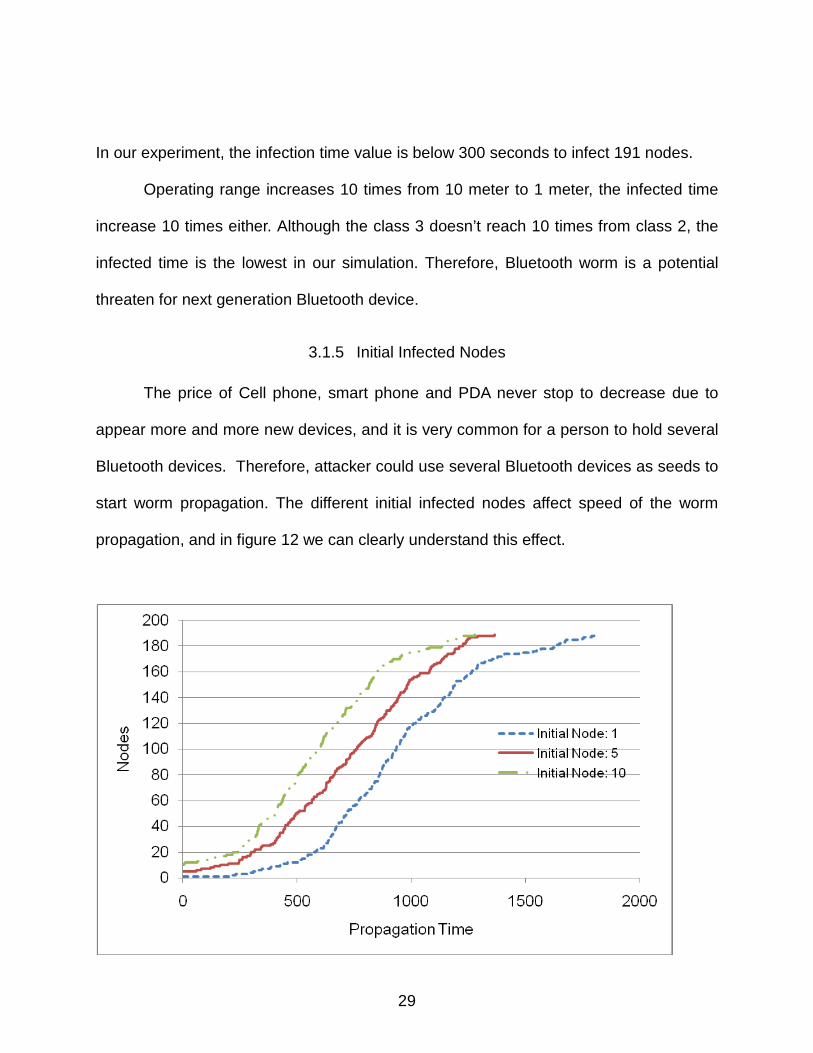
3.1.5 Initial Infected Nodes
The price of Cell phone, smart phone and PDA never stop to decrease due to
appear more and more new devices, and it is very common for a person to hold several
Bluetooth devices. Therefore, attacker could use several Bluetooth devices as seeds to
start worm propagation. The different initial infected nodes affect speed of the worm
propagation, and in figure 12 we can clearly understand this effect.

30
Figure 13 Propagation Curve in Different Initial Infected Nodes: 1, 5, 10
Figure 14 Initial Infected Nodes and Propagation Time
From Figure 13 the number of initial infected nodes is set from 1 to 10, and the
infection time become short with adding initial infected nodes, but the decreasing value
is not too big. The primary reason is when initial infected nodes increase, and the
opportunity of discovering vulnerable nodes would decrease. We can explain it from
worm propagation figure. When worm infect over 90% nodes in a fix area, the speed of
worm propagation begin to decrease significantly, and it is hard for an infected node to
find a healthy vulnerable neighbor node. Therefore increasing the number of initial
infected node only helps worm spreading at the beginning stage, while the most of node
are infected, the worm spreading changes to low value. Above all we can know the
number of initial infected node is not key factor of the worm propagation.

31
3.1.6 Contact Degree
In this section, we consider the contact degree of the Bluetooth device. We
assume that one Bluetooth device can set up only one connection with another
Bluetooth device, which means at one unit time, the attacker just infect one Bluetooth
device. In previous simulation, there is no such limitation. In this simulation, Contact
degree is set to 1, if attacker finds over 1 vulnerable neighbors, it connects the one with
minimum distance between them. Because in real wireless network there are not all cell
phones or PDA with Bluetooth function, the devices without Bluetooth function are
immunization to the Bluetooth worm, e.g. 20% cell phone can not be infected. We call
20% as Healthy Rate. In this experiment, we simulate 0%, 20%, 40% and 60% Healthy
Rate. Figure 14 shows a relationship between the infection time and Healthy Rate.
Figure 4.6 uses different ways to describe the effect of Contact degree under different
Healthy Rate. The basic arguments: Nodes 200, Speed 2m/s, initial infected Nodes 3,
Range 10m, and Area 1000 X 1000 m2.
32
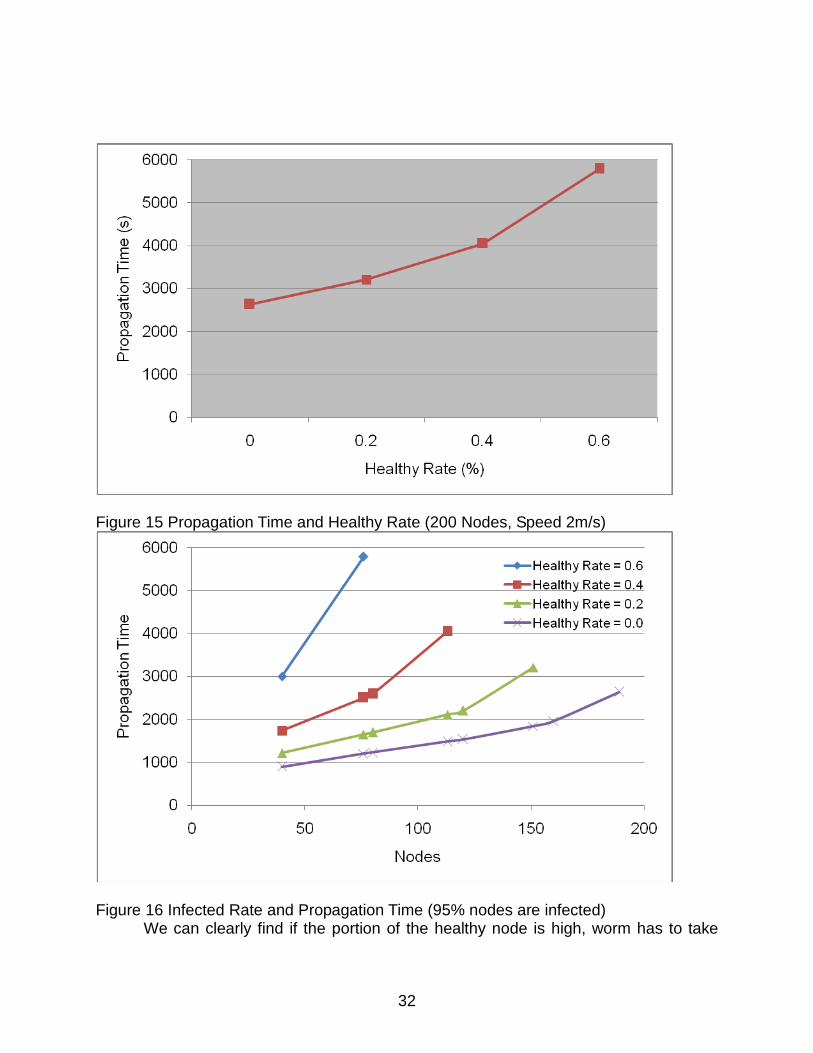
Figure 15 Propagation Time and Healthy Rate (200 Nodes, Speed 2m/s)
Figure 16 Infected Rate and Propagation Time (95% nodes are infected) We can clearly find if the portion of the healthy node is high, worm has to take
33
more time to infect vulnerable node. Originally, when the healthy rate increase as to
decrease the total number of vulnerable node, and it seems that the worm should take
fewer times to infect smaller portion of nodes. On the contrary, worm need take more
time to spread itself in the network. From figure 3.14 the healthy rate and infection time
are almost linear relationship. In figure 15 we compare four different healthy rate
scenarios, and the healthy rate does not just effects part of the worm propagation, it
effect the whole process. To infect the same number of vulnerable nodes, the lower
healthy rate use smaller time than bigger healthy rate.
3.1.7 Inquiry Time Effect
In density, speed and initial infected nodes simulation, all experiment is under ideal
model. Previous simulation we consider the contact degree of each node, but all of
them assume no time to use for inquiring and setting up connection. A Bluetooth device,
however, can not ignore the above both parameters. Normally, both process of inquiring
and setting up connection should take several hundreds mms, even several seconds.
We simulate the inquiry time as 1, 2, 3, 4 and 5 seconds. Then we assume each node
take 1 second to set up connection and finish the infected file transmission, but we
change the node’s speed.
34
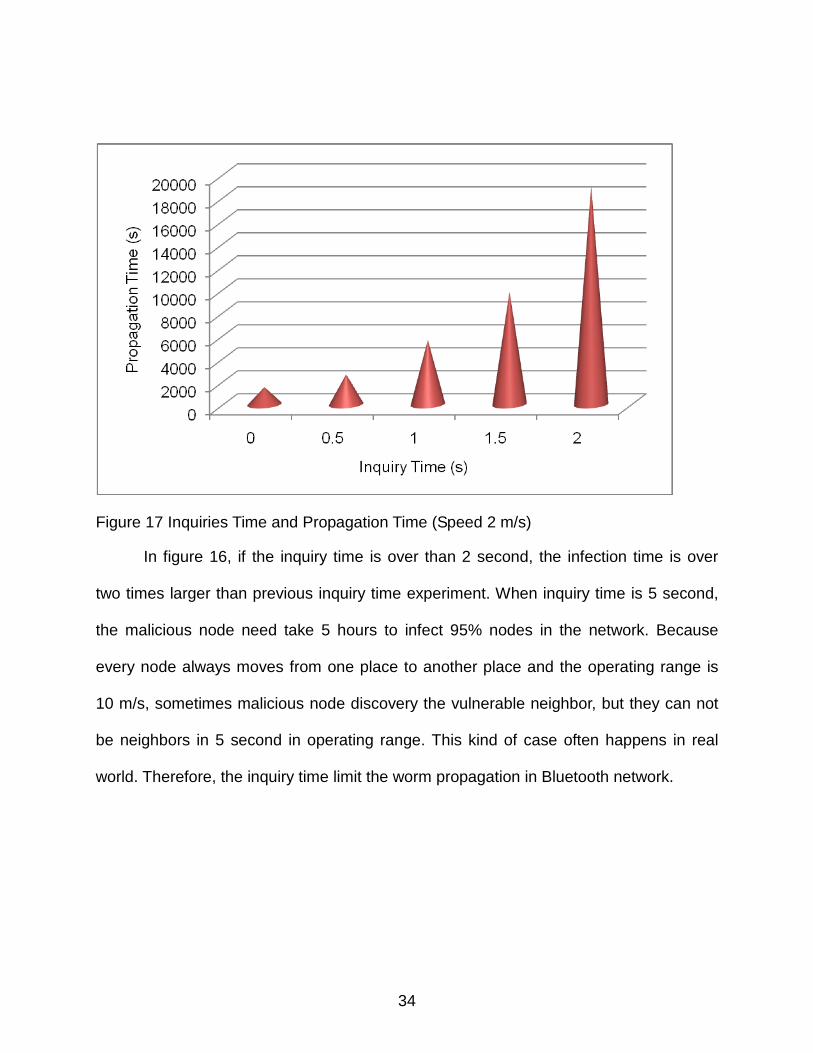
Figure 17 Inquiries Time and Propagation Time (Speed 2 m/s)
In figure 16, if the inquiry time is over than 2 second, the infection time is over
two times larger than previous inquiry time experiment. When inquiry time is 5 second,
the malicious node need take 5 hours to infect 95% nodes in the network. Because
every node always moves from one place to another place and the operating range is
10 m/s, sometimes malicious node discovery the vulnerable neighbor, but they can not
be neighbors in 5 second in operating range. This kind of case often happens in real
world. Therefore, the inquiry time limit the worm propagation in Bluetooth network.
35
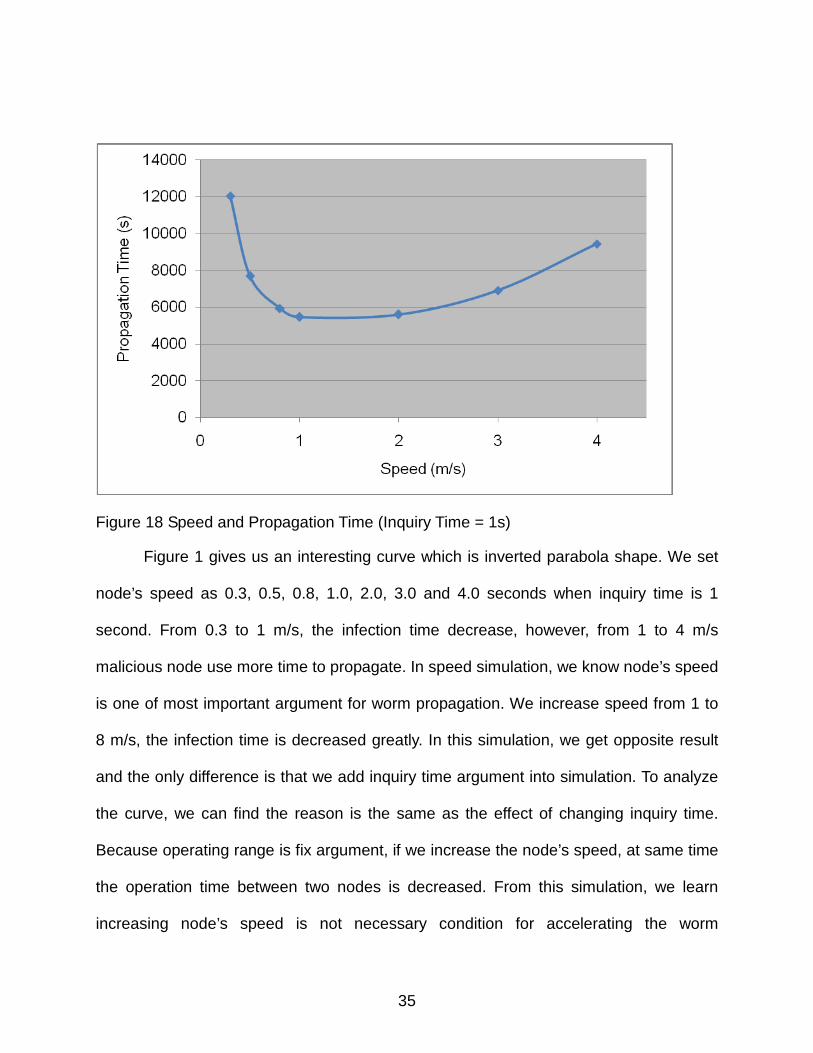
Figure 18 Speed and Propagation Time (Inquiry Time = 1s)
Figure 1 gives us an interesting curve which is inverted parabola shape. We set
node’s speed as 0.3, 0.5, 0.8, 1.0, 2.0, 3.0 and 4.0 seconds when inquiry time is 1
second. From 0.3 to 1 m/s, the infection time decrease, however, from 1 to 4 m/s
malicious node use more time to propagate. In speed simulation, we know node’s speed
is one of most important argument for worm propagation. We increase speed from 1 to
8 m/s, the infection time is decreased greatly. In this simulation, we get opposite result
and the only difference is that we add inquiry time argument into simulation. To analyze
the curve, we can find the reason is the same as the effect of changing inquiry time.
Because operating range is fix argument, if we increase the node’s speed, at same time
the operation time between two nodes is decreased. From this simulation, we learn
increasing node’s speed is not necessary condition for accelerating the worm
36
propagation.
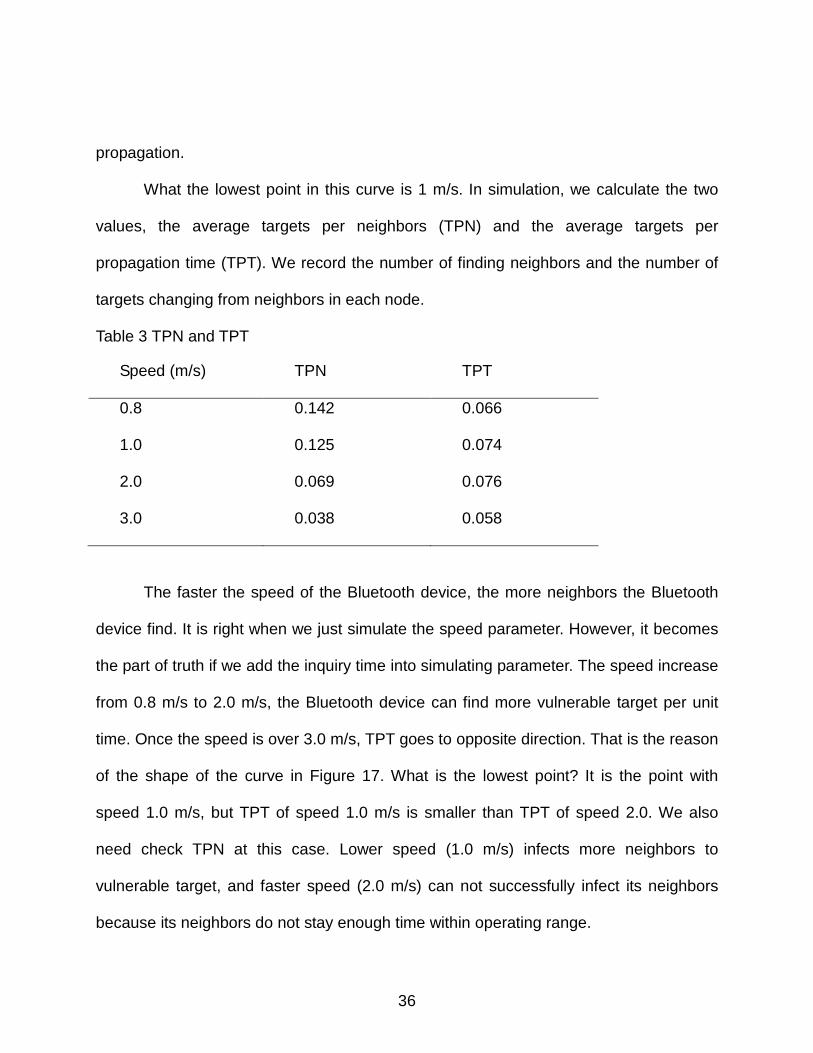
What the lowest point in this curve is 1 m/s. In simulation, we calculate the two
values, the average targets per neighbors (TPN) and the average targets per
propagation time (TPT). We record the number of finding neighbors and the number of
targets changing from neighbors in each node.
Table 3 TPN and TPT
Speed (m/s) TPN TPT
0.8 0.142 0.066
1.0 0.125 0.074
2.0 0.069 0.076
3.0 0.038 0.058
The faster the speed of the Bluetooth device, the more neighbors the Bluetooth
device find. It is right when we just simulate the speed parameter. However, it becomes
the part of truth if we add the inquiry time into simulating parameter. The speed increase
from 0.8 m/s to 2.0 m/s, the Bluetooth device can find more vulnerable target per unit
time. Once the speed is over 3.0 m/s, TPT goes to opposite direction. That is the reason
of the shape of the curve in Figure 17. What is the lowest point? It is the point with
speed 1.0 m/s, but TPT of speed 1.0 m/s is smaller than TPT of speed 2.0. We also
need check TPN at this case. Lower speed (1.0 m/s) infects more neighbors to
vulnerable target, and faster speed (2.0 m/s) can not successfully infect its neighbors
because its neighbors do not stay enough time within operating range.
37
3.1.8 Co-Channel Interference and Failure Rate
Many environment factors cause failure. Sometimes two Bluetooth devices
terminate during paring state not to be connected, sometimes connection has been set
up, but transferring file failed. This thesis focuses on co-channel interference [26] in
Bluetooth network from peripheral Bluetooth devices located in proximity of the ten-
meter range. Each new user connects to a Bluetooth network within the ten-meter range,
the probability of interference increases. The Bluetooth efficiency can suffer a drastic
drop when too many Bluetooth devices are active in a small area due to collisions.
Therefore, co-channel interference increases the failure rate as well. We assume a
failure rate with different number of neighbors. If one Bluetooth device find a neighbor
and no others, we set failure rate as 0; if there are 1-2 other neighbors within their
operating range, the failure rate is 15%; when there are above 2 other neighbors, the
failure rate is 25%.
38
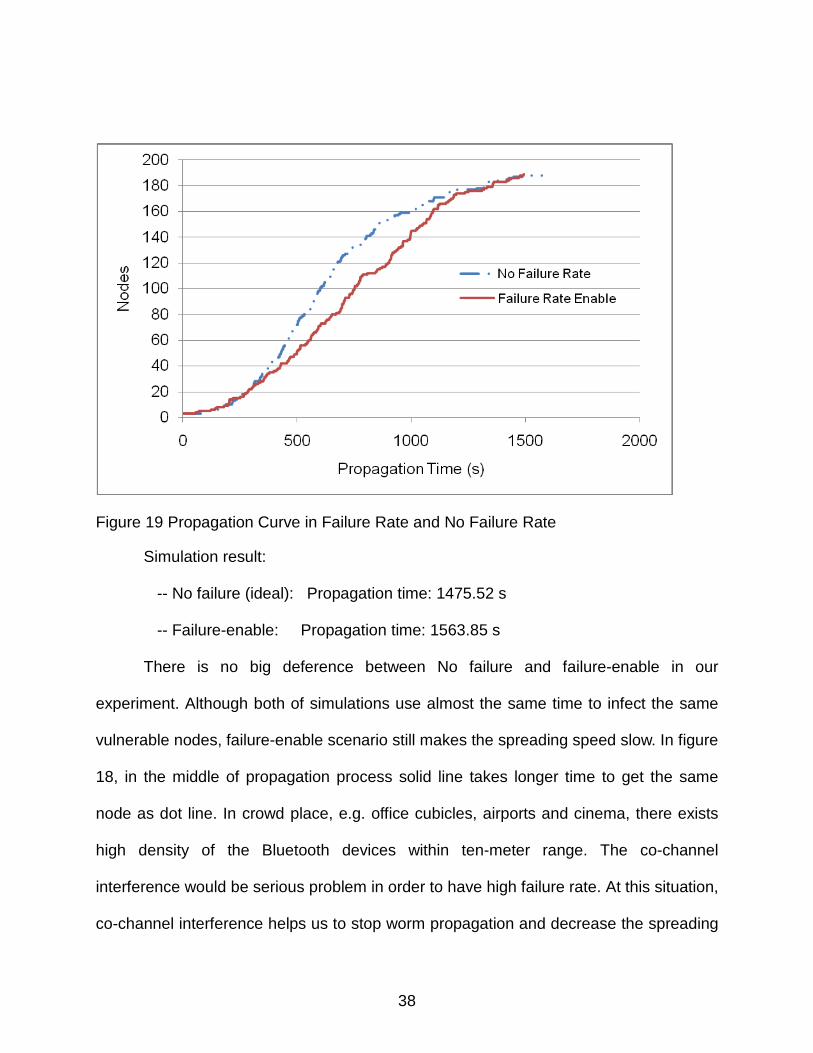
Figure 19 Propagation Curve in Failure Rate and No Failure Rate
Simulation result:
-- No failure (ideal): Propagation time: 1475.52 s
-- Failure-enable: Propagation time: 1563.85 s
There is no big deference between No failure and failure-enable in our
experiment. Although both of simulations use almost the same time to infect the same
vulnerable nodes, failure-enable scenario still makes the spreading speed slow. In figure
18, in the middle of propagation process solid line takes longer time to get the same
node as dot line. In crowd place, e.g. office cubicles, airports and cinema, there exists
high density of the Bluetooth devices within ten-meter range. The co-channel
interference would be serious problem in order to have high failure rate. At this situation,
co-channel interference helps us to stop worm propagation and decrease the spreading

39
speed.
3.1.9 Speed and Inquiry Time Combination
In previous simulation, we consider speed and inquiry time separately. Now we
take two arguments into consideration at the same time. Speed could impact the inquiry
time, and user maybe takes more time to set up connection than one with lower speed.
In this part simulation, there are three assumptions as below.
• Speed: 0 ~ 1.0 m/s, Inquiry time: 0.5 s
• Speed: 1.0 ~ 2.0 m/s, Inquiry time: 1.0 s
• Speed: > 2.0 m/s, Inquiry time: 1.5 s
Table 4 Speed and Inquiry Time
Speed (m/s) Propagation Time (s)
1 3590.89
2 3917.62
5 23643.3
Obviously, when speed is over 5 m/s, and propagation time increase significantly.
Only considering speed argument, attacker just uses 1000 seconds to spread worm. In
real wireless environment, it is hard for an attacker to rapidly implement Bluetooth worm
propagation.

40
3.1.10 Energy Issue
Bluetooth technology is designed to have low power consumption. The Bluetooth
device is classified into three power classes. Table 5 describes the specification in detail.
Table 5 Power Class
Power Class
Maximum Output Power (Pmax)
Minimum Output Power
1 100 mW (20 dBm) 1 mW (0 dBm)
2 2.5 mW (4 dBm) 0.25 mW(-6 dBm)
3 1 mW (0 dBm) N/A
. The most commonly used radio is Class 2 and uses 2.5mW of power. Actually,
there is no Bluetooth device, and there is only Bluetooth enable device. These include
Bluetooth headsets, Bluetooth-enabled laptops, Bluetooth-enabled PDAs or Bluetooth
input devices. In some Bluetooth systems (e.g. laptops and appliances using AC power),
Bluetooth will not be a noticeable drain on the system. However, in some cases,
Bluetooth will dominate current consumption in a device. This is especially true for
simple devices such as a Bluetooth headset or a Bluetooth mouse.
How long the Bluetooth device can work without charging? We choose headsets
to study the energy lifetime of Bluetooth device because it completely uses Bluetooth
function without other primary power consumption. According to market products,
Bluetooth headsets typically offer 2-10 hours talk time or 25-250 hours standby. We do
not consider the standby case, and we assume attacker continue to scan neighbor and
transfer infected file without time interval. From the experiment result, the worst case is
malicious node take over 5 hours to infect 95% vulnerability in network. However, in

41
most of my simulations the infection time is below 1.5 hour (5000 seconds). It is
possible for attacker to infect all vulnerabilities before the power of Bluetooth device is
used up. If we use other Bluetooth-enable devices with AC power, there is no necessary
to consider energy issue, and it can not stop Bluetooth worm attacking.
In future, Bluetooth technology uses Power Class 1 that is just 1 mW output
power. The Bluetooth function device has longer lifetime and provides more chance for
attacker to spread Bluetooth worm. Therefore, in this thesis we don’t take care of the
Bluetooth energy (power) issue.
3.2 Simulation in Wide Wireless Network
In wide wireless network, we simulate the large scale network. In the real world,
human activity doesn’t just in a local group. Usually, people go to work at company or
school, and at weekend, they go to cinema or park, even from one city to another, one
country to another. You always change group or area and not belong to a static group.
Therefore, wide network simulation provides different density group, part of nodes in
one group transfer to another at some time. Transfer model is Poisson distribution, and
each group has a fix departure rate. For each group, it is still a local network and run
local simulation. The difference between wide network and local network is that the
density of each group is variable during the simulation. This should affect the worm
propagation.
As above mention, we simulate five kinds of scenarios related with real people
activities. There are 20 groups with different nodes, such as 50, 100, 150 and 200.
-- Node Transfer scenario: People travel among different group.
42
-- Without Node transferring scenario: All activates happen in local group, and
people do not go out of his group.
-- Add New Group scenario: Sometimes people could go to the one place at
same time, for example, cinema, national park, or arena. In this simulation people was
random selected from random group to build a new group, and we grantee there is 3
infected nodes in new group.
-- Remove New Group scenario: On the contrary, when movie and match is over,
people go to different place. We also simulate one group dismiss and people in this
group randomly join into other exist group.
-- Adding and Removing Group scenario: This case assumes the two events,
group adding and group removing, both happen during one simulation. We assume they
are not happened at the same time as well.
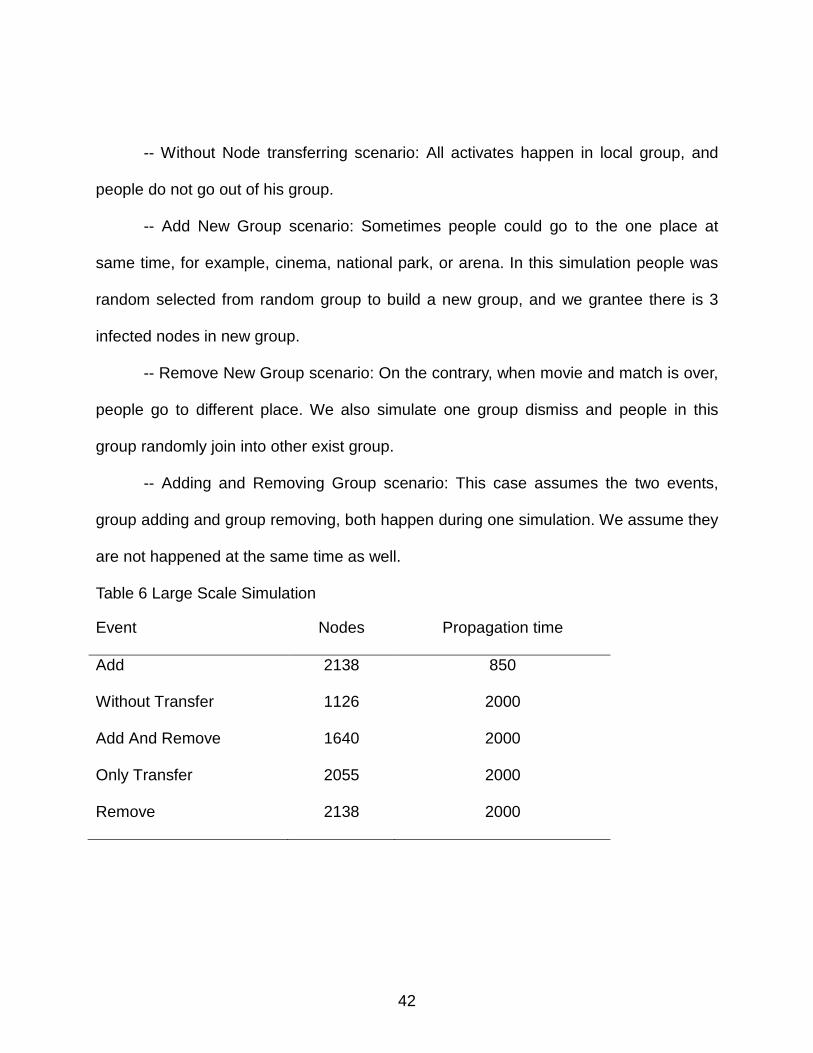
Table 6 Large Scale Simulation Event Nodes Propagation time
Add 2138 850
Without Transfer 1126 2000
Add And Remove 1640 2000
Only Transfer 2055 2000
Remove 2138 2000
43
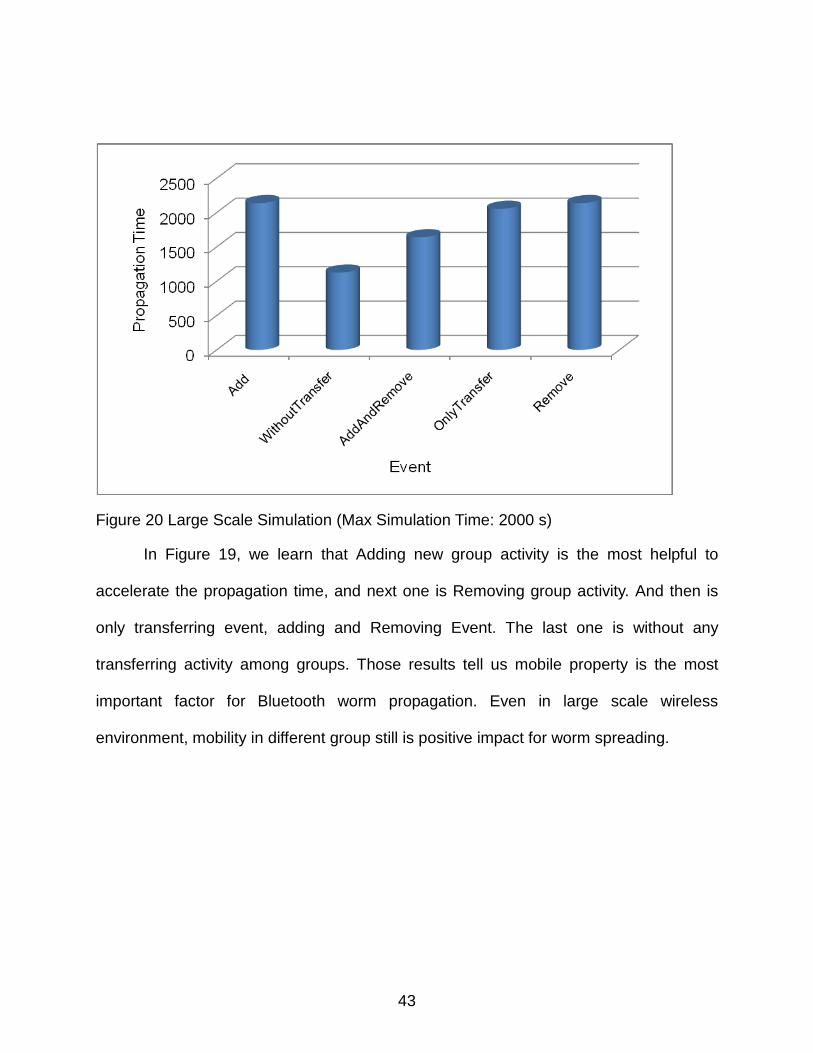
Figure 20 Large Scale Simulation (Max Simulation Time: 2000 s)
In Figure 19, we learn that Adding new group activity is the most helpful to
accelerate the propagation time, and next one is Removing group activity. And then is
only transferring event, adding and Removing Event. The last one is without any
transferring activity among groups. Those results tell us mobile property is the most
important factor for Bluetooth worm propagation. Even in large scale wireless
environment, mobility in different group still is positive impact for worm spreading.
44
4 CHAPTER FOUR: DEFENSE
Product developers that use Bluetooth wireless technology in their products have
several options for implementing security. There are three modes of security for
Bluetooth access between two devices.
Security Mode 1: non-secure
Security Mode 2: service level enforced security
Security Mode 3: link level enforced security
The manufacturer of each product determines these security modes. Devices
and services also have different security levels. For devices, there are two levels:
"trusted device" and "un-trusted device." A trusted device, having been paired with one's
other device, has unrestricted access to all services. With regard to services, three
security levels are defined: services that require authorization and authentication,
services that require authentication only and services that are open to all devices.
Consumers can do a number of things to protect their data. If users have a
phone that is vulnerable to Bluetooth virus, they should contact the phone's
manufacturer to get developed software patches to fix the vulnerability. In addition, if
users are still concerned about a device being targeted, they can turn the device to non-
discoverable mode when not using Bluetooth wireless technology and in unknown areas.
Users can also ensure their data is secure by not "pairing" with unknown devices. If a
user were to receive an invitation to pair with another device, and asked to put in a PIN
code, but was unsure of what device was inviting to pair, the user should not pair, and
45
only pair with known devices.
However, the attacker still can find the address of the user even if user just pair
with trusted devices. He can overhear the initial pairing process between two Bluetooth
devices, and then use brute-force or other method to guess the security key [28] and
masquerade as the second device during a connection. If successfully setting up
connection. It can transfer infected file to implement worm propagation. According to
above simulation, in mobile network attacker need guess the security key very quickly
within the 10 meter communication range. If the PIN code is from manufacture that is
just four digital, it is very easy for attacker to spread worm in few seconds. If user set the
PIN code more complex, attacker has to take hours even several days to find the right
PIN. Hence complex PIN code is one way to prevent Bluetooth worm.
All computer worms including Bluetooth worm have the same property, spreading
rapidly. It is un-normal behavior in network. Also we find the co-channel interference is a
negative factor for Bluetooth worm spreading. Therefore, one defense method is to set
monitor and interference system in popular place since Bluetooth worm attacking is
implemented mostly in this kind of place. When system finds suspect device that
continually pairs and transfers file with others, firstly the system sent warning to virus
center to further analysis. Secondly the system tries to answer all pairing quest in order
to generate co-channel interference. This process is to reduce the spreading speed of
the Bluetooth worm so as to let virus center develop patch to prevent worm propagation
in future.

46
5 CHAPTER FIVE: CONCLUSION
Computer worm spread by Bluetooth technology still is a new way in network
security, and so far it does not bring the huge damage for wireless network. Since all of
Bluetooth worm need be activated by manual operation, it can not spread rapidly.
However, Bluetooth technology will be growth quickly in order to communicate in larger
range, to transfer package bigger and more rapidly, and smart phone become a mobile
micro device with full computer’s function. Those new techniques will boost Bluetooth
worm propagation in wireless network.
To reduce Bluetooth worm damage, even to predict Bluetooth worm, this paper
study its behaviors based on new simulator – BTWS. The movement of the Bluetooth
devices in Mobile wireless network is the direct effect on worm spreading, and
controlling their speed at 1 or 2 m/s so as to maximum worm propagation. Inquiry time
is another key feature of Bluetooth technology, and it determines whether or not worm
can infect the vulnerable device. If new generation Bluetooth technology can significant
reduce inquiry time, it is easy for Bluetooth devices to communicate, but it is also a
disaster for wireless network security. In large scale wireless environment, attacker
could transfer its location in order to spread worm quickly. But for network security it is
hard to find the source of worm due to its mobility. In future, we can build a worm
propagation model to further study its behavior so as to improve the defense system.

47
6 REFERENCES
[1] Guanhua Yan and Stephan Eidebenz. Bluetooth Worms: Models, Dynamics, and Defense Implications. In the 22nd Annual Computer Security Applications Conference (ACSAC), 2006. [2] James W. Mickens and Brian D. Noble. Modeling Epidemic Spreading in Mobile Environments. In the international conference of Web information systems engineering (Wise), September 2, 2005 [3] Abhijit Bose, Scott Boehmer and Kang G. Shin. On Mobile Viruses Exploiting Messaging and Bluetooth Services. In Securecomm and Workshops, 2006 [4] Jing Su, Kelvin K. W. Chan, Andrew G. Miklas, Kenneth Po, Ali Akhavan, Stefan Saroiu, Eyal de Lara†, Ashvin Goel. A Preliminary Investigation of Worm Infections in a Bluetooth Environment. In The 4th ACM workshop on Recurring malcode, 2006. [5] Computer Worm. http://en.wikipedia.org/wiki/Computer_worm. [6] Peter Denning. Computers Under Attack: Intruders, Worms, and Viruses. ACM Press, 1990. [7] Eugene Spafford. The internet worm program: An analysis. Computer Communication Review, 19(1), January 1989. [8] Moore, David; Colleen Shannon. The Spread of the Code-Red Worm (CRv2). CAIDA Analysis. Retrieved on 2006-10-03. [9] ANALYSIS: .ida "Code Red". eEye Digital Security Company. EWormhttp://research.eeye.com/html/advisories/published/AL20010717.html [10] David Moore, Colleen Shannon, and k claffy. Code-red: a case study on the spread and victims of an Internet worm. In The Second Internet Measurement Workshop, pages 273–284, November 2002. [11] Netcraft. The Netcraft Survey, http://www.netcraft.com. [12] Stuart Staniford, Vern Paxson, and Nicholas Weaver. How to Own the Internet in Your Spare Time. In Proceedings of the 11th USENIX Security Symposium. USENIX, August 2002. [13] CC Zou, DW Gong. Computer Communications and Networks, 2004. ICCCN 2004.
48
[14] F-Secure Virus Descriptions: Antimarc. http://www.f-secure.com/v-descs/antimarc.shtml [15] Lidong Zhou, Lintao Zhang, Frank McSherry, Nicole Immorlica, Manuel Costa, and Steve Chien. A First Look at Peer-to-Peer Worms: Threats and Defenses. Proceedings of the IPTPS, 2005 [16] 2005 FBI Computer Crime Survey. http://www.cpppe.umd.edu/Bookstore/Documents/2005CSISurvey.pdf [17] Worm.SymbOS.Cabir.a. http://www.viruslist.com/en/viruslist.html?id=1689517 [18] Virus.WinCE.Duts.a. http://www.viruslist.com/en/viruslist.html?id=1874404 [19] Worm.SymbOS.Comwar.a. http://www.viruslist.com/en/viruses/encyclopedia?virusid=75541 [20] C Bisdikian. An overview of the Bluetooth wireless technology IEEE COMMUN MAG, 2001 [21] Core Specification v2.0 + EDR. http://www.bluetooth.com/NR/rdonlyres/1F6469BA-6AE7-42B6-B5A1-65148B9DB238/840/Core_v210_EDR.zip [22] BlueHoc: Bluetooth Performance Evaluation Tool. http://bluehoc.sourceforge.net/ [23] Blueware: Bluetooth Simulator for ns. http://nms.lcs.mit.edu/projects/blueware/software/ [24] The Network Simulator - ns-2. http://www.isi.edu/nsnam/ns/ [25] UCBT - Bluetooth extension for NS2 at the University of Cincinnati. http://www.ececs.uc.edu/~cdmc/ucbt/ [26] J. P. Lynch Jr. Co-channel interference in Bluetooth piconets. Master’s thesis, Virginia Polytechnic Institute and State University, 2002. [27] C. Guo, H. J. Wang, and W. Zhu. Smart-phone attacks and defenses. In Proceedings of HotNets III, November 2004 [28] O. Whitehouse. Bluetooth: Red Fang, Blue Fang, 2004. http://www.cansecwest.com/csw04/csw04-Whitehouse.pdf. [29] N. Eagle and A. Pentland. Reality Mining: Sensing Complex Social Systems. Journal of Personal and Ubiquitous Computing, June 2005.
49
[30] J. Kephart and S. White. Directed-graph epidemiological models of computer viruses. In Proceedings of the IEEE Computer Symposium on Research in Security and Privacy, pages 343–359, May 1991. [31] Vidyut Samanta, “A study of mobile messaging services,” UCLA Master’s Thesis, 2005. [32] Mike Foley. Stacking Up High-speed Bluetooth Against Certified Wireless USB. http://www.byte.com/documents/s=10114/byt1175264350917/0402b.htm [33] S. A. Khayam and H. Radha. A topologically-aware worm propagation model for wireless sensor networks. In Proceedings of The 2nd International Workshop on Security in Distributed Computing Systems (SDCS-2005), 2005. [34] G. E. P. Box and M .E. Muller, “A Note on the Generation of Random Normal Deviates,” Annals Math. Stat, vol. 29, pp. 610–611, 1958. [35] B. Hoh and M. Gruteser. Computer Ecology: Responding to Mobile Worms with Location-Based Quarantine Boundaries. In International Workshop on Research Challenges in Security and Privacy for Mobile and Wireless Networks, 2006. [36] A. Wagner, T. Dubendorfer, B. Plattner, and R. Hiestand, “Experiences with Worm Propagation Simulations,” 10th ACM CCS Workshop on Rapid Malcode (WORM '03), 2003. [37] N Srl. Studying Bluetooth Malware Propagation. csdl.computer.org [38] B Dwan. The mobile phone virus. Network Security, 2004 [39] Iain Thomson. Mosquito Trojan set to infect mobiles. Vnunet.com, Aug 2004 [40] John Leyden. Dampig Trojan menaces Symbian mobiles. http://www.theregister.co.uk/2005/03/07/dampig_symbian_trojan/ [41] Trojan.SymbOS.Locknut.a. http://www.viruslist.com/en/viruses/encyclopedia?virusid=73046