Embed Size (px)
Citation preview
I J C T A, 9(9), 2016, pp. 3731-3735© International Science Press
Blood Microscopic Image Analysis forAcute Leukemia DetectionV. Renuga, J. Sivaraman, S. Vinuraj Kumar, S. Sathish, P. Padmapriya and R. Reethu
ABSTRACT
Leukemia is the type of blood cell cancer and it actually starts from the bone marrow and then it affects the bloodcells. It is said to be cancerous when a large number of abnormal White Blood Cells (WBC) enter into bone marrowand it does not respond to the cell growth inhibitors which leads to Acute Lymphocytic leukemia (ALL). The mainaim of this paper is to analyze the blood microscopic images for ALL detection. The ALL is detected using thetechnique such as preprocessing, segmentation, feature extraction and classification. The technique of segmentationand feature extraction aims at the clear view of the structure of WBC nucleus and to classify the lymphocyte asnormal or lymphoblast. In this work the leukocytes are separated from the other blood cells and then the lymphocytesare extracted from the subclass, fractal features, shape features and other texture feature. These features greatlyhelp in identifying the structures of lymphocytes and differentiating them from the cancerous cell. This identificationprocess is of importance in differentiating and detecting the cancerous cell.
Keywords: Acute Lymphocytic Leukemia, Image Analysis, Microscopic images, MATLAB, Peripheral blood stream.
1. INTRODUCTION
Acute Lymphocytic Leukemia (ALL) is a disease which often occurs in children. It is said that White Bloodcells grow larger in the blood stream [1]. Examination of peripheral blood smear images is one of the mostwidely used techniques for leukemia detection though it suffers from problems such as subjectiveinterpretations, operator fatigue and efficiency. The samples were taken from ALL-IDB datasets [2].Segmentation is done to identify the WBC’s and for segmentation there are various methods in whichclustering technique would give good result. By analyzing the various techniques and getting knowledgeabout that it is known that shape features would be effective. Shape features like circle, rectangle, ellipse,squares are considered [3]. The most popular unsupervised algorithm is the k-means clustering algorithm.While using this algorithm, sometimes the edges of some nuclei are obtained instead of whole nuclei. Thisproblem can be avoided by using some morphological filtering methods such as edge enhancement bysobel operator and canny edge detector [4], [5]. Automatic thresholding methods are also used but it doesnot always produce precise results during the selection of segmentation threshold. Pattern recognition isalso considered a powerful tool for the differentiation of normal cells and blast cells. It is also done by colorbased clustering. Some of them are k-means, k-medoid, FCM, GK, FPCM etc., [6], [7]. Fractal geometry isa new tool that can be extremely used for many problems in almost every scientific field. Cancer cells areoften referred to as fractals. The likelihood ratio test is employed for hausdorff dimension. Fractal dimensionis one of the useful factors to be considered in analysis. There are many ways to define the fractal dimensionsin which Box-counting method is one the simplest method in used [8]. The contour signature can also beused for this analysis which is to find the non-routine changes in the boundary of nucleus. Based on thedomain from which they are extracted the texture feature is of two types spatial and spectral methods.Among the various important color features the simplest and very effective feature is the color moments.Local Binary pattern is one of the features used in classification in computer vision [9].
Department of Biomedical Engineering, Vel Tech Multi Tech, Chennai–600062
3732 V. Renuga, J. Sivaraman, S. Vinuraj Kumar, S. Sathish, P. Padmapriya and R. Reethu
2. METHODS
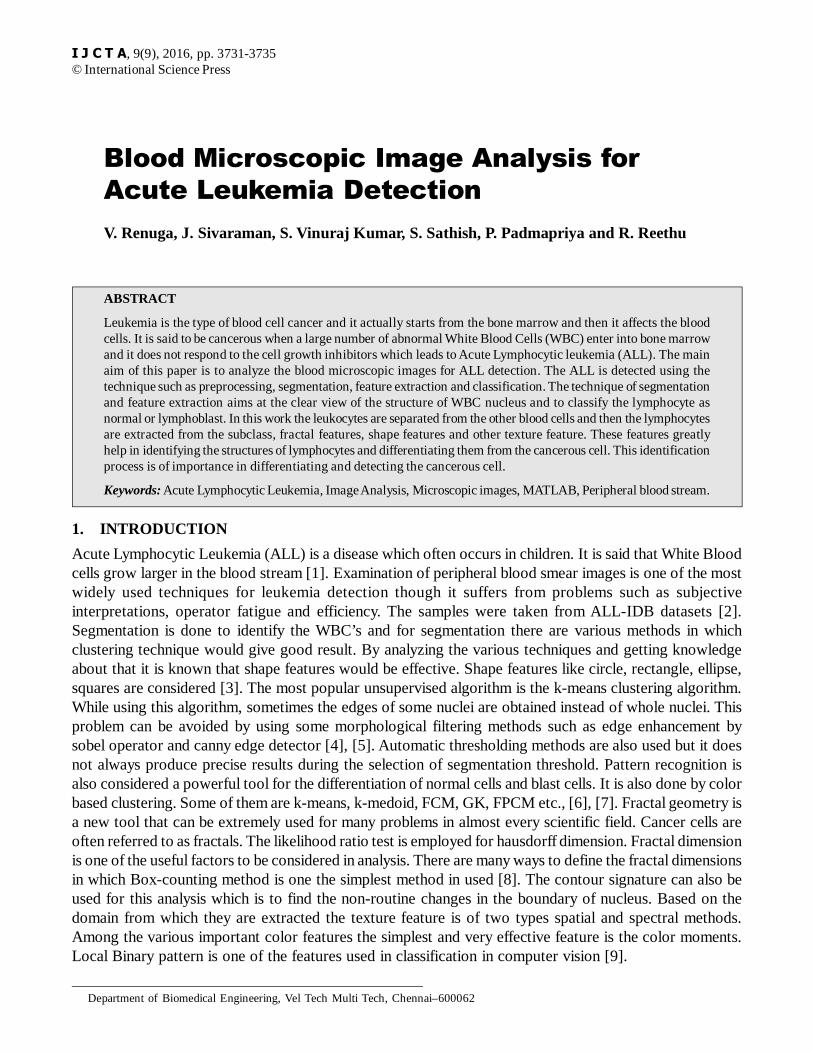
The Acute Lymphocytic Leukemia is detected using Image processing techniques using MATLAB 2013a.Images are collected from ALL-IDB Database and used as a sample. After that segmentation is done toextract WBC nucleus from the image. Then from the segmented image the features are drawn out. Finallyclassification is done to classify the abnormal and normal cells. Figure 1 shows the work flow.
2.1. Collection of Blood Smear Images
Fabio Scotti provided a public supervised datasets (ALL-IDB) for study purpose. It is used to test andcompare cell segmentation algorithm and the classification of ALL. From this database, the images aretaken and used as an input.
Figure 1: Work Flow
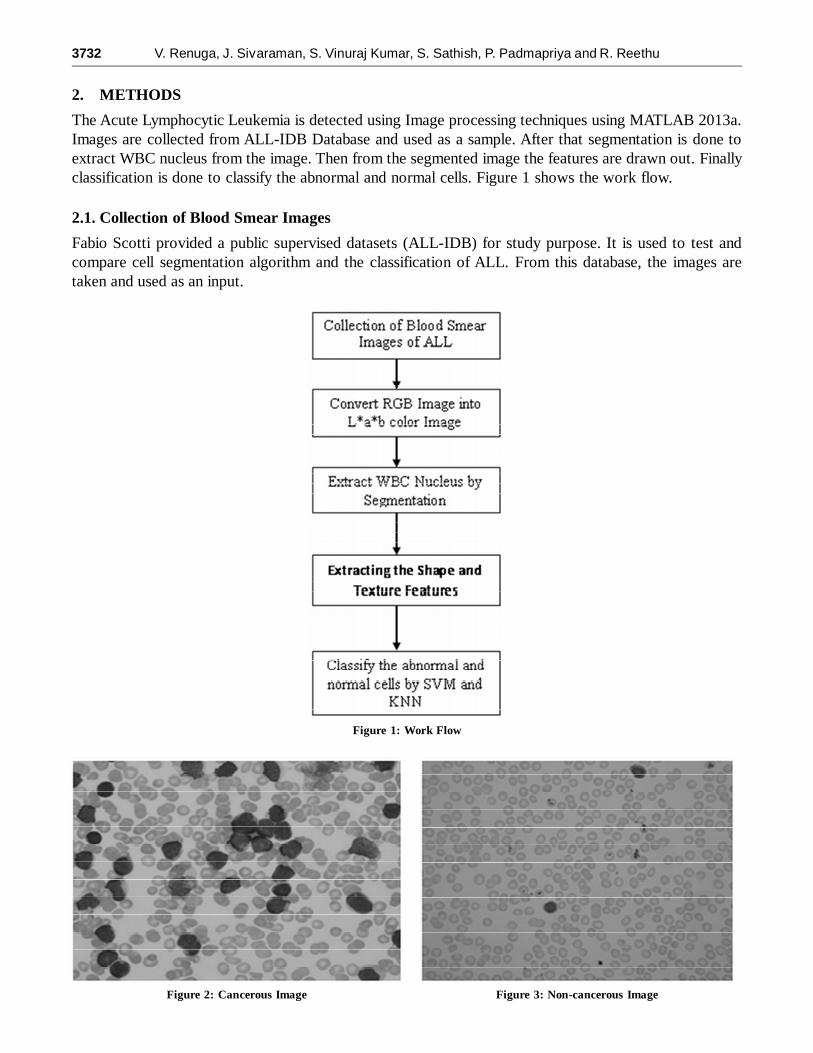
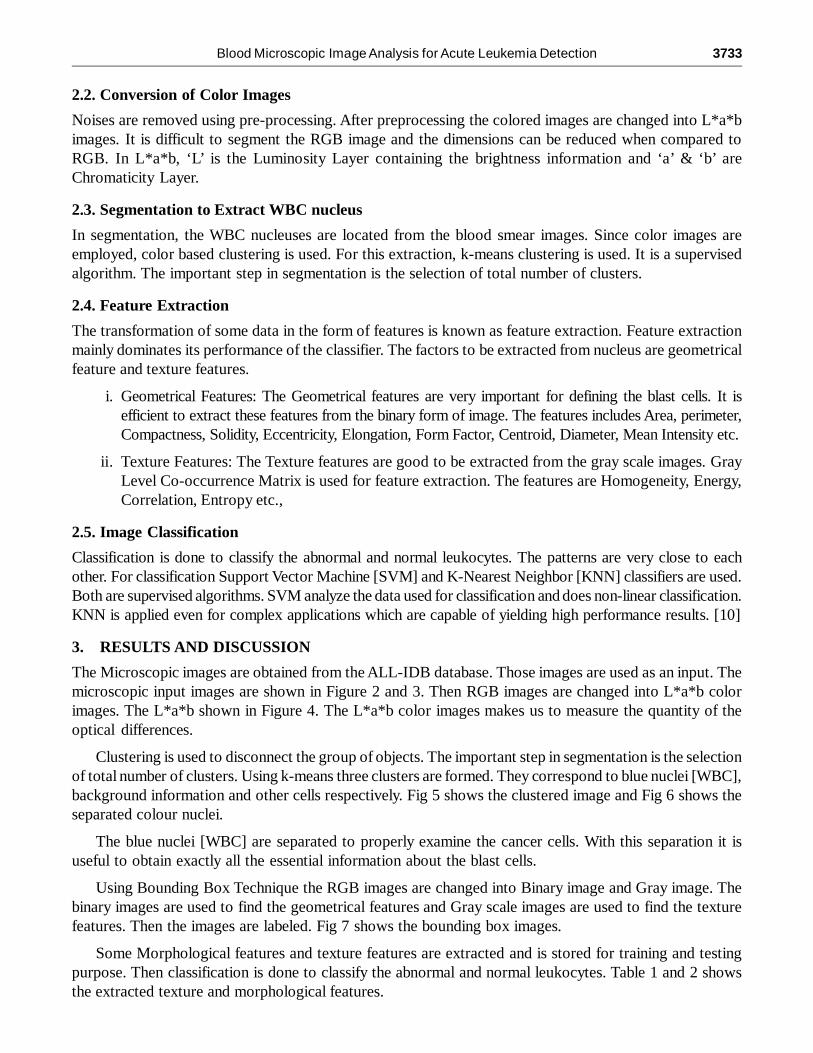
Figure 2: Cancerous Image Figure 3: Non-cancerous Image
Blood Microscopic Image Analysis for Acute Leukemia Detection 3733
2.2. Conversion of Color Images
Noises are removed using pre-processing. After preprocessing the colored images are changed into L*a*bimages. It is difficult to segment the RGB image and the dimensions can be reduced when compared toRGB. In L*a*b, ‘L’ is the Luminosity Layer containing the brightness information and ‘a’ & ‘b’ areChromaticity Layer.
2.3. Segmentation to Extract WBC nucleus
In segmentation, the WBC nucleuses are located from the blood smear images. Since color images areemployed, color based clustering is used. For this extraction, k-means clustering is used. It is a supervisedalgorithm. The important step in segmentation is the selection of total number of clusters.
2.4. Feature Extraction
The transformation of some data in the form of features is known as feature extraction. Feature extractionmainly dominates its performance of the classifier. The factors to be extracted from nucleus are geometricalfeature and texture features.
i. Geometrical Features: The Geometrical features are very important for defining the blast cells. It isefficient to extract these features from the binary form of image. The features includes Area, perimeter,Compactness, Solidity, Eccentricity, Elongation, Form Factor, Centroid, Diameter, Mean Intensity etc.
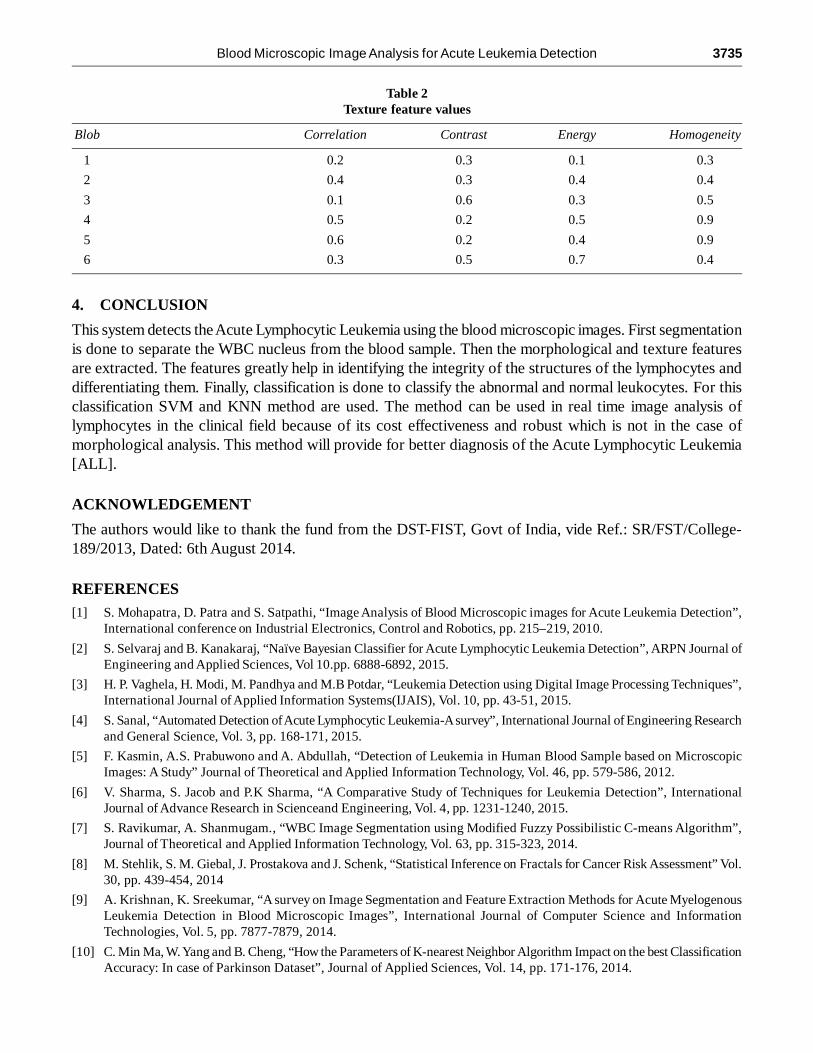
ii. Texture Features: The Texture features are good to be extracted from the gray scale images. GrayLevel Co-occurrence Matrix is used for feature extraction. The features are Homogeneity, Energy,Correlation, Entropy etc.,
2.5. Image Classification
Classification is done to classify the abnormal and normal leukocytes. The patterns are very close to eachother. For classification Support Vector Machine [SVM] and K-Nearest Neighbor [KNN] classifiers are used.Both are supervised algorithms. SVM analyze the data used for classification and does non-linear classification.KNN is applied even for complex applications which are capable of yielding high performance results. [10]
3. RESULTS AND DISCUSSION
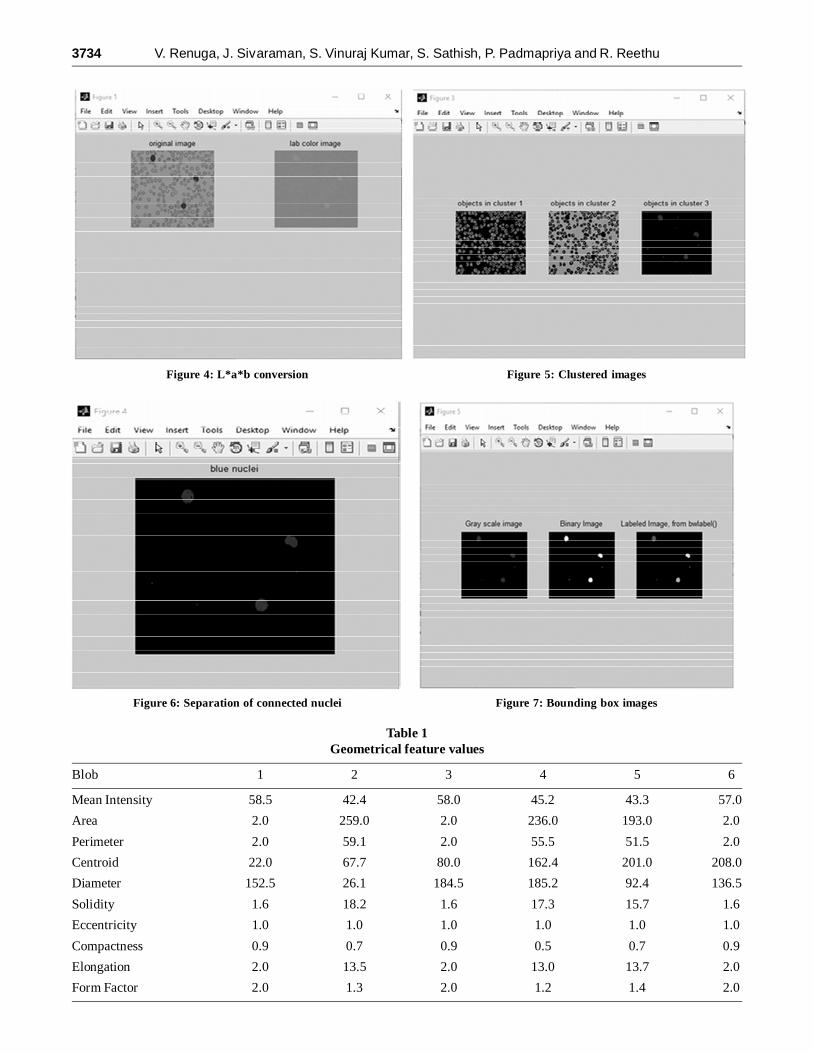
The Microscopic images are obtained from the ALL-IDB database. Those images are used as an input. Themicroscopic input images are shown in Figure 2 and 3. Then RGB images are changed into L*a*b colorimages. The L*a*b shown in Figure 4. The L*a*b color images makes us to measure the quantity of theoptical differences.
Clustering is used to disconnect the group of objects. The important step in segmentation is the selectionof total number of clusters. Using k-means three clusters are formed. They correspond to blue nuclei [WBC],background information and other cells respectively. Fig 5 shows the clustered image and Fig 6 shows theseparated colour nuclei.
The blue nuclei [WBC] are separated to properly examine the cancer cells. With this separation it isuseful to obtain exactly all the essential information about the blast cells.
Using Bounding Box Technique the RGB images are changed into Binary image and Gray image. Thebinary images are used to find the geometrical features and Gray scale images are used to find the texturefeatures. Then the images are labeled. Fig 7 shows the bounding box images.
Some Morphological features and texture features are extracted and is stored for training and testingpurpose. Then classification is done to classify the abnormal and normal leukocytes. Table 1 and 2 showsthe extracted texture and morphological features.
3734 V. Renuga, J. Sivaraman, S. Vinuraj Kumar, S. Sathish, P. Padmapriya and R. Reethu
Figure 4: L*a*b conversion Figure 5: Clustered images
Figure 6: Separation of connected nuclei Figure 7: Bounding box images
Table 1Geometrical feature values
Blob 1 2 3 4 5 6
Mean Intensity 58.5 42.4 58.0 45.2 43.3 57.0
Area 2.0 259.0 2.0 236.0 193.0 2.0
Perimeter 2.0 59.1 2.0 55.5 51.5 2.0
Centroid 22.0 67.7 80.0 162.4 201.0 208.0
Diameter 152.5 26.1 184.5 185.2 92.4 136.5
Solidity 1.6 18.2 1.6 17.3 15.7 1.6
Eccentricity 1.0 1.0 1.0 1.0 1.0 1.0
Compactness 0.9 0.7 0.9 0.5 0.7 0.9
Elongation 2.0 13.5 2.0 13.0 13.7 2.0
Form Factor 2.0 1.3 2.0 1.2 1.4 2.0
Blood Microscopic Image Analysis for Acute Leukemia Detection 3735
4. CONCLUSION
This system detects the Acute Lymphocytic Leukemia using the blood microscopic images. First segmentationis done to separate the WBC nucleus from the blood sample. Then the morphological and texture featuresare extracted. The features greatly help in identifying the integrity of the structures of the lymphocytes anddifferentiating them. Finally, classification is done to classify the abnormal and normal leukocytes. For thisclassification SVM and KNN method are used. The method can be used in real time image analysis oflymphocytes in the clinical field because of its cost effectiveness and robust which is not in the case ofmorphological analysis. This method will provide for better diagnosis of the Acute Lymphocytic Leukemia[ALL].
ACKNOWLEDGEMENT
The authors would like to thank the fund from the DST-FIST, Govt of India, vide Ref.: SR/FST/College-189/2013, Dated: 6th August 2014.
REFERENCES[1] S. Mohapatra, D. Patra and S. Satpathi, “Image Analysis of Blood Microscopic images for Acute Leukemia Detection”,
International conference on Industrial Electronics, Control and Robotics, pp. 215–219, 2010.
[2] S. Selvaraj and B. Kanakaraj, “Naïve Bayesian Classifier for Acute Lymphocytic Leukemia Detection”, ARPN Journal ofEngineering and Applied Sciences, Vol 10.pp. 6888-6892, 2015.
[3] H. P. Vaghela, H. Modi, M. Pandhya and M.B Potdar, “Leukemia Detection using Digital Image Processing Techniques”,International Journal of Applied Information Systems(IJAIS), Vol. 10, pp. 43-51, 2015.
[4] S. Sanal, “Automated Detection of Acute Lymphocytic Leukemia-A survey”, International Journal of Engineering Researchand General Science, Vol. 3, pp. 168-171, 2015.
[5] F. Kasmin, A.S. Prabuwono and A. Abdullah, “Detection of Leukemia in Human Blood Sample based on MicroscopicImages: A Study” Journal of Theoretical and Applied Information Technology, Vol. 46, pp. 579-586, 2012.
[6] V. Sharma, S. Jacob and P.K Sharma, “A Comparative Study of Techniques for Leukemia Detection”, InternationalJournal of Advance Research in Scienceand Engineering, Vol. 4, pp. 1231-1240, 2015.
[7] S. Ravikumar, A. Shanmugam., “WBC Image Segmentation using Modified Fuzzy Possibilistic C-means Algorithm”,Journal of Theoretical and Applied Information Technology, Vol. 63, pp. 315-323, 2014.
[8] M. Stehlik, S. M. Giebal, J. Prostakova and J. Schenk, “Statistical Inference on Fractals for Cancer Risk Assessment” Vol.30, pp. 439-454, 2014
[9] A. Krishnan, K. Sreekumar, “A survey on Image Segmentation and Feature Extraction Methods for Acute MyelogenousLeukemia Detection in Blood Microscopic Images”, International Journal of Computer Science and InformationTechnologies, Vol. 5, pp. 7877-7879, 2014.
[10] C. Min Ma, W. Yang and B. Cheng, “How the Parameters of K-nearest Neighbor Algorithm Impact on the best ClassificationAccuracy: In case of Parkinson Dataset”, Journal of Applied Sciences, Vol. 14, pp. 171-176, 2014.
Table 2Texture feature values
Blob Correlation Contrast Energy Homogeneity
1 0.2 0.3 0.1 0.3
2 0.4 0.3 0.4 0.4
3 0.1 0.6 0.3 0.5
4 0.5 0.2 0.5 0.9
5 0.6 0.2 0.4 0.9
6 0.3 0.5 0.7 0.4