Embed Size (px)
Citation preview

Reports Guide

07/20/2016 Blackbaud Altru 4.91 Reports US
©2016 Blackbaud, Inc. This publication, or any part thereof, may not be reproduced or transmitted in any form orby anymeans, electronic, or mechanical, including photocopying, recording, storage in an information retrievalsystem, or otherwise, without the prior written permission of Blackbaud, Inc.
The information in this manual has been carefully checked and is believed to be accurate. Blackbaud, Inc., assumesno responsibility for any inaccuracies, errors, or omissions in this manual. In no event will Blackbaud, Inc., be liablefor direct, indirect, special, incidental, or consequential damages resulting from any defect or omission in thismanual, even if advised of the possibility of damages.
In the interest of continuing product development, Blackbaud, Inc., reserves the right to make improvements inthis manual and the products it describes at any time, without notice or obligation.
All Blackbaud product names appearing herein are trademarks or registered trademarks of Blackbaud, Inc.
All other products and company names mentioned herein are trademarks of their respective holder.
Reports-2016
ContentsKey Performance Indicators 4
KPI Workflow 5Access KPIs 5KPI Definitions 6Manage KPIs 7KPI Instance Record 12
Key Performance Indicator Dashboard 16
View KPI Dashboards 16Customize KPI Dashboard 17Manage KPIs 17Export KPI Dashboards 17
Web Dashboard 19
Blackbaud Dashboard Page 19Add Pages 20Edit Pages 22Add Parts 23Add Connections 26
Report Options 29
Reports Toolbar 29
Microsoft Excel Add-In 30
Set Up Microsoft Excel Add-In 30Data Options in Excel 30
Prospect Research Reporting 32
Opportunity Pipeline Report 32Prospect Plan Analysis 33Prospect Plan Follow-Up Report 33
Key Performance Indicators
KPI Workflow 5
Types of KPIs 5Standard KPIs 5Context-Sensitive KPIs 5Dynamic Goal KPIs 5Access KPIs 5
KPI Definitions 6
Marketing KPIs 6Manage KPIs 7
Add KPI Instances 7View KPI Data 8Assign KPI Permissions 10Generate Values for a KPI Instance 10Import and Export KPI Definitions 11Organize KPIs 11KPI Instance Record 12
Goal Status 12Goal Status History 12Recent Status 12History 12Job Schedules 13Add a Job Schedule 13Create Yahoo! Widgets for a KPI Instance 15Manage RSS Feed 15Create a Windows Scripting File to Generate KPI Values 15
Key Performance Indicators track your organization’s strategic performance. Financial and non-financialmatrices are used to assess your business condition and to help you determine a course of action.Monitoring your business activity using KPIs helps you place a value on otherwise difficult to measureactivities, such as leadership development.
chapter 1

Depending on the nature of your organization and your strategy, KPIs can help measure the progresstoward your goals. For example, your organization may decide to track the total number of giftsgenerated each month as a performance indicator. Or, if your organization uses direct marketing, youmay decide to track the cost per dollar raised for a specific mailing. With KPIs, you can create aninstance that defines this indicator. After you create the instance, your organization can view the statusof your KPI goals and schedule updates for KPI instances.
KPI WorkflowYou can manage key performance indicators (KPIs) to allow quick access to track goals and progress.
The KPI feature also provides a variety of ways to access the information, such as dashboards, links onrecords, and RSS feed links you can copy to Internet browsers.
Types of KPIsAll KPI instances are based on a definition stored in the program catalog. The program includes anumber of definitions, but the exact functionality of the KPI depends on the type of informationcontained in each definition.
Note: Authoring KPI definitions is available as a customization. If you need definitions beyond thoseincluded in the program, contact your in-house developer or your implementation consultant.
Standard KPIsA standard KPI generates the requested value. Users can then view the data on the KPIs page or with anRSS feed or web page link provided them by the administrator.
Context-Sensitive KPIsA context-sensitive KPI is assigned to a specific record. In these cases, the KPI is then available withinthe context of that record.
Dynamic Goal KPIsA dynamic goal KPI defines the KPI instance goal outside of the KPI instance. This is useful for recordsthat include goal information and for users who want the KPI instance goal to always reflect the recordvalue.
Access KPIsTo access KPIs, from Analysis, click Information library, and click the KPIs tab. From this page, you cancreate, edit, and delete KPI instances, update an existing KPI value, open an instance, and assignpermissions.
5 CHAPTER 1
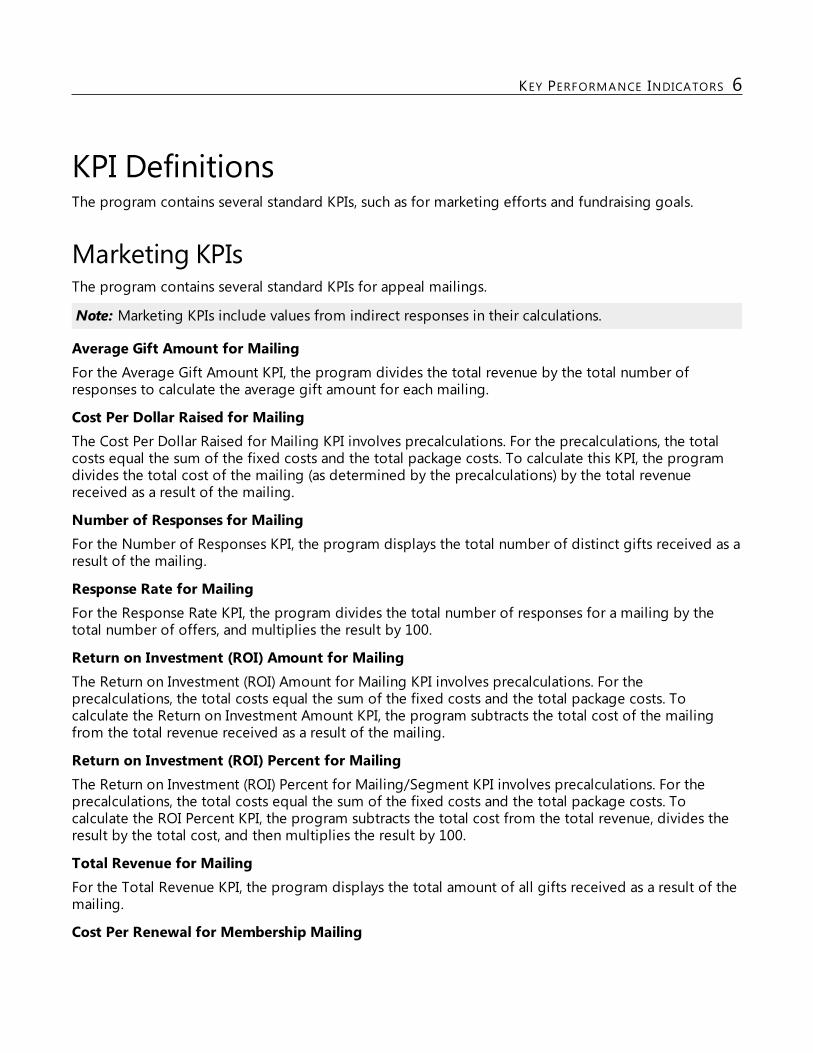
KPI DefinitionsThe program contains several standard KPIs, such as for marketing efforts and fundraising goals.
Marketing KPIsThe program contains several standard KPIs for appeal mailings.
Note: Marketing KPIs include values from indirect responses in their calculations.
Average Gift Amount for MailingFor the Average Gift Amount KPI, the program divides the total revenue by the total number ofresponses to calculate the average gift amount for each mailing.
Cost Per Dollar Raised for MailingThe Cost Per Dollar Raised for Mailing KPI involves precalculations. For the precalculations, the totalcosts equal the sum of the fixed costs and the total package costs. To calculate this KPI, the programdivides the total cost of the mailing (as determined by the precalculations) by the total revenuereceived as a result of the mailing.
Number of Responses for MailingFor the Number of Responses KPI, the program displays the total number of distinct gifts received as aresult of the mailing.
Response Rate for MailingFor the Response Rate KPI, the program divides the total number of responses for a mailing by thetotal number of offers, and multiplies the result by 100.
Return on Investment (ROI) Amount for MailingThe Return on Investment (ROI) Amount for Mailing KPI involves precalculations. For theprecalculations, the total costs equal the sum of the fixed costs and the total package costs. Tocalculate the Return on Investment Amount KPI, the program subtracts the total cost of the mailingfrom the total revenue received as a result of the mailing.
Return on Investment (ROI) Percent for MailingThe Return on Investment (ROI) Percent for Mailing/Segment KPI involves precalculations. For theprecalculations, the total costs equal the sum of the fixed costs and the total package costs. Tocalculate the ROI Percent KPI, the program subtracts the total cost from the total revenue, divides theresult by the total cost, and then multiplies the result by 100.
Total Revenue for MailingFor the Total Revenue KPI, the program displays the total amount of all gifts received as a result of themailing.
Cost Per Renewal for Membership Mailing
KEY PERFORMANCE INDICATORS 6
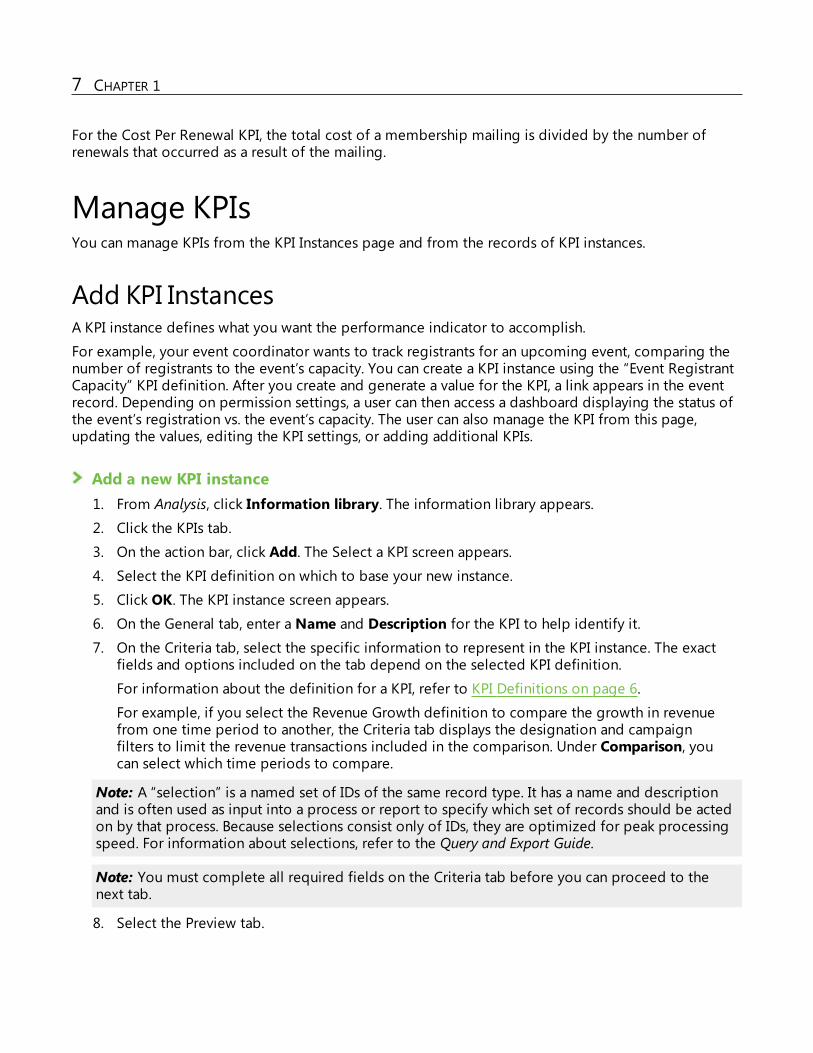
For the Cost Per Renewal KPI, the total cost of a membership mailing is divided by the number ofrenewals that occurred as a result of the mailing.
Manage KPIsYou can manage KPIs from the KPI Instances page and from the records of KPI instances.
Add KPI InstancesA KPI instance defines what you want the performance indicator to accomplish.
For example, your event coordinator wants to track registrants for an upcoming event, comparing thenumber of registrants to the event’s capacity. You can create a KPI instance using the “Event RegistrantCapacity” KPI definition. After you create and generate a value for the KPI, a link appears in the eventrecord. Depending on permission settings, a user can then access a dashboard displaying the status ofthe event’s registration vs. the event’s capacity. The user can also manage the KPI from this page,updating the values, editing the KPI settings, or adding additional KPIs.
Add a new KPI instance1. From Analysis, click Information library. The information library appears.2. Click the KPIs tab.
3. On the action bar, click Add. The Select a KPI screen appears.4. Select the KPI definition on which to base your new instance.
5. Click OK. The KPI instance screen appears.6. On the General tab, enter a Name and Description for the KPI to help identify it.7. On the Criteria tab, select the specific information to represent in the KPI instance. The exact
fields and options included on the tab depend on the selected KPI definition.
For information about the definition for a KPI, refer to KPI Definitions on page 6.
For example, if you select the Revenue Growth definition to compare the growth in revenuefrom one time period to another, the Criteria tab displays the designation and campaignfilters to limit the revenue transactions included in the comparison. Under Comparison, youcan select which time periods to compare.
Note: A “selection” is a named set of IDs of the same record type. It has a name and descriptionand is often used as input into a process or report to specify which set of records should be actedon by that process. Because selections consist only of IDs, they are optimized for peak processingspeed. For information about selections, refer to the Query and Export Guide.
Note: You must complete all required fields on the Criteria tab before you can proceed to thenext tab.
8. Select the Preview tab.
7 CHAPTER 1
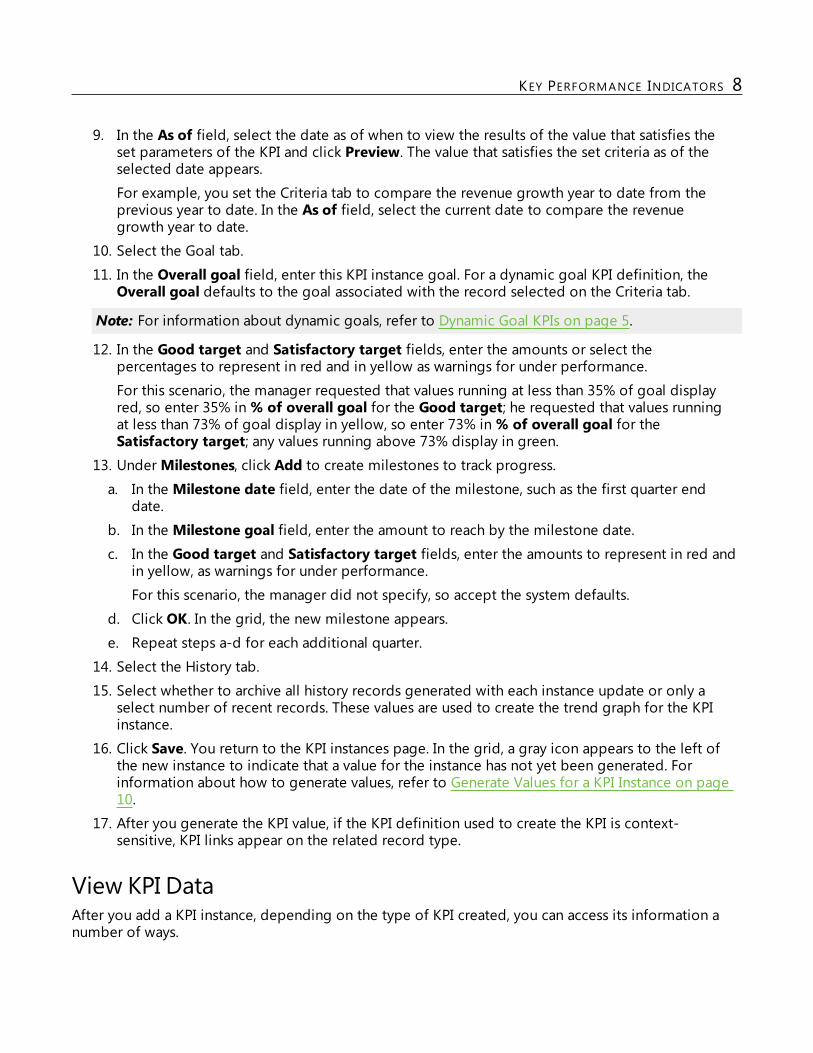
9. In the As of field, select the date as of when to view the results of the value that satisfies theset parameters of the KPI and click Preview. The value that satisfies the set criteria as of theselected date appears.
For example, you set the Criteria tab to compare the revenue growth year to date from theprevious year to date. In the As of field, select the current date to compare the revenuegrowth year to date.
10. Select the Goal tab.
11. In the Overall goal field, enter this KPI instance goal. For a dynamic goal KPI definition, theOverall goal defaults to the goal associated with the record selected on the Criteria tab.
Note: For information about dynamic goals, refer to Dynamic Goal KPIs on page 5.
12. In the Good target and Satisfactory target fields, enter the amounts or select thepercentages to represent in red and in yellow as warnings for under performance.
For this scenario, the manager requested that values running at less than 35% of goal displayred, so enter 35% in% of overall goal for the Good target; he requested that values runningat less than 73% of goal display in yellow, so enter 73% in% of overall goal for theSatisfactory target; any values running above 73% display in green.
13. UnderMilestones, click Add to create milestones to track progress.a. In the Milestone date field, enter the date of the milestone, such as the first quarter end
date.
b. In the Milestone goal field, enter the amount to reach by the milestone date.c. In the Good target and Satisfactory target fields, enter the amounts to represent in red and
in yellow, as warnings for under performance.
For this scenario, the manager did not specify, so accept the system defaults.
d. Click OK. In the grid, the new milestone appears.e. Repeat steps a-d for each additional quarter.
14. Select the History tab.
15. Select whether to archive all history records generated with each instance update or only aselect number of recent records. These values are used to create the trend graph for the KPIinstance.
16. Click Save. You return to the KPI instances page. In the grid, a gray icon appears to the left ofthe new instance to indicate that a value for the instance has not yet been generated. Forinformation about how to generate values, refer to Generate Values for a KPI Instance on page10.
17. After you generate the KPI value, if the KPI definition used to create the KPI is context-sensitive, KPI links appear on the related record type.
View KPI DataAfter you add a KPI instance, depending on the type of KPI created, you can access its information anumber of ways.
KEY PERFORMANCE INDICATORS 8
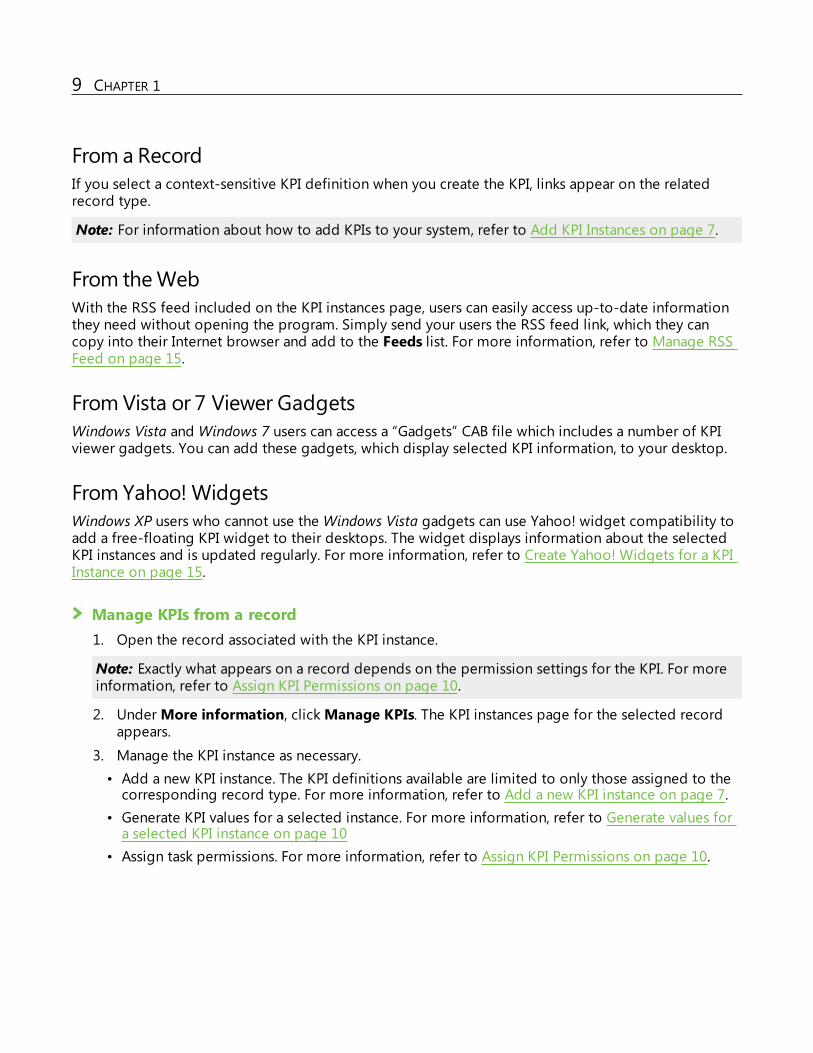
From a RecordIf you select a context-sensitive KPI definition when you create the KPI, links appear on the relatedrecord type.
Note: For information about how to add KPIs to your system, refer to Add KPI Instances on page 7.
From theWebWith the RSS feed included on the KPI instances page, users can easily access up-to-date informationthey need without opening the program. Simply send your users the RSS feed link, which they cancopy into their Internet browser and add to the Feeds list. For more information, refer to Manage RSSFeed on page 15.
FromVista or 7 Viewer GadgetsWindows Vista and Windows 7 users can access a “Gadgets” CAB file which includes a number of KPIviewer gadgets. You can add these gadgets, which display selected KPI information, to your desktop.
From Yahoo! WidgetsWindows XP users who cannot use the Windows Vista gadgets can use Yahoo! widget compatibility toadd a free-floating KPI widget to their desktops. The widget displays information about the selectedKPI instances and is updated regularly. For more information, refer to Create Yahoo! Widgets for a KPIInstance on page 15.
Manage KPIs from a record1. Open the record associated with the KPI instance.
Note: Exactly what appears on a record depends on the permission settings for the KPI. For moreinformation, refer to Assign KPI Permissions on page 10.
2. UnderMore information, clickManage KPIs. The KPI instances page for the selected recordappears.
3. Manage the KPI instance as necessary.• Add a new KPI instance. The KPI definitions available are limited to only those assigned to thecorresponding record type. For more information, refer to Add a new KPI instance on page 7.
• Generate KPI values for a selected instance. For more information, refer to Generate values fora selected KPI instance on page 10
• Assign task permissions. For more information, refer to Assign KPI Permissions on page 10.
9 CHAPTER 1

Assign KPI PermissionsYou can control system role permissions granted to each individual KPI instance. When a user assignedthe specific role opens the program, only KPIs for which they are granted permission appear.
Note: For more information about system roles and security, refer to the Security Guide.
Set user permissions for KPI instances1. From Analysis, click Information library. The information library appears.2. Click the KPIs tab.
3. In the grid, select the KPI instance for which to assign permissions.
4. On the action bar, click Assign Permissions. The Assign KPI Instance Permissions screenappears.
5. Under System Roles, select the checkboxes for the roles to access the KPI.
Note: To deny a role access, do not select its checkbox. To clear all existing assignments, clickClear all.
6. Click Save. You return to the KPI Instances page.
Generate Values for a KPI InstanceAfter you create a KPI instance, you can generate the values associated with its settings whenevernecessary. When you generate values, the selected KPI record opens and displays details about theindicator values. For information about KPI instance records, refer to KPI Instance Record on page 12.
Note: To generate KPI values, you can also create an SQL Server agent job orWindows scripting file.For more information, refer to or Create a Windows Scripting File to Generate KPI Values on page 15.
Generate values for a selected KPI instanceFor information about how to create a KPI instance, refer to Add KPI Instances on page 7.
1. From Analysis, click Information library. The information library appears.2. Click the KPIs tab.
3. In the grid, select the instance for which to generate values.
4. On the action bar, click Update KPI value. The Update KPI screen appears.5. Select whether to view data based on the current date or another date.• If you select Process once using current date, the program creates one history record relativeto the current date.
Note: We recommend you back date values for new KPI instances, when trend information doesnot exist. After you create a KPI instance, you can schedule a business process to update its values.
KEY PERFORMANCE INDICATORS 10
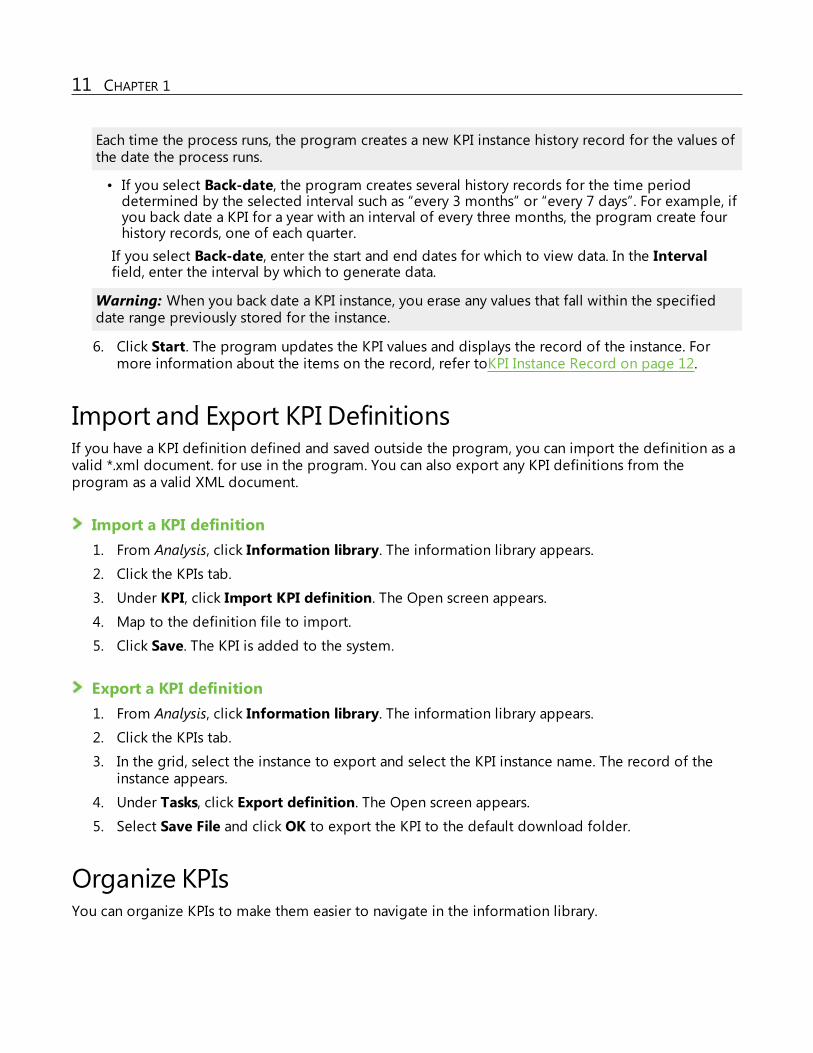
Each time the process runs, the program creates a new KPI instance history record for the values ofthe date the process runs.
• If you select Back-date, the program creates several history records for the time perioddetermined by the selected interval such as “every 3 months” or “every 7 days”. For example, ifyou back date a KPI for a year with an interval of every three months, the program create fourhistory records, one of each quarter.If you select Back-date, enter the start and end dates for which to view data. In the Intervalfield, enter the interval by which to generate data.
Warning: When you back date a KPI instance, you erase any values that fall within the specifieddate range previously stored for the instance.
6. Click Start. The program updates the KPI values and displays the record of the instance. Formore information about the items on the record, refer toKPI Instance Record on page 12.
Import and Export KPI DefinitionsIf you have a KPI definition defined and saved outside the program, you can import the definition as avalid *.xml document. for use in the program. You can also export any KPI definitions from theprogram as a valid XML document.
Import a KPI definition1. From Analysis, click Information library. The information library appears.2. Click the KPIs tab.
3. Under KPI, click Import KPI definition. The Open screen appears.4. Map to the definition file to import.
5. Click Save. The KPI is added to the system.
Export a KPI definition1. From Analysis, click Information library. The information library appears.2. Click the KPIs tab.
3. In the grid, select the instance to export and select the KPI instance name. The record of theinstance appears.
4. Under Tasks, click Export definition. The Open screen appears.5. Select Save File and click OK to export the KPI to the default download folder.
Organize KPIsYou can organize KPIs to make them easier to navigate in the information library.
11 CHAPTER 1
l To mark a KPI as a favorite, click the star next to the KPI's name.
l To move KPIs to folders, select "Folder" in the View by field. Select the KPI or KPIs you want tomove, and clickMove. In the Move KPIs to folder screen, select a folder and click Save.
l To create and edit folders and arrange them in hierarchies, clickManage folders.l To view different details about your KPIs, click Columns and select the columns you want to seeon the list. You can also filter columns to only see KPIs that meet certain criteria.
KPI Instance RecordThe KPI instance record displays details about the indicator values. When you update KPI values, therecord appears. The information that appears on the record is based on the parameter selections usedwhen you generate the values. For more information about how to update KPI values, refer to GenerateValues for a KPI Instance on page 10.
Goal StatusThe Goal status tab displays status information related to the KPI goals. In the Show field underPercent of goal, you can select to view data for the overall goal or the milestone goal. In the Showfield under KPI value chart, select the time period for which to view status information. You can selecta predefined time period or a custom period. If you select Custom, Start date and End date fieldsappear so you can define the time span. Also, if you select Custom, you must click Go to update thestatus. If you select a predefined option, the display automatically updates after you make yourselection.
Goal Status HistoryThe Goal status history tab tracks KPI status changes. For example, if a KPI's status changes from red toyellow or from yellow to green. In addition, this tab is compatible with the Custom Email Alertsfeature, allowing you to track select KPIs by directing the application to email you every time thestatus changes. For more information about Email Alerts, refer to the Administration Guide .
Recent StatusThe Recent status tab displays information about the most recent KPI instance update. For example, ifthe update “Completed,” dates and times of the last update, number of records processed, number ofexceptions, and much more.
HistoryEach time you run a KPI process, the program generates a status record of the instance. On the Historytab, you view historical status record information about each instance of the KPI process. Theinformation in the grid includes the status of the instance; the start time, end time, and duration of the
KEY PERFORMANCE INDICATORS 12
instance; the person who started the instance; the total number of records processed during theinstance; and the server used to run the process for the instance.
Note: For information about how to create a KPI instance, refer to Add KPI Instances on page 7.
Depending on your security rights and system role, you can delete a status record from the grid on theHistory tab.
Job SchedulesYou can create a job schedule to automatically generate KPI instance values, such as during off-hours.This job scheduler uses the SSIS packages, which can make web service calls to the program so you cancreate a SQL Server Agent job through the program shell. You can use SQL Server Agent jobs togenerate KPI instances automatically and opt to run the task on a recurring basis. When you create ajob schedule, you define the conditions that cause the job to run.
Add a Job ScheduleWhen you click the Add button on the Job schedule tab, the Create job screen appears. From thisscreen, you define your automated job schedule.
Add a New Job Schedule1. From the Job Schedules tab, select Add. The Create job screen appears.
13 CHAPTER 1
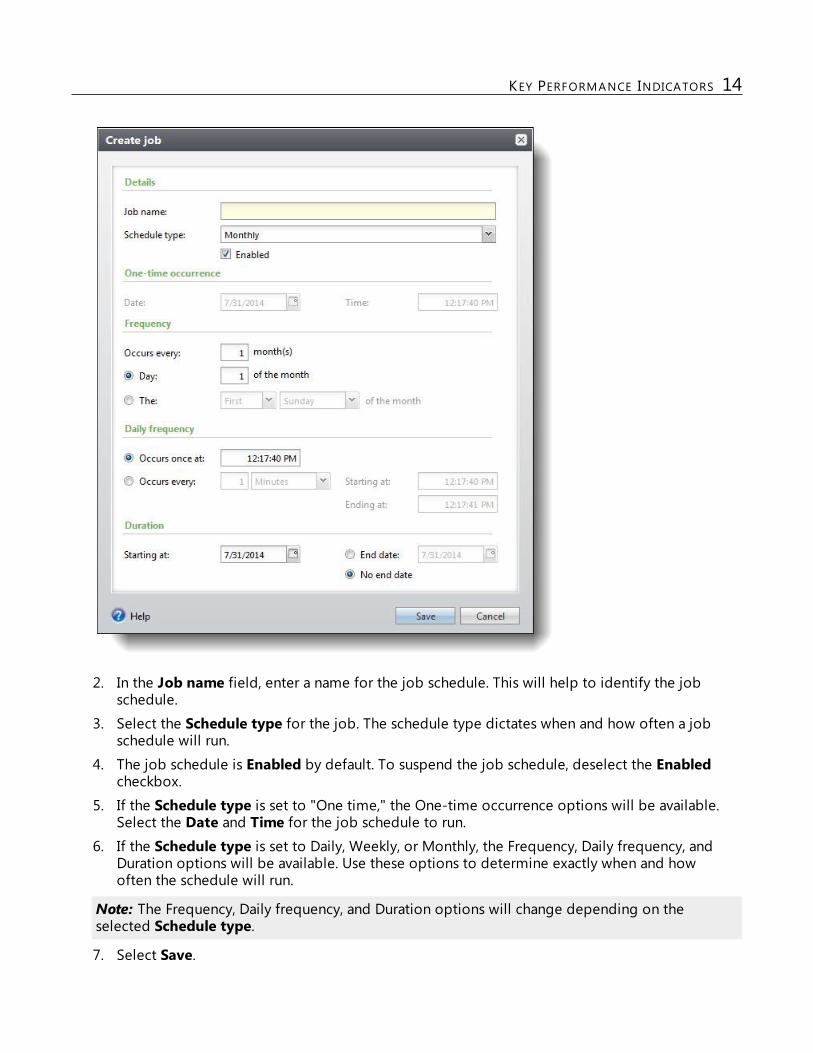
2. In the Job name field, enter a name for the job schedule. This will help to identify the jobschedule.
3. Select the Schedule type for the job. The schedule type dictates when and how often a jobschedule will run.
4. The job schedule is Enabled by default. To suspend the job schedule, deselect the Enabledcheckbox.
5. If the Schedule type is set to "One time," the One-time occurrence options will be available.Select the Date and Time for the job schedule to run.
6. If the Schedule type is set to Daily, Weekly, or Monthly, the Frequency, Daily frequency, andDuration options will be available. Use these options to determine exactly when and howoften the schedule will run.
Note: The Frequency, Daily frequency, and Duration options will change depending on theselected Schedule type.
7. Select Save.
KEY PERFORMANCE INDICATORS 14
Create Yahoo! Widgets for a KPI InstanceWith the Yahoo!Widget Engine, you can run applications called “widgets” on your desktop. You canadd KPI widgets to your desktop so you can view the most up-to-date values every time you turn onyour computer.
Note: Before you can use the Yahoo! widget functionality, you must download the free Yahoo!Widget Engine from http://widgets.yahoo.com/.
Create a KPI Yahoo! widget1. From Analysis, click Information library. The information library appears.2. Click the KPIs tab.
3. In the grid, select the process for which to create a widget.
4. On the action bar, click Go to KPI instance. The record of the instance appears.5. Under Tasks, click Create Yahoo! widget. A zip archive that contains the widget files will
download.
6. Unzip the files and double click the Yahoo Widget file.
7. The program creates a widget for the selected KPI.
8. To view the widget, double-click on its icon. To view the graph and thermometerrepresentation of the KPI value, click the Trend field.
Manage RSS FeedYou can enable your KPI data consumers can monitor KPI values from outside of the program. On a KPIInstance record, select the Goal Status History tab. SelectMore and click View RSS feed. Your webbrowser opens and displays the updates for the KPI instance whenever the status changes from onethreshold value to another.
You can provide the address of the web page to your KPI data consumers. With the web address, theycan then subscribe to the feed, add it to theirMicrosoft Feeds list, and generate up-to-date KPI datafrom their web browser at any time.
15 CHAPTER 1
Key Performance IndicatorDashboard
View KPI Dashboards 16
Customize KPI Dashboard 17
Manage KPIs 17
Export KPI Dashboards 17
All users have a personal dashboard, displaying Key Performance Indicator data. The KPI dashboardstores all KPI values and statistic information in an easy to view format.
The dashboard includes data from every KPI instance for which the user has permission. Forinformation about establishing permission settings, see Assign KPI Permissions on page 10.
You can customize the dashboard view, making it even easier to access the specific information youneed. You can also export the information to Microsoft Excel or generate a PDF.
View KPI DashboardsWhenever you generate values for a KPI instance, the values are automatically added to the KPIdashboard.
Dashboards are permission-based, so only KPIs for which you have permission appear on thedashboard panel.
View KPI data from a dashboard1. To view the dashboard, either click the KPI dashboard link from the Data page, or if you are
working on the KPI instances page or in a KPI instance record, click the KPI dashboard link inthe Tasks pane on the left side of the screen. The KPI dashboard page appears.In addition, if can access an context-sensitive KPI instance dashboard from your record in theprogram. For more information, see Types of KPIs on page 5.
Note: For information about accessing the Data page or the KPI instances page, see Access KPIs onpage 5 or KPI Instance Record on page 12.
2. From the KPI dashboard page, in the Time span field, select the time period for which youwant to view status information. You can select a predefined time period or a “Custom”
chapter 2

period. If you select “Custom”, Start date and End date fields appear, allowing you to defineyour time span. Also, if you select “Custom”, you must click the Go button to update the statusdisplay. If you select a predefined option, the display automatically updates after you makeyour selection.
3. The dashboard includes the following information:• A color-coded line displaying the KPI status• A graph displaying KPI value trends• The data represented in the thermometer and graph
Customize KPI DashboardThe Customize dashboard option allows you to arrange your dashboard to meet your specific needs.For example, if your KPI dashboard page includes value information for 20 or 30 KPI instances, youspend a good deal of time scrolling through this very long list, trying to locate specific instanceinformation. With Customize dashboard, you can create different dashboard pages on which to storespecific instance data. You can also arrange information in tabs, making it easy to access differentinstance data while working on the same page.
Manage KPIsWhile working in the KPI dashboard, you can access the KPI instances page by clicking Manage KPIs.
Export KPI DashboardsYou can easily share KPI dashboard data with users outside the program. In addition to printing out thedashboard page, you can also export the information, creating either an Excel spreadsheet or a PDF.
Note: You can also export to Excel and Acrobat PDF from the web view. For more information, seeView Web Dashboard on page 1.
Export a KPI Dashboard data to an Excel spreadsheet1. From the KPI dashboard page, right click.
2. Select Export, Excel. The Save as screen appears.3. Select a Save in location.4. Enter a File name for the Excel spreadsheet about to be generated.5. Click Save. The dashboard information is saved to the new spreadsheet.
Export a KPI Dashboard data to a PDF1. From the KPI dashboard page, right click.
17 CHAPTER 2

2. Select Export, Acrobat (PDF) file. The Save as screen appears.3. Select a Save in location.4. Enter a File name for the PDF about to be generated.5. Click Save. The dashboard information is saved to the PDF.
KEY PERFORMANCE INDICATOR DASHBOARD 18
Web Dashboard
Blackbaud Dashboard Page 19
Site Options 19Folder Options 20Add Pages 20
Page Options 21Edit Pages 22
Add Parts 23
Add Connections 26
The Web Dashboard presents information from your database in one consolidated location usingdynamic tools such as lists, charts, gauges, and web content from external web sites. Users customizethe content, appearance, and layout of the parts and pages that make up the Web Dashboard site.Other users can view or manipulate parts for their own needs. For example, users can select the datesor records displayed in the part. Administrators can define permissions so only specified users haveview or edit rights for the site, pages, and parts.
Parts on the same page can be connected so they share data. Using a part’s embed code and directURL, you can embed the part in other web applications, or use it with Microsoft Vista or 7 gadgets orYahoo! widgets.
Blackbaud Dashboard PageUse the Blackbaud Dashboard home page to organize your site. If you use multiple databases, you canselect the database you want to use for the site. Once you select a database, you access the FolderContents page. On this page you can set site and page permissions and add pages and folders.
Site OptionsUsing the options under the Site Options field, you can specify which system roles have rights to editthe site or parts.
chapter 3
Option DescriptionEdit Site Privileges Assign rights to roles. Options include the ability to personalize pages, add new
pages, assign page permissions, and add, edit, or delete folders.
Edit Part Privileges Assign add or edits rights to dashboard parts that are secured.
Folder OptionsYou can organize pages by adding folders to your site. The Folder options field appears on the FolderContents page of the dashboard.
Option DescriptionAdd new page Add a new page to this folder. For more information, refer to Add Pages on page 20.
Import page Import an existing dashboard page using an page definition file. You can export apage definition file using the Export page option under Page options. For moreinformation about exporting, refer to Page Options on page 21.
Add new folder Add a new sub-folder to this folder.
Add PagesWhen you add pages to the site, you define basic properties for the page as well as the layout andcontext record type.
Add a page1. From the Blackbaud Dashboard page, if you use multiple databases, select the database to use.
The Folder Contents page appears.
2. Select Folder options, Add new page. The Add new page screen appears.
20 CHAPTER 3
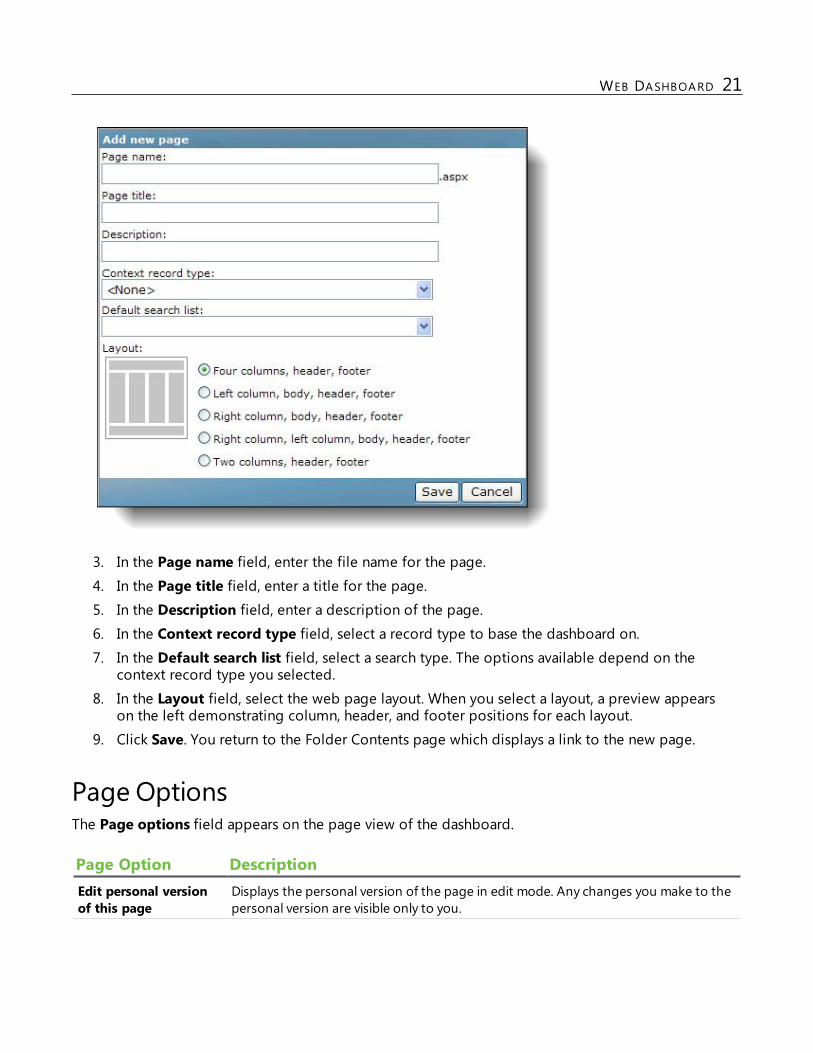
3. In the Page name field, enter the file name for the page.4. In the Page title field, enter a title for the page.5. In the Description field, enter a description of the page.6. In the Context record type field, select a record type to base the dashboard on.7. In the Default search list field, select a search type. The options available depend on the
context record type you selected.
8. In the Layout field, select the web page layout. When you select a layout, a preview appearson the left demonstrating column, header, and footer positions for each layout.
9. Click Save. You return to the Folder Contents page which displays a link to the new page.
Page OptionsThe Page options field appears on the page view of the dashboard.
Page Option DescriptionEdit personal versionof this page
Displays the personal version of the page in edit mode. Any changes you make to thepersonal version are visible only to you.
WEB DASHBOARD 21
Page Option DescriptionEdit shared version ofthis page
Displays the shared version of the page in edit mode. Any changes you make to theshared version are visible to any users who view this page.
Show shared view From the personal version, select this option to display the shared view of the page.
Show personal view From the shared version, select this option to display the personal view of the page.
Reset page content When editing the personal version, select this option to remove all personalizationsettings from the page.
Edit page information Edit the page name, title, description, context record, or default search list.
Copy page Make a copy of the page.
Move page Move the page to a different folder.
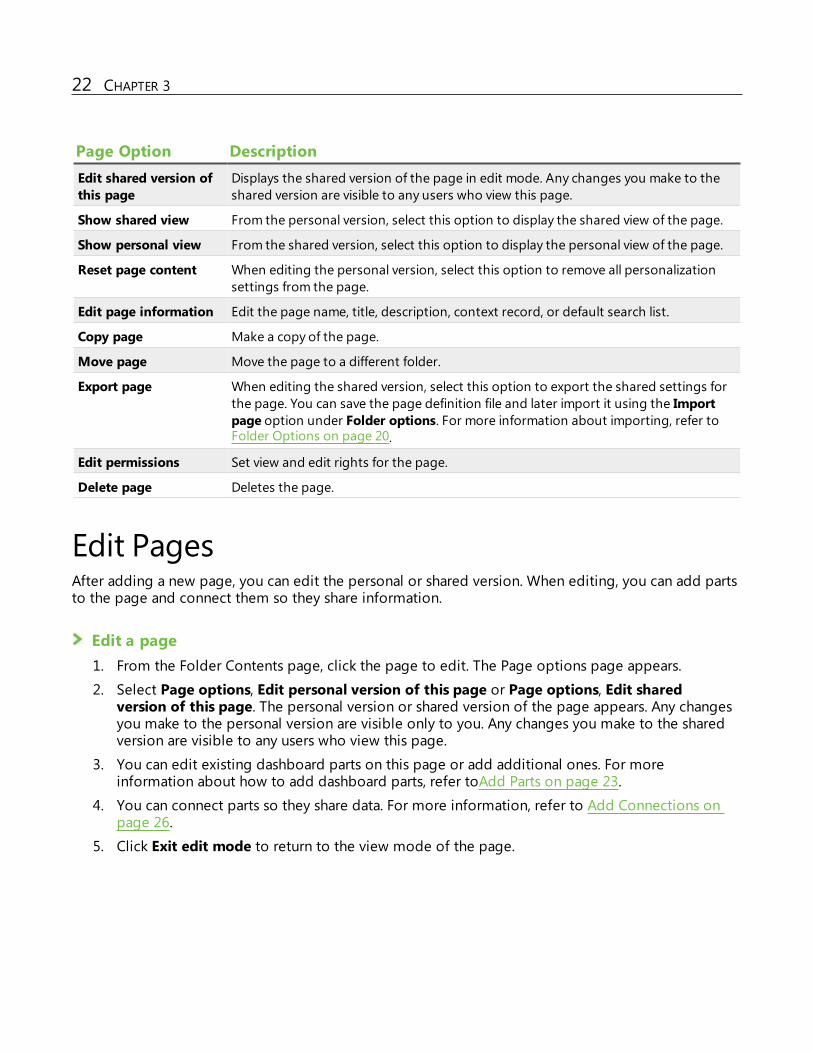
Export page When editing the shared version, select this option to export the shared settings forthe page. You can save the page definition file and later import it using the Importpage option under Folder options. For more information about importing, refer toFolder Options on page 20.
Edit permissions Set view and edit rights for the page.
Delete page Deletes the page.
Edit PagesAfter adding a new page, you can edit the personal or shared version. When editing, you can add partsto the page and connect them so they share information.
Edit a page1. From the Folder Contents page, click the page to edit. The Page options page appears.
2. Select Page options, Edit personal version of this page or Page options, Edit sharedversion of this page. The personal version or shared version of the page appears. Any changesyou make to the personal version are visible only to you. Any changes you make to the sharedversion are visible to any users who view this page.
3. You can edit existing dashboard parts on this page or add additional ones. For moreinformation about how to add dashboard parts, refer toAdd Parts on page 23.
4. You can connect parts so they share data. For more information, refer to Add Connections onpage 26.
5. Click Exit edit mode to return to the view mode of the page.
22 CHAPTER 3
Add PartsYou can add several different types of dashboard parts such as Date and Data list parts, as well asEmbedded web content parts.
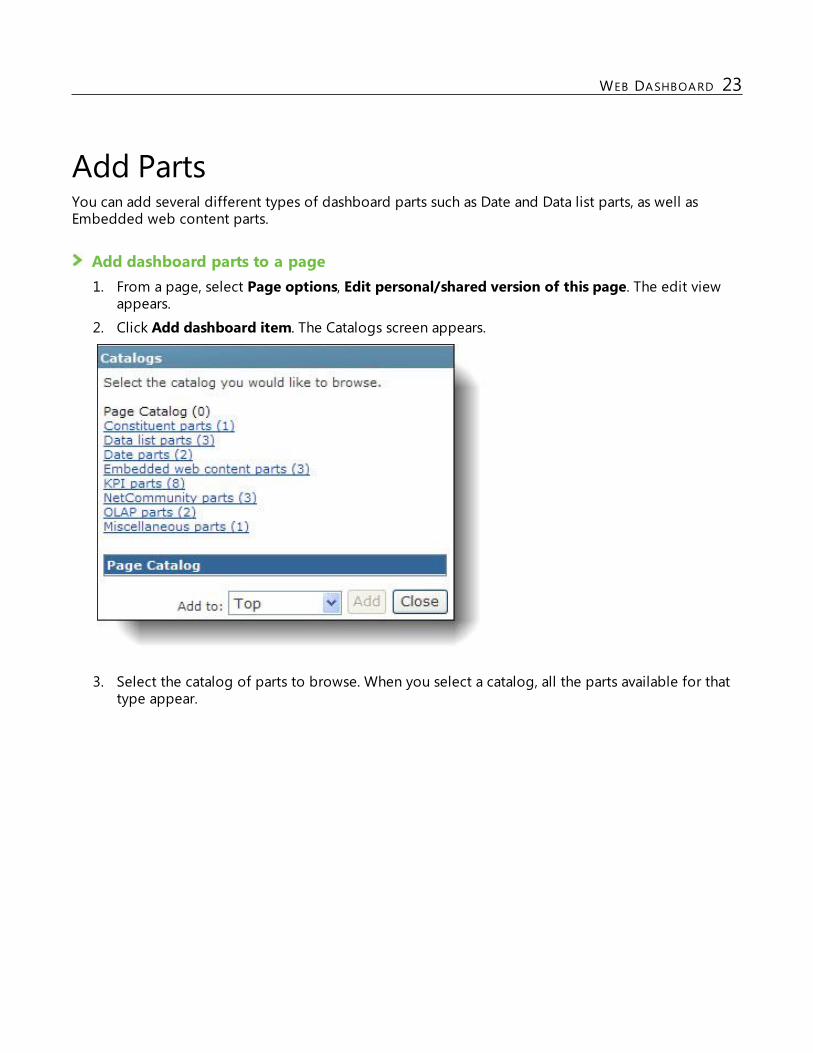
Add dashboard parts to a page1. From a page, select Page options, Edit personal/shared version of this page. The edit view
appears.
2. Click Add dashboard item. The Catalogs screen appears.
3. Select the catalog of parts to browse. When you select a catalog, all the parts available for thattype appear.
WEB DASHBOARD 23
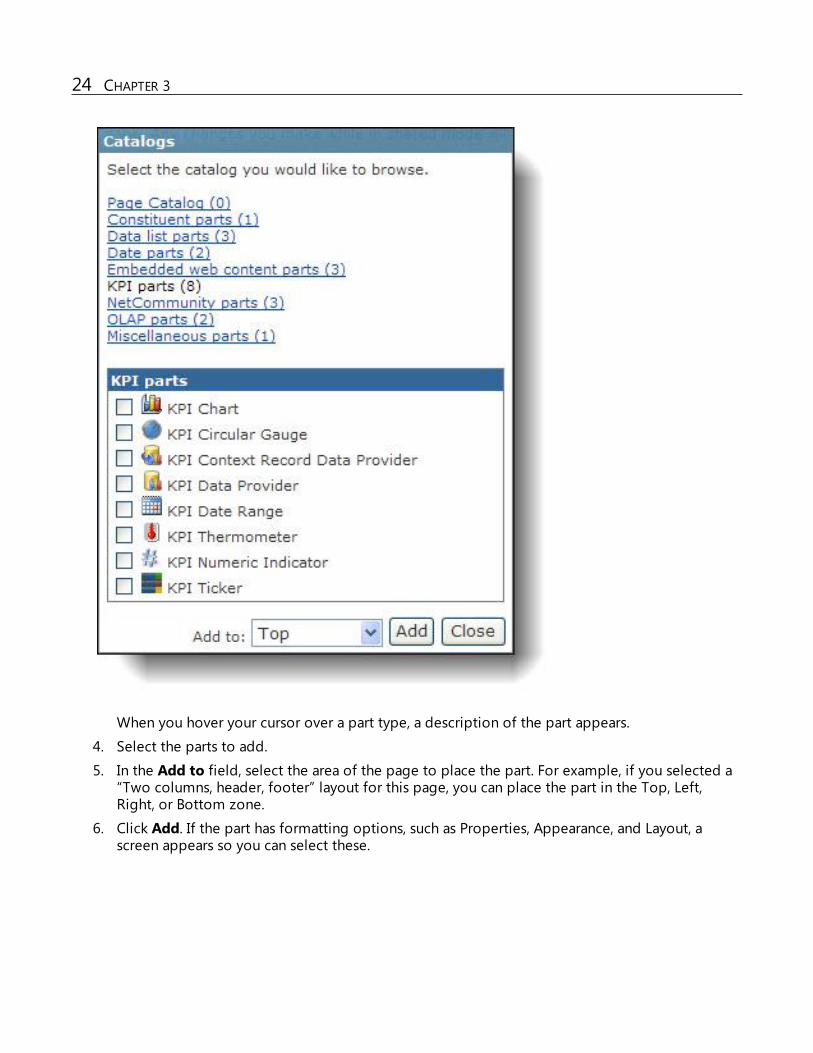
When you hover your cursor over a part type, a description of the part appears.
4. Select the parts to add.
5. In the Add to field, select the area of the page to place the part. For example, if you selected a“Two columns, header, footer” layout for this page, you can place the part in the Top, Left,Right, or Bottom zone.
6. Click Add. If the part has formatting options, such as Properties, Appearance, and Layout, ascreen appears so you can select these.
24 CHAPTER 3
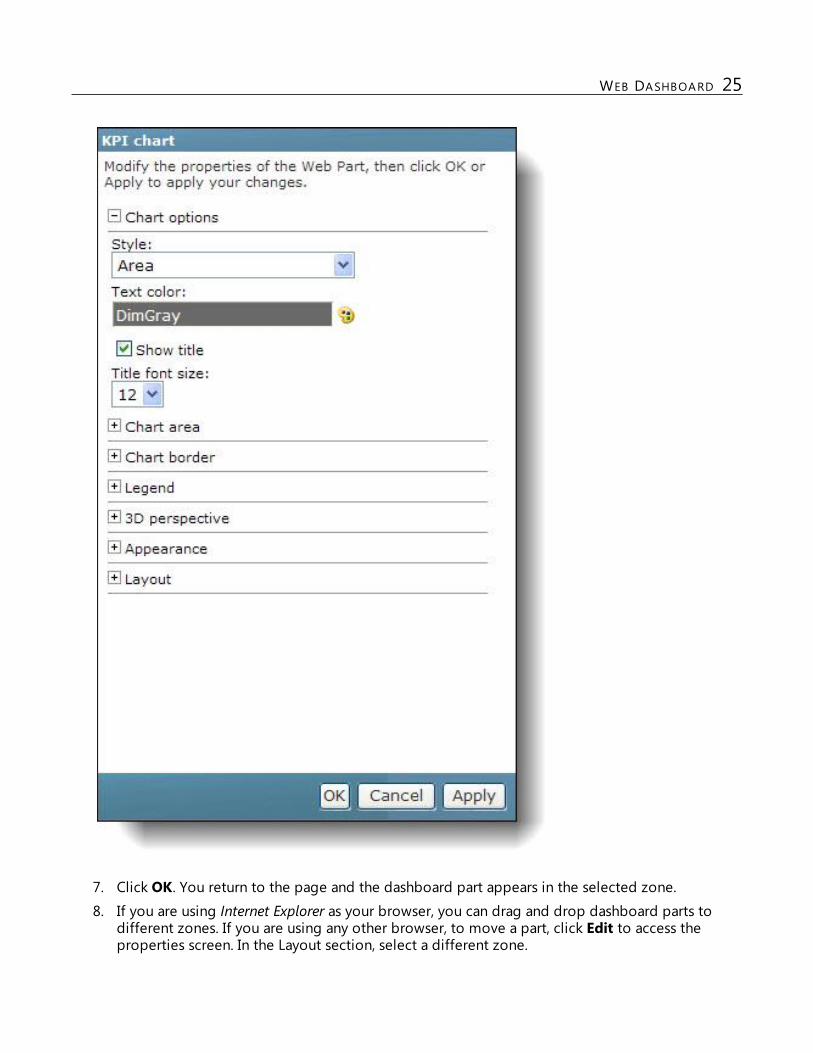
7. Click OK. You return to the page and the dashboard part appears in the selected zone.8. If you are using Internet Explorer as your browser, you can drag and drop dashboard parts to
different zones. If you are using any other browser, to move a part, click Edit to access theproperties screen. In the Layout section, select a different zone.
WEB DASHBOARD 25
Tip: For certain part types, a Web properties icon appears when you hover over the part. Whenyou click the icon, the Properties screen appears displaying the part’s embed code and direct URL.You can use these to embed the part in other web applications, or to use with Microsoft Vistaor7gadgets or Yahoo! widgets.
9. Continue to add dashboard parts to the page or click Exit edit mode to return to the page.
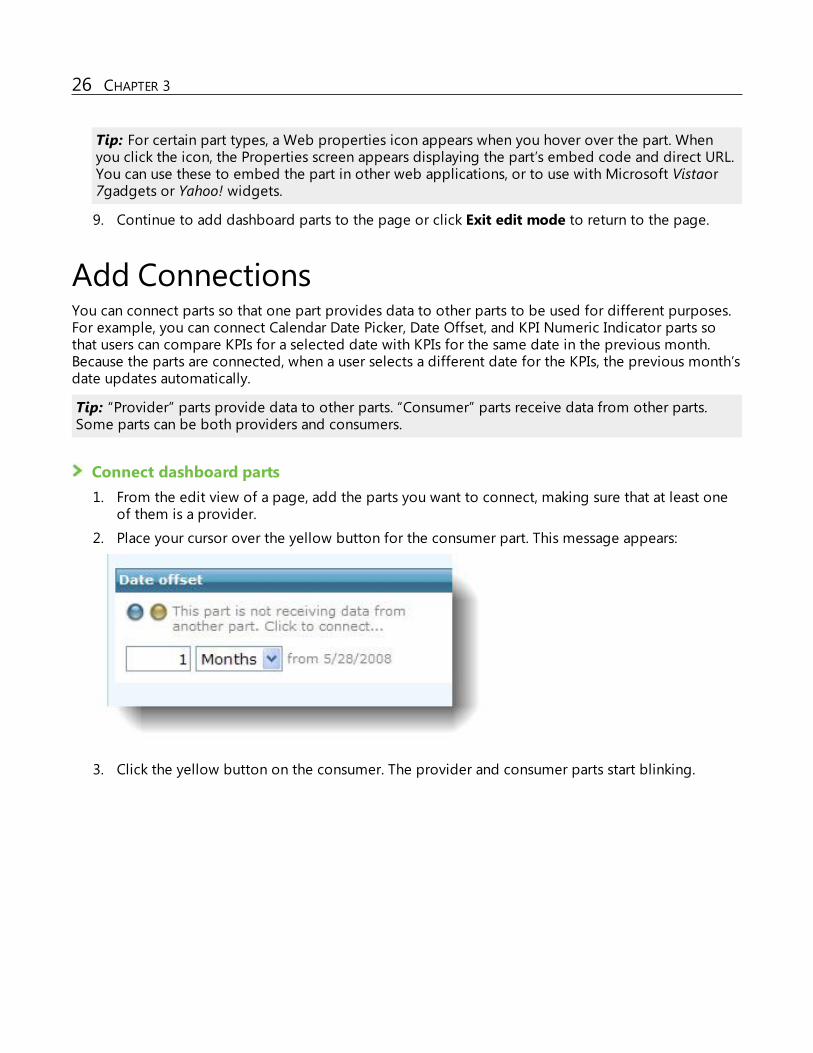
Add ConnectionsYou can connect parts so that one part provides data to other parts to be used for different purposes.For example, you can connect Calendar Date Picker, Date Offset, and KPI Numeric Indicator parts sothat users can compare KPIs for a selected date with KPIs for the same date in the previous month.Because the parts are connected, when a user selects a different date for the KPIs, the previous month’sdate updates automatically.
Tip: “Provider” parts provide data to other parts. “Consumer” parts receive data from other parts.Some parts can be both providers and consumers.
Connect dashboard parts1. From the edit view of a page, add the parts you want to connect, making sure that at least one
of them is a provider.
2. Place your cursor over the yellow button for the consumer part. This message appears:
3. Click the yellow button on the consumer. The provider and consumer parts start blinking.
26 CHAPTER 3
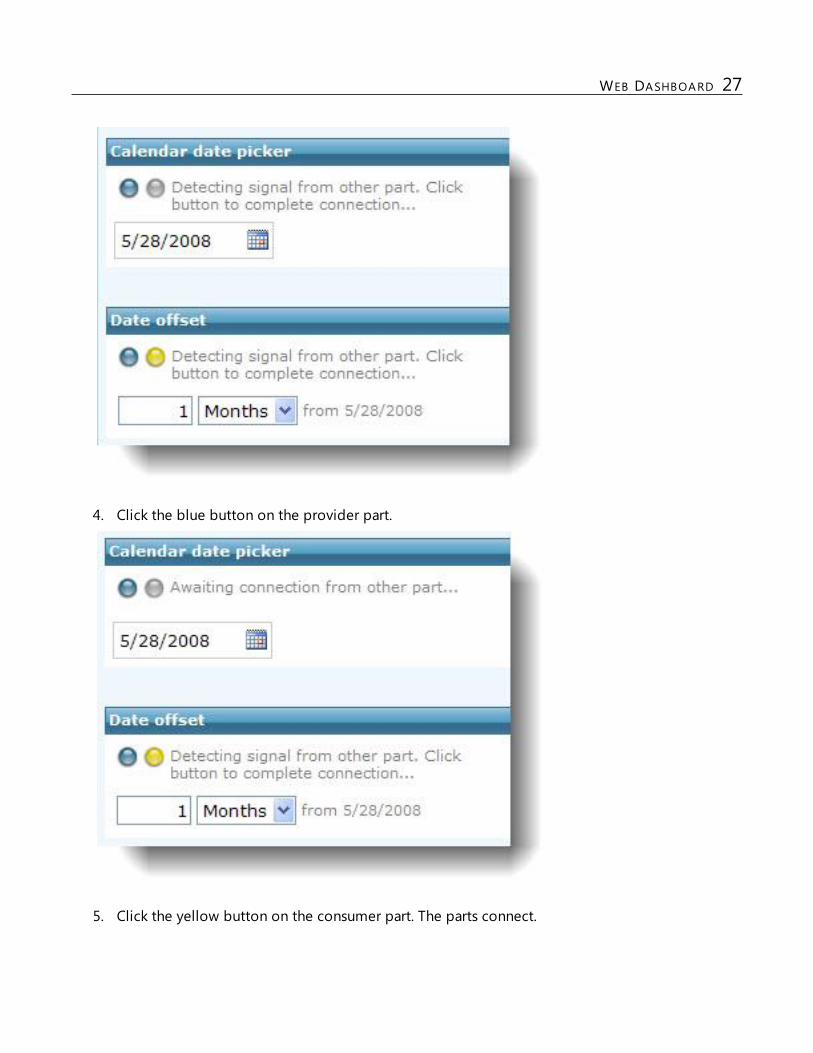
4. Click the blue button on the provider part.
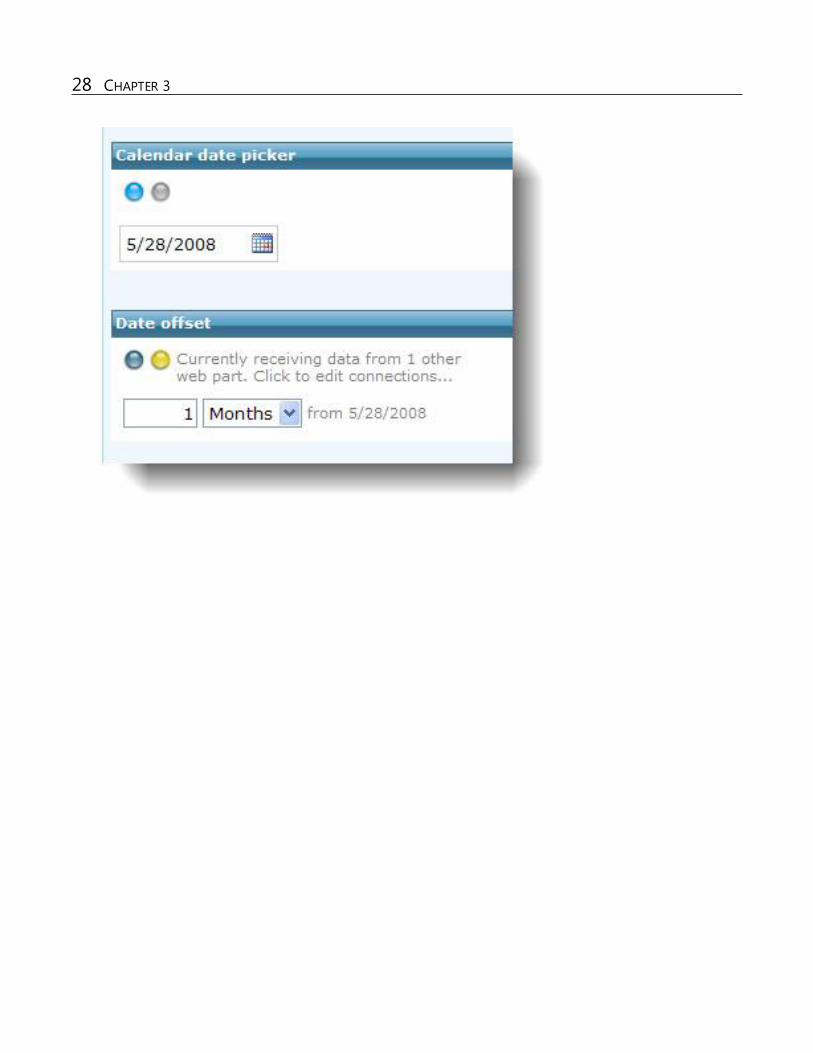
5. Click the yellow button on the consumer part. The parts connect.
WEB DASHBOARD 27
28 CHAPTER 3
Report Options
Reports Toolbar 29
This chapter includes information about the various report options available, such as print and export.
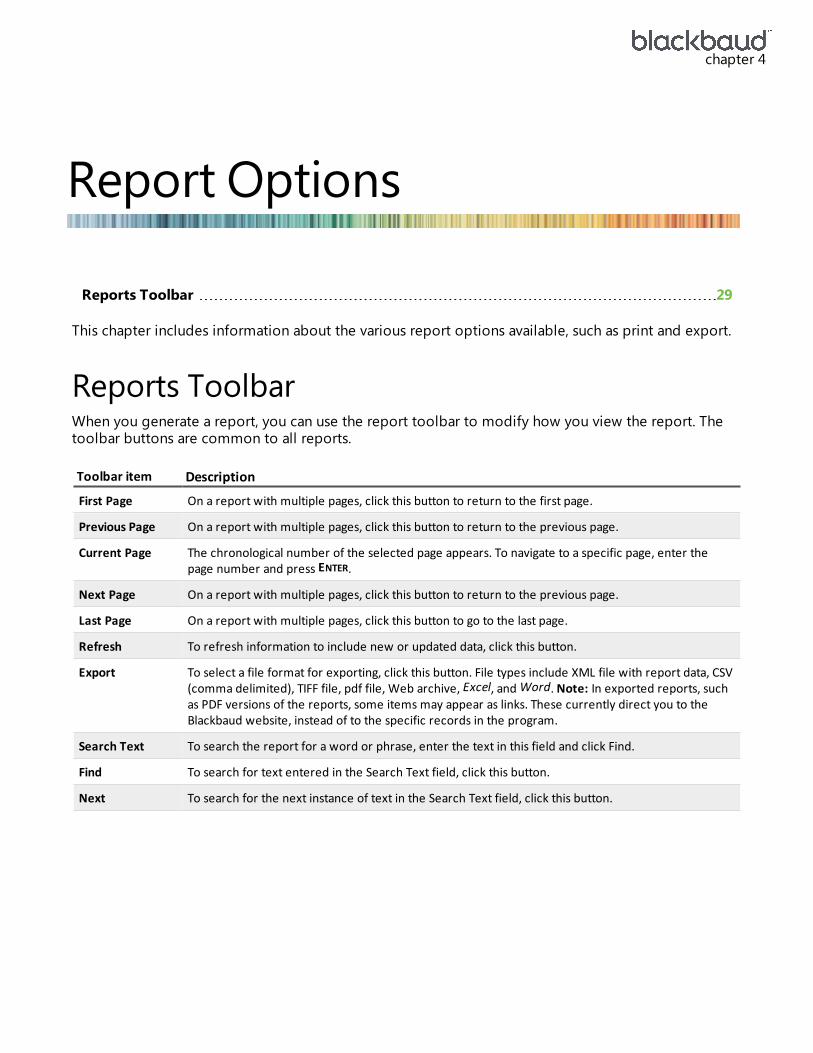
Reports ToolbarWhen you generate a report, you can use the report toolbar to modify how you view the report. Thetoolbar buttons are common to all reports.
Toolbar item Description
First Page On a report with multiple pages, click this button to return to the first page.
Previous Page On a report with multiple pages, click this button to return to the previous page.
Current Page The chronological number of the selected page appears. To navigate to a specific page, enter thepage number and press ENTER.
Next Page On a report with multiple pages, click this button to return to the previous page.
Last Page On a report with multiple pages, click this button to go to the last page.
Refresh To refresh information to include new or updated data, click this button.
Export To select a file format for exporting, click this button. File types include XML file with report data, CSV(comma delimited), TIFF file, pdf file, Web archive, Excel, andWord. Note: In exported reports, suchas PDF versions of the reports, some items may appear as links. These currently direct you to theBlackbaud website, instead of to the specific records in the program.
Search Text To search the report for a word or phrase, enter the text in this field and click Find.
Find To search for text entered in the Search Text field, click this button.
Next To search for the next instance of text in the Search Text field, click this button.
chapter 4
Microsoft Excel Add-In
Set Up Microsoft Excel Add-In 30
Data Options in Excel 30
Programs built on Blackbaud’s Infinity platform can integrate with Microsoft Excel 2007 or 2010 foreasy access to Infinity data from within a spreadsheet. You can take advantage of the tools in Excel,such as graphs and pivot tables, to present and analyze the data. The data is pulled from the Infinitydatabase and can be refreshed each time the spreadsheet is opened or can be refreshed on demand.
Set Up Microsoft Excel Add-InTo install the Microsoft Excel Add-in, you can use a utility on the Utilities, Gadgets, and Referencepage that you access from the application start page. After you install the add-in, a Blackbaud tabappears on the ribbon in Excel. You can then select ad-hoc queries, data lists, or KPIs in the program tocreate spreadsheets with data from your database. For more information about how to install the add-in, refer to the Installation Guide and the Update Guide.
Data Options in ExcelYou can display data from your database in the spreadsheet using ad-hoc queries, data lists, or KPIs.After you display data in the spreadsheet, you can use the standard tools in Excel to format, graph, andanalyze it.
Ad-hoc Query in Excel. On the Blackbaud tab, click From Ad-hoc Query to display data from anInfinity ad-hoc query. The results of the query — the fields and data from the results tab of the ad-hocquery — appear in the spreadsheet.
Data Lists in Excel. On the Blackbaud tab, click From Data List to select an Infinity data list. Many datalists require a record to be selected so the data is in context. For example, the “Constituent 5 YearGiving” data list needs a constituent record for context. When you select this data list, you must alsoselect a constituent. The information from the data list, including fields and parameters, is displayed inthe spreadsheet. You can change the parameters to update the information in the fields.
KPIs in Excel. On the Blackbaud tab, click From KPI to select an Infinity KPI instance. The KPI instancemust already exist in order for the data to display in a spreadsheet.
Smart Query in Excel. On the Blackbaud tab, click From Smart Query to display data from an Infinitysmart query. The results of the query — the fields and data from the results tab of the smart query —appear in the spreadsheet.
chapter 5

Note: Query results are restricted to 500 records. If your results exceed the 500 record limit, you cansave your query and create an export instead of using the Excel Add-in functionality.
31 CHAPTER 5
Prospect Research Reporting
Opportunity Pipeline Report 32
Prospect Plan Analysis 33
Prospect Plan Follow-Up Report 33
Major Giving includes several tracking and reporting options, enabling you to quickly and easilygenerate basic reports tracking a variety of major giving activities. For example, you can generate aProspect Plan Analysis to review details about the various plan types included in your system,including status and ask amount information; you can generate an Opportunity Pipeline Report toreview details about your fundraisers and ask opportunities; and much more.
Major Giving includes several reporting options, allowing you to quickly and easily generate basicreports tracking a variety of major giving activities.
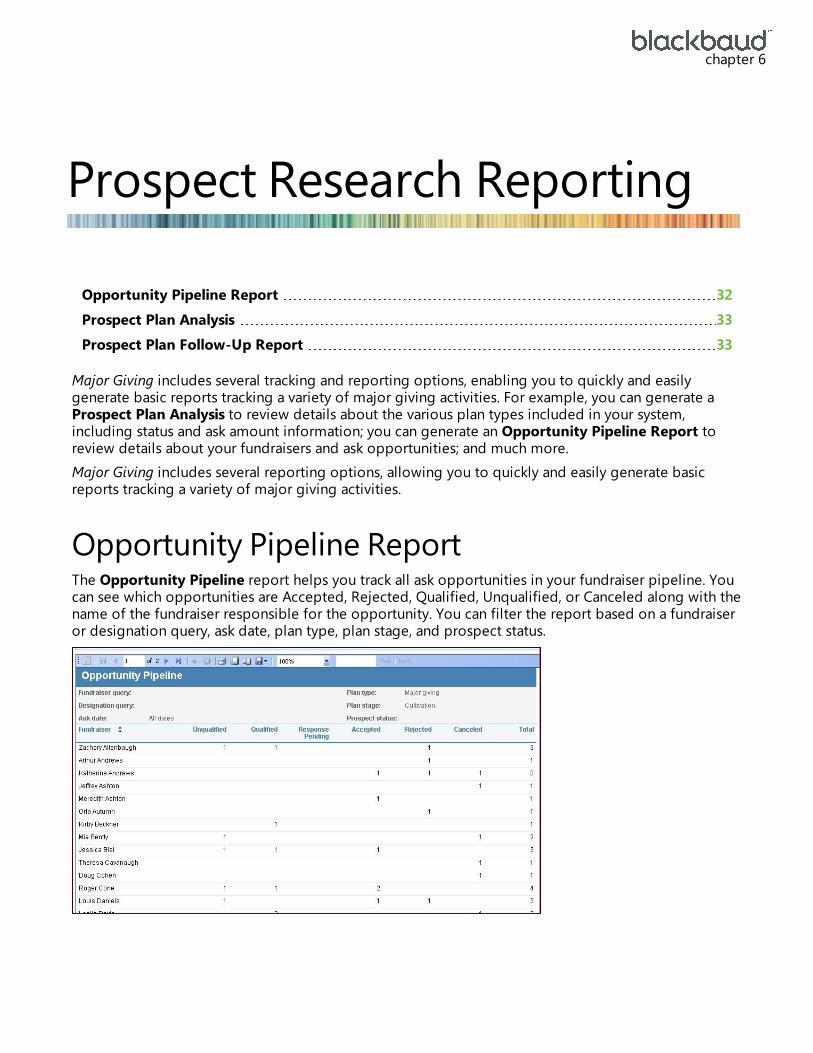
Opportunity Pipeline ReportThe Opportunity Pipeline report helps you track all ask opportunities in your fundraiser pipeline. Youcan see which opportunities are Accepted, Rejected, Qualified, Unqualified, or Canceled along with thename of the fundraiser responsible for the opportunity. You can filter the report based on a fundraiseror designation query, ask date, plan type, plan stage, and prospect status.
chapter 6
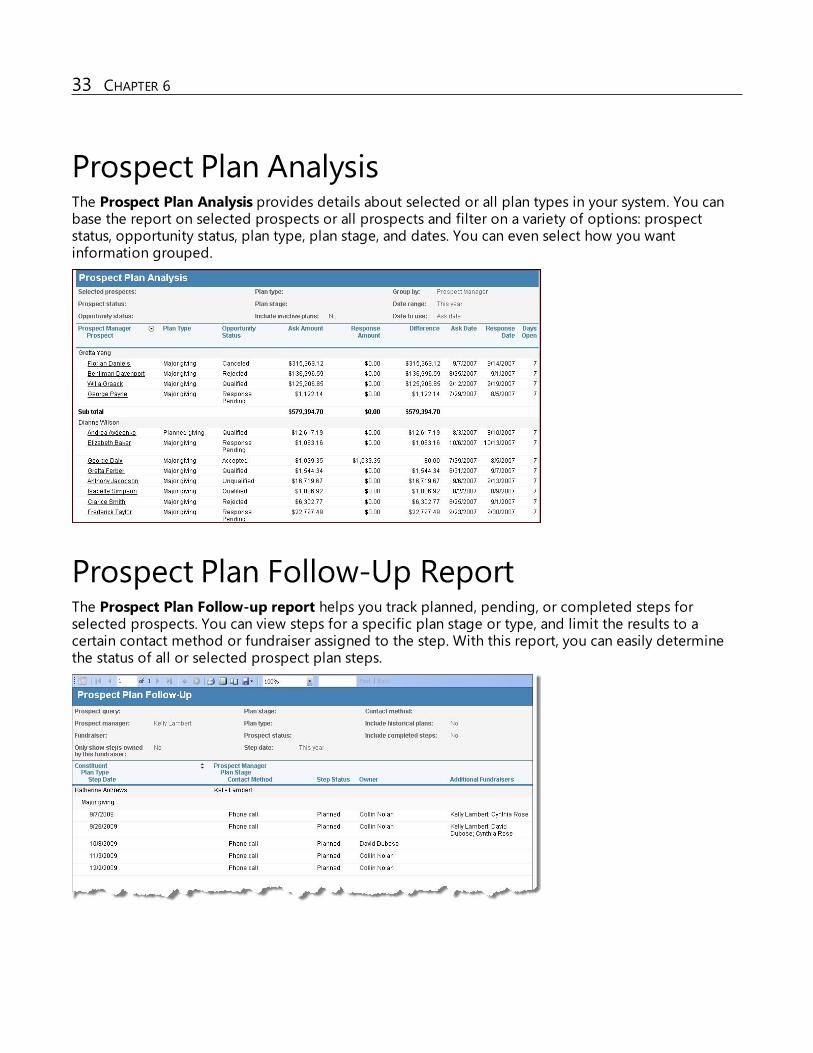
Prospect Plan AnalysisThe Prospect Plan Analysis provides details about selected or all plan types in your system. You canbase the report on selected prospects or all prospects and filter on a variety of options: prospectstatus, opportunity status, plan type, plan stage, and dates. You can even select how you wantinformation grouped.
Prospect Plan Follow-Up ReportThe Prospect Plan Follow-up report helps you track planned, pending, or completed steps forselected prospects. You can view steps for a specific plan stage or type, and limit the results to acertain contact method or fundraiser assigned to the step. With this report, you can easily determinethe status of all or selected prospect plan steps.
33 CHAPTER 6