Embed Size (px)
Citation preview
CMP 262.00
Target Price 290.00
ISIN: INE340A01012
JANUARY 3rd
2014
BIRLA CORPORATION LTD.
Result Update: Q2 FY14
HOLD
Index Details
Stock Data
Sector Cement
BSE Code 500335
Face Value 10.00
52wk. High / Low (Rs.) 336.00/191.00
Volume (2wk. Avg.) 1064
Market Cap (Rs. in mn.) 20176.62
Annual Estimated Results (A*: Actual / E*: Estimated)
YEARS FY13A FY14E FY15E
Net Sales 26029.60 29673.74 32641.12
EBITDA 5199.60 4357.34 5663.30
Net Profit 2698.20 2103.55 2736.15
EPS 35.04 27.32 35.53
P/E 7.48 9.59 7.37
Shareholding Pattern (%)
1 Year Comparative Graph
BIRLA CORPORATION LTD S&P BSE SENSEX
SYNOPSIS
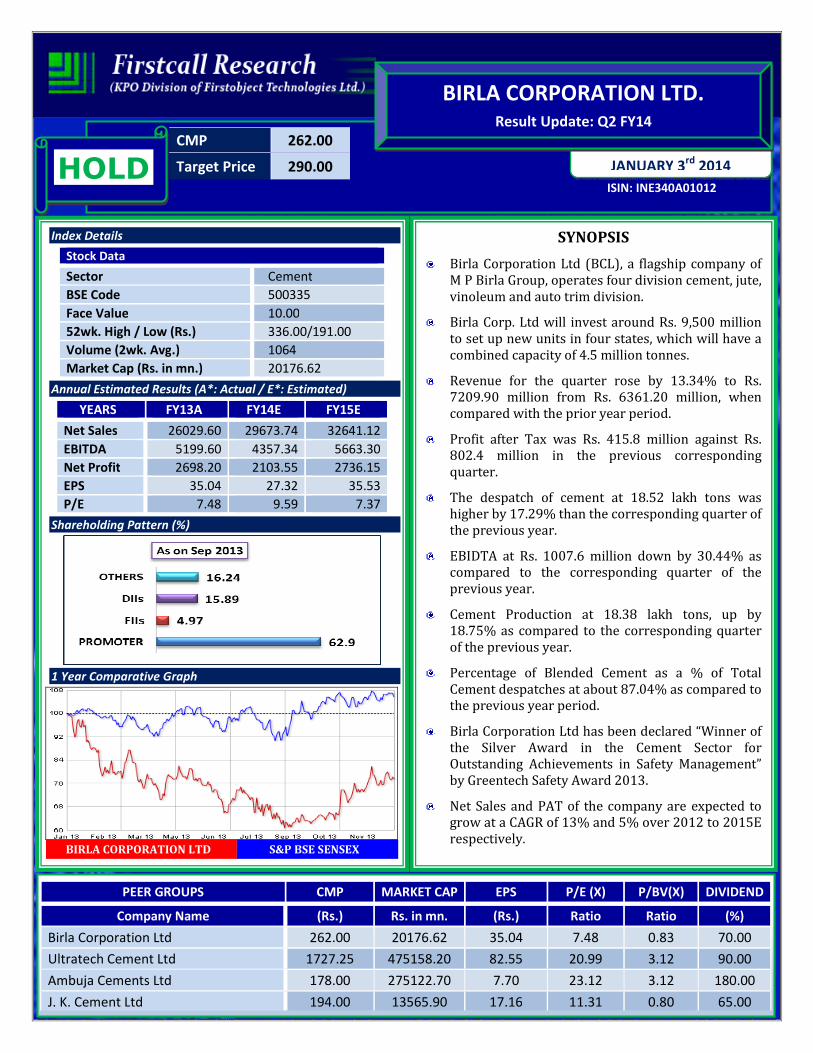
Birla Corporation Ltd (BCL), a flagship company of M P Birla Group, operates four division cement, jute, vinoleum and auto trim division.
Birla Corp. Ltd will invest around Rs. 9,500 million to set up new units in four states, which will have a combined capacity of 4.5 million tonnes.
Revenue for the quarter rose by 13.34% to Rs. 7209.90 million from Rs. 6361.20 million, when compared with the prior year period.
Profit after Tax was Rs. 415.8 million against Rs. 802.4 million in the previous corresponding quarter.
The despatch of cement at 18.52 lakh tons was higher by 17.29% than the corresponding quarter of the previous year.
EBIDTA at Rs. 1007.6 million down by 30.44% as compared to the corresponding quarter of the previous year.
Cement Production at 18.38 lakh tons, up by 18.75% as compared to the corresponding quarter of the previous year.
Percentage of Blended Cement as a % of Total Cement despatches at about 87.04% as compared to the previous year period.
Birla Corporation Ltd has been declared “Winner of the Silver Award in the Cement Sector for Outstanding Achievements in Safety Management” by Greentech Safety Award 2013.
Net Sales and PAT of the company are expected to grow at a CAGR of 13% and 5% over 2012 to 2015E respectively.
PEER GROUPS CMP MARKET CAP EPS P/E (X) P/BV(X) DIVIDEND
Company Name (Rs.) Rs. in mn. (Rs.) Ratio Ratio (%)
Birla Corporation Ltd 262.00 20176.62 35.04 7.48 0.83 70.00
Ultratech Cement Ltd 1727.25 475158.20 82.55 20.99 3.12 90.00
Ambuja Cements Ltd 178.00 275122.70 7.70 23.12 3.12 180.00
J. K. Cement Ltd 194.00 13565.90 17.16 11.31 0.80 65.00
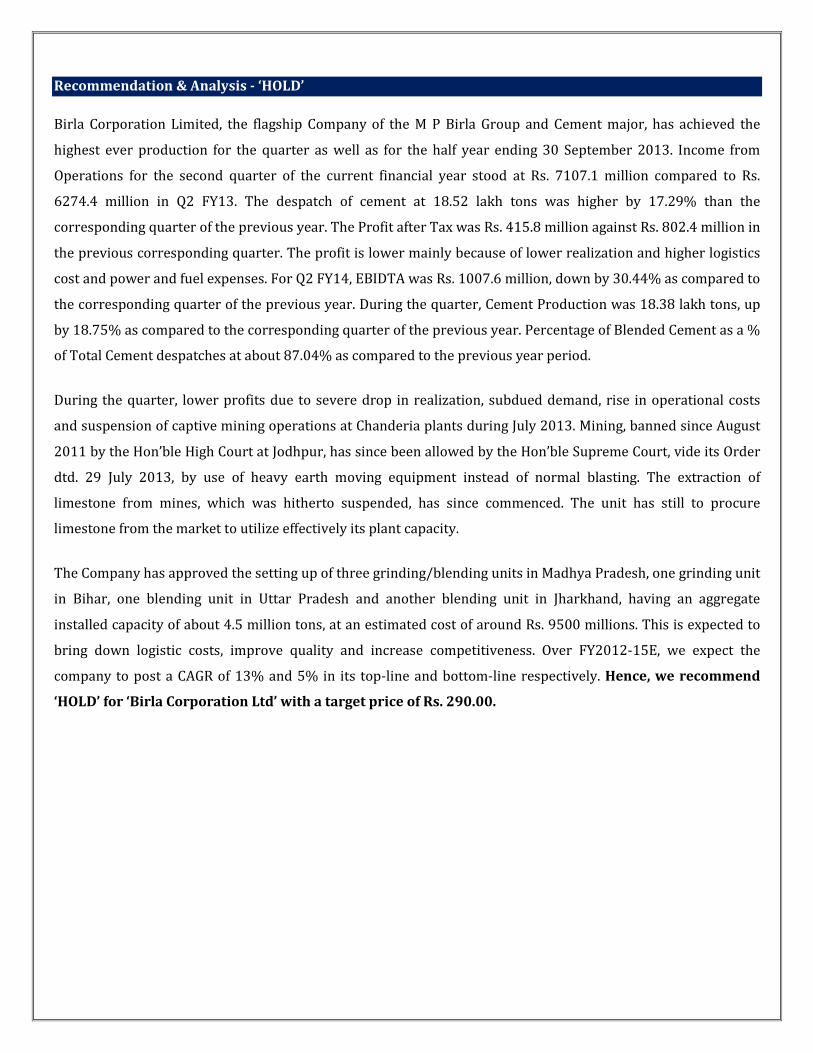
Recommendation & Analysis - ‘HOLD’
Birla Corporation Limited, the flagship Company of the M P Birla Group and Cement major, has achieved the
highest ever production for the quarter as well as for the half year ending 30 September 2013. Income from
Operations for the second quarter of the current financial year stood at Rs. 7107.1 million compared to Rs.
6274.4 million in Q2 FY13. The despatch of cement at 18.52 lakh tons was higher by 17.29% than the
corresponding quarter of the previous year. The Profit after Tax was Rs. 415.8 million against Rs. 802.4 million in
the previous corresponding quarter. The profit is lower mainly because of lower realization and higher logistics
cost and power and fuel expenses. For Q2 FY14, EBIDTA was Rs. 1007.6 million, down by 30.44% as compared to
the corresponding quarter of the previous year. During the quarter, Cement Production was 18.38 lakh tons, up
by 18.75% as compared to the corresponding quarter of the previous year. Percentage of Blended Cement as a %
of Total Cement despatches at about 87.04% as compared to the previous year period.
During the quarter, lower profits due to severe drop in realization, subdued demand, rise in operational costs
and suspension of captive mining operations at Chanderia plants during July 2013. Mining, banned since August
2011 by the Hon’ble High Court at Jodhpur, has since been allowed by the Hon’ble Supreme Court, vide its Order
dtd. 29 July 2013, by use of heavy earth moving equipment instead of normal blasting. The extraction of
limestone from mines, which was hitherto suspended, has since commenced. The unit has still to procure
limestone from the market to utilize effectively its plant capacity.
The Company has approved the setting up of three grinding/blending units in Madhya Pradesh, one grinding unit
in Bihar, one blending unit in Uttar Pradesh and another blending unit in Jharkhand, having an aggregate
installed capacity of about 4.5 million tons, at an estimated cost of around Rs. 9500 millions. This is expected to
bring down logistic costs, improve quality and increase competitiveness. Over FY2012-15E, we expect the
company to post a CAGR of 13% and 5% in its top-line and bottom-line respectively. Hence, we recommend
‘HOLD’ for ‘Birla Corporation Ltd’ with a target price of Rs. 290.00.
QUARTERLY HIGHLIGHTS (STANDALONE)
Results updates- Q2 FY14,
Birla Corporation Limited, the flagship Company of
the M P Birla Group and Cement major in India,
reported its financial results for the quarter ended
30th Sep, 2013.
Months Sep-13 Sep-12 % Change
Net Sales 7209.90 6361.20 13.34
PAT 415.80 802.40 (48.18)
EPS 5.40 10.42 (48.18)
EBITDA 1007.60 1448.50 (30.44)
The company’s net profit declines to Rs. 415.80 million against Rs. 802.40 million in the corresponding quarter
ending of previous year, a decrease of 48.18%. Revenue for the quarter rose by 13.34% to Rs. 7209.90 million
from Rs. 6361.20 million, when compared with the prior year period. Reported earnings per share of the
company stood at Rs. 5.40 a share during the quarter, registering 48.18% decrease over previous year period.
Profit before interest, depreciation and tax is Rs. 1007.60 millions as against Rs. 1448.50 millions in the
corresponding period of the previous year.
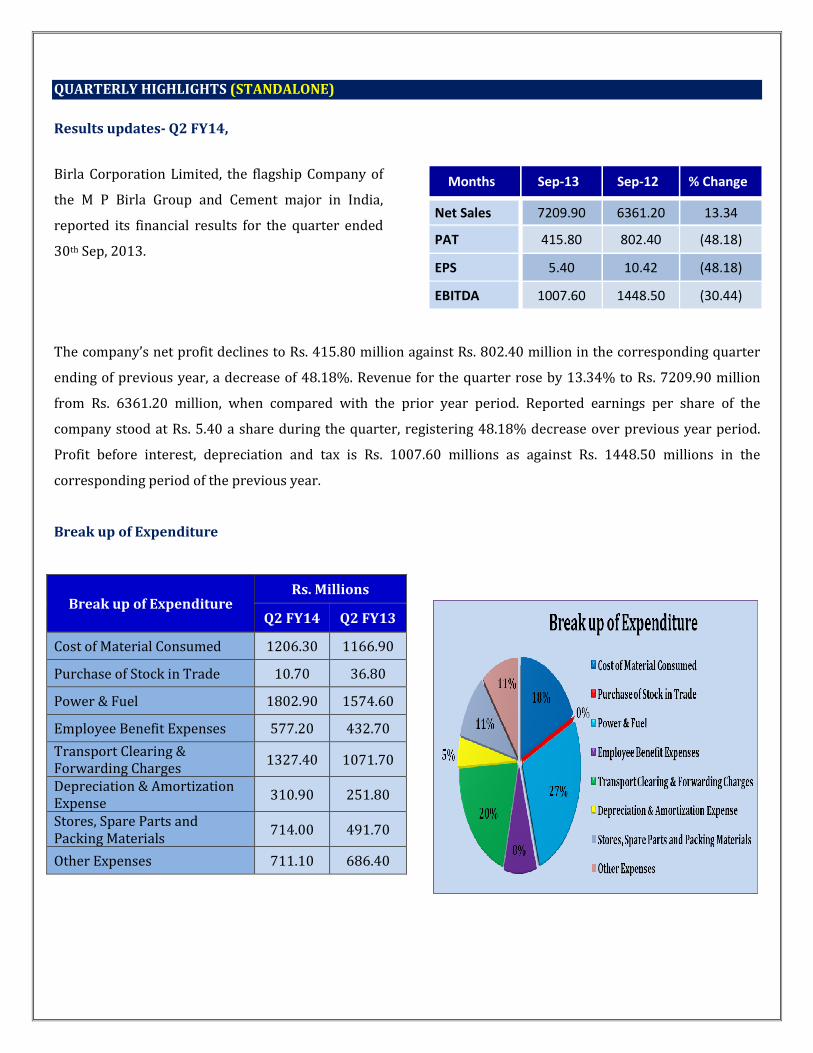
Break up of Expenditure
Break up of Expenditure Rs. Millions
Q2 FY14 Q2 FY13
Cost of Material Consumed 1206.30 1166.90
Purchase of Stock in Trade 10.70 36.80
Power & Fuel 1802.90 1574.60
Employee Benefit Expenses 577.20 432.70
Transport Clearing & Forwarding Charges
1327.40 1071.70
Depreciation & Amortization Expense
310.90 251.80
Stores, Spare Parts and Packing Materials
714.00 491.70
Other Expenses 711.10 686.40
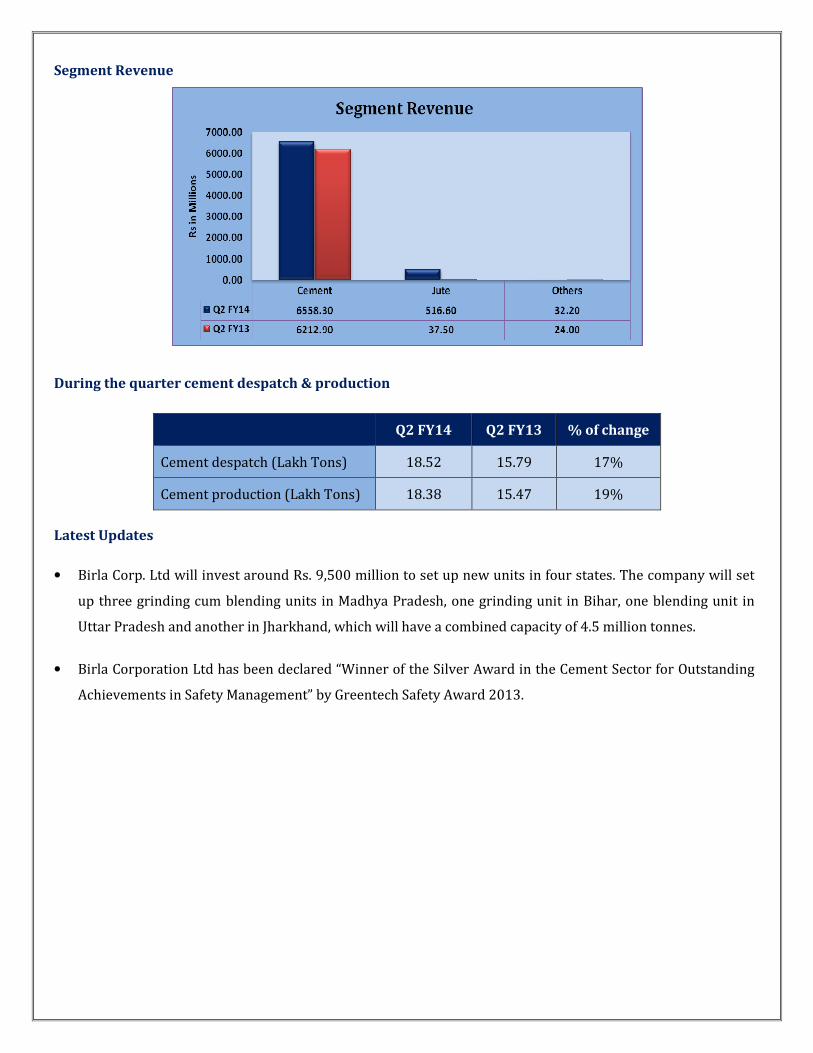
Segment Revenue
During the quarter cement despatch & production
Q2 FY14 Q2 FY13 % of change
Cement despatch (Lakh Tons) 18.52 15.79 17%
Cement production (Lakh Tons) 18.38 15.47 19%
Latest Updates
• Birla Corp. Ltd will invest around Rs. 9,500 million to set up new units in four states. The company will set
up three grinding cum blending units in Madhya Pradesh, one grinding unit in Bihar, one blending unit in
Uttar Pradesh and another in Jharkhand, which will have a combined capacity of 4.5 million tonnes.
• Birla Corporation Ltd has been declared “Winner of the Silver Award in the Cement Sector for Outstanding
Achievements in Safety Management” by Greentech Safety Award 2013.
COMPANY PROFILE
Birla Corporation Ltd (BCL), a flagship company of M P Birla Group, operates four division cement, jute, vinoleum
and auto trim division. It was incorporated in 1919 by Madhav Prasadji as Birla Jute Manufacturing Company.
Later its steadily grew in a multiproduct corporation. The Company crossed the Rs. 1300 - crore turnover mark
and the name was changed to Birla Corporation in 1998.
Birla Corporation Limited, together with its subsidiaries, primarily engages in the manufacture and sale of
cement, jute goods, PVC floor covering products, and auto trims primarily in India. Its Cement division provides
ordinary portland cement, 43 and 53 grades, portland pozzolana cement (PPC), low alkali cement, portland slag
cement, low heat cement, and sulphate resistant cement under the Birla Cement SAMRAT, Birla Cement
KHAJURAHO, Birla Cement CHETAK, and Birla Premium Cement brand names. During year ended 31st March,
2013, the Company has achieved the Total Income of Rs. 27300.80 Million.
Business Divisions:
Cement Division – BCL manufactures ordinary portland cement of 43 and 53 grades, fly ash- based portland
pozzolana cement portland slag cement and sulphate resistant cement. It has installed capacity of 5.8 million
tonnes.
Jute Division- It manufactures jute fibre that is eco-friendly and bio degradable. It has an installed capacity of
38000 million tonnes. It manufactures wide range of jute such as jute yarn, jute carpets, canvas, sacking bags,
decorative fabrics, etc.
Vinoleum division- It has a production capacity of 48,60,000 sq mtrs of cushion vinyl flooring and PVC Sheet.
Auto Trim Division- It manufactures door trims for automobile industry. It has clients like Maruti Udyog,
Mahindra & Mahindra, General Motors, Hindustan Motors and Tata Motors, among others.

FINANCIAL HIGHLIGHT (STANDALONE) (A*- Actual, E* -Estimations & Rs. In Millions)
Balance Sheet as at March31, 2012 -2015E
BIRLA CORPORATION LTD. FY12A FY13A FY14E FY15E
SOURCES OF FUNDS (Rs.in.mn)
Shareholder's Funds
Share Capital 770.10 770.10 770.10 770.10
Reserves and Surplus 21663.71 23730.51 25760.55 28496.70
1. Sub Total - Net worth 22433.81 24500.61 26530.65 29266.80
Non Current Liabilities
Long term borrowings 7522.38 8973.84 12922.33 13956.12
Deferred Tax Liabilities 1532.49 2116.92 2222.77 2311.68
Other Long term Liabilities 2216.32 2504.84 2705.23 2867.54
Long Term Provisions 338.57 362.23 409.32 450.25
2. Sub Total - Non Current Liabilities 11609.76 13957.83 18259.64 19585.59
Current Liabilities
Short Term Borrowings 3720.95 2778.90 2328.72 1979.41
Trade Payables 1012.18 1267.06 1773.88 2235.09
Other Current Liabilities 1515.80 2162.30 2767.74 3432.00
Short Term Provisions 420.21 588.21 499.98 549.98
3. Sub Total - Current Liabilities 6669.14 6796.47 7370.32 8196.48
Total Liabilities (1+2+3) 40712.71 45254.91 52160.62 57048.87
APPLICATION OF FUNDS
Non-Current Assets
Fixed Assets
Tangible assets 13482.30 17282.33 18595.42 19711.15
Intangible assets 0.00 45.93 48.69 53.55
Capital Work in Progress 5096.24 2285.73 2468.59 2592.02
Intangible assets under development 43.02 0.00 0.00 0.00
a) Sub Total - Fixed Assets 18621.56 19613.99 21112.69 22356.72
b) Non-current investments 4599.44 8979.31 4040.69 4283.13
c) Long Term loans and advances 851.57 1350.39 1836.53 2258.93
d) Other non-current assets 288.02 294.20 332.45 365.69
1. Sub Total - Non Current Assets 24360.59 30237.89 27322.36 29264.47
Current Assets
Current Investment 5848.66 3728.00 10450.50 11564.22
Inventories 4158.13 5701.41 5416.34 5687.16
Trade receivables 372.45 749.63 1409.30 1747.54
Cash and Bank Balances 4264.13 2786.30 5015.34 5918.10
Short-terms loans & advances 784.90 969.54 1085.88 1172.76
Other current assets 923.85 1082.14 1460.89 1694.63
2. Sub Total - Current Assets 16352.12 15017.02 24838.26 27784.40
Total Assets (1+2) 40712.71 45254.91 52160.62 57048.87
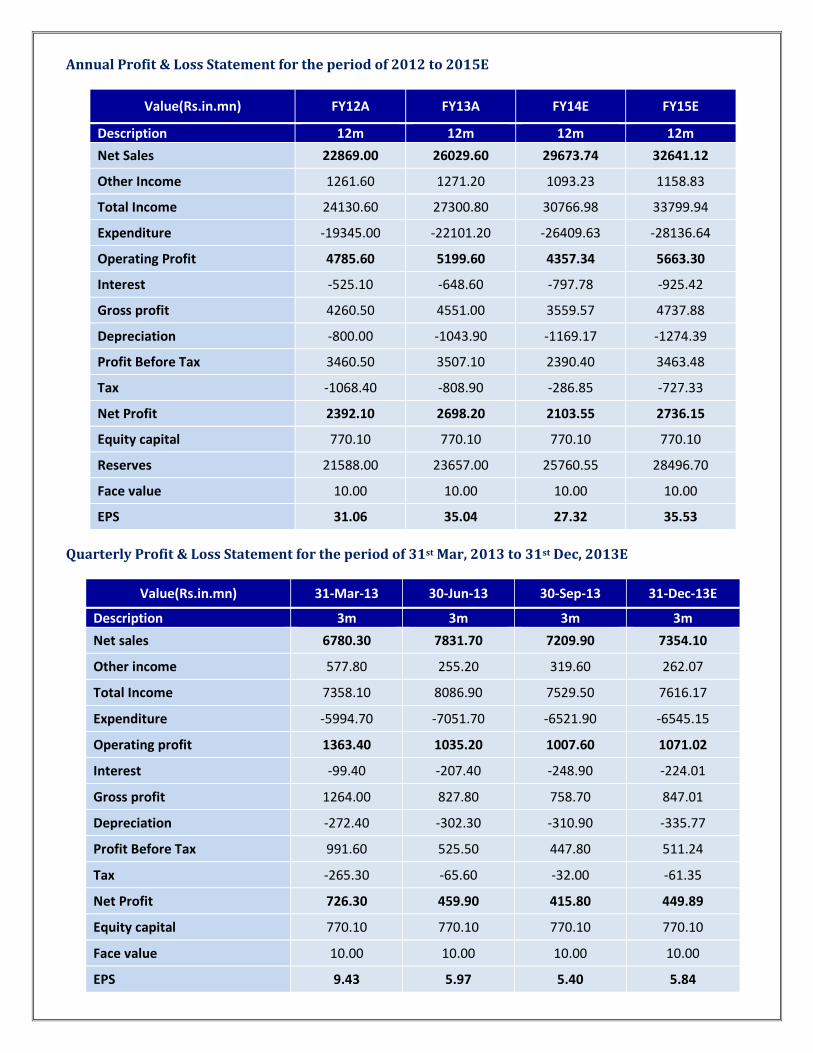
Annual Profit & Loss Statement for the period of 2012 to 2015E
Value(Rs.in.mn) FY12A FY13A FY14E FY15E
Description 12m 12m 12m 12m
Net Sales 22869.00 26029.60 29673.74 32641.12
Other Income 1261.60 1271.20 1093.23 1158.83
Total Income 24130.60 27300.80 30766.98 33799.94
Expenditure -19345.00 -22101.20 -26409.63 -28136.64
Operating Profit 4785.60 5199.60 4357.34 5663.30
Interest -525.10 -648.60 -797.78 -925.42
Gross profit 4260.50 4551.00 3559.57 4737.88
Depreciation -800.00 -1043.90 -1169.17 -1274.39
Profit Before Tax 3460.50 3507.10 2390.40 3463.48
Tax -1068.40 -808.90 -286.85 -727.33
Net Profit 2392.10 2698.20 2103.55 2736.15
Equity capital 770.10 770.10 770.10 770.10
Reserves 21588.00 23657.00 25760.55 28496.70
Face value 10.00 10.00 10.00 10.00
EPS 31.06 35.04 27.32 35.53
Quarterly Profit & Loss Statement for the period of 31st Mar, 2013 to 31st Dec, 2013E
Value(Rs.in.mn) 31-Mar-13 30-Jun-13 30-Sep-13 31-Dec-13E
Description 3m 3m 3m 3m
Net sales 6780.30 7831.70 7209.90 7354.10
Other income 577.80 255.20 319.60 262.07
Total Income 7358.10 8086.90 7529.50 7616.17
Expenditure -5994.70 -7051.70 -6521.90 -6545.15
Operating profit 1363.40 1035.20 1007.60 1071.02
Interest -99.40 -207.40 -248.90 -224.01
Gross profit 1264.00 827.80 758.70 847.01
Depreciation -272.40 -302.30 -310.90 -335.77
Profit Before Tax 991.60 525.50 447.80 511.24
Tax -265.30 -65.60 -32.00 -61.35
Net Profit 726.30 459.90 415.80 449.89
Equity capital 770.10 770.10 770.10 770.10
Face value 10.00 10.00 10.00 10.00
EPS 9.43 5.97 5.40 5.84
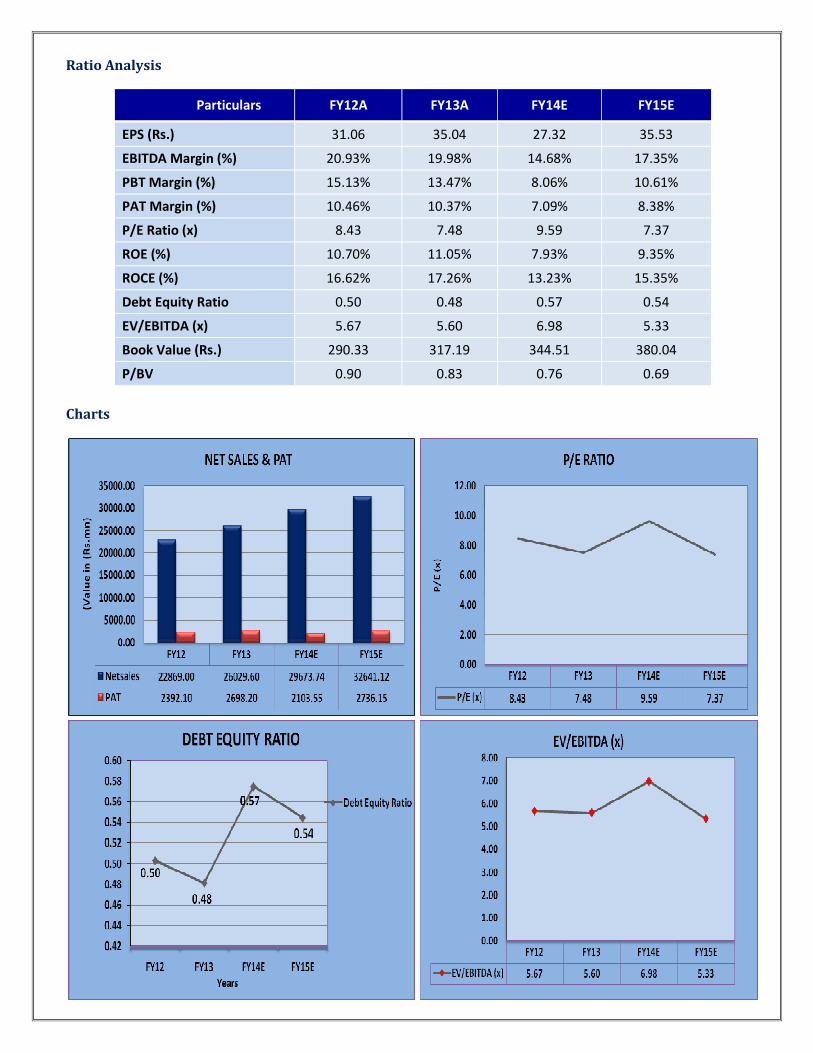
Ratio Analysis
Particulars FY12A FY13A FY14E FY15E
EPS (Rs.) 31.06 35.04 27.32 35.53
EBITDA Margin (%) 20.93% 19.98% 14.68% 17.35%
PBT Margin (%) 15.13% 13.47% 8.06% 10.61%
PAT Margin (%) 10.46% 10.37% 7.09% 8.38%
P/E Ratio (x) 8.43 7.48 9.59 7.37
ROE (%) 10.70% 11.05% 7.93% 9.35%
ROCE (%) 16.62% 17.26% 13.23% 15.35%
Debt Equity Ratio 0.50 0.48 0.57 0.54
EV/EBITDA (x) 5.67 5.60 6.98 5.33
Book Value (Rs.) 290.33 317.19 344.51 380.04
P/BV 0.90 0.83 0.76 0.69
Charts
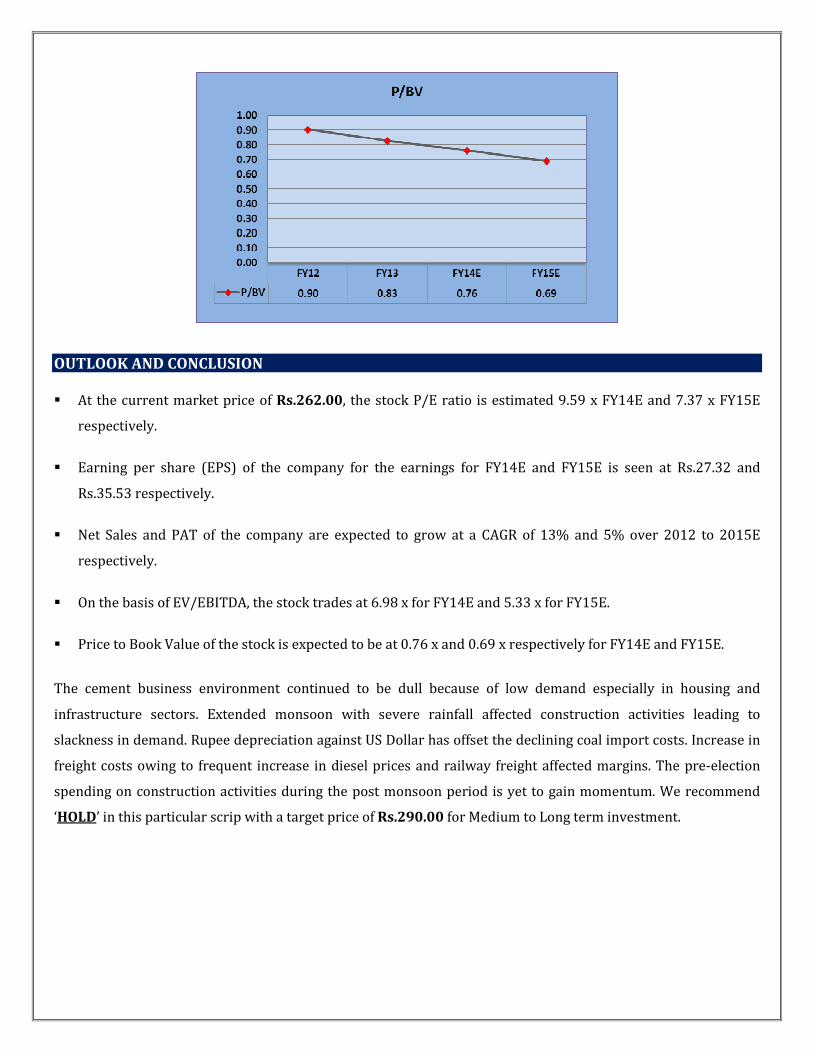
OUTLOOK AND CONCLUSION
� At the current market price of Rs.262.00, the stock P/E ratio is estimated 9.59 x FY14E and 7.37 x FY15E
respectively.
� Earning per share (EPS) of the company for the earnings for FY14E and FY15E is seen at Rs.27.32 and
Rs.35.53 respectively.
� Net Sales and PAT of the company are expected to grow at a CAGR of 13% and 5% over 2012 to 2015E
respectively.
� On the basis of EV/EBITDA, the stock trades at 6.98 x for FY14E and 5.33 x for FY15E.
� Price to Book Value of the stock is expected to be at 0.76 x and 0.69 x respectively for FY14E and FY15E.
The cement business environment continued to be dull because of low demand especially in housing and
infrastructure sectors. Extended monsoon with severe rainfall affected construction activities leading to
slackness in demand. Rupee depreciation against US Dollar has offset the declining coal import costs. Increase in
freight costs owing to frequent increase in diesel prices and railway freight affected margins. The pre-election
spending on construction activities during the post monsoon period is yet to gain momentum. We recommend
‘HOLD’ in this particular scrip with a target price of Rs.290.00 for Medium to Long term investment.
INDUSTRY OVERVIEW
Cement is one of the core industries which plays a vital role in the growth and development of a nation. The
cement industry in India has been expanding significantly on back of increasing infrastructure activities and
demand from housing sector.
Keeping in line with the technological world, the Indian cement industry has transited itself into a more
advanced one. At present, the Indian cement industry is positioned on the second rank globally and comprise of
183 large and 365 mini cement plants.
Moreover, the Indian cement majors, including ACC Ltd, Shree Cement Ltd and Ultratech, have signed a co-
operation pact to support low-carbon investments in India. The pact was signed in Geneva with member
companies of the World Business Council (WBC) for Sustainable Development’s Cement Sustainability Initiative
and International Finance Corporation (IFC). The roadmap will pose as a possible transition path for the Indian
cement industry to reduce its direct emissions by 18 per cent by 2050. This is the first roadmap to focus on one
specific industrial sector in a single country, as per a WBC release.
Market Size
A RNCOS report titled “Indian Cement Industry Outlook 2015” estimated that the total installed capacity of
cement in India will increase with a compound annual growth rate (CAGR) of around 7 per cent during 2012-13
to 2014-15.
The production of cement has increased at 10 per cent CAGR over FY07-11. The market size of the industry is
expected to grow from 223.4 MTPA during FY12 to 550 MTPA by FY20. The cement companies in India are
receiving full attention from the private equity (PE) firms for funding their business plans. India’s cement sector
is with an overall capacity of 350 MTPA. The companies including UltraTech, ACC, Ambuja Cements, Jaiprakash
and Shree Cement control almost half the country’s cement market. In the 11th Five Year Plan (2007-12), the
industry added 120 MT of new capacities and is expected to reach close to 470 MT by 2017.
Investments
The cement and gypsum products sector has attracted foreign direct investments (FDI) worth US$ 2,656.29
million between April 2000 to June 2013, according to the data published by the Department of Industrial Policy
and Promotion (DIPP).
• Malaysia’s Construction Industry Development Board (CIDB) has expressed interest in the construction
of 300 km long Agra-Lucknow expressway project, linking the Taj city with the state capital, at an
estimated cost of around Rs 11,000 crore (US$ 1.78 billion) in Uttar Pradesh
• The Government of Jammu and Kashmir (J&K) will set up a cement plant with 1,000 tonnes per day
capacity with the aim of capturing local market share for the cement
• Ultratech Cement has initiated steps to set up a Rs 2,500 crore (US$ 405.38 million) Greenfield cement
plant in Tamil Nadu (TN) and will add to the 36 MT cement production capacity in TN. The Company also
plans to set up a 5.5 MTPA cement plant with 4.5 MT clinker production, 75 megawatt (MW) captive
power plant and a waste heat recovery facility of about 15 MW
• Orient Cement Ltd has received environmental clearance for its three MTPA cement plant at Chittapur in
Gulbarga district of Karnataka
• Shiva Cement plans to enhance its production capacity to one MTPA with an investment of Rs 270 crore
(US$ 43.78 million)
• ACC Ltd, aims to enter the north-coastal Andhra Pradesh market through its product called Coastal Plus
particularly suited to coastal areas as it is corrosion-proof, according to Mr Kurian Chandapillai, Director
(sales) of the eastern region. The company had acquired a small cement (Encore) in the Visakhapatanm
Special Economic Zone (SEZ) and spent Rs 80 crore (US$ 12.97 million) on it, making it a 30,000 tonne
per month plant
Government Initiatives
During the 12th Five Year Plan period (2012-17) the industry is estimated to add a capacity of 150 MT.
Giving impetus to the market, the Government of India plans to roll out public-private partnership (PPP) projects
worth Rs 1 trillion (US$ 16.33 billion) over the next six months. The Principal Secretary in the Prime Minister's
Office (PMO) will monitor these projects. Also, the steering group appointed by Dr Manmohan Singh, Prime
Minister of India, to accelerate infrastructure investments, has set deadlines for the award of projects such as
Mumbai rail corridor and Navi Mumbai Airport, among others.
With focus on the green initiatives, Goa State Pollution Control Board (GSPCB) signed a memorandum of
understanding (MoU) with Vasavdatta Cement, a company with its plant in Karnataka. The firm would use the
plastic waste collected by the state agencies and village panchayats from Goa to use the waste as fuel for its
manufacturing plant.
Road Ahead
Indian cement industry is globally competitive as the industry witnessed healthy trends such as cost control,
continuous technology upgradation and increased construction activities.
With the ever increasing industrial activities, real estate, construction and infrastructure, in addition to the onset
of various Special Economic Zones (SEZs) being developed across the country, there is a demand for cement.
In addition, it is estimated that India needs about US$ 1 trillion from 2012-13 to 2016-17 to fund infrastructure
such as ports, airports and highways to boost growth, thereby promising a good outlook for the industry.
Disclaimer:
This document prepared by our research analysts does not constitute an offer or solicitation for the purchase or sale
of any financial instrument or as an official confirmation of any transaction. The information contained herein is
from publicly available data or other sources believed to be reliable but do not represent that it is accurate or
complete and it should not be relied on as such. Firstcall India Equity Advisors Pvt. Ltd. or any of it’s affiliates shall
not be in any way responsible for any loss or damage that may arise to any person from any inadvertent error in the
information contained in this report. This document is provide for assistance only and is not intended to be and must
not alone be taken as the basis for an investment decision.
Firstcall India Equity Research: Email – [email protected]
C.V.S.L.Kameswari Pharma
U. Janaki Rao Capital Goods
B. Anil Kumar Diversified
Ashish.Kushwaha IT, Consumer Durable & Banking
Suhani Adilabadkar Diversified
M. Vinayak Rao Diversified
Firstcall India also provides
Firstcall India Equity Advisors Pvt.Ltd focuses on, IPO’s, QIP’s, F.P.O’s,Takeover
Offers, Offer for Sale and Buy Back Offerings.
Corporate Finance Offerings include Foreign Currency Loan Syndications,
Placement of Equity / Debt with multilateral organizations, Short Term Funds
Management Debt & Equity, Working Capital Limits, Equity & Debt
Syndications and Structured Deals.
Corporate Advisory Offerings include Mergers & Acquisitions(domestic and
cross-border), divestitures, spin-offs, valuation of business, corporate
restructuring-Capital and Debt, Turnkey Corporate Revival – Planning &
Execution, Project Financing, Venture capital, Private Equity and Financial
Joint Ventures
Firstcall India also provides Financial Advisory services with respect to raising
of capital through FCCBs, GDRs, ADRs and listing of the same on International
Stock Exchanges namely AIMs, Luxembourg, Singapore Stock Exchanges and
other international stock exchanges.
For Further Details Contact:
3rd Floor,Sankalp,The Bureau,Dr.R.C.Marg,Chembur,Mumbai 400 071
Tel. : 022-2527 2510/2527 6077/25276089 Telefax : 022-25276089
E-mail: [email protected]
www.firstcallindiaequity.com