Embed Size (px)
Citation preview
1
Bioretention Hydrologic
Modeling
Robin Kirschbaum, PE, LEED AP
Alice Lancaster, PE
April 11, 2012
Presentation Overview
Hydrologic Modeling
Modeling Guidelines,
Tools, Concepts
Bioretention Types
Applications
Flow Control
Water Quality Treatment
Combined Sewer
Overflow Reduction
Wetland Protection
Hydrologic Modeling
Q: What is hydrologic modeling?
A: Use of mathematical equations to estimate runoff based on: weather patterns
landuse
soil
topography
Source: http://www.und.nodak.edu/

2
Hydrologic Modeling
Q: Why do we use hydrologic models?
A1: Characterize hydrologic conditions Predeveloped
Current
Post-project
A2: Design mitigation
A3: It’s fun!
Source: http://www.und.nodak.edu/
Hydrologic Modeling
Q: When does hydrologic
modeling enter into your
project?
A: Start to finish
preliminary design (sizing)
final design (optimization)
demonstrate requirements met
(permit submittals) Source: http://www.und.nodak.edu/
Hydrologic Modeling Performance Standards
Flow Control
Non-exempt Receiving Waters - Ecology requirement to match
peaks and duration to pre-developed condition
Combined Sewer or Capacity Constrained Basins- Local
requirements, typically peak-control based
Water Quality
Ecology requirement to treat 91st percentile of the 24-hour runoff
volume OR
Infiltrate 91 percent of the total runoff volume through soil
meeting Ecology treatment criteria
Wetland Protection
Ecology guideline to maintain wetland hydroperiod
3
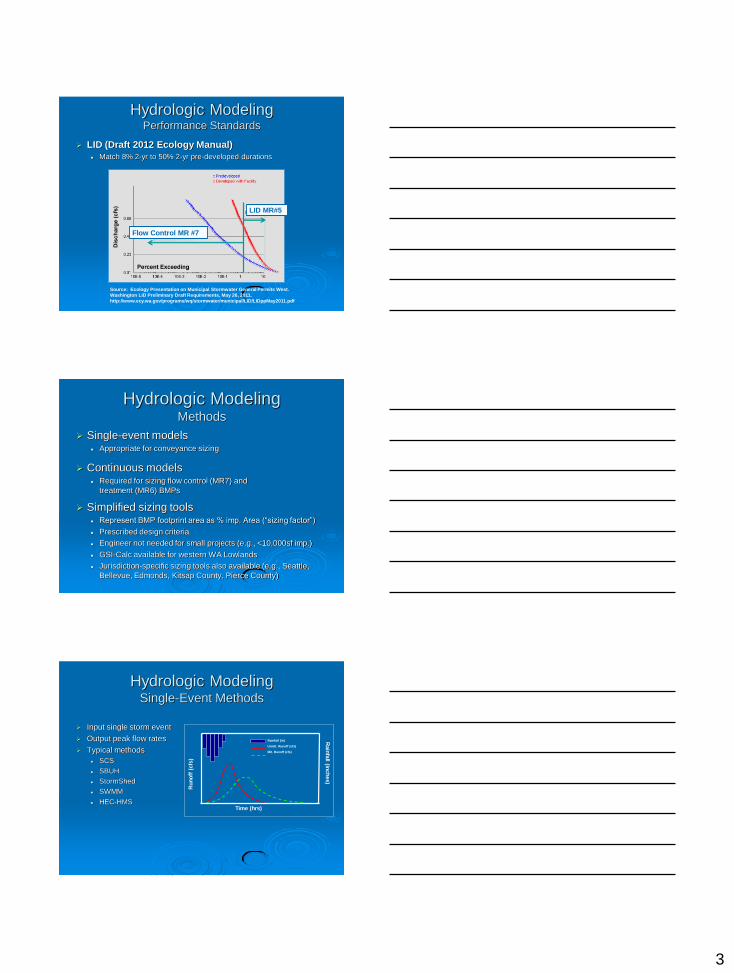
Hydrologic Modeling Performance Standards
LID (Draft 2012 Ecology Manual)
Match 8% 2-yr to 50% 2-yr pre-developed durations
Source: Ecology Presentation on Municipal Stormwater General Permits West.
Washington LID Preliminary Draft Requirements, May 26, 2011.
http://www.ecy.wa.gov/programs/wq/stormwater/municipal/LID/LIDppMay2011.pdf
Flow Control MR #7
LID MR#5
Hydrologic Modeling Methods
Single-event models Appropriate for conveyance sizing
Continuous models Required for sizing flow control (MR7) and
treatment (MR6) BMPs
Simplified sizing tools Represent BMP footprint area as % imp. Area (“sizing factor”)
Prescribed design criteria
Engineer not needed for small projects (e.g., <10,000sf imp.)
GSI-Calc available for western WA Lowlands
Jurisdiction-specific sizing tools also available (e.g., Seattle,
Bellevue, Edmonds, Kitsap County, Pierce County)
Hydrologic Modeling Single-Event Methods
Input single storm event
Output peak flow rates
Typical methods
SCS
SBUH
StormShed
SWMM
HEC-HMS
Ru
no
ff (
cfs
)
Rain
fall (in
ch
es)
Rainfall (in)
Unmit. Runoff (cfs)
Mit. Runoff (cfs)
Time (hrs)
4
Hydrologic Modeling Continuous Models
Input long-term rain and
evaporation
Output continuous runoff,
peak flow, & duration
Typical programs
HSPF
WWHM
MGS Flood
KCRTS
SWMM
SUSTAIN
Time (hrs)
Ru
no
ff (
cfs
)
Rain
fall (in
ch
es)
Rainfall (in)
Unmit. Runoff (cfs)
Mit. Runoff (cfs)
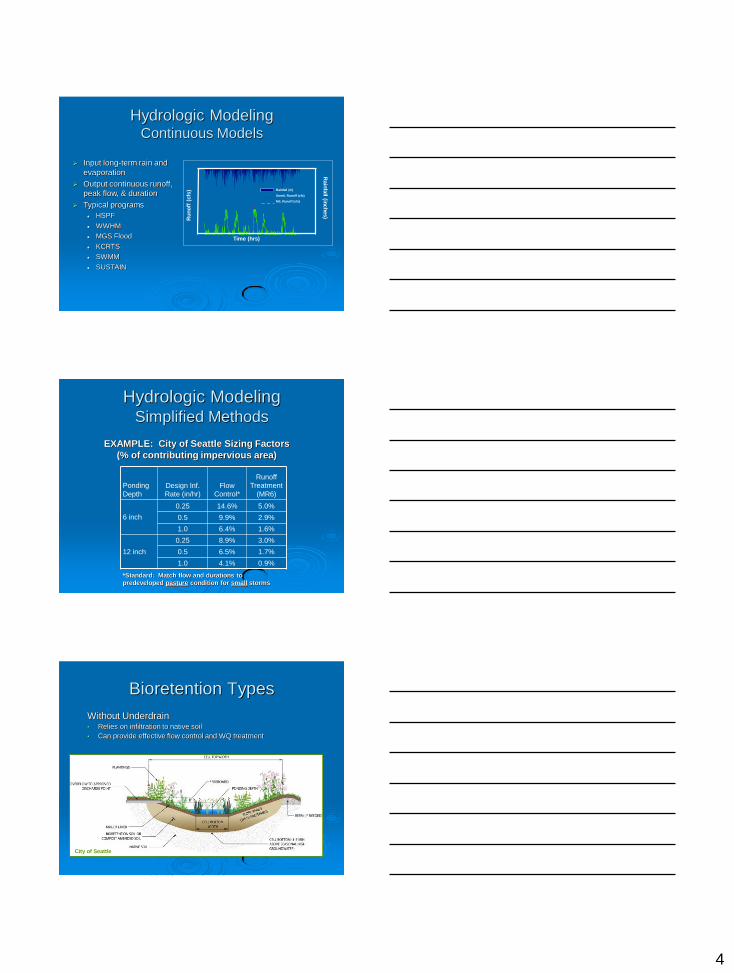
Hydrologic Modeling Simplified Methods
EXAMPLE: City of Seattle Sizing Factors
(% of contributing impervious area)
Ponding
Depth
Design Inf.
Rate (in/hr)
Flow
Control*
Runoff
Treatment
(MR6)
6 inch
0.25 14.6% 5.0%
0.5 9.9% 2.9%
1.0 6.4% 1.6%
12 inch
0.25 8.9% 3.0%
0.5 6.5% 1.7%
1.0 4.1% 0.9%
*Standard: Match flow and durations to
predeveloped pasture condition for small storms
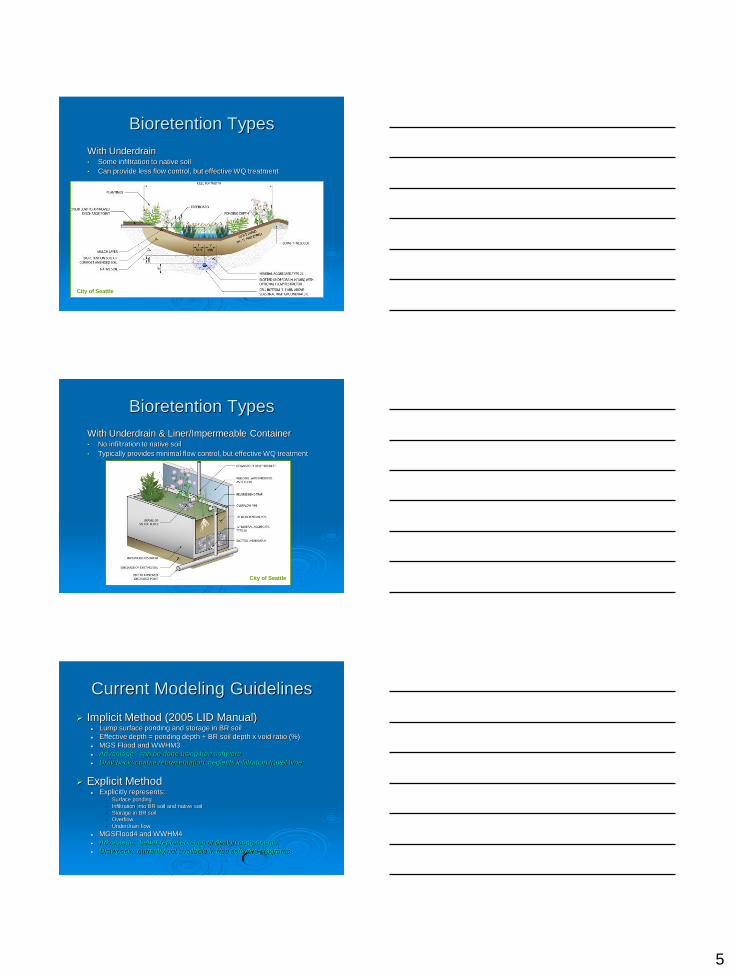
Bioretention Types
Without Underdrain • Relies on infiltration to native soil
• Can provide effective flow control and WQ treatment
City of Seattle
5
Bioretention Types
With Underdrain • Some infiltration to native soil
• Can provide less flow control, but effective WQ treatment
City of Seattle
Bioretention Types
With Underdrain & Liner/Impermeable Container • No infiltration to native soil
• Typically provides minimal flow control, but effective WQ treatment
City of Seattle
Current Modeling Guidelines
Implicit Method (2005 LID Manual) Lump surface ponding and storage in BR soil
Effective depth = ponding depth + BR soil depth x void ratio (%)
MGS Flood and WWHM3
Advantage: can be done using free software
Drawback: coarse representation, neglects infiltration travel time
Explicit Method Explicitly represents:
• Surface ponding
• Infiltration into BR soil and native soil
• Storage in BR soil • Overflow
• Underdrain flow
MGSFlood4 and WWHM4
Advantage: better representation of design components
Drawback: currently not available in free software programs
6
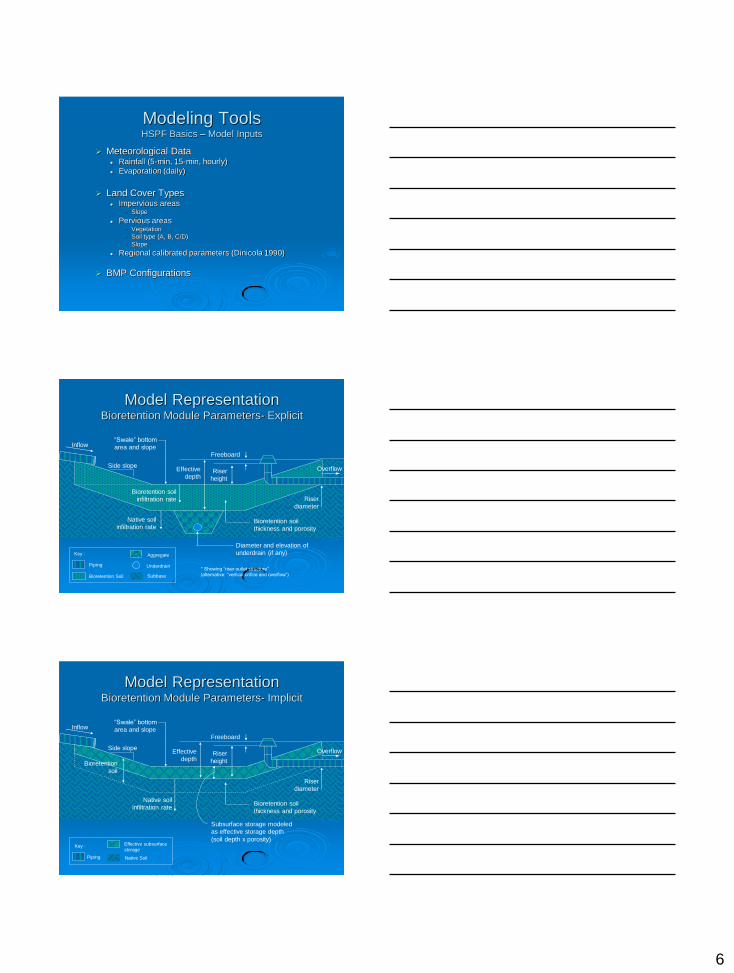
Modeling Tools HSPF Basics – Model Inputs
Meteorological Data Rainfall (5-min, 15-min, hourly)
Evaporation (daily)
Land Cover Types Impervious areas
• Slope
Pervious areas • Vegetation
• Soil type (A, B, C/D)
• Slope
Regional calibrated parameters (Dinicola 1990)
BMP Configurations
Model Representation Bioretention Module Parameters- Explicit
Native soil
infiltration rate Bioretention soil
thickness and porosity
Diameter and elevation of
underdrain (if any)
Piping Underdrain
Subbase
Aggregate Key :
Bioretention Soil
Freeboard
Side slope
“Swale” bottom
area and slope
Bioretention soil
infiltration rate
Riser
height
Riser
diameter
* Showing “riser outlet structure”
(alternative: “vertical orifice and overflow”)
Inflow
Effective
depth
Overflow
Model Representation Bioretention Module Parameters- Implicit
Native soil
infiltration rate Bioretention soil
thickness and porosity
Freeboard
Side slope
“Swale” bottom
area and slope
Riser
height
Riser
diameter
Inflow
Effective
depth
Piping Native Soil
Key : Effective subsurface
storage
Overflow
Subsurface storage modeled
as effective storage depth
(soil depth x porosity)
Bioretention
soil
7
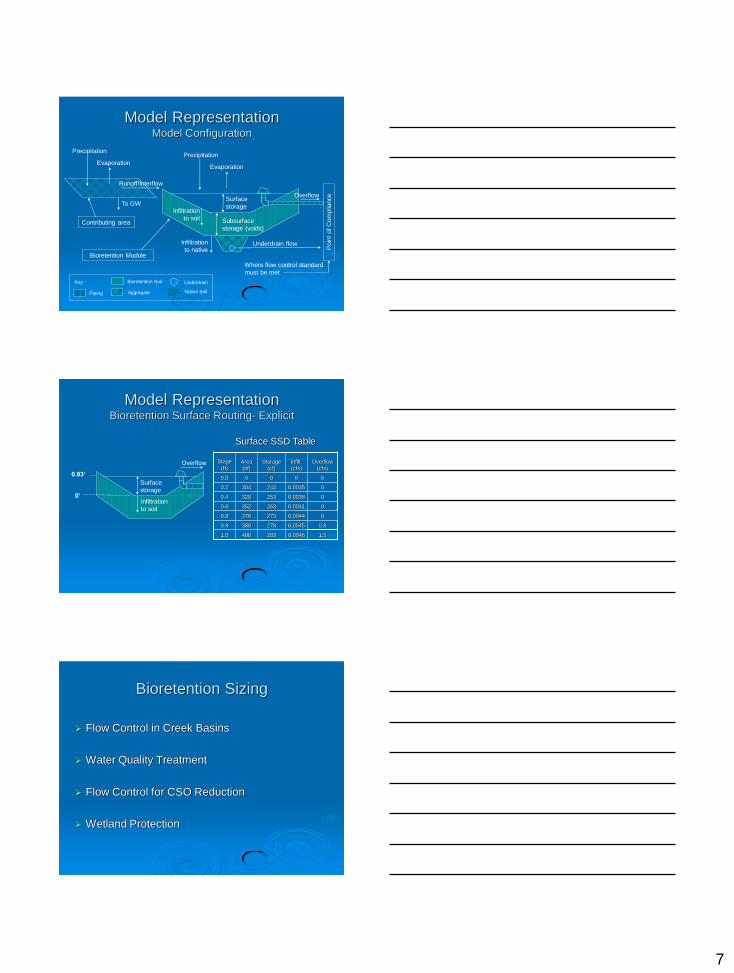
Model Representation Model Configuration
Contributing area
Precipitation
Evaporation
Runoff/Interflow
Infiltration
to native Bioretention Module
Poin
t of C
om
plia
nce
Surface
storage
Precipitation
Evaporation
Underdrain flow
Piping
Underdrain
Native Soil Aggregate
Key : Bioretention Soil
Subsurface
storage (voids)
Overflow
Infiltration
to soil
Where flow control standard
must be met
To GW
Model Representation Bioretention Surface Routing- Explicit
Stage
(ft) Area
(sf)
Storage
(cf)
Infilt.
(cfs)
Overflow
(cfs)
0.0 0 0 0 0
0.2 304 243 0.0035 0
0.4 328 253 0.0038 0
0.6 352 263 0.0041 0
0.8 376 273 0.0044 0
0.9 388 278 0.0045 0.8
1.0 400 283 0.0046 1.5
Surface SSD Table
0.83’
Surface
storage
Infiltration
to soil
Overflow
0’
Bioretention Sizing
Flow Control in Creek Basins
Water Quality Treatment
Flow Control for CSO Reduction
Wetland Protection
8
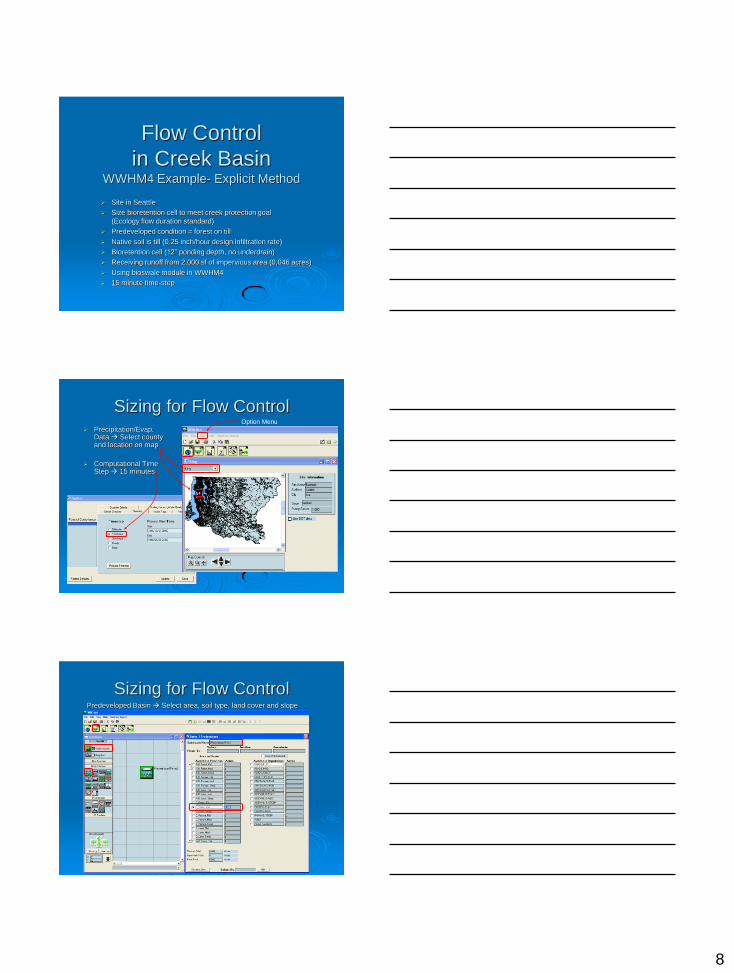
Flow Control
in Creek Basin WWHM4 Example- Explicit Method
Site in Seattle
Size bioretention cell to meet creek protection goal
(Ecology flow duration standard)
Predeveloped condition = forest on till
Native soil is till (0.25 inch/hour design infiltration rate)
Bioretention cell (12” ponding depth, no underdrain)
Receiving runoff from 2,000 sf of impervious area (0.046 acres)
Using bioswale module in WWHM4
15 minute time-step
Precipitation/Evap. Data Select county and location on map
Computational Time Step 15 minutes
Option Menu
Sizing for Flow Control
Predeveloped Basin Select area, soil type, land cover and slope
Sizing for Flow Control
9
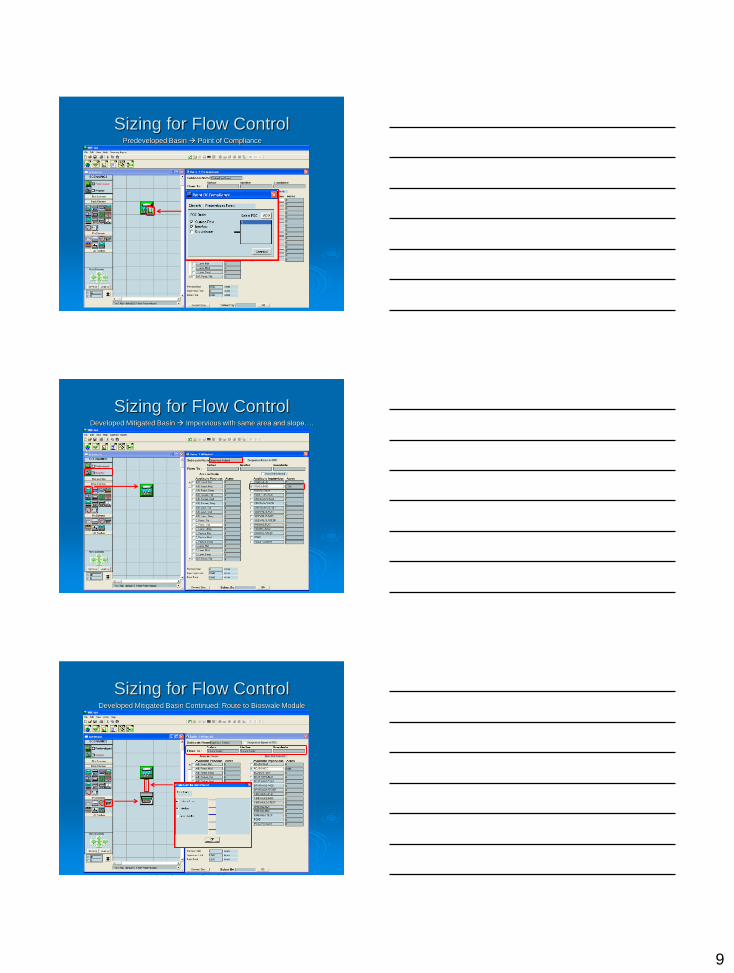
Predeveloped Basin Point of Compliance
Sizing for Flow Control
Sizing for Flow Control Developed Mitigated Basin Impervious with same area and slope….
Sizing for Flow Control Developed Mitigated Basin Continued: Route to Bioswale Module
10
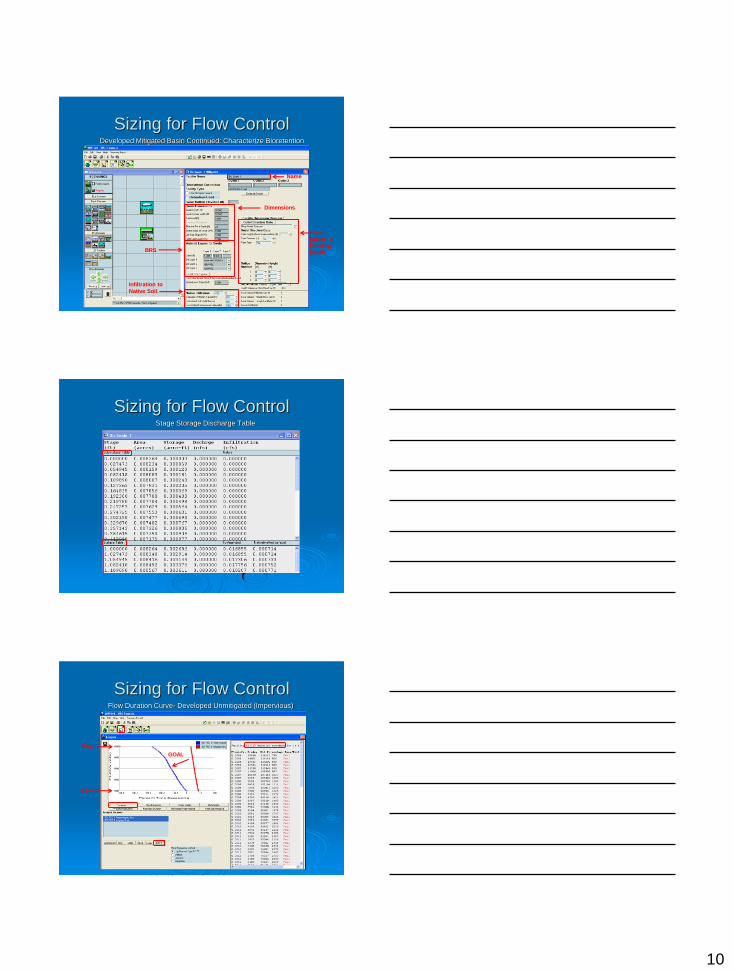
Sizing for Flow Control Developed Mitigated Basin Continued: Characterize Bioretention
Dimensions
BRS
Infiltration to
Native Soil
Outlet &
Ponding Depth
Name
Stage Storage Discharge Table
Sizing for Flow Control
Flow Duration Curve- Developed Unmitigated (Impervious)
Sizing for Flow Control
50-yr
½ 2-yr
GOAL
11
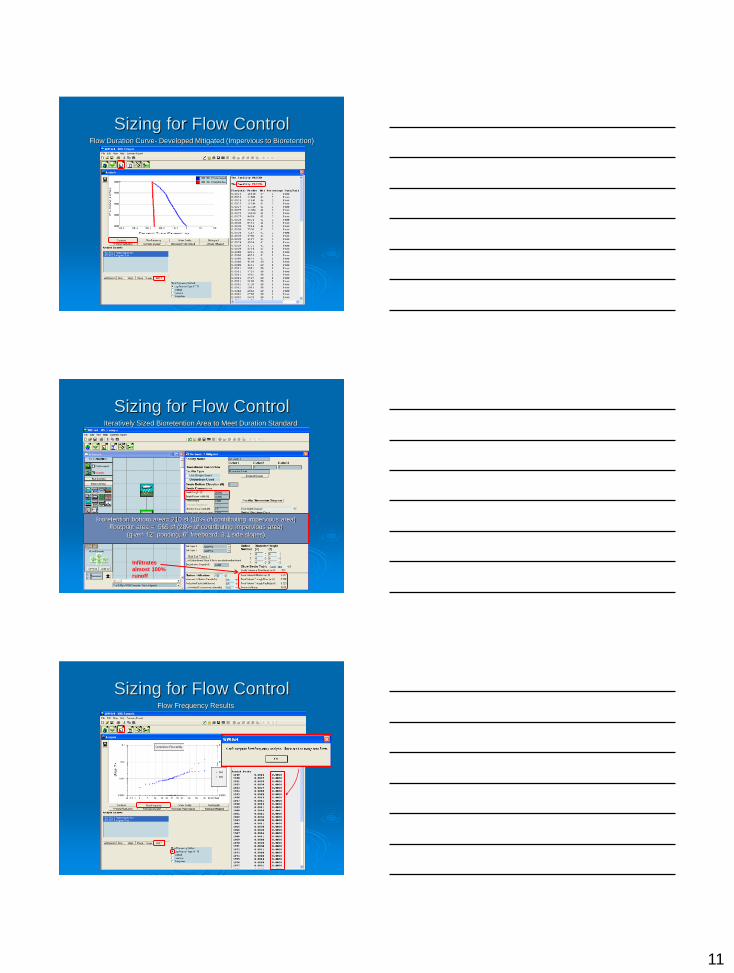
Flow Duration Curve- Developed Mitigated (Impervious to Bioretention)
Sizing for Flow Control
Iteratively Sized Bioretention Area to Meet Duration Standard
Bioretention bottom area= 210 sf (10% of contributing impervious area)
Footprint area = 565 sf (28% of contributing impervious area)
(given 12” ponding, 6” freeboard, 3:1 side slopes)
Sizing for Flow Control
Infiltrates
almost 100% runoff
Flow Frequency Results
Sizing for Flow Control
12
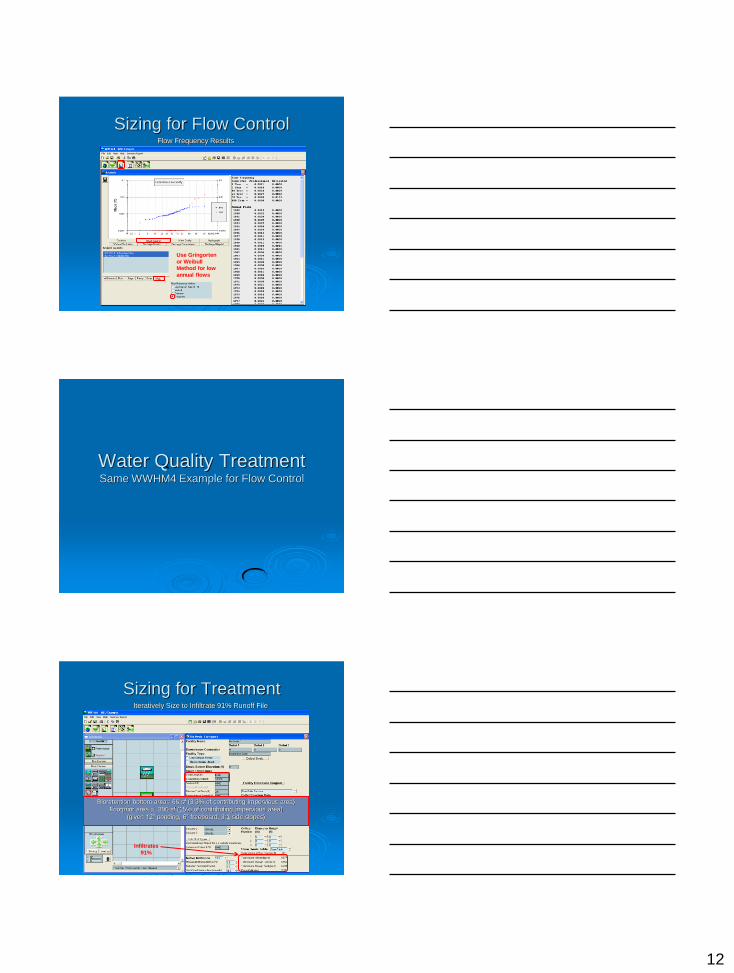
Flow Frequency Results
Sizing for Flow Control
Use Gringorten
or Weibull Method for low
annual flows
Water Quality Treatment Same WWHM4 Example for Flow Control
Iteratively Size to Infiltrate 91% Runoff File
Bioretention bottom area= 66 sf (3.3% of contributing impervious area)
Footprint area = 300 sf (15% of contributing impervious area)
(given 12” ponding, 6” freeboard, 3:1 side slopes)
Sizing for Treatment
Infiltrates
91%
13
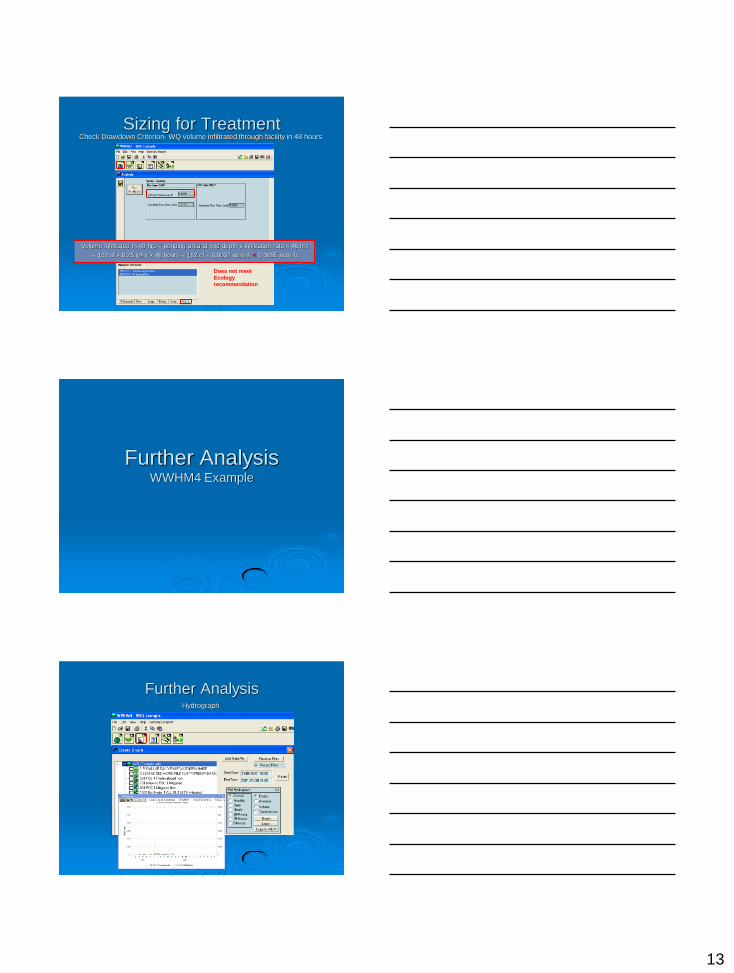
Sizing for Treatment Check Drawdown Criterion- WQ volume infiltrated through facility in 48 hours
91st percentile, 24-hour runoff volume
Volume Infiltrated in 48 hrs = ponding area at mid-depth x infiltration rate x 48 hrs
= 162 sf x 0.25 in/hr x 48 hours = 162 cf = 0.0037 acre-ft < 0.0095 acre-ft
Does not meet
Ecology recommendation
Further Analysis WWHM4 Example
Hydrograph
Further Analysis

14
Report
Further Analysis
Time Series Export
Further Analysis
Combined Sewer
Overflow Reduction InfoWorks/WWHM Example
15
CSO Reduction Lakewood RainCatchers Project
SPU pilot project to
reduce CSOs
75-acre residential
neighborhood
300 homes
BMPs
Bioretention
(Rain gardens)
Cisterns
CSO Reduction Lakewood RainCatchers Project (Cont)
Partially combined
system
Roofs to combined
Streets to separated
Combined system
modeled in
InfoWorks CS
CSO Reduction Lakewood RainCatchers Project (Cont)
Cistern areas
Rain garden
areas
16
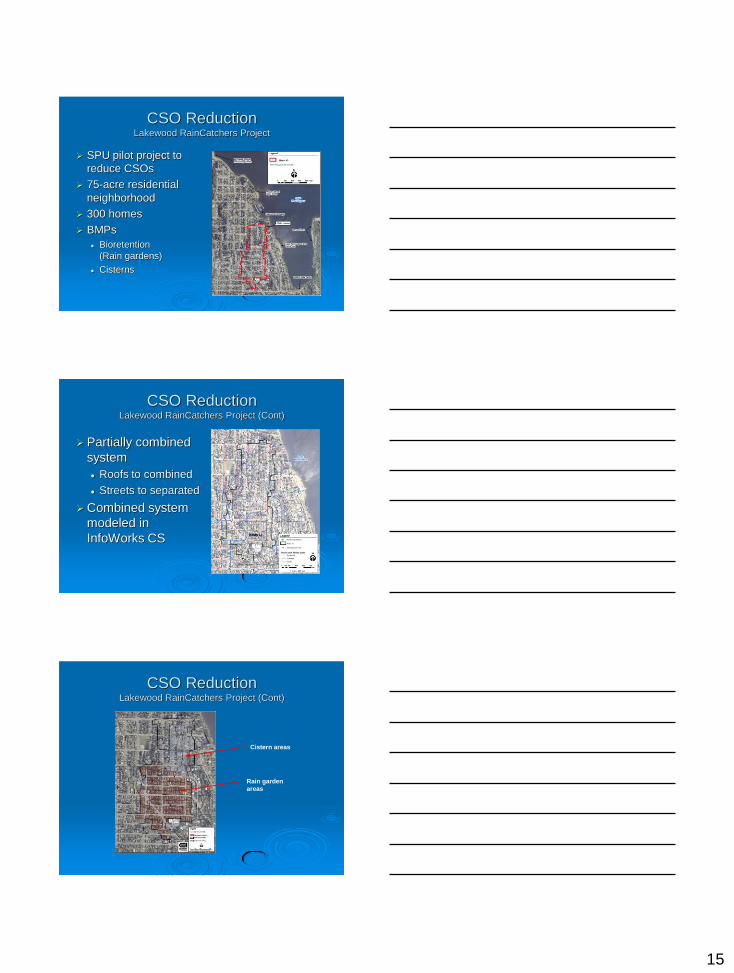
CSO Reduction Lakewood RainCatchers Project (Cont)
Rain gardens modeled as pervious land
surface in InfoWorks CS
Cisterns modeled in WWHM3
Runoff timeseries for individual homes were
lumped by subbasin and imported into
InfoWorks CS
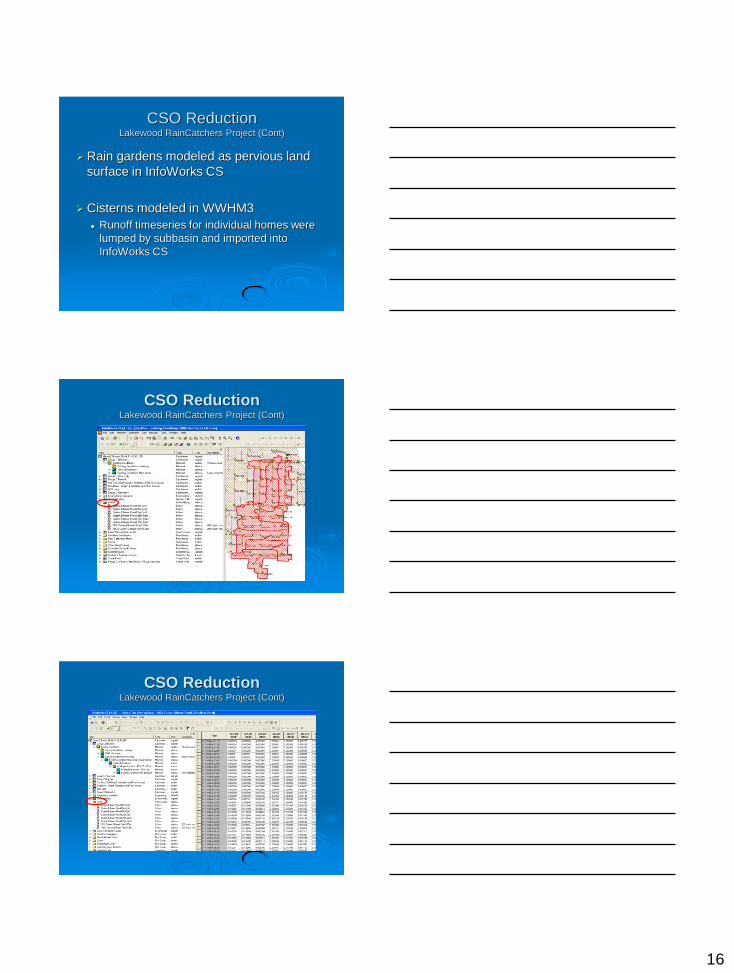
CSO Reduction Lakewood RainCatchers Project (Cont)
CSO Reduction Lakewood RainCatchers Project (Cont)

17
CSO Reduction Lakewood RainCatchers Project (Cont)
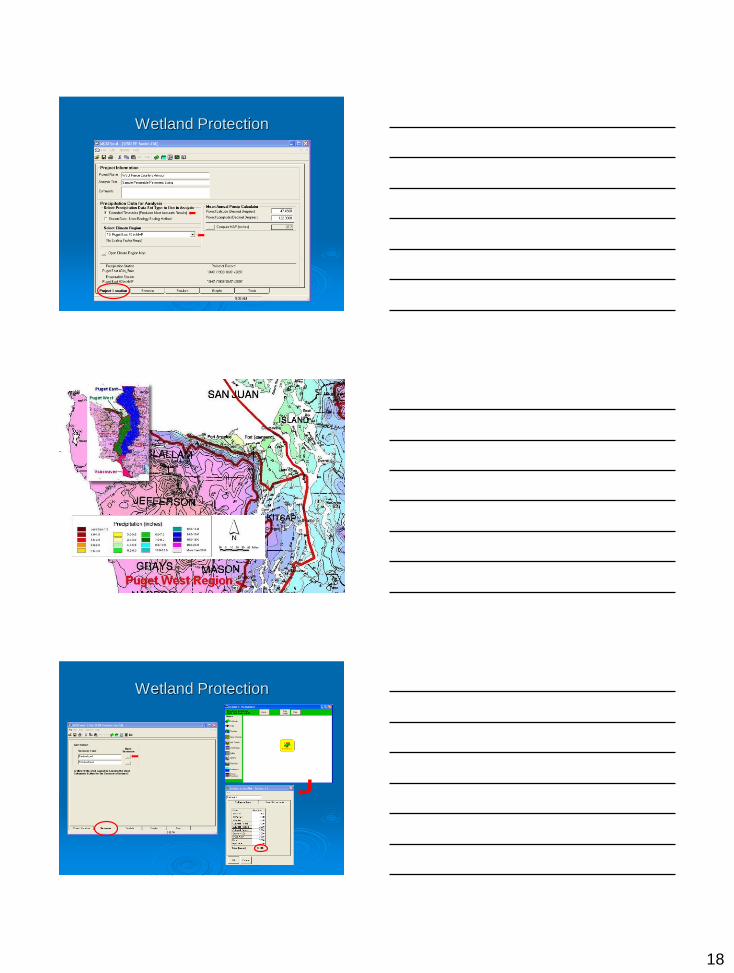
Wetland Protection MGSFlood4 Example
Model Scenario
Puget East 40 extended precip timeseries
15-min time step
5,000 sq ft till forest converted to impervious area, draining to rain garden: 25-ft-long x 20-ft-wide
6-inch ponding depth
18-inch BR soil depth, 20% porosity
Sat. hyd. cond. BR soil = 4 in/hr
Sat. hyd. cond. native soil = 2 in/hr
No underdrain
Downstream wetland 1-ft deep, 50-ft long x 100-ft wide
18
Wetland Protection
Wetland Protection
19
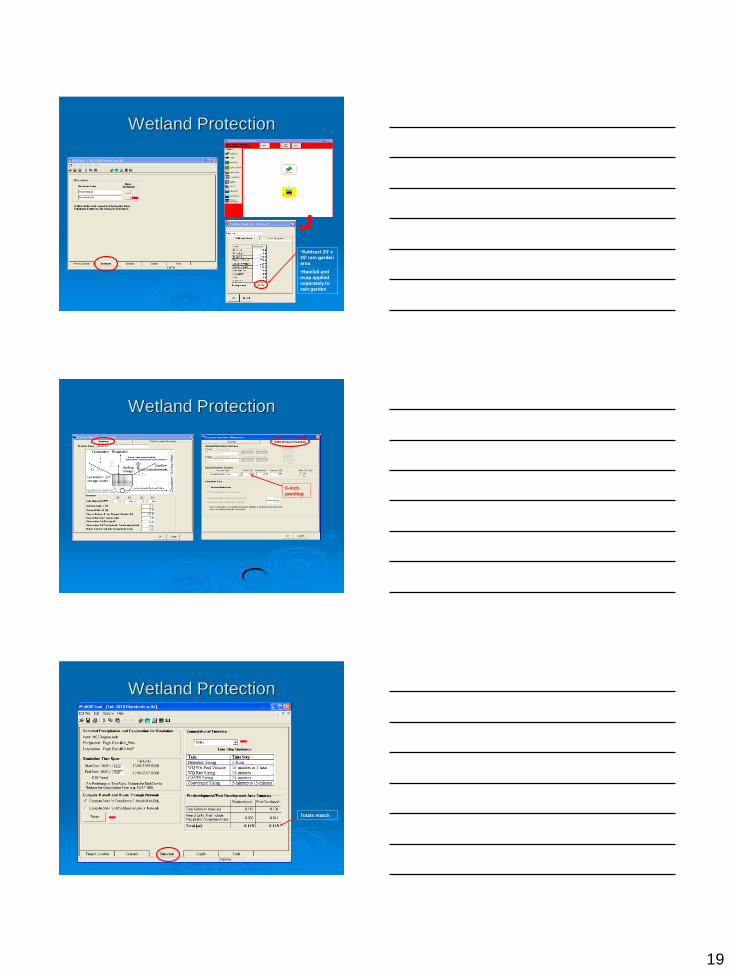
Wetland Protection
•Subtract 20’ x
25’ rain garden
area
•Rainfall and
evap applied
separately to
rain garden
Wetland Protection
6-inch
ponding
Wetland Protection
Totals match
20
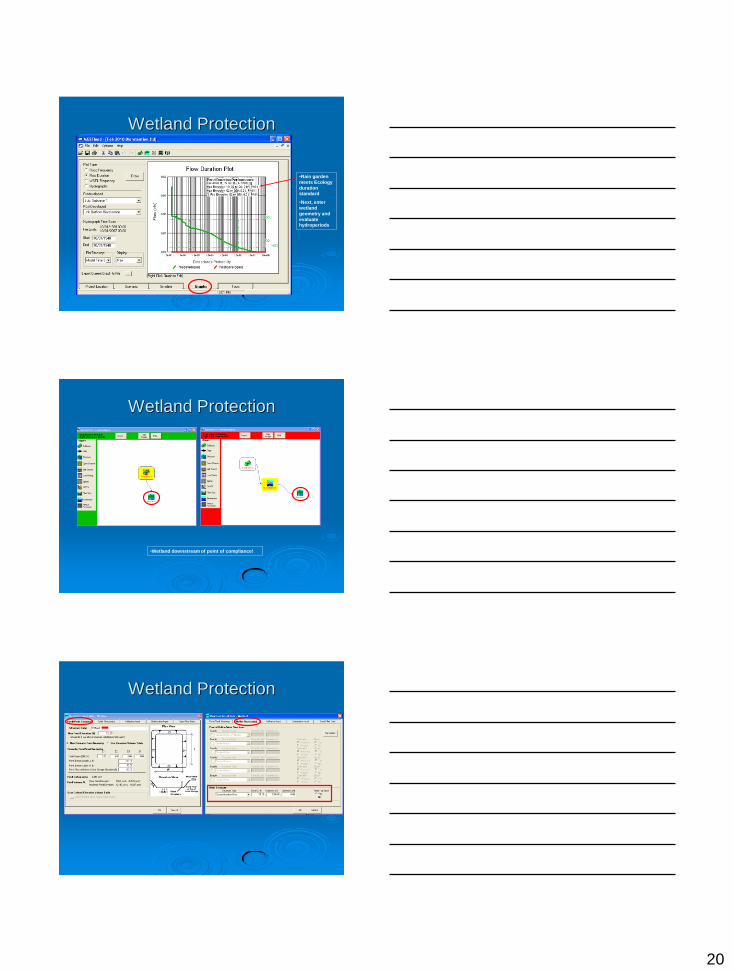
Wetland Protection
•Rain garden
meets Ecology
duration standard
•Next, enter
wetland
geometry and
evaluate hydroperiods
Wetland Protection
•Wetland downstream of point of compliance!
Wetland Protection
21
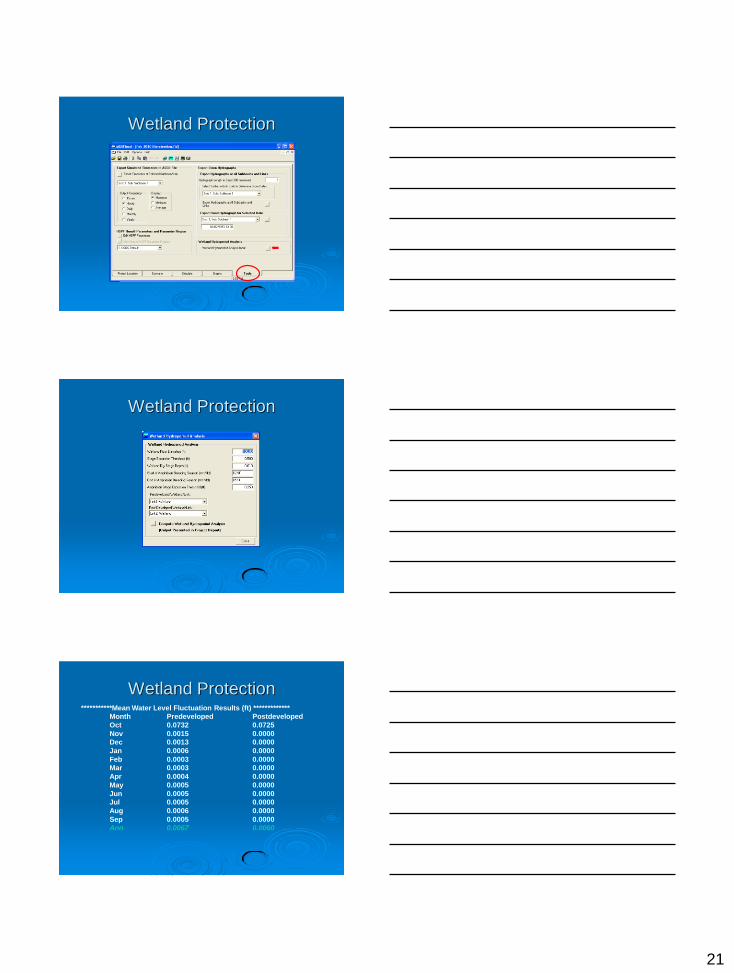
Wetland Protection
Wetland Protection
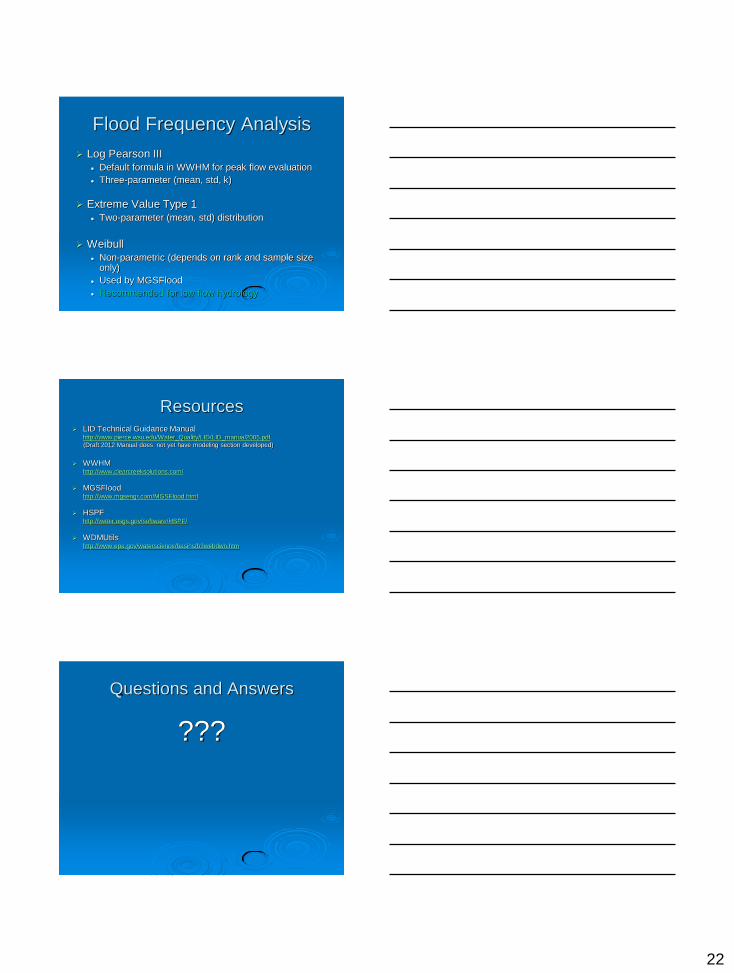
Wetland Protection ***********Mean Water Level Fluctuation Results (ft) *************
Month Predeveloped Postdeveloped
Oct 0.0732 0.0725
Nov 0.0015 0.0000
Dec 0.0013 0.0000
Jan 0.0006 0.0000
Feb 0.0003 0.0000
Mar 0.0003 0.0000
Apr 0.0004 0.0000
May 0.0005 0.0000
Jun 0.0005 0.0000
Jul 0.0005 0.0000
Aug 0.0006 0.0000
Sep 0.0005 0.0000
Ann 0.0067 0.0060
22
Flood Frequency Analysis
Log Pearson III Default formula in WWHM for peak flow evaluation
Three-parameter (mean, std, k)
Extreme Value Type 1 Two-parameter (mean, std) distribution
Weibull Non-parametric (depends on rank and sample size
only)
Used by MGSFlood
Recommended for low flow hydrology
Resources LID Technical Guidance Manual http://www.pierce.wsu.edu/Water_Quality/LID/LID_manual2005.pdf
(Draft 2012 Manual does not yet have modeling section developed)
WWHM http://www.clearcreeksolutions.com/
MGSFlood http://www.mgsengr.com/MGSFlood.html
HSPF http://water.usgs.gov/software/HSPF/
WDMUtils http://www.epa.gov/waterscience/basins/b3webdwn.htm
Questions and Answers
???

23
Contact Information
Alice Lancaster, PE [email protected]
Robin Kirschbaum, PE, LEED [email protected]