Embed Size (px)
Citation preview

Bioremediation of Hydrocarbons – Has Your Design Considered Potential
Residual Contaminants Relating to Your Amendments?
Wenhui Xiong, Ph.D., P.Eng.
David Alberti, M.Sc., P.Geol., MBA
October 12, 2016
Outline
1 Introduction
2 Study Site Remediation
3Nitrate Source Identification
4Conclusions
1 Introduction
• Landfarming is a common method used to reduce
concentrations of petroleum hydrocarbons (PHC) in
excavated soils through the use of biodegradation
• Heaping contaminated soils into stockpiles
• Stimulating aerobic biodegradation through aeration and
addition of nutrients and moisture
• Landfarming design elements
• Land requirements
• Aeration equipment
• Water management
• pH adjustment (if necessary)
• Supply of nutrients and moisture
• Site security
• Air emission controls
1

1 Introduction
• Microorganisms require inorganic nutrients such
as nitrogen and phosphorus to support cell
growth and sustain biodegradation processes
• Symbolic equation for nutrient uptake
•
• Redfield et al. (1958) have defined an organism
stoichiometry of C106N16P1H263O110
• Redfield (1958) C:N:P ratio: 106:16:1
• EPA (2004) ratio: 100:10:1
• Cleveland and Liptzin (2007) modified the Redfield ratio to
60:7:1
aHPO42- + bHCO3
- +cNO3- + dH2O + eH+=CbNcPaHqOr
Cleveland, C. C. and Liptzin, D. C:N:P stoichiometry in soil: is there a ‘‘Redfield ratio’’ for the
microbial biomass? Biogeochemistry, 85, 235-252. EPA. 2004. How to Evaluate Alternative Cleanup
Technologies for Underground Storage Tank Sites
Redfield, A. 1958. The Biological Control of Chemical Factors in the Environment. American Science, 46, 205-221.
1 Introduction
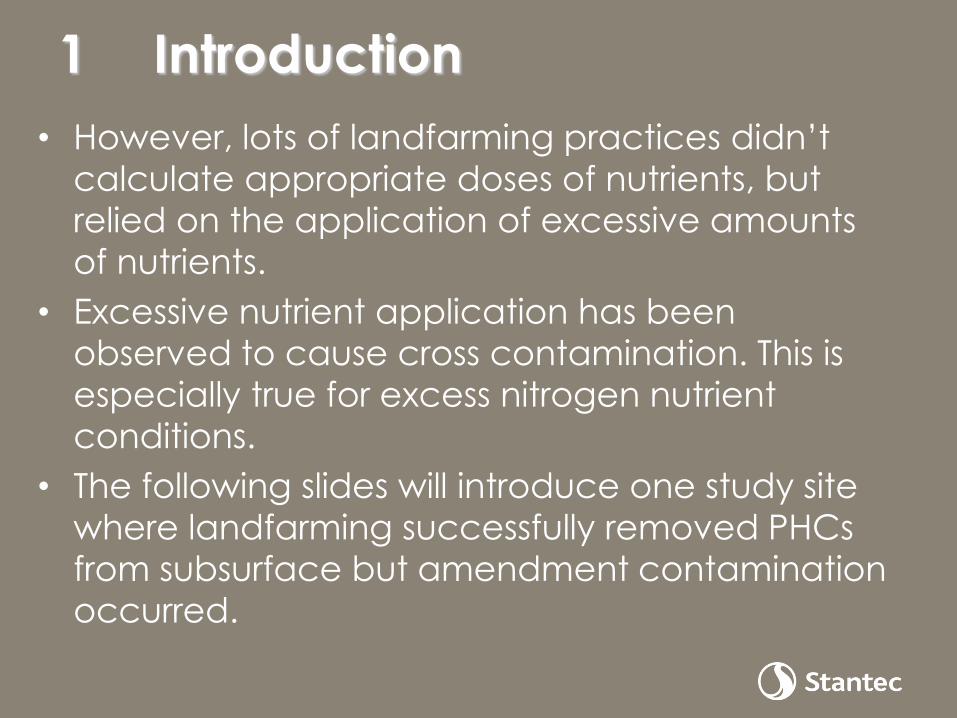
• However, lots of landfarming practices didn’t
calculate appropriate doses of nutrients, but
relied on the application of excessive amounts
of nutrients.
• Excessive nutrient application has been
observed to cause cross contamination. This is
especially true for excess nitrogen nutrient
conditions.
1 Introduction
• However, lots of landfarming practices didn’t
calculate appropriate doses of nutrients, but
relied on the application of excessive amounts
of nutrients.
• Excessive nutrient application has been
observed to cause cross contamination. This is
especially true for excess nitrogen nutrient
conditions.
• The following slides will introduce one study site
where landfarming successfully removed PHCs
from subsurface but amendment contamination
occurred.
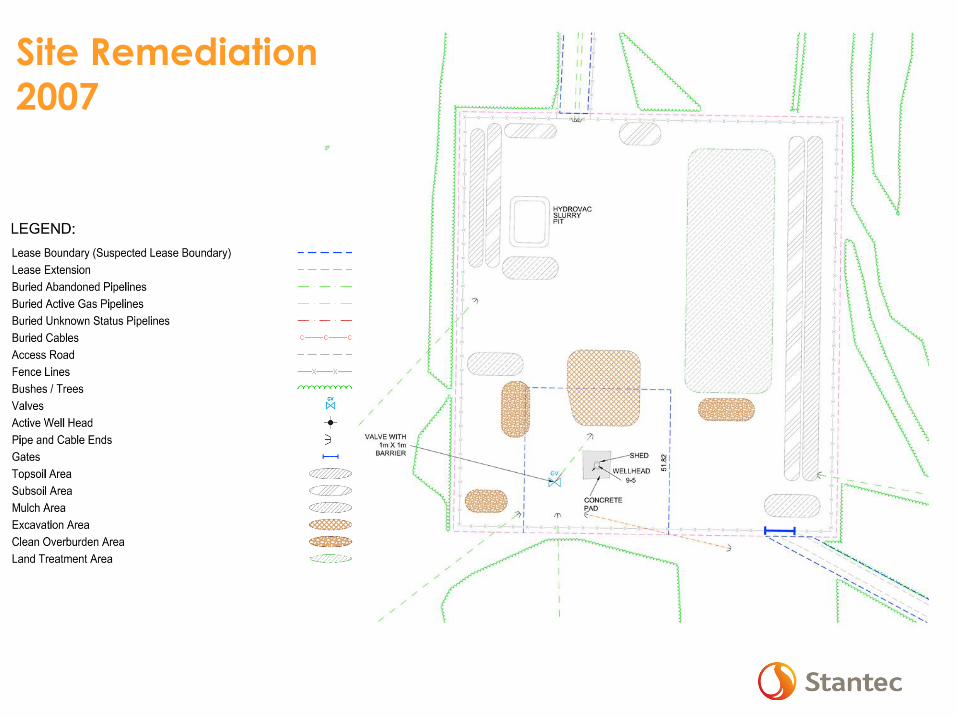
Site Remediation in
2007
2 Study Site Remediation
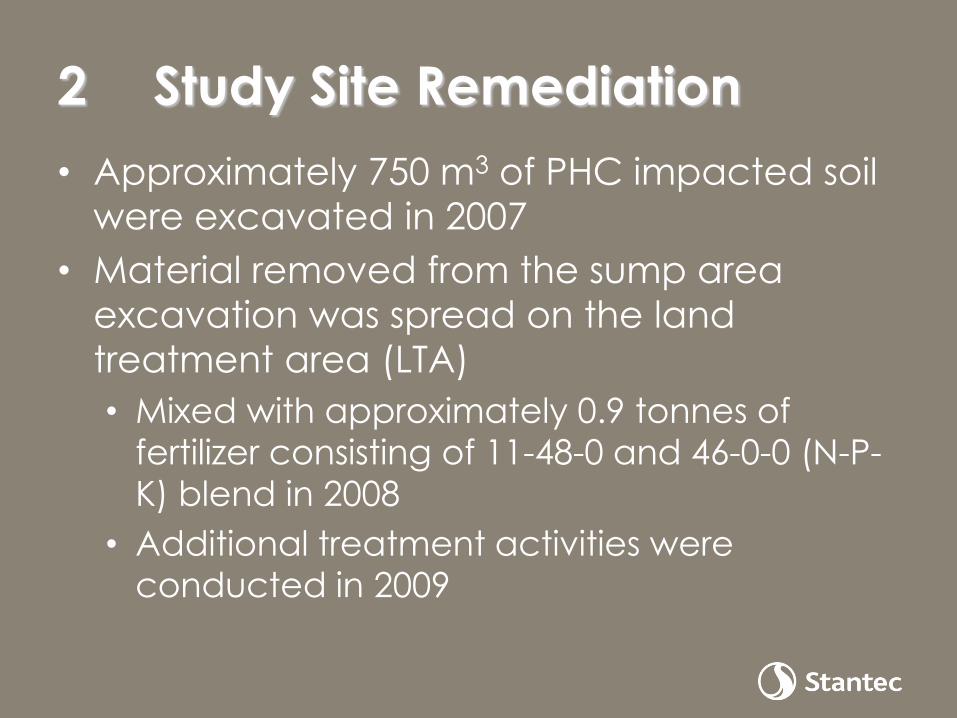
• Approximately 750 m3 of PHC impacted soil
were excavated in 2007
• Material removed from the sump area
excavation was spread on the land
treatment area (LTA)
• Mixed with approximately 0.9 tonnes of
fertilizer consisting of 11-48-0 and 46-0-0 (N-P-
K) blend in 2008
• Additional treatment activities were
conducted in 2009

2 Study Site Remediation
• Soil samples were collected from the stockpile soil and the LTA base
• One hydrocarbon exceedance was reported from the LTA base, resulting in additional excavation
• Additional confirmatory soil samples were reported at levels below the applicable guidelines
• A composite soil sample from the treated soil reported nitrate + nitrite concentration of13.5 mg/kg
• Concentrations of dissolved-phase PHCs in groundwater were lower than the applicable guidelines• Nitrate concentration in groundwater collected from
09-MW06 and MW15-01 exceeded the applicable guideline
• Site closure cannot be achieved due to the nitrate exceedance

Site Plan in 2016
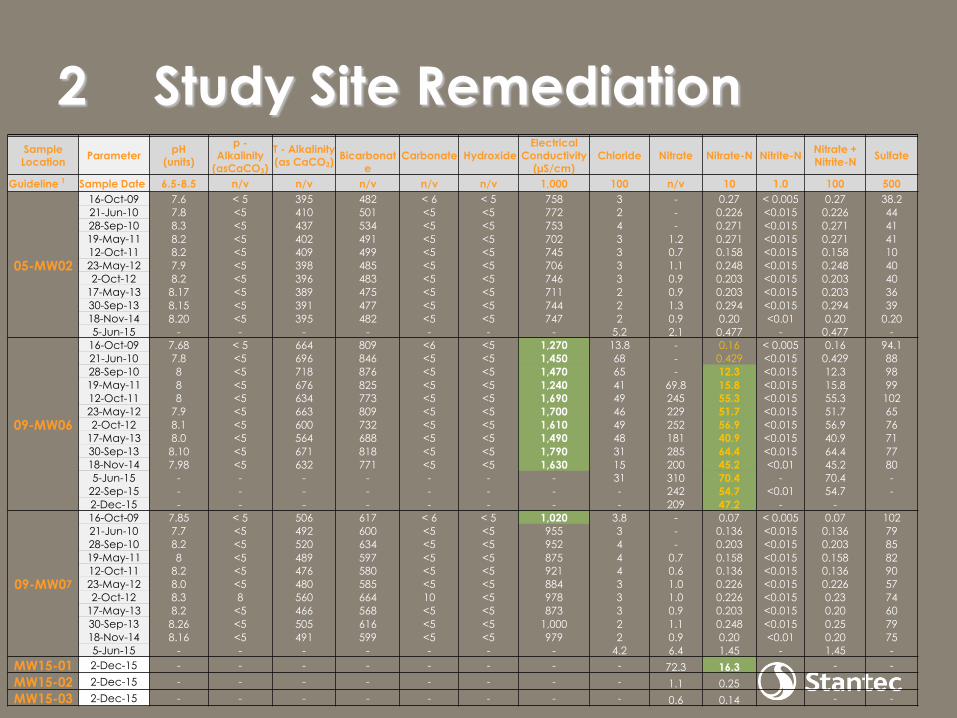
2 Study Site RemediationSample Location
ParameterpH
(units)
p -Alkalinity
(asCaCO3)
T - Alkalinity (as CaCO3)
Bicarbonate
Carbonate HydroxideElectrical
Conductivity (µS/cm)
Chloride Nitrate Nitrate-N Nitrite-NNitrate + Nitrite-N
Sulfate
Guideline 1 Sample Date 6.5-8.5 n/v n/v n/v n/v n/v 1,000 100 n/v 10 1.0 100 500
05-MW02
16-Oct-09 7.6 < 5 395 482 < 6 < 5 758 3 - 0.27 < 0.005 0.27 38.2
21-Jun-10 7.8 <5 410 501 <5 <5 772 2 - 0.226 <0.015 0.226 44
28-Sep-10 8.3 <5 437 534 <5 <5 753 4 - 0.271 <0.015 0.271 41
19-May-11 8.2 <5 402 491 <5 <5 702 3 1.2 0.271 <0.015 0.271 41
12-Oct-11 8.2 <5 409 499 <5 <5 745 3 0.7 0.158 <0.015 0.158 10
23-May-12 7.9 <5 398 485 <5 <5 706 3 1.1 0.248 <0.015 0.248 40
2-Oct-12 8.2 <5 396 483 <5 <5 746 3 0.9 0.203 <0.015 0.203 40
17-May-13 8.17 <5 389 475 <5 <5 711 2 0.9 0.203 <0.015 0.203 36
30-Sep-13 8.15 <5 391 477 <5 <5 744 2 1.3 0.294 <0.015 0.294 39
18-Nov-14 8.20 <5 395 482 <5 <5 747 2 0.9 0.20 <0.01 0.20 0.20
5-Jun-15 - - - - - - - 5.2 2.1 0.477 - 0.477 -
09-MW06
16-Oct-09 7.68 < 5 664 809 <6 <5 1,270 13.8 - 0.16 < 0.005 0.16 94.1
21-Jun-10 7.8 <5 696 846 <5 <5 1,450 68 - 0.429 <0.015 0.429 88
28-Sep-10 8 <5 718 876 <5 <5 1,470 65 - 12.3 <0.015 12.3 98
19-May-11 8 <5 676 825 <5 <5 1,240 41 69.8 15.8 <0.015 15.8 99
12-Oct-11 8 <5 634 773 <5 <5 1,690 49 245 55.3 <0.015 55.3 102
23-May-12 7.9 <5 663 809 <5 <5 1,700 46 229 51.7 <0.015 51.7 65
2-Oct-12 8.1 <5 600 732 <5 <5 1,610 49 252 56.9 <0.015 56.9 76
17-May-13 8.0 <5 564 688 <5 <5 1,490 48 181 40.9 <0.015 40.9 71
30-Sep-13 8.10 <5 671 818 <5 <5 1,790 31 285 64.4 <0.015 64.4 77
18-Nov-14 7.98 <5 632 771 <5 <5 1,630 15 200 45.2 <0.01 45.2 80
5-Jun-15 - - - - - - - 31 310 70.4 - 70.4 -
22-Sep-15 - - - - - - - - 242 54.7 <0.01 54.7 -
2-Dec-15 - - - - - - - - 209 47.2 - -
09-MW07
16-Oct-09 7.85 < 5 506 617 < 6 < 5 1,020 3.8 - 0.07 < 0.005 0.07 102
21-Jun-10 7.7 <5 492 600 <5 <5 955 3 - 0.136 <0.015 0.136 79
28-Sep-10 8.2 <5 520 634 <5 <5 952 4 - 0.203 <0.015 0.203 85
19-May-11 8 <5 489 597 <5 <5 875 4 0.7 0.158 <0.015 0.158 82
12-Oct-11 8.2 <5 476 580 <5 <5 921 4 0.6 0.136 <0.015 0.136 90
23-May-12 8.0 <5 480 585 <5 <5 884 3 1.0 0.226 <0.015 0.226 57
2-Oct-12 8.3 8 560 664 10 <5 978 3 1.0 0.226 <0.015 0.23 74
17-May-13 8.2 <5 466 568 <5 <5 873 3 0.9 0.203 <0.015 0.20 60
30-Sep-13 8.26 <5 505 616 <5 <5 1,000 2 1.1 0.248 <0.015 0.25 79
18-Nov-14 8.16 <5 491 599 <5 <5 979 2 0.9 0.20 <0.01 0.20 75
5-Jun-15 - - - - - - - 4.2 6.4 1.45 - 1.45 -
MW15-01 2-Dec-15 - - - - - - - - 72.3 16.3 - - -
MW15-02 2-Dec-15 - - - - - - - - 1.1 0.25 - - -
MW15-03 2-Dec-15 - - - - - - - - 0.6 0.14 - - -

3 Nitrate Source Identification
• Nitrate sources in groundwater
• Natural nitrate sources
• Geogenic sources (including desert-derived nitrate, lake evaporate deposits)
• Soil organic nitrogen (including proteinaceous materials and heterocyclics)
• Anthropogenic nitrate sources
• Septic systems
• Sanitary sewage effluent releases
• Domestic animal wastes
• Usage of nitrogen fertilizers including nitrate fertilizer, ammonium fertilizer, and urea
3 Nitrate Source Identification
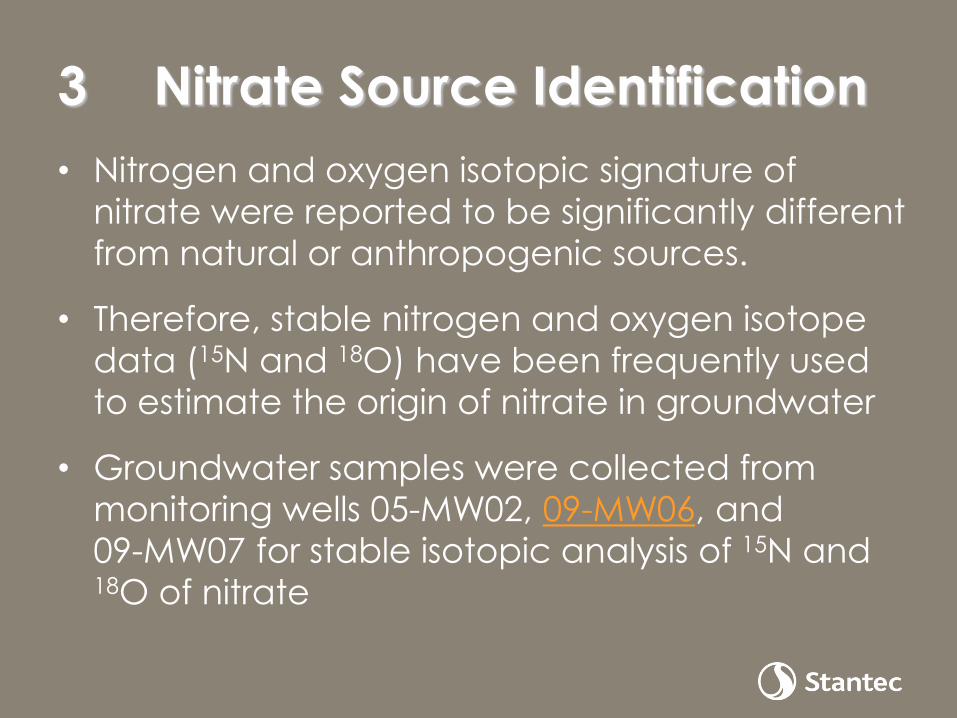
• Nitrogen and oxygen isotopic signature of
nitrate were reported to be significantly different
from natural or anthropogenic sources.
• Therefore, stable nitrogen and oxygen isotope
data (15N and 18O) have been frequently used
to estimate the origin of nitrate in groundwater
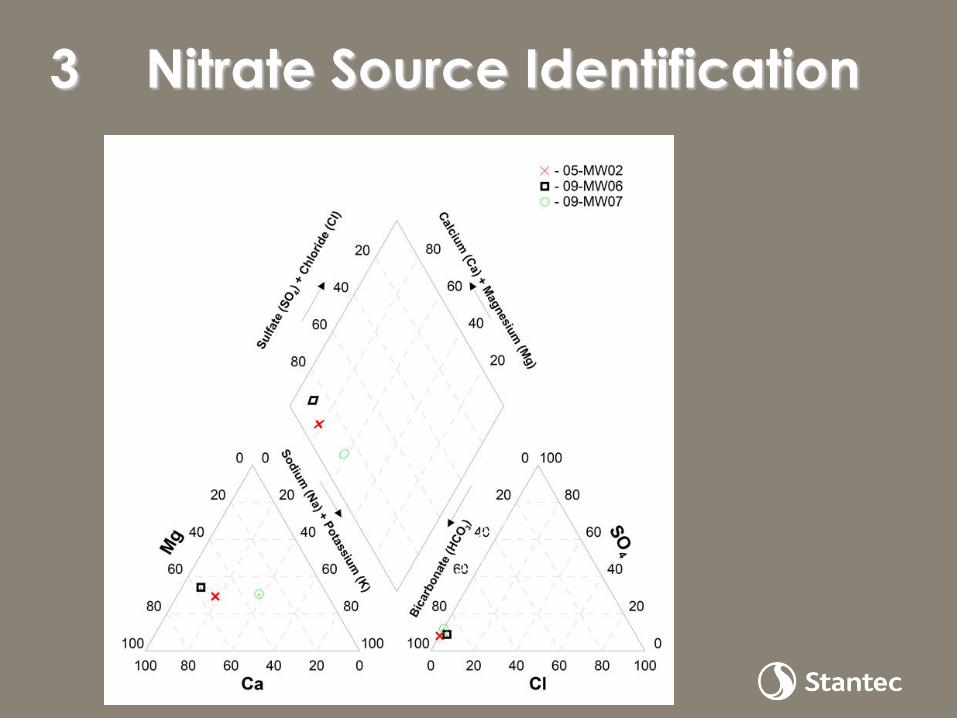
• Groundwater samples were collected from
monitoring wells 05-MW02, 09-MW06, and
09-MW07 for stable isotopic analysis of 15N and 18O of nitrate
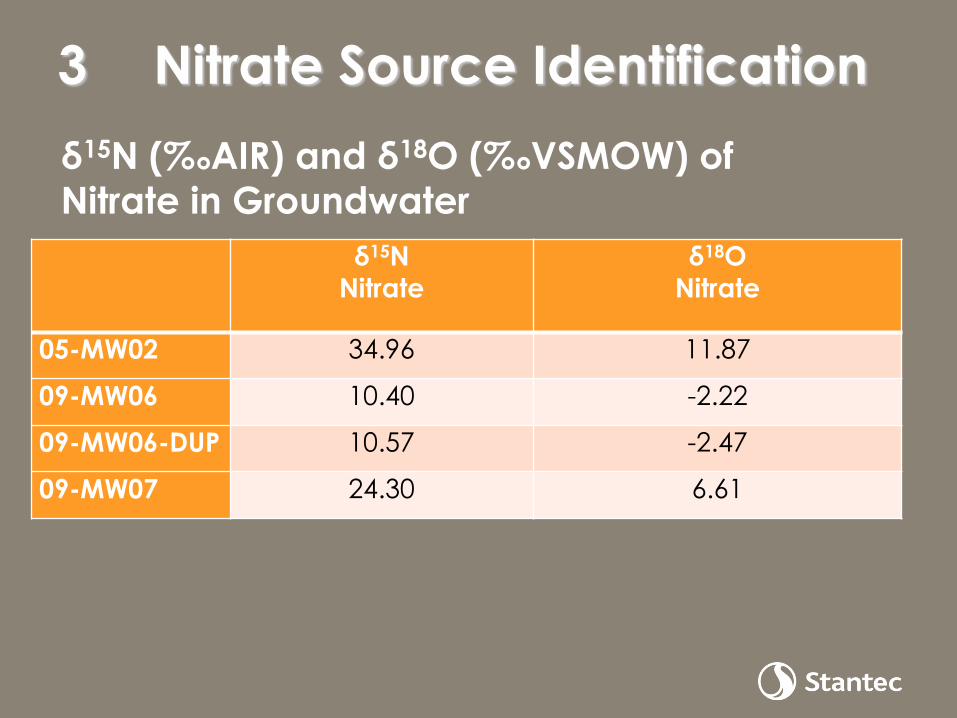
δ15N (‰AIR) and δ18O (‰VSMOW) of
Nitrate in Groundwater
3 Nitrate Source Identification
δ15N
Nitrate
δ18O
Nitrate
05-MW02 34.96 11.87
09-MW06 10.40 -2.22
09-MW06-DUP 10.57 -2.47
09-MW07 24.30 6.61

• 18O=0.5815N-7.97
• A slope of
approximately 1 part
δ18O to 1.7 parts δ15N
(1/0.58)
• Occurrence of
denitrification in
groundwater
3 Nitrate Source Identification
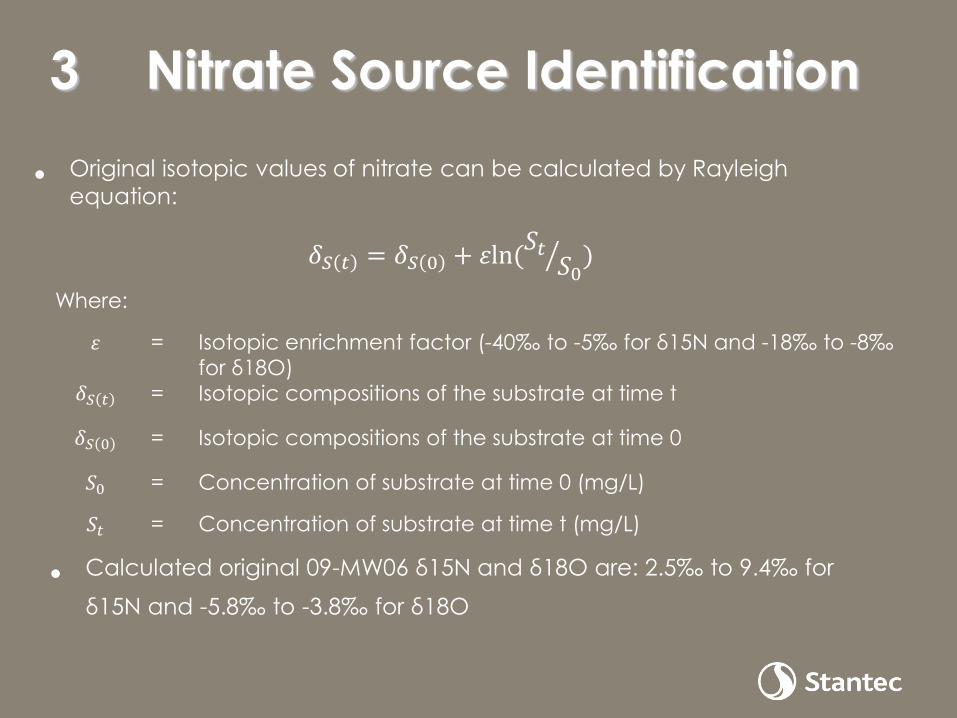
• Original isotopic values of nitrate can be calculated by Rayleigh
equation:
𝛿𝑆 𝑡 = 𝛿𝑆 0 + 휀ln( 𝑆𝑡
𝑆0)
3 Nitrate Source Identification
Where:
휀 = Isotopic enrichment factor (-40‰ to -5‰ for δ15N and -18‰ to -8‰
for δ18O) 𝛿𝑆 𝑡 = Isotopic compositions of the substrate at time t
𝛿𝑆 0 = Isotopic compositions of the substrate at time 0
𝑆0 = Concentration of substrate at time 0 (mg/L)
𝑆𝑡 = Concentration of substrate at time t (mg/L)
• Calculated original 09-MW06 δ15N and δ18O are: 2.5‰ to 9.4‰ for
δ15N and -5.8‰ to -3.8‰ for δ18O

Adapted from Kendall (1998)Kendall, C. 1998. Tracing nitrogen sources and cycling in catchments. In: Kendall, C. and McDonnell, J.J., eds.,
Isotope Tracers in Catchment Hydrology, Elsevier Science B.V., Amsterdam, The Netherlands, 519–576.
Calculated δ15N and δ18O Range of 09-MW06
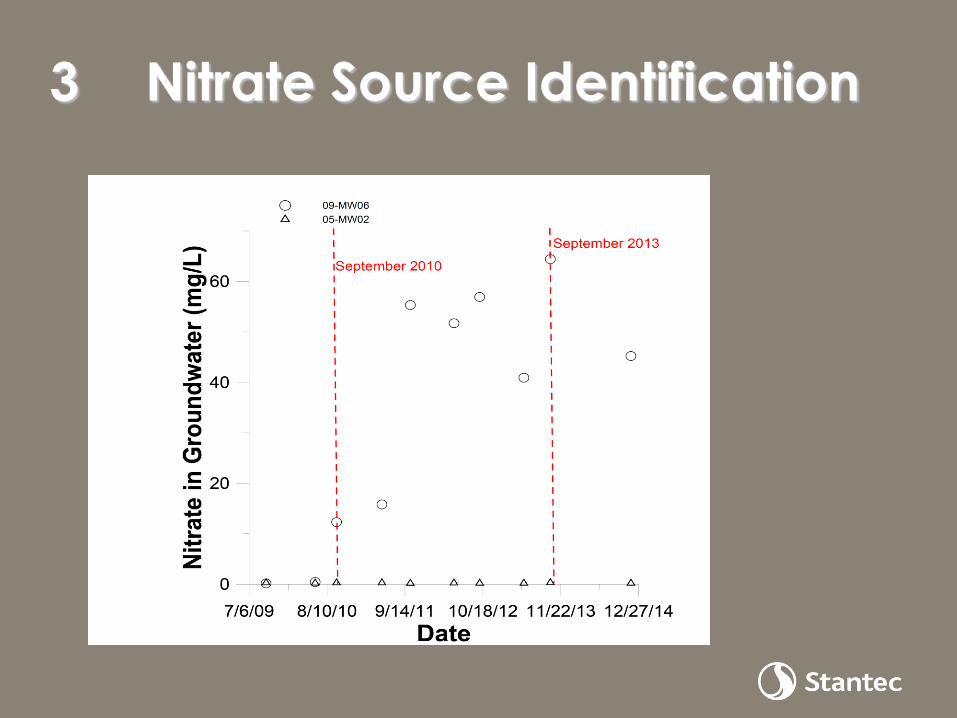
Elevated nitrate in 09-MW06
groundwater
could be either
from
ammonium
fertilizers
(anthropogenic
source) or soil
nitrate (natural
source)
3 Nitrate Source Identification
3 Nitrate Source Identification
3 Nitrate Source Identification
3 Nitrate Source Identification
• The biggest difference between the two possible nitrate sources (ammonium fertilizers and soil nitrate) is that ammonium fertilizers can be considered as anthropogenic source and soil nitrate can be considered as natural source
• Water quality consistency between 09-MW06 and 05-MW02 and nitrate concentration consistency prior to 2009 confirms that natural soil nitrate could not be the source for the recent increase of nitrate concentrations in 09-MW06 groundwater
• The source for the recent nitrate increase in09-MW06 groundwater is likely related to the application of ammonium fertilizer
4 Conclusions
• Utilized fertilizers in the previous land farming
practice were 11-48-0 (NH4H2PO4 ) and 46-0-0
(CO(NH2)2)
• The source for the recent nitrate increase in 09-
MW06 groundwater is likely related to the
excessive application of these ammonium
fertilizers
• Therefore, soil remediation activities conducted at
the Site may result in additional nitrate
contamination in groundwater

Acknowledgments
Groundwater nitrate isotopic analysis and testing
provided by:
Key contributor from Pace CSIA Center of
Excellence:
Yi Wang, Ph.D.

Thank you