Embed Size (px)
Citation preview
Biometrics Metrics Report
v3.0
Prepared for: U.S. Military Academy (USMA) – West Point
December 2012

Biometrics Metrics Report i
Revision History
Version Description Pages Delivery Date
1.0 Draft Section 1, 2, and 3 45 November 13, 2012
2.0 Final Section 2 and 3 56 December 6, 2012
3.0 Final Biometrics Metrics Report 59 December 14, 2012
Biometrics Metrics Report ii
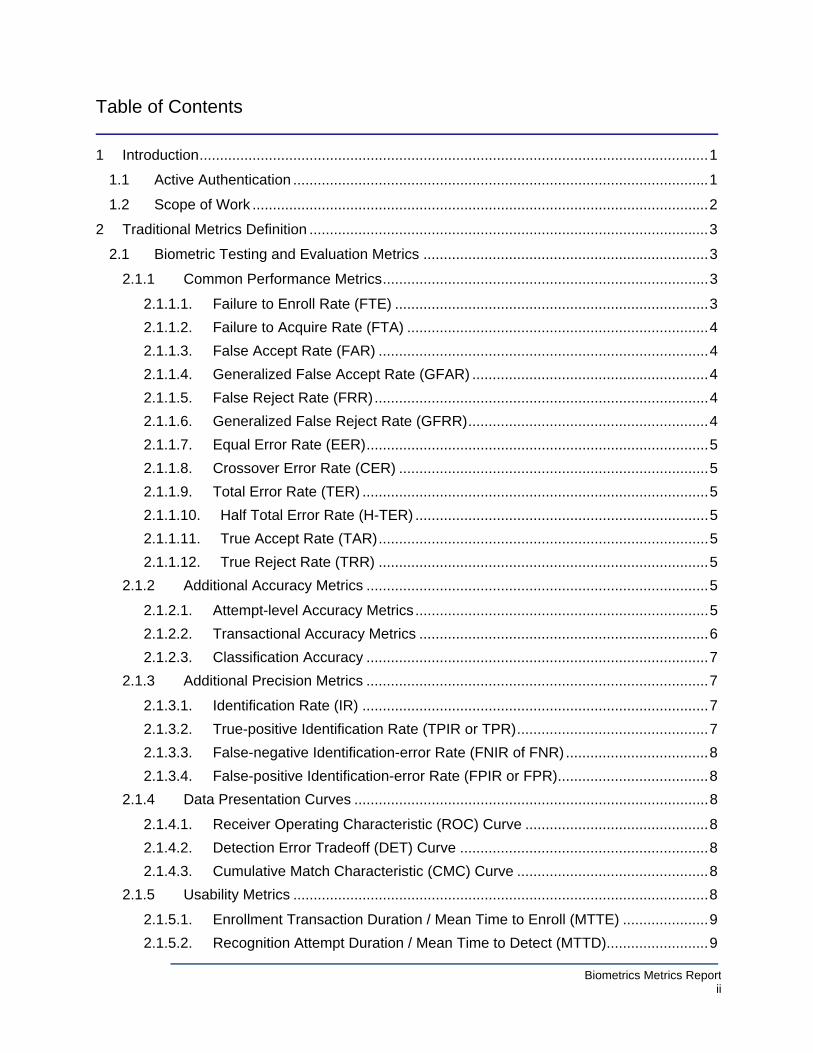
Table of Contents
1 Introduction ............................................................................................................................. 1
1.1 Active Authentication ...................................................................................................... 1
1.2 Scope of Work ................................................................................................................ 2
2 Traditional Metrics Definition .................................................................................................. 3
2.1 Biometric Testing and Evaluation Metrics ...................................................................... 3
2.1.1 Common Performance Metrics ................................................................................ 3
2.1.1.1. Failure to Enroll Rate (FTE) ............................................................................. 3
2.1.1.2. Failure to Acquire Rate (FTA) .......................................................................... 4
2.1.1.3. False Accept Rate (FAR) ................................................................................. 4
2.1.1.4. Generalized False Accept Rate (GFAR) .......................................................... 4
2.1.1.5. False Reject Rate (FRR) .................................................................................. 4
2.1.1.6. Generalized False Reject Rate (GFRR) ........................................................... 4
2.1.1.7. Equal Error Rate (EER) .................................................................................... 5
2.1.1.8. Crossover Error Rate (CER) ............................................................................ 5
2.1.1.9. Total Error Rate (TER) ..................................................................................... 5
2.1.1.10. Half Total Error Rate (H-TER) ........................................................................ 5
2.1.1.11. True Accept Rate (TAR) ................................................................................. 5
2.1.1.12. True Reject Rate (TRR) ................................................................................. 5
2.1.2 Additional Accuracy Metrics .................................................................................... 5
2.1.2.1. Attempt-level Accuracy Metrics ........................................................................ 5
2.1.2.2. Transactional Accuracy Metrics ....................................................................... 6
2.1.2.3. Classification Accuracy .................................................................................... 7
2.1.3 Additional Precision Metrics .................................................................................... 7
2.1.3.1. Identification Rate (IR) ..................................................................................... 7
2.1.3.2. True-positive Identification Rate (TPIR or TPR) ............................................... 7
2.1.3.3. False-negative Identification-error Rate (FNIR of FNR) ................................... 8
2.1.3.4. False-positive Identification-error Rate (FPIR or FPR) ..................................... 8
2.1.4 Data Presentation Curves ....................................................................................... 8
2.1.4.1. Receiver Operating Characteristic (ROC) Curve ............................................. 8
2.1.4.2. Detection Error Tradeoff (DET) Curve ............................................................. 8
2.1.4.3. Cumulative Match Characteristic (CMC) Curve ............................................... 8
2.1.5 Usability Metrics ...................................................................................................... 8
2.1.5.1. Enrollment Transaction Duration / Mean Time to Enroll (MTTE) ..................... 9
2.1.5.2. Recognition Attempt Duration / Mean Time to Detect (MTTD) ......................... 9
Biometrics Metrics Report iii
2.1.5.3. Throughput Rates ............................................................................................ 9
2.1.5.4. Verification Time .............................................................................................. 9
2.1.6 Other Performance Metrics ..................................................................................... 9
2.1.6.1. Confidence Intervals ........................................................................................ 9
2.1.6.2. Confidence Ratio (CR) ..................................................................................... 9
2.1.6.3. Detection Cost Function (DCF) ...................................................................... 10
2.1.6.4. Failure at Source Rate ................................................................................... 10
2.1.6.5. Variance ......................................................................................................... 10
2.1.7 Summary of Metrics .............................................................................................. 10
2.2 Biometric Testing and Evaluation Factors and Conditions ........................................... 12
2.2.1 Type of Evaluation ................................................................................................. 12
2.2.1.1. Technology Evaluations ................................................................................. 12
2.2.1.2. Scenario Evaluations ..................................................................................... 12
2.2.1.3. Operational Evaluations ................................................................................. 13
2.2.2 Type of Matching ................................................................................................... 13
2.2.2.1. Verification (1:1) ............................................................................................. 13
2.2.2.2. Identification (1:N) .......................................................................................... 13
2.2.3 Test Subject Population ........................................................................................ 13
2.2.3.1. Test Subject Control ....................................................................................... 13
2.2.3.2. Size of Test Subject Population ..................................................................... 13
2.2.3.3. Composition of Test Subject Population ........................................................ 13
2.2.3.4. Test Subject Physiology ................................................................................. 14
2.2.3.5. Test Subject Behavior .................................................................................... 14
2.2.4 Method of Performance Measurement .................................................................. 14
2.2.5 Environmental Factors .......................................................................................... 14
2.2.5.1. Illumination ..................................................................................................... 15
2.2.5.2. Temperature ................................................................................................... 15
2.2.5.3. Humidity and Precipitation ............................................................................. 15
2.2.5.4. Dry Air ............................................................................................................ 15
2.2.5.5. Dust and Sand ............................................................................................... 16
2.2.5.6. Induced Conditions ........................................................................................ 16
2.2.5.7. Ambient Noise and Vibration .......................................................................... 16
2.2.6 Use Case ............................................................................................................... 16
2.3 Current State of Emerging Biometrics and Performance Metrics ................................. 16
2.3.1 Performance Metrics for Continuous Authentication (CA) Systems ...................... 16
2.3.1.1. Performance Factors for Continuous Authentication ..................................... 18
Biometrics Metrics Report iv
2.3.1.2. Accuracy Metrics for Continuous Authentication ............................................ 20
2.3.1.3. Session Length Metrics .................................................................................. 21
2.3.1.4. Other Metrics Relevant to Continuous Authentication ................................... 22
2.3.2 Performance Metrics for Non-Cooperative Biometrics (NCB) ............................... 22
2.3.2.1. Collection-based NCB Performance Variables .............................................. 23
2.3.2.2. Behavior-based NCB Performance Variables ................................................ 23
2.3.3 Emerging Performance Metrics for Intent Detection ............................................. 23
2.3.4 Emerging Performance Metrics for Liveness Detection in Biometric Systems ...... 24
3 Novel Metrics Definition ........................................................................................................ 26
3.1 Active Authentication Performance Factors ................................................................. 26
3.1.1 Acquisition Metrics ................................................................................................ 26
3.1.1.1. Failure to Acquire (FTA) ................................................................................. 26
3.1.1.2. Failure at Source Rate ................................................................................... 27
3.1.1.3. Acquisition Business Case and Additional Metrics Specific to AA ................. 27
3.1.2 Enrollment Metrics ................................................................................................. 28
3.1.2.1. Failure at Enroll (FTE) .................................................................................... 29
3.1.2.2. Enrollment Business Case and Additional Metrics Specific to AA ................. 29
3.1.3 Training Metrics ..................................................................................................... 30
3.1.3.1. Training Business Case and Additional Metrics Specific to AA ...................... 30
3.1.4 Matching / Authentication Metrics ......................................................................... 32
3.1.4.1. False Match Rate (FMR) ................................................................................ 32
3.1.4.2. False Accept Rate (FAR) ............................................................................... 33
3.1.4.3. False Non-Match Rate (FNMR) ..................................................................... 33
3.1.4.4. False Reject Rate (FRR) ................................................................................ 34
3.1.4.5. Data Presentation Curves .............................................................................. 34
3.1.4.6. Business Case for AA .................................................................................... 35
3.1.5 Classification Metrics ............................................................................................. 35
3.1.5.1. Classification Business Case and Additional Metrics Specific to AA ............. 35
3.1.6 Alert Metrics .......................................................................................................... 36
3.1.6.1. Alert Business Case and Additional Metrics Specific to AA ........................... 37
3.2 Active Authentication Usability Factors ........................................................................ 39
3.2.1 Learnability and Memorability ................................................................................ 39
3.2.1.1. Anatomical modalities .................................................................................... 39
3.2.1.2. Physiological modalities ................................................................................. 39
3.2.1.3. Behavioral modalities ..................................................................................... 39
3.2.1.4. Cognitive modalities ....................................................................................... 40
Biometrics Metrics Report v
3.2.2 Transparency of Operations .................................................................................. 40
3.2.3 Privacy Considerations .......................................................................................... 40
3.2.4 Human Factors ...................................................................................................... 43
3.2.4.1. Human Interaction with Active Authentication Systems ................................. 43
3.2.4.2. Human Movement within an Operating Environment ..................................... 44
3.2.4.3. Anthropometrics ............................................................................................. 44
3.2.5 Re-Authentication Factors ..................................................................................... 45
3.2.5.1. Single User, Multiple Users ............................................................................ 45
3.2.5.2. Continuous Use, Periodic Use ....................................................................... 45
3.2.5.3. Single Application, Multi-Application .............................................................. 45
3.2.5.4. Basic Requirements for Re-Authentication and Validation............................. 46
3.2.6 Errors ..................................................................................................................... 48
3.2.7 System Efficiency .................................................................................................. 48
3.2.8 DoD Policy ............................................................................................................. 48
3.2.8.1. Sensitive Data Protection ............................................................................... 49
3.2.8.2. Accessibility Compliance ................................................................................ 50
3.3 Adoption of Biometric Technologies ............................................................................. 50
3.3.1 Technical Factors Affecting Adoption .................................................................... 50
3.3.1.1. Acquisition and Enrollment Metrics ................................................................ 50
3.3.1.2. Matching Metrics Related to Adoption ........................................................... 50
3.3.1.3. Performance Time .......................................................................................... 51
3.3.2 Human Factors Affecting Adoption ........................................................................ 51
3.3.3 Organizational Factors Affecting Adoption ............................................................ 51
3.3.4 Other Practical Considerations .............................................................................. 52
Biometrics Metrics Report
1
1 Introduction
As defined by the National Science and Technology Council (NSTC) Subcommittee on Biometrics and Identity Management, performance testing “measures the performance characteristics of an implementation, such as system error rates, throughput, or responsiveness, under various conditions.”1 With respect to the field of biometrics and identity management, performance testing constitutes a fundamental aspect in the assessment of biometric modalities and applications. Explicit NIST, ISO and IEC standards exist for the performance evaluation and reporting of established biometric modalities (e.g. Fingerprint, Face, and Iris recognition) used in traditional, single-instance biometric applications. Traditional modalities have been tested in dozens of independent performance and usability evaluations, based on hundreds of thousands of biometric data samples collected over the course of months or years; consequently, the capabilities and limitations of traditional modalities are well understood and well documented. Novel modalities and applications, by contrast, lack established performance evaluation standards, testing frameworks, and accumulated testing data. Specialized performance and usability metrics must be identified and applied prior to the implementation of any novel biometric system. 1.1 Active Authentication
The Defense Advanced Research Projects Agency (DARPA) Information Innovation Office (I2O) aims to ensure U.S. technological superiority in all areas where information can provide a decisive military advantage. I2O works to ensure U.S. technological superiority in these areas by conceptualizing and executing advanced research and development (R&D) projects to develop and demonstrate interdisciplinary, crosscutting and convergent technologies derived from emerging technological and societal trends that have the potential for game-changing disruptions of the status quo. The capabilities developed by I2O enable the warfighter to better understand the battlespace and the capabilities, intentions and activities of allies and adversaries; empower the warfighter to discover insightful and effective strategies, tactics and plans; and securely connect the warfighter to the people and resources required for mission success2. The I2O currently has an interest in new approaches to innovative software based biometric modalities and enhanced security evaluation. The goal of DARPA’s Active Authentication Program is to advance research in the area of new, software biometric modalities for the purpose of eventually using those biometric modalities for computer system authentication3. A current weakness of traditional biometrics based on physical attributes such as fingerprint, face, and iris is that these modalities can also be bypassed by the physical. To address this gap, the aim of the Active Authentication program is to go beyond the physical while leveraging the existing technology. The intended approach is to repurpose technology that tracks physical and behavioral attributes and expand upon these existing technologies to be able to identify and track an individual based on cognitive attributes and the context that an individual is currently engaged in. Moreover, in current systems, users tend to be the weakest link because they are bombarded with passwords to remember and they are forced to develop predictable patterns. The Active Authentication program changes the current paradigm by removing the secret that a human holds, the password, and focuses on the secret that the human specifically is. An eventual outcome of the Active Authentication program is to change the layer where the authentication process happens and to replace with a platform that connects in multiple biometrics. This will allow for the integration of multiple modalities into a single platform for authentication developed in an open architecture to allow introduction of new solutions. The developed platform will then look for user activity, capturing biometric information
1 NSTC Subcommittee on Biometrics and Identity Management, “Registry of USG Recommended Biometric Standards.” Version 3.0 (February 2011). 2 http://www.darpa.mil/Our_Work/I2O/ 3 http://www.darpa.mil/Our_Work/I2O/Programs/Active_Authentication.aspx
Biometrics Metrics Report
2
as it is available. As system trust in the identity of the user increases, access to more critical systems is made available. The main objective of the Active Authentication program is to develop and implement an open solution that provides meaningful and continual authentication for DoD’s computer systems leveraging features that are unique to a user. This shift in schema to where the machine is aware of the operator will make it harder for adversaries to break in and pretend to be an authorized user. The goal of the Active Authentication is to find these biometrics factors of the person as the person is working, without interrupting their normal activities. The program will initially focus on authentication at a desktop in a Department of Defense office environment. These software biometrics will capture the unique aspects of the person that can be observed through software, which will minimize operational deployment requirements. In the first phase of the Active Authentication program, DARPA seeks innovative research in new, emerging biometric modalities and new methods on software based biometrics that can capture aspects of the “cognitive fingerprint” that will be able to quantitatively verify and track a user’s identity in an office automation environment. The later phases of the program focus on developing a solution that enables integration of biometric modalities leveraging an authentication platform suitable for deployment on a standard DoD desktop or laptop environment. The combinatorial approach of using multiple modalities for continuous user identification and authentication is expected to deliver a system that is accurate, robust, and transparent to the user’s normal computing experience4. 1.2 Scope of Work
This report aims to define traditional metrics widely used and accepted for reporting traditional biometric technology performance, including performance testing and usability metrics. Furthermore, this report reviews the current state of emerging biometric solutions and how performance is measured. An assessment of the relevance and applicability of “traditional” metrics for emerging and novel modalities, specifically those with potential for Active Authentication applications, is provided, as well as the categorization and definition of performance metrics and usability factors in support of the adoption of modalities effective for AA applications. Section 2 (Traditional Metrics Definition) of this report provides an overview of the traditional performance metrics and evaluation methods used to test and appraise established biometric modalities and applications, specifically focusing on measurements of accuracy, precision, and usability. Factors and conditions affecting biometric performance evaluation and testing are described in detail. Section 2 introduces adapted and potential novel performance metrics for non-traditional biometric applications, including Non-Cooperative Biometrics (NCB), Intent Detection, Liveness Detection [Biometric Spoofing Countermeasures], and Continuous [Active] Authentication applications. Section 3 (Novel Metrics Definition) of this report identifies and describes the performance and usability factors crucial in assessing the relevance, utility, applicability and adoptability of emerging biometric modalities for use in novel applications, specifically for Active Authentication (AA) systems. Section 3 explains how the operations and authentication outcomes of novel biometric modalities intended for use in AA applications differ from traditional, single-instance biometric systems. Section 3 furthermore evaluates the relevance of traditional performance and usability metrics to AA systems, determining the extent to which traditional metrics provide effective feedback. This section also examines the ways in which traditional performance and usability concepts can be adapted or re-defined in order to better assess and represent the genuine operation and adoptability of AA systems. Additionally, Section 3 describes privacy and policy considerations and additional human factors that should be contemplated for the adoption and use of AA applications, particularly since these considerations play an active role in determining the usability and utility of any biometric system.
4 http://www.darpa.mil/Our_Work/I2O/Programs/Active_Authentication.aspx

Biometrics Metrics Report
3
2 Traditional Metrics Definition
2.1 Biometric Testing and Evaluation Metrics
Performance testing comprises a critical aspect of biometric modality assessments. Investigators are able to draw from a wide range of performance evaluation metrics that assess functional system accuracy and usability. The choice of metrics employed in performance testing is informed by the type of biometric modality or system undergoing evaluation – specifically, whether the system is traditional in nature (i.e. a well-established, single transaction identification modality such as Fingerprint, Face, or Iris recognition) or novel in nature (e.g. an emerging modality such as Pulse, or a novel application such as cognitive biometrics). Traditional performance metrics describe system accuracy (the ability of an authentication system to measure a biometric with a high degree of closeness to the biometric’s true value), precision (the repeatability of accurate system measurements over time) and usability (the ease with which a system can be used). The majority of traditional biometric performance metrics derive from signal detection theory, which seeks to quantify the ability to discern between information-bearing energy patterns (signals) and the random energy patterns (noise) that obstruct informative pattern detection and acquisition. Traditional biometric performance metrics can be approached and applied in a variety of ways, taking into consideration: performance evaluation type (technical, scenario, or operational testing), performance component assessment (detection, acquisition, enrollment, matching, and authentication), human factors (usability), and others. Jain et al suggest that a useful biometric system will possess seven specific qualities:
• Universality: each potential user possesses the modality • Uniqueness: the modality adequately differentiates between any two users • Permanence: the modality profile remains relatively constant over time • Collectability: the modality samples are easy to detect and acquire • Performance: the modality is robust and functional within a range of operational and
environmental factors • Acceptability: the extent to which users are willing to accept and use the modality • Circumvention: how susceptible the modality is to spoof attacks and identity fraud
Of these seven fundamental characteristics, uniqueness and permanence are most integral to biometric performance evaluations.
2.1.1 Common Performance Metrics
Performance metrics commonly take the form of rates; for each metric, it is important to note that the measured/observed rate noted in any evaluation is distinct from the predicted/expected rate that occurs in deployed, fully operational biometric systems (predicted/expected performance rates may be gauged using measured/observed rates). Common performance metrics include:
2.1.1.1. Failure to Enroll Rate (FTE)
The Failure to Enroll rate (FTE) describes the proportion of enrollment transactions in which zero subjects are successfully enrolled into a biometric system. FTE can apply to overall enrollment or to the enrollment of specific biometric instances, such as enrolling different fingers in a fingerprint-based system. Image
Biometrics Metrics Report
4
sample quality and user-system interaction can influence FTE. Successful enrollment encompasses biometric detection and acquisition.
2.1.1.2. Failure to Acquire Rate (FTA)
The Failure to Acquire rate (FTA) describes the proportion or weighted proportion of recognition attempts in which a biometric system fails to detect, identify or acquire a biometric image or signal of adequate quality, due to failures related to user presentation, sample segmentation, feature extraction, or quality control. FTA is best known as a recognition capture metric and depends on several factors, including: the thresholds established for sample quality, the duration of time allowed for sample acquisition, and the allowed number of presentation attempts. It is important to note that Technology Evaluations operate using a previously collected database, which eliminates the possibility of FTA during performance testing (although an FTA rate for the dataset may be available for consideration).
2.1.1.3. False Accept Rate (FAR)
The False Accept Rate (FAR) describes the proportion of identification or verification transactions in which an impostor subject was incorrectly matched to a genuine user template stored within a biometric system. FAR reflects the ability of a non-authorized user to access a system, whether via zero-effort access attempts or deliberate spoofing or other methods of circumvention.
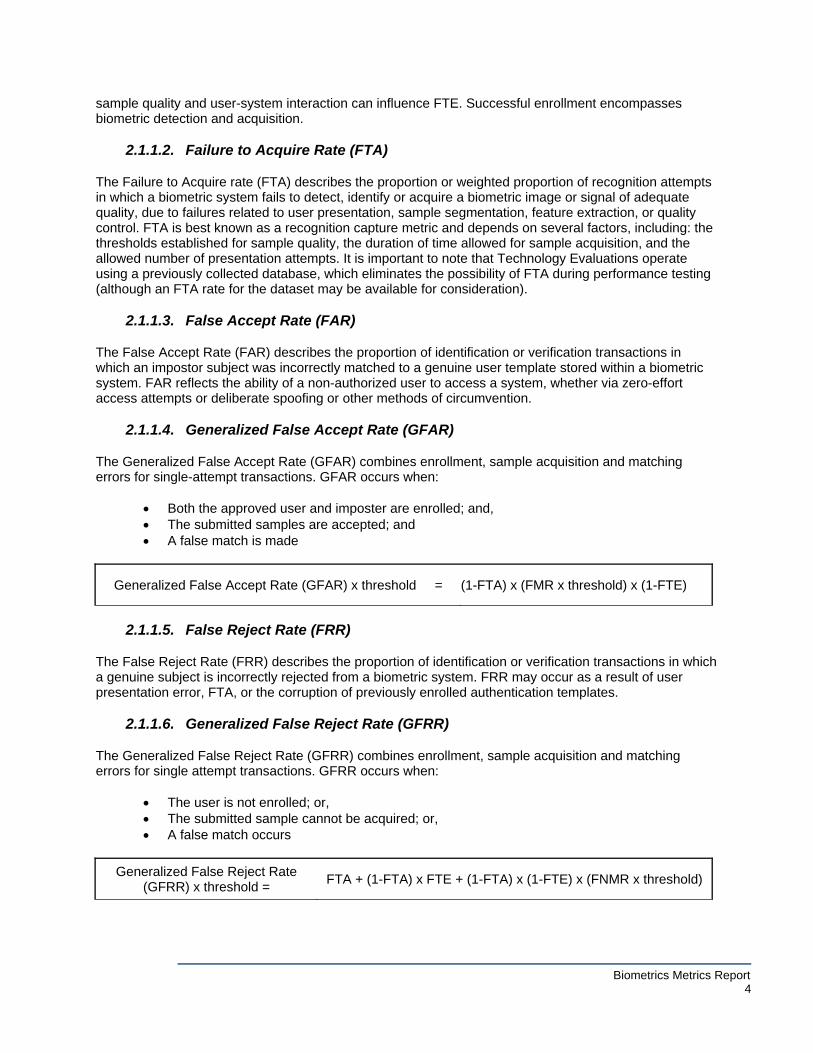
2.1.1.4. Generalized False Accept Rate (GFAR)
The Generalized False Accept Rate (GFAR) combines enrollment, sample acquisition and matching errors for single-attempt transactions. GFAR occurs when:
Both the approved user and imposter are enrolled; and, The submitted samples are accepted; and A false match is made
Generalized False Accept Rate (GFAR) x threshold = (1-FTA) x (FMR x threshold) x (1-FTE)
2.1.1.5. False Reject Rate (FRR)
The False Reject Rate (FRR) describes the proportion of identification or verification transactions in which a genuine subject is incorrectly rejected from a biometric system. FRR may occur as a result of user presentation error, FTA, or the corruption of previously enrolled authentication templates.
2.1.1.6. Generalized False Reject Rate (GFRR)
The Generalized False Reject Rate (GFRR) combines enrollment, sample acquisition and matching errors for single attempt transactions. GFRR occurs when:
The user is not enrolled; or, The submitted sample cannot be acquired; or, A false match occurs
Generalized False Reject Rate (GFRR) x threshold =
FTA + (1-FTA) x FTE + (1-FTA) x (1-FTE) x (FNMR x threshold)
Biometrics Metrics Report
5
2.1.1.7. Equal Error Rate (EER)
The Equal Error Rate (EER) describes the point at which genuine and imposter error rates are closest to zero. EER can be represented as a percentage with time/unit factors (e.g. results of “8.3% EER for 1sec/1heartbeat” in a Pulse modality study). EER is not useful in assessing actual system performance, but can be helpful as a first-order performance indicator for 1:1 verification systems.
2.1.1.8. Crossover Error Rate (CER)
Another term for EER, the Crossover Error Rate (CER) describes the percentage rating of FRR versus FAR errors. A lower CER indicates better matching accuracy.5
2.1.1.9. Total Error Rate (TER)
The Total Error Rate (TER) consists of the sum of the False Accept Rate (FAR) and the False Reject Rate (FRR).
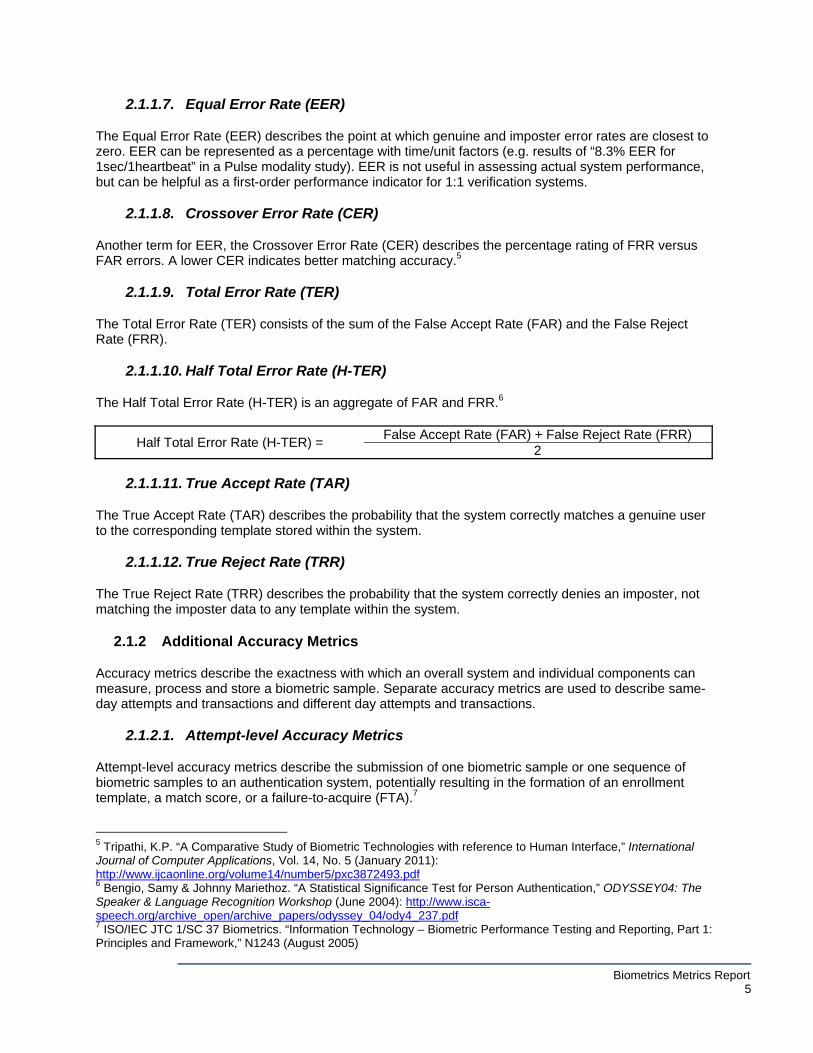
2.1.1.10. Half Total Error Rate (H-TER)
The Half Total Error Rate (H-TER) is an aggregate of FAR and FRR.6
Half Total Error Rate (H-TER) = False Accept Rate (FAR) + False Reject Rate (FRR)
2
2.1.1.11. True Accept Rate (TAR)
The True Accept Rate (TAR) describes the probability that the system correctly matches a genuine user to the corresponding template stored within the system.
2.1.1.12. True Reject Rate (TRR)
The True Reject Rate (TRR) describes the probability that the system correctly denies an imposter, not matching the imposter data to any template within the system.
2.1.2 Additional Accuracy Metrics
Accuracy metrics describe the exactness with which an overall system and individual components can measure, process and store a biometric sample. Separate accuracy metrics are used to describe same-day attempts and transactions and different day attempts and transactions.
2.1.2.1. Attempt-level Accuracy Metrics
Attempt-level accuracy metrics describe the submission of one biometric sample or one sequence of biometric samples to an authentication system, potentially resulting in the formation of an enrollment template, a match score, or a failure-to-acquire (FTA).7
5 Tripathi, K.P. “A Comparative Study of Biometric Technologies with reference to Human Interface,” International Journal of Computer Applications, Vol. 14, No. 5 (January 2011): http://www.ijcaonline.org/volume14/number5/pxc3872493.pdf 6 Bengio, Samy & Johnny Mariethoz. “A Statistical Significance Test for Person Authentication,” ODYSSEY04: The Speaker & Language Recognition Workshop (June 2004): http://www.isca-speech.org/archive_open/archive_papers/odyssey_04/ody4_237.pdf 7 ISO/IEC JTC 1/SC 37 Biometrics. “Information Technology – Biometric Performance Testing and Reporting, Part 1: Principles and Framework,” N1243 (August 2005)
Biometrics Metrics Report
6
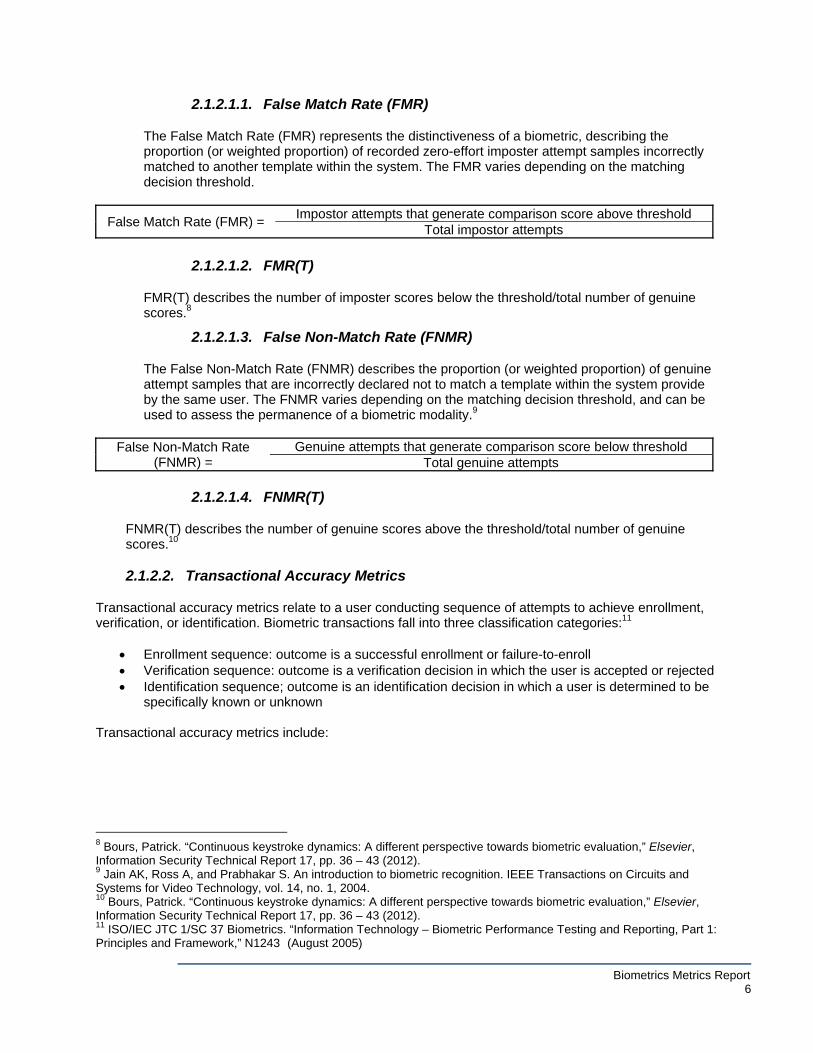
2.1.2.1.1. False Match Rate (FMR)
The False Match Rate (FMR) represents the distinctiveness of a biometric, describing the proportion (or weighted proportion) of recorded zero-effort imposter attempt samples incorrectly matched to another template within the system. The FMR varies depending on the matching decision threshold.
False Match Rate (FMR) = Impostor attempts that generate comparison score above threshold
Total impostor attempts
2.1.2.1.2. FMR(T)
FMR(T) describes the number of imposter scores below the threshold/total number of genuine scores.8
2.1.2.1.3. False Non-Match Rate (FNMR)
The False Non-Match Rate (FNMR) describes the proportion (or weighted proportion) of genuine attempt samples that are incorrectly declared not to match a template within the system provide by the same user. The FNMR varies depending on the matching decision threshold, and can be used to assess the permanence of a biometric modality.9
False Non-Match Rate (FNMR) =
Genuine attempts that generate comparison score below threshold Total genuine attempts
2.1.2.1.4. FNMR(T)
FNMR(T) describes the number of genuine scores above the threshold/total number of genuine scores.10 2.1.2.2. Transactional Accuracy Metrics
Transactional accuracy metrics relate to a user conducting sequence of attempts to achieve enrollment, verification, or identification. Biometric transactions fall into three classification categories:11
Enrollment sequence: outcome is a successful enrollment or failure-to-enroll Verification sequence: outcome is a verification decision in which the user is accepted or rejected Identification sequence; outcome is an identification decision in which a user is determined to be
specifically known or unknown Transactional accuracy metrics include:
8 Bours, Patrick. “Continuous keystroke dynamics: A different perspective towards biometric evaluation,” Elsevier, Information Security Technical Report 17, pp. 36 – 43 (2012). 9 Jain AK, Ross A, and Prabhakar S. An introduction to biometric recognition. IEEE Transactions on Circuits and Systems for Video Technology, vol. 14, no. 1, 2004. 10 Bours, Patrick. “Continuous keystroke dynamics: A different perspective towards biometric evaluation,” Elsevier, Information Security Technical Report 17, pp. 36 – 43 (2012). 11 ISO/IEC JTC 1/SC 37 Biometrics. “Information Technology – Biometric Performance Testing and Reporting, Part 1: Principles and Framework,” N1243 (August 2005)
Biometrics Metrics Report
7
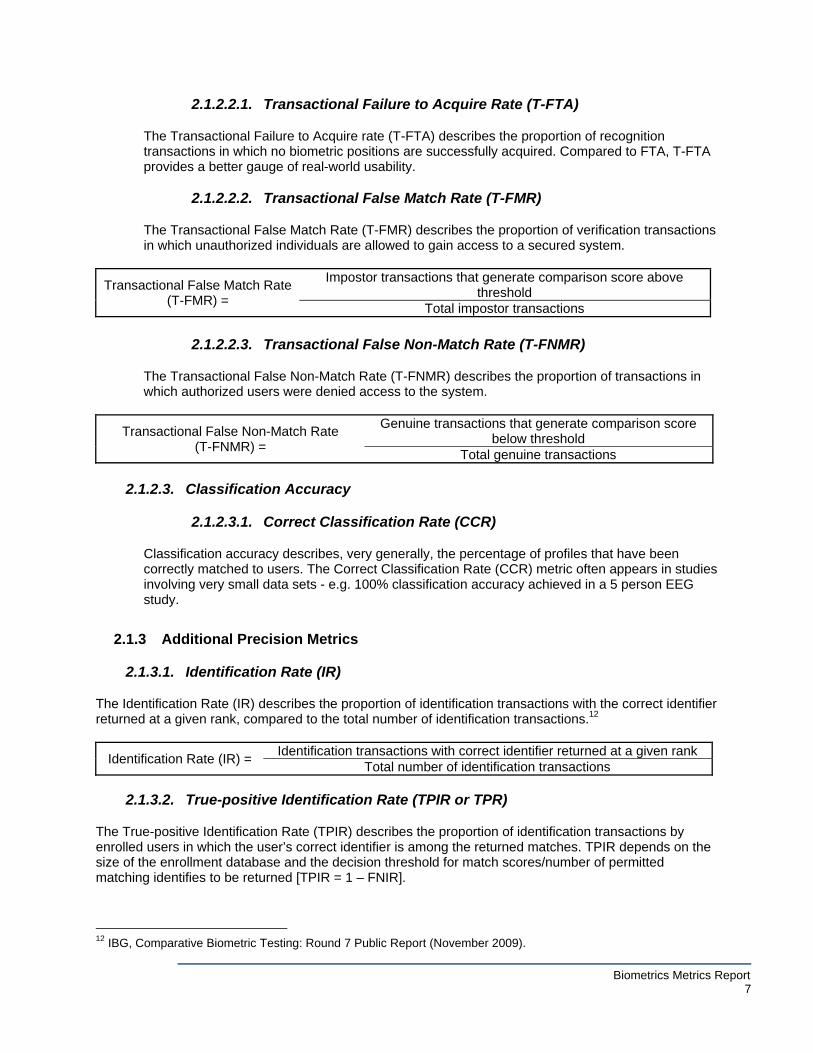
2.1.2.2.1. Transactional Failure to Acquire Rate (T-FTA)
The Transactional Failure to Acquire rate (T-FTA) describes the proportion of recognition transactions in which no biometric positions are successfully acquired. Compared to FTA, T-FTA provides a better gauge of real-world usability.
2.1.2.2.2. Transactional False Match Rate (T-FMR)
The Transactional False Match Rate (T-FMR) describes the proportion of verification transactions in which unauthorized individuals are allowed to gain access to a secured system.
Transactional False Match Rate (T-FMR) =
Impostor transactions that generate comparison score above threshold
Total impostor transactions
2.1.2.2.3. Transactional False Non-Match Rate (T-FNMR)
The Transactional False Non-Match Rate (T-FNMR) describes the proportion of transactions in which authorized users were denied access to the system.
Transactional False Non-Match Rate (T-FNMR) =
Genuine transactions that generate comparison score below threshold
Total genuine transactions 2.1.2.3. Classification Accuracy
2.1.2.3.1. Correct Classification Rate (CCR)
Classification accuracy describes, very generally, the percentage of profiles that have been correctly matched to users. The Correct Classification Rate (CCR) metric often appears in studies involving very small data sets - e.g. 100% classification accuracy achieved in a 5 person EEG study.
2.1.3 Additional Precision Metrics
2.1.3.1. Identification Rate (IR)
The Identification Rate (IR) describes the proportion of identification transactions with the correct identifier returned at a given rank, compared to the total number of identification transactions.12
Identification Rate (IR) = Identification transactions with correct identifier returned at a given rank
Total number of identification transactions
2.1.3.2. True-positive Identification Rate (TPIR or TPR)
The True-positive Identification Rate (TPIR) describes the proportion of identification transactions by enrolled users in which the user’s correct identifier is among the returned matches. TPIR depends on the size of the enrollment database and the decision threshold for match scores/number of permitted matching identifies to be returned [TPIR = 1 – FNIR].
12 IBG, Comparative Biometric Testing: Round 7 Public Report (November 2009).

Biometrics Metrics Report
8
2.1.3.3. False-negative Identification-error Rate (FNIR of FNR)
False-negative Identification-Error Rate (FNIR) describes the proportion of identification transactions by enrolled users in which the user’s correct identifier is not among the returned matches [FNIR = 1 – TPIR].
2.1.3.4. False-positive Identification-error Rate (FPIR or FPR)
The False-positive Identification-error Rate (FPIR) describes the proportion of identification transactions by users not enrolled in the system, in which an identifier is returned. FPIR depends on the size of the enrollment database and the decision threshold for matching scores and/or number of matched identifies that the system is permitted to return. FPIR does not occur in scenarios involving closed-set identification, as all users are previously enrolled in the system.
2.1.4 Data Presentation Curves
In addition to rate-based metrics, three types of data presentation curves are commonly used to describe and model biometric performance.
2.1.4.1. Receiver Operating Characteristic (ROC) Curve
A ROC curve plots of the rate of false positives (accepted impostor attempts) along the x-axis against the corresponding rate of true positives (genuine attempts accepted) on the y-axis; points are plotted parametrically as a function of the decision threshold.
2.1.4.2. Detection Error Tradeoff (DET) Curve
A DET curve is a modified ROC curve that plots error rates across a range of operating points on both axes (false positives are recorded on the x-axis and false negatives are recorded on the y-axis); accuracy improves as one moves leftward and downward on the graph.
2.1.4.3. Cumulative Match Characteristic (CMC) Curve
A CMC curve graphically represents the results of an identification task test by plotting rank values on the x-axis and the probability of correct identification at or below that rank on the y-axis.
2.1.5 Usability Metrics
The International Organization for Standardization (ISO) employs “usability” to describe “the extent to which a product can be used by specified users to achieve specified goals with effectiveness, efficiency, and satisfaction in a specified context of use. Usability comprises several user-based aspects:13
Learnability – the ease with which users can complete basic tasks on their first encounter with a biometric system
Efficiency – the speed at which users can perform a task after becoming familiar with the system Memorability – the ease with which users can re-establish system proficiency following a period
of system disuse Errors – the number of user errors that occur during system use, the severity of user errors, and
the degree to which users can recover from such errors Satisfaction – the degree to which users find the system pleasant to operate
Usability can be related in terms of performance metrics that describe user-system interaction, particularly FTE, FTA, and T-FTA. Additional usability metrics include:
13 Nielsen, Jakob. “Usability 101: Introduction to Usability,” www.useit.com : http://www.useit.com/alertbox/20030825.html
Biometrics Metrics Report
9
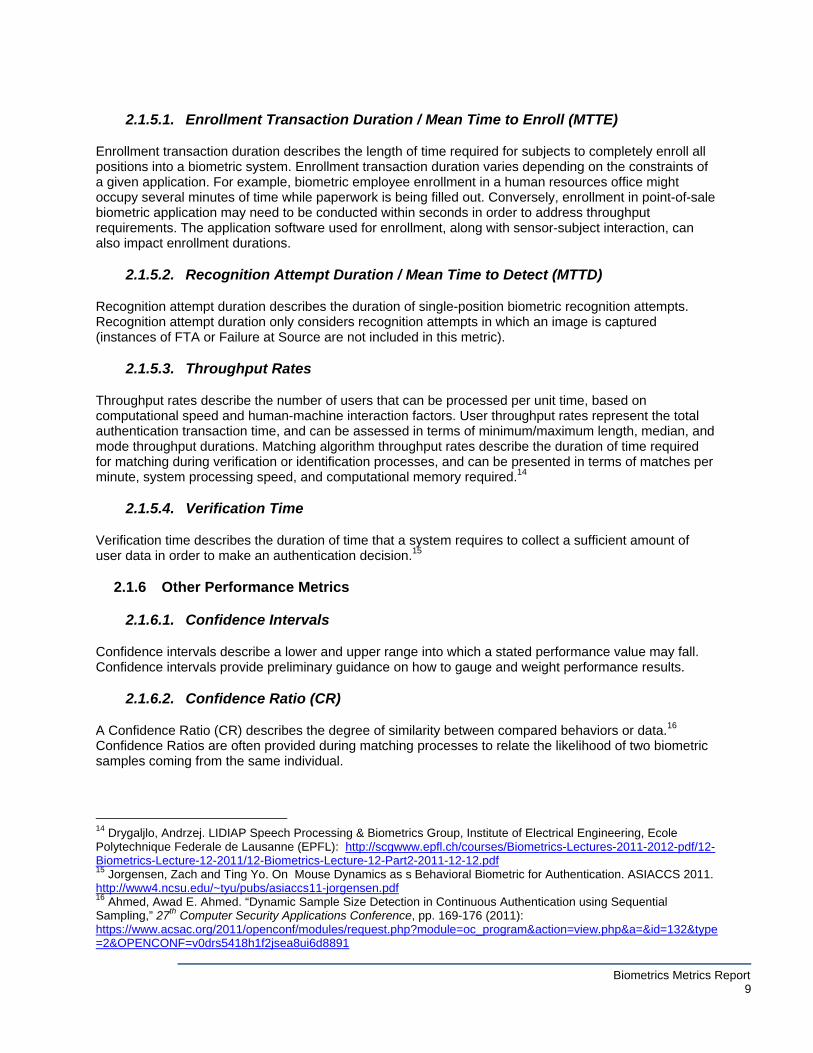
2.1.5.1. Enrollment Transaction Duration / Mean Time to Enroll (MTTE)
Enrollment transaction duration describes the length of time required for subjects to completely enroll all positions into a biometric system. Enrollment transaction duration varies depending on the constraints of a given application. For example, biometric employee enrollment in a human resources office might occupy several minutes of time while paperwork is being filled out. Conversely, enrollment in point-of-sale biometric application may need to be conducted within seconds in order to address throughput requirements. The application software used for enrollment, along with sensor-subject interaction, can also impact enrollment durations.
2.1.5.2. Recognition Attempt Duration / Mean Time to Detect (MTTD)
Recognition attempt duration describes the duration of single-position biometric recognition attempts. Recognition attempt duration only considers recognition attempts in which an image is captured (instances of FTA or Failure at Source are not included in this metric).
2.1.5.3. Throughput Rates
Throughput rates describe the number of users that can be processed per unit time, based on computational speed and human-machine interaction factors. User throughput rates represent the total authentication transaction time, and can be assessed in terms of minimum/maximum length, median, and mode throughput durations. Matching algorithm throughput rates describe the duration of time required for matching during verification or identification processes, and can be presented in terms of matches per minute, system processing speed, and computational memory required.14
2.1.5.4. Verification Time
Verification time describes the duration of time that a system requires to collect a sufficient amount of user data in order to make an authentication decision.15
2.1.6 Other Performance Metrics
2.1.6.1. Confidence Intervals
Confidence intervals describe a lower and upper range into which a stated performance value may fall. Confidence intervals provide preliminary guidance on how to gauge and weight performance results.
2.1.6.2. Confidence Ratio (CR)
A Confidence Ratio (CR) describes the degree of similarity between compared behaviors or data.16 Confidence Ratios are often provided during matching processes to relate the likelihood of two biometric samples coming from the same individual.
14 Drygaljlo, Andrzej. LIDIAP Speech Processing & Biometrics Group, Institute of Electrical Engineering, Ecole Polytechnique Federale de Lausanne (EPFL): http://scgwww.epfl.ch/courses/Biometrics-Lectures-2011-2012-pdf/12-Biometrics-Lecture-12-2011/12-Biometrics-Lecture-12-Part2-2011-12-12.pdf 15 Jorgensen, Zach and Ting Yo. On Mouse Dynamics as s Behavioral Biometric for Authentication. ASIACCS 2011. http://www4.ncsu.edu/~tyu/pubs/asiaccs11-jorgensen.pdf 16 Ahmed, Awad E. Ahmed. “Dynamic Sample Size Detection in Continuous Authentication using Sequential Sampling,” 27th Computer Security Applications Conference, pp. 169-176 (2011): https://www.acsac.org/2011/openconf/modules/request.php?module=oc_program&action=view.php&a=&id=132&type=2&OPENCONF=v0drs5418h1f2jsea8ui6d8891
Biometrics Metrics Report
10
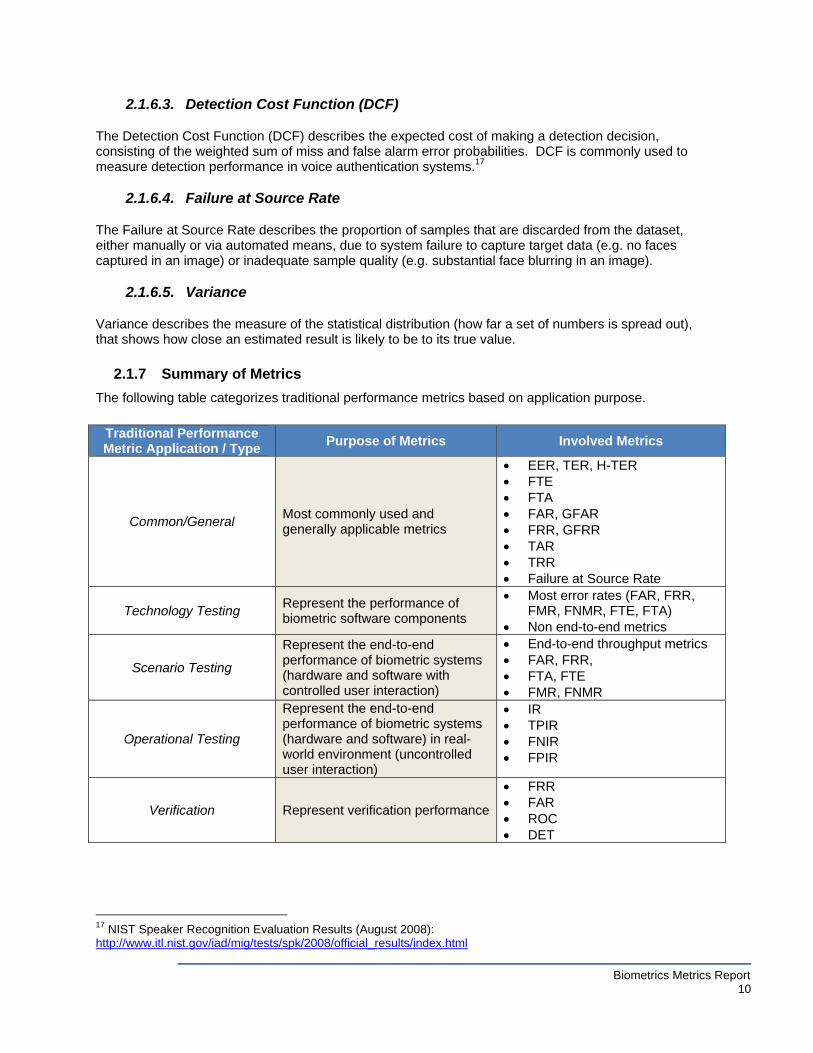
2.1.6.3. Detection Cost Function (DCF)
The Detection Cost Function (DCF) describes the expected cost of making a detection decision, consisting of the weighted sum of miss and false alarm error probabilities. DCF is commonly used to measure detection performance in voice authentication systems.17
2.1.6.4. Failure at Source Rate
The Failure at Source Rate describes the proportion of samples that are discarded from the dataset, either manually or via automated means, due to system failure to capture target data (e.g. no faces captured in an image) or inadequate sample quality (e.g. substantial face blurring in an image).
2.1.6.5. Variance
Variance describes the measure of the statistical distribution (how far a set of numbers is spread out), that shows how close an estimated result is likely to be to its true value.
2.1.7 Summary of Metrics
The following table categorizes traditional performance metrics based on application purpose.
Traditional Performance Metric Application / Type
Purpose of Metrics Involved Metrics
Common/General Most commonly used and generally applicable metrics
EER, TER, H-TER FTE FTA FAR, GFAR FRR, GFRR TAR TRR Failure at Source Rate
Technology Testing Represent the performance of biometric software components
Most error rates (FAR, FRR, FMR, FNMR, FTE, FTA)
Non end-to-end metrics
Scenario Testing
Represent the end-to-end performance of biometric systems (hardware and software with controlled user interaction)
End-to-end throughput metrics FAR, FRR, FTA, FTE FMR, FNMR
Operational Testing
Represent the end-to-end performance of biometric systems (hardware and software) in real-world environment (uncontrolled user interaction)
IR TPIR FNIR FPIR
Verification Represent verification performance
FRR FAR ROC DET
17 NIST Speaker Recognition Evaluation Results (August 2008): http://www.itl.nist.gov/iad/mig/tests/spk/2008/official_results/index.html
Biometrics Metrics Report
11
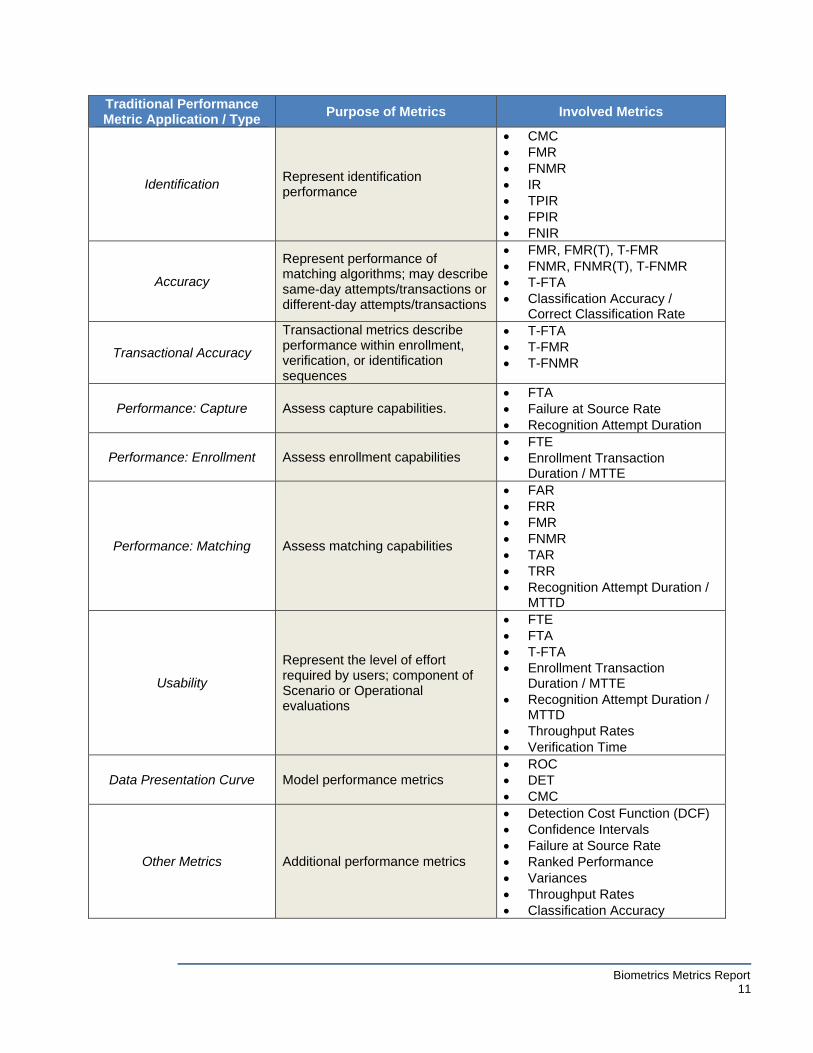
Traditional Performance Metric Application / Type
Purpose of Metrics Involved Metrics
Identification Represent identification performance
CMC FMR FNMR IR TPIR FPIR FNIR
Accuracy
Represent performance of matching algorithms; may describe same-day attempts/transactions or different-day attempts/transactions
FMR, FMR(T), T-FMR FNMR, FNMR(T), T-FNMR T-FTA Classification Accuracy /
Correct Classification Rate
Transactional Accuracy
Transactional metrics describe performance within enrollment, verification, or identification sequences
T-FTA T-FMR T-FNMR
Performance: Capture Assess capture capabilities. FTA Failure at Source Rate Recognition Attempt Duration
Performance: Enrollment Assess enrollment capabilities FTE Enrollment Transaction
Duration / MTTE
Performance: Matching Assess matching capabilities
FAR FRR FMR FNMR TAR TRR Recognition Attempt Duration /
MTTD
Usability
Represent the level of effort required by users; component of Scenario or Operational evaluations
FTE FTA T-FTA Enrollment Transaction
Duration / MTTE Recognition Attempt Duration /
MTTD Throughput Rates Verification Time
Data Presentation Curve Model performance metrics ROC DET CMC
Other Metrics Additional performance metrics
Detection Cost Function (DCF) Confidence Intervals Failure at Source Rate Ranked Performance Variances Throughput Rates Classification Accuracy
Biometrics Metrics Report
12
2.2 Biometric Testing and Evaluation Factors and Conditions
The following section identifies and describes several critical, non-measurement-based factors involved in assessing the capabilities, relevance, and applicability of biometric modality performance evaluations:
Type of Evaluation Type of Matching Test Subject Population Method of Performance Measurement Environmental Factors Use Case
2.2.1 Type of Evaluation
The International Organization for Standardization (ISO) and the International Electrotechnical Commission (IEC) identify three primary categories of biometric performance evaluation: technology evaluation, scenario evaluation, and operational evaluation.18 Each performance evaluation type employs a specific set of performance metrics.
2.2.1.1. Technology Evaluations
Technology evaluations are used to examine the offline function of one or more enrollment or comparison algorithms that operate within the same biometric modality. Dataset selection constitutes an integral aspect of technology evaluations, and pre-existing or specially compiled testing corpuses should ideally meet several standards; dataset samples should be collected using sensors that are equally compatible with all algorithms undergoing evaluation, and collected data should not be accessed by algorithm developers prior to testing. The use of “fixed” datasets helps ensure that technology evaluation results are repeatable. Technology evaluations produce large quantities of comparison scores and candidate lists which indicate an algorithm’s capability to generate fundamental discriminations. Typical metrics include most error rates (e.g. EER, FAR, FRR, etc.), but not end-too-end throughput metrics. Technology evaluations are best suited for determining the performance capabilities of large-scale identification systems (in which obtaining a large enough test population might be difficult), and facilitate cross-comparison testing, exploratory testing, and multi-instance (e.g. 3 views of face) and multi-algorithmic testing. Technology evaluations can also be extended to help assess quality control and feedback, signal processing, image fusion, feature extraction and normalization, feature-level fusion, comparison score computation and fusion, and score normalization methods.
2.2.1.2. Scenario Evaluations
Scenario evaluations are used to test the end-to-end system performance of a prototype or simulated application, examining how samples collected from real test subjects are processed in real time in a modeled environment. Like technology evaluations, scenario evaluations examine the function of algorithms but also include the opportunity to assess hardware components (i.e. sensors) and user-system interaction. The acquisition sensors involved in scenario evaluations are unique to each test; therefore, each tested system will collect slightly different data. If multiple systems are undergoing comparison, scenario evaluations must control for environmental and population factors across all data collection. The data storage capacities of the sensor or system also have an impact on scenario testing, determining whether
18 ISO/IEC JTC 1/SC 37 Biometrics. “Information Technology – Biometric Performance Testing and Reporting, Part 1: Principles and Framework,” N1243 (August 2005)

Biometrics Metrics Report
13
the assessment is conducted online, offline, or in some combination thereof. The repeatability of scenario evaluations remains highly dependent the extent to which the modeled environment can be controlled. Scenario evaluations typically produce metrics that relate to end-to-end throughput, including FMR, FNMR, FTA, FTE, GFAR, and GFRR; performance aspects related to user presentation and sample capture duration can also be gauged. Scenario evaluations also provide insight into how additional attempts and transactions impact the system’s ability to enroll and recognize users.
2.2.1.3. Operational Evaluations
Operational evaluations assess the performance of a comprehensive biometric system in a precise application environment using a specific target population. Unlike Technology and Scenario Evaluations, offline testing might not be feasible in operational evaluations. Achieving test result repeatability in operational evaluations may also be difficult due to unknown or uncontrollable differences between operational environments. Additionally, ground truth may be difficult to establish in operational evaluations, especially if the assessment is conducted under unsupervised conditions.
2.2.2 Type of Matching
The type of matching evaluation conducted for a given system, either Verification (1:1) or Identification (1: N or 1:many) provides insight into the potential discriminating power of a biometric.
2.2.2.1. Verification (1:1)
Verification (1:1) testing determines whether two samples, when compared, generate a score above a designated threshold, providing assurance that a presented biometric sample matches the stored biometric template associated with the individual’s identity.
2.2.2.2. Identification (1:N)
Identification testing (1:N) is typically more challenging than verification testing in that the genuine match must be stronger than all possible impostor matches. As the number of subjects in a 1:N test increases, robust identification results indicate a stronger biometric modality.
2.2.3 Test Subject Population
2.2.3.1. Test Subject Control
Performance evaluations employ varying degrees of test subject behavior control, which can take the form of system training and instruction, feedback and guidance during system use, supervision, and permitting time for user habituation.
2.2.3.2. Size of Test Subject Population
Typically, test result reliability increases in correlation with the number of test subjects involved. Tests conducted on small subject populations are likely to understate a system’s capabilities or fail to identify the impact that outlier users have on system performance. In addition to maximizing the number of unique subjects, it is generally appropriate to collect numerous samples from each test subject in order to assess feature stability in the form of genuine match rates.
2.2.3.3. Composition of Test Subject Population
Test populations should reflect an application's intended user base with respect to user gender, ethnicity, age, physiology, and level of acclimation to the suggested technology. For example, tests featuring all
Biometrics Metrics Report
14
male subjects, or all student subjects, may not be relevant to systems deployed for use among demographic that is diverse in terms of gender, age, education, and health status.
2.2.3.4. Test Subject Physiology
Many aspects of a user’s physical composition and bodily integrity can impact the performance of biometric systems, particularly with respect to:
Head and facial hair (or lack of hair) Disability - e.g. amputation, poor eyesight requiring glasses or contact lens use, etc. Disease - e.g. arthritis, ocular degeneration, cardiovascular disease, poor circulation, etc. Illness – e.g. fever, weight loss, edema, etc. Injury – e.g. scars, bruising, swelling, lacerations, burns; presence of bandages or installation of
reconstructive hardware Natural growth – e.g. hair, fingernails, height, aging, weight fluctuations, etc. Skin quality – affected by moisture, heat, cleansing, sun exposure, aging, topical applications
(lotions, make-up, paint, etc.), calluses, and environmental factors (e.g. dirt, oil) Coloring of skin, eyes, or other features
2.2.3.5. Test Subject Behavior
Test subject behavior can vary greatly in terms of:
Expression Movement Emotional state Pose and Orientation Prior Activity (e.g. out of breath, sweaty, etc.) Degree of cleanliness Presence of cosmetics, piercings or tattoos
2.2.4 Method of Performance Measurement
Despite the existence of standards and guidelines that specify how to calculate and report biometric evaluation results, performance test outcomes are often reported haphazardly. One fundamental principle of biometric performance testing is that genuine and impostor error rates must be unambiguously reported in order for an evaluation to hold any relevance. Many evaluations, however, report only one side of the equation (e.g. impostor error rates without genuine error rates); in other cases, the methods used to calculate the True Accept Rate (TAR), True Reject Rate (TRR), False Reject Rate (FRR), or Equal Error Rate (EER) are not clearly explained. For all modalities, enrollment failures – the proportion of test subjects from whom biometric data cannot be reliably collected – are an essential metric. Emerging modality evaluations rarely report or examine enrollment failures, perhaps due to excessively small sample sizes.
2.2.5 Environmental Factors
Geography, climate, and induced conditions can have a significant impact on the performance and operation of biometric systems, affecting both technical performance capabilities and user-system interaction.

Biometrics Metrics Report
15
2.2.5.1. Illumination
The degree of illumination or ambient light present in the capture environment varies over distances, by source (natural or artificial light), by time of day, and based on weather conditions (sunny or clouded skies, fog, precipitation interference, etc.). The quality of illumination, the positions of illumination sources, and the consistency of illumination over during and between use periods all have the potential to impact the performance of biometric systems.
2.2.5.2. Temperature
The Department of Defense (DoD) MIL-STD 810G on Test Method Standard: Environment Engineering Considerations and Laboratory Tests defines four climactic classifications of realistic natural environments for materiel use: Hot climate, Basic climate, Cold climate, and Severe Cold climate.19 Extreme temperature variations can impact biometric system performance by melting or freezing system hardware components. Temperature also impacts user-system interaction:
Bodily exposure in extreme temperature conditions may not be feasible or healthy for a user; protective clothing or gear may obscure sample detection and capture
User contact with a sensor surface in extreme conditions may not be feasible, due to risk of burn or electrical shock injuries
Temperature affects a user’s skin quality (causing dryness or sweat-based saturation), which may interfere with data capture of some modalities, such as fingerprint
Extreme temperatures may also alter a user’s physiological biometric signatures
2.2.5.3. Humidity and Precipitation
Humidity and precipitation (in the form of fog, rain, sleet, snow, or hail) can impact biometric systems in several ways:
Disrupt the function and operational capabilities of hardware components, potentially interfering with electrical/mechanical components in the short term and causing physical deterioration, such as rust, over longer periods of time
Affect users in a manner that interferes with system use – e.g. a user with moist or water-saturated hands has greater difficulty presenting viable fingerprints for a print-based authentication system
Disrupting signal or data detection capabilities (in the case of systems deployed in outdoor environments) – e.g. pouring rain might prevent a system from capturing an adequate iris image, or from detecting a pulse signal amid environmental noise
2.2.5.4. Dry Air
Dry air, present in hot, cold, and artificially controlled climates, has a significant impact on skin, diminishing the capture capabilities of skin-based modalities such as finger and palm print, while also potentially impacting the voice modality. Dry air can also create electrostatic discharges (ESD), either air-based or contact based, when users handle system equipment. Over time, repeated ESD shocks can degrade biometric sensor components (e.g. causing pixel death in capacitive fingerprint sensors).
19 Department of Defense. Test Method Standard: Environment Engineering Considerations and Laboratory Tests. MIL-STD-810G. October, 2008.
Biometrics Metrics Report
16
2.2.5.5. Dust and Sand
Like precipitation, the presence of ambient dust and sand can physically degrade biometric equipment by interfering with the function of electrical and mechanical components. Ambient dust and sand can also interfere with data acquisition and capture quality and promote electrostatic discharge (ESD).
2.2.5.6. Induced Conditions
Induced conditions, such as general wear and tear sustained by biometric systems during transportation, system set-up, use, and storage, can also degrade hardware components over time and negatively impact system performance. Many biometric technologies deployed for field use require special protective casing, storage, and maintenance considerations.
2.2.5.7. Ambient Noise and Vibration
Ambient noise and vibrations (e.g. from heavy traffic or large crowds of people) may interfere with biometric signal detection in the case of certain modalities such as Voice and Pulse. Vibrations affecting sensing equipment may also negatively impact image capture in modalities like Fingerprint and Iris recognition.
2.2.6 Use Case
Use case describes the context in which a biometric application is intended to be implemented. Use case encompasses: the degree to which a deployment environment is controlled or uncontrolled; whether the deployment environment is outdoors, indoors, or mixed; anticipated environmental impacts on system use and performance; time of day; the degree to which system or system component mobility and robustness are required; the time expected to elapse between enrollment and authentication; user familiarity with the system; user motivation to habituate to the and operate the system correctly; and existing operational needs that must be considered (e.g. systems that operate silently for covert use, or systems that operate using battery power).20 2.3 Current State of Emerging Biometrics and Performance Metrics
Novel biometric systems are exploratory or notional in nature, and involved sensor and algorithm components are in the early stages of development. Consequently, researches tend to address novel biometric performance in broad terms, seeking to gauge general identification and accuracy capabilities; metrics are applied to ascertain the overall feasibility of a proposed modality or application, rather than to minutely assess the capabilities of a system’s individual component parts or the full range of a system’s application potential. Most evaluations of novel biometric systems rely on generalized traditional performance metrics such as EER, H-TER, FAR, FRR, DET curves, ROC curves, and CMC curves. Novel biometric systems involve new modalities or new applications of existing modalities. In the latter case, component hardware and software technologies exist, but must be repurposed and fully adapted for innovative uses and/or non-standard operational environments. Examples of novel biometric systems include applications for continuous authentication (a.k.a. “Active Authentication”) as well as Non-Cooperative Biometric capture (NCB), intent detection, and liveness detection.
2.3.1 Performance Metrics for Continuous Authentication (CA) Systems
Continuous Authentication (CA; otherwise known as “Active Authentication” or AA systems), a subset of the activity monitoring field, constitutes another novel biometric application that may incorporate
20 ISO/IEC JTC 1/SC 37 Biometrics. “Information Technology – Biometric Performance Testing and Reporting, Part 1: Principles and Framework,” N1243 (August 2005).
Biometrics Metrics Report
17
traditional and novel biometric modalities. In contrast to traditional single-transaction authentication systems, CA systems repeatedly perform authentication sequences throughout a period of observation. CA systems are intended to detect intruders and fraudulent activity, guarantee security throughout the entire duration of user activity, provide liveness detection, and detect and prevent insider threats.21 CA systems do not necessarily need to operate covertly, but do need to offer ease-of-use by conveniently authenticating users without interrupting user work or activity. Because CA monitoring is ongoing and authentication is continuously repeated, CA applications are more dynamic in nature than standard or static biometric authentication schemes. Traditional performance metrics are not able to capture and account for the dynamic and persistently fluctuating nature of CA systems. Also, in order to be useful, CA systems must efficiently detect unusual behavior and generate timely system alerts. Consequently, the duration and frequency of observation intervals constitute critical factors in performance evaluation of CA systems. Initial CA research and development efforts have primarily focused on providing traditional or “static” identification outcomes using novel CA techniques – i.e. providing a precise “true/false” or immediate “acceptance/rejection” decision. The dynamic nature of CA systems, however, extends the use of CA systems beyond the traditional true/false authentication model. Specifically, CA systems may also operate on the premise of “degree of confidence” or “level of trust” observed in a user’s claimed identity – in other words, the operational goal of CA systems may be to continuously maintain a specified degree of certainty that the user truly possesses the identity that he or she claims, instead of precisely identifying the user during successive authentication transactions. Systems that provide degree of confidence data rather than precise identification provide two helpful features:
1. Systems providing degree of confidence data enable system administrators to alter confidence thresholds depending on the sensitivity of a given system. For example, a system secured at the TS/SCI level would require higher confidence thresholds than an unclassified system, or an authentication station located in common, unsecured workspace would operate using lower thresholds than a workstation located in a secured area.
2. Frameworks for CA systems providing degree of confidence data can incorporate traditional and precise biometric authentication as necessary, for instances in which the degree of confidence drops below acceptable threshold levels. This flexibility can help avoid some of the processing strains and user-workflow interference that occurs when using traditional (and often disruptive) authentication modalities.
CA constitutes an emerging area of study that has been spearheaded, in the academic community, by Ahmed Awad E. Ahmed and Issa Traoré of the University of Victoria, Canada. In recent years, Ahmed and Traoré have devised a novel framework for adapting traditional performance and accuracy metrics to account for the dynamic and time-sensitive nature of CA systems, in addition to proposing new metrics unique to evaluating CA systems. Ahmed and Traoré’s methods can be generalized to CA applications, but it is important to note that their proposed framework has been developed within the specific context of CA applications that leverage Mouse Movement and Keystroke modalities. Ahmend and Traoré’s work also focuses on true/false authentication premises, but their framework may be adapted for use in in CA systems that provide a degree of identity confidence. With respect to CA systems, the group highlights the necessity of understanding the following aspects: 22
The amount of data required for detection and recognition
21 Traore, Issa and Ahmed Awad E. Ahmed. Continuous Authentication Using Biometrics: Data, Models, and Metrics (Hershey, PA: IGI Global, 2012), 16-18. 22 Traore, Issa and Ahmed Awad E. Ahmed. Continuous Authentication Using Biometrics: Data, Models, and Metrics (Hershey, PA: IGI Global, 2012), 4-5.
Biometrics Metrics Report
18
The minimum quality of collected data samples
The degree of user effort involved in the identification process
The level of automation offered by a system’s enrollment and monitoring processes
The degree to which a system can be adapted to variation and changes in user activity
Furthermore, at the current stage of technology development, it appears likely that CA systems will need to contend with higher-than-normal FAR with respect to the implementation of emergent or novel biometric modalities. High FAR may be mitigated, however, if CA systems employ and layer multiple modalities, both novel and traditional. A multimodal or layered biometric security system may provide a suitably low composite FAR or a tiered FAR progression (from high to minimal), even if some of the specific modalities involved demonstrate non-ideal FARs.
2.3.1.1. Performance Factors for Continuous Authentication
Ahmed and Traoré suggest considering following factors with respect to CA performance metrics:
Attributes – Attributes describe the anatomical, physiological, behavioral, or cognitive characteristics selected for analysis and employed in user identification.23
Activity Recognition / Activity Identification – Initially, a CA system must be capable of
detecting particular user activities (e.g. gait) or signals (e.g. pulse) and distinguishing key attributes from among a collection of user characteristics.24 Hardware-based factors, such as sensor number and placement, can play a key factor in activity recognition. Metrics that represent the probability of detection (Pd) speak to activity recognition performance.25
State Classification – State classification may be broadly applied to describe a user’s behavioral
or cognitive state (e.g. neural pattern categorization).26
Interaction Quotient (IQ) – IQ describe the percentage or ratio of user interaction with system sensors (such as a mouse or a keyboard) compared to the total amount of user-system interaction possible within an activity period.27
Interaction Type – User-system interaction for enrollment and monitoring may be described in
one of two ways:
o Active / Explicit – describes a scenario in which a user must deliberately perform a certain action or present a sample for capture in order to be enrolled in or monitored by the system; active user-system interactions may be disruptive to user workflow.
o Passive / Implicit – describes a scenario in which a user is enrolled in and discreetly
monitored by the system without any interruption to normal activities or procedures.
23 Derawi, Mohammad Omar, Davrondzhon Gafurov and Patrick Bours. “Towards Continuous Authentication Based on Gait Using Wearable Motion Recording Sensors,” IGI Global (2012). 24 Derawi, Mohammad Omar, Davrondzhon Gafurov and Patrick Bours. “Towards Continuous Authentication Based on Gait Using Wearable Motion Recording Sensors,” IGI Global (2012). 25 Gibson, Laurie, Jon Touryan, Anthony Ries, Kaleb McDowell, Hubert Cecotti, and Barry Giesbrecht. “Adaptive Integration and Optimization of Automated and Neural Processing Systems – Establishing Neural and Behavioral Benchmarks of Optimized Performance,” Army Research Laboratory, ARL-TR-6055 (July 2012). 26 Gibson, Laurie, Jon Touryan, Anthony Ries, Kaleb McDowell, Hubert Cecotti, and Barry Giesbrecht. “Adaptive Integration and Optimization of Automated and Neural Processing Systems – Establishing Neural and Behavioral Benchmarks of Optimized Performance,” Army Research Laboratory, ARL-TR-6055 (July 2012). 27 Jagadeesan, Harini and Michael S. Hsiao. “Continuous Authentication in Computers,” IGI Global (2012).
Biometrics Metrics Report
19
Permutations of interaction type include:28
o Active enrollment, active monitoring o Active enrollment, passive monitoring o Passive enrollment, active monitoring o Passive enrollment, passive monitoring
Monitoring Period / Activity Period – The monitoring or activity period describes the interval during which received data items are queued and then processed, generating an authentication confidence level which leads to an acceptance or rejection decision. The start and end points of an activity period are marked by an event, which is noted in terms of time and data-producing action(s). 29 Shorter verification periods ensure rapid decision-making and response time, limiting the window of opportunity available to system intruders.30
Monitoring Session Length – Monitoring session length describes the duration of time the
system requires to identify or recognize a user, measured either in terms of time (i.e., the length of a monitoring session) or data (i.e., the amount of data or action points collected during a monitoring session). Multiple factors contribute to monitoring session length: 31
o Time-to-Recognize (TTR) [Impostor Detection Time] – TTR describes the interval
between the commencement of unusual behavior and the collection of data/ensuing detection of unusual behavior by the system. 32
o Time-to-Alert [or Alarm] (TTA) / Time to Correct Rejection (TCR)33 - TTA describes
the duration of time the system requires to establish that a legitimate identity has been appropriated by a malicious user; the maximum length of time during which an imposter can escape detection, without being denied system access. TTA can be described with further specificity using the following metrics:
Mean Time-to-Alert (MTTA) Minimum Time-to-Alert (Min TTA) Maximum Time-to-Alert (Max TTA)
o Mean Time-to-Enroll (MTTE) – MTTE describes the mean time required to generate a
reference template for a user, including sample collection, sample processing, and template creation.
o Mean Time-to-Detect (MTD) – MTTD describe the mean time required to detect and
verify a user’s identity after the user has submitted a sample for authentication. MTTD
28 Traore, Issa and Ahmed Awad E. Ahmed. Continuous Authentication Using Biometrics: Data, Models, and Metrics (Hershey, PA: IGI Global, 2012), 6. 29 Ahmed, Ahmed Awad El Sayed. Security Monitoring through Human Computer Interaction Devices. Doctor of Philosophy, Department of Electrical & Computer Engineering, University of Victoria (2008). 30 Traore, Issa and Ahmed Awad E. Ahmed. Continuous Authentication Using Biometrics: Data, Models, and Metrics (Hershey, PA: IGI Global, 2012), 6. 31 Ahmed, Ahmed Awad El Sayed. Security Monitoring through Human Computer Interaction Devices. Doctor of Philosophy, Department of Electrical & Computer Engineering, University of Victoria (2008). 32 Bours, Patrick & Hafez Barghouthi. “Continuous Authentication using Biometric Keystroke Dynamics,” The Norwegian Information Security Conference (NISK) (2009). 33 Tsatsoulis, P. Daphne, Aaron Jaech, Robert Batie, and Marios Savvides. “Multimodal Biometric Hand-Off for Robust Unobtrusive Continuous Biometric Authentication.” IGI Global (2012).
Biometrics Metrics Report
20
accounts for the time needed to capture and process the biometric sample, create a template, compare the reference templates and generate a decision. 34
o Action Count – Action count describes the amount of data required to identify or
recognize a user; action count is used in count-base session length assessment models.
o Arrival Rate – Arrival rate describes the rate at which input data is received or processed.
Data or Signal Quality – CA systems are more functional as the presence of target data or
signals increase in robustness and availability.
CPU Usage – CPU usage describes the amount of time in which a central processing unit (CPU) is used to process data; in the case of CA systems, CPU usage qualifies the performance of repetitive data processing.
Latency – Latency describes a “silent” period in which no data items are generated by a data
source. Latency applies only to certain behavioral modalities, such as Keystroke (periods in which no typing occurs), Mouse Movement (periods in which no mouse movement occurs), and Eye Movement (periods in which the eyes are closed).35
Usability – In the context of CA systems, Usability has been used to describe the total duration of
time in which a legitimate system user is granted (and can maintain) system access in the course of normal operations.36
2.3.1.2. Accuracy Metrics for Continuous Authentication
Having considered the performance factors listed above, Ahmed and Traoré suggest the following CA performance metrics:37
Dynamic False Acceptance Rate (DFAR) – Derived from the traditional FAR, DFAR compares login sessions of a user against the reference profile of the certified user during each monitoring period. In the case of CA applications, acceptance or rejection decisions are based on all monitoring periods that occur during a login session, whereas, in traditional biometric schemes, acceptance or rejection decisions are made independently for each monitoring period.
Dynamic False Rejection Rate (DFRR) – DFRR compares the reference profile of the certified
user against each of the monitoring periods involved in one of his/her login sessions incrementally, starting with the first monitoring period in the sequence, and with the expectation that each incremental verification will result in an acceptance. At the time of the first rejection, the entire login session will be flagged as a false rejection.
Dynamic ROC curve– The Dynamic ROC curve conforms to the same shape as the traditional
ROC curve, but the represented values are 4-5 times higher; the shift in values occurs because it
34 Ahmed, Awad E. Ahmed. “Dynamic Sample Size Detection in Continuous Authentication using Sequential Sampling,” 27th Computer Security Applications Conference, pp. 169-176 (2011): https://www.acsac.org/2011/openconf/modules/request.php?module=oc_program&action=view.php&a=&id=132&type=2&OPENCONF=v0drs5418h1f2jsea8ui6d8891 35 Ahmed, Ahmed Awad El Sayed. Security Monitoring through Human Computer Interaction Devices. Doctor of Philosophy, Department of Electrical & Computer Engineering, University of Victoria (2008). 36 Tsatsoulis, P. Daphne, Aaron Jaech, Robert Batie, and Marios Savvides. “Multimodal Biometric Hand-Off for Robust Unobtrusive Continuous Biometric Authentication.” IGI Global (2012). 37 Ahmed, Ahmed Awad El Sayed. Security Monitoring through Human Computer Interaction Devices. Doctor of Philosophy, Department of Electrical & Computer Engineering, University of Victoria (2008).
Biometrics Metrics Report
21
is more difficult to achieve lower DFAR and DFRR, and harder to adjust the system for dynamic accuracy.
2.3.1.3. Session Length Metrics
Ahmed and Traoré propose two forms of session length metrics: time-based metrics and count-based metrics. 38
Time-Based Session Length Metric Models – Ahmed and Traoré propose four time-based session length metrics.
o Periodic Detection (Fixed Interval Detection) – In this model, detection occurs periodically at every fixed time interval of a specified length. When each interval concludes, data or signal information acquired within that time span is submitted for processing. In terms of utility, however, the Periodic Detection model fails to account for the quantity of data collected; as a result, a system relying on Periodic Detection may make recognition attempts using insufficient amount of data.
o Fixed Upon Data Availability – In this model, the CA system processes data only at the end of a monitoring period; monitoring periods are determined when latency periods reach certain threshold duration. The Fixed Upon Data Availability model proves beneficial for systems that require an entire session of observation and data collection in order to make a decision about user validity. The simplified decision basis enhances the utility of this model, but overall utility decreases for scenarios featuring activity periods of typically long duration.
o Maximum Activity Period Duration – In the Maximum Activity Period Duration model, the system undertakes detection activities each time the duration of a continuous data sequence reaches a specific threshold. This model guarantees that decisions are returned only after a sufficient amount of data has been collected and processed; the utility of this model consequently decreases for scenarios in which activity periods frequently lack adequate levels of data collection or signal observation.
o Combined Fixed Upon Data Availability & Maximum Activity Period Duration – This mixed approach combines two previously described detection models. Dual detection processes are triggered whenever a user’s duration of activity reaches a threshold limit, or when a latency period of specified length is observed.
Count-based Session Length Metric Models - Ahmed and Traoré propose three count-based
session length metrics: 39
o Fixed Count of Actions – In this model, the total number of actions serves as the only criterion. Detection activities commence each time the number of acquired actions or data points reaches a threshold. The Fixed Count of Actions model does not consider latency, however, making this method less useful in scenarios that feature long periods of latency.
o Fixed Count with Wait Time Restriction – This count-based model operates using total action count while also incorporating periods of latency by setting a maximum duration on wait time. The Fixed Count with Wait Time Restriction method makes decisions on
38 Ahmed, Ahmed Awad El Sayed. Security Monitoring through Human Computer Interaction Devices. Doctor of Philosophy, Department of Electrical & Computer Engineering, University of Victoria (2008). 39 Ahmed, Ahmed Awad El Sayed. Security Monitoring through Human Computer Interaction Devices. Doctor of Philosophy, Department of Electrical & Computer Engineering, University of Victoria (2008).
Biometrics Metrics Report
22
available data once wait time reaches a certain limit, thereby circumventing lengthy waiting periods.
o Fixed Count with Wait Time to Drop – In this model, collected data is not processed until (and unless) the count of actions reaches a specified threshold. The model guarantees data contingency but not allowing long latency periods within the processed data. This model will drop the data for intervals in which the data count fails to reach the threshold after a silence period of specified duration.
2.3.1.4. Other Metrics Relevant to Continuous Authentication
Certain novel physiological biometric modalities, such as Pulse, Electrocardiogram (ECG) and Electroencephalogram (EEG), have been highly developed in the medical field for use in diagnostic procedures and the continuous and remote monitoring of patient health. Because these systems are employed in critical patient-care, healthcare-derived biometric performance metrics focus heavily on assessing confidence in the accuracy of sensor data and signal transmission, sensor power consumption (ensuring sustainable and continuous function), and processing execution time (providing timely alerts to fluctuations in physiological signals). To-date, studies examining physiological biometrics for authentication purposes have typically relied on small subject pools and have only been capable of providing very general metrics to describe authentication accuracy. Medical biometric researchers operating in the healthcare field, however, focus strongly on measuring sensor performance, human factors, and ease of signal transmission. Commonly employed metrics include:
Confidence Metric – A confidence metric provides an evidence-based quantification of the truthfulness of recent and incoming sensor readings.40
Diagnostic Accuracy – Diagnostic accuracy describes the extent to which an obtained signal
provides correct, relevant and actionable health information that affects ongoing patient care. Diagnostic accuracy does not pertain directly to biometric authentication, but the specificity required to identify and extract accurate diagnostic physiological signals is also likely to be required in providing accurate user identification.
Energy Consumption – Large range of metrics used to describe the energy consumption of
sensors and overall systems (system energy consumption typically measured in CPU).
Human factors metrics – Human factors metrics describe the extent to which a physiological biometric sensor is wearable/non-invasive, portable (i.e. no power cord required and capable of wireless data transmission)
2.3.2 Performance Metrics for Non-Cooperative Biometrics (NCB)
Non-cooperative biometric (NCB) systems serve as strong examples of novel applications for existing modalities such as Iris and Face recognition. NCB systems conduct remote or “stand-off” biometric data collection, obviating the need for overt and cooperative user-system interaction, while also enabling covert monitoring and identification capabilities in uncontrolled or partially-controlled environments. NCB systems may be deployed to monitor individuals passing through an airport terminal, for instance, or to monitor personnel working outside of a forward operating base. Due to the surreptitious nature of the application type, NCB collection conditions are typically suboptimal, resulting in lower-quality images than are typically acquired through cooperative biometric applications.
40 Shin, Minho. “Confidence Metric in Critical Systems,” Myongji University (2012) <http://onlinepresent.org/proceedings/vol5_2012/29.pdf>
Biometrics Metrics Report
23
These conditions may include capture from a distance, at an angle, or with moving subjects. NCB operational strains are produced by several collection-based and behavior-based factors.41
2.3.2.1. Collection-based NCB Performance Variables
Distance – Images or signals acquired via standoff, at-a-distance capture techniques are often characterized by decreased image resolution and lower signal quality than is typically found in cooperative biometric systems. Low quality data provides the NCB system with less information to use in matching and decision-making processes. Distance can also contribute to sensor impairment by producing out-of-focus blur (in the case of image-based modalities) or distortion (in the case of physiological signal-based modalities such as Pulse).
Illumination – The degree of illumination or ambient lighting present in the capture environment varies
over distances, by source (natural or artificial light), by time of day, and based on weather conditions (sunny or clouded skies). The quality of illumination, the positions of illumination sources, and the consistency of illumination during and between captures potentially detract from ideal conditions and negatively impact NCB performance.
Multiple Data Sources – NCB systems are capable of capturing data from multiple users present
within a sensor’s collection range (e.g. multiple faces may appear within a captured image). In the presence of multiple data sources, an NCB system requires greater computational resources to detect, isolate, and process target data.
2.3.2.2. Behavior-based NCB Performance Variables
User Orientation and Pose – NCB systems must account for highly-varied user orientations and poses; angles-of-capture can decrease biometric detection, impair acquisition, and thereby decrease identification rates.
Movement - User movement or activity during capture produces motion blur in acquired images, and
can also detract from the quality of physiological biometric signals such as Pulse. Occlusion – Occlusion or signal interference factors can be produced by user limbs, hair, clothing,
accessories, or environmental objects between the user and the sensor (e.g. a lamppost).
Given the specialized application context, NCB performance evaluations incorporate the NCB-specific performance variables, listed above, into evaluation frameworks that employ traditional biometric performance metrics such as FTA, DET curves, FMR, and FNMR.
2.3.3 Emerging Performance Metrics for Intent Detection
Intent detection constitutes another strong example of a novel application for existing and emerging biometric modalities. Intent detection applications may be deployed in a range of environments, from crowded stadiums to border checkpoints to individual work stations. Intent detection schemes employ a variety of sensors to collect physiological, anatomical and behavioral information that is used to measure and assess the natural signals emitted by an observed individual; intent detection systems aim to identify unusual behavior (or anomalous individuals), and anticipate and prevent acts of violence or sabotage.42
41 IBG, “Iris and Face Recognition Algorithm Evaluation using Non-Cooperative Images,” (2011). 42 Bournstein, Ann, Thyagaraju Damarla, John Lavery, Frank Morelli, & Elmar Schmeisser. “Remote Detection of Covert Tactical Adversarial Intent of Individuals in Asymmetric Operations,” Army Research Laboratory (ARL), ARL-SR-197 (April 2010) <http://www.arl.army.mil/www/pages/185/ARL-SR-197_2010_04_15_final.pdf>
Biometrics Metrics Report
24
Several modalities can currently be leveraged by intent detection systems, which assess a user’s expression (Face recognition), heart rate (Pulse, ECG), respiration (Pulse, ECG), gaze and attention fixation (Eye Movement), temperature (Skin Thermography), posture (Anthropometry), and activity (EEG, Keystroke, Mouse Movement, Muscle Movement, Anthropometry, and Gait). At this time, no formalized performance metrics have been established for broad, multimodal intent detection systems. Ann Bournstein and fellow Army Research Lab (ARL) researchers have suggested that any metrics for assessing intent detection should be rooted in cognitive, psychological, neurophysiological, and/or kinesiological principles. The group discourages the use of ad hoc or heuristic metrics, stressing the need for intent-based metrics to accurately distinguish between normal and anomalous behavior.43
2.3.4 Emerging Performance Metrics for Liveness Detection in Biometric Systems
Liveness detection-enabled biometric systems incorporate anti-spoofing methods into traditional biometric systems in order to validate a) whether or not captured biometric data has been presented by a living individual, and b) whether a captured biometric has been altered in any way that might affect identification (i.e. whether a suspicious “artifact” is present that could indicate a fake finger, false skin, patterned contact lenses, dead tissue, etc.). Liveness detection systems often incorporate physiological sensors that gauge a user’s skin resistance, temperature, pulse oximetry, and ECG signals.44 Stephanie Shuckers, Arun Ross, and several additional researches associated with Clarkson University, West Virginia University, and NIST have developed a set of performance metrics for biometric systems that incorporate liveness detection. Liveness detection systems are premised on four occurrences: 45
Suspicious Presentation Detection – Occurs when a liveness detection system recognizes
suspicious characteristics in captured data
Non-Suspicious Presentation Detection – Occurs when a liveness detection system determines that captured characteristics are normative
Artifact Detection – Occurs when the liveness detection system determines that a presentation
characteristic in captured data is an artifact (i.e. likely to be a false or altered biometric; the term artifact may also be used to describe general white noise produced during capture by environmental or user factors such as clothing, hair, topical applications, coughing, etc.46).
Non-Artifact Detection – Occurs when the liveness detection system indicates that the
presentation characteristic in captured data is not an artifact (i.e. a genuine biometric from a live individual).
43 Bournstein, Ann, Thyagaraju Damarla, John Lavery, Frank Morelli, & Elmar Schmeisser. “Remote Detection of Covert Tactical Adversarial Intent of Individuals in Asymmetric Operations,” Army Research Laboratory (ARL), ARL-SR-197 (April 2010) <http://www.arl.army.mil/www/pages/185/ARL-SR-197_2010_04_15_final.pdf> 44 Shuckers, Stephanie, Lawrence Hornak, & Bozhao Tan. Regional Fingerprint Liveness Detection Systems and Methods. U.S. Patent 8,098,906 B2, filed October 10, 2007 and issued January 17, 2012. <http://www.google.com/patents?hl=en&lr=&vid=USPAT8098906&id=iTEBAgAAEBAJ&oi=fnd&dq=liveness+stephanie+shuckers&printsec=abstract#v=onepage&q=liveness%20stephanie%20shuckers&f=false> 45 Johnson, Peter, Richard Lazarick, Emanuela Marasco, Elaine Newton, Arun Ross, & Stephanie Shuckers. Presentation: Biometric Liveness Detection – Framework & Metrics. International Biometric Performance Conference (IBPC) (March 2012). 46 Revett, Kenneth. “Cognitive Biometrics: A Novel Approach to Continuous Person Authentication,” IGI Global (2012).

Biometrics Metrics Report
25
Performance error metrics for liveness detection-enabled biometric systems include FTA, FTE, FRR, and FAR, as well as four application-specific metrics: 47
False Non-Suspicious Presentation Detection (FNSPD) – Occurs when a liveness detection system classifies a suspicious biometric presentation as non-suspicious
False Suspicious Presentation Detection (FSPD) – Occurs when a liveness detection system
flags a non-suspicious biometric presentation as suspicious
False Artifact Detection Rate (FADR) – Describes the proportion of non-artifact presentations erroneously flagged as artifacts
False Non-Artifact Detection Rate (FNDR) - Describes the proportion of artifact presentations erroneously classified as non-artifacts
47 Johnson, Peter, Richard Lazarick, Emanuela Marasco, Elaine Newton, Arun Ross, & Stephanie Shuckers. Presentation: Biometric Liveness Detection – Framework & Metrics. International Biometric Performance Conference (IBPC) (March 2012).
Biometrics Metrics Report
26
3 Novel Metrics Definition
3.1 Active Authentication Performance Factors
3.1.1 Acquisition Metrics
Acquisition metrics can be viewed as the foundational subset of performance metrics for novel biometric systems. Biometrics measure anatomical, physiological, behavioral, and cognitive traits for identification and authentication applications. Biometric systems acquire a presented trait and compare the trait to a stored biometric template for the purpose of identification (1:N matching) or verification (1:1 matching). Novel biometrics for Active Authentication (AA) rely heavily on a system’s ability to successfully capture dynamic physiological, behavioral and cognitive traits, thus changing the understanding of traditional data acquisition and subsequent template formation. In the context of AA systems, acquisition describes the process of detecting an individual’s biometric signals or characteristics and capturing data samples from the individual via a sensor (mechanical data capture).48 AA systems need to identify, with a high degree of confidence, the complete physiological or behavioral biometric signal that will be used for template creation and authentication, ensuring that data of sufficient quantity and quality is acquired to create a user profile. Acquisition metrics for novel biometric systems include failure to acquire (FTA) and failure at source rate. Interaction quotient (IQ) and the amount of time required for successful acquisition also impact AA system performance and usability.
3.1.1.1. Failure to Acquire (FTA)
3.1.1.1.1. Metric definition
FTA describes the proportion (or weighted proportion) of recognition attempts in which a system fails to detect or acquire a biometric image or signal of adequate quality. Failures in detection and acquisition can relate to user presentation, sample segmentation, feature extraction, or quality control issues. FTA incidence depends on several factors, including: the established thresholds for sample quality, the duration of time allowed for sample acquisition, and the permitted number of user presentation attempts.
3.1.1.1.2. Relevance to AA performance
AA applications rely heavily on behavioral and physiological traits that can potentially compromise acquisition on both the user-level and system-level. In traditional, anatomically-based biometric systems, user-based FTA often relates to user errors during presentation. In AA systems, explicit user presentation is not required, therefore minimizing the likelihood of FTA caused by deliberate or inadvertent user error. However, humans do experience shifts in intrinsic processes which are reflected in variations in physiological or behavioral signals; such shifts (caused by illness, fatigue, emotion, and many other factors) may compromise signal detection, thereby causing FTA. Furthermore, AA system users may exhibit periods of inactivity or “latency” during the course of an access session. Latency is relevant to task-specific behavioral biometric modalities (physiological modalities such as Pulse and EEG are persistently emitted). For example, if an AA system relies on keystroke dynamics and a user is reading a document instead of typing, there
48 Executive Office of the President of the United States, National Science and Technology Council. Committee on Technology. Committee on Homeland and National Security. Subcommittee on Biometrics. (2006). Biometrics Glossary. Retrieved from website: http://biometrics.gov/Documents/Glossary.pdfAccessed 10 Oct 2012.
Biometrics Metrics Report
27
may be a long period of inactivity during which the system does not receive any biometric data with which to authenticate the user. Latency can be viewed as a primary cause for FTA in behavioral-based AA systems, but, as a natural occurrence, latency should be accounted for in any AA system design. Sampling segmentation during an activity session should be flexible and based on a range of potential user activities, with monitoring and acquisition processes activated if and when a user presents biometric data. If activity periods are too short in duration, a sufficient number or degree of behavioral and physiological attributes that actively identify a user may not be acquired. If activity periods are too long, however, an abundance of behavioral and physiological signals can be captured that do not clearly reflect a user’s normative biometric template (possibly leading to false rejection).
System-level FTA can be understood more specifically by examining the Failure at Source Rate metric.
3.1.1.2. Failure at Source Rate
3.1.1.2.1. Metric definition
The failure at source rate describes the proportion of biometric samples that are discarded by a system (manually or via automated means) when a system fails to capture target data (e.g. no faces in a picture) or in the event of inadequate sample quality (e.g. substantial face blurring).
3.1.1.2.2. Relevance to AA performance
In AA systems, failure at source can occur for several reasons. A system may fail to capture target data if a user moves outside a sensor’s collection range (e.g. such as getting up from a desk to walk to an office printer). Inadequate data may also result from signal interference or degradation caused by environmental factors (e.g. noise from nearby office equipment). Intrinsic user factors such as stress, fatigue, and illness may also impair signal quality or acquisition, particularly if system sensors are not robust enough to detect and capture signals in non-ideal circumstances and environments.
3.1.1.3. Acquisition Business Case and Additional Metrics Specific to AA
Because many AA modalities are task-specific and susceptible to a wide range of user physiology and/or behavior, many common computer and work-related activities may not persistently generate useful biometric data that can be acquired at all times. A system that relies on layering multiple sensors will capture a wider range of data and decrease FTA and failure at source rates. Biometric data sample segmentation must also be calibrated accurately to include all usable user features for authentication so that acquired data satisfies quality requirements for authentication. Acquisition performance in AA systems may be determined by assessing interaction quotient and time to acquire.
3.1.1.3.1. Interaction Quotient (IQ)
The interaction quotient (IQ) describes the percentage or ratio of user interaction with input-device sensors (such as a mouse, keyboard, or computer), compared to the total amount of user-system interaction possible within an activity period. For instance, keystroke-based IQ describes the percentage of user typing that occurs during an activity period.49 IQ offers particular value if user activities are mixed or vary over time (e.g. a typical computer user engages in a number of activities, spending type typing, reading, scrolling, etc.).
49 Jagadeesan, Harini and Michael S. Hsiao. “Continuous Authentication in Computers,” IGI Global (2012).
Biometrics Metrics Report
28
An AA system must determine how much user interaction, if any, is necessary in order to acquire a sufficient amount of data for authentication. For instance, in the case of behavioral biometrics registered using input devices, a user might be required to provide a certain degree of data within a given timeframe (e.g., spend two minutes out of every 10 typing). In cognitive modalities, a user might be required to produce certain cognitive loads within a specified timeframe (e.g. compose 1 page of text per hour). For physiological modalities, a user might be required to wear or remain in contact with a sensor (e.g. wear a pulse sensor attached to an earlobe). Latency must additionally be considered alongside the IQ metric. AA system architecture should leverage multiple modalities and multiple sensors to register a sufficiently large percentage of user-system interaction, thereby decreasing the likelihood of FTA and FSR while increasing the likelihood of detecting unauthorized use. In addition to IQ, time to acquire also affects the implementation of acquisition processes in AA systems.
3.1.1.3.2. Time to Acquire
The time to acquire metric describes the duration of time that a biometric system requires to detect and acquire a sufficient amount and quality of data with which to create a biometric template or profile. In biometric systems featuring traditional modalities, time to acquire has been reduced to a matter of seconds; near-instantaneous acquisition is an expected capability of currently available systems. With respect to novel biometric systems, time to acquire most directly relates to the concept of session length metrics suggested by Ahmed and Traoré. Ahmed and Traoré propose two forms of session length metrics: time-based metrics and count-based metrics.50 AA systems attempt to acquire data throughout a user’s activity session. Time to acquire must be factored into overall system design and implementation, taking into consideration data availability, the amount of data required to establish a novel biometric template, and the amount of data required to reliably compare user signals against a novel biometric template. Time to acquire directly affects AA system performance rates. A system that relies on long acquisition durations is likely to record a larger number of signal changes (stemming from natural shifts in user behavior and physiology); an increased number of recorded changes degrades confidence levels and increases the likelihood of non-matches during subsequent authentication stages. Conversely, short monitoring and acquisition periods may fail to capture sufficient data necessary to uniquely identify a user.
3.1.2 Enrollment Metrics
In the context of Active Authentication (AA) systems, enrollment describes the back-end system processing in which a successfully acquired biometric sample is converted into a basic user template that is then stored in the system database for subsequent augmentation and use in authentication processes.51 Feature selection, data conversion, template formation, and template storage must be successfully completed in order to properly enroll an individual into a biometric system. Errors that occur during any of stage of enrollment can lead to failures to enroll, a performance metric measured by failure to enroll rate.
50 Ahmed, Ahmed Awad El Sayed. Security Monitoring through Human Computer Interaction Devices. Doctor of Philosophy, Department of Electrical & Computer Engineering, University of Victoria (2008). 51 Executive Office of the President of the United States, National Science and Technology Council. Committee on Technology. Committee on Homeland and National Security. Subcommittee on Biometrics. (2006). Biometrics Glossary. Retrieved from website: http://biometrics.gov/Documents/Glossary.pdf Accessed 10 Oct 2012
Biometrics Metrics Report
29
3.1.2.1. Failure at Enroll (FTE)
3.1.2.1.1. Metric definition
The failure to enroll rate (FTE) describes the proportion of enrollment transactions in which zero subjects successfully enroll into a biometric system. FTE can apply to single-transaction/single feature enrollment or to the multi-transaction enrollment of several biometric features (e.g. establishing templates for each finger in a fingerprint-based system, or establishing templates for different cognitive responses to a task in a cognitive biometric system). Acquisition performance factors such as acquired data sample quality and user-system interaction also influence FTE.
3.1.2.1.2. Relevance to AA performance
In AA systems, enrollment may be complicated by the complex and nuanced nature of physiological and behavioral biometric features and signals. Behavioral and physiological features and signals are expected to remain relatively constant over time; however, natural nuances and shifts often occur in a user’s behavior and/or physiology that do not reflect the user’s primary state of being. In the context of novel biometric systems, the occurrence of natural shifts in user behavior and/or physiology is referred to as user variance.
3.1.2.2. Enrollment Business Case and Additional Metrics Specific to AA
Variance constitutes a key factor in the enrollment and training performance of AA systems. In traditional biometric systems, variance describes the measure of the statistical distribution (how far a set of numbers is spread out), showing how close an estimated result is likely to be to genuine result’s true value. In the context of AA systems, variance broadly describes natural changes or shifts in a user’s physiological, behavioral and/or cognitive state during periods of user activity, all of which must be accounted for during the creation of user template profiles. Variance constitutes a dynamic evolution process for each user that continues to evolve and change over time. Physiological variance in biometric modalities often stems from factors such as a user’s age, health status, and internal equilibrium. Behavioral biometric variance may stem from a user’s emotional state and induced environmental conditions, while cognitive biometric variance stems from a user’s degree of knowledge, understanding, and familiarity with a given task and can evolve over time as a result of training and operational experience. Variance impacts the uniqueness of an AA biometric, i.e. the ability of a biometric to differentiate with certainty between users, as well as the overall permanence of a biometric, i.e. the ability of a system to identify a user over an extended period of time.52 The process of accounting for variance in AA systems can have a significant impact on matching performance (FAR, FRR) and also has key relevance to Alerts (for further information on Alerts, see Section 3.1.6). Data input complexity caused by user variance specifically affects several stages of enrollment, starting with feature selection. Feature selection describes the process of determining what features or attributes a system extracts from a user’s biometric data and stores within a database for future use in matching processes. A biometric system must extract an adequate number of biometric features from acquired data, using a sufficient degree of detail granularity which may vary depending on the composition of the feature in question. The degree of feature granularity established in a template during enrollment directly impacts template construction, specifically with respect to template size. On one hand, larger templates that include
52 Bours, Patrick. “Continuous keystroke dynamics: A different perspective towards biometric evaluation,” Elsevier, Information Security Technical Report 17, pp. 36 – 43 (2012).
Biometrics Metrics Report
30
numerous features in high degrees of detail will provide a more accurate basis for establishing user identity; detailed enrollment templates will identify users more precisely and offer a system a greater degree of robustness in the event of circumvention and spoofing. On the other hand, larger, more detailed templates typically require additional processing time and data storage resources, which may significantly slow or strain AA system and operating system (OS) operations, thereby impairing overall system utility and performance. Furthermore, enrollment processes in AA systems must determine how to accurately and efficiently translate selected features into a user template that will remain unique to a user over time. A need exists for a modality-specific framework of processing algorithms that precisely and accurately extract and translate features into user templates. For example, in the case of behavioral modalities, behavioral shifts may not be a linear process occurring at specific intervals during acquisition; during enrollment, the AA system will need to extract unique behavioral features from acquired data, weight the relevance of those behavioral features to the specified user, and disregard additional, non-pertinent data. Complex enrollment processes and calculations risk becoming time and resource intensive. Consequently, AA system performance may also be assessed with respect to enrollment duration.
3.1.2.2.1. Enrollment Transaction Duration / Mean Time to Enroll (MTTE)
Enrollment transaction duration describes the length of time required for a biometric system to create templates for all user positions. Enrollment transaction duration varies depending on the data input requirement and operational time constraints of a given biometric application.
In traditional biometric systems based on anatomical modalities, the enrollment process typically yields a continuously relevant user template, primarily because anatomical modalities tend to resist change over time. In AA systems, user features and modalities naturally evolve and fluctuate over time. AA enrollment constitutes an initial stage that provides a baseline for identification; during enrollment, there is no guarantee that the resulting biometric template reflects a single, continuously relevant user baseline. Consequently, a need exists for initial enrollment templates to be enhanced in order to account for the dynamic nature of AA modalities and ensure that a user template reflects the full range of normative variation in genuine user behavior. This enhancement of an initial user template can be accomplished through Training.
3.1.3 Training Metrics
In the context of traditional biometric deployments, the term “training” typically describes the learning period of the user population and the process of instructing users how to interact correctly and efficiently with a biometric system.
3.1.3.1. Training Business Case and Additional Metrics Specific to AA
In contrast to traditional biometrics, Active Authentication (AA) applications intend to be accessible to all users without requiring any specific instruction or user acclimation period. Consequently, with respect to AA systems, the term training may instead describe the learning period of the biometric system - specifically, the process by which an AA system gathers sufficient data for the augmentation of initially enrolled user templates, so that user profiles account for normative degrees of variance in user physiology and behavior. AA training can be considered as the user modeling period that follows enrollment and the creation of an initial user template. AA training can also be considered as a consolidation of multiple enrollment templates that represent a broader, more dynamic user profile. Training in AA systems describes the type, quantity, and degree of input that a system requires in order to establish an operable user profile that encompasses an expected range of deviation in a user’s activities and behaviors. While current research does not employ specific metrics for gauging training performance, measurements of time and data input help delineate system performance during training.
Biometrics Metrics Report
31
3.1.3.1.1. Time to Train
Time to train is the duration of time required to establish a functional user profile, as described by activity period and/or session duration (measured in minutes, hours, etc.), as well as the duration of inactivity between training activity periods and/or sessions (measured in minutes, hours, days, weeks, months, etc.), during which user profiles may naturally shift or evolve.
3.1.3.1.2. Data Input Requirement
The data input requirement describes the minimum amount of captured data necessary to establish a functional user profile (e.g., designating the minimum number of keystrokes needed to establish a user template based on keystroke modality).
In order to conduct successful system training, AA systems must determine how to account for user variation during activity periods and throughout activity sessions. Several components contribute to time to train and the data input requirement:
Determining the normative degree of change in user behavior or physiology likely to be exhibited during an activity period and/or session
Determining the acceptable minimum and maximum number of changes in physiology or behavior which may occur during an activity period and/or session
Determining the frequency of variation during an activity period and/or session – a normal duration between changes may exist, while changes that occur too frequently or too infrequently may signal unnatural or erratic behavior
Determining how long an enrollment template or training profile remains valid; how often must training be repeated in order to maintain a calibrated user profile over a period of months or years?
Ideally, training will assert a maximally effective balance between profile flexibility and overall system security. As profile flexibility in accounting for user variation increases, the profile becomes less specific and distinguishes a user less precisely; this increases the likelihood for adversarial circumvention (specifically increasing FAR and system susceptibility to spoofing). As profile flexibility decreases, the odds of a system not recognizing an authorized user grow (increasing the likelihood of FRR and user frustration, while limiting the work productivity of a user). All AA systems intend to operate passively during the monitoring and authentication phases, but some may require active, explicit user participation during training in order for the system to learn how recognize a user (e.g. a user completing a fixed-text entry task to provide a baseline for keystroke recognition). Certain modalities and system configurations may enable passive training to be conducted during a user’s normal work routine, without any interruptions or imposed tasks (e.g. pulse monitoring, or a keystroke system operating on a basis of free-text entry). However, passive training may require additional time or data input in order to establish a robust user profile.
The active or passive nature of training has several impacts on system performance. For instance, an active training phase may create additional workload for a user, as can be gauged by:
The number of required training activity periods and/or training sessions The duration of training activity period(s) and/or training session(s) The minimum data input requirement of each activity period and/or training session
The required frequency of training also impacts overall system performance and usability. With the exception of illness or injury, traditional anatomical biometric modalities remain largely constant throughout large portions of a user’s lifetime. Physiological and behavioral modalities, however, may vary
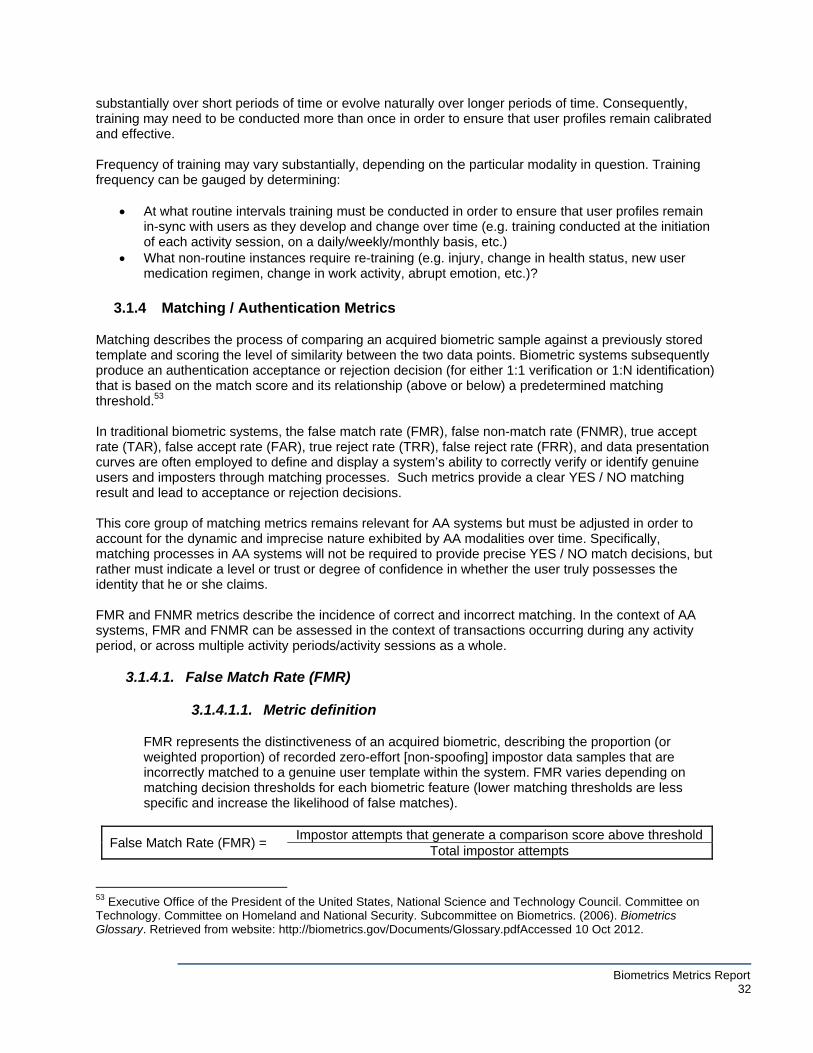
Biometrics Metrics Report
32
substantially over short periods of time or evolve naturally over longer periods of time. Consequently, training may need to be conducted more than once in order to ensure that user profiles remain calibrated and effective. Frequency of training may vary substantially, depending on the particular modality in question. Training frequency can be gauged by determining:
At what routine intervals training must be conducted in order to ensure that user profiles remain in-sync with users as they develop and change over time (e.g. training conducted at the initiation of each activity session, on a daily/weekly/monthly basis, etc.)
What non-routine instances require re-training (e.g. injury, change in health status, new user medication regimen, change in work activity, abrupt emotion, etc.)?
3.1.4 Matching / Authentication Metrics
Matching describes the process of comparing an acquired biometric sample against a previously stored template and scoring the level of similarity between the two data points. Biometric systems subsequently produce an authentication acceptance or rejection decision (for either 1:1 verification or 1:N identification) that is based on the match score and its relationship (above or below) a predetermined matching threshold.53 In traditional biometric systems, the false match rate (FMR), false non-match rate (FNMR), true accept rate (TAR), false accept rate (FAR), true reject rate (TRR), false reject rate (FRR), and data presentation curves are often employed to define and display a system’s ability to correctly verify or identify genuine users and imposters through matching processes. Such metrics provide a clear YES / NO matching result and lead to acceptance or rejection decisions. This core group of matching metrics remains relevant for AA systems but must be adjusted in order to account for the dynamic and imprecise nature exhibited by AA modalities over time. Specifically, matching processes in AA systems will not be required to provide precise YES / NO match decisions, but rather must indicate a level or trust or degree of confidence in whether the user truly possesses the identity that he or she claims. FMR and FNMR metrics describe the incidence of correct and incorrect matching. In the context of AA systems, FMR and FNMR can be assessed in the context of transactions occurring during any activity period, or across multiple activity periods/activity sessions as a whole.
3.1.4.1. False Match Rate (FMR)
3.1.4.1.1. Metric definition
FMR represents the distinctiveness of an acquired biometric, describing the proportion (or weighted proportion) of recorded zero-effort [non-spoofing] impostor data samples that are incorrectly matched to a genuine user template within the system. FMR varies depending on matching decision thresholds for each biometric feature (lower matching thresholds are less specific and increase the likelihood of false matches).
False Match Rate (FMR) = Impostor attempts that generate a comparison score above threshold
Total impostor attempts
53 Executive Office of the President of the United States, National Science and Technology Council. Committee on Technology. Committee on Homeland and National Security. Subcommittee on Biometrics. (2006). Biometrics Glossary. Retrieved from website: http://biometrics.gov/Documents/Glossary.pdfAccessed 10 Oct 2012.
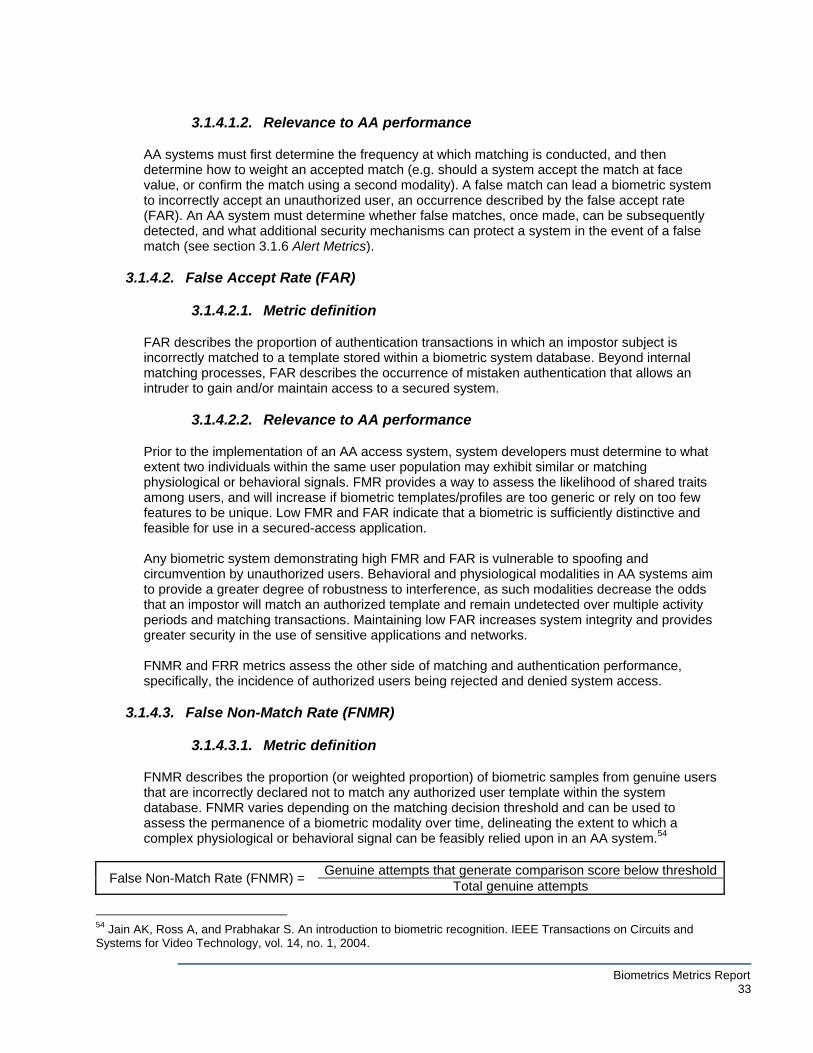
Biometrics Metrics Report
33
3.1.4.1.2. Relevance to AA performance
AA systems must first determine the frequency at which matching is conducted, and then determine how to weight an accepted match (e.g. should a system accept the match at face value, or confirm the match using a second modality). A false match can lead a biometric system to incorrectly accept an unauthorized user, an occurrence described by the false accept rate (FAR). An AA system must determine whether false matches, once made, can be subsequently detected, and what additional security mechanisms can protect a system in the event of a false match (see section 3.1.6 Alert Metrics).
3.1.4.2. False Accept Rate (FAR)
3.1.4.2.1. Metric definition
FAR describes the proportion of authentication transactions in which an impostor subject is incorrectly matched to a template stored within a biometric system database. Beyond internal matching processes, FAR describes the occurrence of mistaken authentication that allows an intruder to gain and/or maintain access to a secured system.
3.1.4.2.2. Relevance to AA performance
Prior to the implementation of an AA access system, system developers must determine to what extent two individuals within the same user population may exhibit similar or matching physiological or behavioral signals. FMR provides a way to assess the likelihood of shared traits among users, and will increase if biometric templates/profiles are too generic or rely on too few features to be unique. Low FMR and FAR indicate that a biometric is sufficiently distinctive and feasible for use in a secured-access application. Any biometric system demonstrating high FMR and FAR is vulnerable to spoofing and circumvention by unauthorized users. Behavioral and physiological modalities in AA systems aim to provide a greater degree of robustness to interference, as such modalities decrease the odds that an impostor will match an authorized template and remain undetected over multiple activity periods and matching transactions. Maintaining low FAR increases system integrity and provides greater security in the use of sensitive applications and networks. FNMR and FRR metrics assess the other side of matching and authentication performance, specifically, the incidence of authorized users being rejected and denied system access.
3.1.4.3. False Non-Match Rate (FNMR)
3.1.4.3.1. Metric definition
FNMR describes the proportion (or weighted proportion) of biometric samples from genuine users that are incorrectly declared not to match any authorized user template within the system database. FNMR varies depending on the matching decision threshold and can be used to assess the permanence of a biometric modality over time, delineating the extent to which a complex physiological or behavioral signal can be feasibly relied upon in an AA system.54
False Non-Match Rate (FNMR) = Genuine attempts that generate comparison score below threshold
Total genuine attempts
54 Jain AK, Ross A, and Prabhakar S. An introduction to biometric recognition. IEEE Transactions on Circuits and Systems for Video Technology, vol. 14, no. 1, 2004.
Biometrics Metrics Report
34
3.1.4.3.2. Relevance to AA performance
A false non-match can lead, immediately or eventually, to a false rejection, an occurrence described by the False Rejection Rate. An AA system must determine whether rejection occurs immediately, or if subsequent methods of authentication are brought online (e.g. a secondary modality). The implications of FNMR and false rejection in AA systems will be further discussed in section 3.1.6 Alert Metrics.
3.1.4.4. False Reject Rate (FRR)
3.1.4.4.1. Metric definition
FRR describes the proportion of authentication transactions in which a genuine user is incorrectly rejected and denied access from a system. FRR occurs after a false non-match. The FRR metric measures a system’s inability to correctly verify or identify legitimate users.
3.1.4.4.2. Relevance to AA performance
In AA systems, FNMR implicitly reflects the quality of acquisition, enrollment, and training processes, gauging whether a biometric system can accommodate an authorized user exhibiting a normal variation in physiological or behavioral signals over time. Several factors can limit an AA system’s ability to match a genuine user to a stored biometric template or profile. The user data acquired by a sensor at a given point in time might not successfully or closely match a stored template due to FTA, FSR, or poor signal quality. Internally, a nuanced biometric template may become degraded or corrupted during biometric data storage and recall processes. FNMR may also occur when a legitimate user demonstrates physiology or behavior that is not recorded in enrollment templates or user profiles, or if a template comprised of inadequate features does not fully describe a user’s normative range of activity. A high FNMR will negatively impact business processes by increasing FRR and preventing legitimate users access to critical systems.
3.1.4.5. Data Presentation Curves
Matching and authentication performance metrics are used to understand system capabilities and determine what types of AA systems best meet the requirements of a given use case. Three types of data presentation curves can be used to describe and model the matching and authentication performance of novel biometric systems.
3.1.4.5.1. Receiver Operating Characteristic (ROC) Curve
A ROC curve plots FAR (accepted impostor attempts) along the x-axis against the corresponding rate of true positives (genuine attempts accepted) on the y-axis; points are plotted parametrically as a function of the decision threshold.
3.1.4.5.2. Detection Error Tradeoff (DET) Curve
A DET curve is a modified ROC curve that plots error rates across a range of operating points on both axes (false positives are recorded on the x-axis and false negatives are recorded on the y-axis); accuracy improves as one moves leftward and downward on the graph.
3.1.4.5.3. Cumulative Match Characteristic (CMC) Curve
A CMC curve graphically represents the results of an identification task test by plotting rank values on the x-axis and the probability of correct identification at or below that rank on the y-axis.
Biometrics Metrics Report
35
3.1.4.5.4. Relevance to AA performance
The ROC Curve and the DET Curve illustrate the relationship between an impostor’s ability to gain access to a secured system and a legitimate user’s ability to gain access to the system. The CMC curve measures the probability that a biometric system will identify an individual in a 1:N operational mode. Understanding and visualizing the relationship between impostor access and legitimate user access enables system developers and end users to refine matching thresholds and determine the security administration decision-making processes. Data curves represent combinations of performance metrics and may help clarify which modalities render better results in certain circumstances and applications, thereby contributing to the refinement of biometric system configuration and assessment methodology in order to ensure that deployed systems perform at optimum levels.
3.1.4.6. Business Case for AA
Matching may constitute one of the most difficult performance areas for AA systems. A successfully implemented match will be determined by the quality of acquired biometric template and how the user’s current physiological or behavioral features match the user’s enrolled template(s). At certain points during continuous authentication, physiological or behavioral signals will match well with stored templates. At other points, user signals may deviate substantially from stored templates, depending on the user’s internal state, external context, and how the user’s unique biometric signatures have naturally evolved and fluctuated over time. As a result, precise matches may not always be likely, or a realistic expectation of AA systems; rather, a degree of confidence result may be a more reasonable and useful output of AA authentication systems.
3.1.5 Classification Metrics
Classification refers to a high-level, generalized method of asserting user identity based on a limited number of user attributes or characteristics. Classification or “binning” often constitutes a part of traditional, single-transaction authentication processes, in which user profile templates are organized within a database according to select primary features. Databases with organized profiles enable the system to rapidly eliminate obvious non-matches during the authentication process, thereby enhancing processing speed.55
3.1.5.1. Classification Business Case and Additional Metrics Specific to AA
Due to the dynamic nature of AA systems, classification-based metrics may offer greater relevance to AA performance assessments than traditional identification-oriented metrics, particularly during the early stages of AA development. Classification and confidence metrics may prove more useful in accounting for normative variance in user physiology and behavior; however, classification methods provide less assurance and accuracy than identification processes. Two general classification types are relevant to AA systems:
User / Intruder – This classification type categorizes individuals as either genuine, authorized
users or non-authorized intruders. This classification type is integral to AA systems that seek to prevent system spoofing and hijacking.
Normal User / Abnormal User – This classification type categorizes individuals as normal, i.e.
operating consistently within established normative physiological or behavioral thresholds
55 ISO/IEC JTC 1/SC 37 Biometrics. “Information Technology – Biometric Performance Testing and Reporting, Part 1: Principles and Framework,” N1243 (August 2005)
Biometrics Metrics Report
36
(thresholds may be user-specific or population-specific), or abnormal, i.e. operating erratically and outside typical thresholds. This classification type is relevant for detecting suspicious user intent, insider threats, and coerced system use (e.g. a third party compelling an authorized individual to access a system). The Normal / Abnormal User classification type may also provide data on user work performance, mental state / distress, and liveness detection.
Four classification performance metrics are relevant to Active Authentication:
Classification Accuracy or Correct Classification Rate (CCR) – CCR describes, very generally, the percentage of user profiles that have been correctly matched to normal, enrolled users. In the context of AA systems, CCR can be used to determine the accuracy of a system in categorizing individuals within User / Intruder or Normal / Abnormal classification types.
Confidence Intervals (CI) or Confidence Thresholds – Confidence intervals describe a lower
and upper range into which a stated physiological, behavioral or cognitive performance measurement may fall. An AA system’s designated CIs define the boundaries of normative physiology or behavior for a specific user; when user signals exceed set limits, a user may be classified as abnormal or as an intruder.
Confidence Ratio (CR) – A confidence ratio (CR) describes the degree of similarity between
compared behaviors.56 CR may be helpful in classifying changes in user physiology and behavior, specifically in determining whether changes are similar in nature and therefore likely generated by the same user, or dissimilar and therefore suspicious.
State Classification – State classification broadly describes a user’s behavioral or cognitive
state (e.g. neural pattern categorization).57 State classification plays a specific role in cognitive AA systems which seek to identify and monitor a user’s mental state.
From a security perspective, an access-control system based entirely on classification poses a high degree of risk, specifically through increased vulnerability to spoofing and circumvention. An AA system, however, could feasibly rely on an operational mix of classification and identification methods. Depending on the system’s functional parameters and data processing capabilities, conducting precise identification during every user activity period may not be necessary or efficient. It may be more effective for a system to conduct a mix of identification and classification during a session, relying on identification at routine intervals or in the event of suspicious activity, and classification during interim activity periods featuring routine occurrences. The attainment of purely identification-based AA systems may be considered as a goal of future development but realistically may not be achievable or operationally effective in the near-future. Classification may be viewed as a step toward identification in developing and enhancing AA systems.
3.1.6 Alert Metrics
Traditional single-transaction biometric systems unambiguously accept or reject user access pending identification results that are based on adjustable but finite matching thresholds. A matched profile leading to positive identification of authenticated user produces an acceptance decision, while an unmatched profile indicating a non-authorized user prompts a rejection decision. AA systems,
56 Ahmed, Awad E. Ahmed. “Dynamic Sample Size Detection in Continuous Authentication using Sequential Sampling,” 27th Computer Security Applications Conference, pp. 169-176 (2011): https://www.acsac.org/2011/openconf/modules/request.php?module=oc_program&action=view.php&a=&id=132&type=2&OPENCONF=v0drs5418h1f2jsea8ui6d8891 57 Gibson, Laurie, Jon Touryan, Anthony Ries, Kaleb McDowell, Hubert Cecotti, and Barry Giesbrecht. “Adaptive Integration and Optimization of Automated and Neural Processing Systems – Establishing Neural and Behavioral Benchmarks of Optimized Performance,” Army Research Laboratory, ARL-TR-6055 (July 2012).
Biometrics Metrics Report
37
alternatively, are capable of operating on a degree of confidence model, providing feedback on the level of trust maintained in a user’s claimed identity rather than a precise acceptance/rejection authentication decision.
3.1.6.1. Alert Business Case and Additional Metrics Specific to AA
Variance in user behavior and physiology requires AA systems to demonstrate a greater degree of nuance while determining degrees of confidence and ultimately forming acceptance and rejection decisions. It would be counterproductive for an AA system to immediately reject a user after detecting each shift in constantly fluctuating and evolving user physiology or behavior; similarly, it might also prove counterproductive to reject users if their observed confidence interval occasionally drops below a specified security threshold. Consequently, a need exists for intermediate steps in the rejection process, which take the form of system “alerts.” Alerts indicate a significant variation in user physiology or behavior, which may be normal in certain instances or suspicious in others. An AA system should recognize and track alerts, determining at what point an alert or series of alerts should lead to user rejection, software application suspension, or system shut-down. In AA systems, alerts and decision events are gauged using time-based performance metrics, which include:
Time-to-Recognize (TTR) – TTR describes: o The time a system requires to detect and recognize abnormal user signals (behavioral or
physiological).
o The time a system requires to detect and recognize activity by an intruder.58
Ideally, AA systems will demonstrate short-duration TTR, thereby decreasing the likelihood system spoofing, circumvention, and extended security breaches.
Time-to-Alert (TTA)59 - TTA accounts for the time, processing and analysis conducted by an AA
system between the time when a system detects a variation in user signal(s) and the time when a system flags that variation as suspicious. More specifically, TTA describes: o The duration of time a system requires to establish that a legitimate identity has been
appropriated by a malicious user; also, the maximum length of time during which an imposter can escape detection, without initiating the rejection-decision process.
o The duration of time a system requires to establish that an authorized user is demonstrating suspiciously abnormal behavior or physiology
TTA can be described with further specificity using the following metrics: Mean Time-to-Alert (MTTA), Minimum Time-to-Alert (Min TTA), and Maximum Time-to-Alert (Max TTA).60 Ideal AA systems will demonstrate short duration TTA. The quality of signal processing and analysis that occurs during the TTA process is also vital, however, as it directly leads to changes in the degree of confidence (confidence intervals) an alert or non-alert decision. TTA quality performance
58 Bours, Patrick & Hafez Barghouthi. “Continuous Authentication using Biometric Keystroke Dynamics,” The Norwegian Information Security Conference (NISK) (2009). 59 Tsatsoulis, P. Daphne, Aaron Jaech, Robert Batie, and Marios Savvides. “Multimodal Biometric Hand-Off for Robust Unobtrusive Continuous Biometric Authentication.” IGI Global (2012). 60 Traore, Issa and Ahmed Awad E. Ahmed. Continuous Authentication Using Biometrics: Data, Models, and Metrics (Hershey, PA: IGI Global, 2012)
Biometrics Metrics Report
38
reflects the quality of user training, in which the boundaries of normal user signals are established.
Time to Correct Rejection (TCR) / System Shut-Out – TCR describes the duration of time that
a system permits between an alert (triggered by a drop in degree of confidence) and an access-rejection decision. TCR depends heavily on confidence intervals and confidence ratios to determine whether an alert is an isolated incident or a persistent security risk. AA systems may implement a variety of schemes for TCR, depending on the modalities and use cases involved. Example scenarios include:
o Immediate Rejection – Rejection occurs as the next step following an alert or a as the next step following a drop below established identity confidence thresholds
o Observation, Rejection – Rejection occurs after a consecutive series of alerts, or in the instance of a fixed number of non-consecutive alerts (e.g. 3 alerts or drops below confidence thresholds during an activity period leading to a rejection)
o Weighted Rejection - Some variations in user signals may be weighted more heavily than
others, giving some alters high priority in leading to system rejection (e.g. a sudden and extensive spike in pulse rate may be weighted more heavily than an elevated but consistent rate).
Shorter TCRs minimize system vulnerability to an unauthorized or abnormal user. However, if an AA system is highly alert-responsive and executes a rejection-decision too rapidly, the system risks frequently shutting out authorized users and disrupting workflow, thereby decreasing user satisfaction and work productivity.
AA systems must delineate a framework of alerts that incorporates TTR, TTA and TCR, carefully taking into consideration factors of time and the quality of signal analysis. Specifically, an AA system must determine:
Alert Incidence – What type and duration of variation or interruption in user signal prompts an alert (e.g., a single drop below the specified identity confidence threshold, multiple drops, prolonged drops in confidence, etc.), and at what point during ongoing signal collection is the alert implemented?
Alert Issuance – How does an AA system issues alerts? Furthermore, to what extent are alerts transparent to managers, security personnel, and system users? In the case of users, a degree of alert-notification may prove helpful in reminding authorized users to return to normal activities (e.g. in the instance of prolonged distraction), or as a dissuasion to authorized users demonstrating abnormal behavior by reminding the user they are under observation (e.g. in the instance of insider threat scenarios). Conversely, user alert-notifications could prove detrimental to system security in the event of an intruder by informing the unauthorized party of covert AA system operations.
Post-Alert Protocols - What subsequent security protocols occur in a system following an alert?
Some systems may pursue further user observation after an initial alert has been issued. In this case, a system must determine if monitoring periods remain the same or become shorter in duration, or if more user data should be collected to re-establish a higher degree of identity confidence (e.g. switch from collecting one modality to multiple modalities, or initiate the acquisition and matching of a larger number of user features). Systems operating using a dual
Biometrics Metrics Report
39
classification/identification approach may also switch over from continuous degree of confidence modalities to precise identification mechanisms following an alert.
If rejection is the next step following an alert or series of alerts, an AA system must determine how to implement user rejection: a user may be shut out of a system completely for a specified period of time; a user may be required to re-authenticate using a traditional biometric or identity claim; or human verification (e.g. by a manager or security office) may be required. With respect to OS operations, a work station may shut down entirely, suspend sensitive applications, or suspend network access until a user’s identity has been reestablished.
3.2 Active Authentication Usability Factors
3.2.1 Learnability and Memorability
All biometric system deployers aim to offer users accessible and repeatable processes that can be easily intuited and accomplished by any member of the projected user population. Biometric systems that demonstrate optimum levels of performance offer high levels of interoperability between the user and the system as a whole. The degree to which a user can successfully operate a biometric system is often described in terms of learnability and memorability. Learnability can be defined as the ease with which system users become proficient in accomplishing basic tasks during their first encounter with a given biometric system. Memorability can be defined as the ease with which system users re-establish system proficiency following a period of disuse. System learnability and memorability may vary significantly based on the modality type(s) comprised within a given AA system.
3.2.1.1. Anatomical modalities
Anatomical-based biometric systems typically require a degree of user cooperation in presenting a feature for biometric sampling. For example, a user must actively apply a finger to a platen in order to complete fingerprint-based authentication. In such a scenario, a user must learn and later remember several factors in order to optimize biometric capture: how to position the finger, the amount of pressure with which to apply the finger to the platen, the amount of time to allow for capture, and how to prepare for print capture (e.g. washing detritus from hands). Consequently, standard-deployment anatomical modalities tend to require a high degree of user learnability; furthermore, the number of factors involved in optimal system use increase the level of memorability required in order for a user to successfully access a system over time.
3.2.1.2. Physiological modalities
Physiological modalities, conversely, should require a low degree of learnability and memorability during biometric capture and monitoring processes. Physiological signals are generated naturally, within the body, and are not produced by conscious user thought or activity. A degree of learnability and memorability may be necessary, however, with respect to sensor placement and wearing. For example, a pulse sensor would likely need to be worn or attached to the user at a specific point on the body in order to provide an adequate and consistent signal.
3.2.1.3. Behavioral modalities
Behavioral modalities gauge user behaviors during activity, as well as the underlying cognitive processes that inform such behaviors (Cognitive modalities are discussed below). With respect to purely behavioral biometric modalities, such as keystroke (the mechanical way in which an individual types), learnability and memorability are assumed – users are expected to possess the basis and experience necessary to interact sufficiently with an input device such as a keyboard, mouse, web browser, or common software application.
Biometrics Metrics Report
40
3.2.1.4. Cognitive modalities
Cognitive modalities measure intrinsic cognitive processes that regulate behavior and thereby inform the manner in which user activity is conducted. Behavioral-cognitive processes are controlled unconsciously and presented as a natural response to a certain activity or prompt. Systems that actively challenge users to produce a certain cognitive state may require a degree of learnability and memorability (e.g. cognitive games). Other behavioral-cognitive systems may be entirely passive in nature and therefor require very low levels of learnability and memorability (e.g. Stylometry assumes that a user knows and remembers how to write; no new skills must be learned or remembered in order for the modality to operate successfully).
3.2.2 Transparency of Operations
Transparency of operations describes the extent to which an individual (an authorized user or an intruder) interacting with an AA system will be aware of the system’s existence and internal monitoring and authentication processes. Transparency of operations constitutes a nuanced usability factor that has different implications, depending on whether a given individual is a genuine, authorized user or an illegitimate, unauthorized intruder posing a security risk. To enhance overall security, an AA system should not be detectable by a user during an activity period or session. An AA system should passively and continuously collect biometric data in order to ensure user authenticity during a period of use. Publicizing the deployment and operational details of an AA system may provide a basis for intruders to better determine the extent of the system’s security measures and how to circumvent them. Furthermore, for purposes of intruder apprehension, it may be preferable not to alert a suspicious user that his or her activity has been detected by the monitoring system and that further security measures, such as manual intervention and digital forensics, have been enacted. From the perspective of authorized users, however, higher levels of transparency may prove beneficial, helping users to remain aware and understanding of the fact that they are being monitored and continuously authenticated during an activity period or session. Transparency of operations may also help users ensure their actions are in compliance with specified AA system use standards (e.g. having to enter a certain minimum amount of text within an activity period to avoid access revocation). Finally, transparency in the case of authorized users may also serve as a significant dissuasion to insider threats, as users will be aware that their activity is monitored at all times.
3.2.3 Privacy Considerations
Privacy considerations play an active role in determining the usability and utility of any biometric system. Informational privacy pertains to the documentation and application of information relating to a given individual. Informational privacy concerns typically focus on the extent of an individual’s authority to control how collected information is used (specifically by whom and for what purpose) and the corresponding responsibility of other individuals and organizations to include the individual in decision-making processes that drive the subsequent use of personal information.61 AA systems present several privacy issues which must be considered during system design and deployment. Each modality type relies upon biometric data that is sensitive in nature because it relates uniquely to an individual and may impart non-identity related information to system deployers regarding user health, cognitive abilities or disabilities, and functional behaviors. The sensitivity of biometric information requires that system users and system deployers take active measures to protect collected user information. With respect to potential DoD applications, two overarching privacy issues exist:
61 Executive Office of the President of the United States, National Science and Technology Council. Committee on Technology. Committee on Homeland and National Security. Subcommittee on Biometrics. (2006). Biometrics Glossary. Retrieved from website: http://biometrics.gov/Documents/Glossary.pdf Accessed 10 Oct 2012.

Biometrics Metrics Report
41
1. Protecting individuals’ identity information from outside access (which can facilitate hijacking and spoofing efforts), and;
2. Protecting individuals’ identity information that is contained and stored within an AA system In order to successfully authenticate individuals, AA systems may ultimately need to store and process a larger quantity of biometric data than traditional systems. Privacy concerns may inform biometric feature selection (some features may be more “privacy friendly” than others), as well as data processing and storage mechanisms. Ideally, once biometric data is converted into a template or profile, the collected data should be discarded; templates should furthermore be formulated so as not to enable the reconstruction of biometric data based on a given template. AA systems must carefully balance privacy and security concerns. International Biometric Group’s BioPrivacy Application Impact Framework outlines questions that are important in determining whether a biometric system is privacy invasive.
BioPrivacy Application Impact Framework Low Risk of Privacy Invasiveness High Risk of Privacy Invasiveness
Overt
Are users aware of system’s operation?
Covert
Optional
Is the system optional or mandatory?
Mandatory
Verification
Is the system used for identification or verification?
Identification
Fixed Period
Is the system deployed for a fixed period of time
Indefinite
Private Sector
Is the deployment public or private sector?
Public Sector
Individual, Customer
In what capacity is the user interacting with the system?
Employee, Citizen
Enrollee
Who owns the biometric information?
Institution
Personal Storage
Where is the biometric data stored? Database Storage
Behavioral
What type of biometric technology is being deployed?
Physiological
Templates
Does the system utilize biometric template or biometric images?
Images
Table 1: IBG BioPrivacy Application Impact Framework Based on the BioPrivacy Application Impact Framework, AA systems employing novel biometrics in DoD applications may pose a high risk of privacy invasiveness. While many issues will be addressed during implementation, it seems that an ideal AA system will mostly take the following form:
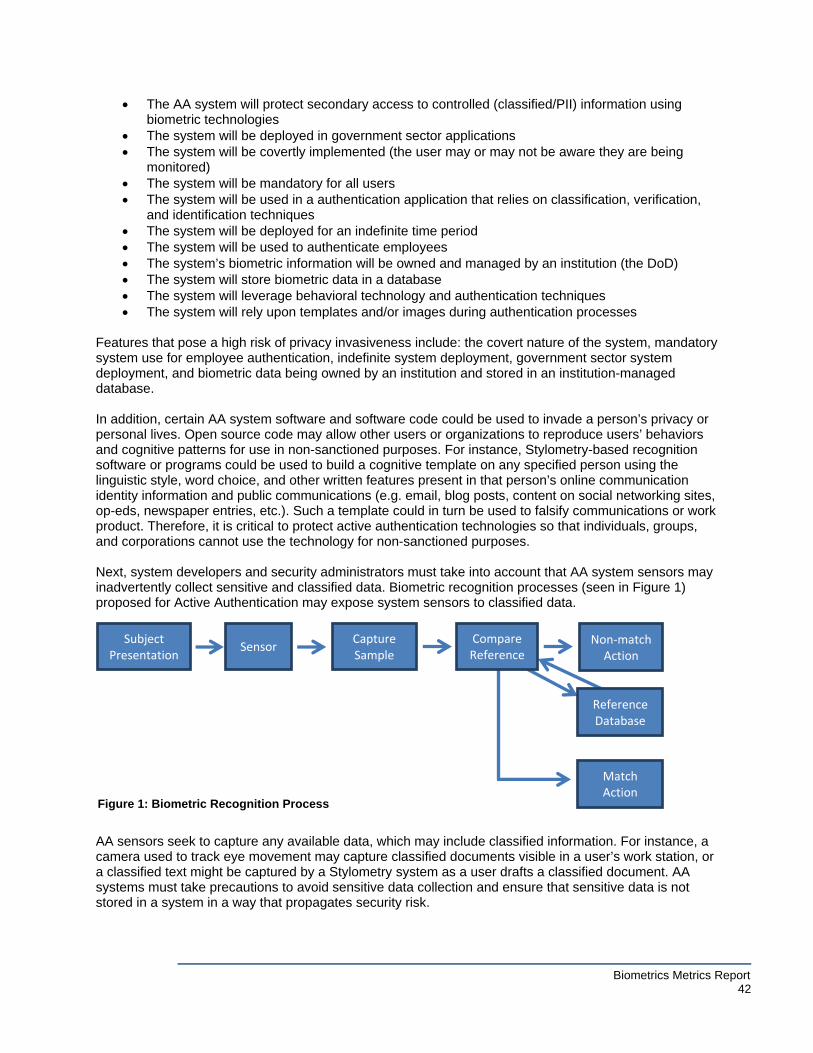
Biometrics Metrics Report
42
The AA system will protect secondary access to controlled (classified/PII) information using biometric technologies
The system will be deployed in government sector applications The system will be covertly implemented (the user may or may not be aware they are being
monitored) The system will be mandatory for all users The system will be used in a authentication application that relies on classification, verification,
and identification techniques The system will be deployed for an indefinite time period The system will be used to authenticate employees The system’s biometric information will be owned and managed by an institution (the DoD) The system will store biometric data in a database The system will leverage behavioral technology and authentication techniques The system will rely upon templates and/or images during authentication processes
Features that pose a high risk of privacy invasiveness include: the covert nature of the system, mandatory system use for employee authentication, indefinite system deployment, government sector system deployment, and biometric data being owned by an institution and stored in an institution-managed database. In addition, certain AA system software and software code could be used to invade a person’s privacy or personal lives. Open source code may allow other users or organizations to reproduce users’ behaviors and cognitive patterns for use in non-sanctioned purposes. For instance, Stylometry-based recognition software or programs could be used to build a cognitive template on any specified person using the linguistic style, word choice, and other written features present in that person’s online communication identity information and public communications (e.g. email, blog posts, content on social networking sites, op-eds, newspaper entries, etc.). Such a template could in turn be used to falsify communications or work product. Therefore, it is critical to protect active authentication technologies so that individuals, groups, and corporations cannot use the technology for non-sanctioned purposes. Next, system developers and security administrators must take into account that AA system sensors may inadvertently collect sensitive and classified data. Biometric recognition processes (seen in Figure 1) proposed for Active Authentication may expose system sensors to classified data.
AA sensors seek to capture any available data, which may include classified information. For instance, a camera used to track eye movement may capture classified documents visible in a user’s work station, or a classified text might be captured by a Stylometry system as a user drafts a classified document. AA systems must take precautions to avoid sensitive data collection and ensure that sensitive data is not stored in a system in a way that propagates security risk.
Reference Database
Figure 1: Biometric Recognition Process
Subject Presentation
Sensor Capture Sample
Compare Reference
Non‐match Action
Match Action

Biometrics Metrics Report
43
Finally, deployers of an AA system will need to assure users that the application is intended purely for authentication purposes rather than serving additional uses of gauging an employee’s time, attendance, work performance, focus, or physical or mental health. Any AA system will need to be reviewed in order to ensure compliance with existing DoD directives regarding Human protections and protections on Human Subject Research, as well as legal policies.
3.2.4 Human Factors
In the development of any novel authentication system, a number of human factors concerns exist that are based both on the nature of the authentication system and the nature of the system-user interface. Users must be able to easily operate a given system without impeding workflow, and the system must authenticate user access at a reliable enough level to provide security. Human factors considerations affect the development of requirements for biometric re-authentication systems, and may be assessed with respect to: human interaction, human movement, anthropometrics, and system impact on user effectiveness.
3.2.4.1. Human Interaction with Active Authentication Systems
DoD employees are continuously asked to perform a greater number of tasks and to work more efficiently. Added work load and compliance requirements can negatively affect work quality, organizational morale and employee retention and satisfaction. In seeking to avoid such complications, AA systems must determine what type and degree of user-system interaction is required for each inherent AA modality to generate a sufficient amount of authentication data. In this context, human factors may be assessed using Interaction Quotient (IQ). Systems that leverage input devices such as a mouse or a keyboard are likely to derive useful biometric data from all of a user’s interaction with an input device, without detracting from a user’s actual work efforts. AA systems can increase IQ by incorporating multiple modalities. Human-computer interaction required for enrollment, training and monitoring in AA systems may be described in one of two ways:
Active / Explicit – describes a scenario in which a user must deliberately perform a certain action or present a sample for capture in order to be enrolled in or monitored by the system; active user-system interactions may be disruptive to user workflow and have difficulty accounting for normative periods of user latency.
Passive / Implicit – describes a scenario in which a user is enrolled in and discreetly monitored
by the system without any interruption to normal activities or procedures; passive user-system interactions should account for normative periods of user latency.
AA systems that demand a high degree of active user-interaction during a given time period may distract and strain users by prompting unnatural or unnaturally-timed work activity (for example, a user having to provide keystroke data when he or she is actually trying to read a document, in order to avoid the revocation of system access). Legitimate work activity may be further hindered by the time it takes the user to present a biometric sample for authentication and the amount of times a user will need to authenticate their identity during an activity session. A user may become frustrated with a system that continuously requires active participation (e.g., precluding breaks), thereby possibly affecting attitude and decreasing work initiative. Human factors and employee workflow studies have repeatedly demonstrated that systems which adversely affect a user’s ability to perform and complete assigned tasks are easily disconnected, breached or circumvented. Vulnerable security systems negatively affect security instead of imparting planned, positive effects. Consequently, biometric authentication systems must satisfy a major

Biometrics Metrics Report
44
operational requirement by posing a minimal degree of negative impact on normal user workflow, effectiveness, and productivity. AA systems intended for deployment in office environments should seek to facilitate human-computer interaction (HCI) and rely on passive/implicit interactions, so that a user can accomplish work processes effectively and efficiently. Systems based on the passive/implicit interaction type enable users to authenticate their identity without sacrificing time, attention or work productivity. Passive/implicit interactions also facilitate discreet user monitoring and account for user latency. An ideal AA system must be flexible enough to account for natural periods of user latency, and passive enough so as not to place added task-based demands on a user and thereby encumber user workflow. User productivity will be impacted by overall system usability. Tradeoffs between an AA system’s degree of usability and security will have to be addressed on an Agency Policy level.
3.2.4.2. Human Movement within an Operating Environment
In computer-based operations, users may move in relation to assigned computers: users may be seated, actively or passively, in front of a work station, or may move away from an assigned computer during the course of working hours. The likelihood for user movement creates several potential scenarios and subsequent requirements for an AA system. First, at least one AA system modality must be capable of functioning independently of the computer system (i.e., monitoring and authentication functions will not cease in the event of latency, a screen lock-out, an automatic log-off, etc.). Secondly, biometric modalities employed in AA systems must be as discreet and unobtrusive as computer system components. Thirdly, depending on the anticipated degree of user movement, an AA system may be required to detect the presence of a user and to monitor and track that user’s movement within a given workspace. The ability of a biometric modality to detect and track a user will increase the proffered level of security and reduce potential distractions and disruptions that the AA system may pose to normal user workflow. Human movement with respect to re-claiming identity each time a system is accessed also prompts a unique use case scenario which is discussed in detail below in the Re-Authentication Factors section.
3.2.4.3. Anthropometrics
More than 450,000 people work for the Department of Defense62. In this sizable group of employees, the wide-ranging diversity of the operator community poses considerable concern to AA system development and specification. Operator population diversity is expressed through an assortment of individual user/operator characteristics that are derived from significantly varied levels of education, training, focus, functional experience and aptitude with computers, and anatomical, physiological and behavioral features, among others. Minimizing the impact of user diversity on biometric re-authentication system function requires that biometric systems be fully mature and possess a history of successful testing and implementation among large and highly diverse user populations. In addition to addressing population-level anthropometrics, AA systems must account also account for anthropometric change within each user. Each system user will possess an evolving degree of education, training, degree of focus, and functional experience and aptitude, along with anatomical, physiological and behavioral features that have been previously discussed. For instance, a successful AA system must determine how to best account for new, untrained employees whose work routines and biometric traits (in cases of behavioral and cognitive based modalities such as Stylometry) are likely to rapidly evolve during training and the initial stages of work experience and development.
62 http://www.defense.gov/about/dod101.aspx
Biometrics Metrics Report
45
3.2.5 Re-Authentication Factors
Active authentication systems can accomplish continuous authentication using classification, verification, or identification techniques. Factors that impact re-authentication requirements are specific to a system’s use case, and include: number of users (single or multiple user systems), manner of system usage (continuous or periodic), and application usage (single or multiple application OS). Timing of access and use also plays a critical role in assessing each re-authentication factor.
3.2.5.1. Single User, Multiple Users
Most office computers are assigned to a single, specific individual for routine use. Consequently, a biometric re-authentication system can operate in a simple 1:1 verification mode in a single-user context; the AA system merely needs to determine if a given user is the specified user. A verification-based system decreases biometric accuracy requirements, eases processing loads and requirements, and, in some cases, also affects the cost of the biometric system. In the case of a single-user, an AA system must determine whether the user is granted access at all times, or if access is restricted to certain work days and/or working hours (e.g., can an authorized user gain access on evenings or weekends). Certain use cases, however, involve IT systems that are designed to grant access to and be used by a number of authorized office personnel. The multiple-user scenario frequently occurs within the context of shared work spaces and shift work, in which computers are operated by different individuals over the course of working hours (e.g., a nurses’ station in a hospital). This particular usage pattern requires the use of 1:N identification for re-authentication, instead of 1:1 verification. Multiple-user systems involve the same issues and characteristics as a single-user case, with additional requirements derived from the possibility of different designated user roles on the computer system and network. Different roles impart varying degrees of access, authentication, re-authentication, and timing-of-access requirements to each individual user, all of which must be accounted for within an AA access framework.
3.2.5.2. Continuous Use, Periodic Use
Most computers deployed in office environments are assigned to a single, specific user, who then uses the assigned computer frequently or continuously during the course of a work day to perform required tasks. In continuous use cases, re-authentication is not affected by different users during normal computer operation. Any access of a work station by someone other than the single, assigned user (even if it’s another authorized user) can be viewed as suspicious activity and a potential security breach. In some office environments, computers assigned to a single user are only used to accomplish specific and/or infrequent tasks. A periodic use case occurs when a user possesses or has access to more than one computer within a workspace, with one assigned computer dedicated to a restricted number of work applications. In the periodic use case, system requirements may change from re-authentication conducted on a time interval basis to re-authentication conducted each time a user accesses a computer station or system application.
3.2.5.3. Single Application, Multi-Application
The single application use case is highly similar to the periodic use case. However, in this instance, some work tasks require a user to continuously access an IT system via a single software application (e.g., a data-entry task). In this case, re-authentication requirements will be determined and driven by the level of system security and the sensitivity of the single application. Again, application usage may be restricted to certain working hours or days. Multi-application scenarios commonly occur in professional service work environments (e.g., engineering, contracting, etc.). In this case, different applications operating off of a single computer or work station
Biometrics Metrics Report
46
may possess significantly diverse security requirements. As a result, re-authentication requirements for a user who changes applications frequently or keeps more than one application open at the same time may vary greatly based on the level of system security and the sensitivity of each individual application. The multi-application use case also presents an opportunity to augment overall biometric re-authentication system performance over time, specifically by compounding the amount of collected biometric data available for analysis and user identification.
3.2.5.4. Basic Requirements for Re-Authentication and Validation
Implementation of a biometric system requires a systems engineering approach to develop satisfactory and ideal requirements for authenticating and re-verifying user identity during normal computer use as commonly occurs in standard office environments. In the Department of Defense, standard systems engineering processes are critical to concretely defining concepts of operation and system requirements before executing the design, implementation, and evaluation of new systems63. For AA applications requiring re-authentication, several scenarios and factors should be carefully considered including frequency of re-verification and performance on re-verification tasks.
3.2.5.4.1. Frequency of Re-verification The frequency of re-verification requirement can be defined in terms of three underlying classes of re-verification tasks. The three classes include: point re-verification, periodic re-verification, and continuous re-verification. Each re-verification task class meets different security requirements; consequently, each type creates different operational requirements for a biometric re-verification system.
Point Re-verification - Point re-verification refers to the need for a biometric system to re-verify a user’s identity based on a specific action or software application requirement. Point re-verification would be required in a number of different cases, and examples include: 1) when a user returns to operating a computer system after temporarily moving away from the work station, 2) when a user opens a software application that requires positive authentication/re-verification of the user’s identity, and 3) when a specific transaction that the user is conducting requires verification (non-repudiation) of the user’s identity.
Periodic Re-verification - Periodic re-verification occurs when a system intermittently re-verifies a user’s identity as the user conducts normal work activities. Periodic re-verification is primarily used as a computer system security feature in order to ensure that the same person who initiated a given software application is the same person using the application at a later point in time.
Although security system designers would ideally like to re-verify user identity as frequently as possible, the successful completion of re-verification tasks typically requires a degree of user attention and cooperation; these re-verification needs can pose a significant distraction to user workflow, thereby reducing user effectiveness. As such, a tradeoff exists between the degree of operator effectiveness and the degree of re-verification system security. Optimal periodic re-verification design should require the user to re-verify as often as possible without imparting a noticeable effect on work performance. Studies on computer workflow and computer-user behavior indicate that most healthy teenagers and adults are unable to sustain focused attention on one task for more than 20 consecutive minutes. Based on such studies, a user re-verification requirement timed at 20-30 minute intervals should minimally affect work productivity in the course of typical computer usage that does not involve time-sensitive task completion. Two additional considerations must be taken into account with respect to re-verification system design and the specific time interval between re-verification prompts. First, for security purposes, a user should not be easily able to discern or predict the exact timing of re-verification requests. This protective measure can be implemented in software applications through the use of a simple
63 Defense Acquisition Guidebook
Biometrics Metrics Report
47
random number generator. Secondly, it is important to understand that any new security system may negatively affect the user’s perception of his or her relationship with the organization’s leadership. A new security system that gives the staff the impression that they are not trusted can harmfully impact staff performance and create undesirable organizational conflicts. Lastly, it should be noted that the 20-30 minute re-verification request interval serves to minimize user workflow interruption. If security requirements dictate more frequent re-verification, then the frequency can easily be increased; however, this will prompt some (potentially detrimental) impact on user productivity.
Continuous Re-verification - Continuous re-verification is a special class of re-verification implemented using passive biometric technologies (e.g. face recognition, eye movement, etc.), each of which operates via a host computer and verifies user identity on an uninterrupted basis. Continuous re-verification systems always remain “on,” incessantly collecting and verifying biometric data within normal time parameters specific to the biometric modality in use. Once the continuous re-verification system makes a positive verification, the system re-initiates and continues verification efforts until it does not successfully verify the user. When a user leaves (i.e., steps away from a workstation), the computer’s biometric system should be able to detect that no user is present (as opposed to indicating the presence of an unauthorized user), and should automatically resume re-verification when the user returns. In addition to the basic security benefits provided by continuous re-verification, this method offers a number of additional advantages. First, a correctly implemented continuous re-verification system proves less intrusive and less disruptive to user workflow than a periodic re-verification system. Secondly, some continuous re-verification systems are capable of detecting other security risks. For instance, certain face recognition systems are capable of detecting and identifying whether more than one individual is present within a given field of observation; this capability can be used to determine if an unauthorized individual is present within a workspace or if an unauthorized individual is looking over the shoulder of an authorized user. It is important to note, however, that few biometric modalities are suitable for implementation in continuous re-verification systems, and that some proposed modalities may require additional software development to enable successful continuous re-verification system implementation.
3.2.5.4.2. Performance on the Re-verification Task
In order to support the re-verification tasks and modes of operation described above, proposed biometric systems must satisfy some limited, minimal performance requirements. These baseline performance requirements include:
Accuracy - The biometric system must accurately determine if a user’s identity is the same as the user identity that was originally authenticated when the computer system/software application was started or initially accessed.
Reliability - The biometric system must function reliably. Reliability includes the system’s ability to be successfully and easily operated by the intended user population while producing a very low rate of false alarms.
Speed - The biometric system must function at a rate that minimizes any negative impact on users, user work product, and effectiveness produced by processing time.
Biometric performance levels vary significantly depending on the selection of specific hardware and software solutions, specific system configuration, the operational environment, and the user population. Without knowing the details of a specific re-verification system implementation, only a general and comparative analysis of the performance requirements can be made.

Biometrics Metrics Report
48
3.2.6 Errors
False rejection of an authorized user can occur in all biometric systems; the likelihood of false rejection incidence increases in AA systems due to the complex nature of continuous authentication systems. Incorrect access revocation may also occur in AA systems due to extended periods of latency, in which a sensor may not actively receive data despite the presence of a user. Depending on latency threshold settings, a system may not be able to determine at all times whether a user is present at a work station. The incidence of access revocation will impact users as well as the OS activities which the AA system is protecting. During access revocation, work-in-progress may be lost or quarantined, and certain applications or overall OS access may be suspended. Consequently, AA systems must provide an efficient course of redress for genuine users whose access has been wrongly or inconveniently revoked. In non-suspicious revocation cases, it might be helpful for users to rely upon direct methods of identity assertion, such as presenting a traditional biometric and/or a CAC card (Common Access Card). If human verification is required for a user to regain access, it would be necessary to have a manager or security personnel on hand at all times. Depending on the frequency of system errors, relying on human verification to re-establish identity distract from traditional managerial or security duties and create inter-office points of friction.
3.2.7 System Efficiency
Installing a complex AA system on a common Operating System (OS) may significantly impact overall AA system practicality and utility. An AA system may strain the processing resources and speed of a protected OS, as might occur when continuous biometric data processing requires the majority of a system’s processing capacity. An AA system may also actively conflict with the operation of other OS applications such as Anti-Virus software. In some cases, AA system software may also require standard security settings to be lowered (e.g. web browsing security settings, or the installation of key-logger software) in order to ensure that the OS “plays nice” during AA system data collection and matching processes. AA system efficiency may also be impacted by hardware dependency. A given AA modality may be sensitive to or affected by system configuration aspects such as input device type (e.g. keyboard or mouse model) and hardware specifications such as screen size and resolution. If an AA system involves disposable components, usability and performance may also be affected by hardware reusability as replacement components may alter or degrade overall system function. As a security precaution, it may also be beneficial to tie input devices, such as a keyboard or mouse, to a designated work station. This would require additional programming functions, but could help ensure that data input is being provided by a specified, authenticated device rather than input remotely or via a tampered sensor.
3.2.8 DoD Policy
An Active Authentication (AA) system deployed by the DoD must operationally conform with DoD and Federal information security and accessibility issuances that apply to secured-authentication systems. Policy conformance requirements will vary based on the degree of information sensitivity and classification present in a given DoD operational context. Sensitive Compartmented Information (SCI) facilities constitute one use case that is subject to Federal and DoD policy requirements. For example, SCI systems must conform with the following:
Federal Information Security Management Act of 2002
Biometrics Metrics Report
49
Department of Defense Directive No. 5105.21, Vols. 1-3 (October 2012) - Sensitive Compartmented Information (SCI) Administrative Security Manual: Administration of Information and Information Systems Security64
Additional (but not superseding) policy and accessibility issuances pertaining to authentication in highly secured, sensitive information environments include:
Department of Defense Instruction No. 5200.01 (October 2008 - 2012) – DoD Information Security Program and Protection of Sensitive Compartmented Information.65 This document serves as DoD Manual to implement policy, assign responsibilities, and provide procedures for the designation, marking, protection, and dissemination of multiple levels of CUI and classified information, providing corollary details on how AA systems may need to be adjusted and secured when used in environments containing sensitive information.
Intelligence Community Directive Number 702 – Technical Surveillance Countermeasures
(February 2008)66 - This document addresses the overlapping issues related to counterintelligence and security countermeasures, providing an introduction into the techniques used to detect and nullify malicious technologies and/or methods of technological interference that may enable unauthorized access to an AA security system.
Intelligence Community Directive Number 705 – Sensitive Compartmented Information Facilities
(May 2010) - This document addresses physical security standards for SCIF facilities, p providing corollary details on how AA systems may need to be adjusted and secured when used in environments containing sensitive information
Office of the National Counterintelligence Executive – Technical Specifications for Construction
and Management of Sensitive Compartmented Information Facilities Version 1.1, Intelligence Community Technical Specifications for Intelligence Community Standard (ICS) 705-1 (Physical and Technical Standards for SCIFs) (October 2011) - This document describes the physical and technical security specifications and best practices required to meet ICS 705-1 standards for Sensitive Compartmented information Facilities, providing insight into what aspects may be involved or necessary in deploying AA security systems in secured areas.
It is important to note that the majority of DoD systems requiring secured access do not involve classified or highly sensitive information. However, in the context of classified information systems, two security policy-based issues must be considered with regard to the implementation of AA authentication applications.
3.2.8.1. Sensitive Data Protection
Certain AA modalities deployed in an environment containing sensitive information, such as a SCIF (Sensitive Compartmented Information Facilities), may inadvertently capture, record and store sensitive data during personal monitoring activities. AA systems must take precautions to avoid sensitive data collection and ensure that sensitive data is not stored in a system in a way that propagates security risk. Furthermore, existing defense and intelligence policies relating to sensitive information or secured areas specify that users must be notified, prior to obtaining system access, that system usage may be monitored, recorded, and subject to audit.67 Notification requirements may hinder the deployment of any
64 Department of Defense Manual No. 5105.21, Vols. 1-3 (October 2012) http://www.dtic.mil/whs/directives/corres/pdf/510521m_vol1.pdf 65 Department of Defense Instruction No. 5200.01 (October 2008) http://www.dtic.mil/whs/directives/corres/pdf/520001p.pdf 66 Director of National Intelligence, Intelligence Community Directives, http://www.fas.org/irp/dni/icd/index.html 67 Director of Central Intelligence Directive 6/3 – Protecting Sensitive Compartmented Information within Information Systems. http://www.fas.org/irp/offdocs/DCID_6-3_20Manual.htm
Biometrics Metrics Report
50
covertly operational AA system. DoD regulatory policies will likely require revision before the implementation of an AA system.
3.2.8.2. Accessibility Compliance
Section 508 of the Rehabilitation Act of 197368 and the Americans with Disabilities Act of 199069 both require that workplace computer systems be accessible to persons with disabilities. The compliance requirements of these laws apply to computers operated by DoD employees within non-combat environments and also to integrated computer devices such as biometric capture sensors. The preferred method for satisfying this accessibility requirement is to use more than one modality in a biometric system. For example, if a given user did not possess healthy eyes, then another biometric modality in addition to iris recognition would be required for successful user authentication. The accessibility requirement consequently provides a strong motivation for investigating the use of multi-modal biometric systems for verification and re-verification applications. The standardized implementation of multi-modal systems throughout the DoD would minimize the need to implement novel or inhomogeneous systems in order to satisfy accessibility compliance.
3.3 Adoption of Biometric Technologies
3.3.1 Technical Factors Affecting Adoption
3.3.1.1. Acquisition and Enrollment Metrics
Acquisition and enrollment rates are integral performance factors to consider in the adoption of biometric security systems. A biometric system that performs poorly during acquisition and enrollment processes will prove difficult to use and will likewise perform poorly during matching processes, thereby providing a lower, less robust degree of security and access control. Consequently, for the purposes of adoption, the Failure at Source rate, Failure to Acquire rate (FTA), and Failure to Enroll rate (FTE) should be weighted heavily against other performance metrics and usability factors.
3.3.1.2. Matching Metrics Related to Adoption
Performance metrics that reflect the precision and accuracy of biometric matching and authentication processes should also be awarded precedence when considering the adoption of any biometric system. Given that the goal of implementing secured access systems is to prevent access and activity by unauthorized individuals, the False Match Rate (FMR), False Accept Rate (FAR), and False-Positive Identification-error Rate (FPIR), should always be weighted heavily in adoption considerations.
Active Authentication (AA) systems will potentially need to contend with higher-than-normal FAR associated with emergent or novel modalities. High FAR may be mitigated, however, if AA systems employ and layer multiple modalities, both novel and traditional. A multimodal or layered system may provide a suitably low composite FAR or a tiered FAR progression (from high to minimal), even if some of the specific modalities involved demonstrate non-ideal FARs. For example, Pulse could be deployed as an introductory monitoring modality that may have a high FAR, with the AA system relying on better-performing modalities, such as Fingerprint recognition, to eliminate initial false acceptances.
68 Section508.gov, “Section 508 of the Rehabilitation Act” http://www.section508.gov/index.cfm?fuseAction=1998Amend 69 FindUSLaw, “Americans with Disabilities Act of 1990 – ADA – 42 U.S. Code Chapter 126,” http://finduslaw.com/americans-disabilities-act-1990-ada-42-us-code-chapter-126
Biometrics Metrics Report
51
In contrast to false acceptance metrics, false rejection metrics such as the False Non-Match Rate (FNMR), False Rejection Rate (FRR), and False-Negative Identification-Error Rate may be weighted more lightly with respect to biometric system adoption. High FRR can be problematic as users tend to become frustrated when they experience incorrect system rejection; in such instances, work productivity and user morale can be negatively impacted. High rates of false rejection may prove difficult to control from a technical perspective, particularly for AA systems relying on physiological and behavioral modalities which vary substantially within a single user. Higher-than-normal false rejection rates may be offset, however, by ensuring that the user population is provided with and maintains positive perception of the utility and necessity of the AA system; such attributes among a user population can help create a greater willingness to forgive and work through false rejection errors.
3.3.1.3. Performance Time
Performance times, such as Time to Acquire (TTA), Time to Enroll (TTE), and durations required for matching and authentication are not necessary to weight for the purposes of adoption, but should always be considered as time factors directly impact both user and organizational efficacy.
3.3.2 Human Factors Affecting Adoption
Alongside technical factors, the adoption of new technology is often assessed from both the human [user] and organizational [deployer] viewpoints.70 User-centric approaches focus on informing specific user understandings, perceptions and concerns regarding the perceived need for the security technology, ease of use, privacy considerations, trust in the technology and the deploying organization, training, and self-efficacy.71 As previously noted, increased degrees of user trust have proven helpful in counterbalancing operational inefficiencies of new technologies. AA biometric systems that merge multiple modalities may facilitate adoption by increasing the likelihood of continuous user access and convenience.72 User-centric approaches to adoption offer two primary suggestions:
1. It is recommended that the deploying organization carefully assess new technology from the viewpoint of users in the relevant deployment context(s).
2. It is recommended that the deploying organization actively build awareness among users regarding the need and utility of new technology prior to deployment, such as designing and launching education and exposure programs that account for all aspects of user impact. However, this approach will not be appropriate for AA systems that are intended to operate covertly, in which case technological performance factors must be refined to a high degree.
3.3.3 Organizational Factors Affecting Adoption
Organization-centric approaches to the adoption of biometric technologies involve developing a firm understanding of organizational needs and requirements regarding a diverse array of topics that include security requirements, performance reliability, the value of the adopted technology, ease of adoption, technical support, and administration requirements.73
70 Alhussain, Thamer and Steve Drew. “Chapter 10: Developing a Theoretical Framework for the Adoption of Biometrics in M-Government Applications Using Grounded Theory,” Security Enhanced Applications for Information Systems. InTech (May 2012). 71 Thia, Tyler. “Ease of Use to Advance Biometrics Adoption,” July 15, 2011. <<http://www.zdnet.com/ease-of-use-to-advance-biometrics-adoption-2062301216/>> 72 Thia, Tyler. “Ease of Use to Advance Biometrics Adoption,” July 15, 2011. <<http://www.zdnet.com/ease-of-use-to-advance-biometrics-adoption-2062301216/>> 73 Alhussain, Thamer and Steve Drew. “Chapter 10: Developing a Theoretical Framework for the Adoption of Biometrics in M-Government Applications Using Grounded Theory,” Security Enhanced Applications for Information Systems. InTech (May 2012).

Biometrics Metrics Report
52
The quality of communication within an organization – specifically, the organization’s ability and willingness to facilitate user awareness and education, as well as successfully coordinate between different levels of management and administration – constitutes an integral adoption factor, along with organizational preparedness for technology adoption. Current DoD Practices provide some general guidance regarding technology adoption. The DoD Information Technology Standards Registry (DISR) specifies seven criteria for technology submission and acceptance standards pertaining to the development, acquisition and deployment of new IT and National Security Systems: 74
Net-centricity Interoperability Maturity Implementability Public availability Consistency with authoritative sources
Certain DoD divisions have developed internal adoption procedures. For example, the Department of Homeland Security (DHS) has developed a two-stage adoption method that involves 1) a technology vetting step and 2) vetting the proposed technology at a policy level to determine procurement requirements and impacts on component efficacy.
3.3.4 Other Practical Considerations
A number of practical criteria are associated with the successful adoption of biometric technologies. Criteria for emerging and existing adoption standards include:
Technological Value – Determining and clearly portraying the relative advantages and benefits provided to users and organizations adopting a new biometric system.
Technological Maturity – The technology readiness level (TRL) and technical content of a biometric system is mature, requiring no major alterations or corrections that will affect compatibility.
Commercial Availability - The variety of the biometric system’s component hardware (sensors)
and software (algorithms) in the marketplace, preferably provided by multiple vendors.
Compatibility / Interoperability – The new biometric technology possesses sufficient backwards compatibility to enable the incorporation of, and interoperability with, legacy data or legacy systems (alongside current implementations).75
Timely Validity Period – Novel biometric technologies and applications may improve rapidly over brief
periods of time. Performance standards and adoption policies should be adjusted often enough to accurately reflect technological progress and the growing familiarity and operational experience of the user population. The validity period of adoption processes should allow time for trial periods that yield observable results.76
74 NSTC Subcommittee on Biometrics & Identity Management. ”Supplemental Information in Support of the NSTC Policy for Enabling the Development, Adoption and Use of Biometrics Standards,” August 10, 2009. 75 NSTC Subcommittee on Biometrics & Identity Management. NSTC Policy for Enabling the Development, Adoption and Use of Biometric Standards. September 7, 2007. 76 Robinson, Les. “A Summary of Diffusion of Innovations,” Enabling Change (January 2009).

Biometrics Metrics Report
53