Embed Size (px)
Citation preview
Bioinformatics
• Gene detection and prediction
• Gene predictions in prokaryotes
• Gene predictions in eukaryotes
• Difficulties of gene prediction
• Statistical measure of prediction accuracy
Lecture 11
• Gene detection in genomic DNA was a challenging question since early 1980
• Intensive sequencing of large genomic DNA sequences and entire genomes made gene prediction even more important in the last few years
• Ever growing number of programs dealing with gene prediction is the best demonstration of significant efforts
• On the other hand this is also an indication of significant difficulties on the way caused by the tremendous variety of the genes’ signals
• The accuracy of modern gene prediction programs varies broadly form 0.45 to 0.9 depending on gene type, species, software, etc.
Gene detection and prediction
• Gene prediction in prokaryotic organisms is generally easier than in eukaryotic mainly because their genes usually lack introns
• Another reason is more conserved structure of the promoter region
• Thus having smaller number of patterns, which have to be recognised, and much more conservative nature of these patterns plus a single ORF makes the objective more achievable
• As a result gene prediction in eukaryotes more reliable
Gene prediction in prokaryotic genomes
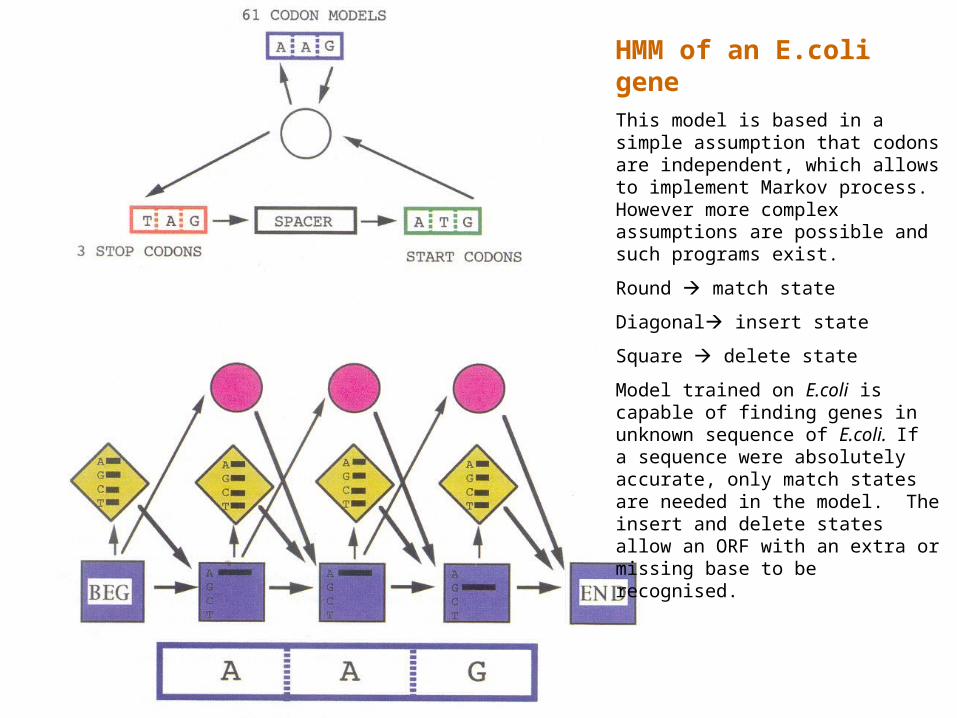
HMM of an E.coli geneThis model is based in a simple assumption that codons are independent, which allows to implement Markov process. However more complex assumptions are possible and such programs exist.
Round match state
Diagonal insert state
Square delete state
Model trained on E.coli is capable of finding genes in unknown sequence of E.coli. If a sequence were absolutely accurate, only match states are needed in the model. The insert and delete states allow an ORF with an extra or missing base to be recognised.
• Knowledge of basic structural elements of genes opens a possibility for prediction genes in long stretches of unknown DNA.
• There two major types of information, which are used in ab initio gene prediction programs.
• Prediction of numerous signals (next slides)
• Prediction of exons/ORF
Ab initio gene prediction in eukaryotes
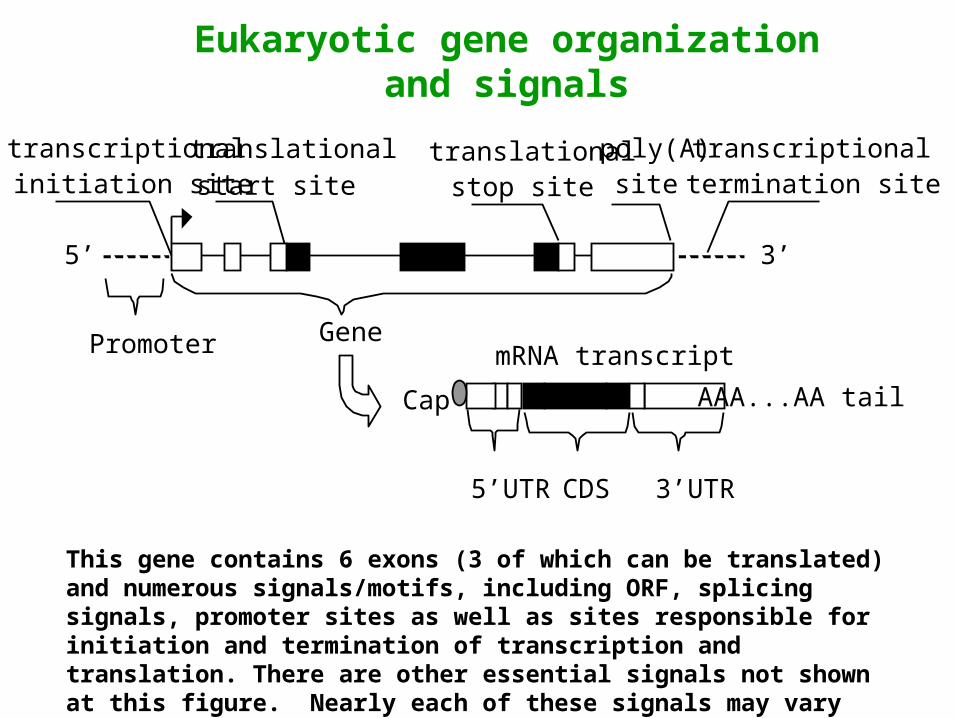
Eukaryotic gene organization and signals
5’UTR 3’UTRCDS
Promoter
transcriptionalinitiation site
translationalstart site
translationalstop site
poly(A)site
transcriptionaltermination site
5’ 3’
GenemRNA transcript
Cap AAA...AA tail
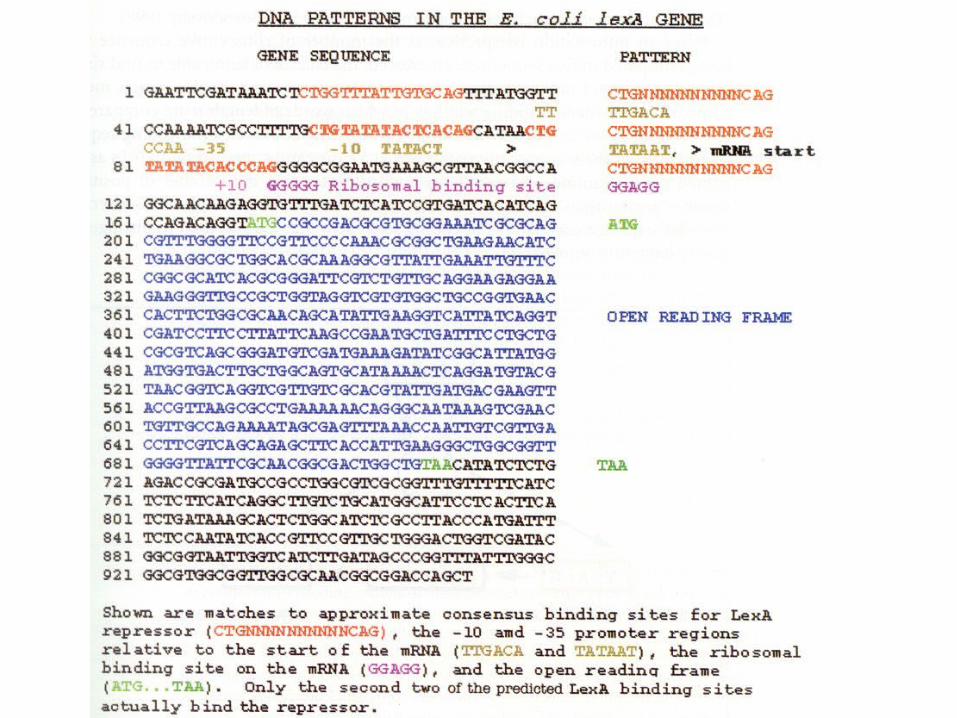
This gene contains 6 exons (3 of which can be translated) and numerous signals/motifs, including ORF, splicing signals, promoter sites as well as sites responsible for initiation and termination of transcription and translation. There are other essential signals not shown at this figure. Nearly each of these signals may vary significantly in different genes and species.
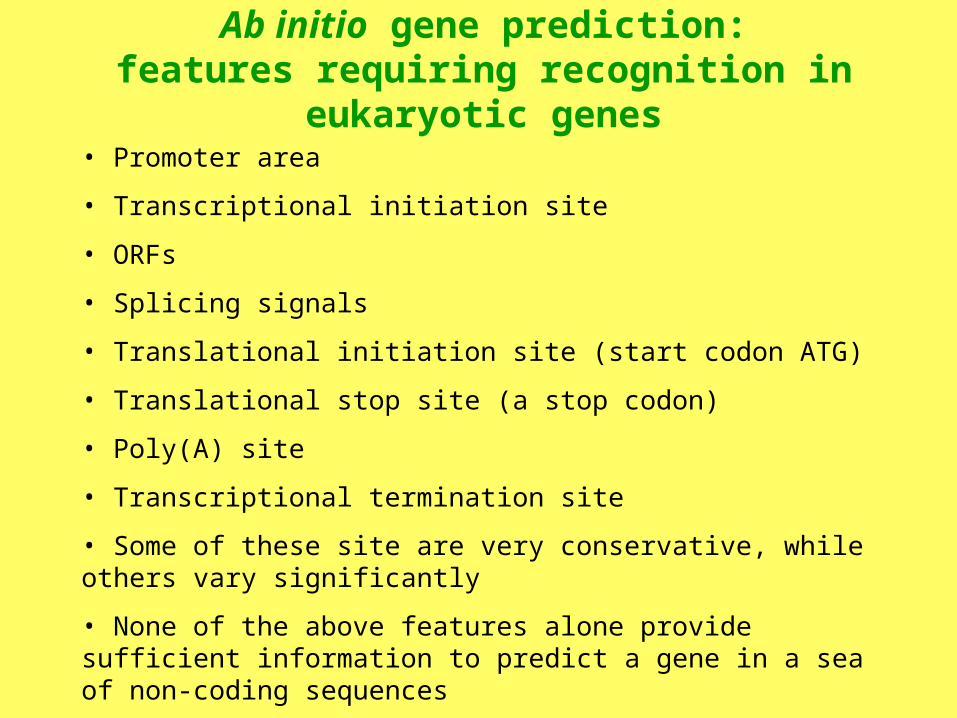
• Promoter area
• Transcriptional initiation site
• ORFs
• Splicing signals
• Translational initiation site (start codon ATG)
• Translational stop site (a stop codon)
• Poly(A) site
• Transcriptional termination site
• Some of these site are very conservative, while others vary significantly
• None of the above features alone provide sufficient information to predict a gene in a sea of non-coding sequences
Ab initio gene prediction:features requiring recognition in eukaryotic genes
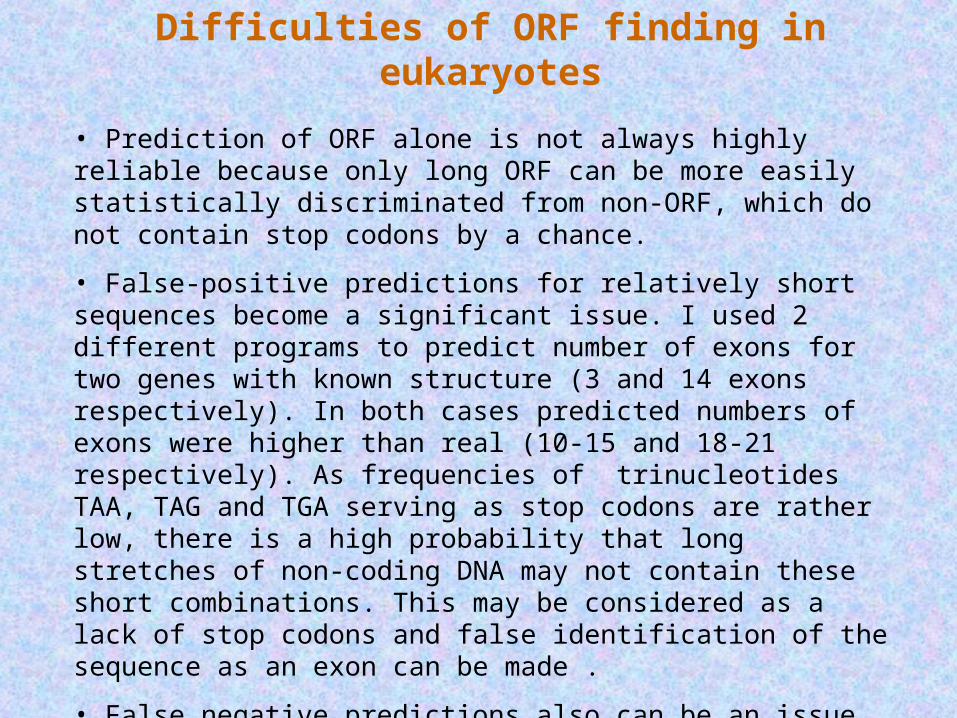
• Prediction of ORF alone is not always highly reliable because only long ORF can be more easily statistically discriminated from non-ORF, which do not contain stop codons by a chance.
• False-positive predictions for relatively short sequences become a significant issue. I used 2 different programs to predict number of exons for two genes with known structure (3 and 14 exons respectively). In both cases predicted numbers of exons were higher than real (10-15 and 18-21 respectively). As frequencies of trinucleotides TAA, TAG and TGA serving as stop codons are rather low, there is a high probability that long stretches of non-coding DNA may not contain these short combinations. This may be considered as a lack of stop codons and false identification of the sequence as an exon can be made .
• False negative predictions also can be an issue particularly when exons are very short < 15 nucleotides.
Difficulties of ORF finding in eukaryotes
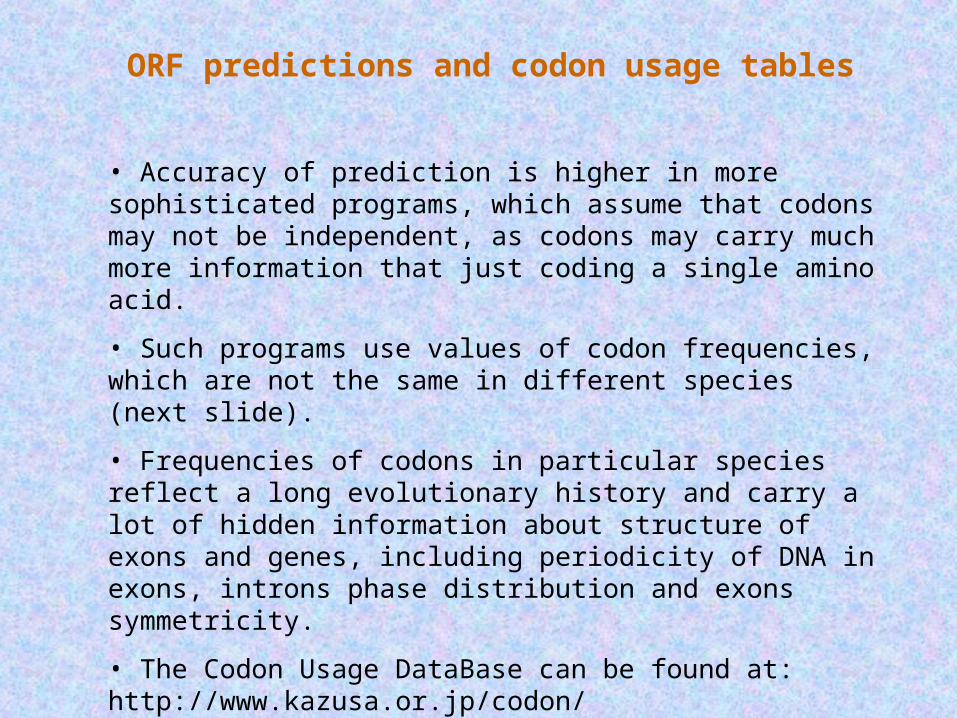
• Accuracy of prediction is higher in more sophisticated programs, which assume that codons may not be independent, as codons may carry much more information that just coding a single amino acid.
• Such programs use values of codon frequencies, which are not the same in different species (next slide).
• Frequencies of codons in particular species reflect a long evolutionary history and carry a lot of hidden information about structure of exons and genes, including periodicity of DNA in exons, introns phase distribution and exons symmetricity.
• The Codon Usage DataBase can be found at: http://www.kazusa.or.jp/codon/
ORF predictions and codon usage tables
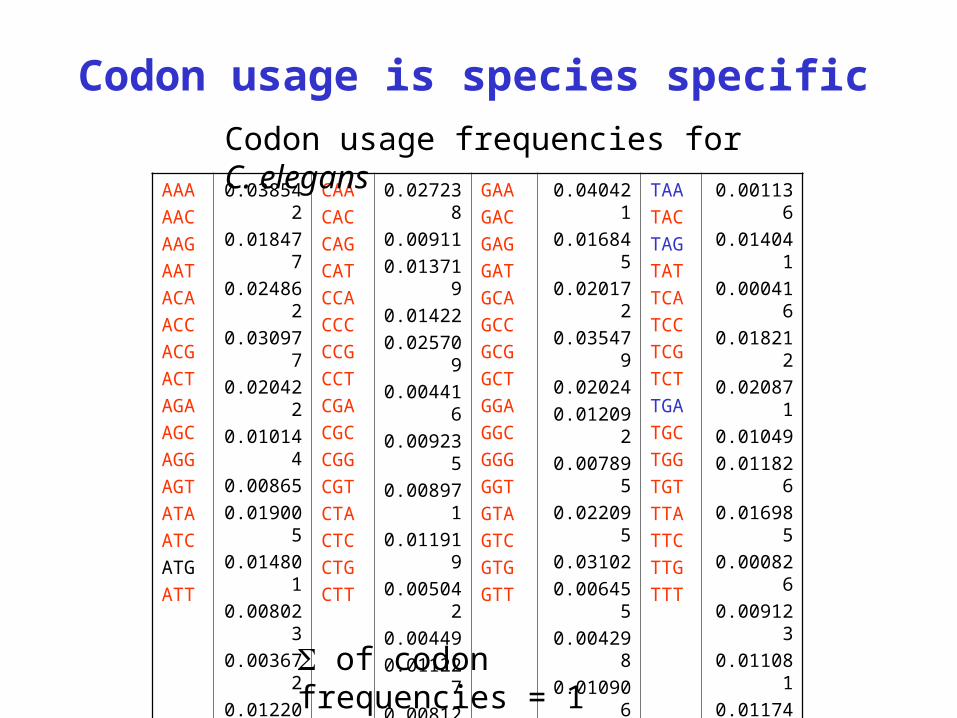
Codon usage is species specific
AAA
AAC
AAG
AAT
ACA
ACC
ACG
ACT
AGA
AGC
AGG
AGT
ATA
ATC
ATG
ATT
0.038542
0.018477
0.024862
0.030977
0.020422
0.010144
0.00865
0.019005
0.014801
0.008023
0.003672
0.012206
0.009912
0.01886
0.026516
0.033305
CAA
CAC
CAG
CAT
CCA
CCC
CCG
CCT
CGA
CGC
CGG
CGT
CTA
CTC
CTG
CTT
0.027238
0.00911
0.013719
0.01422
0.025709
0.004416
0.009235
0.008971
0.011919
0.005042
0.00449
0.011227
0.008125
0.01475
0.011957
0.021641
GAA
GAC
GAG
GAT
GCA
GCC
GCG
GCT
GGA
GGC
GGG
GGT
GTA
GTC
GTG
GTT
0.040421
0.016845
0.020172
0.035479
0.02024
0.012092
0.007895
0.022095
0.03102
0.006455
0.004298
0.010906
0.010104
0.013357
0.014256
0.024388
TAA
TAC
TAG
TAT
TCA
TCC
TCG
TCT
TGA
TGC
TGG
TGT
TTA
TTC
TTG
TTT
0.001136
0.014041
0.000416
0.018212
0.020871
0.01049
0.011826
0.016985
0.000826
0.009123
0.011081
0.011749
0.010399
0.024397
0.020223
0.025005
Codon usage frequencies for C. elegans
of codon frequencies = 1
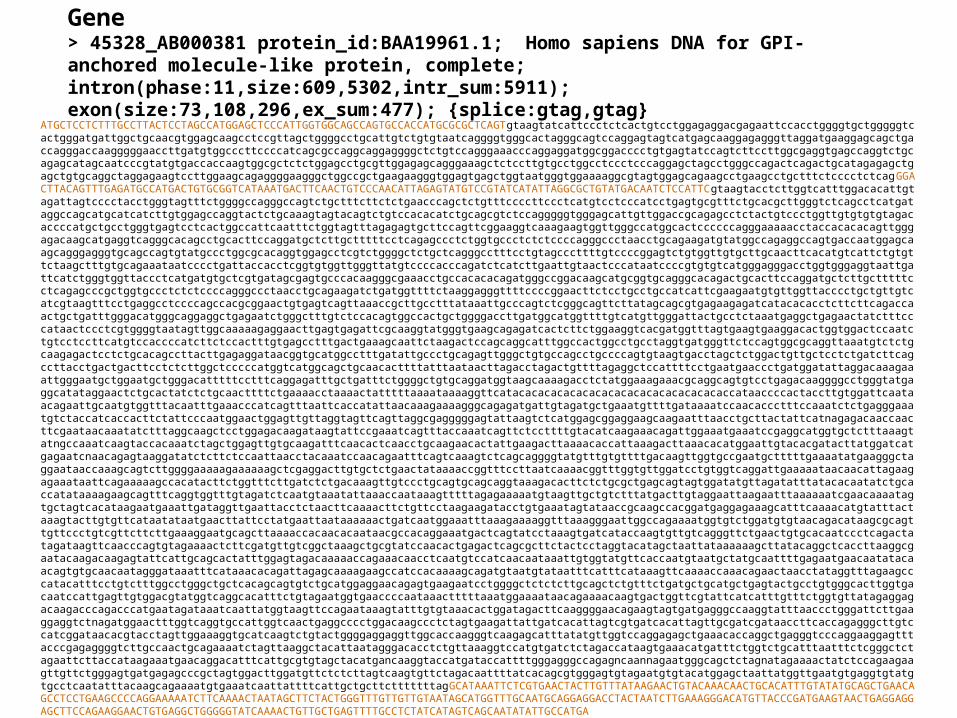
Gene > 45328_AB000381 protein_id:BAA19961.1; Homo sapiens DNA for GPI-anchored molecule-like protein, complete; intron(phase:11,size:609,5302,intr_sum:5911); exon(size:73,108,296,ex_sum:477); {splice:gtag,gtag}
ATGCTCCTCTTTGCCTTACTCCTAGCCATGGAGCTCCCATTGGTGGCAGCCAGTGCCACCATGCGCGCTCAGTgtaagtatcattccctctcactgtcctggagaggacgagaattccacctggggtgctgggggtcactgggatgattggctgcaacgtggagcaagcctccgttagctggggcctgcattgtctgtgtaatcaggggtgggcactagggcagtccaggagtagtcatgagcaaggagagggttaggatgaaggagcagctgaccagggaccaagggggaaccttgatgtggcccttccccatcagcgccaggcaggaggggctctgtccagggaaacccaggaggatggcggacccctgtgagtatccagtcttccttggcgaggtgagccaggtctgcagagcatagcaatcccgtatgtgaccaccaagtggcgctctctggagcctgcgttggagagcagggaaagctctccttgtgcctggcctccctcccaggagctagcctgggccagactcagactgcatagagagctgagctgtgcaggctaggagaagtccttggaagcagaggggaagggctggccgctgaagaagggtggagtgagctggtaatgggtggaaaaggcgtagtggagcagaagcctgaagcctgctttctcccctctcagGGACTTACAGTTTGAGATGCCATGACTGTGCGGTCATAAATGACTTCAACTGTCCCAACATTAGAGTATGTCCGTATCATATTAGGCGCTGTATGACAATCTCCATTCgtaagtacctcttggtcatttggacacattgtagattagtcccctacctgggtagtttctggggccagggccagtctgctttcttctctgaacccagctctgtttccccttccctcatgtcctcccatcctgagtgcgtttctgcacgcttgggtctcagcctcatgataggccagcatgcatcatcttgtggagccaggtactctgcaaagtagtacagtctgtccacacatctgcagcgtctccagggggtgggagcattgttggaccgcagagcctctactgtccctggttgtgtgtgtagacaccccatgctgcctgggtgagtcctcactggccattcaatttctggtagtttagagagtgcttccagttcggaaggtcaaagaagtggttgggccatggcactccccccagggaaaaacctaccacacacagttgggagacaagcatgaggtcagggcacagcctgcacttccaggatgctcttgctttttcctcagagccctctggtgccctctctccccagggccctaacctgcagaagatgtatggccagaggccagtgaccaatggagcaagcagggagggtgcagccagtgtatgccctggcgcacaggtggagcctcgtctggggctctgctcagggcctttcctgtagcccttttgtccccggagtctgtggttgtgcttgcaacttcacatgtcattctgtgttctaagctttgtgcagaaataatcccctgattaccacctcggtgtggttgggttatgtccccacccagatctcatcttgaattgtaactcccataatccccgtgtgtcatgggagggacctggtgggaggtaattgattcatctgggtggttaccctcatgatgtgctcgtgatagcgagtgcccacaagggcgaaacctgccacacacagatgggccggacaagcatgcggtgcagggcacagactgcacttccaggatgctcttgctttttcctcagagcccgctggtgccctctctccccagggccctaacctgcagaagatctgatggttttctaaggagggttttccccggaacttctcctgcctgccatcattcgaagaatgtgttggttacccctgctgttgtcatcgtaagtttcctgaggcctccccagccacgcggaactgtgagtcagttaaaccgcttgcctttataaattgcccagtctcgggcagttcttatagcagcgtgagaagagatcatacacacctcttcttcagaccaactgctgatttgggacatgggcaggaggctgagaatctgggctttgtctccacagtggccactgctggggaccttgatggcatggttttgtcatgttgggattactgcctctaaatgaggctgagaactatctttcccataactccctcgtggggtaatagttggcaaaaagaggaacttgagtgagattcgcaaggtatgggtgaagcagagatcactcttctggaaggtcacgatggtttagtgaagtgaaggacactggtggactccaatctgtcctccttcatgtccaccccatcttctccactttgtgagcctttgactgaaagcaattctaagactccagcaggcatttggccactggcctgcctaggtgatgggttctccagtggcgcaggttaaatgtctctgcaagagactcctctgcacagccttacttgagaggataacggtgcatggcctttgatattgccctgcagagttgggctgtgccagcctgccccagtgtaagtgacctagctctggactgttgctcctctgatcttcagccttacctgactgacttcctctcttggctcccccatggtcatggcagctgcaacacttttatttaataacttagacctagactgttttagaggctccattttcctgaatgaaccctgatggatattaggacaaagaaattgggaatgctggaatgctgggacatttttcctttcaggagatttgctgatttctggggctgtgcaggatggtaagcaaaagacctctatggaaagaaacgcaggcagtgtcctgagacaaggggcctgggtatgaggcatataggaactctgcactatctctgcaacttttctgaaaacctaaaactatttttaaaataaaaggttcatacacacacacacacacacacacacacacacacaccataaccccactaccttgtggattcaataacagaattgcaatgtggtttacaatttgaaacccatcagtttaattcaccatattaacaaagaaaagggcagagatgattgtagatgctgaaatgttttgataaaatccaacaccctttccaaatctctgagggaaatgtctaccatcaccacttctattcccaatggaactggagttgttaggtagttcagttaggcgagggggagtattaagtctcatggagcggaggaagcaagaatttaacctgcttactattcatnagagacaaccaacttcgaataacaaatatctttaggcaagctcctggagacaagataagtattccgaaatcagtttaccaaatcagttctccttttgtacatcaagaaacagattggaaatgaaatccgaggcatggtgctctttaaagtatngccaaatcaagtaccacaaatctagctggagttgtgcaagatttcaacactcaacctgcaagaacactattgaagacttaaaacaccattaaagacttaaacacatggaattgtacacgatacttatggatcatgagaatcnaacagagtaaggatatctcttctccaattaacctacaaatccaacagaatttcagtcaaagtctcagcaggggtatgtttgtgttttgacaagttggtgccgaatgctttttgaaaatatgaagggctaggaataaccaaagcagtcttggggaaaaagaaaaaagctcgaggacttgtgctctgaactataaaaccggtttccttaatcaaaacggtttggtgttggatcctgtggtcaggattgaaaaataacaacattagaagagaaataattcagaaaaagccacatacttctggtttcttgatctctgacaaagttgtccctgcagtgcagcaggtaaagacacttctctgcgctgagcagtagtggatatgttagatatttatacacaatatctgcaccatataaaagaagcagtttcaggtggtttgtagatctcaatgtaaatattaaaccaataaagtttttagagaaaaatgtaagttgctgtctttatgacttgtaggaattaagaatttaaaaaatcgaacaaaatagtgctagtcacataagaatgaaattgataggttgaattacctctaacttcaaaacttctgttcctaagaagatacctgtgaaatagtataaccgcaagccacggatgaggagaaagcatttcaaaacatgtatttactaaagtacttgtgttcataatataatgaacttattcctatgaattaataaaaaactgatcaatggaaatttaaagaaaaggtttaaagggaattggccagaaaatggtgtctggatgtgtaacagacataagcgcagttgttccctgtcgttcttcttgaaaggaatgcagcttaaaaccacaacacaataacgccacaggaaatgactcagtatcctaaagtgatcataccaagtgttgtcagggttctgaactgtgcacaatccctcagactatagataagttcaacccagtgtagaaaactcttcgatgttgtcggctaaagctgcgtatccaacactgagactcagcgcttctactcctaggtacatagctaattataaaaaagcttatacaggctcaccttaaggcgaatacaagacaagagtattcattgcagcactatttggagtagacaaaaaccagaaacaacctcaatgtccatcaacaataaattgtggtatgttcaccaatgtaatgctatgcaattttgagaatgaacaatatacaacagtgtgcaacaatagggataaatttcataaacacagattagagcaaaagaagccatccacaaaagcagatgtaatgtataatttcatttcataaagttcaaaaccaaacagaactaacctataggtttagaagcccatacatttcctgtctttggcctgggctgctcacagcagtgtctgcatggaggaacagagtgaagaatcctggggctctctcttgcagctctgtttctgatgctgcatgctgagtactgcctgtgggcacttggtgacaatccattgagttgtggacgtatggtcaggcacatttctgtagaatggtgaaccccaataaactttttaaatggaaaataacagaaaacaagtgactggttcgtattcatcatttgtttctggtgttatagaggagacaagacccagacccatgaatagataaatcaattatggtaagttccagaataaagtatttgtgtaaacactggatagacttcaaggggaacagaagtagtgatgagggccaaggtatttaaccctgggattcttgaaggaggtctnagatggaactttggtcaggtgccattggtcaactgaggcccctggacaagccctctagtgaagattattgatcacattagtcgtgatcacattagttgcgatcgataaccttcaccagagggcttgtccatcggataacacgtacctagttggaaaggtgcatcaagtctgtactggggaggaggttggcaccaagggtcaagagcatttatatgttggtccaggagagctgaaacaccaggctgagggtcccaggaaggagtttacccgagaggggtcttgccaactgcagaaaatctagttaaggctacattaatagggacacctctgttaaaggtccatgtgatctctagaccataagtgaaacatgatttctggtctgcatttaatttctcgggctctagaattcttaccataagaaatgaacaggacatttcattgcgtgtagctacatgancaaggtaccatgataccattttgggagggccagagncaannagaatgggcagctctagnatagaaaactatctccagaagaagttgttctgggagtgatgagagcccgctagtggacttggatgttctctcttagtcaagtgttctagacaattttatcacagcgtgggagtgtagaatgtgtacatggagctaattatggttgaatgtgaggtgtatgtgcctcaatatttacaagcagaaaatgtgaaatcaattattttcattgctgcttctttttttagGCATAAATTCTCGTGAACTACTTGTTTATAAGAACTGTACAAACAACTGCACATTTGTATATGCAGCTGAACAGCCTCCTGAAGCCCCAGGAAAAATCTTCAAAACTAATAGCTTCTACTGGGTTTGTTGTTGTAATAGCATGGTTTGCAATGCAGGAGGACCTACTAATCTTGAAAGGGACATGTTACCCGATGAAGTAACTGAGGAGGAGCTTCCAGAAGGAACTGTGAGGCTGGGGGTATCAAAACTGTTGCTGAGTTTTGCCTCTATCATAGTCAGCAATATATTGCCATGA
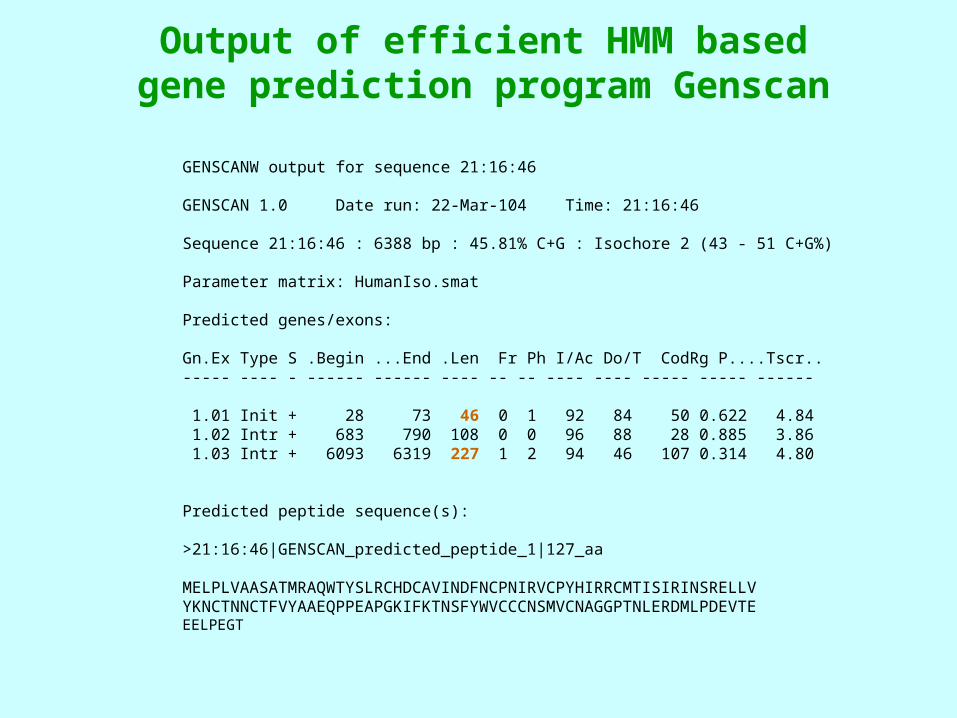
Output of efficient HMM based gene prediction program Genscan
GENSCANW output for sequence 21:16:46 GENSCAN 1.0 Date run: 22-Mar-104 Time: 21:16:46 Sequence 21:16:46 : 6388 bp : 45.81% C+G : Isochore 2 (43 - 51 C+G%) Parameter matrix: HumanIso.smat Predicted genes/exons: Gn.Ex Type S .Begin ...End .Len Fr Ph I/Ac Do/T CodRg P....Tscr..----- ---- - ------ ------ ---- -- -- ---- ---- ----- ----- ------ 1.01 Init + 28 73 46 0 1 92 84 50 0.622 4.84 1.02 Intr + 683 790 108 0 0 96 88 28 0.885 3.86 1.03 Intr + 6093 6319 227 1 2 94 46 107 0.314 4.80 Predicted peptide sequence(s): >21:16:46|GENSCAN_predicted_peptide_1|127_aa
MELPLVAASATMRAQWTYSLRCHDCAVINDFNCPNIRVCPYHIRRCMTISIRINSRELLVYKNCTNNCTFVYAAEQPPEAPGKIFKTNSFYWVCCCNSMVCNAGGPTNLERDMLPDEVTEEELPEGT
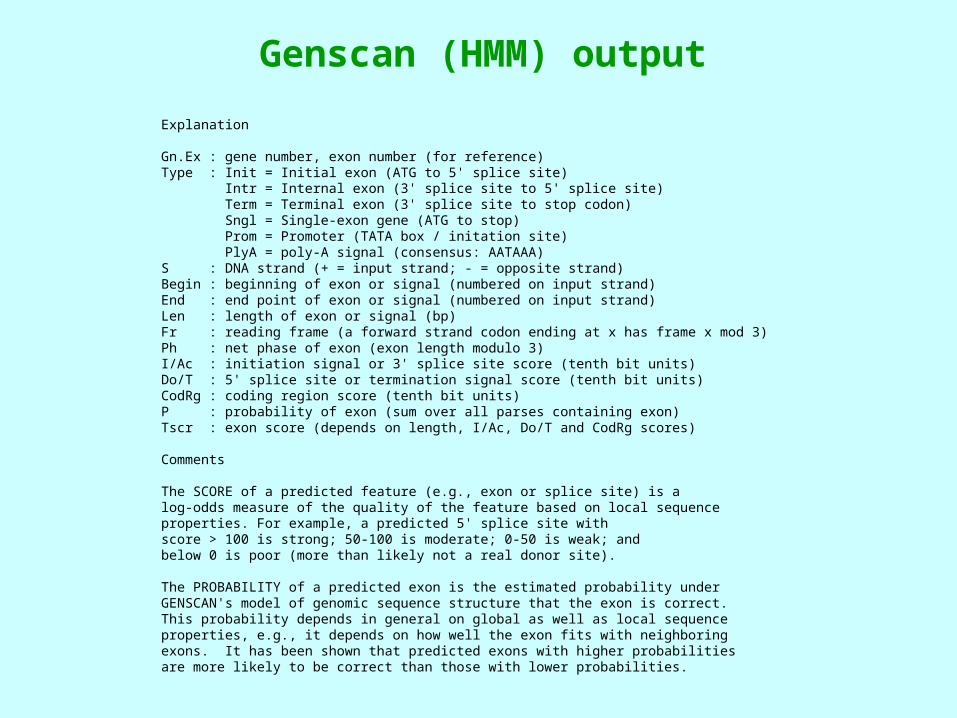
Genscan (HMM) output
Explanation Gn.Ex : gene number, exon number (for reference)Type : Init = Initial exon (ATG to 5' splice site) Intr = Internal exon (3' splice site to 5' splice site) Term = Terminal exon (3' splice site to stop codon) Sngl = Single-exon gene (ATG to stop) Prom = Promoter (TATA box / initation site) PlyA = poly-A signal (consensus: AATAAA)S : DNA strand (+ = input strand; - = opposite strand)Begin : beginning of exon or signal (numbered on input strand)End : end point of exon or signal (numbered on input strand)Len : length of exon or signal (bp)Fr : reading frame (a forward strand codon ending at x has frame x mod 3)Ph : net phase of exon (exon length modulo 3)I/Ac : initiation signal or 3' splice site score (tenth bit units)Do/T : 5' splice site or termination signal score (tenth bit units)CodRg : coding region score (tenth bit units)P : probability of exon (sum over all parses containing exon)Tscr : exon score (depends on length, I/Ac, Do/T and CodRg scores) Comments The SCORE of a predicted feature (e.g., exon or splice site) is alog-odds measure of the quality of the feature based on local sequenceproperties. For example, a predicted 5' splice site withscore > 100 is strong; 50-100 is moderate; 0-50 is weak; andbelow 0 is poor (more than likely not a real donor site). The PROBABILITY of a predicted exon is the estimated probability underGENSCAN's model of genomic sequence structure that the exon is correct.This probability depends in general on global as well as local sequenceproperties, e.g., it depends on how well the exon fits with neighboringexons. It has been shown that predicted exons with higher probabilitiesare more likely to be correct than those with lower probabilities.
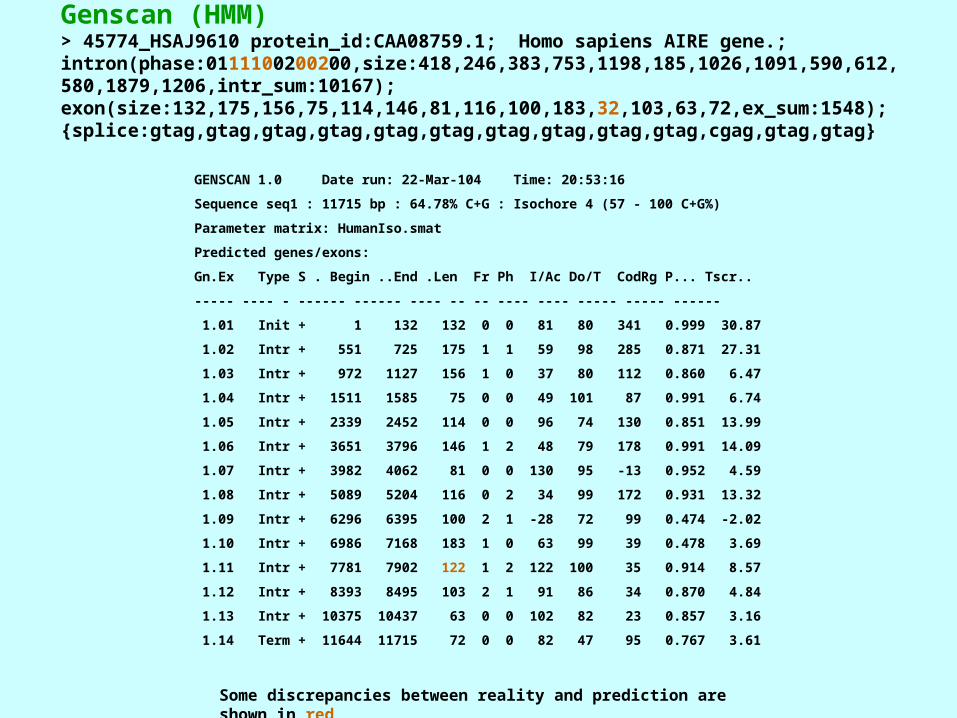
Genscan (HMM)> 45774_HSAJ9610 protein_id:CAA08759.1; Homo sapiens AIRE gene.; intron(phase:0111100200200,size:418,246,383,753,1198,185,1026,1091,590,612,580,1879,1206,intr_sum:10167); exon(size:132,175,156,75,114,146,81,116,100,183,32,103,63,72,ex_sum:1548); {splice:gtag,gtag,gtag,gtag,gtag,gtag,gtag,gtag,gtag,gtag,cgag,gtag,gtag}
GENSCAN 1.0 Date run: 22-Mar-104 Time: 20:53:16
Sequence seq1 : 11715 bp : 64.78% C+G : Isochore 4 (57 - 100 C+G%)
Parameter matrix: HumanIso.smat
Predicted genes/exons:
Gn.Ex Type S . Begin ..End .Len Fr Ph I/Ac Do/T CodRg P... Tscr..
----- ---- - ------ ------ ---- -- -- ---- ---- ----- ----- ------
1.01 Init + 1 132 132 0 0 81 80 341 0.999 30.87
1.02 Intr + 551 725 175 1 1 59 98 285 0.871 27.31
1.03 Intr + 972 1127 156 1 0 37 80 112 0.860 6.47
1.04 Intr + 1511 1585 75 0 0 49 101 87 0.991 6.74
1.05 Intr + 2339 2452 114 0 0 96 74 130 0.851 13.99
1.06 Intr + 3651 3796 146 1 2 48 79 178 0.991 14.09
1.07 Intr + 3982 4062 81 0 0 130 95 -13 0.952 4.59
1.08 Intr + 5089 5204 116 0 2 34 99 172 0.931 13.32
1.09 Intr + 6296 6395 100 2 1 -28 72 99 0.474 -2.02
1.10 Intr + 6986 7168 183 1 0 63 99 39 0.478 3.69
1.11 Intr + 7781 7902 122 1 2 122 100 35 0.914 8.57
1.12 Intr + 8393 8495 103 2 1 91 86 34 0.870 4.84
1.13 Intr + 10375 10437 63 0 0 102 82 23 0.857 3.16
1.14 Term + 11644 11715 72 0 0 82 47 95 0.767 3.61
Some discrepancies between reality and prediction are shown in red
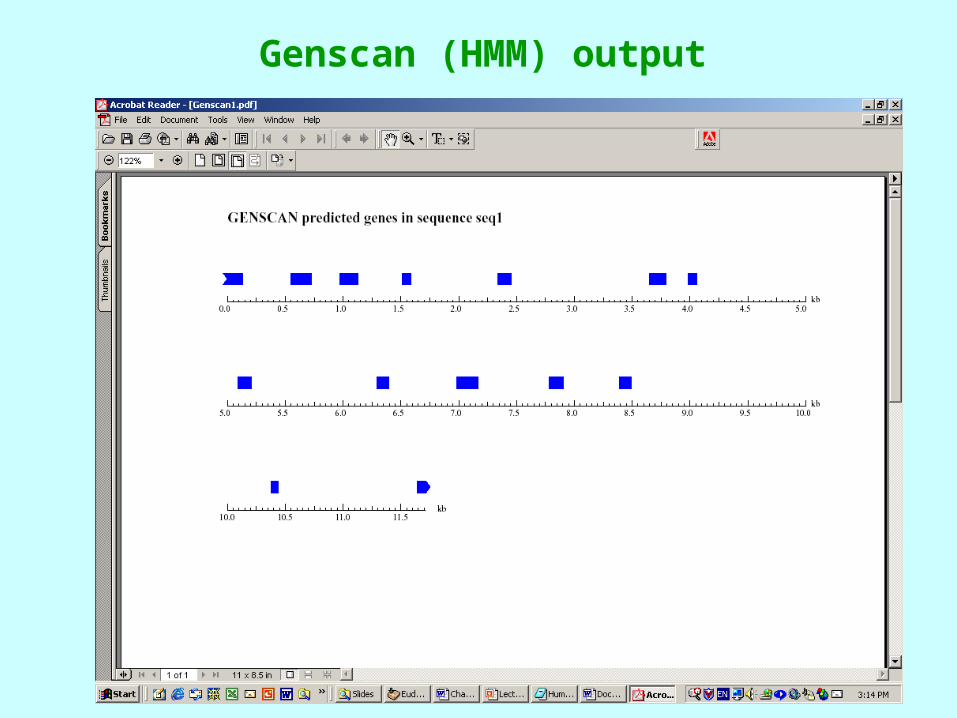
Genscan (HMM) output
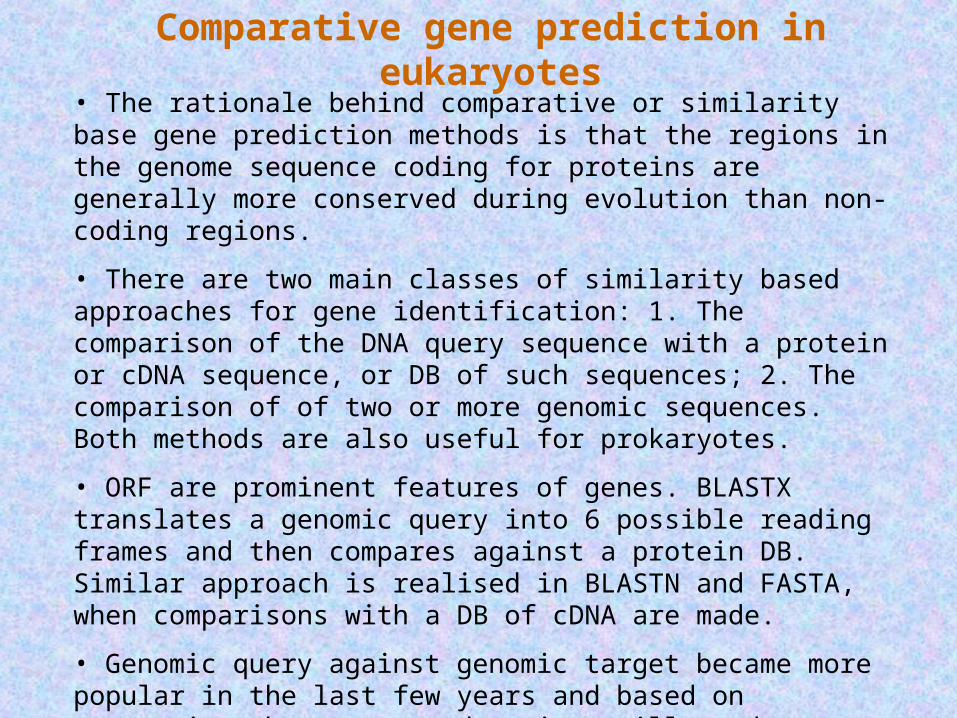
• The rationale behind comparative or similarity base gene prediction methods is that the regions in the genome sequence coding for proteins are generally more conserved during evolution than non-coding regions.
• There are two main classes of similarity based approaches for gene identification: 1. The comparison of the DNA query sequence with a protein or cDNA sequence, or DB of such sequences; 2. The comparison of of two or more genomic sequences. Both methods are also useful for prokaryotes.
• ORF are prominent features of genes. BLASTX translates a genomic query into 6 possible reading frames and then compares against a protein DB. Similar approach is realised in BLASTN and FASTA, when comparisons with a DB of cDNA are made.
• Genomic query against genomic target became more popular in the last few years and based on assumption that conserved regions will tend to correspond to coding exons from homologous genes. A number of specialised programs were developed.
• Ever growing power of different DB makes these methods much more efficient and popular.
Comparative gene prediction in eukaryotes
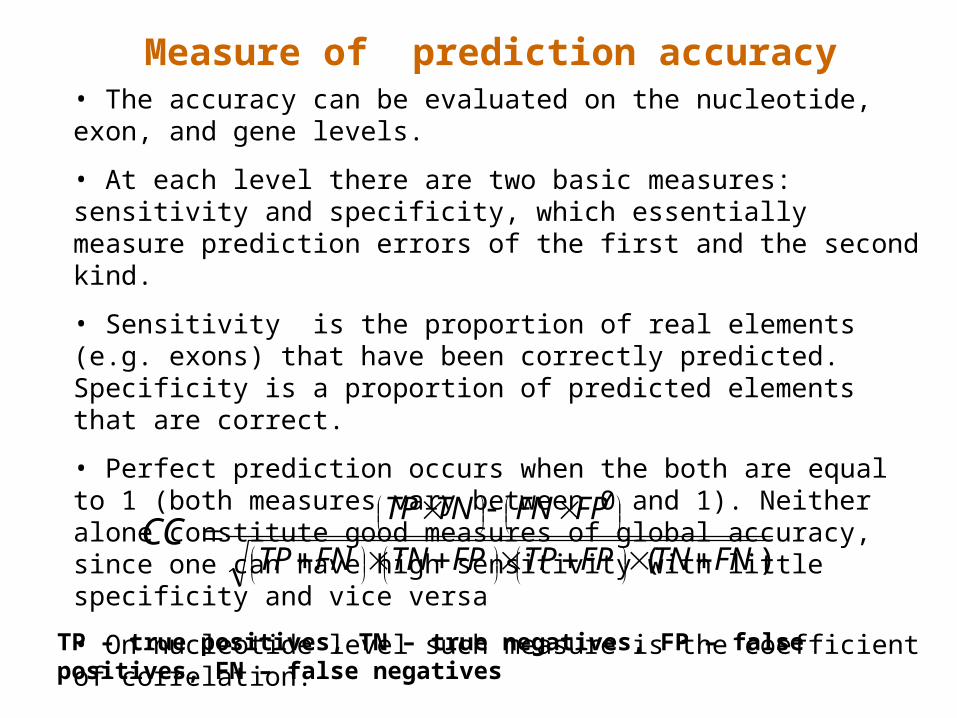
• The accuracy can be evaluated on the nucleotide, exon, and gene levels.
• At each level there are two basic measures: sensitivity and specificity, which essentially measure prediction errors of the first and the second kind.
• Sensitivity is the proportion of real elements (e.g. exons) that have been correctly predicted. Specificity is a proportion of predicted elements that are correct.
• Perfect prediction occurs when the both are equal to 1 (both measures vary between 0 and 1). Neither alone constitute good measures of global accuracy, since one can have high sensitivity with little specificity and vice versa
• On nucleotide level such measure is the coefficient of correlation:
Measure of prediction accuracy
)( FNTNFPTPFPTNFNTP
FPFNTNTPCC
TP – true positives, TN – true negatives, FP – false positives, FN – false negatives