Embed Size (px)
Citation preview
1
Report
Biogas and bio-syngas upgrading
Carried out by:
Danish Technological Institute
Laura Bailón Allegue and Jørgen Hinge
Kongsvang Allé 29
DK–8000 Aarhus C
Date: December 2012
2
Content
1 Summary ...................................................................................................................... 5
2 Introduction ................................................................................................................. 6
3 Biogas composition .................................................................................................... 7
3.1 Biogas quality versus feedstock composition ............................................................. 9
3.2 Biogas quality versus production process ................................................................. 12
4 Biogas quality for energy uses ................................................................................ 15
4.1 Biogas for only heat production .................................................................................. 16
4.2 Biogas to cogeneration systems (CHP) ...................................................................... 17
4.2.1 Biogas for internal combustion engines ................................................................................... 17 4.2.2 Biogas for Stirling engines ....................................................................................................... 18 4.2.3 Biogas for gas turbines and micro-turbines ............................................................................. 18 4.2.4 Biogas for fuel cells .................................................................................................................. 20
4.3 Biogas into the natural gas grid .................................................................................. 22 4.3.1 Biomethane standards ............................................................................................................. 24
4.4 Biogas as vehicle fuel .................................................................................................. 30
4.5 Biogas as CNG and LNG .............................................................................................. 30
5 Biogas upgrading technologies ............................................................................... 31
5.1 Adsorption .................................................................................................................... 31
5.2 Water Scrubbing ........................................................................................................... 33
5.3 Physical Absorption ..................................................................................................... 36
5.4 Chemical Absorption .................................................................................................... 37
5.5 Membrane Technology ................................................................................................. 38
5.6 Cryogen technique ....................................................................................................... 40
5.7 Biological methane enrichment ................................................................................... 42
5.8 Ecological lung ............................................................................................................. 43
5.9 Summary of upgrading technologies specifications ................................................. 44
6 Biogas cleaning methods ......................................................................................... 49
6.1 Hydrogen sulfide removal ............................................................................................ 49 6.1.1 In-situ (digester) sulfide abatement by addition of iron salts/oxides to the digester slurry ...... 51 6.1.2 In-situ biological H2S reduction by air/oxygen dosing to digester slurry .................................. 52 6.1.3 Adsorption ................................................................................................................................ 53 6.1.4 Absorption/Scrubbing .............................................................................................................. 57 6.1.5 Membrane separation .............................................................................................................. 59 6.1.6 Biofilters and biotrickling filters ................................................................................................ 59 6.1.7 Bioscrubber .............................................................................................................................. 61
6.2 Water removal ............................................................................................................... 62
3
6.2.1 Water condensation ................................................................................................................. 62 6.2.2 Water adsorption ..................................................................................................................... 63 6.2.3 Water absorption ..................................................................................................................... 63
6.3 Siloxanes removal ........................................................................................................ 63
6.4 Halogenated hydrocarbons removal ........................................................................... 65
6.5 Oxygen removal ............................................................................................................ 66
6.6 Nitrogen removal .......................................................................................................... 66
6.7 Ammonia removal ......................................................................................................... 66
6.8 Particle removal ............................................................................................................ 66
7 Overview of system propagation ............................................................................. 67
8 Converting biogas to non-cryogenic liquid fuels ................................................... 71
9 Biogas as feedstock .................................................................................................. 71
10 Gas composition from thermal gasification units ............................................... 72
10.1 Impact from gasifier type ............................................................................................. 72
10.2 Impact on product gas from different types of biomass ............................................ 74
11 Gas quality from thermal gasification plants ...................................................... 75
12 Cleaning process ................................................................................................... 76
12.1 Particulate removal ....................................................................................................... 76
12.2 Tar Conversion ............................................................................................................. 77
12.2.1 Thermal partial oxidation ......................................................................................................... 77 12.2.2 Catalytic oxidation .................................................................................................................... 77 12.2.3 Scrubbing ................................................................................................................................. 78
12.3 Hydrochloric acid, ammonia, and sulfur removal....................................................... 78 12.3.1 Adsorption processes .............................................................................................................. 78
12.3.2 Rectisol and Selexol absorption process ............................................................................. 79 12.3.3 Membrane solutions ................................................................................................................ 79 12.3.4 COS hydrolyses ....................................................................................................................... 79
12.4 Chloride and alkali removal ......................................................................................... 79
12.5 Carbon dioxide removal ............................................................................................... 79
13 Methane production from bio-syngas .................................................................. 81
14 Liquid fuel production from bio-syngas .............................................................. 81
14.1 Methanol ........................................................................................................................ 82
14.2 Fischer-Tropsch process ............................................................................................. 83
15 Biomass thermal gasification ongoing activities ................................................ 84
15.1 Rentech ......................................................................................................................... 84
15.2 The Güssing gasifier .................................................................................................... 85
4
15.3 EON – SNG production, Göteborg Energy .................................................................. 86
15.4 Enerkem ........................................................................................................................ 86
15.5 MILENA and OLGA processes ..................................................................................... 86
15.6 VTT Ultra Clean Fuel Gas (UCG) process ................................................................... 87
15.7 Carbo-V Process ........................................................................................................... 87
15.8 Chemrec ........................................................................................................................ 87
15.9 GreatPoint Energy ........................................................................................................ 88
15.10 The Blue Tower concept ........................................................................................... 88
15.11 CORTUS-WoodRoll three-stage gasification ........................................................... 88
15.12 Absorption Enhanced Reforming at ZSW ................................................................ 89
15.13 The FZK Bioliq ........................................................................................................... 89
16 Conclusions ........................................................................................................... 90
References ....................................................................................................................... 92
List of abbreviations ........................................................................................................ 97

5
1 Summary
Biogas from digestion of biomass and bio-syngas from thermal gasification need to be upgraded
and cleaned before being injected into the natural gas grid or used as vehicle fuel or in the
manufacturing of high value products. The gas composition is mainly determined by the type and
quality of the biomass, as well as the conditions of the gas generation process.
Several countries have defined their own different gas quality requirements for the injection of
biogas into the natural gas grid and/or for its utilization as vehicle fuel. In order to enhance the
biogas expansion through Europe there is ongoing work to establish a common European
Standard on biomethane, the first draft expected to be ready at the beginning of 2014.
There are different upgrading technologies to separate CO2 from biogas. The most used processes
are water scrubbing and pressure swing adsorption, followed by chemical scrubbing. New methods
like membrane cleaning and the cryogenic techniques are being tested and commercialized. Apart
from the CO2, impurities as particles, water, hydrogen sulfide and ammonia also have to be
removed. Gas from municipal waste can also contain organo-chlorine or -fluorine compounds, and
siloxanes.
At least 190 biogas upgrading plants for vehicle use or biogas injection into the natural gas grid
have been registered in Europe and 12 in USA in 2012. Germany and Sweden have the highest
number of plants.
Upgrading of syngas from thermal gasification of biomass is still under development. Only a few
test plants have been built. The technology to clean and upgrade synthesis gas from coal
gasification is however a well know technology, which can be used directly on syngas from
biomass. Nevertheless, those processes are quite complicated and very often they must be built in
very big scale to be economical feasible. As biomass resources typically are not available in huge
amounts it can be difficult to combine biomass with this kind of cleaning and upgrading technology.
In the thermal process beside impurities as sulfur compounds and ammonia, tar must be also
taken into account. Gasification takes place at 800 – 900 °C in many types of gasifiers and at that
temperature tar becomes a downstream problem unless internal cleaning processes in the gasifier
have been applied.
Catalytic cracking or partial oxidations can be utilized for tar conversion. Many investigations have
been carried out at university level, but only a few at full scale and not all with success.
In thermal gasification ash particles constitute another problem that must be considered. An
Entrained Flow Gasifier can remove both tar and particles, but in some cases the ash amount is
too small and the addition of more particles is necessary. Particles can be also removed in high
temperature filters or by washing.
Big companies as Shell and Sasol have many years of experience in coal gasification and
conversion of syngas to methanol and other products via Fischer–Tropsch process. But the
production of bio–syngas is in the developing stage. The first demonstration plant producing
6
biomethane thermochemically out of solid biomass started operation in late 2008 in Austria and
EON is building a biomethane plant from thermal gasification of biomass in Gothenburg. The first
phase of 20 MW is planned to be operational in late 2012.
Catalyst manufactures as Johnson Matthey, Topsøe and UOP are developing catalysts for the
conversion of biomass to valuable products, methane, methanol diesel, jet fuel, olefines and
dimethylether (DME) being among the most interesting products.
The end uses of biogas and bio-syngas are many, but the technologies or integration of
technologies that allow their utilization are relatively new, and vary as a function of the biomass
feedstock and gas production process, and of course of the end use itself. Therefore different
combinations must be proven to find the best route.
2 Introduction
Today the challenge is to increase the sustainability of fuels and chemical products by using
innovative systems, processes and technologies.
Biomass is an important potential energy source for the future and has many use possibilities.
Sustainable fuel-based biorefinery concepts are systems in which food, high value raw chemicals
for industry, and energy can be produced from biomass. Combining a variety of technologies
achieves a reduction in production costs and minimizes the use of fossil energy sources, whilst
reusing excess materials and by-products. Thus the ecological footprint is minimized.
Biogas from anaerobic digestion of waste, residues and energy crops, as well as syngas from
biomass gasification are versatile renewable sources, which can be used for replacement of fossil
fuels in power and heat production and in transport. Moreover they can replace also natural gas as
feedstock for producing chemical compounds.
Biogas plants make as well a valuable contribution to the solution of a range of problems
concerning agricultural and environmental interests. The biogas concept offers a total appropriate
system for treatment, sanitation, redistribution and nutrient utilization from livestock slurry and
organic waste.
Biogas production potential is significant. It has been suggested that a major part of the EU 27
renewable energy target for 2020 (20% in energy consumption and at least 10% of all vehicle fuel
sold) will originate from bioenergy and at least 25% of bioenergy could came from biogas produced
from wet organic materials (Holm–Nielsen, 2009).
Gasification is a highly versatile process. Virtually any biomass feedstock can be converted to fuel
gas with high efficiency. Combining gasification with the catalytic upgrading of the syngas to a
liquid fuel (using, for example, the Fischer-Tropsch process) has the potential to produce a range
of synthetic biofuels (synfuels) with low greenhouse gas (GHG) intensity.
This report presents a description of the different end uses of biogas and bio-syngas, mainly
focused on energy uses, together with the state of the art of the main technologies to upgrade such
gases.
7
3 Biogas composition
Biogas is a product from the anaerobic digestion of organic material, such as manure, sewage
sludge, the organic fraction of household and industry waste, and energy crops. All types of
biomass can be used as substrates for biogas production as long as they contain carbohydrates,
proteins, fats, cellulose, and hemicelluloses as main components. Only strong lignified organic
substances, e.g., wood are not suitable due to the slowly anaerobic decomposition.
Biogas is a mixture of methane (40 – 75%) and carbon dioxide (15 – 60%) with small amounts of
other gases and by-products, i.e. nitrogen (0 – 2%), carbon monoxide (< 0.6%), hydrogen sulfide
(0.005 – 2%), oxygen (0 – 1%) and ammonia (< 1%). Trace amounts of siloxanes (0 – 0.02%),
halogenated hydrocarbons (< 0.65%) and other non-methane organic compounds as aromatic
hydrocarbons, alkanes, alkenes, etc., are also occasionally present. Usually this mixed gas is
saturated with water vapour and may contain dust particles (Ryckebosch, 2011).
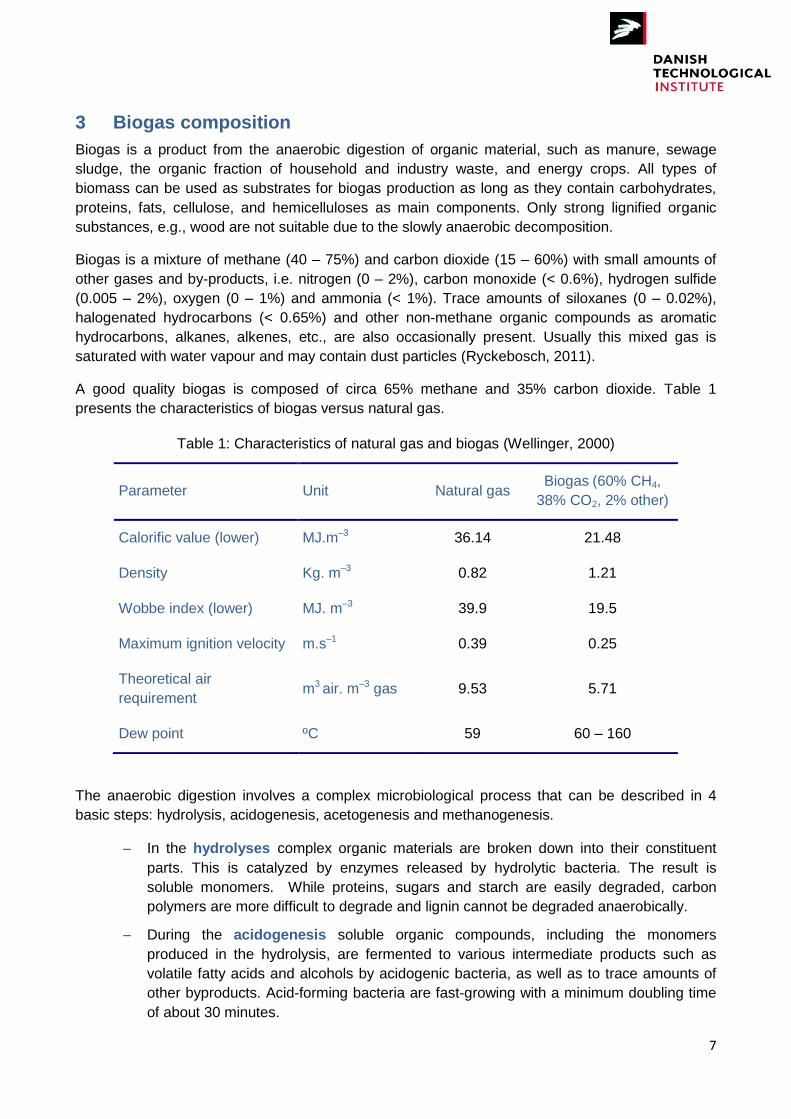
A good quality biogas is composed of circa 65% methane and 35% carbon dioxide. Table 1
presents the characteristics of biogas versus natural gas.
Table 1: Characteristics of natural gas and biogas (Wellinger, 2000)
Parameter Unit Natural gas Biogas (60% CH4,
38% CO2, 2% other)
Calorific value (lower) MJ.m–3 36.14 21.48
Density Kg. m–3 0.82 1.21
Wobbe index (lower) MJ. m–3 39.9 19.5
Maximum ignition velocity m.s–1 0.39 0.25
Theoretical air
requirement m3 air. m–3 gas 9.53 5.71
Dew point ºC 59 60 – 160
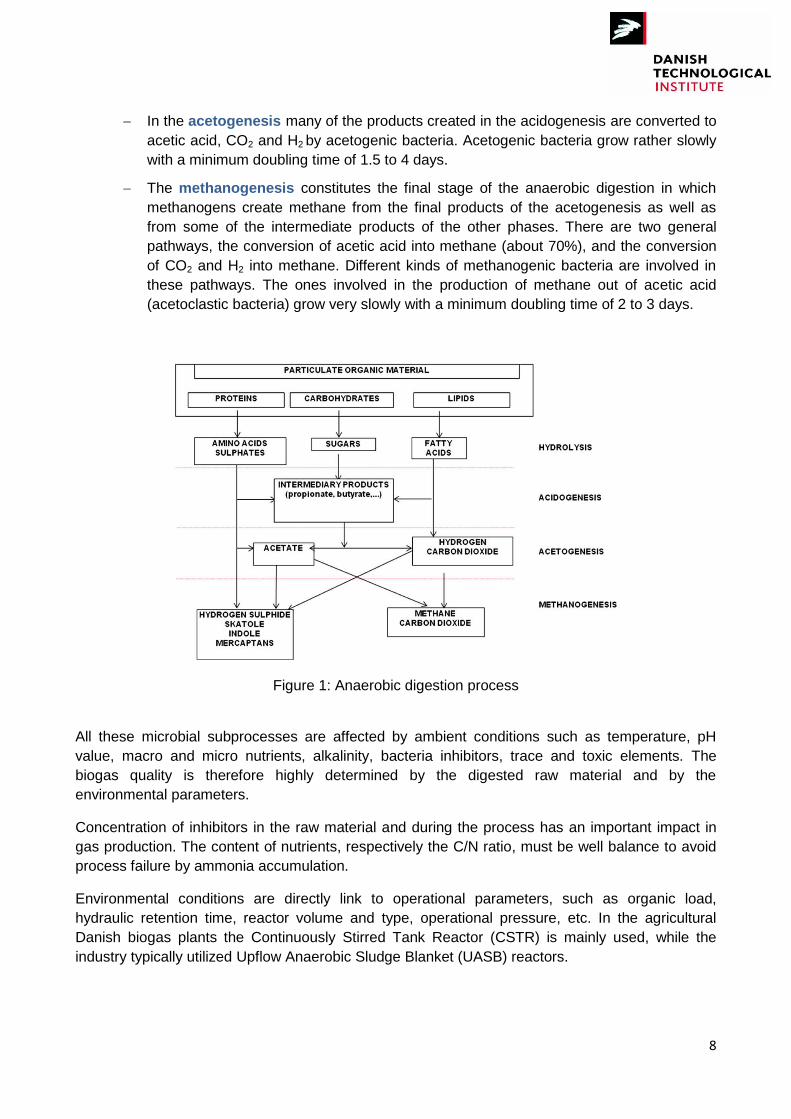
The anaerobic digestion involves a complex microbiological process that can be described in 4
basic steps: hydrolysis, acidogenesis, acetogenesis and methanogenesis.
In the hydrolyses complex organic materials are broken down into their constituent
parts. This is catalyzed by enzymes released by hydrolytic bacteria. The result is
soluble monomers. While proteins, sugars and starch are easily degraded, carbon
polymers are more difficult to degrade and lignin cannot be degraded anaerobically.
During the acidogenesis soluble organic compounds, including the monomers
produced in the hydrolysis, are fermented to various intermediate products such as
volatile fatty acids and alcohols by acidogenic bacteria, as well as to trace amounts of
other byproducts. Acid-forming bacteria are fast-growing with a minimum doubling time
of about 30 minutes.
8
In the acetogenesis many of the products created in the acidogenesis are converted to
acetic acid, CO2 and H2 by acetogenic bacteria. Acetogenic bacteria grow rather slowly
with a minimum doubling time of 1.5 to 4 days.
The methanogenesis constitutes the final stage of the anaerobic digestion in which
methanogens create methane from the final products of the acetogenesis as well as
from some of the intermediate products of the other phases. There are two general
pathways, the conversion of acetic acid into methane (about 70%), and the conversion
of CO2 and H2 into methane. Different kinds of methanogenic bacteria are involved in
these pathways. The ones involved in the production of methane out of acetic acid
(acetoclastic bacteria) grow very slowly with a minimum doubling time of 2 to 3 days.
Figure 1: Anaerobic digestion process
All these microbial subprocesses are affected by ambient conditions such as temperature, pH
value, macro and micro nutrients, alkalinity, bacteria inhibitors, trace and toxic elements. The
biogas quality is therefore highly determined by the digested raw material and by the
environmental parameters.
Concentration of inhibitors in the raw material and during the process has an important impact in
gas production. The content of nutrients, respectively the C/N ratio, must be well balance to avoid
process failure by ammonia accumulation.
Environmental conditions are directly link to operational parameters, such as organic load,
hydraulic retention time, reactor volume and type, operational pressure, etc. In the agricultural
Danish biogas plants the Continuously Stirred Tank Reactor (CSTR) is mainly used, while the
industry typically utilized Upflow Anaerobic Sludge Blanket (UASB) reactors.
9
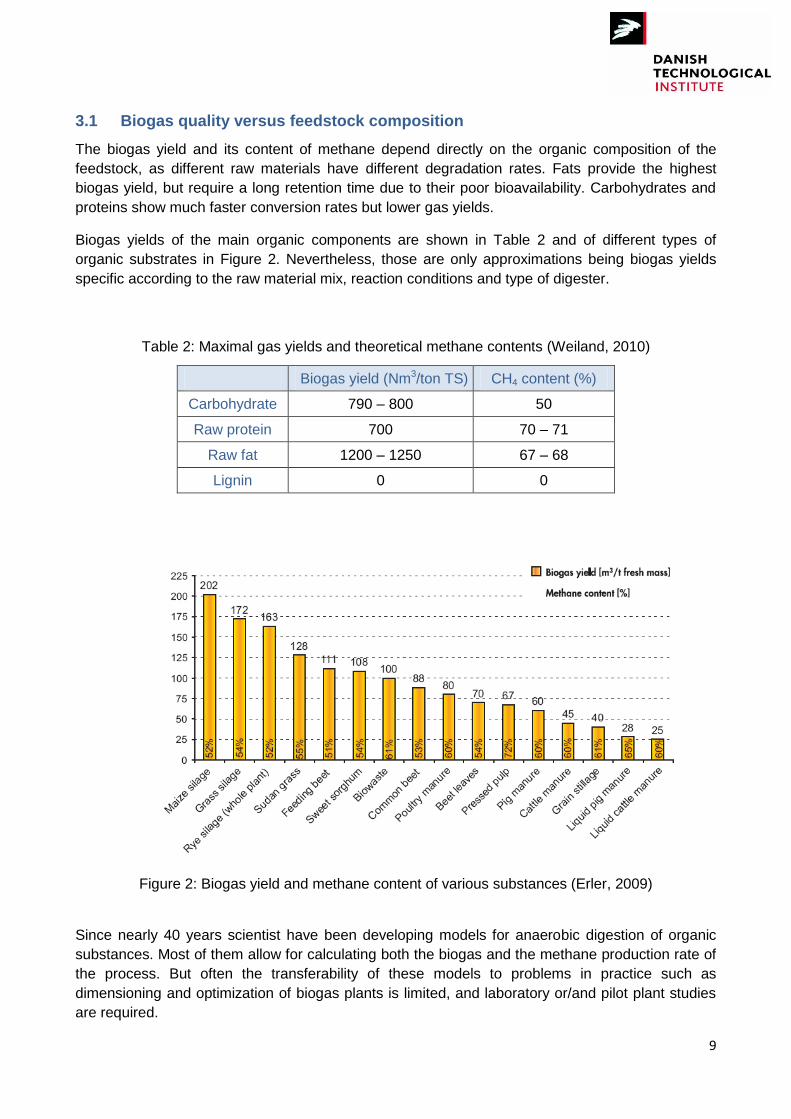
3.1 Biogas quality versus feedstock composition
The biogas yield and its content of methane depend directly on the organic composition of the
feedstock, as different raw materials have different degradation rates. Fats provide the highest
biogas yield, but require a long retention time due to their poor bioavailability. Carbohydrates and
proteins show much faster conversion rates but lower gas yields.
Biogas yields of the main organic components are shown in Table 2 and of different types of
organic substrates in Figure 2. Nevertheless, those are only approximations being biogas yields
specific according to the raw material mix, reaction conditions and type of digester.
Table 2: Maximal gas yields and theoretical methane contents (Weiland, 2010)
Biogas yield (Nm3/ton TS) CH4 content (%)
Carbohydrate 790 – 800 50
Raw protein 700 70 – 71
Raw fat 1200 – 1250 67 – 68
Lignin 0 0
Figure 2: Biogas yield and methane content of various substances (Erler, 2009)
Since nearly 40 years scientist have been developing models for anaerobic digestion of organic
substances. Most of them allow for calculating both the biogas and the methane production rate of
the process. But often the transferability of these models to problems in practice such as
dimensioning and optimization of biogas plants is limited, and laboratory or/and pilot plant studies
are required.
10
Simple ways of calculate the biogas production of organic matter are the models of Buswell and
Mueller (1952), Boyle (1976), Baserga (1998), Keymer & Schilcher (2003) or Amon et. al (2007)
(Gerber, 2008). These are time independent models based on data of the chemical organic matter
composition and result only in values for the production of the main biogas components.
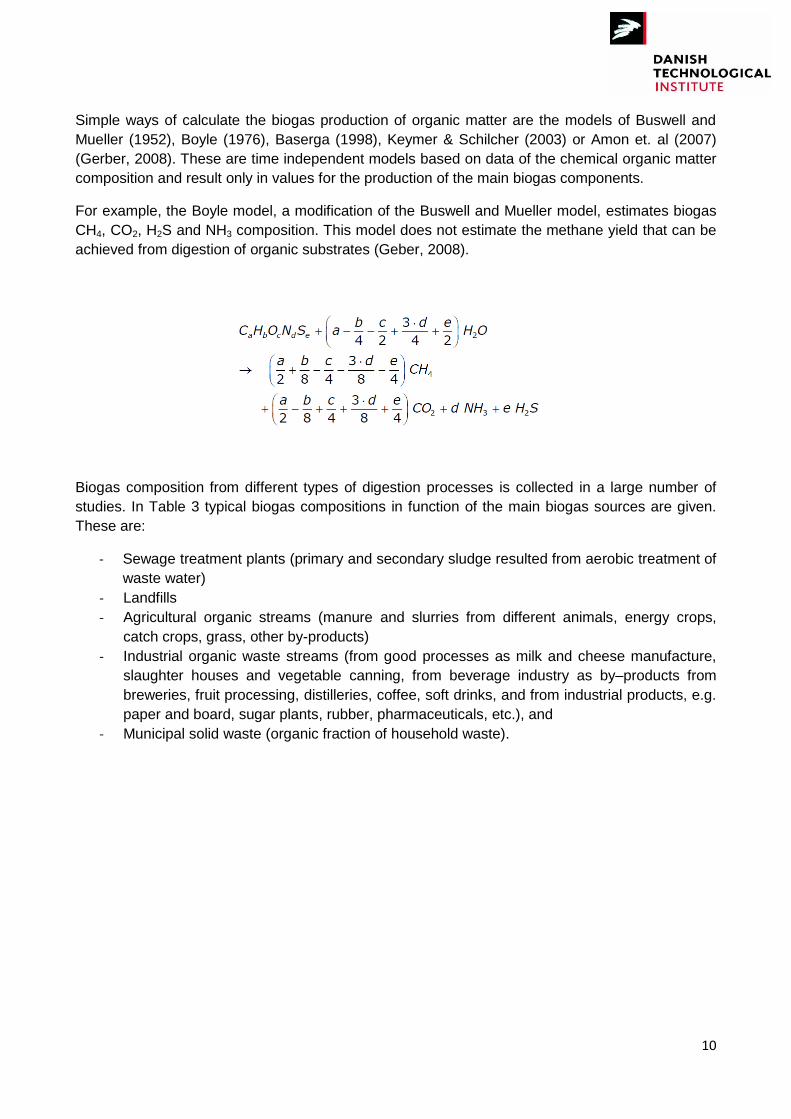
For example, the Boyle model, a modification of the Buswell and Mueller model, estimates biogas
CH4, CO2, H2S and NH3 composition. This model does not estimate the methane yield that can be
achieved from digestion of organic substrates (Geber, 2008).
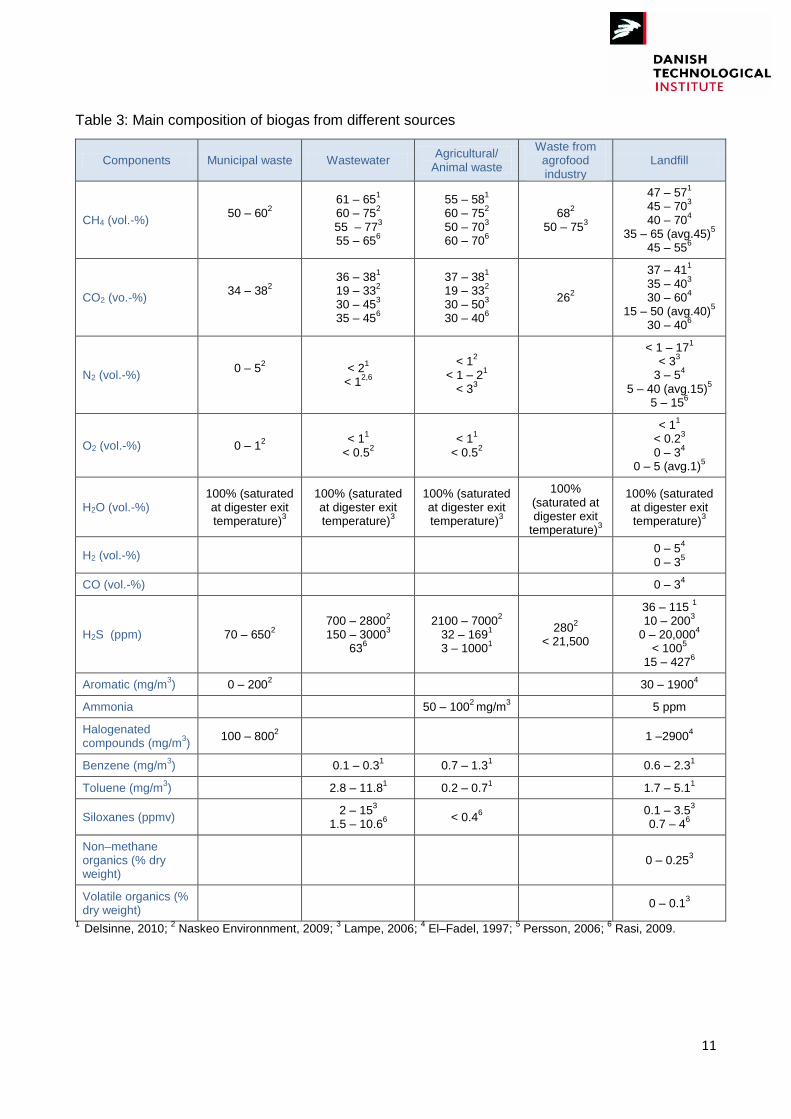
Biogas composition from different types of digestion processes is collected in a large number of
studies. In Table 3 typical biogas compositions in function of the main biogas sources are given.
These are:
- Sewage treatment plants (primary and secondary sludge resulted from aerobic treatment of
waste water)
- Landfills
- Agricultural organic streams (manure and slurries from different animals, energy crops,
catch crops, grass, other by-products)
- Industrial organic waste streams (from good processes as milk and cheese manufacture,
slaughter houses and vegetable canning, from beverage industry as by–products from
breweries, fruit processing, distilleries, coffee, soft drinks, and from industrial products, e.g.
paper and board, sugar plants, rubber, pharmaceuticals, etc.), and
- Municipal solid waste (organic fraction of household waste).
11
Table 3: Main composition of biogas from different sources
Components Municipal waste Wastewater Agricultural/
Animal waste
Waste from agrofood industry
Landfill
CH4 (vol.-%) 50 – 60
2
61 – 651
60 – 752
55 – 773
55 – 656
55 – 581
60 – 752
50 – 703
60 – 706
682
50 – 753
47 – 571
45 – 703
40 – 704
35 – 65 (avg.45)5
45 – 556
CO2 (vo.-%) 34 – 38
2
36 – 381
19 – 332
30 – 453
35 – 456
37 – 381
19 – 332
30 – 503
30 – 406
262
37 – 411
35 – 403
30 – 604
15 – 50 (avg.40)5
30 – 406
N2 (vol.-%) 0 – 5
2
< 2
1
< 12,6
< 12
< 1 – 21
< 33
< 1 – 171
< 33
3 – 54
5 – 40 (avg.15)5
5 – 156
O2 (vol.-%) 0 – 12
< 11
< 0.52
< 11
< 0.52
< 11
< 0.23
0 – 34
0 – 5 (avg.1)5
H2O (vol.-%) 100% (saturated at digester exit temperature)
3
100% (saturated at digester exit temperature)
3
100% (saturated at digester exit temperature)
3
100% (saturated at digester exit
temperature)3
100% (saturated at digester exit temperature)
3
H2 (vol.-%) 0 – 5
4
0 – 35
CO (vol.-%) 0 – 34
H2S (ppm) 70 – 6502
700 – 28002
150 – 30003
636
2100 – 70002
32 – 1691
3 – 10001
2802
< 21,500
36 – 115 1
10 – 2003
0 – 20,0004
< 1005
15 – 4276
Aromatic (mg/m3) 0 – 200
2 30 – 1900
4
Ammonia 50 – 1002 mg/m
3 5 ppm
Halogenated compounds (mg/m
3)
100 – 8002 1 –2900
4
Benzene (mg/m3)
0.1 – 0.3
1 0.7 – 1.3
1 0.6 – 2.3
1
Toluene (mg/m3) 2.8 – 11.8
1 0.2 – 0.7
1 1.7 – 5.1
1
Siloxanes (ppmv) 2 – 15
3
1.5 – 10.66
< 0.46
0.1 – 3.53
0.7 – 46
Non–methane organics (% dry weight)
0 – 0.253
Volatile organics (% dry weight)
0 – 0.13
1 Delsinne, 2010;
2 Naskeo Environnment, 2009;
3 Lampe, 2006;
4 El–Fadel, 1997;
5 Persson, 2006;
6 Rasi, 2009.
12
Farm biogas has much higher concentration of hydrogen sulfide than waste water biogas and also
contains traces of pesticides and pharmaceuticals. Waste water biogas contains siloxanes and
odiferous compounds such as terpenes and aldehydes whereas farm biogas contains ammonia
(NH3). The amount of organic silicon compounds may be high in sewage digester biogas because
of the various uses of silicon containing compounds in households and industry. Also high
temporal variations in siloxane concentrations of several mg/m3 have been reported. The
concentrations of halogenated compounds are usually low in waste water biogas (< 1 mg/m3).
Waste water biogas can also contain low levels of particulate matter and metals including arsenic.
Hydrogen sulfide concentrations in digester biogas vary greatly between waste water treatment
plants (WWTPs). The usual values of hydrogen sulfide are reported to be about 1,000 ppm in
WWPTs, but values up to 10,000 ppm have also been measured (Rasi, 2011).
Landfill gas composition is highly source dependent. In several cases landfill gas has been
reported to contain more than one hundred different trace compounds such as halogenated and
aromatic hydrocarbons. Trace compounds can be found in landfill gas in the range from 0.05 to
1,000 mg/m3. Aromatic and chlorinated compounds are widely used in industry as solvents, and
fluorinated compounds have been used as refrigerating aggregates, foaming agents, solvents and
propellants (Rasi, 2009). Toluene is a compound commonly used in industry as solvent, carrier, or
thinner in the paint, rubber, printing, cosmetic, adhesives and resin industries. Benzene is a natural
component of crude oil and is widely used in industry. Especially landfills receiving industrial waste
might be expected to have a high level of these compounds. Levels of alkanes and aromatic
compounds as well as those of halogenated and oxygenated compounds are dependent on the
composition and stage of decomposition of waste. Organic silicon compounds, found in landfill and
sewage digester biogas, are widely used, e.g., in shampoos, skin creams, tooth paste and food
production.
Today, China is by far the biggest biogas producer and user in the world, with around 18 million
farm households using biogas and about 3,500 medium to large-scale digester units (Bauen,
2009). In Europe, specific support mechanisms have resulted in Germany being the leader in this
technology with 5,900 units in operation corresponding to 2,300 MWe total capacity installed in
2010 (mostly small cogeneration units running on agricultural residues). In order to increase
productivity, decentralized farm-size units are increasingly relying on supplementary feedstock
such as agricultural residues or crops. The UK, Italy and Spain are leading landfill gas production,
while less successful in stimulating farm-based anaerobic digestion. In contrast, deployment of
biogas technology in the USA suffers from a reputation of poor reliability. According to the
American Biogas Council there are currently 171 agricultural anaerobic digestion plants in
operation in the USA; 12 are centralized/regional systems, the rest being on-farm digesters.
However, there are 324 new projects under planning. Apart from agricultural biogas there are more
than 1,500 digesters on WWTPs in operation but only 250 utilize the gas. The large biogas
production comes from landfills with 563 sites.
3.2 Biogas quality versus production process
The efficiency of the anaerobic digestion (AD) process is influended by some critical operating data
and parameters. The growth and activity of anaerobic microoragnisms is significantly influence by
conditions such as exclusion of oxygen, constant temperature, pH-value, nutrient supply, stirring
intensity as well as presence and amount of inhibitors.
13
Process temperature
The anaerobic digestion process can take place at different temperatures, divided into three
temperature ranges: psychrophilic (below 25°C), mesophilic (25°C – 45°C), and thermophilic (45°C
– 70°C). There is a direct relation between the process temperature and the hydraulic retention
time (HRT) (Table 4).
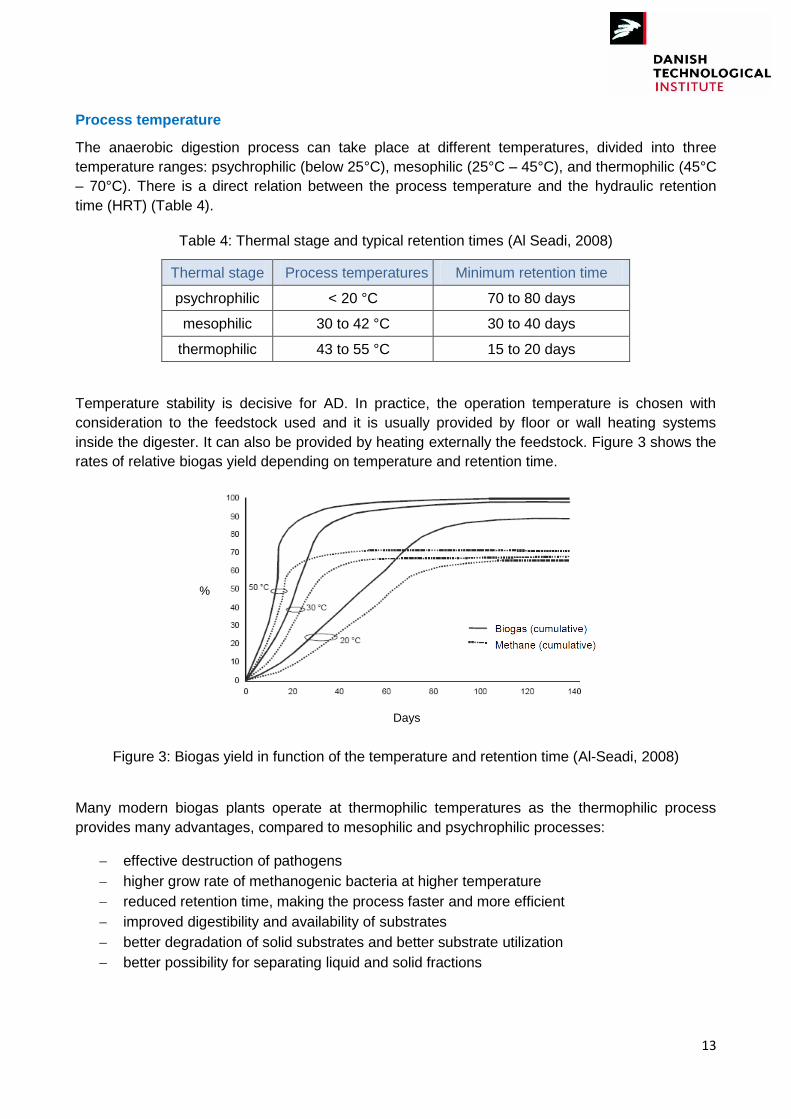
Table 4: Thermal stage and typical retention times (Al Seadi, 2008)
Thermal stage Process temperatures Minimum retention time
psychrophilic < 20 °C 70 to 80 days
mesophilic 30 to 42 °C 30 to 40 days
thermophilic 43 to 55 °C 15 to 20 days
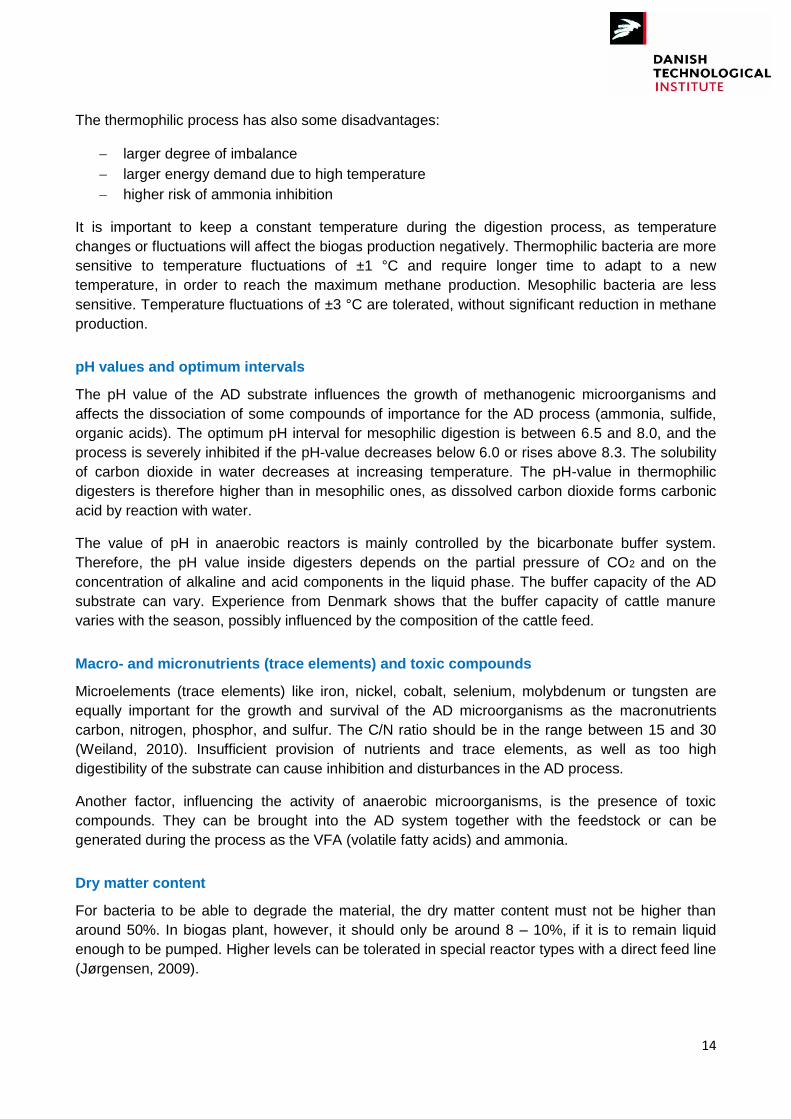
Temperature stability is decisive for AD. In practice, the operation temperature is chosen with
consideration to the feedstock used and it is usually provided by floor or wall heating systems
inside the digester. It can also be provided by heating externally the feedstock. Figure 3 shows the
rates of relative biogas yield depending on temperature and retention time.
Figure 3: Biogas yield in function of the temperature and retention time (Al-Seadi, 2008)
Many modern biogas plants operate at thermophilic temperatures as the thermophilic process
provides many advantages, compared to mesophilic and psychrophilic processes:
effective destruction of pathogens
higher grow rate of methanogenic bacteria at higher temperature
reduced retention time, making the process faster and more efficient
improved digestibility and availability of substrates
better degradation of solid substrates and better substrate utilization
better possibility for separating liquid and solid fractions
%
Days
14
The thermophilic process has also some disadvantages:
larger degree of imbalance
larger energy demand due to high temperature
higher risk of ammonia inhibition
It is important to keep a constant temperature during the digestion process, as temperature
changes or fluctuations will affect the biogas production negatively. Thermophilic bacteria are more
sensitive to temperature fluctuations of ±1 °C and require longer time to adapt to a new
temperature, in order to reach the maximum methane production. Mesophilic bacteria are less
sensitive. Temperature fluctuations of ±3 °C are tolerated, without significant reduction in methane
production.
pH values and optimum intervals
The pH value of the AD substrate influences the growth of methanogenic microorganisms and
affects the dissociation of some compounds of importance for the AD process (ammonia, sulfide,
organic acids). The optimum pH interval for mesophilic digestion is between 6.5 and 8.0, and the
process is severely inhibited if the pH-value decreases below 6.0 or rises above 8.3. The solubility
of carbon dioxide in water decreases at increasing temperature. The pH-value in thermophilic
digesters is therefore higher than in mesophilic ones, as dissolved carbon dioxide forms carbonic
acid by reaction with water.
The value of pH in anaerobic reactors is mainly controlled by the bicarbonate buffer system.
Therefore, the pH value inside digesters depends on the partial pressure of CO2 and on the
concentration of alkaline and acid components in the liquid phase. The buffer capacity of the AD
substrate can vary. Experience from Denmark shows that the buffer capacity of cattle manure
varies with the season, possibly influenced by the composition of the cattle feed.
Macro- and micronutrients (trace elements) and toxic compounds
Microelements (trace elements) like iron, nickel, cobalt, selenium, molybdenum or tungsten are
equally important for the growth and survival of the AD microorganisms as the macronutrients
carbon, nitrogen, phosphor, and sulfur. The C/N ratio should be in the range between 15 and 30
(Weiland, 2010). Insufficient provision of nutrients and trace elements, as well as too high
digestibility of the substrate can cause inhibition and disturbances in the AD process.
Another factor, influencing the activity of anaerobic microorganisms, is the presence of toxic
compounds. They can be brought into the AD system together with the feedstock or can be
generated during the process as the VFA (volatile fatty acids) and ammonia.
Dry matter content
For bacteria to be able to degrade the material, the dry matter content must not be higher than
around 50%. In biogas plant, however, it should only be around 8 – 10%, if it is to remain liquid
enough to be pumped. Higher levels can be tolerated in special reactor types with a direct feed line
(Jørgensen, 2009).
15
Organic load
Obtaining the maximum biogas yield, by complete digestion of the substrate, would require a long
retention time of the substrate inside the digester and a correspondingly large digester size. In
practice, the choice of system design (digester size and type) or of applicable retention time is
always based on a compromise between getting the highest possible biogas yield and having a
justifiable plant economy. In this respect, the organic load is an important operational parameter,
which indicates how much organic dry matter can be fed into the digester, per volume and time
unit. The normal load for a CSTR reactor is 1 – 6 kg COD/m3 reactor volume/day (Jørgensen,
2009).
Hydraulic retention time (HRT)
HRT is the average time interval that the substrate is kept inside the digester tank. HRT is
correlated to the digester volume and the volume of substrate per time unit. The retention time
must be sufficiently long to ensure that the amount of microorganisms removed with the effluent is
not higher than the amount of reproduced microorganisms. A short HRT provides a good substrate
flow rate, but a lower gas yield. It is therefore important to adapt the HRT to the specific
decomposition rate of the used substrates.
4 Biogas quality for energy uses
Most of the European biogas production is combusted in internal combustion engines to produce
electric power. When possible the thermal energy from the engine exhaust and cooling systems is
also used, but as the biogas plants are located mostly in rural areas the utilization of the thermal
energy is often not satisfying. The presence of a district heating network near the biogas
production unit obviously favors an external use of the produced heat. Instead of internal
combustion engines turbines, micro-turbines and stirling engines can be as well utilized. Biogas is
also commonly burned in boilers to produce hot water and steam.
Other possible alternative to conventional gas motors is the use of fuel cells. Fuel cells are an
emerging technology that may improve the outlook for clean, efficient and economical energy use
of biogas as they have much higher electrical conversion efficiency compared to motor engines,
lower emissions of pollutants (NOx) and lower noise generation.
By removing carbon dioxide, moisture, hydrogen sulfide and other impurities biogas can be
upgraded to biomethane, a product equivalent to natural gas, which typically contains more than
95% methane. The process can be controlled to produce biomethane that meets a predetermined
standard of quality. In this way the full biogas range of conversion opportunities are open.
Biomethane can be used interchangeably with natural gas, whether for electrical generation,
heating, cooling, pumping, or as a vehicle fuel. Biomethane can be pumped into the natural gas
supply pipeline or store and transport as compressed biomethane (CBM), which is analogous to
compressed natural gas (CNG), or as liquefied biomethane (LBM), which is analogous to liquefied
natural gas (LNG). A report issued by the Swedish Gas Association shows the relation between
transport distance and transported volumes for the different upgrading and distribution alternatives
available on the market (Swensson, 2010). For short to medium distances and larger volumes,
16
local gas grids provide the best alternative. Considering road transport, CBM is the best option for
all volumes up to distances of 200 km compared to LBM.
The methane content in the biomethane depends on the upgrading process, the quality of the
biogas, and on the preconditioning of the biogas. For example the nitrogen is not separated from
the methane by most of upgrading process; thus a desulfurization with air would lead to high
nitrogen content in the biomethane.
Other potential high-grade fuels that can possibly be produced from biogas include liquid
hydrocarbon replacements for gasoline and diesel fuels (created using the Fischer-Tropsch
process), methanol, dimethyl ether, and hydrogen.
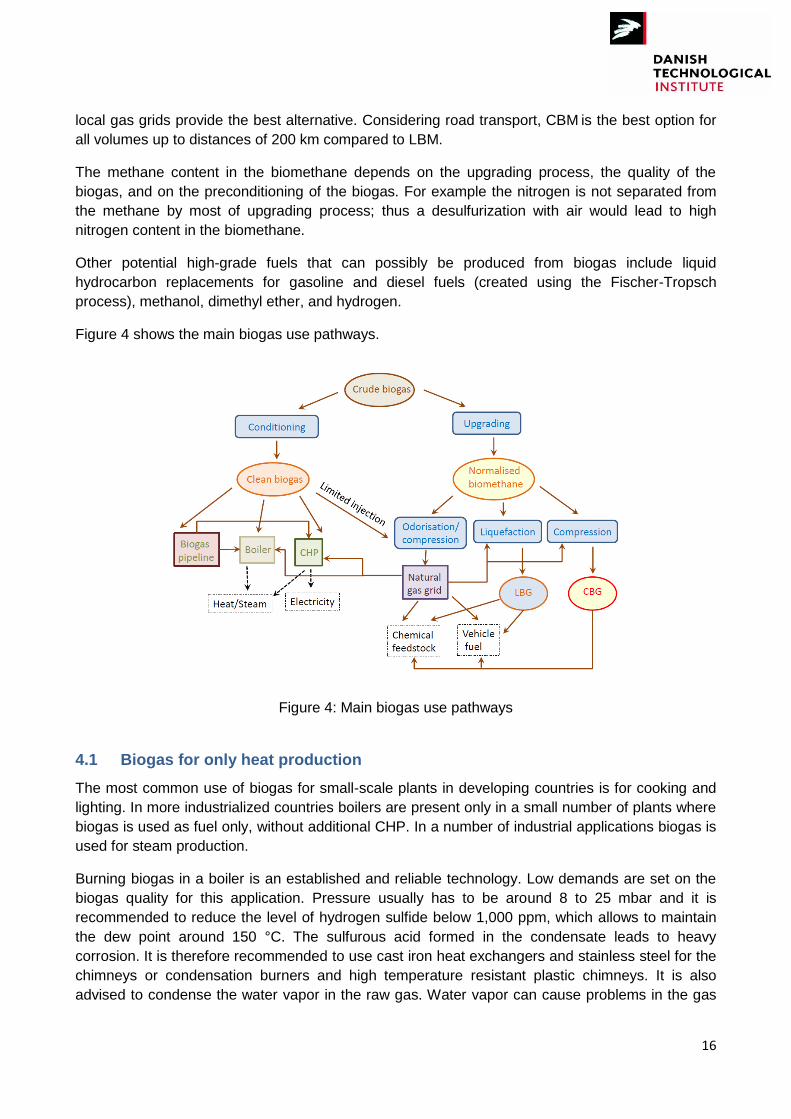
Figure 4 shows the main biogas use pathways.
Figure 4: Main biogas use pathways
4.1 Biogas for only heat production
The most common use of biogas for small-scale plants in developing countries is for cooking and
lighting. In more industrialized countries boilers are present only in a small number of plants where
biogas is used as fuel only, without additional CHP. In a number of industrial applications biogas is
used for steam production.
Burning biogas in a boiler is an established and reliable technology. Low demands are set on the
biogas quality for this application. Pressure usually has to be around 8 to 25 mbar and it is
recommended to reduce the level of hydrogen sulfide below 1,000 ppm, which allows to maintain
the dew point around 150 °C. The sulfurous acid formed in the condensate leads to heavy
corrosion. It is therefore recommended to use cast iron heat exchangers and stainless steel for the
chimneys or condensation burners and high temperature resistant plastic chimneys. It is also
advised to condense the water vapor in the raw gas. Water vapor can cause problems in the gas

17
nozzles. Removal of water will also remove a large proportion of the H2S, reducing the corrosion
and stack gas dew point problems.
4.2 Biogas to cogeneration systems (CHP)
A number of different technologies are available and applied: internal combustion engines, gas
turbines, micro-turbines, stirling engines and fuel cells.
4.2.1 Biogas for internal combustion engines
Reciprocating internal combustion engines have the longest history of use in biogas applications,
and are still the most widely used technology. Thousands of engines are operated on sewage
plants, landfill sites and biogas installations. They can be practical in a size range as low as 30 kW
to 3,000 kW. The amount of fuel energy converted to electricity generally increases with size,
ranging from 30% for small units to 40% for large engines. Thermal energy conversion is from 45
to 60% resulting in overall efficiencies up to 90%. Operating and maintenance costs can be a
significant portion of the total electricity cost as internal combustion engines require frequent oil
changes and minor overhauls. Most engines require a major overhaul about every 5 years
(Chamber, 2002).
Gas engines do not have high gas quality requirements. It is advised to condense the water vapour
in the raw gas to avoid condensation in gas lines and formation of acid solutions and it is also
recommended a H2S concentration lower to 1,000 – 200 ppmv, depending on the engine, to
guarantee a reasonable operation time of the same. Otto engines designed to run on petrol are far
more susceptible to H2S than the more robust diesel engines. For large scale applications (≥ 60
kWel) diesel engines are standard. Siloxanes can create abrasive problems, so if present at the
biogas they should be removed. Typical gas quality specifications for internal combustion
reciprocating engines are given in Table 6. To compare the different tolerances in different kind of
engines in Table 5 biogas requirements for Rolls Royce and GE Jenbacher engines are given.
Table 5: Requirements to biogas quality given by two different engine manufactures (Kvist, 2011)
Rolls-Royce GE Jenbacher
Lowest heat value (MJ/Nm3) 18 –
Gas temperature (°C) 20 – 40 0 – 40
Moisture Dew point: 5 °C @ 4.3 bar
80 % relative
Max. particle size 5 µm 3 µm
Max. sulfur (mg/m3) 1520 4551
Max. ammonia (mg/m3) 50 32
Max. halogens (mg/m3) (Cl + 2xFl)
100 651
1 Valid for engines which are not equipped with catalysts. If the engines are equipped with CO or
formaldehyde catalysts the concentration of sulfur and halogens are lower
18
4.2.2 Biogas for Stirling engines
The stirling engine is an engine that runs on the Stirling Thermodynamic Power Cycle. This cycle is
capable of high theoretical thermal efficiency; however such high efficiency is generally not
achieved in practice. Real stirling engines have actual efficiencies slightly lower than standard
reciprocating engine generators. Because it is an external combustion engine, the stirling engine
may offer the advantages of being more tolerant to contaminants in the fuel stream, reducing gas
conditioning requirements. Stirling engine gas requirements are showed in Table 6.
Actual field experience to date for stirling engines fueled with biogas is limited. At the moment,
stirling engines are not competitive with large reciprocating engines or turbines but may offer an
alternative to micro-turbines and small internal combustion engines.
4.2.3 Biogas for gas turbines and micro-turbines
Use of turbines on biogas is rare, because only the very largest biogas applications would produce
sufficient biogas fuel for combustion turbines. The very smallest of combustion turbines is about
800 kW; most families start at 5,000 kW capacity and go up to hundreds of megawatts. Turbines
are also sensitive to biogas impurities, and require fuel conditioning (Table 6)
Micro-turbines are smaller versions of combustion turbines; developed to be economical at low
output ranges where the large combustion turbines are not. Use of biogas to fuel micro-turbines
began in the late 1990s. The available capacity range of 25 kW to 500 kW is well-suited to many
biogas applications, and they have been installed at municipal wastewater treatment plants,
landfills, and some dairy farms. The greatest technical challenge for micro-turbines in these
applications has been assuring proper fuel treatment. Some early installations were shut down
prematurely due to inadequate fuel moisture removal, gas compressor corrosion problems and
lack of siloxanes filtering. Micro-turbines are a relatively new product, especially as applied to
biogas applications. Initial lessons learned, however, have resulted in more comprehensive gas
treatment packages and a better understanding of their behavior on the part of manufacturers
when fueled with biogas. Typical biogas requirements for micro-turbines are given in Table 6.
Micro-turbines have the advantage of a small footprint, low exhaust emissions and modular
installations. Rather than one large engine, several micro-turbines can be installed in the same
space, and then individually started and stopped as needed. Due to their low efficiency of
electricity production (15 – 30%) micro-turbines are best applied when a thermal source is
required. Micro-turbine exhaust temperatures are relatively low (about 200 – 300 °C) so the water
heat can only be used to generate low pressure steam and/or hot water (Chamber, 2002).
19
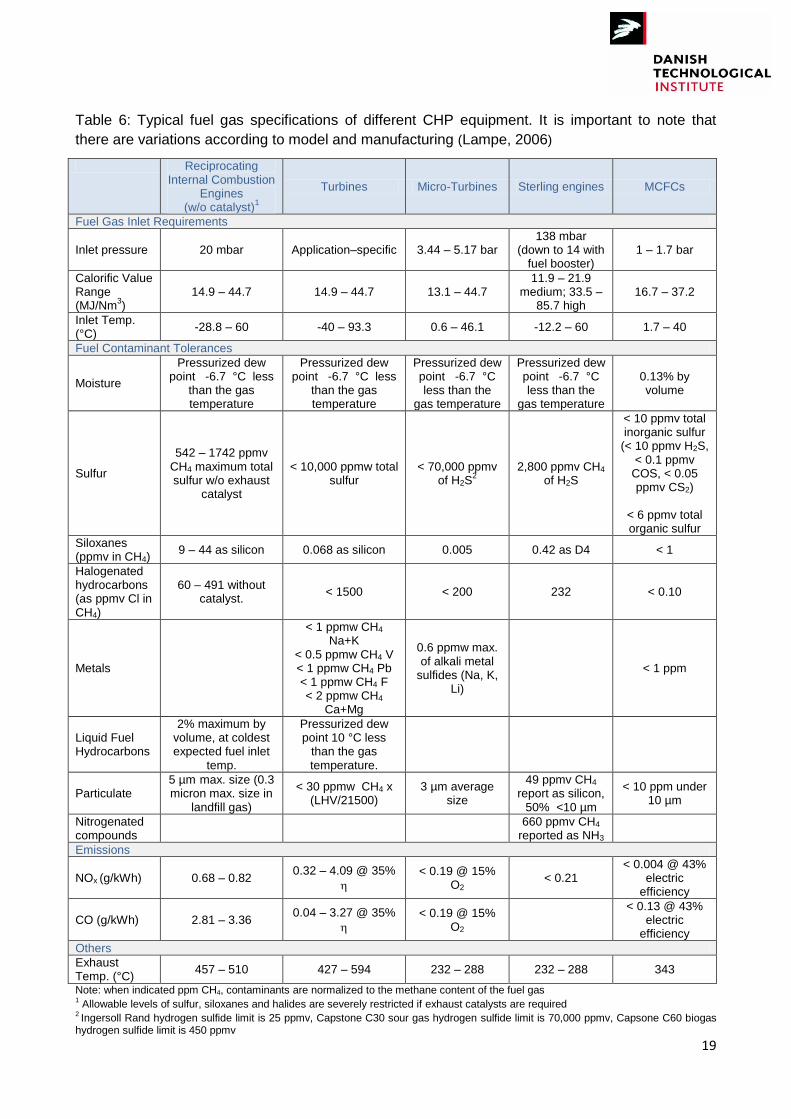
Table 6: Typical fuel gas specifications of different CHP equipment. It is important to note that
there are variations according to model and manufacturing (Lampe, 2006)
Reciprocating Internal Combustion
Engines (w/o catalyst)
1
Turbines Micro-Turbines Sterling engines MCFCs
Fuel Gas Inlet Requirements
Inlet pressure 20 mbar Application–specific 3.44 – 5.17 bar 138 mbar
(down to 14 with fuel booster)
1 – 1.7 bar
Calorific Value Range (MJ/Nm
3)
14.9 – 44.7 14.9 – 44.7 13.1 – 44.7 11.9 – 21.9
medium; 33.5 – 85.7 high
16.7 – 37.2
Inlet Temp. (°C)
-28.8 – 60 -40 – 93.3 0.6 – 46.1 -12.2 – 60 1.7 – 40
Fuel Contaminant Tolerances
Moisture
Pressurized dew point -6.7 °C less
than the gas temperature
Pressurized dew point -6.7 °C less
than the gas temperature
Pressurized dew point -6.7 °C less than the
gas temperature
Pressurized dew point -6.7 °C less than the
gas temperature
0.13% by volume
Sulfur
542 – 1742 ppmv CH4 maximum total sulfur w/o exhaust
catalyst
< 10,000 ppmw total sulfur
< 70,000 ppmv of H2S
2 2,800 ppmv CH4
of H2S
< 10 ppmv total inorganic sulfur
(< 10 ppmv H2S, < 0.1 ppmv
COS, < 0.05 ppmv CS2)
< 6 ppmv total organic sulfur
Siloxanes (ppmv in CH4)
9 – 44 as silicon 0.068 as silicon 0.005 0.42 as D4 < 1
Halogenated hydrocarbons (as ppmv Cl in CH4)
60 – 491 without catalyst.
< 1500 < 200 232 < 0.10
Metals
< 1 ppmw CH4
Na+K < 0.5 ppmw CH4 V < 1 ppmw CH4 Pb < 1 ppmw CH4 F < 2 ppmw CH4
Ca+Mg
0.6 ppmw max. of alkali metal
sulfides (Na, K, Li)
< 1 ppm
Liquid Fuel Hydrocarbons
2% maximum by volume, at coldest expected fuel inlet
temp.
Pressurized dew point 10 °C less
than the gas temperature.
Particulate 5 µm max. size (0.3 micron max. size in
landfill gas)
< 30 ppmw CH4 x (LHV/21500)
3 µm average size
49 ppmv CH4 report as silicon,
50% <10 µm
< 10 ppm under 10 µm
Nitrogenated compounds
660 ppmv CH4
reported as NH3
Emissions
NOx (g/kWh) 0.68 – 0.82 0.32 – 4.09 @ 35%
< 0.19 @ 15% O2
< 0.21 < 0.004 @ 43%
electric efficiency
CO (g/kWh) 2.81 – 3.36 0.04 – 3.27 @ 35%
< 0.19 @ 15% O2
< 0.13 @ 43%
electric efficiency
Others
Exhaust Temp. (°C)
457 – 510 427 – 594 232 – 288 232 – 288 343
Note: when indicated ppm CH4, contaminants are normalized to the methane content of the fuel gas 1 Allowable levels of sulfur, siloxanes and halides are severely restricted if exhaust catalysts are required
2 Ingersoll Rand hydrogen sulfide limit is 25 ppmv, Capstone C30 sour gas hydrogen sulfide limit is 70,000 ppmv, Capsone C60 biogas
hydrogen sulfide limit is 450 ppmv
20
4.2.4 Biogas for fuel cells
Fuel cells are an emerging energy technology that could replace a large part of current
combustion-based energy systems in all fields, from mobile phone batteries through vehicle
propulsion to centralized or decentralized stationary power generation.
Fuel cells are electrochemical devices that convert the chemical energy of a fuel/oxidizer mixture
directly into electrical energy. It is essentially a clean technology that uses hydrogen (from its fuel
source) and oxygen (from air) to generate electricity and heat without combustion or pollution, its
only basic emission being water vapor. Individual cells do not deliver the necessary voltage for
normal application. The cells are thus combined into a fuel cell stack of the desired power.
Hydrogen is usually produced from carbonaceous raw material, but it is also possible to obtain it
from renewable sources. Renewable-based processes like solar- or wind-driven electrolysis and
photo-biological water splitting hold great promise for clean hydrogen production; however,
advances must still be made before these technologies can be economically competitive. For the
near- and mid-term, generating hydrogen from biogas reforming may be the most practical and
viable renewable option. The feeding of fuel cells with biogas offers numerous advantages as
compared to internal combustion engines or gas turbines: e.g. higher conversion efficiency to
electricity (> 50%), lower pollutants and greenhouse emissions and lower acoustic contamination.
However, because fuel cell systems employ numerous catalytic processes, they are very sensitive
to trace contaminants in biogas and therefore their efficient removal is necessary for long term fuel
cell applications. Biogas cleaning and upgrading must thus be a cost competitive process in order
to avoid a neutralization of the fuel cell and biogas advantages.
A variety of FC´s are in different stages of development. They can be classified by the type of
electrolyte used and, consequently, by the operating temperature range in Low Temperature Fuel
Cells (60 – 250°C) and High Temperature Fuel Cells (600 – 250°C). The first group includes
Alkaline Fuel Cells (AFCs), Polymer Electrolyte Fuel Cells (PEFCs), Direct Methanol Fuel Cells
(DMFCs) and Phosphoric Acid Fuel Cells (PAFCs), and the second group Molten Carbonate Fuel
Cells (MCFCs) and Solid Oxide Fuel Cells (SOFCs). PAFCs can also be considered middle
temperature fuel cells. High temperature FC´s seem to be the most promising for biomass-based
fuel cell applications. Their high operating temperatures translate into a greater tolerance for
contaminants relative to other FC technologies and CO2 does not inhibit the electrochemical
process but rather serves as an electron carrier. In addition, these FC´s allowed internal reforming
technologies, and this leads to simpler designs of the plants and to increase the system efficiency.
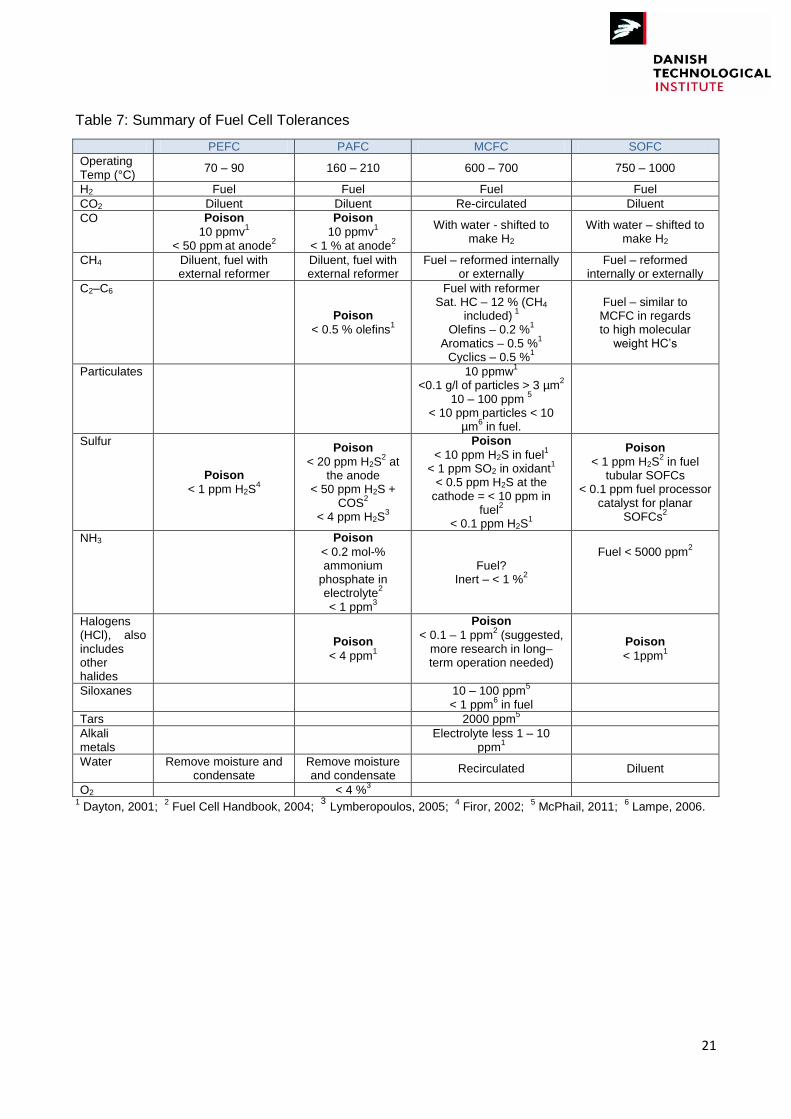
Different fuel cell tolerances are showed in Table 7. More studies are required to define better fuel
cells tolerance limits. Different fuel cell systems (PEFC, PAFC, MCFC, SOFC) from 25 Wel to 250
kWel have been worldwide tested with biogas, landfill or waste gas in lab, pilot and full scale. The
first type of fuel cell to be tested with biogas was the PAFC, followed by the MCFC. In the last
years the SOFC has experienced a high degree of development and their range of power
application has increased. As said before for stationary power biogas applications the MCFC and
the SOFC seem the most promised type of fuel cell, but it is still unclear which is the most suited.
Table 6 provides fuel specifications (at the enclosure fuel nozzle) for a 250 kW molten carbonated
fuel cell (note that there is, typically, an activated carbon bed “inside the box” that cleans the fuel
gas from inlet nozzle specifications to fuel cell stack requirements).
21
Table 7: Summary of Fuel Cell Tolerances
PEFC PAFC MCFC SOFC
Operating Temp (°C)
70 – 90 160 – 210 600 – 700 750 – 1000
H2 Fuel Fuel Fuel Fuel
CO2 Diluent Diluent Re-circulated Diluent
CO Poison
10 ppmv1
< 50 ppm at anode
2
Poison
10 ppmv1
< 1 % at anode2
With water - shifted to make H2
With water – shifted to make H2
CH4
Diluent, fuel with external reformer
Diluent, fuel with external reformer
Fuel – reformed internally or externally
Fuel – reformed internally or externally
C2–C6
Poison
< 0.5 % olefins1
Fuel with reformer Sat. HC – 12 % (CH4
included) 1
Olefins – 0.2 %1
Aromatics – 0.5 %1
Cyclics – 0.5 %1
Fuel – similar to MCFC in regards to high molecular
weight HC‟s
Particulates
10 ppmw1
<0.1 g/l of particles > 3 µm2
10 – 100 ppm 5
< 10 ppm particles < 10 µm
6 in fuel.
Sulfur
Poison
< 1 ppm H2S4
Poison
< 20 ppm H2S2 at
the anode < 50 ppm H2S +
COS2
< 4 ppm H2S3
Poison
< 10 ppm H2S in fuel1
< 1 ppm SO2 in oxidant1
< 0.5 ppm H2S at the cathode = < 10 ppm in
fuel2
< 0.1 ppm H2S1
Poison
< 1 ppm H2S2 in fuel
tubular SOFCs < 0.1 ppm fuel processor
catalyst for planar SOFCs
2
NH3
Poison
< 0.2 mol-% ammonium
phosphate in electrolyte
2
< 1 ppm3
Fuel? Inert – < 1 %
2
Fuel < 5000 ppm2
Halogens (HCl), also includes other halides
Poison
< 4 ppm1
Poison
< 0.1 – 1 ppm2 (suggested,
more research in long–term operation needed)
Poison
< 1ppm1
Siloxanes
10 – 100 ppm5
< 1 ppm6 in fuel
Tars 2000 ppm5
Alkali metals
Electrolyte less 1 – 10
ppm1
Water Remove moisture and condensate
Remove moisture and condensate
Recirculated Diluent
O2 < 4 %3
1 Dayton, 2001;
2 Fuel Cell Handbook, 2004;
3 Lymberopoulos, 2005; 4 Firor, 2002;
5 McPhail, 2011;
6 Lampe, 2006.
22
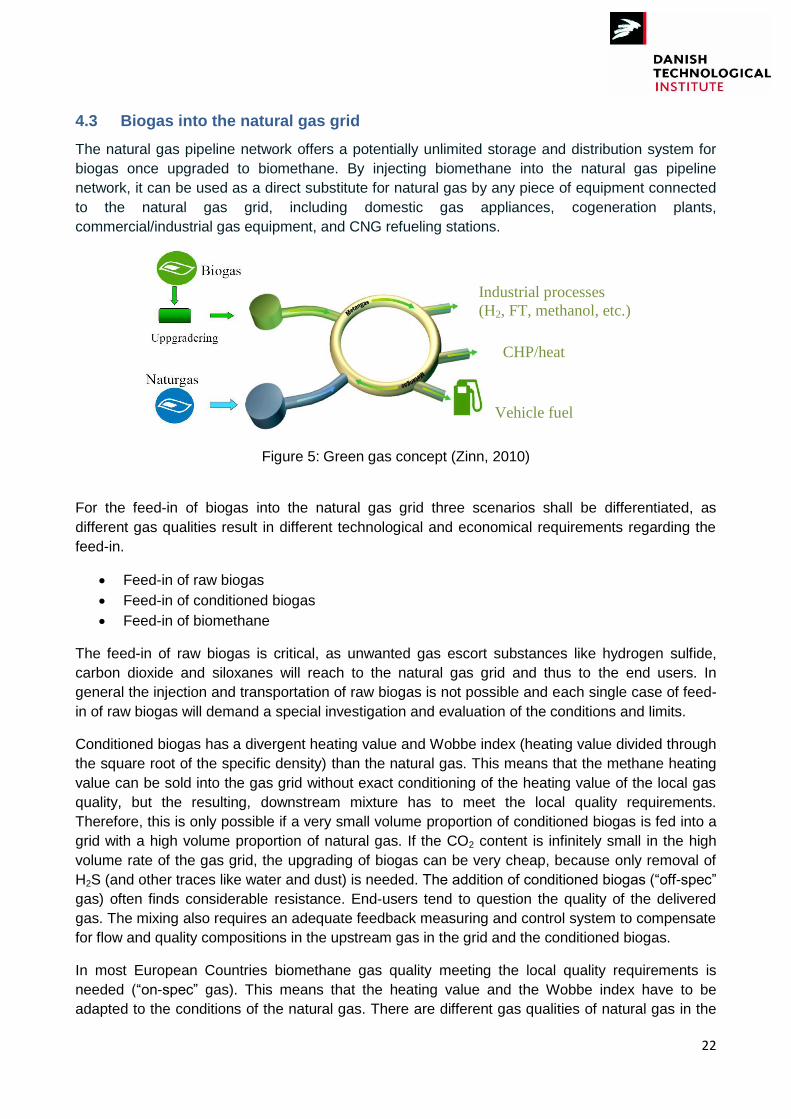
4.3 Biogas into the natural gas grid
The natural gas pipeline network offers a potentially unlimited storage and distribution system for
biogas once upgraded to biomethane. By injecting biomethane into the natural gas pipeline
network, it can be used as a direct substitute for natural gas by any piece of equipment connected
to the natural gas grid, including domestic gas appliances, cogeneration plants,
commercial/industrial gas equipment, and CNG refueling stations.
Figure 5: Green gas concept (Zinn, 2010)
For the feed-in of biogas into the natural gas grid three scenarios shall be differentiated, as
different gas qualities result in different technological and economical requirements regarding the
feed-in.
Feed-in of raw biogas
Feed-in of conditioned biogas
Feed-in of biomethane
The feed-in of raw biogas is critical, as unwanted gas escort substances like hydrogen sulfide,
carbon dioxide and siloxanes will reach to the natural gas grid and thus to the end users. In
general the injection and transportation of raw biogas is not possible and each single case of feed-
in of raw biogas will demand a special investigation and evaluation of the conditions and limits.
Conditioned biogas has a divergent heating value and Wobbe index (heating value divided through
the square root of the specific density) than the natural gas. This means that the methane heating
value can be sold into the gas grid without exact conditioning of the heating value of the local gas
quality, but the resulting, downstream mixture has to meet the local quality requirements.
Therefore, this is only possible if a very small volume proportion of conditioned biogas is fed into a
grid with a high volume proportion of natural gas. If the CO2 content is infinitely small in the high
volume rate of the gas grid, the upgrading of biogas can be very cheap, because only removal of
H2S (and other traces like water and dust) is needed. The addition of conditioned biogas (“off-spec”
gas) often finds considerable resistance. End-users tend to question the quality of the delivered
gas. The mixing also requires an adequate feedback measuring and control system to compensate
for flow and quality compositions in the upstream gas in the grid and the conditioned biogas.
In most European Countries biomethane gas quality meeting the local quality requirements is
needed (“on-spec” gas). This means that the heating value and the Wobbe index have to be
adapted to the conditions of the natural gas. There are different gas qualities of natural gas in the
Industrial processes
(H2, FT, methanol, etc.)
CHP/heat
Vehicle fuel

23
gas grids. The differences are connected with the content of CO2 and alkenes (ethane and
propane have a higher heating value than pure methane) in the natural gas. In Europe the natural
gas is divided in two groups according to the Wobbe index: high calorific (group H) and low calorific
(group L) gases. Gas from the North Sea often has L gas quality; gas from Russia is H gas. The
Wobble index of biomethane can be increased by addition of propane and/or butane.
After upgrading, the biomethane has to be adjusted to the gas pressure in the gas grid. Due to the
gas consumption fluctuation the injection in gas pipes for households (1 bar) is rarely
recommendable. On the other hand the compression of the biomethane to transmission pipes (60
– 80 bar) is very expensive. The outlet of the upgrading process delivers the biomethane at a
pressure between 0 – 7 bar. Thus the most interesting gas pipes for feed-in are operated at a
pressure levels between 4 and 16 bar.
Because natural gas is dangerous, but odorless, it is mixed with a signal gas. This is called
adoration. In most countries biomethane adoration has to be done, but in some countries the
adoration of the basic natural gas flow (not biomethane) is sufficient.
Figure 6: Scheme of the biogas injection process into the natural gas grid (Panousos, 2010)
As it can be seen in the previous figure injection of biomethane into the gas grid normally requires
the following steps: gas pressure controlling, gas compression, gas measurement (flow), gas
storage, odorizing, gas mixing, and gas analysis. These steps are common practice and are rather
straightforward. The costs highly depend on injection location, pressure and quantity.
To ensure the gas quality, various legislative frameworks are currently in force in different
countries.
24
4.3.1 Biomethane standards
Europa is leading worldwide the development of the biomethane market. EU‟s policy promotes the
wider use of biogas as a sustainable source of energy. Directive 2009/73/EC of the European
Parliament and of the Council of 13 July 2009 Concerning Common Rules for the Internal Market
in Natural Gas (and repealing Directive 2003/55/EC) is clear in the obligations of Member States to
allow non-discriminatory access to the natural gas grid. The directive also says, however, that grid
injection is conditional upon gas quality requirements being fulfilled and that the gas should be
“permanently compatible with the relevant technical rules and safety standards. The rules and
standards should ensure that those gases can technically and safely be injected into, and
transported through the natural gas system and should also address their chemical
characteristics”. Most standards and regulations for distribution of gas on the natural gas grid in
Europe are developed for natural gas, even if it is not explicitly expressed. This means that biogas,
and especially gas from thermal gasification may have difficulties in fulfilling the demands in these
standards and specifications and in some cases fulfillment is impossible. This can cause
economical and technical problems for the company that want to introduce biogas into the grid.
There will always be a balance between upgrading costs and market value for the gas. A biogas
can be upgraded to exactly fit the gas composition in the natural gas grid, but the cost for the
upgrading will probably be very high. Less upgrading will result in a product that may not be as
valuable on the market, but on the other hand is less costly to produce.
Today, each biomethane plant needs to be adapted to a technical specification applying
locally/regionally/nationally which inhibits biogas expansion. Therefore, harmonization of standards
regarding biomethane uses among countries is a crucial issue. Particularly in Europe such a
standard along with defining a common technical specification will ensure that the quality of
biomethane is stable throughout all the countries. Stable quality will lead to positive conditions, i.e.
similar tunings for upgrading units and analyses equipment, as well as a distinct falling-off of
investments and operation costs by an economy of scale. Authorization procedures for biomethane
injection into the grid will be significantly simplified as soon as quality requirements will be fulfilled,
which will help local stakeholders to implement such projects.
In Europe there are several countries where biogas is injected: Austria, Denmark, Germany,
Luxembourg, Switzerland, Sweden, The Netherlands, Norway, Finland and U.K. Most of them
have developed dedicated standards for biomethane injection into the natural gas grid (Table 8), or
in its defect there are agreements between grid operators and suppliers. Moreover, countries with
plans for grid injection as Italy are in the process of creating a regulatory framework and others as
France, Poland, Slovakia and Czech Republic have established regulations.
Worldwide there are examples of injection into the natural gas grid in Canada and USA. But not
national standards have been developed. In North American, work is underway to create a single
quality standard for natural gas distribution systems that will allow supply from non-conventional
sources like biomethane (BC Innovation Council, 2008).
25
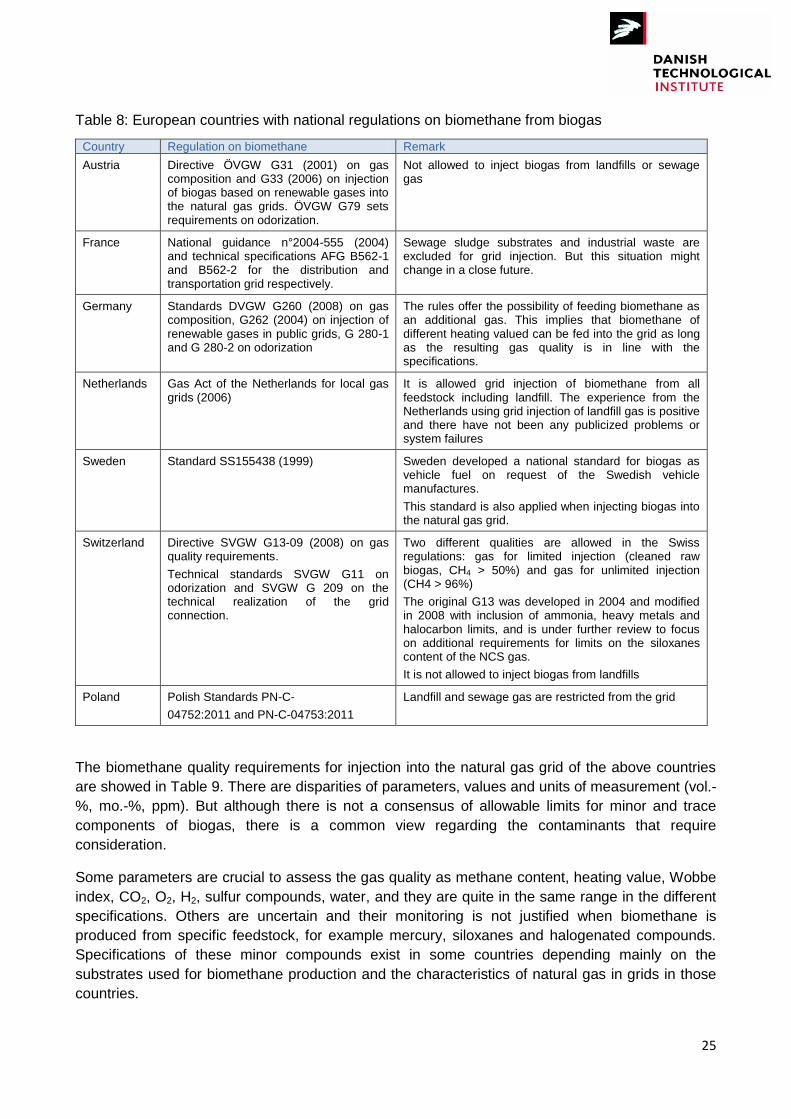
Table 8: European countries with national regulations on biomethane from biogas
Country Regulation on biomethane Remark
Austria Directive ÖVGW G31 (2001) on gas composition and G33 (2006) on injection of biogas based on renewable gases into the natural gas grids. ÖVGW G79 sets requirements on odorization.
Not allowed to inject biogas from landfills or sewage gas
France National guidance n°2004-555 (2004) and technical specifications AFG B562-1 and B562-2 for the distribution and transportation grid respectively.
Sewage sludge substrates and industrial waste are excluded for grid injection. But this situation might change in a close future.
Germany Standards DVGW G260 (2008) on gas composition, G262 (2004) on injection of renewable gases in public grids, G 280-1 and G 280-2 on odorization
The rules offer the possibility of feeding biomethane as an additional gas. This implies that biomethane of different heating valued can be fed into the grid as long as the resulting gas quality is in line with the specifications.
Netherlands Gas Act of the Netherlands for local gas grids (2006)
It is allowed grid injection of biomethane from all feedstock including landfill. The experience from the Netherlands using grid injection of landfill gas is positive and there have not been any publicized problems or system failures
Sweden Standard SS155438 (1999) Sweden developed a national standard for biogas as vehicle fuel on request of the Swedish vehicle manufactures.
This standard is also applied when injecting biogas into the natural gas grid.
Switzerland Directive SVGW G13-09 (2008) on gas quality requirements.
Technical standards SVGW G11 on odorization and SVGW G 209 on the technical realization of the grid connection.
Two different qualities are allowed in the Swiss regulations: gas for limited injection (cleaned raw biogas, CH4 > 50%) and gas for unlimited injection (CH4 > 96%)
The original G13 was developed in 2004 and modified in 2008 with inclusion of ammonia, heavy metals and halocarbon limits, and is under further review to focus on additional requirements for limits on the siloxanes content of the NCS gas.
It is not allowed to inject biogas from landfills
Poland Polish Standards PN-C-
04752:2011 and PN-C-04753:2011
Landfill and sewage gas are restricted from the grid
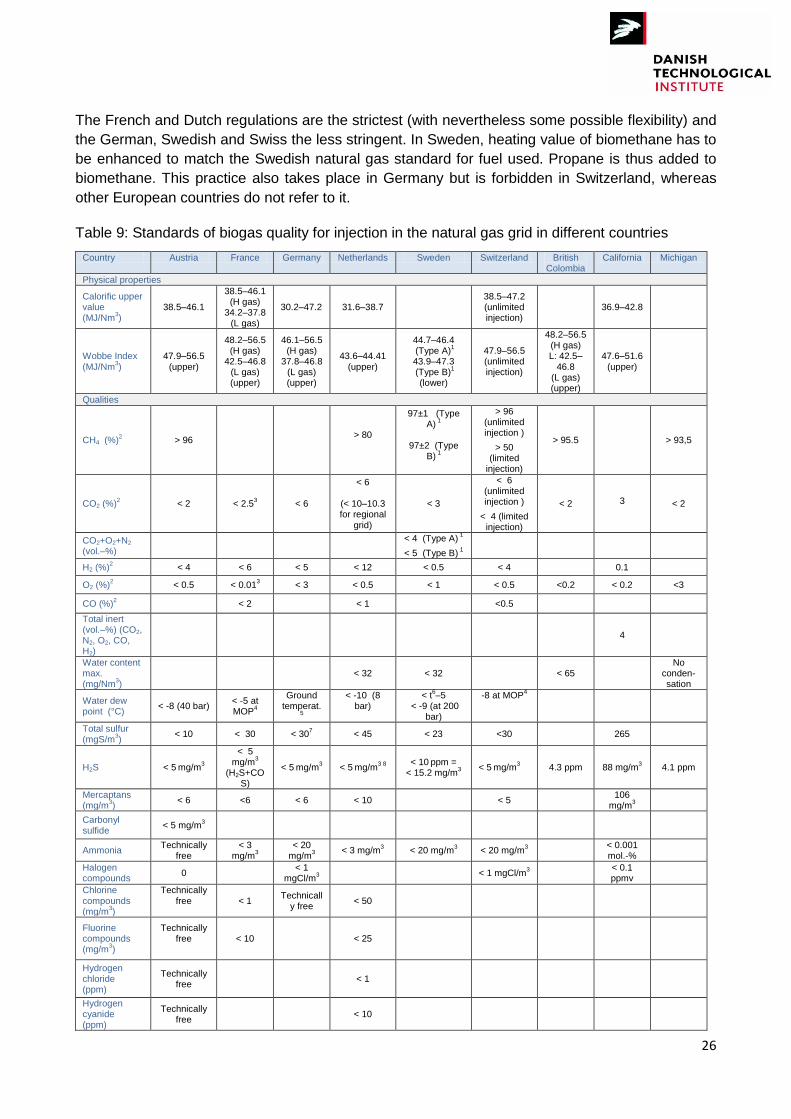
The biomethane quality requirements for injection into the natural gas grid of the above countries
are showed in Table 9. There are disparities of parameters, values and units of measurement (vol.-
%, mo.-%, ppm). But although there is not a consensus of allowable limits for minor and trace
components of biogas, there is a common view regarding the contaminants that require
consideration.
Some parameters are crucial to assess the gas quality as methane content, heating value, Wobbe
index, CO2, O2, H2, sulfur compounds, water, and they are quite in the same range in the different
specifications. Others are uncertain and their monitoring is not justified when biomethane is
produced from specific feedstock, for example mercury, siloxanes and halogenated compounds.
Specifications of these minor compounds exist in some countries depending mainly on the
substrates used for biomethane production and the characteristics of natural gas in grids in those
countries.
26
The French and Dutch regulations are the strictest (with nevertheless some possible flexibility) and
the German, Swedish and Swiss the less stringent. In Sweden, heating value of biomethane has to
be enhanced to match the Swedish natural gas standard for fuel used. Propane is thus added to
biomethane. This practice also takes place in Germany but is forbidden in Switzerland, whereas
other European countries do not refer to it.
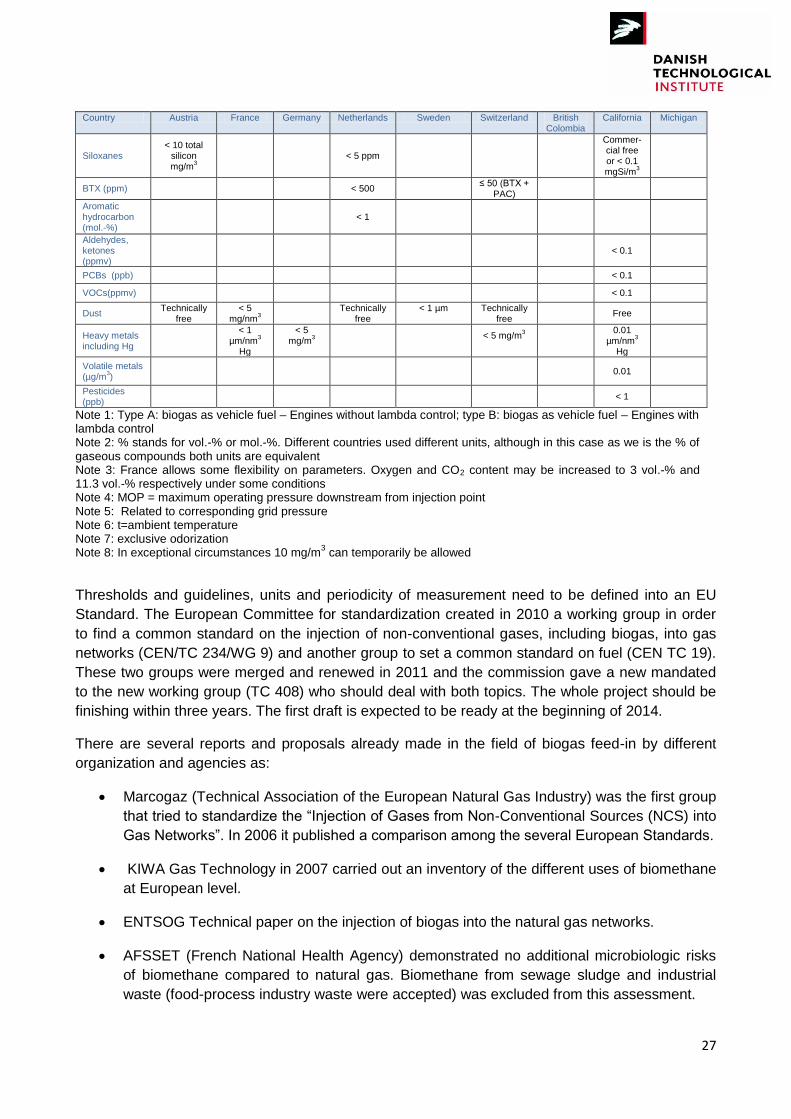
Table 9: Standards of biogas quality for injection in the natural gas grid in different countries
Country Austria France Germany Netherlands Sweden Switzerland British Colombia
California Michigan
Physical properties
Calorific upper value (MJ/Nm
3)
38.5–46.1
38.5–46.1 (H gas)
34.2–37.8 (L gas)
30.2–47.2 31.6–38.7 38.5–47.2 (unlimited injection)
36.9–42.8
Wobbe Index (MJ/Nm
3)
47.9–56.5
(upper)
48.2–56.5 (H gas)
42.5–46.8 (L gas)
(upper)
46.1–56.5 (H gas)
37.8–46.8 (L gas) (upper)
43.6–44.41
(upper)
44.7–46.4 (Type A)
1
43.9–47.3 (Type B)
1
(lower)
47.9–56.5 (unlimited injection)
48.2–56.5 (H gas) L: 42.5–
46.8 (L gas) (upper)
47.6–51.6 (upper)
Qualities
CH4 (%)2
> 96 > 80
97±1 (Type A)
1
97±2 (Type
B) 1
> 96 (unlimited injection )
> 50 (limited
injection)
> 95.5 > 93,5
CO2 (%)2
< 2 < 2.53 < 6
< 6
(< 10–10.3 for regional
grid)
< 3
< 6
(unlimited injection )
< 4 (limited injection)
< 2 3 < 2
CO2+O2+N2 (vol.–%)
< 4 (Type A)
1
< 5 (Type B) 1
H2 (%)2
< 4 < 6 < 5 < 12 < 0.5 < 4 0.1
O2 (%)2
< 0.5 < 0.013 < 3 < 0.5
< 1 < 0.5
<0.2 < 0.2 <3
CO (%)2
< 2 < 1
<0.5
Total inert (vol.–%) (CO2, N2, O2, CO, H2)
4
Water content max. (mg/Nm
3)
< 32 < 32 < 65 No
conden-sation
Water dew point (°C)
< -8 (40 bar) < -5 at MOP
4
Ground temperat.
5
< -10 (8 bar)
< t6–5
< -9 (at 200 bar)
-8 at MOP4
Total sulfur (mgS/m
3)
< 10
< 30 < 307 < 45
< 23 <30
265
H2S < 5 mg/m
3
< 5
mg/m3
(H2S+COS)
< 5 mg/m
3 < 5
mg/m
3 8 < 10 ppm =
< 15.2 mg/m3
< 5 mg/m
3 4.3 ppm 88 mg/m
3 4.1 ppm
Mercaptans (mg/m
3)
< 6 <6
< 6 < 10 < 5 106
mg/m3
Carbonyl sulfide
< 5 mg/m3
Ammonia Technically
free < 3
mg/m3
< 20 mg/m
3
< 3 mg/m3 < 20 mg/m
3 < 20 mg/m
3
< 0.001 mol.-%
Halogen compounds
0 < 1
mgCl/m3 < 1 mgCl/m
3
< 0.1 ppmv
Chlorine compounds (mg/m
3)
Technically free
< 1
Technically free
< 50
Fluorine compounds (mg/m
3)
Technically free
< 10 < 25
Hydrogen chloride (ppm)
Technically free
< 1
Hydrogen cyanide (ppm)
Technically free
< 10
27
Country Austria France Germany Netherlands Sweden Switzerland British Colombia
California Michigan
Siloxanes < 10 total
silicon mg/m
3
< 5 ppm
Commer-cial free or < 0.1 mgSi/m
3
BTX (ppm) < 500
≤ 50 (BTX +
PAC)
Aromatic hydrocarbon (mol.-%)
< 1
Aldehydes, ketones (ppmv)
< 0.1
PCBs (ppb) < 0.1
VOCs(ppmv) < 0.1
Dust Technically
free < 5
mg/nm3
Technically
free < 1 µm
Technically
free Free
Heavy metals including Hg
< 1
µm/nm3
Hg
< 5 mg/m
3
< 5 mg/m3
0.01
µm/nm3
Hg
Volatile metals (µg/m
3)
0.01
Pesticides (ppb)
< 1
Note 1: Type A: biogas as vehicle fuel – Engines without lambda control; type B: biogas as vehicle fuel – Engines with lambda control Note 2: % stands for vol.-% or mol.-%. Different countries used different units, although in this case as we is the % of gaseous compounds both units are equivalent Note 3: France allows some flexibility on parameters. Oxygen and CO2 content may be increased to 3 vol.-% and 11.3 vol.-% respectively under some conditions Note 4: MOP = maximum operating pressure downstream from injection point Note 5: Related to corresponding grid pressure Note 6: t=ambient temperature Note 7: exclusive odorization Note 8: In exceptional circumstances 10 mg/m
3 can temporarily be allowed
Thresholds and guidelines, units and periodicity of measurement need to be defined into an EU
Standard. The European Committee for standardization created in 2010 a working group in order
to find a common standard on the injection of non-conventional gases, including biogas, into gas
networks (CEN/TC 234/WG 9) and another group to set a common standard on fuel (CEN TC 19).
These two groups were merged and renewed in 2011 and the commission gave a new mandated
to the new working group (TC 408) who should deal with both topics. The whole project should be
finishing within three years. The first draft is expected to be ready at the beginning of 2014.
There are several reports and proposals already made in the field of biogas feed-in by different
organization and agencies as:
Marcogaz (Technical Association of the European Natural Gas Industry) was the first group
that tried to standardize the “Injection of Gases from Non-Conventional Sources (NCS) into
Gas Networks”. In 2006 it published a comparison among the several European Standards.
KIWA Gas Technology in 2007 carried out an inventory of the different uses of biomethane
at European level.
ENTSOG Technical paper on the injection of biogas into the natural gas networks.
AFSSET (French National Health Agency) demonstrated no additional microbiologic risks
of biomethane compared to natural gas. Biomethane from sewage sludge and industrial
waste (food-process industry waste were accepted) was excluded from this assessment.
28
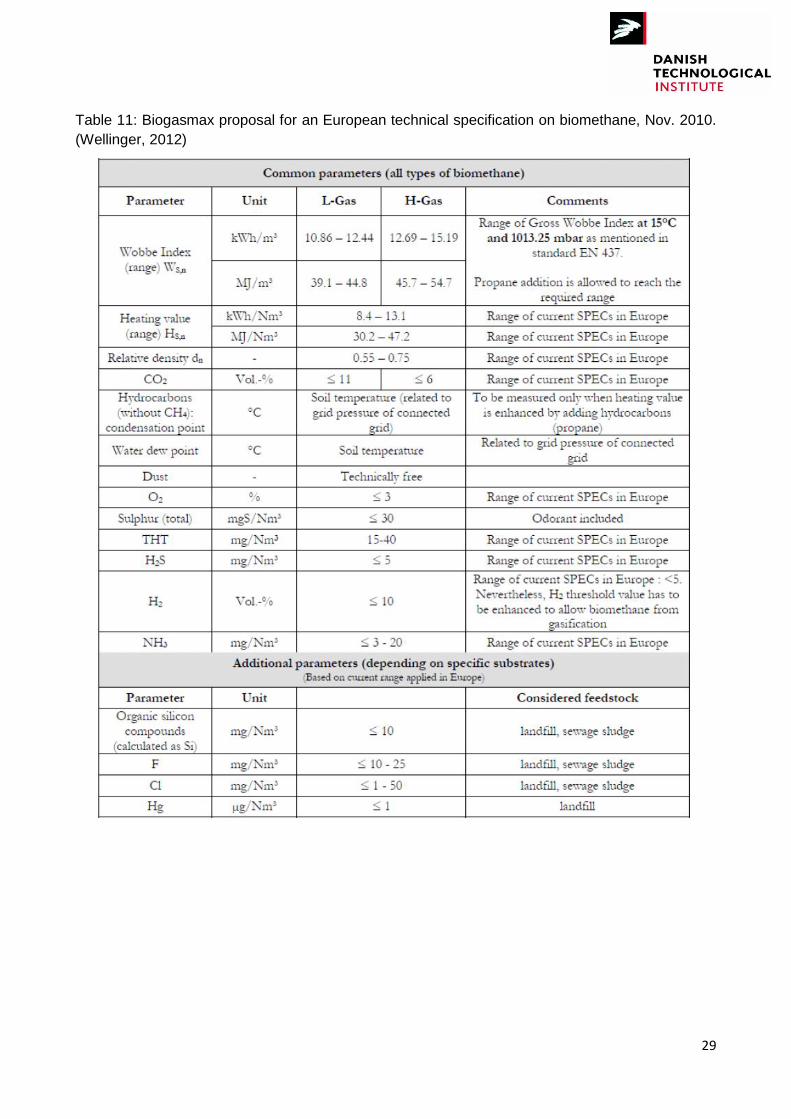
Biogasmax, a large project of EU´s Framework 6 program to promote the production and
utilization of biomethane for public transport cities. At the occasion of the European
Conference on Biomethane Fuel in Goteborg in September 2009, the experts of Biogasmax
were asked by the European Commission to set up a proposal for an European technical
specification on biomethane (Table 11). Biogasmax made a proposition to unify the units of
content/concentration and they also cited good reason to make the regulations for
biomethane injection more flexible.
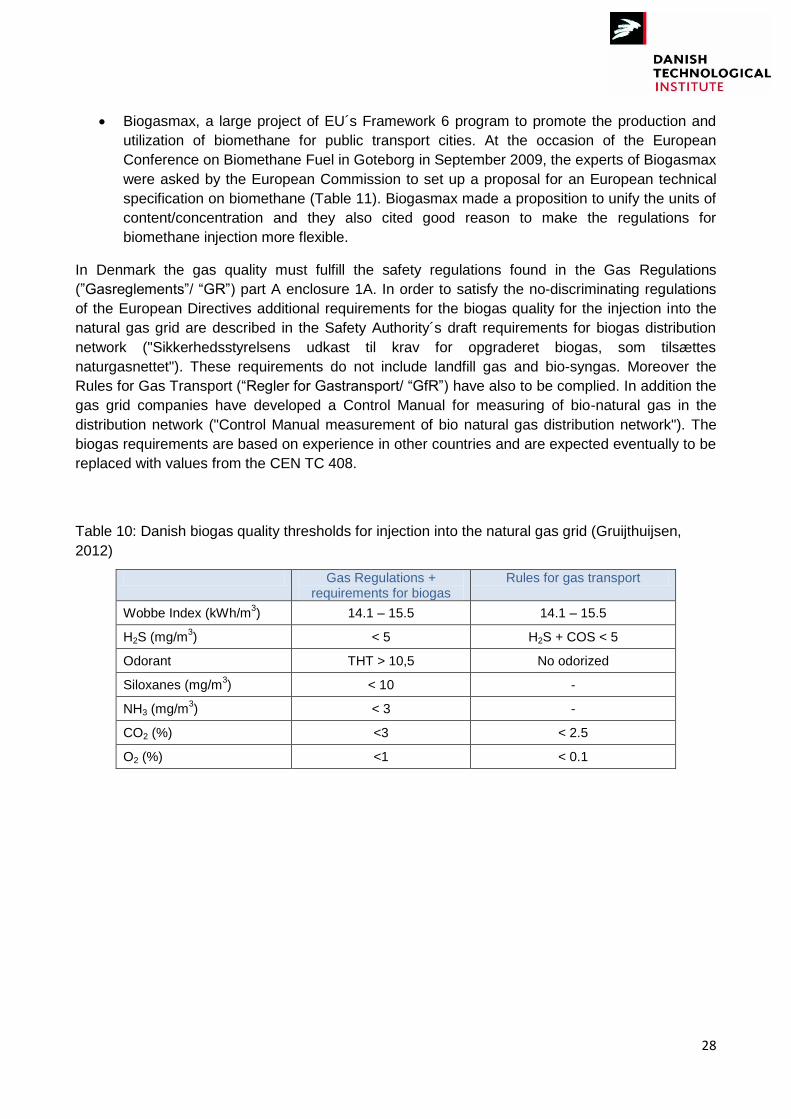
In Denmark the gas quality must fulfill the safety regulations found in the Gas Regulations
(”Gasreglements”/ “GR”) part A enclosure 1A. In order to satisfy the no-discriminating regulations
of the European Directives additional requirements for the biogas quality for the injection into the
natural gas grid are described in the Safety Authority´s draft requirements for biogas distribution
network ("Sikkerhedsstyrelsens udkast til krav for opgraderet biogas, som tilsættes
naturgasnettet"). These requirements do not include landfill gas and bio-syngas. Moreover the
Rules for Gas Transport (“Regler for Gastransport/ “GfR”) have also to be complied. In addition the
gas grid companies have developed a Control Manual for measuring of bio-natural gas in the
distribution network ("Control Manual measurement of bio natural gas distribution network"). The
biogas requirements are based on experience in other countries and are expected eventually to be
replaced with values from the CEN TC 408.
Table 10: Danish biogas quality thresholds for injection into the natural gas grid (Gruijthuijsen,
2012)
Gas Regulations + requirements for biogas
Rules for gas transport
Wobbe Index (kWh/m3) 14.1 – 15.5 14.1 – 15.5
H2S (mg/m3) < 5 H2S + COS < 5
Odorant THT > 10,5 No odorized
Siloxanes (mg/m3) < 10 -
NH3 (mg/m3) < 3 -
CO2 (%) <3 < 2.5
O2 (%) <1 < 0.1
29
Table 11: Biogasmax proposal for an European technical specification on biomethane, Nov. 2010.
(Wellinger, 2012)
30
4.4 Biogas as vehicle fuel
The deployment of natural gas vehicles has started to grow rapidly, particularly during the last
decade. In 2008 there were over nine million natural gas vehicles in the world, while the annual
growth in the number of gas vehicles since the year 2000 has been 50% in Asia, and a little over
15% in Europe (Rasi, 2009). There are light- and heavy-duty natural gas vehicles. Biomethane
from anaerobic digestion or gasification of biomass can be used in both of them. Light duty
vehicles can normally run both on natural gas and biogas without any modifications whereas
heavy-duty vehicles without closed loop control may have to be adjusted if they run alternately on
biogas and natural gas. Currently only one EU member state, Sweden, has a standard for the use
of biogas as a transport fuel: “SS 15 54 38, Motor fuels - Biogas as fuel for high-speed Otto
engines” (Table 9). The standard deals with specific characteristics relevant to the use and storage
of biogas produced by anaerobic digestion for use as a motor fuel. It does not cover fuel which
might be mixed with other compounds, e.g. hydrogen, propane etc. Consequently the standard
reflects a fuel with a high methane number content.
In comparison to other biofuels, biomethane is to be ranked among the most efficient ones. Per
hectare of crop land a similar mileage can be achieved with biomethane as with biomass-to-liquid
fuels of the so-called second generation.
Biomethane is stored on the vehicles in one of two basic forms: compressed or liquefied. The
compressed form is the most common. Gas is stored onboard in tanks at high pressure, around
200 bars. The amount of energy stored in compressed gas is significantly less than the energy
stored in the same volume of liquid fuel such as diesel. Therefore the operating range of vehicles
tends to be reduced.
To overcome this range issue, some vehicles store the gas in liquefied form. The gas is both
cooled and compressed to become a liquid, which is stored in high-pressure tanks on the vehicle.
Because it must be kept at such cold temperatures, liquefied biomethane is stored in double-wall,
vacuum-insulated pressure vessels. LNG/LBM fuel systems typically are only used with heavy-duty
vehicles.
Another way of using biogas as vehicle fuel it is in powered fuel cell vehicles. This technology is
still in its early stages, but for example the U.S. Department of Energy has shown commitment to
developing a paradigm for fuel cell vehicles. About 17 states around the United States have at
least one fueling station, and California has more than 20. On the vehicle end, consumer and fleet
vehicles using fuel cells have been released on small scale for testing and evaluation. These
vehicles include the 60-mpg Honda FCX Clarity, the 53-mpg Mercedes-Benz F-Cell, and a few
buses and larger vehicles.
4.5 Biogas as CNG and LNG
Once biogas has been upgrading to biomethane it can be stored as compressed biomethane
(CBM) or liquefied biomethane (LBM). When distribution of biomethane via dedicated pipelines or
the natural gas grid is impractical or very expensive, over-the-road transportation of compressed or
liquefied biomethane may be a distribution option. One cubic meter of LNG is equivalent to 600
Nm3 of natural gas.
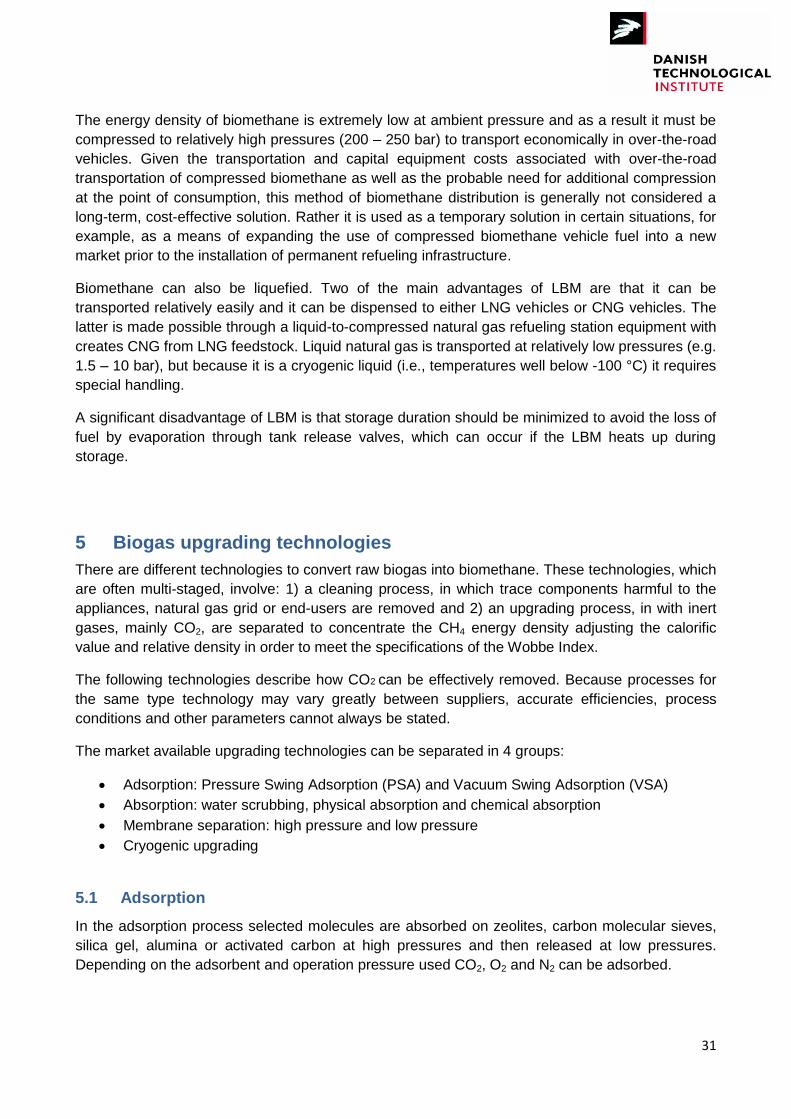
31
The energy density of biomethane is extremely low at ambient pressure and as a result it must be
compressed to relatively high pressures (200 – 250 bar) to transport economically in over-the-road
vehicles. Given the transportation and capital equipment costs associated with over-the-road
transportation of compressed biomethane as well as the probable need for additional compression
at the point of consumption, this method of biomethane distribution is generally not considered a
long-term, cost-effective solution. Rather it is used as a temporary solution in certain situations, for
example, as a means of expanding the use of compressed biomethane vehicle fuel into a new
market prior to the installation of permanent refueling infrastructure.
Biomethane can also be liquefied. Two of the main advantages of LBM are that it can be
transported relatively easily and it can be dispensed to either LNG vehicles or CNG vehicles. The
latter is made possible through a liquid-to-compressed natural gas refueling station equipment with
creates CNG from LNG feedstock. Liquid natural gas is transported at relatively low pressures (e.g.
1.5 – 10 bar), but because it is a cryogenic liquid (i.e., temperatures well below -100 °C) it requires
special handling.
A significant disadvantage of LBM is that storage duration should be minimized to avoid the loss of
fuel by evaporation through tank release valves, which can occur if the LBM heats up during
storage.
5 Biogas upgrading technologies
There are different technologies to convert raw biogas into biomethane. These technologies, which
are often multi-staged, involve: 1) a cleaning process, in which trace components harmful to the
appliances, natural gas grid or end-users are removed and 2) an upgrading process, in with inert
gases, mainly CO2, are separated to concentrate the CH4 energy density adjusting the calorific
value and relative density in order to meet the specifications of the Wobbe Index.
The following technologies describe how CO2 can be effectively removed. Because processes for
the same type technology may vary greatly between suppliers, accurate efficiencies, process
conditions and other parameters cannot always be stated.
The market available upgrading technologies can be separated in 4 groups:
Adsorption: Pressure Swing Adsorption (PSA) and Vacuum Swing Adsorption (VSA)
Absorption: water scrubbing, physical absorption and chemical absorption
Membrane separation: high pressure and low pressure
Cryogenic upgrading
5.1 Adsorption
In the adsorption process selected molecules are absorbed on zeolites, carbon molecular sieves,
silica gel, alumina or activated carbon at high pressures and then released at low pressures.
Depending on the adsorbent and operation pressure used CO2, O2 and N2 can be adsorbed.
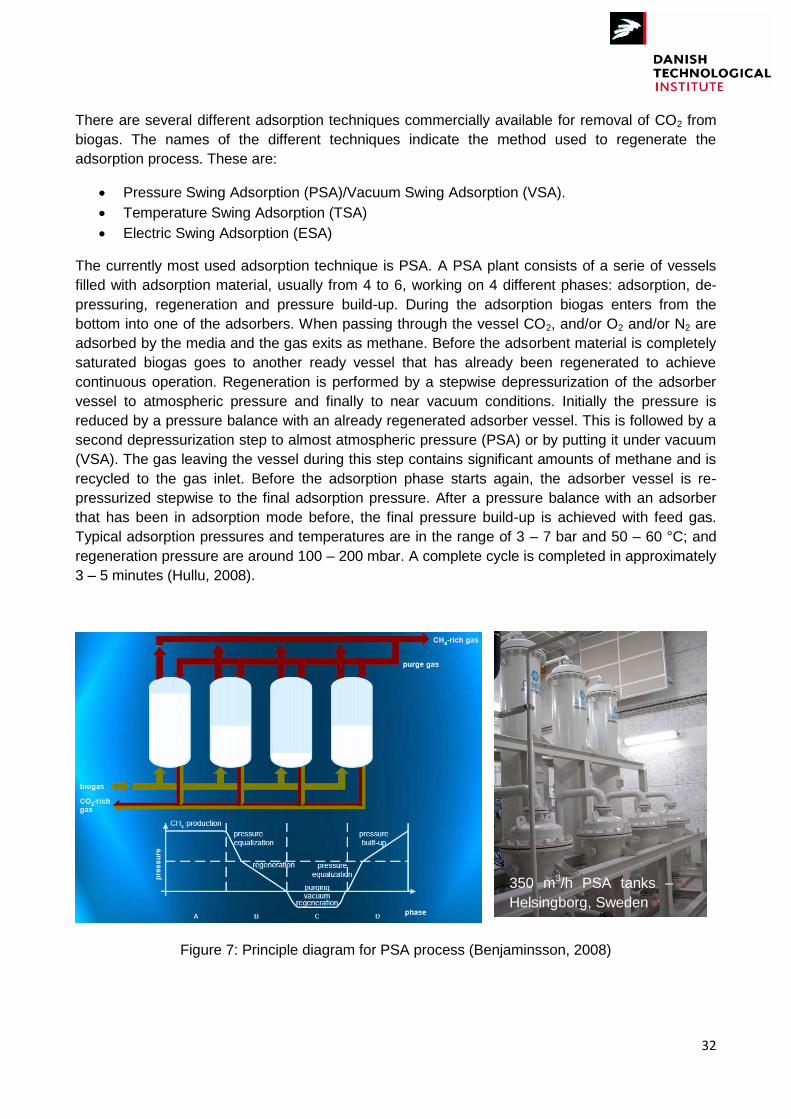
32
There are several different adsorption techniques commercially available for removal of CO2 from
biogas. The names of the different techniques indicate the method used to regenerate the
adsorption process. These are:
Pressure Swing Adsorption (PSA)/Vacuum Swing Adsorption (VSA).
Temperature Swing Adsorption (TSA)
Electric Swing Adsorption (ESA)
The currently most used adsorption technique is PSA. A PSA plant consists of a serie of vessels
filled with adsorption material, usually from 4 to 6, working on 4 different phases: adsorption, de-
pressuring, regeneration and pressure build-up. During the adsorption biogas enters from the
bottom into one of the adsorbers. When passing through the vessel CO2, and/or O2 and/or N2 are
adsorbed by the media and the gas exits as methane. Before the adsorbent material is completely
saturated biogas goes to another ready vessel that has already been regenerated to achieve
continuous operation. Regeneration is performed by a stepwise depressurization of the adsorber
vessel to atmospheric pressure and finally to near vacuum conditions. Initially the pressure is
reduced by a pressure balance with an already regenerated adsorber vessel. This is followed by a
second depressurization step to almost atmospheric pressure (PSA) or by putting it under vacuum
(VSA). The gas leaving the vessel during this step contains significant amounts of methane and is
recycled to the gas inlet. Before the adsorption phase starts again, the adsorber vessel is re-
pressurized stepwise to the final adsorption pressure. After a pressure balance with an adsorber
that has been in adsorption mode before, the final pressure build-up is achieved with feed gas.
Typical adsorption pressures and temperatures are in the range of 3 – 7 bar and 50 – 60 °C; and
regeneration pressure are around 100 – 200 mbar. A complete cycle is completed in approximately
3 – 5 minutes (Hullu, 2008).
Figure 7: Principle diagram for PSA process (Benjaminsson, 2008)
350 m3/h PSA tanks –
Helsingborg, Sweden

33
The adsorption material adsorbs hydrogen sulfide irreversibly and is thus poisoned by it. Therefore
H2S must be removed before the PSA process. The company CarboTech allows a maximum H2S
content in the biogas input of 5 mg/m3 for its PSA system. Water, siloxanes and organic solvents
are also contaminants to the process and must be removed.
PSA and VSA are similar systems, but VSA has a supplementary vacuum pump, so the differential
pressure is situated at lower absolute pressure. Adsorption takes place on a gas under pressure,
and desorption at vacuum.
New PSA processes have been recently developed like the rapid PSA process. This allows for
quicker treatment of the gas and up to 1/15 the size of unit is needed. Additionally, this technology
is said to cost ½ of what conventional PSA technologies costs and require less maintenance (BC
Innovation Council, 2008).
Typical CH4 concentrations in the product gas stream is about 96 – 98%, moreover the methane
rich stream is substantially free from siloxanes components and volatile organic compounds. The
methane losses are about 2 – 4% (CarboTech). In principle the optimization of the PSA is for
product gas purity or for methane losses. The higher the methane content in the product gas, the
higher the methane losses. Because the waste exhaust gas stream that leaves the absorber
vessels at the bottom includes 2 – 4% CH4, an exhaust gas cleaning is recommended or obligatory
depending on the country emission requirements. As the exhaust gas does not include any sulfur
the following exhaust gas treatment technologies are possible: 1) catalytic oxidation, 2)
regenerative thermal oxidation and 3) flameless oxidation
The demand of electric energy is about 0.25 kWh/Nm³ raw biogas. There is no heat demand for
the process. A 10 years lifetime is assumed by most of the companies. Installed biogas plants with
PSA technology range from 10 to 2,000 Nm3 raw biogas/h. But this technology is really suitable
from 200 Nm3/ h.
TSA works under different principle, instead of adjusting the pressure it adjusts the temperature.
The technique is usually applied to gas drying, where the moisture is first adsorbed at around
40 °C and the process regenerates above 120 °C.
Similarly to TSA, Electric Swing Adsorption (ESA) regenerates by means of temperature increase.
In contrast to TSA, ESA uses a low voltage electric current to heat the adsorbing material by the
direct Joule effect. The fact that this process cannot use waste heat for the regeneration, in
comparison to TSA, is a disadvantage. To its advantage it can be added that it shows higher
potential for volatile organic compounds removal than TSA.
5.2 Water Scrubbing
In this process the biogas is cleaned from CO2, H2S and NH3 that are physically dissolved in water
under pressure in an absorption column. CH4 is also dissolved in water, but its solubility is lower
than the other substances. Solubility increases with increasing pressure and decreasing
temperature. There are two types of water absorption process single pass absorption and
regenerative absorption. In both processes biogas is introduced from the bottom of a tall vertical
column and water is fed at the top of the column to achieve a gas-liquid counter flow. The column
is equipped with random packing to give a large specific surface for gas-liquid contact. The
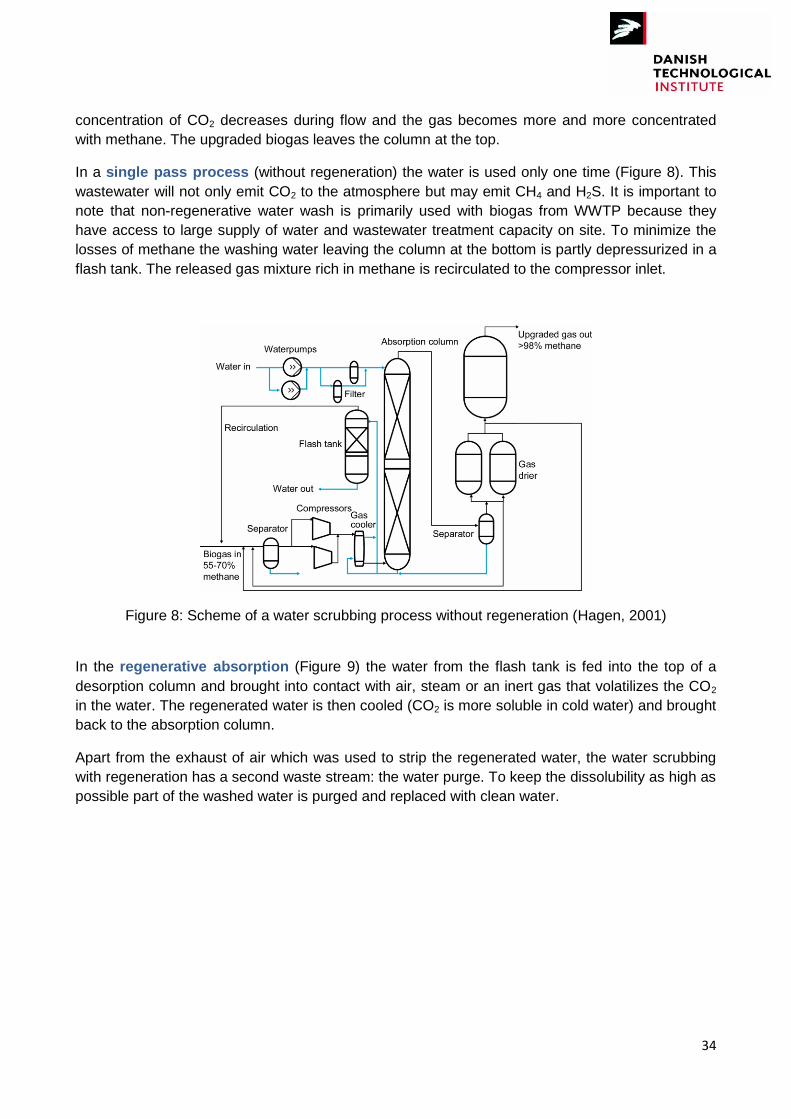
34
concentration of CO2 decreases during flow and the gas becomes more and more concentrated
with methane. The upgraded biogas leaves the column at the top.
In a single pass process (without regeneration) the water is used only one time (Figure 8). This
wastewater will not only emit CO2 to the atmosphere but may emit CH4 and H2S. It is important to
note that non-regenerative water wash is primarily used with biogas from WWTP because they
have access to large supply of water and wastewater treatment capacity on site. To minimize the
losses of methane the washing water leaving the column at the bottom is partly depressurized in a
flash tank. The released gas mixture rich in methane is recirculated to the compressor inlet.
Figure 8: Scheme of a water scrubbing process without regeneration (Hagen, 2001)
In the regenerative absorption (Figure 9) the water from the flash tank is fed into the top of a
desorption column and brought into contact with air, steam or an inert gas that volatilizes the CO2
in the water. The regenerated water is then cooled (CO2 is more soluble in cold water) and brought
back to the absorption column.
Apart from the exhaust of air which was used to strip the regenerated water, the water scrubbing
with regeneration has a second waste stream: the water purge. To keep the dissolubility as high as
possible part of the washed water is purged and replaced with clean water.
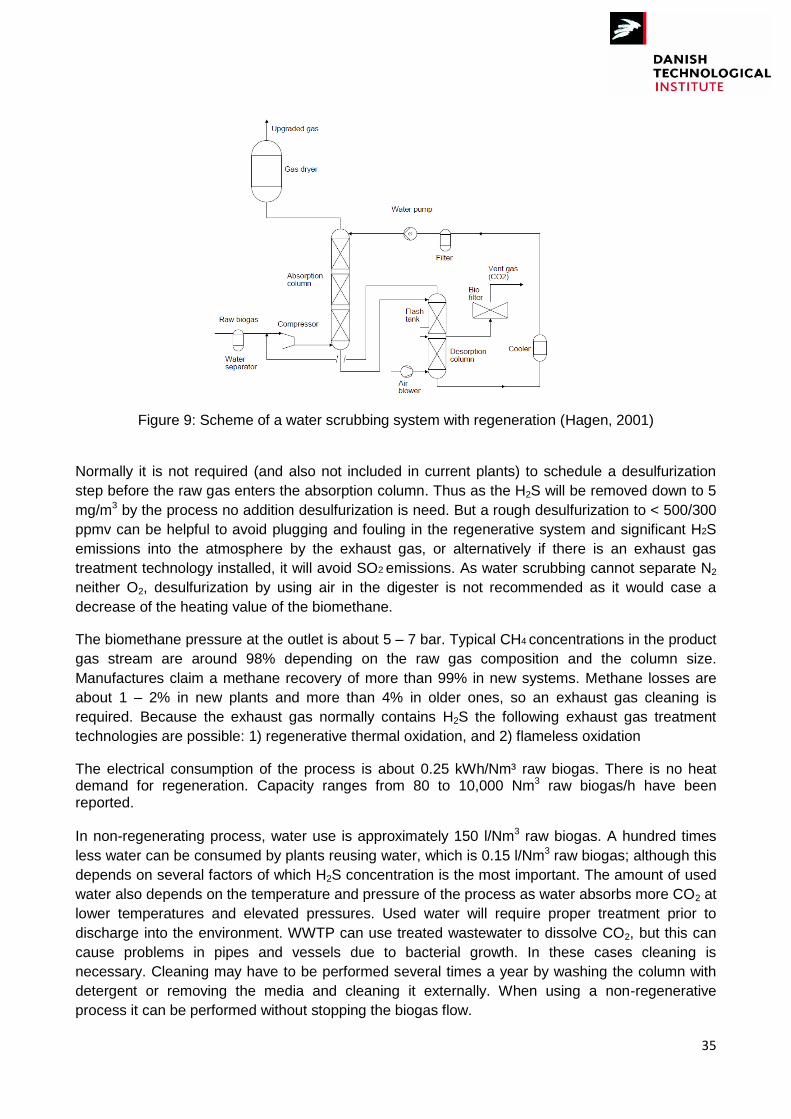
35
Figure 9: Scheme of a water scrubbing system with regeneration (Hagen, 2001)
Normally it is not required (and also not included in current plants) to schedule a desulfurization
step before the raw gas enters the absorption column. Thus as the H2S will be removed down to 5
mg/m3 by the process no addition desulfurization is need. But a rough desulfurization to < 500/300
ppmv can be helpful to avoid plugging and fouling in the regenerative system and significant H2S
emissions into the atmosphere by the exhaust gas, or alternatively if there is an exhaust gas
treatment technology installed, it will avoid SO2 emissions. As water scrubbing cannot separate N2
neither O2, desulfurization by using air in the digester is not recommended as it would case a
decrease of the heating value of the biomethane.
The biomethane pressure at the outlet is about 5 – 7 bar. Typical CH4 concentrations in the product
gas stream are around 98% depending on the raw gas composition and the column size.
Manufactures claim a methane recovery of more than 99% in new systems. Methane losses are
about 1 – 2% in new plants and more than 4% in older ones, so an exhaust gas cleaning is
required. Because the exhaust gas normally contains H2S the following exhaust gas treatment
technologies are possible: 1) regenerative thermal oxidation, and 2) flameless oxidation
The electrical consumption of the process is about 0.25 kWh/Nm³ raw biogas. There is no heat demand for regeneration. Capacity ranges from 80 to 10,000 Nm3 raw biogas/h have been reported. In non-regenerating process, water use is approximately 150 l/Nm3 raw biogas. A hundred times
less water can be consumed by plants reusing water, which is 0.15 l/Nm3 raw biogas; although this
depends on several factors of which H2S concentration is the most important. The amount of used
water also depends on the temperature and pressure of the process as water absorbs more CO2 at
lower temperatures and elevated pressures. Used water will require proper treatment prior to
discharge into the environment. WWTP can use treated wastewater to dissolve CO2, but this can
cause problems in pipes and vessels due to bacterial growth. In these cases cleaning is
necessary. Cleaning may have to be performed several times a year by washing the column with
detergent or removing the media and cleaning it externally. When using a non-regenerative
process it can be performed without stopping the biogas flow.
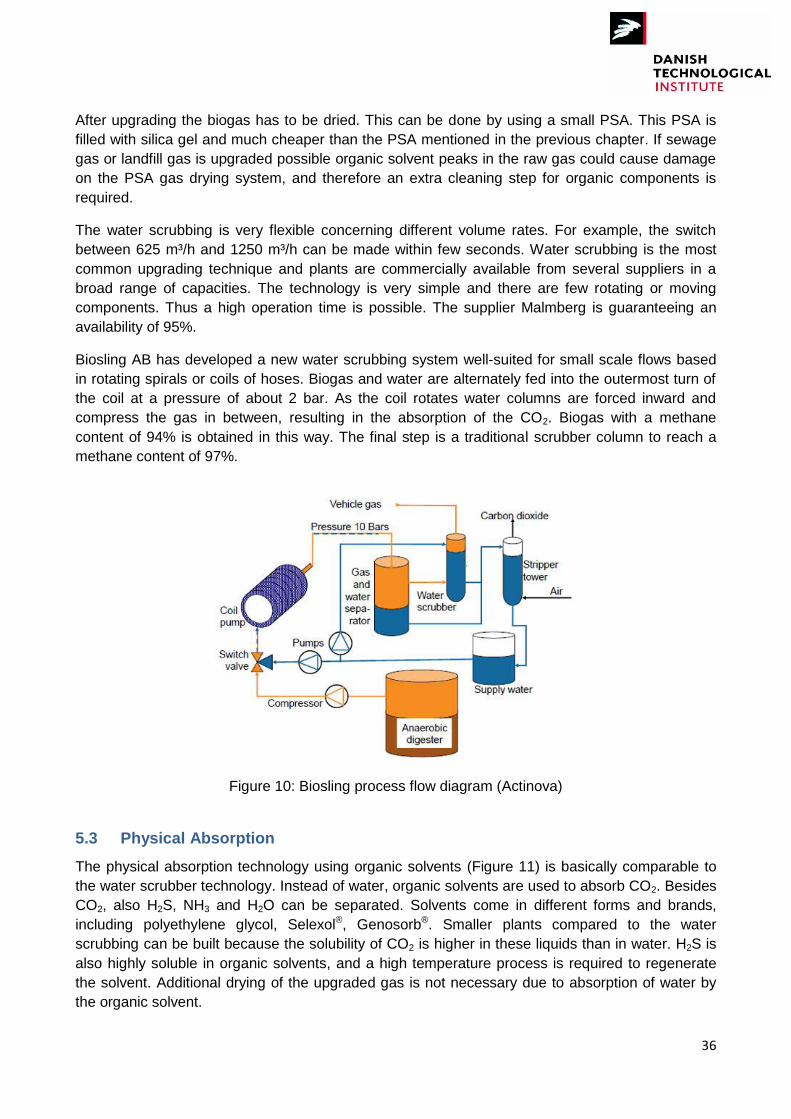
36
After upgrading the biogas has to be dried. This can be done by using a small PSA. This PSA is
filled with silica gel and much cheaper than the PSA mentioned in the previous chapter. If sewage
gas or landfill gas is upgraded possible organic solvent peaks in the raw gas could cause damage
on the PSA gas drying system, and therefore an extra cleaning step for organic components is
required.
The water scrubbing is very flexible concerning different volume rates. For example, the switch
between 625 m³/h and 1250 m³/h can be made within few seconds. Water scrubbing is the most
common upgrading technique and plants are commercially available from several suppliers in a
broad range of capacities. The technology is very simple and there are few rotating or moving
components. Thus a high operation time is possible. The supplier Malmberg is guaranteeing an
availability of 95%.
Biosling AB has developed a new water scrubbing system well-suited for small scale flows based
in rotating spirals or coils of hoses. Biogas and water are alternately fed into the outermost turn of
the coil at a pressure of about 2 bar. As the coil rotates water columns are forced inward and
compress the gas in between, resulting in the absorption of the CO2. Biogas with a methane
content of 94% is obtained in this way. The final step is a traditional scrubber column to reach a
methane content of 97%.
Figure 10: Biosling process flow diagram (Actinova)
5.3 Physical Absorption
The physical absorption technology using organic solvents (Figure 11) is basically comparable to
the water scrubber technology. Instead of water, organic solvents are used to absorb CO2. Besides
CO2, also H2S, NH3 and H2O can be separated. Solvents come in different forms and brands,
including polyethylene glycol, Selexol®, Genosorb®. Smaller plants compared to the water
scrubbing can be built because the solubility of CO2 is higher in these liquids than in water. H2S is
also highly soluble in organic solvents, and a high temperature process is required to regenerate
the solvent. Additional drying of the upgraded gas is not necessary due to absorption of water by
the organic solvent.
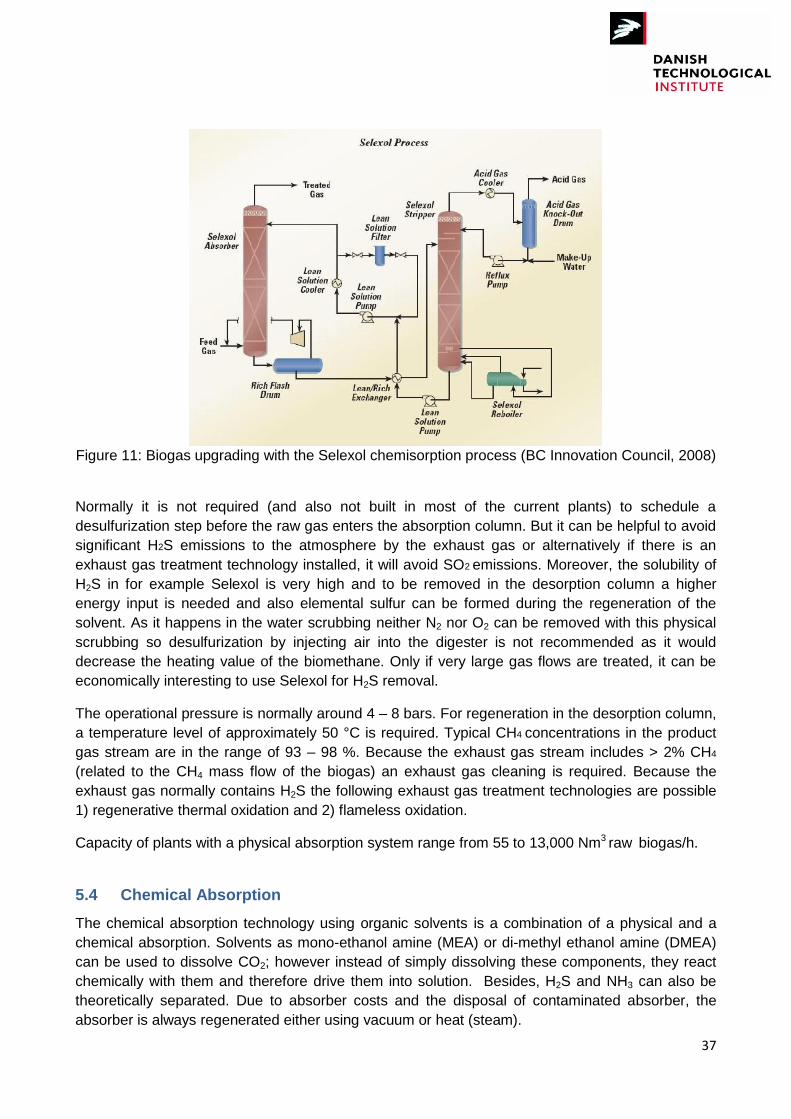
37
Figure 11: Biogas upgrading with the Selexol chemisorption process (BC Innovation Council, 2008)
Normally it is not required (and also not built in most of the current plants) to schedule a
desulfurization step before the raw gas enters the absorption column. But it can be helpful to avoid
significant H2S emissions to the atmosphere by the exhaust gas or alternatively if there is an
exhaust gas treatment technology installed, it will avoid SO2 emissions. Moreover, the solubility of
H2S in for example Selexol is very high and to be removed in the desorption column a higher
energy input is needed and also elemental sulfur can be formed during the regeneration of the
solvent. As it happens in the water scrubbing neither N2 nor O2 can be removed with this physical
scrubbing so desulfurization by injecting air into the digester is not recommended as it would
decrease the heating value of the biomethane. Only if very large gas flows are treated, it can be
economically interesting to use Selexol for H2S removal.
The operational pressure is normally around 4 – 8 bars. For regeneration in the desorption column,
a temperature level of approximately 50 °C is required. Typical CH4 concentrations in the product
gas stream are in the range of 93 – 98 %. Because the exhaust gas stream includes > 2% CH4
(related to the CH4 mass flow of the biogas) an exhaust gas cleaning is required. Because the
exhaust gas normally contains H2S the following exhaust gas treatment technologies are possible
1) regenerative thermal oxidation and 2) flameless oxidation.
Capacity of plants with a physical absorption system range from 55 to 13,000 Nm3 raw biogas/h.
5.4 Chemical Absorption
The chemical absorption technology using organic solvents is a combination of a physical and a
chemical absorption. Solvents as mono-ethanol amine (MEA) or di-methyl ethanol amine (DMEA)
can be used to dissolve CO2; however instead of simply dissolving these components, they react
chemically with them and therefore drive them into solution. Besides, H2S and NH3 can also be
theoretically separated. Due to absorber costs and the disposal of contaminated absorber, the
absorber is always regenerated either using vacuum or heat (steam).

38
Amines are highly CO2 selective, and result in minimal losses of CH4 (< 0.1%). CH4 output can be
as high as 99.5% if there is no N2 and/or O2 in the biogas flow. However, these organic solvents are
toxic to humans and the environment. Furthermore, they required significant energy consumption
for regeneration and water from the biogas may contaminate the chemical, reducing its efficiency.
To regenerate amines a heat demand in the desorption column of about 0.5 kWh/Nm3 cleaned
biogas is needed at 120 – 160 °C. About 2/3 of that heat can be recovered in the process to heat
the digester of the biogas plant if both facilities are at the same location. The pressure in the
absorption column is normally only a few mbars.
The preliminary purification of the biogas is very demanding (< 6 ppm H2S, low oxygen) to avoid
corrosion, undesirable chemical reactions and higher temperatures for the regeneration. Therefore
an exhaust gas treatment is not necessary. H2S removal systems by adding air into the digester
are not recommended as neither N2 nor O2 are removed by chemical absorption.
Chemical absorption is more cost competitive for larger plants than for smaller. Installed biogas
plants with upgrading chemical adoption system range between 100 to 10,000 Nm3 raw biogas/h.
5.5 Membrane Technology
In membrane separation systems CO2 and other components as H2O, H2S and NH3 are
transported through a thin membrane in more or less extent while CH4 is retaining, due to
difference in particle size and/or affinity. The driving force behind this process is a difference in
partial pressures. The properties of this separation technique are highly dependent on the type of
membrane used. Many different membranes are available each with its particular specifications.
Two basic systems exist: (1) gas-gas separation with a gas phase at both sides of the membrane
and (2) gas-liquid absorption separation with a liquid absorbing the diffused molecules.
In the last years the membrane technology has experimented important improvements, technical
and economical.
Figure 12: Membrane separation principle (Persson, 2003)
a) Gas-gas separation, solid membrane process or dry membranes.
Dry membranes for biogas upgrading are made of materials that are permeable to CO2, H2O and
NH3. H2S and O2 permeate through the membrane to some extent while N2 and CH4 only pass to a
very low extent. Usually membranes are in the form of hollow fibers bundler together, and very
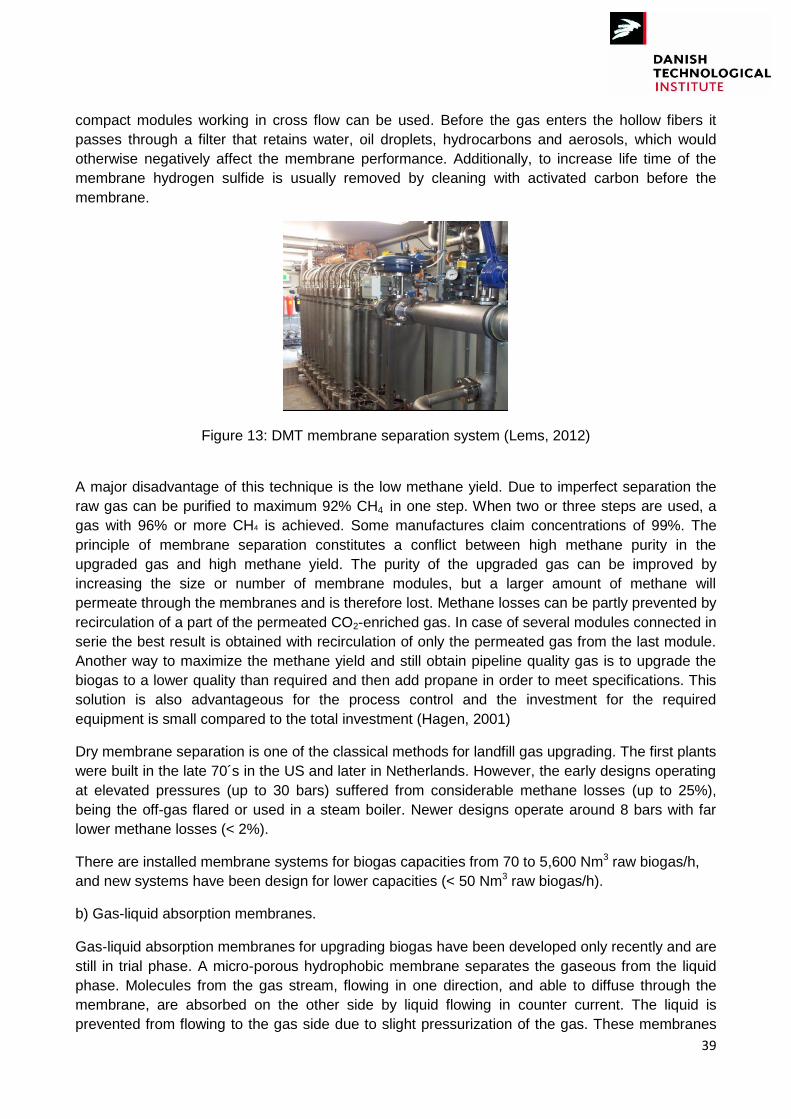
39
compact modules working in cross flow can be used. Before the gas enters the hollow fibers it
passes through a filter that retains water, oil droplets, hydrocarbons and aerosols, which would
otherwise negatively affect the membrane performance. Additionally, to increase life time of the
membrane hydrogen sulfide is usually removed by cleaning with activated carbon before the
membrane.
Figure 13: DMT membrane separation system (Lems, 2012)
A major disadvantage of this technique is the low methane yield. Due to imperfect separation the
raw gas can be purified to maximum 92% CH4 in one step. When two or three steps are used, a
gas with 96% or more CH4 is achieved. Some manufactures claim concentrations of 99%. The
principle of membrane separation constitutes a conflict between high methane purity in the
upgraded gas and high methane yield. The purity of the upgraded gas can be improved by
increasing the size or number of membrane modules, but a larger amount of methane will
permeate through the membranes and is therefore lost. Methane losses can be partly prevented by
recirculation of a part of the permeated CO2-enriched gas. In case of several modules connected in
serie the best result is obtained with recirculation of only the permeated gas from the last module.
Another way to maximize the methane yield and still obtain pipeline quality gas is to upgrade the
biogas to a lower quality than required and then add propane in order to meet specifications. This
solution is also advantageous for the process control and the investment for the required
equipment is small compared to the total investment (Hagen, 2001)
Dry membrane separation is one of the classical methods for landfill gas upgrading. The first plants
were built in the late 70´s in the US and later in Netherlands. However, the early designs operating
at elevated pressures (up to 30 bars) suffered from considerable methane losses (up to 25%),
being the off-gas flared or used in a steam boiler. Newer designs operate around 8 bars with far
lower methane losses (< 2%).
There are installed membrane systems for biogas capacities from 70 to 5,600 Nm3 raw biogas/h,
and new systems have been design for lower capacities (< 50 Nm3 raw biogas/h).
b) Gas-liquid absorption membranes.
Gas-liquid absorption membranes for upgrading biogas have been developed only recently and are
still in trial phase. A micro-porous hydrophobic membrane separates the gaseous from the liquid
phase. Molecules from the gas stream, flowing in one direction, and able to diffuse through the
membrane, are absorbed on the other side by liquid flowing in counter current. The liquid is
prevented from flowing to the gas side due to slight pressurization of the gas. These membranes
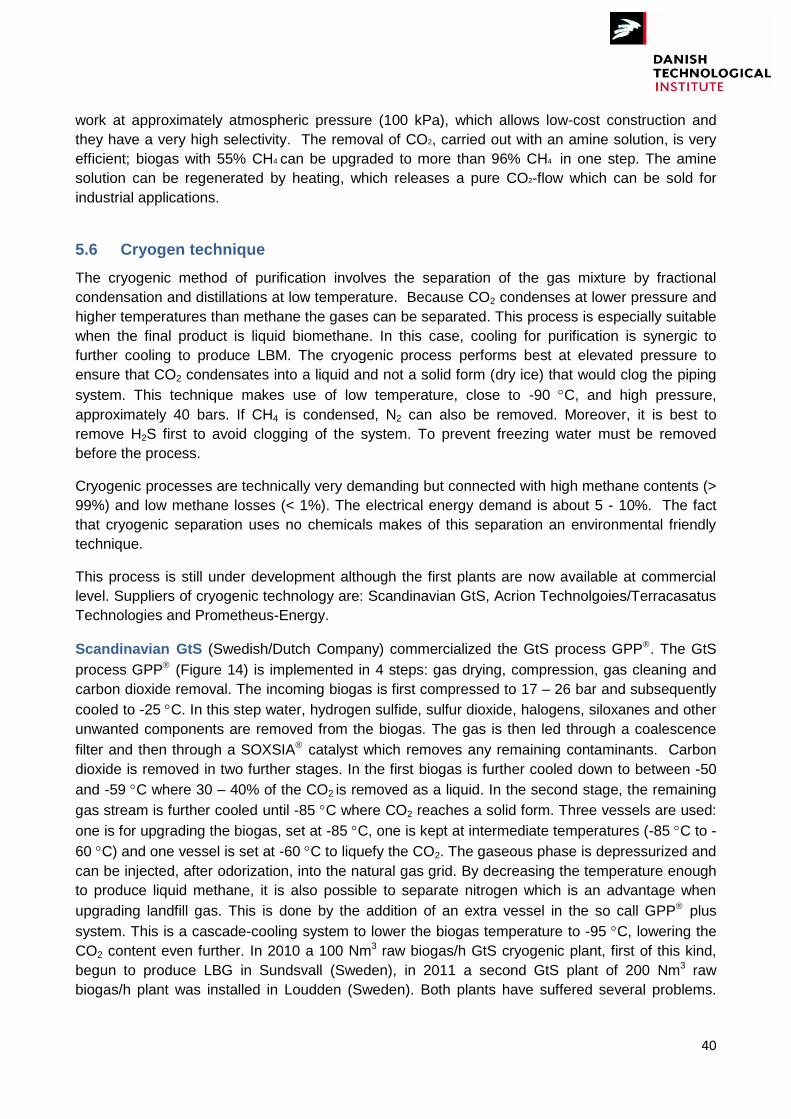
40
work at approximately atmospheric pressure (100 kPa), which allows low-cost construction and
they have a very high selectivity. The removal of CO2, carried out with an amine solution, is very
efficient; biogas with 55% CH4 can be upgraded to more than 96% CH4 in one step. The amine
solution can be regenerated by heating, which releases a pure CO2-flow which can be sold for
industrial applications.
5.6 Cryogen technique
The cryogenic method of purification involves the separation of the gas mixture by fractional
condensation and distillations at low temperature. Because CO2 condenses at lower pressure and
higher temperatures than methane the gases can be separated. This process is especially suitable
when the final product is liquid biomethane. In this case, cooling for purification is synergic to
further cooling to produce LBM. The cryogenic process performs best at elevated pressure to
ensure that CO2 condensates into a liquid and not a solid form (dry ice) that would clog the piping
system. This technique makes use of low temperature, close to -90 C, and high pressure,
approximately 40 bars. If CH4 is condensed, N2 can also be removed. Moreover, it is best to
remove H2S first to avoid clogging of the system. To prevent freezing water must be removed
before the process.
Cryogenic processes are technically very demanding but connected with high methane contents (>
99%) and low methane losses (< 1%). The electrical energy demand is about 5 - 10%. The fact
that cryogenic separation uses no chemicals makes of this separation an environmental friendly
technique.
This process is still under development although the first plants are now available at commercial
level. Suppliers of cryogenic technology are: Scandinavian GtS, Acrion Technolgoies/Terracasatus
Technologies and Prometheus-Energy.
Scandinavian GtS (Swedish/Dutch Company) commercialized the GtS process GPP. The GtS
process GPP (Figure 14) is implemented in 4 steps: gas drying, compression, gas cleaning and
carbon dioxide removal. The incoming biogas is first compressed to 17 – 26 bar and subsequently
cooled to -25 C. In this step water, hydrogen sulfide, sulfur dioxide, halogens, siloxanes and other
unwanted components are removed from the biogas. The gas is then led through a coalescence
filter and then through a SOXSIA catalyst which removes any remaining contaminants. Carbon
dioxide is removed in two further stages. In the first biogas is further cooled down to between -50
and -59 C where 30 – 40% of the CO2 is removed as a liquid. In the second stage, the remaining
gas stream is further cooled until -85 C where CO2 reaches a solid form. Three vessels are used:
one is for upgrading the biogas, set at -85 C, one is kept at intermediate temperatures (-85 C to -
60 C) and one vessel is set at -60 C to liquefy the CO2. The gaseous phase is depressurized and
can be injected, after odorization, into the natural gas grid. By decreasing the temperature enough
to produce liquid methane, it is also possible to separate nitrogen which is an advantage when
upgrading landfill gas. This is done by the addition of an extra vessel in the so call GPP plus
system. This is a cascade-cooling system to lower the biogas temperature to -95 C, lowering the
CO2 content even further. In 2010 a 100 Nm3 raw biogas/h GtS cryogenic plant, first of this kind,
begun to produce LBG in Sundsvall (Sweden), in 2011 a second GtS plant of 200 Nm3 raw
biogas/h plant was installed in Loudden (Sweden). Both plants have suffered several problems.
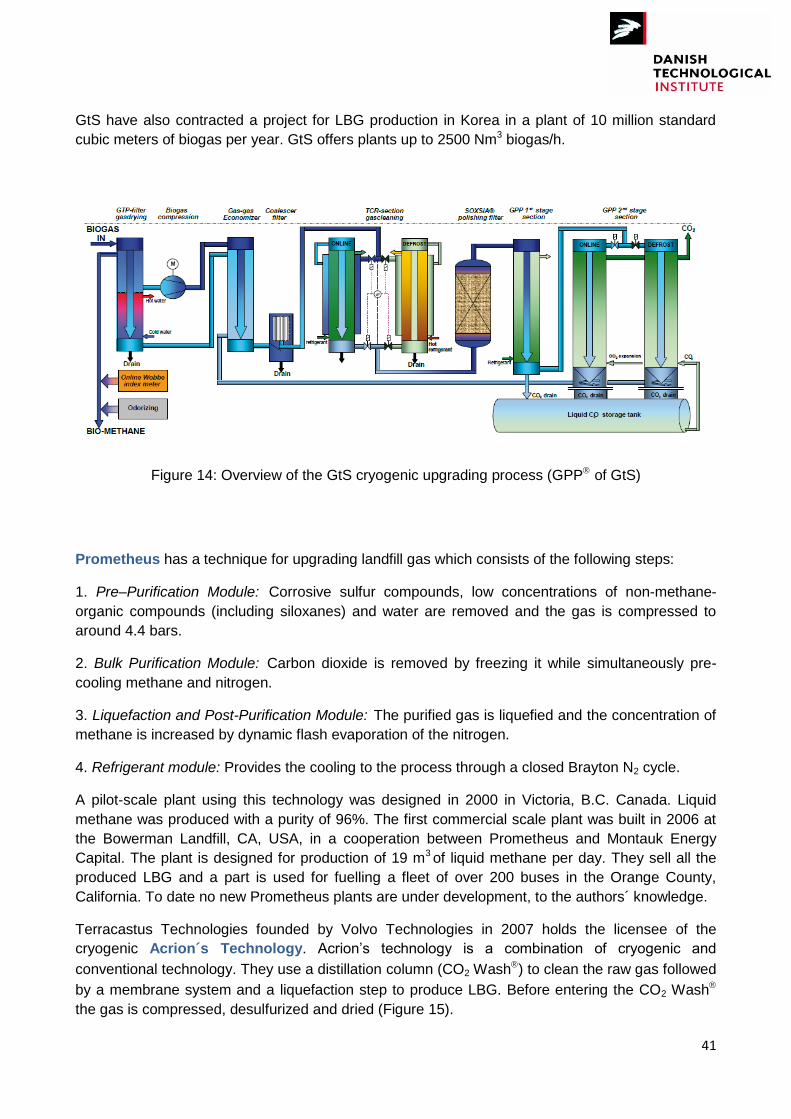
41
GtS have also contracted a project for LBG production in Korea in a plant of 10 million standard
cubic meters of biogas per year. GtS offers plants up to 2500 Nm3 biogas/h.
Figure 14: Overview of the GtS cryogenic upgrading process (GPP of GtS)
Prometheus has a technique for upgrading landfill gas which consists of the following steps:
1. Pre–Purification Module: Corrosive sulfur compounds, low concentrations of non-methane-
organic compounds (including siloxanes) and water are removed and the gas is compressed to
around 4.4 bars.
2. Bulk Purification Module: Carbon dioxide is removed by freezing it while simultaneously pre-
cooling methane and nitrogen.
3. Liquefaction and Post-Purification Module: The purified gas is liquefied and the concentration of
methane is increased by dynamic flash evaporation of the nitrogen.
4. Refrigerant module: Provides the cooling to the process through a closed Brayton N2 cycle.
A pilot-scale plant using this technology was designed in 2000 in Victoria, B.C. Canada. Liquid
methane was produced with a purity of 96%. The first commercial scale plant was built in 2006 at
the Bowerman Landfill, CA, USA, in a cooperation between Prometheus and Montauk Energy
Capital. The plant is designed for production of 19 m3 of liquid methane per day. They sell all the
produced LBG and a part is used for fuelling a fleet of over 200 buses in the Orange County,
California. To date no new Prometheus plants are under development, to the authors´ knowledge.
Terracastus Technologies founded by Volvo Technologies in 2007 holds the licensee of the
cryogenic Acrion´s Technology. Acrion‟s technology is a combination of cryogenic and
conventional technology. They use a distillation column (CO2 Wash) to clean the raw gas followed
by a membrane system and a liquefaction step to produce LBG. Before entering the CO2 Wash
the gas is compressed, desulfurized and dried (Figure 15).
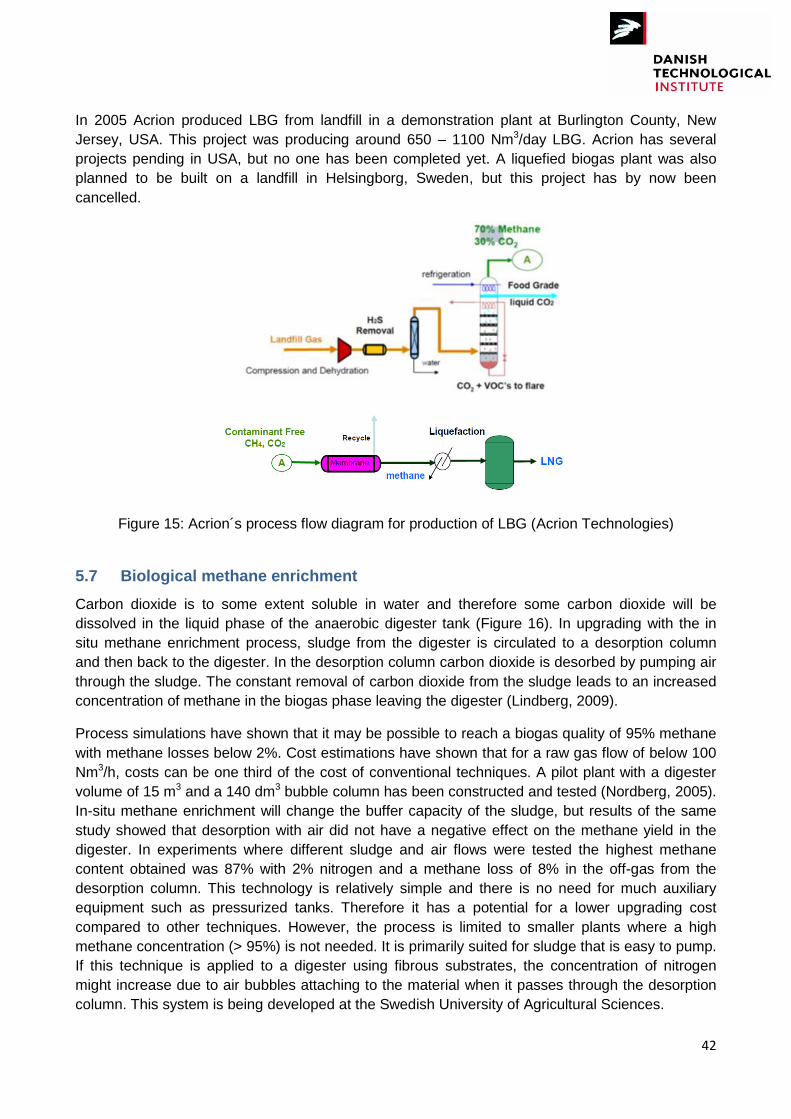
42
In 2005 Acrion produced LBG from landfill in a demonstration plant at Burlington County, New
Jersey, USA. This project was producing around 650 – 1100 Nm3/day LBG. Acrion has several
projects pending in USA, but no one has been completed yet. A liquefied biogas plant was also
planned to be built on a landfill in Helsingborg, Sweden, but this project has by now been
cancelled.
Figure 15: Acrion´s process flow diagram for production of LBG (Acrion Technologies)
5.7 Biological methane enrichment
Carbon dioxide is to some extent soluble in water and therefore some carbon dioxide will be
dissolved in the liquid phase of the anaerobic digester tank (Figure 16). In upgrading with the in
situ methane enrichment process, sludge from the digester is circulated to a desorption column
and then back to the digester. In the desorption column carbon dioxide is desorbed by pumping air
through the sludge. The constant removal of carbon dioxide from the sludge leads to an increased
concentration of methane in the biogas phase leaving the digester (Lindberg, 2009).
Process simulations have shown that it may be possible to reach a biogas quality of 95% methane
with methane losses below 2%. Cost estimations have shown that for a raw gas flow of below 100
Nm3/h, costs can be one third of the cost of conventional techniques. A pilot plant with a digester
volume of 15 m3 and a 140 dm3 bubble column has been constructed and tested (Nordberg, 2005).
In-situ methane enrichment will change the buffer capacity of the sludge, but results of the same
study showed that desorption with air did not have a negative effect on the methane yield in the
digester. In experiments where different sludge and air flows were tested the highest methane
content obtained was 87% with 2% nitrogen and a methane loss of 8% in the off-gas from the
desorption column. This technology is relatively simple and there is no need for much auxiliary
equipment such as pressurized tanks. Therefore it has a potential for a lower upgrading cost
compared to other techniques. However, the process is limited to smaller plants where a high
methane concentration (> 95%) is not needed. It is primarily suited for sludge that is easy to pump.
If this technique is applied to a digester using fibrous substrates, the concentration of nitrogen
might increase due to air bubbles attaching to the material when it passes through the desorption
column. This system is being developed at the Swedish University of Agricultural Sciences.
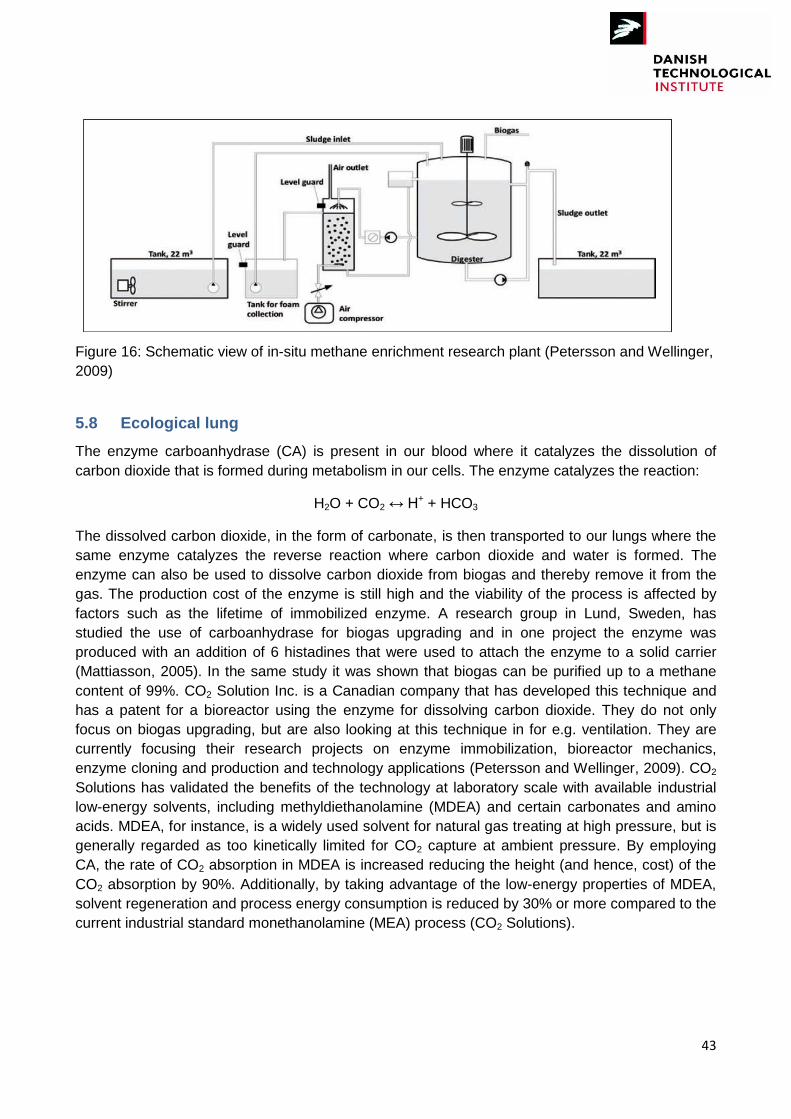
43
Figure 16: Schematic view of in-situ methane enrichment research plant (Petersson and Wellinger,
2009)
5.8 Ecological lung
The enzyme carboanhydrase (CA) is present in our blood where it catalyzes the dissolution of
carbon dioxide that is formed during metabolism in our cells. The enzyme catalyzes the reaction:
H2O + CO2 ↔ H+ + HCO3
The dissolved carbon dioxide, in the form of carbonate, is then transported to our lungs where the
same enzyme catalyzes the reverse reaction where carbon dioxide and water is formed. The
enzyme can also be used to dissolve carbon dioxide from biogas and thereby remove it from the
gas. The production cost of the enzyme is still high and the viability of the process is affected by
factors such as the lifetime of immobilized enzyme. A research group in Lund, Sweden, has
studied the use of carboanhydrase for biogas upgrading and in one project the enzyme was
produced with an addition of 6 histadines that were used to attach the enzyme to a solid carrier
(Mattiasson, 2005). In the same study it was shown that biogas can be purified up to a methane
content of 99%. CO2 Solution Inc. is a Canadian company that has developed this technique and
has a patent for a bioreactor using the enzyme for dissolving carbon dioxide. They do not only
focus on biogas upgrading, but are also looking at this technique in for e.g. ventilation. They are
currently focusing their research projects on enzyme immobilization, bioreactor mechanics,
enzyme cloning and production and technology applications (Petersson and Wellinger, 2009). CO2
Solutions has validated the benefits of the technology at laboratory scale with available industrial
low-energy solvents, including methyldiethanolamine (MDEA) and certain carbonates and amino
acids. MDEA, for instance, is a widely used solvent for natural gas treating at high pressure, but is
generally regarded as too kinetically limited for CO2 capture at ambient pressure. By employing
CA, the rate of CO2 absorption in MDEA is increased reducing the height (and hence, cost) of the
CO2 absorption by 90%. Additionally, by taking advantage of the low-energy properties of MDEA,
solvent regeneration and process energy consumption is reduced by 30% or more compared to the
current industrial standard monethanolamine (MEA) process (CO2 Solutions).

44
Figure 17: CO2 Solutions process for CO2 removal (CO2 Solutions)
5.9 Summary of upgrading technologies specifications
Each of the mentioned technologies, except the biological and ecological lung, is in operation in
large scale and delivers biomethane that meets the local standards for injection in the natural gas
grid or for vehicle fuel. Full scales cryogenic implementation is very recent, last 2/3 years and the
technology is still under development. Table 12, Figure 18, Figure 19 and Table 13 show the most
relevant data when comparing different technologies. This data is just an indication. In practice
local conditions are very different (water supply, available heat, emission limits, etc.), therefore
there is not a best technical solution available on the market; all of them have their advantages and
disadvantages. A deep study must be done for each concrete project regarding to upgrading
capacity, shut-down/start-up performance, product quality needed, chemicals and energy
consumption, etc. Investment cost, operation costs and maintenance costs are always taken into
consideration as well as plant capacity. The operational costs are determined by the use of
chemicals and by the use of energetic or physical aid streams, like heat or water, while other
techniques might require electricity (pressure and/or cooling). When the installation is located near
an entity that has an excess of heat, a technique that requires heat as the amine gas cleaning can
be an economical relevant choice. A lot of the choices are determined by the presence or the
absence of suppliers for the technology in the particular country. In Sweden, water scrubbers are
used mostly. In Germany they prefer PSA and chemical scrubbing units and in The Netherlands
they use water scrubbers, PSA-units as well as membrane technology.
In order to make a correct comparison of investment and operation cost, the necessary costs for
pre/post treatment also need to be taking into consideration, as well as the savings in useful
utilization of residues. Price comparison of the „basic installation´ usually gives a false picture,
because one supplier integrates all process stages into a single installation, and another takes a
different approach. In a report published at the end of 2008 the German Fraunhofer UMSIGT
compared gas scrubbing and PSA techniques of various manufactures (Figure 18) (Petersson,
2009). The investment costs of a 500 Nm3 capacity plant were around one million euro. The scale
advantages are considerable, particularly when scaling up from 250 to 500 Nm3. Today, there are
commercially available plants for capacities lower than 250 Nm3/h, while also plants larger than
2,000 Nm3/h are being built (Petersson and Wellinger, 2009).
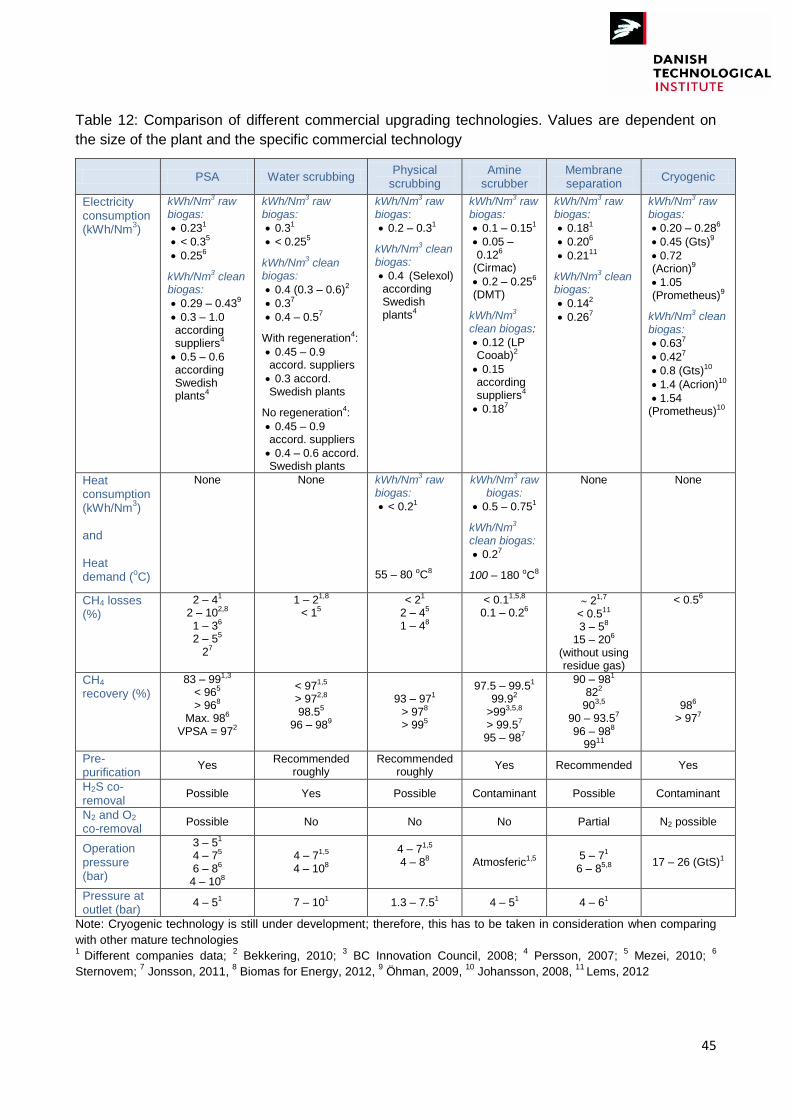
45
Table 12: Comparison of different commercial upgrading technologies. Values are dependent on
the size of the plant and the specific commercial technology
PSA Water scrubbing Physical
scrubbing Amine
scrubber Membrane separation
Cryogenic
Electricity consumption (kWh/Nm
3)
kWh/Nm3 raw biogas:
0.231
< 0.35
0.256
kWh/Nm3 clean biogas:
0.29 – 0.439
0.3 – 1.0 according suppliers4
0.5 – 0.6 according Swedish plants4
kWh/Nm3 raw biogas:
0.31
< 0.255
kWh/Nm3 clean biogas:
0.4 (0.3 – 0.6)2
0.37
0.4 – 0.57
With regeneration4:
0.45 – 0.9 accord. suppliers
0.3 accord. Swedish plants
No regeneration4:
0.45 – 0.9 accord. suppliers
0.4 – 0.6 accord. Swedish plants
kWh/Nm3 raw biogas:
0.2 – 0.31
kWh/Nm3 clean biogas:
0.4 (Selexol) according Swedish plants4
kWh/Nm3 raw biogas:
0.1 – 0.151
0.05 –0.126
(Cirmac)
0.2 – 0.256 (DMT)
kWh/Nm3 clean biogas:
0.12 (LP Cooab)2
0.15 according suppliers4
0.187
kWh/Nm3 raw biogas:
0.181
0.206
0.2111
kWh/Nm3 clean biogas:
0.142
0.267
kWh/Nm3 raw biogas:
0.20 – 0.286
0.45 (Gts)9
0.72
(Acrion)9
1.05
(Prometheus)9
kWh/Nm3 clean biogas:
0.637
0.427
0.8 (Gts)10
1.4 (Acrion)10
1.54 (Prometheus)10
Heat consumption (kWh/Nm
3)
and Heat demand (
oC)
None None kWh/Nm3 raw biogas:
< 0.21
55 – 80 oC8
kWh/Nm3 raw biogas:
0.5 – 0.751
kWh/Nm3 clean biogas:
0.27
100 – 180 oC8
None None
CH4 losses (%)
2 – 41
2 – 102,8 1 – 36 2 – 55
27
1 – 21,8
< 15 < 21
2 – 45
1 – 48
< 0.11,5,8
0.1 – 0.26 21,7
< 0.511
3 – 58 15 – 206
(without using residue gas)
< 0.56
CH4 recovery (%)
83 – 991,3
< 965 > 968
Max. 986 VPSA = 972
< 971,5
> 972,8 98.55
96 – 989
93 – 971
> 978 > 995
97.5 – 99.51
99.92 >993,5,8
> 99.57 95 – 987
90 – 981
822 903,5
90 – 93.57 96 – 988
9911
986
> 977
Pre-purification
Yes Recommended roughly
Recommended roughly
Yes Recommended Yes
H2S co-removal
Possible Yes Possible Contaminant Possible Contaminant
N2 and O2 co-removal
Possible No No No Partial N2 possible
Operation pressure (bar)
3 – 51 4 – 75 6 – 86
4 – 108
4 – 71,5
4 – 108
4 – 71,5
4 – 88
Atmosferic1,5 5 – 71 6 – 85,8
17 – 26 (GtS)1
Pressure at outlet (bar)
4 – 51 7 – 101 1.3 – 7.51 4 – 51 4 – 61
Note: Cryogenic technology is still under development; therefore, this has to be taken in consideration when comparing
with other mature technologies 1
Different companies data; 2 Bekkering, 2010;
3 BC Innovation Council, 2008;
4 Persson, 2007;
5 Mezei, 2010;
6
Sternovem; 7 Jonsson, 2011,
8 Biomas for Energy, 2012,
9 Öhman, 2009,
10 Johansson, 2008,
11 Lems, 2012
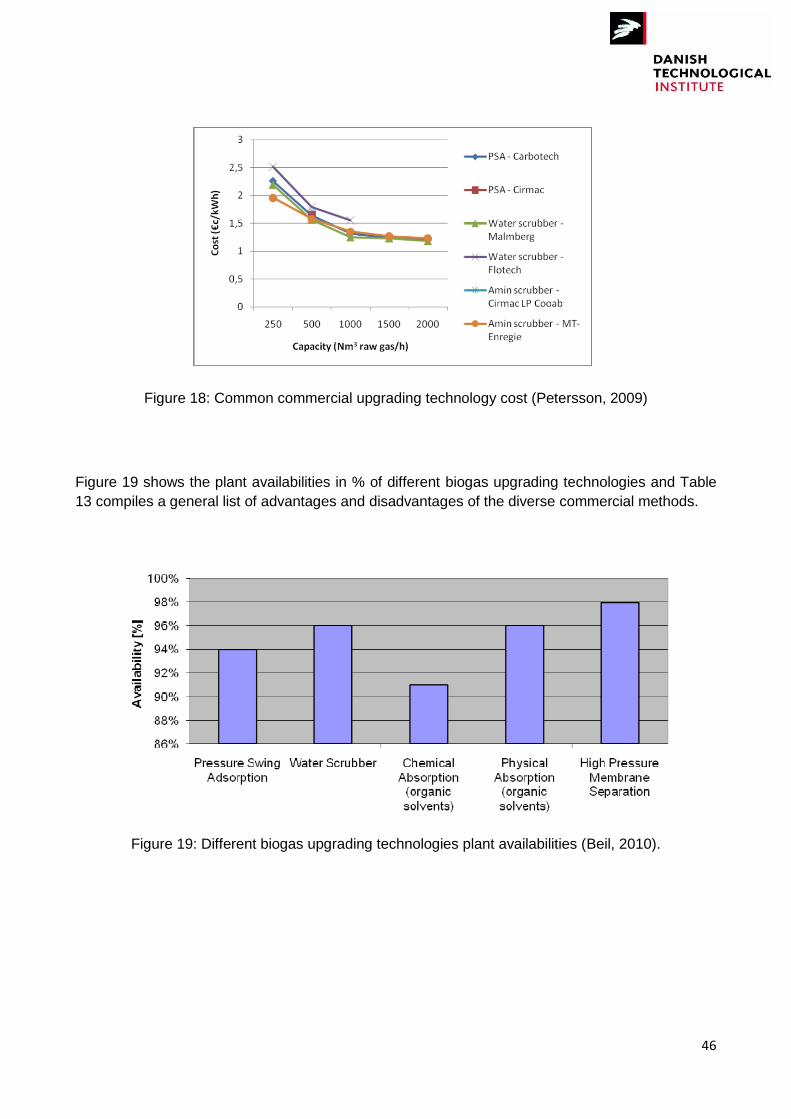
46
Figure 18: Common commercial upgrading technology cost (Petersson, 2009)
Figure 19 shows the plant availabilities in % of different biogas upgrading technologies and Table
13 compiles a general list of advantages and disadvantages of the diverse commercial methods.
Figure 19: Different biogas upgrading technologies plant availabilities (Beil, 2010).
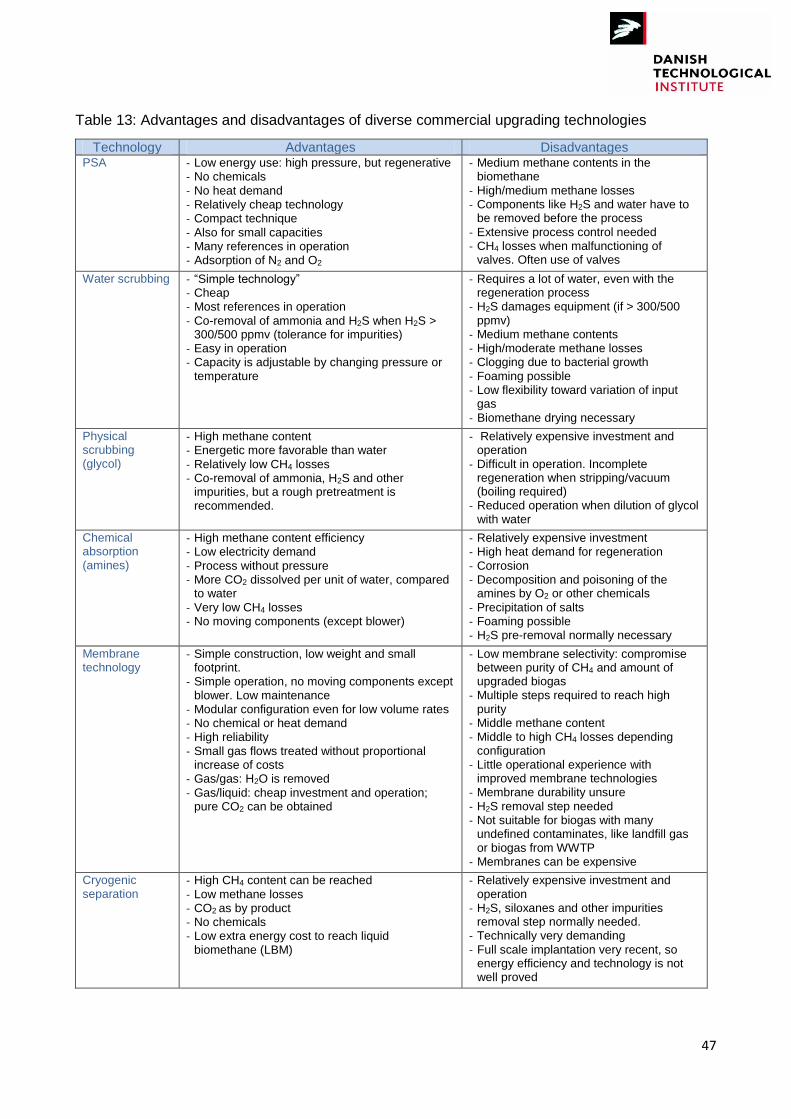
47
Table 13: Advantages and disadvantages of diverse commercial upgrading technologies
Technology Advantages Disadvantages PSA - Low energy use: high pressure, but regenerative
- No chemicals
- No heat demand - Relatively cheap technology - Compact technique
- Also for small capacities - Many references in operation - Adsorption of N2 and O2
- Medium methane contents in the biomethane
- High/medium methane losses - Components like H2S and water have to
be removed before the process
- Extensive process control needed - CH4 losses when malfunctioning of
valves. Often use of valves
Water scrubbing - “Simple technology” - Cheap - Most references in operation
- Co-removal of ammonia and H2S when H2S > 300/500 ppmv (tolerance for impurities)
- Easy in operation - Capacity is adjustable by changing pressure or
temperature
- Requires a lot of water, even with the regeneration process
- H2S damages equipment (if > 300/500 ppmv)
- Medium methane contents - High/moderate methane losses - Clogging due to bacterial growth
- Foaming possible - Low flexibility toward variation of input
gas
- Biomethane drying necessary
Physical scrubbing (glycol)
- High methane content - Energetic more favorable than water
- Relatively low CH4 losses - Co-removal of ammonia, H2S and other
impurities, but a rough pretreatment is recommended.
- Relatively expensive investment and operation
- Difficult in operation. Incomplete regeneration when stripping/vacuum (boiling required)
- Reduced operation when dilution of glycol with water
Chemical absorption (amines)
- High methane content efficiency - Low electricity demand
- Process without pressure - More CO2 dissolved per unit of water, compared
to water
- Very low CH4 losses - No moving components (except blower)
- Relatively expensive investment - High heat demand for regeneration
- Corrosion - Decomposition and poisoning of the
amines by O2 or other chemicals
- Precipitation of salts - Foaming possible - H2S pre-removal normally necessary
Membrane technology
- Simple construction, low weight and small footprint.
- Simple operation, no moving components except blower. Low maintenance
- Modular configuration even for low volume rates - No chemical or heat demand - High reliability
- Small gas flows treated without proportional increase of costs
- Gas/gas: H2O is removed
- Gas/liquid: cheap investment and operation; pure CO2 can be obtained
- Low membrane selectivity: compromise between purity of CH4 and amount of upgraded biogas
- Multiple steps required to reach high purity
- Middle methane content - Middle to high CH4 losses depending
configuration - Little operational experience with
improved membrane technologies - Membrane durability unsure
- H2S removal step needed - Not suitable for biogas with many
undefined contaminates, like landfill gas or biogas from WWTP
- Membranes can be expensive
Cryogenic separation
- High CH4 content can be reached
- Low methane losses - CO2 as by product - No chemicals - Low extra energy cost to reach liquid
biomethane (LBM)
- Relatively expensive investment and operation
- H2S, siloxanes and other impurities removal step normally needed.
- Technically very demanding
- Full scale implantation very recent, so energy efficiency and technology is not well proved
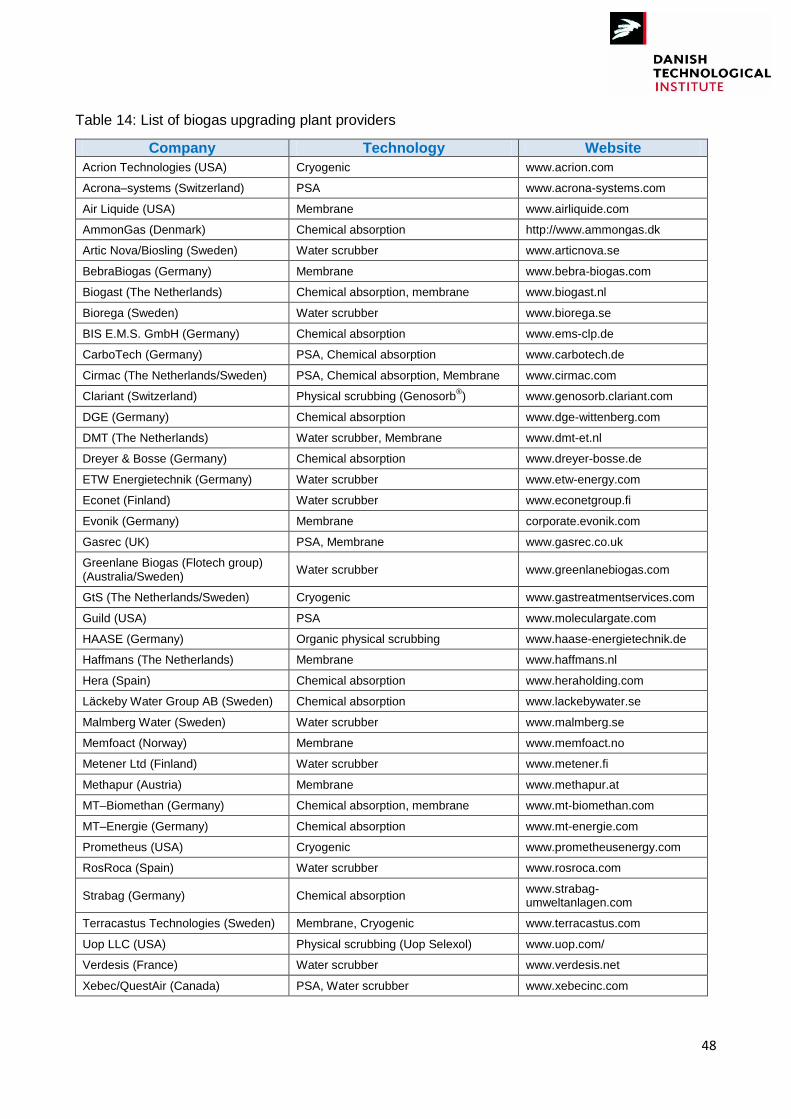
48
Table 14: List of biogas upgrading plant providers
Company Technology Website
Acrion Technologies (USA) Cryogenic www.acrion.com
Acrona–systems (Switzerland) PSA www.acrona-systems.com
Air Liquide (USA) Membrane www.airliquide.com
AmmonGas (Denmark) Chemical absorption http://www.ammongas.dk
Artic Nova/Biosling (Sweden) Water scrubber www.articnova.se
BebraBiogas (Germany) Membrane www.bebra-biogas.com
Biogast (The Netherlands) Chemical absorption, membrane www.biogast.nl
Biorega (Sweden) Water scrubber www.biorega.se
BIS E.M.S. GmbH (Germany) Chemical absorption www.ems-clp.de
CarboTech (Germany) PSA, Chemical absorption www.carbotech.de
Cirmac (The Netherlands/Sweden) PSA, Chemical absorption, Membrane www.cirmac.com
Clariant (Switzerland) Physical scrubbing (Genosorb®) www.genosorb.clariant.com
DGE (Germany) Chemical absorption www.dge-wittenberg.com
DMT (The Netherlands) Water scrubber, Membrane www.dmt-et.nl
Dreyer & Bosse (Germany) Chemical absorption www.dreyer-bosse.de
ETW Energietechnik (Germany) Water scrubber www.etw-energy.com
Econet (Finland) Water scrubber www.econetgroup.fi
Evonik (Germany) Membrane corporate.evonik.com
Gasrec (UK) PSA, Membrane www.gasrec.co.uk
Greenlane Biogas (Flotech group) (Australia/Sweden)
Water scrubber www.greenlanebiogas.com
GtS (The Netherlands/Sweden) Cryogenic www.gastreatmentservices.com
Guild (USA) PSA www.moleculargate.com
HAASE (Germany) Organic physical scrubbing www.haase-energietechnik.de
Haffmans (The Netherlands) Membrane www.haffmans.nl
Hera (Spain) Chemical absorption www.heraholding.com
Läckeby Water Group AB (Sweden) Chemical absorption www.lackebywater.se
Malmberg Water (Sweden) Water scrubber www.malmberg.se
Memfoact (Norway) Membrane www.memfoact.no
Metener Ltd (Finland) Water scrubber www.metener.fi
Methapur (Austria) Membrane www.methapur.at
MT–Biomethan (Germany) Chemical absorption, membrane www.mt-biomethan.com
MT–Energie (Germany) Chemical absorption www.mt-energie.com
Prometheus (USA) Cryogenic www.prometheusenergy.com
RosRoca (Spain) Water scrubber www.rosroca.com
Strabag (Germany) Chemical absorption www.strabag-umweltanlagen.com
Terracastus Technologies (Sweden) Membrane, Cryogenic www.terracastus.com
Uop LLC (USA) Physical scrubbing (Uop Selexol) www.uop.com/
Verdesis (France) Water scrubber www.verdesis.net
Xebec/QuestAir (Canada) PSA, Water scrubber www.xebecinc.com

49
6 Biogas cleaning methods
Apart from methane and carbon dioxide, biogas can also contain water, hydrogen sulfide, oxygen,
nitrogen, ammonia, siloxanes, and particles. As it has been explain in Chapter 4, different
equipment has different tolerance to these substances and depending on the biogas application
they have to be removed in higher or lower grade from the biogas. In those upgrading technologies
where carbon dioxide is separated from biogas, some of the other unwanted compounds are also
separated. However, to prevent corrosion and mechanical wear of the upgrading equipment itself,
it can be advantageous to clean the gas before upgrading.
6.1 Hydrogen sulfide removal
Hydrogen sulfide (H2S) is always present in biogas, normally at concentrations between 80 – 4,000
ppmv depending on the feedstock. The primary mechanism for production of this compound is the
reduction of sulfur-containing proteins under anaerobic conditions by sulfate-reduction
microorganisms (Trogisch, 2004). Inorganic sulfur, particularly sulfates, can also be biochemically
converted producing considerable H2S.
Hydrogen sulfide is corrosive to most equipment (pipelines, compressors, gas storage tanks,
engines, etc.) and acts as strong poison for fuel cells and reformer catalysts. Furthermore, H2S
combustion leads to sulfur dioxide emissions, which have harmful environmental effects. Due to
the potential problems that hydrogen sulfide can cause, it is recommended to remove it early in the
process of biogas upgrading. The level at which gas quality specifications are exceeded and sulfur
abatement is required varies by application, equipment and vendor. The following table outlines the
typical tolerance of H2S levels for different biogas utilization equipment.
Table 15: Biogas Utilization Technologies and H2S requirements (Wellinger, 2000; Trogisch, 2004)
Technology H2S tolerance (ppm)
Heating (Boilers) and Stirling
Engines
< 1,000
Kitchen stoves < 10
Internal Combustion Engines < 500 ppm (depends on the kind of engine; it
can be < 50 ppm)
Turbines < 10,000
Micro-turbines
< 70,000
Fuel Cells :
PEM PAFC MCFC SOFC
< 1 < 20
< 10 in fuel (<0.1 – 0.5 at the anode) < 1
Natural Gas Upgrade < 4 (variations among countries in Table 9 )
A large number of technologies exist to remove H2S from gas streams. These techniques can be
evaluated for their suitability with biogas systems. Selecting the best one depends on the gas final
use, the composition, variability and volume of the gas to be treated, the concentration of H2S
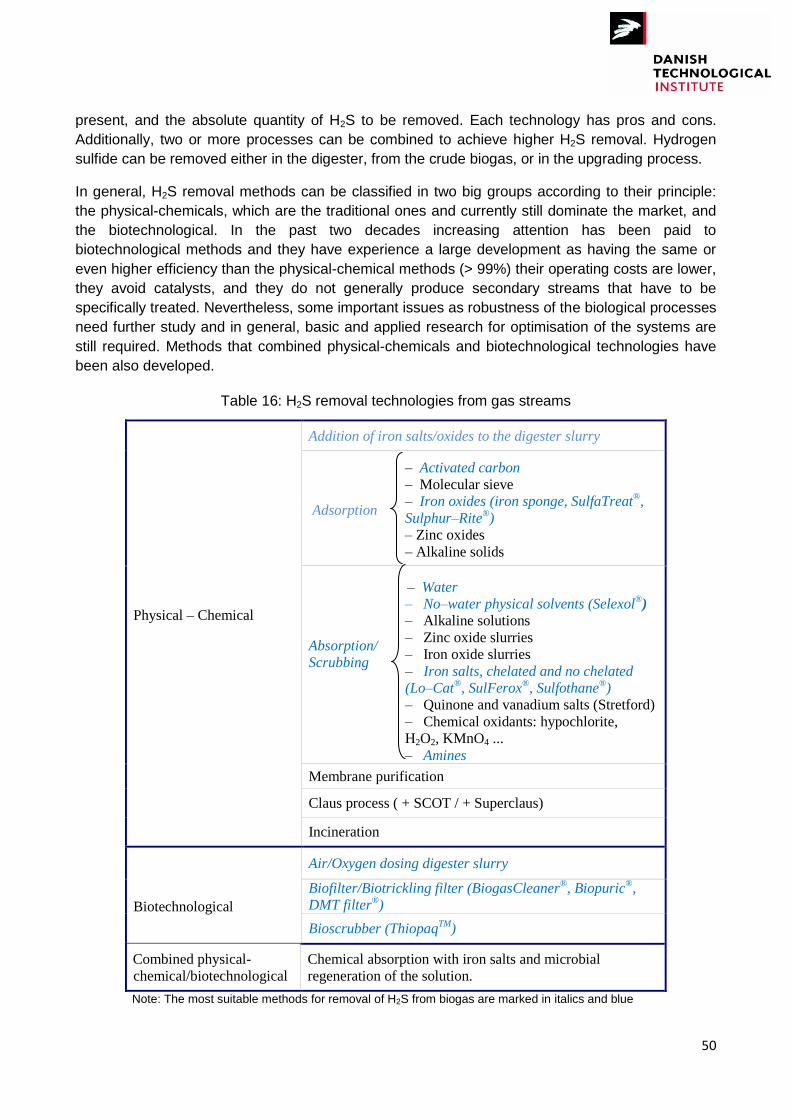
50
present, and the absolute quantity of H2S to be removed. Each technology has pros and cons.
Additionally, two or more processes can be combined to achieve higher H2S removal. Hydrogen
sulfide can be removed either in the digester, from the crude biogas, or in the upgrading process.
In general, H2S removal methods can be classified in two big groups according to their principle:
the physical-chemicals, which are the traditional ones and currently still dominate the market, and
the biotechnological. In the past two decades increasing attention has been paid to
biotechnological methods and they have experience a large development as having the same or
even higher efficiency than the physical-chemical methods (> 99%) their operating costs are lower,
they avoid catalysts, and they do not generally produce secondary streams that have to be
specifically treated. Nevertheless, some important issues as robustness of the biological processes
need further study and in general, basic and applied research for optimisation of the systems are
still required. Methods that combined physical-chemicals and biotechnological technologies have
been also developed.
Table 16: H2S removal technologies from gas streams
Physical – Chemical
Addition of iron salts/oxides to the digester slurry
Adsorption
– Activated carbon
– Molecular sieve
– Iron oxides (iron sponge, SulfaTreat®,
Sulphur–Rite®)
– Zinc oxides
– Alkaline solids
Absorption/
Scrubbing
– Water
– No–water physical solvents (Selexol®)
– Alkaline solutions
– Zinc oxide slurries
– Iron oxide slurries
– Iron salts, chelated and no chelated
(Lo–Cat®, SulFerox
®, Sulfothane
®)
– Quinone and vanadium salts (Stretford)
– Chemical oxidants: hypochlorite,
H2O2, KMnO4 ...
– Amines
Membrane purification
Claus process ( + SCOT / + Superclaus)
Incineration
Biotechnological
Air/Oxygen dosing digester slurry
Biofilter/Biotrickling filter (BiogasCleaner®, Biopuric
®,
DMT filter®)
Bioscrubber (ThiopaqTM
)
Combined physical-
chemical/biotechnological
Chemical absorption with iron salts and microbial
regeneration of the solution.
Note: The most suitable methods for removal of H2S from biogas are marked in italics and blue
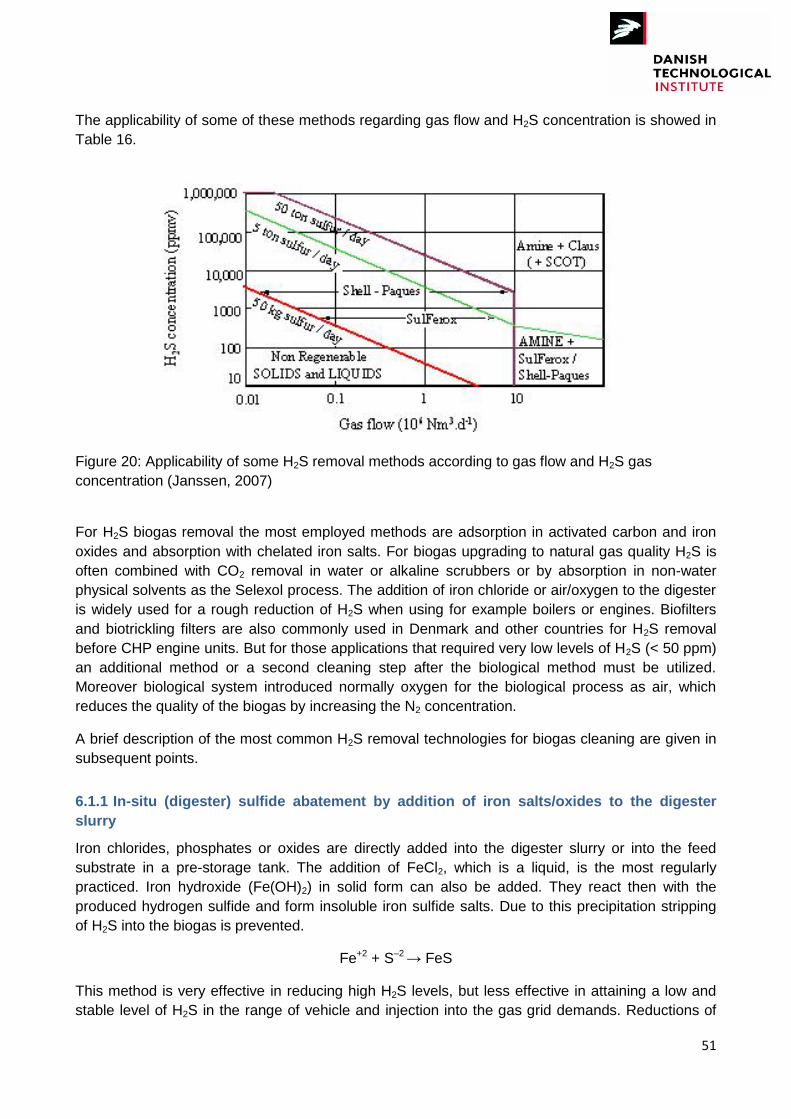
51
The applicability of some of these methods regarding gas flow and H2S concentration is showed in
Table 16.
Figure 20: Applicability of some H2S removal methods according to gas flow and H2S gas
concentration (Janssen, 2007)
For H2S biogas removal the most employed methods are adsorption in activated carbon and iron
oxides and absorption with chelated iron salts. For biogas upgrading to natural gas quality H2S is
often combined with CO2 removal in water or alkaline scrubbers or by absorption in non-water
physical solvents as the Selexol process. The addition of iron chloride or air/oxygen to the digester
is widely used for a rough reduction of H2S when using for example boilers or engines. Biofilters
and biotrickling filters are also commonly used in Denmark and other countries for H2S removal
before CHP engine units. But for those applications that required very low levels of H2S (< 50 ppm)
an additional method or a second cleaning step after the biological method must be utilized.
Moreover biological system introduced normally oxygen for the biological process as air, which
reduces the quality of the biogas by increasing the N2 concentration.
A brief description of the most common H2S removal technologies for biogas cleaning are given in
subsequent points.
6.1.1 In-situ (digester) sulfide abatement by addition of iron salts/oxides to the digester
slurry
Iron chlorides, phosphates or oxides are directly added into the digester slurry or into the feed
substrate in a pre-storage tank. The addition of FeCl2, which is a liquid, is the most regularly
practiced. Iron hydroxide (Fe(OH)2) in solid form can also be added. They react then with the
produced hydrogen sulfide and form insoluble iron sulfide salts. Due to this precipitation stripping
of H2S into the biogas is prevented.
Fe+2 + S–2 → FeS
This method is very effective in reducing high H2S levels, but less effective in attaining a low and
stable level of H2S in the range of vehicle and injection into the gas grid demands. Reductions of
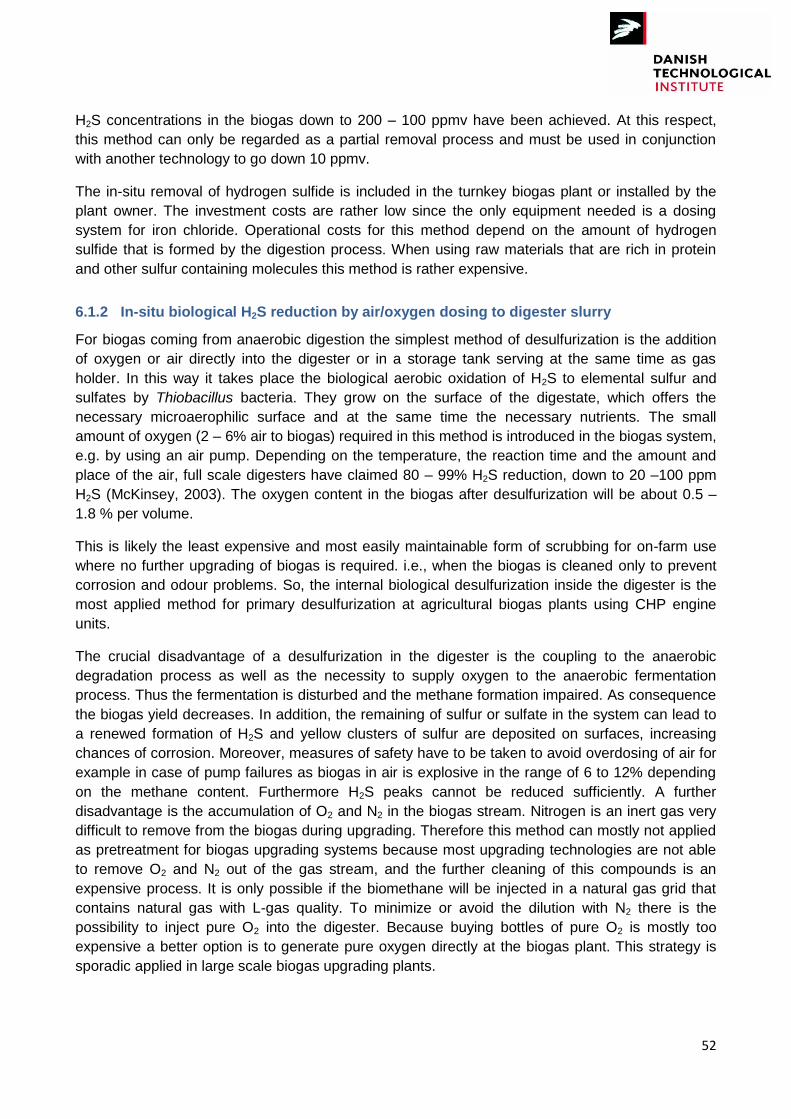
52
H2S concentrations in the biogas down to 200 – 100 ppmv have been achieved. At this respect,
this method can only be regarded as a partial removal process and must be used in conjunction
with another technology to go down 10 ppmv.
The in-situ removal of hydrogen sulfide is included in the turnkey biogas plant or installed by the
plant owner. The investment costs are rather low since the only equipment needed is a dosing
system for iron chloride. Operational costs for this method depend on the amount of hydrogen
sulfide that is formed by the digestion process. When using raw materials that are rich in protein
and other sulfur containing molecules this method is rather expensive.
6.1.2 In-situ biological H2S reduction by air/oxygen dosing to digester slurry
For biogas coming from anaerobic digestion the simplest method of desulfurization is the addition
of oxygen or air directly into the digester or in a storage tank serving at the same time as gas
holder. In this way it takes place the biological aerobic oxidation of H2S to elemental sulfur and
sulfates by Thiobacillus bacteria. They grow on the surface of the digestate, which offers the
necessary microaerophilic surface and at the same time the necessary nutrients. The small
amount of oxygen (2 – 6% air to biogas) required in this method is introduced in the biogas system,
e.g. by using an air pump. Depending on the temperature, the reaction time and the amount and
place of the air, full scale digesters have claimed 80 – 99% H2S reduction, down to 20 –100 ppm
H2S (McKinsey, 2003). The oxygen content in the biogas after desulfurization will be about 0.5 –
1.8 % per volume.
This is likely the least expensive and most easily maintainable form of scrubbing for on-farm use
where no further upgrading of biogas is required. i.e., when the biogas is cleaned only to prevent
corrosion and odour problems. So, the internal biological desulfurization inside the digester is the
most applied method for primary desulfurization at agricultural biogas plants using CHP engine
units.
The crucial disadvantage of a desulfurization in the digester is the coupling to the anaerobic
degradation process as well as the necessity to supply oxygen to the anaerobic fermentation
process. Thus the fermentation is disturbed and the methane formation impaired. As consequence
the biogas yield decreases. In addition, the remaining of sulfur or sulfate in the system can lead to
a renewed formation of H2S and yellow clusters of sulfur are deposited on surfaces, increasing
chances of corrosion. Moreover, measures of safety have to be taken to avoid overdosing of air for
example in case of pump failures as biogas in air is explosive in the range of 6 to 12% depending
on the methane content. Furthermore H2S peaks cannot be reduced sufficiently. A further
disadvantage is the accumulation of O2 and N2 in the biogas stream. Nitrogen is an inert gas very
difficult to remove from the biogas during upgrading. Therefore this method can mostly not applied
as pretreatment for biogas upgrading systems because most upgrading technologies are not able
to remove O2 and N2 out of the gas stream, and the further cleaning of this compounds is an
expensive process. It is only possible if the biomethane will be injected in a natural gas grid that
contains natural gas with L-gas quality. To minimize or avoid the dilution with N2 there is the
possibility to inject pure O2 into the digester. Because buying bottles of pure O2 is mostly too
expensive a better option is to generate pure oxygen directly at the biogas plant. This strategy is
sporadic applied in large scale biogas upgrading plants.
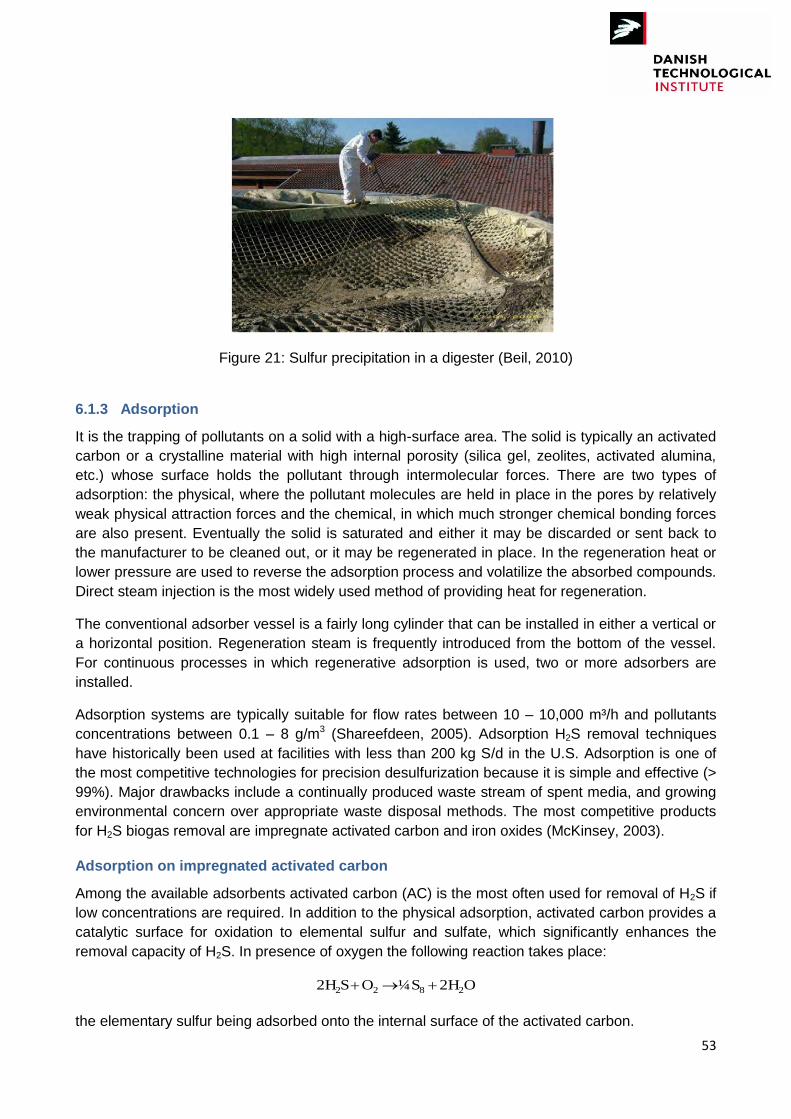
53
Figure 21: Sulfur precipitation in a digester (Beil, 2010)
6.1.3 Adsorption
It is the trapping of pollutants on a solid with a high-surface area. The solid is typically an activated
carbon or a crystalline material with high internal porosity (silica gel, zeolites, activated alumina,
etc.) whose surface holds the pollutant through intermolecular forces. There are two types of
adsorption: the physical, where the pollutant molecules are held in place in the pores by relatively
weak physical attraction forces and the chemical, in which much stronger chemical bonding forces
are also present. Eventually the solid is saturated and either it may be discarded or sent back to
the manufacturer to be cleaned out, or it may be regenerated in place. In the regeneration heat or
lower pressure are used to reverse the adsorption process and volatilize the absorbed compounds.
Direct steam injection is the most widely used method of providing heat for regeneration.
The conventional adsorber vessel is a fairly long cylinder that can be installed in either a vertical or
a horizontal position. Regeneration steam is frequently introduced from the bottom of the vessel.
For continuous processes in which regenerative adsorption is used, two or more adsorbers are
installed.
Adsorption systems are typically suitable for flow rates between 10 – 10,000 m³/h and pollutants
concentrations between 0.1 – 8 g/m3 (Shareefdeen, 2005). Adsorption H2S removal techniques
have historically been used at facilities with less than 200 kg S/d in the U.S. Adsorption is one of
the most competitive technologies for precision desulfurization because it is simple and effective (>
99%). Major drawbacks include a continually produced waste stream of spent media, and growing
environmental concern over appropriate waste disposal methods. The most competitive products
for H2S biogas removal are impregnate activated carbon and iron oxides (McKinsey, 2003).
Adsorption on impregnated activated carbon
Among the available adsorbents activated carbon (AC) is the most often used for removal of H2S if
low concentrations are required. In addition to the physical adsorption, activated carbon provides a
catalytic surface for oxidation to elemental sulfur and sulfate, which significantly enhances the
removal capacity of H2S. In presence of oxygen the following reaction takes place:
O2H S ¼ O S2H 2822
the elementary sulfur being adsorbed onto the internal surface of the activated carbon.
54
The AC must have 20 – 30% of moisture content and the required volume of oxygen. In large
biogas plants air is injected into the gas stream but for small scale, regular removal of AC and
exposure to ambient air suffices. The reaction works best at pressures of 7 to 8 bar and
temperatures of 50 to 70 °C. The gas temperature is easy to achieve through the heat formed
during compression. Usually, the carbon filling is adjusted to an operation time of 4,000 to 8,000
hours. If the gas has high levels of H2S (> 3,000 ppmv) regeneration is periodically required
(Wellinger, 2000).
Impregnation of AC to optimize H2S abatement with chemical adsorption is normally done using
alkaline or oxide coatings. Besides of potassium iodine, sodium hydroxide, sodium carbonate,
potassium hydroxide, and metal oxides are the most common coatings employed. Impregnated
products enhance H2S removal capacity from a normal 10 – 20 kg H2S/m3 carbon for virgin carbon
to 120 – 140 kg H2S/m3 carbon. Drawbacks of impregnated carbons are that the spent carbon
must either be landfilled or re-impregnated with costly, hazardous chemicals and that they are
highly susceptible to exothermic reactions and notorious for causing bed fires if careless operation
(Zappa, 2001).
Dust and water from biogas must be normally removed before the AC system.
Distributors of impregnated activated carbon include: Calgon Carbon Corporation (FCA,
Sulfusorb), US Filter–Westates Carbon, Carmeron Carbon, etc.
Adsorption on molecular sieve
Molecular sieves (zeolites) are excellent products to separate different compounds in gas streams.
The selectivity of adsorption is achieved by different mesh sizes and/or application of different gas
pressures. Polar compounds, such as water, H2S, SO2, NH3, carbonyl sulfide, and mercaptans, are
very strongly adsorbed and can be removed from such non-polar systems as methane.
Both activated carbons and hydrophobic molecular sieves present advantages and drawbacks.
The former are rather cheap materials, readily available from many companies. Moreover, they
have high initial adsorption capacities. On the other hand, the latter, despite their limited initial
capacity, are thermally and chemically very stable products and generally do not lead to side
reactions. Their relatively high cost prevents their extensive use for the moment.
Adsorption using iron oxides
As one of the oldest methods still in practice, iron oxides remove hydrogen sulfide by forming
insoluble iron sulfides. It is possible to extend bed life by admitting air, thereby forming elemental
sulfur and regenerating the iron oxide. This regeneration process is highly exothermic.
Purification: OH FeS SH FeO 22
OH 3 SFe SH 3 OFe 2322 32
Regeneration: S + FeO O ½ + FeS 2
S 3 OFe /2O3 SFe 32232
55
Regeneration is possible for a limited number of times (until the surface is covered with natural
sulfur), after which the tower filling has to be renewed. If using one column systems the
regeneration can be applied by injecting 1 – 5% air into the reaction column but loading is limited
when compared to a two-column system. In a two-stage system the raw biogas streams through
the first column and iron sulfide is generated. In parallel in the second column air is injected and
the regeneration takes place.
The purification step is optimal between 25 and 50 °C and since the reaction with iron oxide needs
water the gas stream should not be too dry. However, condensation should be avoided because
the iron oxide material (pellets, grains, etc.) will stick together with water reducing the reactive
surface (Wellinger, 2000).
The iron oxide removal technology is simple and effective (up to 99.98%). H2S output
concentrations < 1 ppm (related to 1,000 ppm H2S in the raw gas stream) are possible. Its general
drawbacks are that the process is highly chemical intensive, the operating cost can be high, and a
continuous stream of spend waste material is accumulated. Moreover, it is difficult to automate the
regeneration and/or removal phase and this can be troublesome if the heat from the regeneration
is not dissipated properly.
Typical iron oxide media are iron oxide wood chips (iron sponge) and iron oxide pellets. Recently,
proprietary iron-oxide media such as SulfaTreat, Sulphur–Rite, SOXSIA and Sulfa–Bind have
been offered as improved alternatives.
Iron Sponge
Iron-oxide-impregnated wood chips are the most well-known iron oxide product. The primary active
ingredients are hydrated iron-oxides (Fe2O3). Iron oxide or hydroxide can also be bound to the
surface of pellets made from red mud (a waste product from aluminum production). These pellets
have a higher surface-to-volume ratio than impregnated wood chips, though their density is much
higher than that of wood chips. At high H2S concentrations (1,000 to 4,000 ppm), 100 grams of
pellets can bind 50 grams of sulfide. However, the pellets are likely to be more expensive than
wood chips (Krich, 2005).
Iron sponge is a mature technology so there are design parameter guidelines that have been
determined for optimum operation. For example, 40% moisture content ±15% is necessary to
maintain activity, down-flow gas is recommended for maintaining bed gas moisture, temperature
should be kept between 18 and 46 C, 140 kPa is the minimum pressure recommended for
consistent operation, residence time should be greater than 60 seconds, etc. (McKinsey, 2003).
The application of wood chips for biogas cleaning is very popular particularly in USA (Wellinger,
2000). Different scales of operation have been employed ranging from gas flow rates of 2,500 m3
CH4/h, e.g. Avenue Coking Works, down to much smaller scale plants 100 m3 CH4/h, e.g. SCA
paper recycling plant in Lucca, Italy and Camelshead Waste Water Treatment Works in Plymouth,
UK (Environment–Agency, 2004).
Commercial sources for iron sponge include for example Connelly GPM, Inc., of Chicago, IL,
Physichem Technologies, Inc., of Welder.
Perhaps the most important drawback of this kind of iron oxide media, which have led to
decreased usage in recent years, is that the safe disposal of spent iron sponge has become
56
problematic, and in some instances, spent media may be considered hazardous waste and
requires special disposal procedures. Additionally, the regenerative reaction is highly exothermic
and can, if airflow and temperature are not carefully controlled, result in self–ignition of the wood
chips. Thus some operations, in particular those performed on a small scale or that have low levels
of H2S, elect not to regenerate the iron sponge on-site. Precautions must be also taken during
removal of spent material to prevent fires.
Proprietary formulations of iron oxide as Sulphur–Rite® and SulfaTreat® products address this
problem by using an inert ceramic base. Initial costs of Sulphur–Rite® and SulfaTreat® products are
higher than iron sponge products, but those costs are at least partially offset by easier change-out
procedures and transportation and disposal costs. Other proprietary formulations are Sulfa-Bind®
and Soxsia®.
SulfaTreat®
SulfaTreat® is a proprietary sulfur scavenger, consisting mainly of Fe2O3 or Fe3O4 compounds
coated onto a proprietary granulated support commercialized by M-I SWACO. SulfaTreat® is used
similarly to iron sponge in a low-pressure vessel with down-flow of gas and is effective with partially
or fully hydrated gas streams.
Conversion efficiency in commercial systems is in the range of 0.55 – 0.72 kg H2S/kg iron oxide,
which is similar to, or slightly higher than, values reported for batch operation of iron sponge (Kohl,
1997).
Multiple benefits over iron sponge are claimed due to uniform structure and free-flowing nature.
SulfaTreat® is reported to be easier to handle than iron sponge, thus reducing operating costs,
labor for change-out, and pressure drops in the bed. Also, SulfaTreat® claims to be non-pyrophoric
when exposed to air and thus does not mean a safety hazard during change-out. Buffering of pH
and addition of moisture are not necessary as long as the inlet gas is saturated.
SulfaTreat® is non-regenerable, and similar to iron sponge the spent product can be problematic or
expensive to dispose of properly. The manufacturer has suggested that spent product may be
used as a soil amendment or as a raw material in road or brick making, but they state that every
customer must devise a spent-product disposal plan in accordance with local and state regulations.
Sulphur-Rite®
Sulphur-Rite® is an iron-oxide product offered by GTP-Merichem. Sulphur-Rite® is unique in their
claim that insoluble iron pyrite is the final end product. Sulphur-Rite® systems come in
prepackaged cylindrical units that are recommended for installations with less than 180 kg/d with
pre-engineered units handling gas flow rates up to 4,300 m3/h (i.e. H2S gas concentrations < 1,765
mg/m3). Sulphur-Rite® costs approximately the same than SulfaTreat®. Around 8.5 kg of
SulfaTreat® or Sulphur-Rite® remove 1 kg of H2S. Company literature claims spent product is non-
pyrophoric and landfillable and has 3 – 5 times the effectiveness of iron sponge (Environment–
Agency, 2004).
SOXSIA®
SOXSIA® (Sulfur Oxidation and Siloxanes Adsorption) is a catalyst developed by Gastreatment
Services B.V. that absorbs siloxanes and removes H2S from the raw gas. Up to 2,000 ppm of H2S
57
can be removed from the gas at 40 °C, atmospheric pressure and with a capacity of 1,000 Nm3
raw gas/h (Petersson and Wellinger, 2009).
6.1.4 Absorption/Scrubbing
In physical absorption H2S is removed by absorption in water or other solvents such as methanol
and ethers of polyethylene glycol. In chemical absorption the water solubility of the H2S is
enhanced by making the water alkaline or by its oxidation to more water-soluble compounds.
If liquid regeneration is possible usually regeneration columns are operated in conjunction with the
absorber to facilitate continuous processing. The stripper gas of the regeneration unit contains the
displaced H2S if it has not been converted to elemental sulfur.
The primary disadvantage of the absorption is that usually eliminates a problem with a
contaminated gas stream only to create a contaminated liquid stream or a more concentrate gas
liquid stream (if regeneration) that must be further treated. Other disadvantages are high initial
investment costs as well as high consumption of water and/or chemicals. Advantages are high
efficiency removal (up to 99%), small footprint and ability to handle a wide range of pollutant
concentrations. Absorption systems are suitable for flow rate approximately between 100 – 10,000
m³/h and pollutant concentrations between 8 – 30 g/m³.
Traditionally absorption processes as amine are not feasible for low-flow and low-pressure
applications, typical conditions of small biogas plants, due to increased cost of operating at high
pressure, high energy requirements for recirculation pumps and regeneration vessels, or higher
media costs. Nevertheless some of them like the iron-chelated process are viable with small
biogas systems (McKinsey, 2003). For large scale biogas plants these methods become
economically more feasible. A description of the most common H2S removal absorption methods
that are used for biogas cleaning is given in the next paragraphs. Physical absorption by water
scrubbing and no water solvents as polyethylene glycol have already been described in the
upgrading technologies chapter (Chapter 5) as the principle is the same that for CO2 removal.
Costs associated with selective removal of H2S using these kinds of absorption are not competitive
with other methods for selective removal of H2S. Thus, they would only be considered for
simultaneous removal of CO2 and H2S. Nevertheless, previous rough desulfurization is
recommended (Chapter 5.2 and 5.3).
Caustic scrubbing
One of the oldest methods of H2S removal involves sodium hydroxide (NaOH) washing. Absorption
of H2S is favored by highly alkaline conditions. The NaOH reacts with the H2S to form sodium
sulfide or sodium hydrogen sulfide. This chemical reaction enhanced the water absorption capacity
resulting in lower volumes of process water and reducing pumping demands. The formed salts are
insoluble and the method is no regenerative. To prevent salt precipitation in the scrubber, purge
stream (spent caustic) must be withdrawn from the unit on regular basis. The NaOH also absorbs
CO2, so this is a technology for simultaneous CO2 and H2S removal. Nevertheless because of the
high technical requirement to deal with the caustic solution, this application is hardly applied
anymore except when very large gas volumes are treated or high concentrations of H2S are
present. Moreover, large volumes of water contaminated with sodium sulfide need to be disposed.
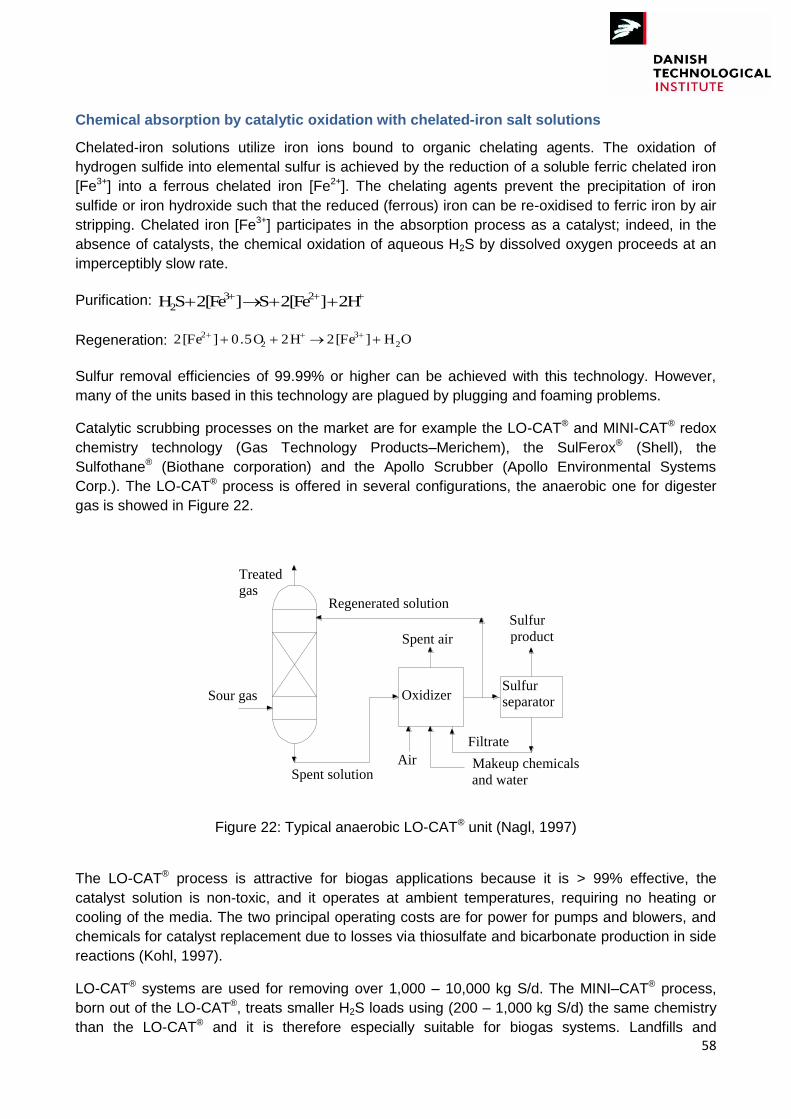
58
Chemical absorption by catalytic oxidation with chelated-iron salt solutions
Chelated-iron solutions utilize iron ions bound to organic chelating agents. The oxidation of
hydrogen sulfide into elemental sulfur is achieved by the reduction of a soluble ferric chelated iron
[Fe3+] into a ferrous chelated iron [Fe2+]. The chelating agents prevent the precipitation of iron
sulfide or iron hydroxide such that the reduced (ferrous) iron can be re-oxidised to ferric iron by air
stripping. Chelated iron [Fe3+] participates in the absorption process as a catalyst; indeed, in the
absence of catalysts, the chemical oxidation of aqueous H2S by dissolved oxygen proceeds at an
imperceptibly slow rate.
Purification: 2H ]2[Fe S ]2[Fe SH 232
Regeneration: OH ]2[Fe 2H 0.5O ]2[Fe 23
22
Sulfur removal efficiencies of 99.99% or higher can be achieved with this technology. However,
many of the units based in this technology are plagued by plugging and foaming problems.
Catalytic scrubbing processes on the market are for example the LO-CAT® and MINI-CAT® redox
chemistry technology (Gas Technology Products–Merichem), the SulFerox® (Shell), the
Sulfothane® (Biothane corporation) and the Apollo Scrubber (Apollo Environmental Systems
Corp.). The LO-CAT® process is offered in several configurations, the anaerobic one for digester
gas is showed in Figure 22.
Regenerated solution
Sour gas OxidizerSulfur separator
Sulfur
product
Filtrate
Makeup chemicals
and water
Air
Spent air
Spent solution
Treated gas
Figure 22: Typical anaerobic LO-CAT® unit (Nagl, 1997)
The LO-CAT® process is attractive for biogas applications because it is > 99% effective, the
catalyst solution is non-toxic, and it operates at ambient temperatures, requiring no heating or
cooling of the media. The two principal operating costs are for power for pumps and blowers, and
chemicals for catalyst replacement due to losses via thiosulfate and bicarbonate production in side
reactions (Kohl, 1997).
LO-CAT® systems are used for removing over 1,000 – 10,000 kg S/d. The MINI–CAT® process,
born out of the LO-CAT®, treats smaller H2S loads using (200 – 1,000 kg S/d) the same chemistry
than the LO-CAT® and it is therefore especially suitable for biogas systems. Landfills and
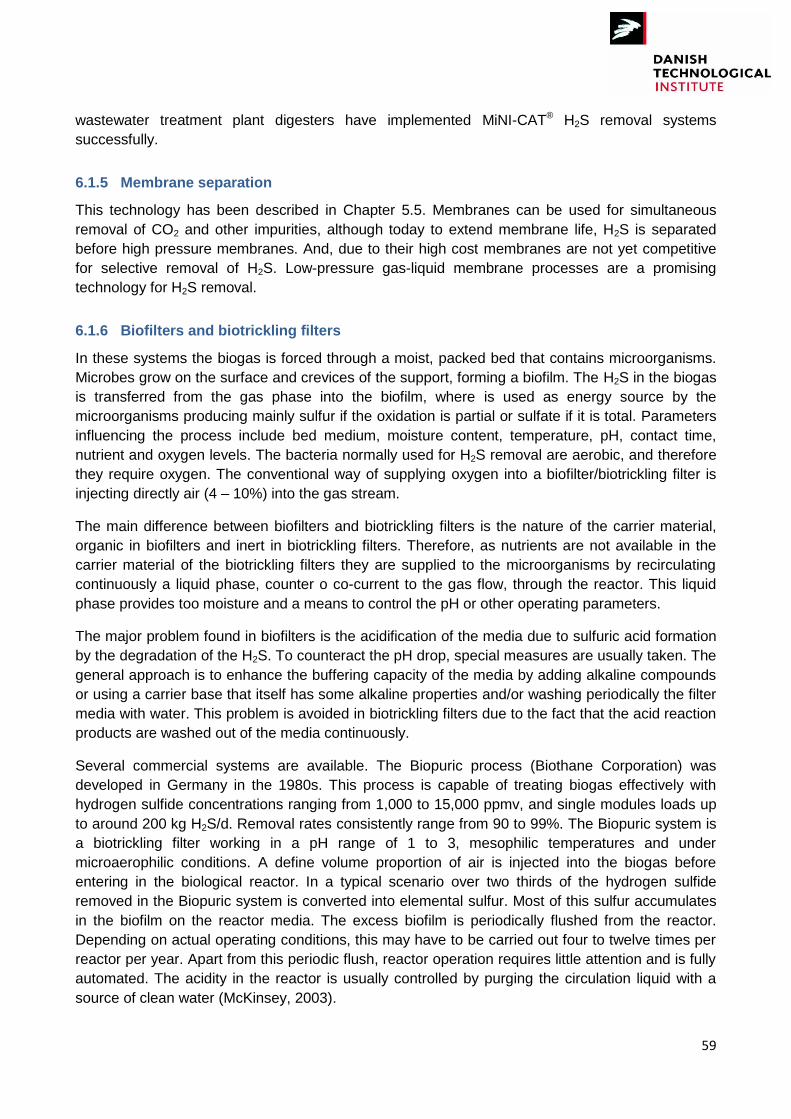
59
wastewater treatment plant digesters have implemented MiNI-CAT® H2S removal systems
successfully.
6.1.5 Membrane separation
This technology has been described in Chapter 5.5. Membranes can be used for simultaneous
removal of CO2 and other impurities, although today to extend membrane life, H2S is separated
before high pressure membranes. And, due to their high cost membranes are not yet competitive
for selective removal of H2S. Low-pressure gas-liquid membrane processes are a promising
technology for H2S removal.
6.1.6 Biofilters and biotrickling filters
In these systems the biogas is forced through a moist, packed bed that contains microorganisms.
Microbes grow on the surface and crevices of the support, forming a biofilm. The H2S in the biogas
is transferred from the gas phase into the biofilm, where is used as energy source by the
microorganisms producing mainly sulfur if the oxidation is partial or sulfate if it is total. Parameters
influencing the process include bed medium, moisture content, temperature, pH, contact time,
nutrient and oxygen levels. The bacteria normally used for H2S removal are aerobic, and therefore
they require oxygen. The conventional way of supplying oxygen into a biofilter/biotrickling filter is
injecting directly air (4 – 10%) into the gas stream.
The main difference between biofilters and biotrickling filters is the nature of the carrier material,
organic in biofilters and inert in biotrickling filters. Therefore, as nutrients are not available in the
carrier material of the biotrickling filters they are supplied to the microorganisms by recirculating
continuously a liquid phase, counter o co-current to the gas flow, through the reactor. This liquid
phase provides too moisture and a means to control the pH or other operating parameters.
The major problem found in biofilters is the acidification of the media due to sulfuric acid formation
by the degradation of the H2S. To counteract the pH drop, special measures are usually taken. The
general approach is to enhance the buffering capacity of the media by adding alkaline compounds
or using a carrier base that itself has some alkaline properties and/or washing periodically the filter
media with water. This problem is avoided in biotrickling filters due to the fact that the acid reaction
products are washed out of the media continuously.
Several commercial systems are available. The Biopuric process (Biothane Corporation) was
developed in Germany in the 1980s. This process is capable of treating biogas effectively with
hydrogen sulfide concentrations ranging from 1,000 to 15,000 ppmv, and single modules loads up
to around 200 kg H2S/d. Removal rates consistently range from 90 to 99%. The Biopuric system is
a biotrickling filter working in a pH range of 1 to 3, mesophilic temperatures and under
microaerophilic conditions. A define volume proportion of air is injected into the biogas before
entering in the biological reactor. In a typical scenario over two thirds of the hydrogen sulfide
removed in the Biopuric system is converted into elemental sulfur. Most of this sulfur accumulates
in the biofilm on the reactor media. The excess biofilm is periodically flushed from the reactor.
Depending on actual operating conditions, this may have to be carried out four to twelve times per
reactor per year. Apart from this periodic flush, reactor operation requires little attention and is fully
automated. The acidity in the reactor is usually controlled by purging the circulation liquid with a
source of clean water (McKinsey, 2003).
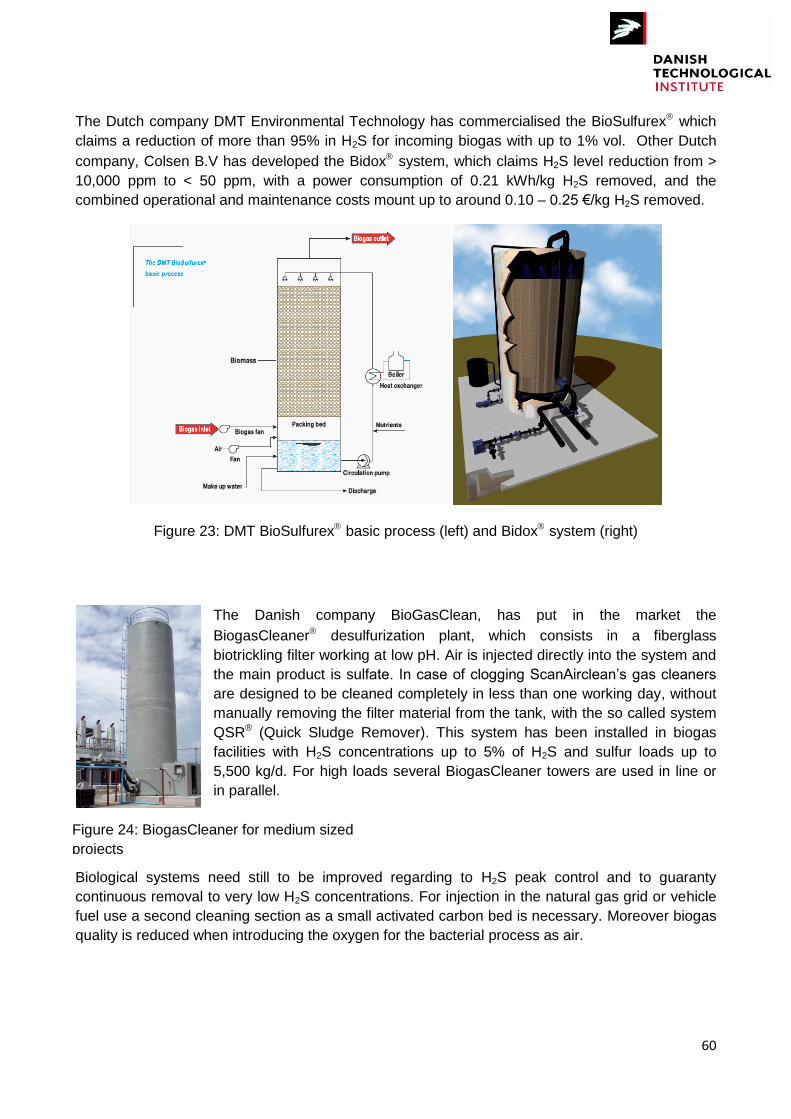
60
The Dutch company DMT Environmental Technology has commercialised the BioSulfurex which
claims a reduction of more than 95% in H2S for incoming biogas with up to 1% vol. Other Dutch
company, Colsen B.V has developed the Bidox system, which claims H2S level reduction from >
10,000 ppm to < 50 ppm, with a power consumption of 0.21 kWh/kg H2S removed, and the
combined operational and maintenance costs mount up to around 0.10 – 0.25 €/kg H2S removed.
Figure 23: DMT BioSulfurex basic process (left) and Bidox system (right)
The Danish company BioGasClean, has put in the market the
BiogasCleaner desulfurization plant, which consists in a fiberglass
biotrickling filter working at low pH. Air is injected directly into the system and
the main product is sulfate. In case of clogging ScanAirclean‟s gas cleaners
are designed to be cleaned completely in less than one working day, without
manually removing the filter material from the tank, with the so called system
QSR® (Quick Sludge Remover). This system has been installed in biogas
facilities with H2S concentrations up to 5% of H2S and sulfur loads up to
5,500 kg/d. For high loads several BiogasCleaner towers are used in line or
in parallel.
Biological systems need still to be improved regarding to H2S peak control and to guaranty
continuous removal to very low H2S concentrations. For injection in the natural gas grid or vehicle
fuel use a second cleaning section as a small activated carbon bed is necessary. Moreover biogas
quality is reduced when introducing the oxygen for the bacterial process as air.
Figure 24: BiogasCleaner for medium sized
projects
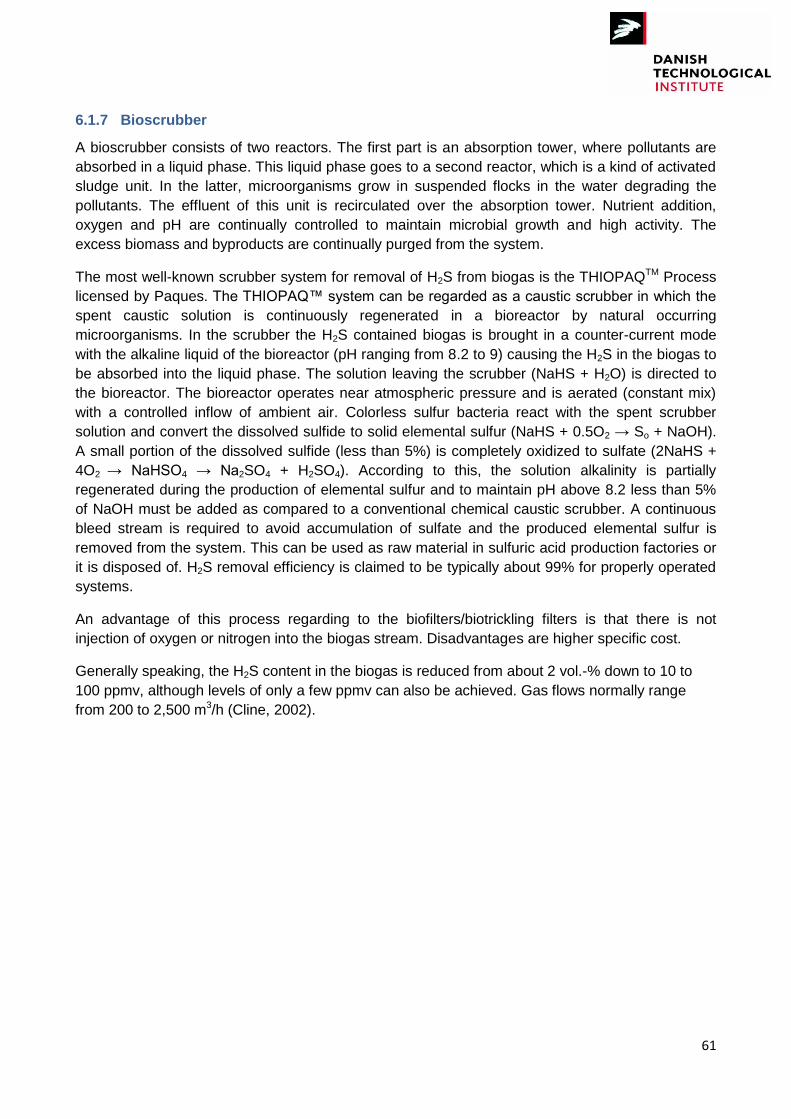
61
6.1.7 Bioscrubber
A bioscrubber consists of two reactors. The first part is an absorption tower, where pollutants are
absorbed in a liquid phase. This liquid phase goes to a second reactor, which is a kind of activated
sludge unit. In the latter, microorganisms grow in suspended flocks in the water degrading the
pollutants. The effluent of this unit is recirculated over the absorption tower. Nutrient addition,
oxygen and pH are continually controlled to maintain microbial growth and high activity. The
excess biomass and byproducts are continually purged from the system.
The most well-known scrubber system for removal of H2S from biogas is the THIOPAQTM Process
licensed by Paques. The THIOPAQ™ system can be regarded as a caustic scrubber in which the
spent caustic solution is continuously regenerated in a bioreactor by natural occurring
microorganisms. In the scrubber the H2S contained biogas is brought in a counter-current mode
with the alkaline liquid of the bioreactor (pH ranging from 8.2 to 9) causing the H2S in the biogas to
be absorbed into the liquid phase. The solution leaving the scrubber (NaHS + H2O) is directed to
the bioreactor. The bioreactor operates near atmospheric pressure and is aerated (constant mix)
with a controlled inflow of ambient air. Colorless sulfur bacteria react with the spent scrubber
solution and convert the dissolved sulfide to solid elemental sulfur (NaHS + 0.5O2 → So + NaOH).
A small portion of the dissolved sulfide (less than 5%) is completely oxidized to sulfate (2NaHS +
4O2 → NaHSO4 → Na2SO4 + H2SO4). According to this, the solution alkalinity is partially
regenerated during the production of elemental sulfur and to maintain pH above 8.2 less than 5%
of NaOH must be added as compared to a conventional chemical caustic scrubber. A continuous
bleed stream is required to avoid accumulation of sulfate and the produced elemental sulfur is
removed from the system. This can be used as raw material in sulfuric acid production factories or
it is disposed of. H2S removal efficiency is claimed to be typically about 99% for properly operated
systems.
An advantage of this process regarding to the biofilters/biotrickling filters is that there is not
injection of oxygen or nitrogen into the biogas stream. Disadvantages are higher specific cost.
Generally speaking, the H2S content in the biogas is reduced from about 2 vol.-% down to 10 to
100 ppmv, although levels of only a few ppmv can also be achieved. Gas flows normally range
from 200 to 2,500 m3/h (Cline, 2002).
62
Figure 25: Simplified THIOPAQ™ and Shell-Paques System Schematic (Greenhouse Gas
Technology Center, 2004) and picture of a THIOPAQ™ plant (Beil, 2010)
6.2 Water removal
Untreated or raw biogas is commonly saturated with water and the absolute water quantity
depends on the temperature. For example, at 35 °C the water content is approximately 5%
(Ryckebosch, 2011). Water vapor is problematic as it may condense into water or ice when
passing from high to lower pressure systems. This may result in corrosion and clogging.
Some upgrading processes require relatively dry gas, so drying is often necessary prior the
upgrading. Others, such as those that use water, add water vapor to non-saturated biogas.
Various biogas utilization systems have various water vapor tolerances. While not usually an issue
in boilers and CHP, water vapor can be highly problematic in grid injection or vehicle fuel
applications. Pipeline quality standards require a maximum water content of 100 mg/m3 water and
compressed natural gas vehicle fuel standards require a dew point of at least 10 °C below the 99%
winter design temperature for the local geographic area at atmospheric pressure (Ryckebosch,
2011). Maximum moisture content in biomethane for grid injection in different countries is given in
Table 9 of Chapter 4.3.1.
There are different methods to remove water from biogas. These are generally based on
separation of condensed water or chemical drying (absorption and adsorption).
6.2.1 Water condensation
The simplest way of removing excess water vapor is through refrigeration using heat exchangers.
This method can only lower the dewpoint to 0.5 °C due to problems with freezing on the surface of
the heat exchanger. To achieve lower dewpoints the gas has to be compressed before cooling and
the later expanded to the desired pressure. The lower the dew point, the higher pressure is needed
to be applied. The condensed water droplets are entrapped, removed and disposed of as
wastewater or recycled back to the digester.
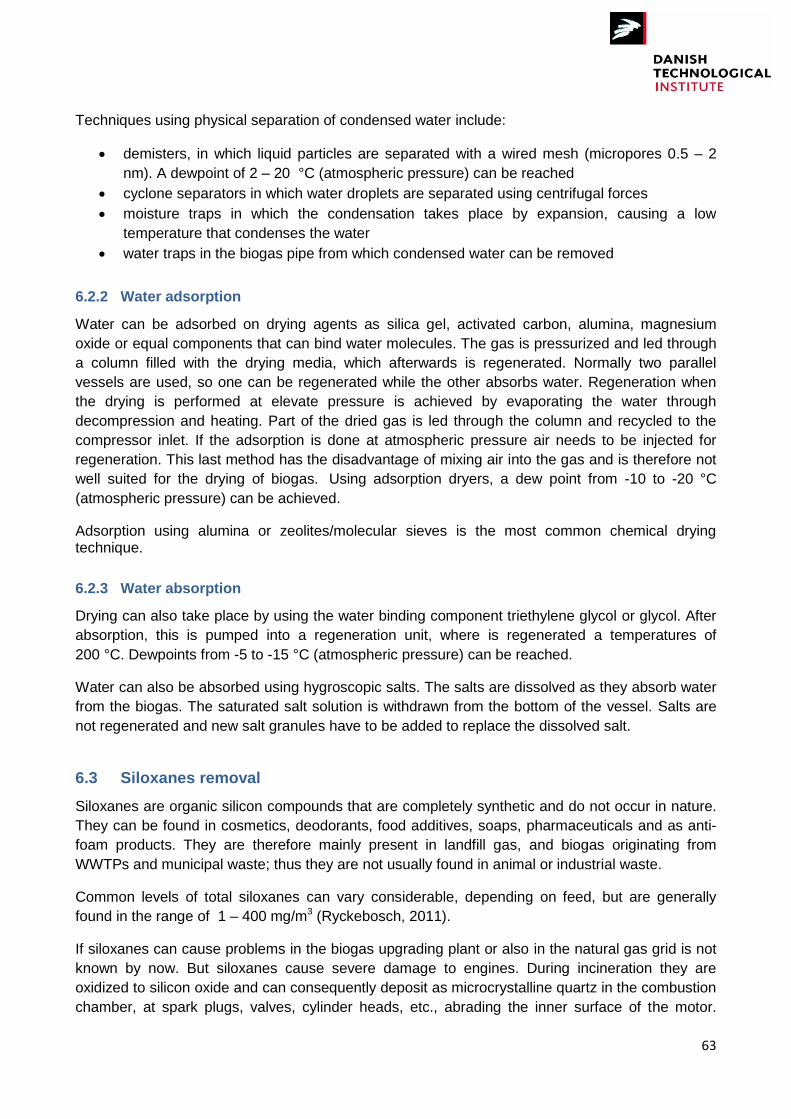
63
Techniques using physical separation of condensed water include:
demisters, in which liquid particles are separated with a wired mesh (micropores 0.5 – 2
nm). A dewpoint of 2 – 20 °C (atmospheric pressure) can be reached
cyclone separators in which water droplets are separated using centrifugal forces
moisture traps in which the condensation takes place by expansion, causing a low
temperature that condenses the water
water traps in the biogas pipe from which condensed water can be removed
6.2.2 Water adsorption
Water can be adsorbed on drying agents as silica gel, activated carbon, alumina, magnesium
oxide or equal components that can bind water molecules. The gas is pressurized and led through
a column filled with the drying media, which afterwards is regenerated. Normally two parallel
vessels are used, so one can be regenerated while the other absorbs water. Regeneration when
the drying is performed at elevate pressure is achieved by evaporating the water through
decompression and heating. Part of the dried gas is led through the column and recycled to the
compressor inlet. If the adsorption is done at atmospheric pressure air needs to be injected for
regeneration. This last method has the disadvantage of mixing air into the gas and is therefore not
well suited for the drying of biogas. Using adsorption dryers, a dew point from -10 to -20 °C
(atmospheric pressure) can be achieved.
Adsorption using alumina or zeolites/molecular sieves is the most common chemical drying technique.
6.2.3 Water absorption
Drying can also take place by using the water binding component triethylene glycol or glycol. After
absorption, this is pumped into a regeneration unit, where is regenerated a temperatures of
200 °C. Dewpoints from -5 to -15 °C (atmospheric pressure) can be reached.
Water can also be absorbed using hygroscopic salts. The salts are dissolved as they absorb water
from the biogas. The saturated salt solution is withdrawn from the bottom of the vessel. Salts are
not regenerated and new salt granules have to be added to replace the dissolved salt.
6.3 Siloxanes removal
Siloxanes are organic silicon compounds that are completely synthetic and do not occur in nature.
They can be found in cosmetics, deodorants, food additives, soaps, pharmaceuticals and as anti-
foam products. They are therefore mainly present in landfill gas, and biogas originating from
WWTPs and municipal waste; thus they are not usually found in animal or industrial waste.
Common levels of total siloxanes can vary considerable, depending on feed, but are generally
found in the range of 1 – 400 mg/m3 (Ryckebosch, 2011).
If siloxanes can cause problems in the biogas upgrading plant or also in the natural gas grid is not
known by now. But siloxanes cause severe damage to engines. During incineration they are
oxidized to silicon oxide and can consequently deposit as microcrystalline quartz in the combustion
chamber, at spark plugs, valves, cylinder heads, etc., abrading the inner surface of the motor.
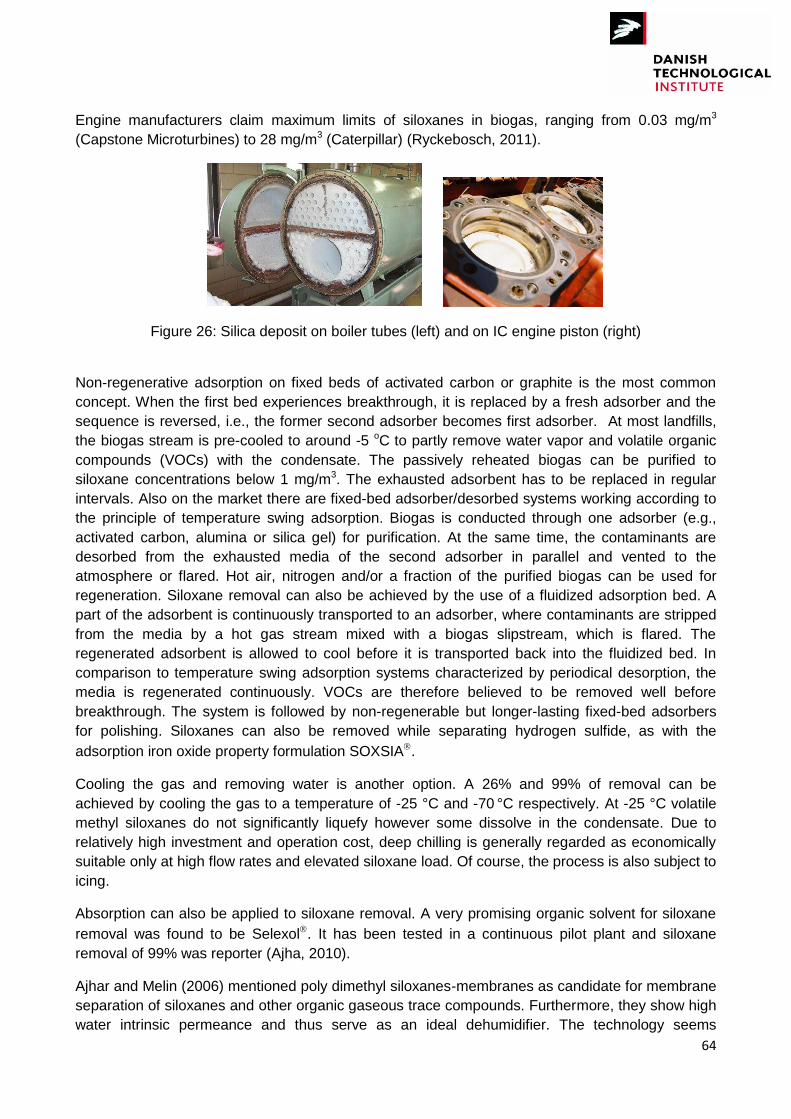
64
Engine manufacturers claim maximum limits of siloxanes in biogas, ranging from 0.03 mg/m3
(Capstone Microturbines) to 28 mg/m3 (Caterpillar) (Ryckebosch, 2011).
Figure 26: Silica deposit on boiler tubes (left) and on IC engine piston (right)
Non-regenerative adsorption on fixed beds of activated carbon or graphite is the most common
concept. When the first bed experiences breakthrough, it is replaced by a fresh adsorber and the
sequence is reversed, i.e., the former second adsorber becomes first adsorber. At most landfills,
the biogas stream is pre-cooled to around -5 oC to partly remove water vapor and volatile organic
compounds (VOCs) with the condensate. The passively reheated biogas can be purified to
siloxane concentrations below 1 mg/m3. The exhausted adsorbent has to be replaced in regular
intervals. Also on the market there are fixed-bed adsorber/desorbed systems working according to
the principle of temperature swing adsorption. Biogas is conducted through one adsorber (e.g.,
activated carbon, alumina or silica gel) for purification. At the same time, the contaminants are
desorbed from the exhausted media of the second adsorber in parallel and vented to the
atmosphere or flared. Hot air, nitrogen and/or a fraction of the purified biogas can be used for
regeneration. Siloxane removal can also be achieved by the use of a fluidized adsorption bed. A
part of the adsorbent is continuously transported to an adsorber, where contaminants are stripped
from the media by a hot gas stream mixed with a biogas slipstream, which is flared. The
regenerated adsorbent is allowed to cool before it is transported back into the fluidized bed. In
comparison to temperature swing adsorption systems characterized by periodical desorption, the
media is regenerated continuously. VOCs are therefore believed to be removed well before
breakthrough. The system is followed by non-regenerable but longer-lasting fixed-bed adsorbers
for polishing. Siloxanes can also be removed while separating hydrogen sulfide, as with the
adsorption iron oxide property formulation SOXSIA.
Cooling the gas and removing water is another option. A 26% and 99% of removal can be
achieved by cooling the gas to a temperature of -25 °C and -70 °C respectively. At -25 °C volatile
methyl siloxanes do not significantly liquefy however some dissolve in the condensate. Due to
relatively high investment and operation cost, deep chilling is generally regarded as economically
suitable only at high flow rates and elevated siloxane load. Of course, the process is also subject to
icing.
Absorption can also be applied to siloxane removal. A very promising organic solvent for siloxane
removal was found to be Selexol. It has been tested in a continuous pilot plant and siloxane
removal of 99% was reporter (Ajha, 2010).
Ajhar and Melin (2006) mentioned poly dimethyl siloxanes-membranes as candidate for membrane
separation of siloxanes and other organic gaseous trace compounds. Furthermore, they show high
water intrinsic permeance and thus serve as an ideal dehumidifier. The technology seems
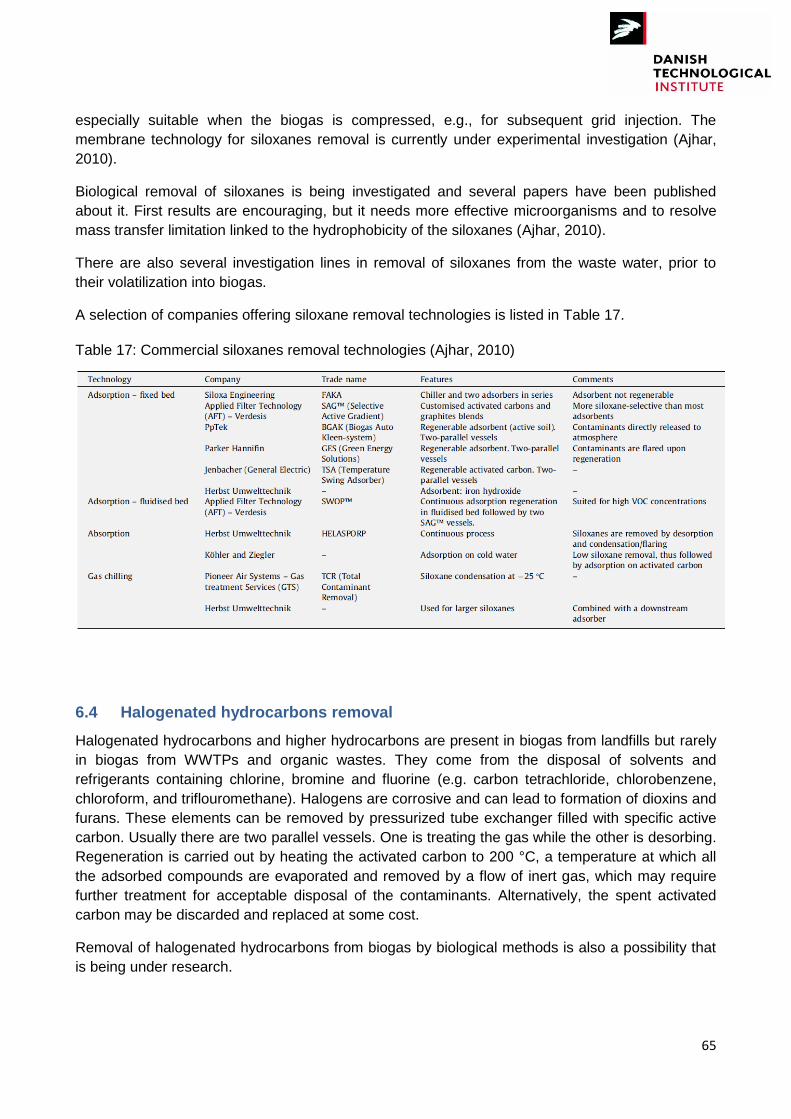
65
especially suitable when the biogas is compressed, e.g., for subsequent grid injection. The
membrane technology for siloxanes removal is currently under experimental investigation (Ajhar,
2010).
Biological removal of siloxanes is being investigated and several papers have been published
about it. First results are encouraging, but it needs more effective microorganisms and to resolve
mass transfer limitation linked to the hydrophobicity of the siloxanes (Ajhar, 2010).
There are also several investigation lines in removal of siloxanes from the waste water, prior to
their volatilization into biogas.
A selection of companies offering siloxane removal technologies is listed in Table 17.
Table 17: Commercial siloxanes removal technologies (Ajhar, 2010)
6.4 Halogenated hydrocarbons removal
Halogenated hydrocarbons and higher hydrocarbons are present in biogas from landfills but rarely
in biogas from WWTPs and organic wastes. They come from the disposal of solvents and
refrigerants containing chlorine, bromine and fluorine (e.g. carbon tetrachloride, chlorobenzene,
chloroform, and triflouromethane). Halogens are corrosive and can lead to formation of dioxins and
furans. These elements can be removed by pressurized tube exchanger filled with specific active
carbon. Usually there are two parallel vessels. One is treating the gas while the other is desorbing.
Regeneration is carried out by heating the activated carbon to 200 °C, a temperature at which all
the adsorbed compounds are evaporated and removed by a flow of inert gas, which may require
further treatment for acceptable disposal of the contaminants. Alternatively, the spent activated
carbon may be discarded and replaced at some cost.
Removal of halogenated hydrocarbons from biogas by biological methods is also a possibility that
is being under research.

66
6.5 Oxygen removal
Oxygen and in part also nitrogen indicate that air has intruded the digester or landfill gas collector. This occurs quite often in landfills where the gas is collected through permeable tubes by providing a slight vacuum. Small concentrations (0 – 4%) of oxygen are harmless. Biogas in air with a methane content of 60% is explosive between 6 and 12%, depending on the temperature. Biological fixation to reduce H2S uses air injection, and, therefore, introduces oxygen into the biogas. However, most of the oxygen is used by the biological process leaving only traces behind. Oxygen can be partially removed by membrane separation and low pressure PSA, but the removal is expensive. Preventing the introduction of air into the biogas by careful monitoring is far cheaper than gas treatment. Tolerance levels for oxygen in natural gas grids in different countries are showed in Table 9 in Chapter 4.3.1.
6.6 Nitrogen removal
Difficult to remove, biogas from landfills contains high proportions of nitrogen. Since it is inert, the
only impact of nitrogen is the dilution of the energy content. Unless H2S abatement requires air
injection (a 4% injection of air would result in 3.1% nitrogen), nitrogen should be absent from farm
biogas. PSA and cryogenic systems can remove nitrogen, but they are generally expensive.
6.7 Ammonia removal
Combustion of ammonia (NH3) leads to formation of nitrogen oxides. Gas engines can usually
accept a maximum of 100 mg/Nm3. According to Swedish experts, there is virtually no NH3 in
biogas, and it has never been a problem as it usually stays below 1ppm
In industrial large scale cleaning processes NH3 is often removed from gas by a washing process
with diluted nitric or sulfuric acid. The use of these acids demands installations made of stainless
steel that can be expensive for small scale applications. NH3 can also be removed with units filled
with activated carbon and is also eliminated in some of the CO2-removing units, like adsorption
processes and absorption processes with water.
6.8 Particle removal
Some dust and oil particles from compressors may be present in the gas, which has to be filtered
at 2 to 5 μm. Particles are removed by proven filtration technology by passing the gas through a
filter pad made of stainless steel wide or through a ceramic filter pack, or alternatively using
cyclone separators.
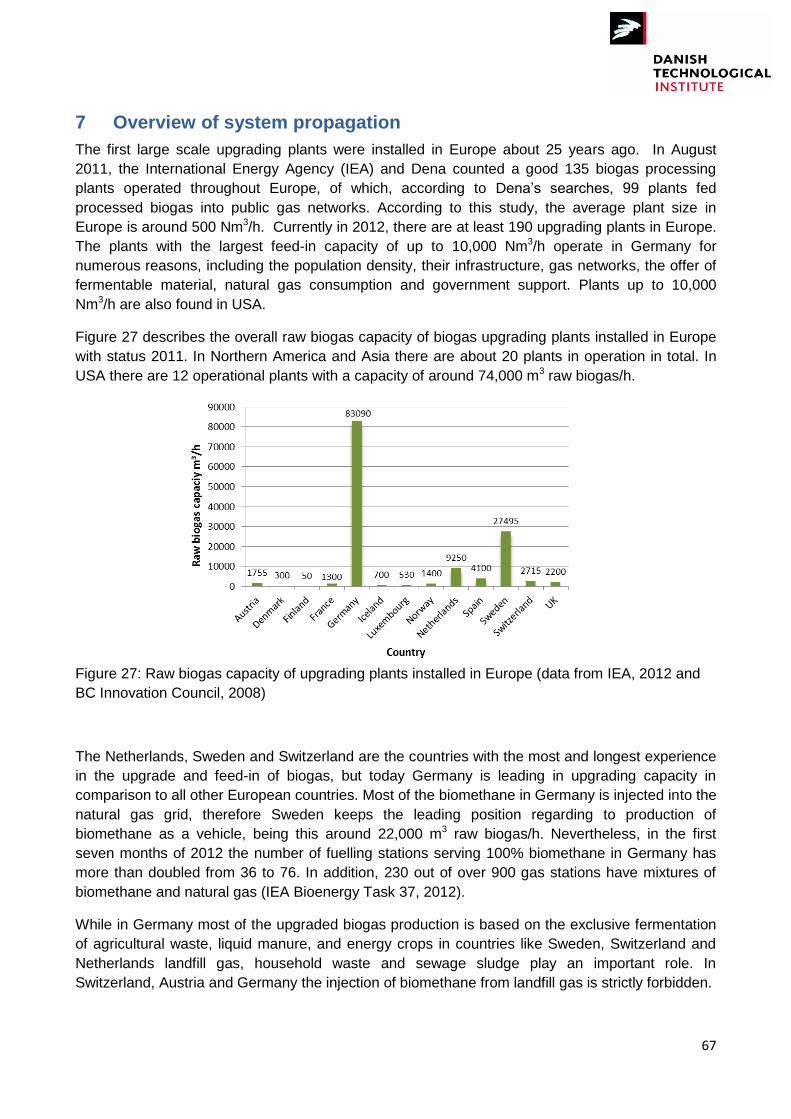
67
7 Overview of system propagation
The first large scale upgrading plants were installed in Europe about 25 years ago. In August
2011, the International Energy Agency (IEA) and Dena counted a good 135 biogas processing
plants operated throughout Europe, of which, according to Dena‟s searches, 99 plants fed
processed biogas into public gas networks. According to this study, the average plant size in
Europe is around 500 Nm3/h. Currently in 2012, there are at least 190 upgrading plants in Europe.
The plants with the largest feed-in capacity of up to 10,000 Nm3/h operate in Germany for
numerous reasons, including the population density, their infrastructure, gas networks, the offer of
fermentable material, natural gas consumption and government support. Plants up to 10,000
Nm3/h are also found in USA.
Figure 27 describes the overall raw biogas capacity of biogas upgrading plants installed in Europe
with status 2011. In Northern America and Asia there are about 20 plants in operation in total. In
USA there are 12 operational plants with a capacity of around 74,000 m3 raw biogas/h.
Figure 27: Raw biogas capacity of upgrading plants installed in Europe (data from IEA, 2012 and
BC Innovation Council, 2008)
The Netherlands, Sweden and Switzerland are the countries with the most and longest experience
in the upgrade and feed-in of biogas, but today Germany is leading in upgrading capacity in
comparison to all other European countries. Most of the biomethane in Germany is injected into the
natural gas grid, therefore Sweden keeps the leading position regarding to production of
biomethane as a vehicle, being this around 22,000 m3 raw biogas/h. Nevertheless, in the first
seven months of 2012 the number of fuelling stations serving 100% biomethane in Germany has
more than doubled from 36 to 76. In addition, 230 out of over 900 gas stations have mixtures of
biomethane and natural gas (IEA Bioenergy Task 37, 2012).
While in Germany most of the upgraded biogas production is based on the exclusive fermentation
of agricultural waste, liquid manure, and energy crops in countries like Sweden, Switzerland and
Netherlands landfill gas, household waste and sewage sludge play an important role. In
Switzerland, Austria and Germany the injection of biomethane from landfill gas is strictly forbidden.
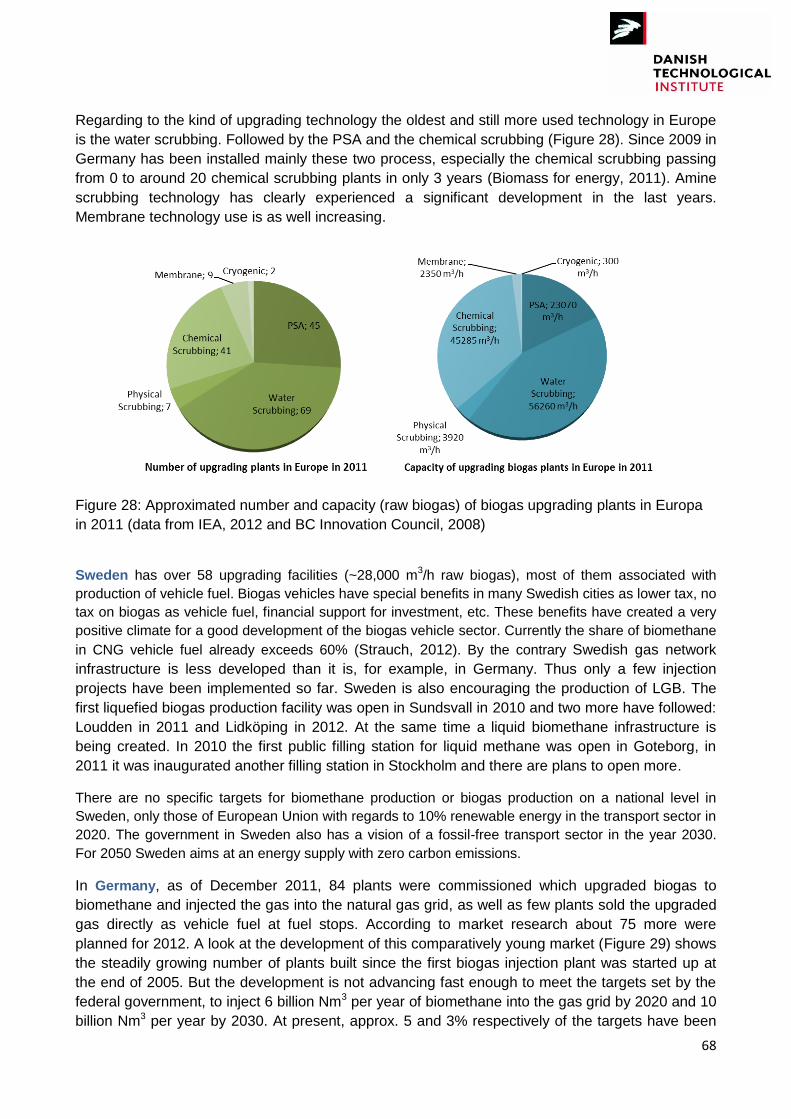
68
Regarding to the kind of upgrading technology the oldest and still more used technology in Europe
is the water scrubbing. Followed by the PSA and the chemical scrubbing (Figure 28). Since 2009 in
Germany has been installed mainly these two process, especially the chemical scrubbing passing
from 0 to around 20 chemical scrubbing plants in only 3 years (Biomass for energy, 2011). Amine
scrubbing technology has clearly experienced a significant development in the last years.
Membrane technology use is as well increasing.
Figure 28: Approximated number and capacity (raw biogas) of biogas upgrading plants in Europa
in 2011 (data from IEA, 2012 and BC Innovation Council, 2008)
Sweden has over 58 upgrading facilities (~28,000 m3/h raw biogas), most of them associated with
production of vehicle fuel. Biogas vehicles have special benefits in many Swedish cities as lower tax, no
tax on biogas as vehicle fuel, financial support for investment, etc. These benefits have created a very
positive climate for a good development of the biogas vehicle sector. Currently the share of biomethane
in CNG vehicle fuel already exceeds 60% (Strauch, 2012). By the contrary Swedish gas network
infrastructure is less developed than it is, for example, in Germany. Thus only a few injection
projects have been implemented so far. Sweden is also encouraging the production of LGB. The
first liquefied biogas production facility was open in Sundsvall in 2010 and two more have followed:
Loudden in 2011 and Lidköping in 2012. At the same time a liquid biomethane infrastructure is
being created. In 2010 the first public filling station for liquid methane was open in Goteborg, in
2011 it was inaugurated another filling station in Stockholm and there are plans to open more.
There are no specific targets for biomethane production or biogas production on a national level in
Sweden, only those of European Union with regards to 10% renewable energy in the transport sector in
2020. The government in Sweden also has a vision of a fossil-free transport sector in the year 2030.
For 2050 Sweden aims at an energy supply with zero carbon emissions.
In Germany, as of December 2011, 84 plants were commissioned which upgraded biogas to
biomethane and injected the gas into the natural gas grid, as well as few plants sold the upgraded
gas directly as vehicle fuel at fuel stops. According to market research about 75 more were
planned for 2012. A look at the development of this comparatively young market (Figure 29) shows
the steadily growing number of plants built since the first biogas injection plant was started up at
the end of 2005. But the development is not advancing fast enough to meet the targets set by the
federal government, to inject 6 billion Nm3 per year of biomethane into the gas grid by 2020 and 10
billion Nm3 per year by 2030. At present, approx. 5 and 3% respectively of the targets have been

69
achieved, so further speeding-up of the construction of new plants would be necessary, otherwise
the targets will not be achieved. Apart from the supply of biomethane from biogas, it is also worth
mentioning the provision of biomethane by way of thermo-chemical conversion of solid biomass.
Germany does not yet have a large-scale plant for the production of bio-SNG, although a large
number of technological developments are very promising and can be implemented in the medium
term.
Figure 29: Biomethane production in Germany: number of plants in operation and upgrading
capacity installed, status March 2012 (Strauch, 2012)
The Netherlands has 15 gas to grid facilities delivering over 5,000 m3/h into gas distribution grids
(status 2011), and it is planned the construction of at least 8 installations more in the next years. The
Netherlands has a target of replacement of natural gas by upgraded biogas. This is as it follows
(Figure 30):
– Short term target: replacement of natural gas by
upgraded biogas 1 – 3%
– Mid-term target: 8 – 12% replacement of natural
gas in 2020 (4 billion Nm3/year), inclusive SNG
production from biomass
– Long term: up-scaling to 50% replacement of
natural gas by Green Gas in the gas grid
Figure 30: Target of replacement of natural gas by
upgraded biogas (Dumont, 2011)
In Denmark the first upgraded biogas entered the distribution network on 15 September 2011. The
plant produces 180 Nm3 of upgraded biogas per hour, corresponding to the consumption of
approximately 800 households. There are agreements for the construction, by Bionaturgas
70
Denmark, of at least 5 new plants with biogas injection into the natural gas grid from summer 2013
with a total biomethane production of 35.5 million m3 per year.
The upgrading of biogas to produce biomethane and feeding or injecting it into the natural gas
grids are no longer a problem from the technical point of view. However, trading is made difficult by
the large number of players involved, their different interests, transport routes and arrangements,
as well as the legal and organizationally very complex procedures. A decisive basic requirement
for trading is therefore regulations which define, among other things, quality, quantity, feed-in,
transport, proof of origin, balancing and use. Much has been done in this area in the past 2/3
years. Switzerland, Germany, The Netherlands and Austria have developed certification systems
or rather a biogas register and in part, have also created rules for cross-border trading. Others
countries as Denmark are in the process. They ensure that the quality and safety requirements are
met as well as verifying documentation for electricity production, the heat market and fuel mixture,
and they are the basis for calculating tax relief and bonuses. These countries have therefore
created the first reliable framework conditions for producers, traders and consumers; however
balancing the verifications still remains a major challenge.
In the fuel sector biomethane has played hardly any role to date. From a worldwide point of view,
most of the vehicles fueled with upgraded biogas are in Europe. Sweden alone reports that more
than half of the gas used in its 11,500 natural gas vehicles is biogas, and Germany is
experimenting a strong development in this area. Small, indeed minimum quantities are being sold
in Austria, Switzerland and the Netherlands, yet they have developed a virtually nationwide natural
gas filling station network. In the summer of 2011, there were 171 natural gas filling stations in
Austria, 130 in Switzerland, 110 in the Netherlands and almost 900 in Germany. Biomethane can
be fuelled at those stations, mostly as bio-CNG mixed gas fuel. Pure biomethane is not yet so easy
to buy except in Sweden (Biomass for energy, 2011).
The German biogas association has found out that in August 2011, 1.5 million natural gas vehicles
were licensed worldwide, most of them in Europe. With almost 700,000 vehicles, Italy is an alone
front-runner. Natural gas cars have been used there for around 60 years. Moreover, on 3 March
2011 the government released the decree no. 28 stating that (among others) the Regions have to
apply specific simplifications in the authorization procedures for building new methane filling
stations in order to promote the use of biomethane for transport. In the summer of 2011, almost
3,000 natural gas vehicles were licensed in the Netherlands, around 6,000 in Austria, 10,000 in
Switzerland and 92,000 in Germany. The growth of natural gas vehicles in these countries is
developing in line with different subsidies. Moreover, the automotive industry has begun
manufacturing more attractive models promoting the development of natural gas vehicles.
In the United States, biogas vehicle activities have been on a smaller scale, but low emission cars
are becoming an important issue. There has been significant interest and work to evaluate the
development of biomethane in California with the aim of opening vehicle fuel and biomethane to
grid markets. Statten Island landfill upgrade facilities have been injecting upgraded gas into the
natural gas network since 1981. Moreover Altamont Landfill, one of the largest in California, collect,
upgraded and liquefied its biogas which is used in the more than 1,000 trash trucks that deliver the
waste to the landfill. In 2011 the California Energy Commission has approved more than $29
million for projects developing cleaner transportation fuels including two landfill upgrading and LBG
projects in the City of Corona (Riverside County) and at the Simi Valley landfill facility in Ventura
County. Pixley Biogas is a third project to build a digestion facility in the community of Pixley
(Tulare County) that will process manure from three nearby dairies and the biogas will be used at
71
the adjacent Calgren Renewable Fuels ethanol biorefinery. The project CalStart that is promoting
the change in California, has rated biogas as the best alternative fuel before bioethanol and
hydrogen for fuel cells.
8 Converting biogas to non-cryogenic liquid fuels
There is considerable interest in the production of renewable liquid fuels that could be used more
directly in the existing transportation fleet and could overcome the volume, range, and weight
limitations imposed by CBM (or CNG). For example, the energy contents of methanol and liquefied
biomethane are much closer to the energy density of gasoline or diesel fuel than CNG (or CBM)
and thus better suited for existing passenger vehicle applications.
In addition to liquefied biomethane (LBM) two main technologies exist for converting biogas to
liquid fuels: catalytic conversion to methanol, and Fischer-Tropsch synthesis for hydrocarbon fuel
production. The first step of these processes is the production of syngas from biomethane.
A different option to utilize biogas is the production of hydrogen with a steam reformer followed up
by a gas purification system. Applications for hydrogen are industrial raw gas, car fuel or fuel for
the production of electric in fuel cells. This alternative is complex and not (yet) industrial-scale
developed; thus it is not considered as a profitable option in the short term. In addition, also an
infrastructure of hydrogen handling to the consumer is not expected to be available in a short-
medium term.
9 Biogas as feedstock
The chemical industry uses natural gas not only as fuel but as well as feedstock. Therefore
biomethane could replace natural gas as feedstock to produce “green” bio-based chemicals, with
no additional infrastructure investments, as upgraded biogas can be injected directly into existing
natural gas distribution grids.
Methane from natural gas is one of the most important actual feedstock for hydrogen production
(for hydrocracking, hydrodesulfurization, and ammonia) and for syngas production (for methanol,
and its derivatives e.g. MTBE, formaldehyde, and acetic acid). Some of the main chemicals used in
the industry as feedstock derivate from natural gas are indicated in Table 18.
Different conversion processes are used for the transformation of natural gas in chemicals and
they are well documented in literature. One of the challenges today is the optimization/new
development of some of these processes so that for instance the CO2 of the biogas can be used
as carbon source, as for example in the synthesis of methanol. In that case no biogas upgrading
step would be needed. Other challenge is the development of those or new technologies for small
or medium scale methane flow rates.
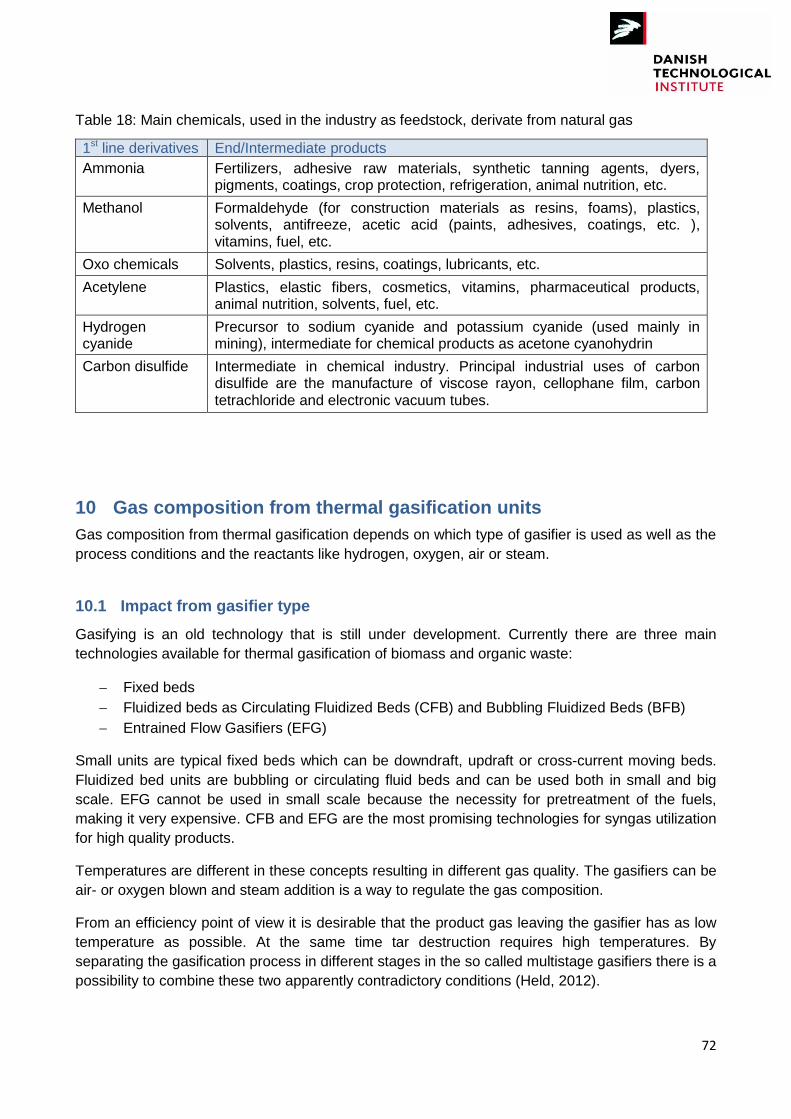
72
Table 18: Main chemicals, used in the industry as feedstock, derivate from natural gas
1st line derivatives End/Intermediate products
Ammonia Fertilizers, adhesive raw materials, synthetic tanning agents, dyers, pigments, coatings, crop protection, refrigeration, animal nutrition, etc.
Methanol Formaldehyde (for construction materials as resins, foams), plastics, solvents, antifreeze, acetic acid (paints, adhesives, coatings, etc. ), vitamins, fuel, etc.
Oxo chemicals Solvents, plastics, resins, coatings, lubricants, etc.
Acetylene Plastics, elastic fibers, cosmetics, vitamins, pharmaceutical products, animal nutrition, solvents, fuel, etc.
Hydrogen cyanide
Precursor to sodium cyanide and potassium cyanide (used mainly in mining), intermediate for chemical products as acetone cyanohydrin
Carbon disulfide Intermediate in chemical industry. Principal industrial uses of carbon disulfide are the manufacture of viscose rayon, cellophane film, carbon tetrachloride and electronic vacuum tubes.
10 Gas composition from thermal gasification units
Gas composition from thermal gasification depends on which type of gasifier is used as well as the
process conditions and the reactants like hydrogen, oxygen, air or steam.
10.1 Impact from gasifier type
Gasifying is an old technology that is still under development. Currently there are three main
technologies available for thermal gasification of biomass and organic waste:
Fixed beds
Fluidized beds as Circulating Fluidized Beds (CFB) and Bubbling Fluidized Beds (BFB)
Entrained Flow Gasifiers (EFG)
Small units are typical fixed beds which can be downdraft, updraft or cross-current moving beds.
Fluidized bed units are bubbling or circulating fluid beds and can be used both in small and big
scale. EFG cannot be used in small scale because the necessity for pretreatment of the fuels,
making it very expensive. CFB and EFG are the most promising technologies for syngas utilization
for high quality products.
Temperatures are different in these concepts resulting in different gas quality. The gasifiers can be
air- or oxygen blown and steam addition is a way to regulate the gas composition.
From an efficiency point of view it is desirable that the product gas leaving the gasifier has as low
temperature as possible. At the same time tar destruction requires high temperatures. By
separating the gasification process in different stages in the so called multistage gasifiers there is a
possibility to combine these two apparently contradictory conditions (Held, 2012).
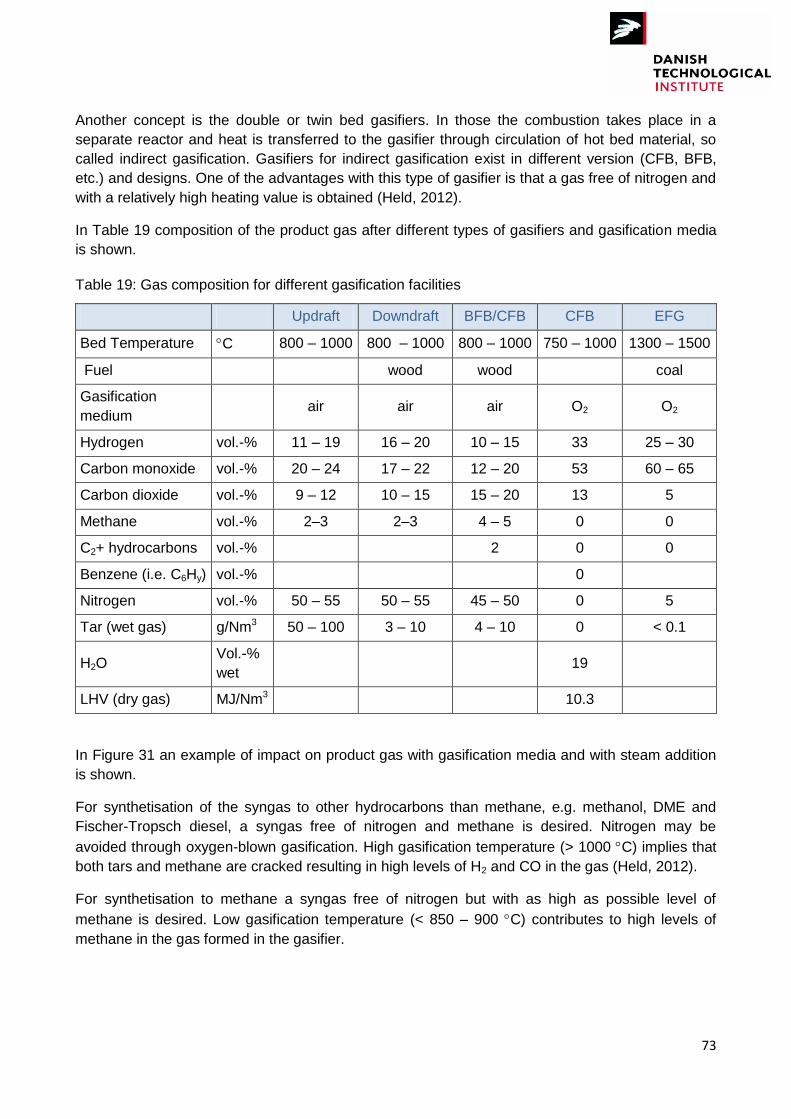
73
Another concept is the double or twin bed gasifiers. In those the combustion takes place in a
separate reactor and heat is transferred to the gasifier through circulation of hot bed material, so
called indirect gasification. Gasifiers for indirect gasification exist in different version (CFB, BFB,
etc.) and designs. One of the advantages with this type of gasifier is that a gas free of nitrogen and
with a relatively high heating value is obtained (Held, 2012).
In Table 19 composition of the product gas after different types of gasifiers and gasification media
is shown.
Table 19: Gas composition for different gasification facilities
Updraft Downdraft BFB/CFB CFB EFG
Bed Temperature C 800 – 1000 800 – 1000 800 – 1000 750 – 1000 1300 – 1500
Fuel wood wood coal
Gasification
medium air air air O2 O2
Hydrogen vol.-% 11 – 19 16 – 20 10 – 15 33 25 – 30
Carbon monoxide vol.-% 20 – 24 17 – 22 12 – 20 53 60 – 65
Carbon dioxide vol.-% 9 – 12 10 – 15 15 – 20 13 5
Methane vol.-% 2–3 2–3 4 – 5 0 0
C2+ hydrocarbons vol.-% 2 0 0
Benzene (i.e. C6Hy) vol.-% 0
Nitrogen vol.-% 50 – 55 50 – 55 45 – 50 0 5
Tar (wet gas) g/Nm3 50 – 100 3 – 10 4 – 10 0 < 0.1
H2O Vol.-%
wet 19
LHV (dry gas) MJ/Nm3 10.3
In Figure 31 an example of impact on product gas with gasification media and with steam addition
is shown.
For synthetisation of the syngas to other hydrocarbons than methane, e.g. methanol, DME and
Fischer-Tropsch diesel, a syngas free of nitrogen and methane is desired. Nitrogen may be
avoided through oxygen-blown gasification. High gasification temperature (> 1000 C) implies that
both tars and methane are cracked resulting in high levels of H2 and CO in the gas (Held, 2012).
For synthetisation to methane a syngas free of nitrogen but with as high as possible level of
methane is desired. Low gasification temperature (< 850 – 900 C) contributes to high levels of
methane in the gas formed in the gasifier.
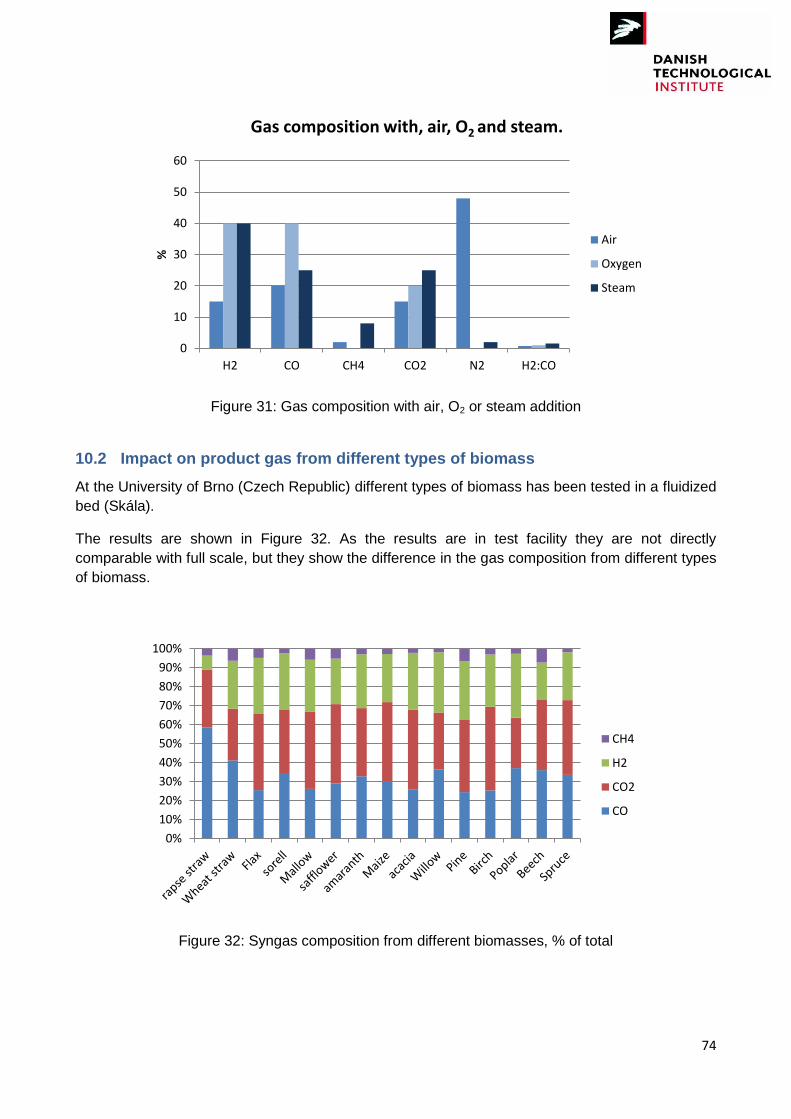
74
Figure 31: Gas composition with air, O2 or steam addition
10.2 Impact on product gas from different types of biomass
At the University of Brno (Czech Republic) different types of biomass has been tested in a fluidized
bed (Skála).
The results are shown in Figure 32. As the results are in test facility they are not directly
comparable with full scale, but they show the difference in the gas composition from different types
of biomass.
Figure 32: Syngas composition from different biomasses, % of total
0
10
20
30
40
50
60
H2 CO CH4 CO2 N2 H2:CO
%
Gas composition with, air, O2 and steam.
Air
Oxygen
Steam
0%
10%
20%
30%
40%
50%
60%
70%
80%
90%
100%
CH4
H2
CO2
CO

75
11 Gas quality from thermal gasification plants
Gas quality depends of which purpose is has to be used for. It is clear that for combustion is not a
critical factor, but for higher grade applications it becomes stricter.
Gas cleaning requirements for different applications are as follow:
Purpose Gas quality
•Heat (kilns) mg/m3
•Co-firing
•Gas engines
•Gas turbines ppm
•Stirling engines
•Fuel cells
•Syngas ppb
Figure 33: Gas cleaning requirements for different applications (Knoef, 2008)
Syngas to high valuable products has strict limits. As example, gas quality to the Fischer-Tropsch process is shown in Table 20.
Table 20: Gas requirements to the Fischer-Tropsch process
Impurity Tolerance level
H2S + COS +CS2 1 ppmv
0.2 ppm
60 ppb
NH3 + HCN 1 ppm
HCl + HBr + HF 10 ppb
Alkali metals 10 ppb
Solids( soot, dust, ash) Essentially completely free
Organic compounds Below dew point
-Class 2 ( hetero aromatics) 1 ppm
Nitrogen 10 ppmv NH3
0.2 ppmv NOx
10 ppb HCN
Note: there are differing points of view regarding sulfur level, but in general, sulfur content in the syngas should be minimized according to economics
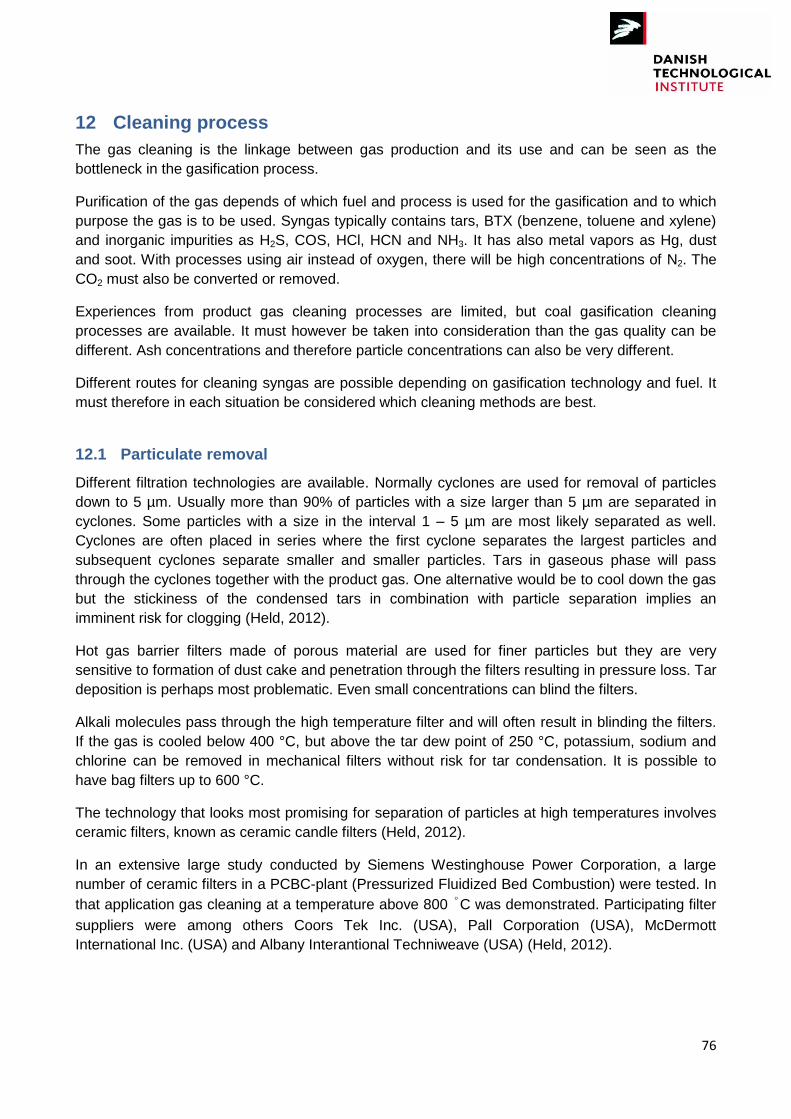
76
12 Cleaning process
The gas cleaning is the linkage between gas production and its use and can be seen as the
bottleneck in the gasification process.
Purification of the gas depends of which fuel and process is used for the gasification and to which
purpose the gas is to be used. Syngas typically contains tars, BTX (benzene, toluene and xylene)
and inorganic impurities as H2S, COS, HCl, HCN and NH3. It has also metal vapors as Hg, dust
and soot. With processes using air instead of oxygen, there will be high concentrations of N2. The
CO2 must also be converted or removed.
Experiences from product gas cleaning processes are limited, but coal gasification cleaning
processes are available. It must however be taken into consideration than the gas quality can be
different. Ash concentrations and therefore particle concentrations can also be very different.
Different routes for cleaning syngas are possible depending on gasification technology and fuel. It
must therefore in each situation be considered which cleaning methods are best.
12.1 Particulate removal
Different filtration technologies are available. Normally cyclones are used for removal of particles
down to 5 µm. Usually more than 90% of particles with a size larger than 5 µm are separated in
cyclones. Some particles with a size in the interval 1 – 5 µm are most likely separated as well.
Cyclones are often placed in series where the first cyclone separates the largest particles and
subsequent cyclones separate smaller and smaller particles. Tars in gaseous phase will pass
through the cyclones together with the product gas. One alternative would be to cool down the gas
but the stickiness of the condensed tars in combination with particle separation implies an
imminent risk for clogging (Held, 2012).
Hot gas barrier filters made of porous material are used for finer particles but they are very
sensitive to formation of dust cake and penetration through the filters resulting in pressure loss. Tar
deposition is perhaps most problematic. Even small concentrations can blind the filters.
Alkali molecules pass through the high temperature filter and will often result in blinding the filters.
If the gas is cooled below 400 °C, but above the tar dew point of 250 °C, potassium, sodium and
chlorine can be removed in mechanical filters without risk for tar condensation. It is possible to
have bag filters up to 600 °C.
The technology that looks most promising for separation of particles at high temperatures involves
ceramic filters, known as ceramic candle filters (Held, 2012).
In an extensive large study conducted by Siemens Westinghouse Power Corporation, a large
number of ceramic filters in a PCBC-plant (Pressurized Fluidized Bed Combustion) were tested. In
that application gas cleaning at a temperature above 800 ˚C was demonstrated. Participating filter
suppliers were among others Coors Tek Inc. (USA), Pall Corporation (USA), McDermott
International Inc. (USA) and Albany Interantional Techniweave (USA) (Held, 2012).
77
12.2 Tar Conversion
Not all the liquids from the gasification are converted to syngas, due to physical limitations of the
reactor and chemical limitations of the reactions. These residues form contaminant condensable
organic compounds, known as tars, in the product gas. These tars tend to be refractory and hard to
remove. This aspect is one of the most important technical barriers to implement the gasification of
biomass technology (Rutz, 2008).
There are three basic ways to destroy tars: thermal cracking, catalytic cracking and scrubbing. The
tars have to be cracked or removed first, to enable the use of conventional low temperature wet
gas cleaning or advanced high temperature dry gas cleaning of the remaining impurities. Cracking
or recycle of the tar back to the gasifier is preferred as the tar has a high content of chemical
energy.
12.2.1 Thermal partial oxidation
Partial oxidation can take place in the gasifier or after the gasifier. The thermal cracking operates
at temperatures between 100 – 1,200 °C where tars are cracked without catalyst, usually by
adding steam or oxygen. Drawbacks are low thermal efficiency, soot production and the need of
expensive materials (Rutz, 2008)
In EFGs the oxidation can be performed by adding oxygen and steam to the high temperature
process, typical >1,100 °C. The EFG process is quiet expensive and the fuel needs a pretreatment
before entering the EFG. These processes can be either torrefaction or pyrolysis followed by
particle reduction to < 200 µm before entering the EFG.
EFG has until now only been used for coal gasification in large scale and only in test facilities for
biomass. Economics for EFG make it necessary to build large scale plants. The high temperature
and oxygen is able to crack tar elements so the levels after the gasifier are low.
Fluidized bed gasifiers operate typically at a much lower temperature, -850 °C and tar
concentrations are quite high, 10 g/Nm3 or higher. A fluidized bed does not need the same particle
reduction as an EFG, but it needs an extra cleaning step for tar reduction, which is possible either
in the bed or in a special unit after the gasifier.
12.2.2 Catalytic oxidation
Tar cracking may be obtained at significant lower temperatures (450 – 900 °C) than the thermal
cracking if a catalyst is present. Different catalysts are used as olivine, carbonate products and
nickel. Olivine is cheap, but not that efficiency. New investigations indicate that iron has a very
good impact on tar reduction. Olivine contains some iron, nevertheless a coating seems
necessary. A French research group has shown that olivine impregnated with 10% and 20% iron
respectively give the corresponding tar destruction as olivine impregnated with nickel (Held, 2012).
Tar removal after the gasifier has been tested in lab scale with different catalysts with success, but
efficiency is not proved. At the Carbonas gasification plant in Skive problems were found.
Paul Scherrer Institute (PSI) and Clean Technology Universe AG (CTU) have shown in lab scale
tests that a total tar conversion in the PSI combined shift and methanation reactor (bubbling bed)
was obtained at temperatures around 350 ˚C. The problem was that some of the tars contained

78
sulfur and the nickel based catalyst died after approx. 200 hours due to sulfur poisoning. This
problem is solved by removing the tars through a scrubber upstream of the shift and methanation
reactor (Held, 2012).
12.2.3 Scrubbing
The use of a wet scrubber to remove tars requires gas temperatures of 35 – 60 ˚C in case of water
scrubbing. Tars are hydrophobic and have low solubility in water which implies that only the
aerosols are separated. By using solvents which are lipophilic, as oil-based medium, the tars in
gaseous phase dissolve in the liquid and the scrubber efficiency increases. The tar is subsequently
separated from the oil and returned into the gasifier (Rutz, 2008).
At the Güssing gasification plant Rapeseed oil Methyl Esther (RME) is used as scrubbing liquid.
The used scrubbing liquid is then combusted in the combustion reactor of the plant.
Energy Research Centre of the Netherlands (ECN) has developed and patented OLGA (an
acronym for oil based gas cleaning in Dutch). The OLGA-process is divided in two scrubbing
stages, a stage in which liquid tars are separated and another in which gaseous tars are absorbed.
The liquid tars are separated from the scrubbing liquid and recycled to the gasifier. The gaseous
tars that have been absorbed by the scrubbing liquid are removed in a stripper. In case of air-
blown gasification air is used for the stripping. The air, containing tars, is then used as an oxidizing
agent in the gasifier (Held, 2012). The Dutch company Dahlman holds the rights to the process.
The OLGA technology was demonstrated at a 4 MW plant in Moisannes, France (Rasmussen,
2012).
12.3 Hydrochloric acid, ammonia, and sulfur removal
Whereas tar formation is mainly caused by the operating conditions of the gasifier and less by the
composition of the biomass feedstock, for non-tar components such as sulfur and chlorine the
situation is reversed. The elemental composition of the feedstock determines the basic
requirements for gas cleaning downstream the gasifier.
The sulfur in the biomass is mainly released as H2S and COS, and only in small amounts as
organic sulfur (mercaptans and thiophenes).
12.3.1 Adsorption processes
Zinc oxide and active carbon filters have been used for H2S, NH3 traces, HCl (hydrochloric acid),
and S removal.
HCl adsorption was found to be optimal on sodium carbonate on high surface area supports such
as alumina, but these support materials are expensive. Several low cost and moderate surface
area materials are therefore being considered, such materials included pyrolyzed rice hulls and
diatomaceous. Both HCl and metals are removed in the process (Merkel, 2005).
Sulfur can be removed by activated carbon, molecular sieve absorbents, disposable ZnO pellets as
well as regenerative ZnO and zinc titanium pellets. The disadvantage is that low boiling COS
cannot be removed due to low activity and high cost, disposal of spent material and the fact that
the absorbent processes are run at low temperature. Adsorption with molecular sieves is a viable
79
option when the amount of sulfur is very low and the gas contains heavier sulfur compounds (such
as mercaptans and COS).
Ammonia removal by catalytic processes is limited by temperature. A level of 10 ppmv requires a
temperature of 250 °C which result in low reaction rate. Molecular sieve has been found suitable,
but removal is impacted by many parameters as dehydration, temperature and treatment with
steam.
12.3.2 Rectisol and Selexol absorption process
In the Rectisol process frozen methanol is used as solvent to separate acid gases as hydrogen
sulfide and carbon dioxide. It is also possible to remove NH4, Hg, COS and HCN. Among
manufactures of the process is Lurgi.
In the Selexol process the solvent is a mixture of dimethyl ether and polyethylene glycol.
Operation takes place a high pressure (2.01 MPa to 13.8 MPa) and the acids are recovered in a
stripping process. UOP is one of the process manufacturers. These processes normally use less
energy than the methanol process. The concentration in the gas stream must however be quiet
high if it shall be economical to recover the acids.
12.3.3 Membrane solutions
The main problem for removal of H2S and NH3 by membrane is the finite selectivity for these
elements in relation to H2 concentration in the syngas.
The selectivity for the product gas components is important for the choice of material. In
polydimethylsiloxanes the following relative permeability is found: H2O >> SO2 > COS > H2S > NH3
> CO2 >> CH4=H2 > CO > N2. Temperature has also high impact on the selectivity
12.3.4 COS hydrolyses
COS is typical removed by passing the cold, particle free gas through a diglucosamine solution.
The reaction is:
2R-NH2 + COS → R-N-C-N-R + H2O + H2S
The degradation product is recovered in a declaimer operating at 190 °C.
R-N-C-N-R + H2O → 2R-NH2 +CO2
12.4 Chloride and alkali removal
Chloride is unwanted as it result in corrosion and alkali must be removed due to deposition risk.
Water scrubbing is one of the most used techniques.
12.5 Carbon dioxide removal
There are different technologies for the removal of CO2 from syngas. Most of them are already
describe in Chapter 5 for removal of CO2 from biogas.

80
Table 21: Resume of main CO2 removal technologies from syngas
Absorption
Physical Chemical
Selexsol
Rectisol Other
Amines (MEA, DEA, MDEA, DGA) Alkaline salts (hot potassium carbonate, caustic wash processes, Seaboard process, …)
Adsorption Adsorption Beds Regeneration method
Alumina Zeolite Activated carbon Pressure Swing Temperature Swing Washing
Membrane Gas separation Gas absorption Ceramic systems
Polyphenylenoxide Polymethylsiloxane Pressure swing
CO2 removal by membrane solution is quiet new. The Membrane Technology research center has
developed a membrane Polaris that has been used for removal of CO2 from a steam reformed gas,
which then is rich in H2
Figure 34: CO2 Removal from syngas using Polaris™ (MTR, 2011)

81
13 Methane production from bio-syngas
Syngas from gasification of biomass can be converted to biomethane in the so called methanation
process. This process followed by upgrading produces biomethane that can be injected into the
existing natural gas grid replacing natural gas. In the methanation process CO and CO2 reacts with
H2 under impact of a nickel based catalyst at a temperature of approx. 250 – 450 C, releasing
heat (Ahrenfeldt, 2010):
CO + 3H2 ↔ CH4 + H2O ΔH= -206 KJ/mol
2CO ↔ CO2 + C ΔH= -173 KJ/mol
2CO + 2H2 ↔ CH4 + CO2 ΔH= -247 KJ/mol
CO2 + 4H2 ↔ CH4 + 2H2O ΔH= -165 KJ/mol
In the methanation process it is very important to have low concentrations of sulfur, as the catalyst
is very sensitive for deactivation with sulfur.
The ratio between hydrogen and carbon monoxide can be adjusted in a shift reactor by adding
steam (CO + H2O H2 + CO2).
Haldor Topsøe A/S has developed the TREMP (Topsøe Recycle Energy-efficient Methanation
Process) process which can convert H2 and CO in the ratio 3/1 into methane. The premise is that
the gasification products are conditioned to the TREMP process (pure syngas). CO2 is removed
after the shift conversion where the H2/CO-ratio is adjusted. In the TREMP process approx. 80% of
the energy in the feed gas is converted into methane in a gas with up to 98% methane
(Rasmussen, 2012).
Another methanation process is the combined shift and methanation reactor developed at Paul
Sherrer Institute (PSI) based on fluid bed technology. This process has shown to work at
hydrogen/carbon monoxide ration within as broad interval as 1 to 5. In the PSI methanation
process the carbon dioxide is separated after the methanation using conventional technology. This
technology was used at the Güssing gasification plant (Chapter 15.2) (Rasmussen, 2012).
A part of the separated CO2 may be used as inert gas for the biomass feeding.
14 Liquid fuel production from bio-syngas
Until now, the power generation has been the focus area for bio-syngas from thermal gasification
and the synthesis of liquid fuels is a relatively new area.
A clean syngas is the basis for production of various fuels and chemicals and a wide spectra has
been proposed in the literature.
In Figure 35 a rout diagram for different processes for various products from syngas is shown.

82
Figure 35: Diagram of different syngas conversion processes (Spath, 2003)
14.1 Methanol
Catalytic methanol synthesis from biogas is a classic high-temperature, high-pressure exothermic
equilibrium limited synthesis reaction. The chemistry of methanol synthesis is as follows (Spath,
2003):
CO + 2H2 ↔ CH3OH ΔH= -90.64 KJ/mol
CO2 + 3H2 ↔ CH3OH + H2O ΔH= -49.67 KJ/mol
CO + H2O ↔ CO2 + H2 ΔH= - 41.47 KJ/mol
The methanol contains by-products as DME, higher alcohols, small amounts of acids and
aldehydes and must be cleaned afterwards.
Methanol production from syngas has been used through many years. One of the most widely
used commercial isothermal methanol converters is the Lurgi Methanol Converter, while the ICI
Low pressure Quench Converter is the most widely used adiabatic methanol converter. Others are
the Kellog, Brown, and Root (now Halliburton) converter and the Haldor-Topsøe Collect, Mix, and
Distribute (CMD) converters. Mitsubishi Gas Chemical has developed an isothermal reactor known
as the MGC/MHI Superconverter (Spath, 2003). Each of these manufacturers has developed as
well their own methanol synthesis catalyst formulations based mainly in cobber, zinc and
aluminum.
A summary of the gas cleanliness requirements for gas phase and liquid phase methanol
production is given in Table 22
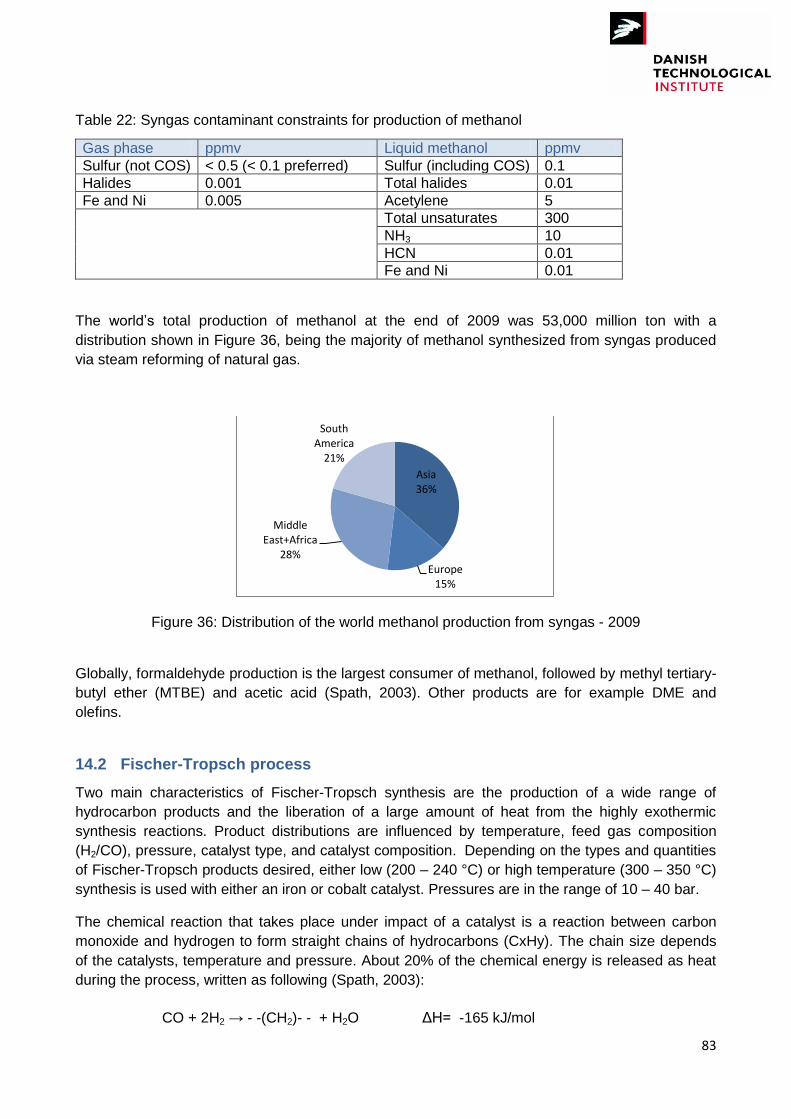
83
Table 22: Syngas contaminant constraints for production of methanol
Gas phase ppmv Liquid methanol ppmv
Sulfur (not COS) < 0.5 (< 0.1 preferred) Sulfur (including COS) 0.1
Halides 0.001 Total halides 0.01
Fe and Ni 0.005 Acetylene 5
Total unsaturates 300
NH3 10
HCN 0.01
Fe and Ni 0.01
The world‟s total production of methanol at the end of 2009 was 53,000 million ton with a
distribution shown in Figure 36, being the majority of methanol synthesized from syngas produced
via steam reforming of natural gas.
Figure 36: Distribution of the world methanol production from syngas - 2009
Globally, formaldehyde production is the largest consumer of methanol, followed by methyl tertiary-
butyl ether (MTBE) and acetic acid (Spath, 2003). Other products are for example DME and
olefins.
14.2 Fischer-Tropsch process
Two main characteristics of Fischer-Tropsch synthesis are the production of a wide range of
hydrocarbon products and the liberation of a large amount of heat from the highly exothermic
synthesis reactions. Product distributions are influenced by temperature, feed gas composition
(H2/CO), pressure, catalyst type, and catalyst composition. Depending on the types and quantities
of Fischer-Tropsch products desired, either low (200 – 240 °C) or high temperature (300 – 350 °C)
synthesis is used with either an iron or cobalt catalyst. Pressures are in the range of 10 – 40 bar.
The chemical reaction that takes place under impact of a catalyst is a reaction between carbon
monoxide and hydrogen to form straight chains of hydrocarbons (CxHy). The chain size depends
of the catalysts, temperature and pressure. About 20% of the chemical energy is released as heat
during the process, written as following (Spath, 2003):
CO + 2H2 → - -(CH2)- - + H2O ΔH= -165 kJ/mol
Asia 36%
Europe 15%
Middle East+Africa
28%
South America
21%
84
In the reaction the ratio of H2/CO is ~ 2. If the concentration of the hydrogen is too low in the product gas steam can be added.
The ratio of CO and H2 is the most important parameter for the reaction products. Specific Fischer-Tropsch products are synthesized according to the following reactions (Spath, 2003):
CO + 3H2 → CH4 + H2O (Methanation)
nCO + (2n+1)H2 → CnH2n+2+ nH2O (Paraffins)
nCO + 2nH2 → CnH2n + nH2O (Olefins)
nCO + 2nH2 → CnH2n+1OH + (n–1)H2O (Alcohols)
One of the earliest Fischer-Tropsch reactors designed was the fixed-bed tubular reactor. After
many years of development, Ruhrchemie and Lurgi have refined this concept into what is known
as the ARGE high capacity Fischer-Tropsch reactor. High-temperature circulating fluidized-bed
reactors have been developed for gasoline and light olefin production. These reactors are known
as Synthol reactors and operate at 350 °C and 25 bar. Another reactor design is the low-
temperature slurry reactor.
Syngas impurities are known to poison Fischer-Tropsch catalysts. Table 20 (Chapter 11)
summarizes the syngas impurities and tolerances.
15 Biomass thermal gasification ongoing activities
The ongoing research and development of gasification techniques is extensive, both on national
and international level. Although many process concepts and components have been
demonstrated, there is still no full-scale plant for the production of synthetic fuels based on
biomass (Held, 2012). Nevertheless several full scale projects are under development.
Furthermore, there are plants that, through gasification of biomass, produce electricity and heat or
provide industrial processes with a clean fuel. In the database “Zeusintel” an updated status of the
biomass thermal gasification plants can be found.
Some of the biomass gasification plants/research activities for production of synthetic fuels in the
world are described in the next points.
15.1 Rentech
Rentech has patented and commercialized the Rentech-SilvaGas biomass gasification technology
and the Rentech-ClearFuels biomass gasification technology, which can produce synthesis gas
from biomass and waste materials for production of renewable power and fuels. Rentech has also
patented the Rentech Process based on Fischer-Tropsch chemistry that convers syngas from the
others Rentech gasification technologies into complex hydrocarbons that then can be upgraded
into fuel or chemicals. The most critical component of the Rentech Process is its proprietary iron-
based Rentech catalyst. The Rentech Process uses a slurry bubble column reactor, known as the
Rentech Reactor.
The Rentech-SilvaGas biomass gasifier can process a wide variety of cellulosic feedstock to
produce syngas. Technology has been proven on large scale (up to 40 MW) since 1998 and on lab
scale for more than 22,000 hours of operation before that. The first large scale SilvaGas gasifier
85
was the Vermont Gasifier that operated from 1998 to 2002 on 200 – 400 tons dry wood/day,
producing gas for the Integrated Gasification Combined Cycle (IGCC) at the McNeil station of the
Burlington Electric Department (Ahrenfeldt, 2010).
The thermal conversion process is a low-pressure, indirect gasification of biomass consisting of
two circulating fluidized beds with sand as heat carrier. The process mixes wood chips with very
hot sand at a gasification temperature of about 830 C. The gas from the SilvaGas gasification has
a medium calorific value with Higher Heating Value of around 11 – 14 MJ/Nm3 (Ahrenfeldt, 2010).
The Rentech-ClearFuels biomass gasification technology produces hydrogen as well as syngas
from cellulosic feedstock through the use of a High Efficiency Hydrothermal Reformer. The
Rentech-ClearFuels technology has operated at pilot scale in excess of 10,000 hours and multiple
third parties, including Idaho National Laboratory and Hawaii Natural Energy Institute, have
independently validated the results of the pilot scale data. The Rentech-ClearFuels technology is
being proven at demonstration scale (20 ton per day) at Rentech's Energy Technology Center,
integrated it with the Rentech´s existing Product Demonstration Unit which consists of Rentech´s
Fischer-Tropsch Process and UOP´s upgrading technology. The joint demonstration produces
synthetic drop-in jet, diesel fuels and waxes and chemicals.
Rentech Gulf Coast Synthetic Energy Center, or Natchez Project, in Mississippi is a project
planned for the production of 30,000 barrels of synthetic fuels (including 16,000 barrels of jet fuel)
and chemical and 120 MW electricity based on biomass and coal.
Rentech has also announced plans to construct a renewable fuels and power plant in Rialto, CA,
producing 640 barrels/day synthetic fuel from biomass.
15.2 The Güssing gasifier
The Güssing biomass gasification plant is an 8 MWth demonstration site for the Fast Internally
Circulating Fluidized-Bed (FICFB) technology based on indirect gasification, developed initially by
Austrian Energy and Technical University of Vienna (TUV), and now by Reportec. TUV is testing
uses for the syngas (Fischer-Tropsch, methanol synthesis and in fuel cells), as well as further R&D
for optimization and tar cleanup. The gasifier has been connected to a 1 MW methanation unit,
which has demonstrated production of synthetic natural gas. In April 2009, the first operation of the
full process chain was achieved. A filling station for biomethane, inaugurated in June 2009, has
been built in direct vicinity of the plant.
In the Güssing plant the gas is cooled down after the gasifier and tars are separated by means of a
Rapeseed Methyl Ester (RME) scrubber. The separated tars are transferred to the combustion
reactor where they are combusted and the energy content recovered. Activated carbon is used to
remove the major part of the sulfur while a bed of ZnO takes care of the final removal (Held, 2012).
The micro-channel Fischer-Tropsch process was also introduced with production of biofuels from
syngas. The FT process has been running since July 2010
Based on the lower calorific value of the biomass this method can achieve efficiencies up to 70%
from biomass to syngas (Rasmussen, 2012).
86
15.3 EON – SNG production, Göteborg Energy
The project GoBiGas is focusing on producing bio-SNG (bio-synthetic natural gas) by gasification
of waste from forestry. A demo gasification plant is scheduled to be built in two stages to
demonstrate the technology of the green gas concept. Ownership and responsibility for operating
the plant will be transferred to GoBiGas AB (Gothenburg Biomass Gasification Project), mainly
owned by Göteborg Energi AB. With forest residue and wood pellets as main fuels, the gasification
system, together with the subsequent methanation and upgrading system, will produce biomethane
for distribution in the existing gas grid. The facility will be the first in the world that produces bio-
SNG from a commercial perspective. The project has received support from the Energy Agency
with approx. 25 million euro. The total cost is approx. 155 million euro (Held, 2012).
During 2011 – 2013 a 20 MW plant will be build and a second phase, with a gas production of 80 –
100 MW, is planned for completion in 2016. The decision regarding the implementation of the
second phase will be done after the evaluation of the first phase. The first phase gasification
system is a Metso solution based on the indirect gasification technology developed by Repotec
and further developed at Chalmers University of Technology. The methanation is a Haldor
Topsøe´s process.
The pilot project at the Chalmers University is a circulating fluid bed which produces 2 – 4 MW of
gas which is used in a boiler.
The next step for EON with possible construction in 2015 is the Bio2G (Biogas 2nd Generation)
project, which comprises the design, erection and commissioning of a biomethane plant with 200
MW (~21,000 m3/h) output and a solid biomass fuel input of 325 MWth.
15.4 Enerkem
Enerkem´s proprietary thermochemical process converts waste into syngas.
Enerkem has started to build a 300 ton/day biorefinery in Edmonton, Alberta (Canada). The plant
will produce 10 million gallons (38 million liters) ethanol and methanol per year as well as other
chemicals. Raw material will be non-recyclable and non-compostable municipal solid waste.
Construction begun during summer 2010 and operation are schedule to start in early 2013. Two
similar plants will be built in Pontotoc, Mississippi (EEUU) and in Varennes, Québec (Canada).
The base for these projects is a commercial demonstration plant in Westbury, Québec, using
waste wood. Operation of this plant started in 2009 with the production of conditioned syngas.
Methanol production has been underway since 2011, and cellulosic ethanol since spring 2012. The
plant has a capacity of 5 million liters per year.
15.5 MILENA and OLGA processes
Milena is a compact designed indirect fluid bed gasifier designed by ECN (Netherlands). It consists
of two reactors for pyrolysis/gasification (CFB-type) and combustion (BFB-type) respectively. Since
2004, a lab-scale Milena gasifier is operated as part of an extensive test park at ECN. Since
November 2007, a 800 kW pilot-scale Milena is available at ECN, which is connected to a pilot-
scale cooler and OLGA tar gas cleaning units. The combination MILENA-OLGA is reported to give
70% biomass to bio-syngas conversion.

87
Plans for carrying out a 10 MW demonstration plant based on MILENA and OLGA technology are
also underway. The target is to produce bio-SNG directly to the existing gas network or to be used
as transport fuel.
15.6 VTT Ultra Clean Fuel Gas (UCG) process
VTT (Technical Research Centre of Finland) has developed the Ultra Clean Gas (UCG) process
for biomass and waste-derived fuels. The UCG-process is based on optimized steam/oxygen
fluidized-bed gasifier (PDU) coupled to an advanced high temperature filtration system as well as
reformer for the catalytic treatment of tars and hydrocarbons, which enables to use a wide range of
wood residues.
The first phase of the research work on UCG-process was started at VTT in the beginning of
2000´s with a 500 kW pressurized process unit. The targets for the gas cleaning steps has been
complete tar and benzene decomposition, over 95% methane reforming, suitable H2/CO ratio for
Fisher-Tropsch synthesis, reliable operation and minimum overall gas cleanup cost (Hannula,
2009). The plant produces Fisher-Tropsch diesel, hydrogen, syngas and gasoline jet fuel.
NSE Biofuels Oy, a joint venture between Neste Oil and Stora Enso operated a Biomass-to-Liquid
(BTL) demonstration plant at Stora Enso´s Varkaus Mill in Finland based on the UCG process. The
output was 656 ton per year from a 12 MW gasifier. NSE Biofuels (in partnership with Foster
Wheeler and VTT) planned to develop a commercial production plant at one of Stora Enso‟s mills
with a projected output capacity of 100,000 ton/year of Fischer-Tropsch waxes, and a potential
launch date of 2016. However, in August 2012 Neste Oil and Stora Enso announced that they had
decided not to progress with their plans to build a biodiesel plant, as the project was not listed for
funding under the EC´s NER 300 (European Biofuels, 2012)
15.7 Carbo-V Process
The Carbo-V Process is a three-stage gasification process developed by Choren industries GmbH,
including three sub-processes, namely low temperature gasification, high temperature gasification
and endothermic entrained bed gasification. Choren built a 45 MWth plant (Beta Plant) for
production of synthetic diesel through Fischer-Tropsch synthesis, in Freiberg, Germany.
In 2011 Choren Industries filed for insolvency and in 2012 Choren´s biomass gasification
technology was sold to Linde Engineering Dresden, who will further develop the Choren Carbo-V
technology used to produce syngas. The Choren plant used the proprietary Shell Middle Distillate
Synthesis (SMDS) technology. The SMDS process has been implemented on commercial scale at
world´s largest fossil GTL plant, developed by Qatar Petroleum and Shell and running since 1993
in Qatar. When fully operational the plant will produce from natural gas 140,000 barrels of oil
equivalent per day of liquid products such as cleaner-burning diesel and aviation fuel, and oils for
advanced lubricants.
15.8 Chemrec
The Chemrec Kraft Recovery is a process based on refractory-lined entrained flow gasifier,
operating around 1000 C and 32 bars. The current development plant of this process is located in
Piteå, Sweden, and it is designed for gasification of about 20 dry tons/day of black liquor (3 MWth).
88
The plant was extended with a DME production plant from syngas with a capacity of 4 – 5 ton
DME/day. The DME synthetisation technology is provided by Haldor Topsøe.
An industrial scale plant, with a capacity of 100,000 ton/year (75 MW), was planned to be built at
the biorefinery Domsjö Fabriker in Örnsköldsvik. However, the owner of Domsjö Fabriker, Aditya
Birla Group, has decided not to continue with the project. The main reason is the insecurity related
to long term political conditions for green transport fuels (Held, 2012).
15.9 GreatPoint Energy
GreatPoint Energy is an American company with a gasifying technology where syngas is produced
directly in the process, the so called Hydromethanation. In this process the feedstock material is
ground to less than the size of sand particles.
The first step in the hydromethanation process is to disperse the catalyst throughout the matrix of a
carbon-rich feedstock under specific conditions so as to ensure effective reactivity. The
catalyst/feedstock material is then loaded into the hydromethanation reactor. Inside the reactor,
pressurized steam is injected to "fluidize" the mixture and ensure constant contact between the
catalyst and the carbon particles. In this environment, the catalyst facilitates multiple chemical
reactions between the carbon and the steam on the surface of the particles. These reactions,
catalyzed in a single reactor and at the same low temperature, generate a mixture predominately
composed of methane and CO2. After CO2-removal the result is SNG, which can be injected into
the natural gas grid (Rasmussen, 2012).
The technology looks promising but is not yet to be found in Europe. The company has a research
plant at Mayflower Clean Energy Center in Somerset, Massachusetts.
15.10 The Blue Tower concept
The German company Blue Tower GmbH owns the rights to this gasification technology. It is a
three-stage moving bed gasification concept: pyrolysis of biomass, steam reforming of the
pyrolysis gas and combustion of char remaining after the pyrolysis (Held, 2012). Depending on the
biomass a drying unit is placed at the front of the gasifier (Rasmussen, 2012).
An interesting feature of the concept is that the product gases could be used directly for production
of syngas. H2/CO ratio is above 3, so all hydrogen can be converted to CH4 by methanation without
a preceding shift reaction. After particle separation and tar and trace element removal the gas can
directly enter the methanation process for bio-SNG production (Rasmussen, 2012).
Presently the concept has not yet been demonstrated with bio-SNG production. A project
(H2Herten) is planned in Herten, Germany. It is a 13 MW demonstration plant. More plants are
being built in India and Japan, including a 30 MW plant in India meant for hydrogen production
(Rasmussen, 2012).
15.11 CORTUS-WoodRoll three-stage gasification
The CORTUS-WoodRoll technology has three stages: drying, pyrolysis and gasification. The
technology has been demonstrated with woodchips, waste wood and sludge from the paper
industry.
89
A part of the technology is indirect gasification, where heat is transferred by means of heat pipes in
the gasification section. The composition of the producer gases is very suitable for methanation as
it has a very large content of H2; H2/CO ratio is above 3 (Rasmussen, 2012).
In the autumn of 2011 a 500 kW demonstration project was successfully carried out. The earlier
pilot project was a successful 150 kW facility. The efficiency from biomass to syngas was
measured at 80%. CORTUS has signed a 12-year contract for supply of a 5 MW facility to a
Swedish lime burning plant. The plan is to expand the facility to 25 MW (Rasmussen, 2012).
15.12 Absorption Enhanced Reforming at ZSW
Zentrum für Sonnenenergie- und Wasserstoff-Forschung (ZSW), Germany has developed the
Absorption Enhanced Reforming (AER) technology which is used in gasification. It is an
enhancement of the indirect gasification technology with chemical looping including CaO (burnt
lime).
CaO absorbs CO2 and the result of the gasification process is a produced gas with a high content
of hydrogen and which is directly convertible to CH4. In addition CaO absorbs other impurities and
works as a catalyst for conversion of tar (Rasmussen, 2012).
The AER technology has successfully been tested on the Güssing plant. The share of hydrogen in
the producer gas was enhanced from 37% to approx. 50% at the expense of CO2. At a pilot plant
especially set up for the AER technology, 65% hydrogen was achieved in a producer gas that
could be used without a shift reaction directly for production of bio-SNG with up to 90% methane
(Rasmussen, 2012).
15.13 The FZK Bioliq
It is a process developed by KIT, the Karlsruhe Institute of Technology, for the production of
synthetic fuels from straw by decentralized fast pyrolysis and centralized entrained flow
gasification. For process development purposes a 500 kg/h pyrolysis plant (2 MW) was
constructed in Karlsruhe. Particles, alkaline salts, H2S, COS, CS2, HCl, NH3, and HCN are
removed to avoid catalyst poisoning during fuel synthesis. The pilot plant is equipped with an
innovative hot-gas cleaning system for particle filtration, pollutant decomposition and adsorption at
500 °C.
90
16 Conclusions
Biogas and syngas from biomass gasification are highly versatile energy carriers. They can be
used for the production of heat and electricity in engines, turbines and fuel cells. Biogas can be
cleaned/upgraded to biomethane and bio-syngas can also be transformed to biomethane by
conditioning, methanation and upgrading. By injecting biomethane into the natural gas pipeline
network, it can be used as a direct substitute for natural gas in domestic gas appliances,
commercial/industrial gas equipment, cogeneration plants, and in transport.
Moreover, biogas and syngas can be transformed into different synthetic biofuels as liquid
hydrocarbon replacements for gasoline and diesel fuels, methanol, dimethyl ether, and hydrogen;
as well as in diverse chemical components.
Depending on the application, certain levels of gas cleaning/upgrading are required.
When talking about biogas, quality considerations are not more a barrier for introducing it into the
natural gas pipeline system as various commercial technologies exist today to process biogas to a
product that is indistinguishable from a constituent perspective to natural gas. The main barrier is
related to price so biomethane can be competitive with natural gas. The upgrading costs are still an
important part of the biomethane price. Costs are very dependent of scale operation. For small
biogas sites such as small farms, the capital cost associated with cleaning, upgrading and pipeline
injection may be too high.
Prospects are nevertheless good, and a very fast development in this area has been taking place
in the last years. Economic and technical improvements of the cleaning/upgrading are expected to
continue in near future together with increasing fossil fuel prices. The number of biogas upgrading
plants in Europe is growing rapidly, especially in Germany, mainly as a result of government
support.
Authorization procedures for biomethane injection into the grid are still not a common procedure in
most countries and trading between countries is not in place yet. A crucial issue at this respect is
the harmonization of standards regarding quality of biomethane and regulations which define,
among others feed-in, transport, proof of origin, balancing and use. At European level, biomethane
quality standards for injection into the natural gas grid and for transport use are under
development.
Regarding biogas as liquid fuel, only production of liquefied biogas has come in the last years to
commercial stage. So if conditions are favorable from an economical and/or political point of view,
a fast development could take place in this area. LBG/LNG could play an important role in heavy
vehicle transport. Since 2010 three liquefied biogas production facilities has been inaugurated in
Sweden and a liquid biomethane infrastructure is being created.
In relation to the production of other liquid biofuels from biogas they will be most probably
considered only in a middle-long term, as vehicle and production technologies need to be further
developed and improved.
Concerning thermal gasification, while thermal gasification of coal is a mature technology, thermal
gasification of biomass to produce bio-SNG is at the pre-commercial stage with successful
demonstration plants and several full scale projects under development. But to increase the
profitability and feasibility of bio-SNG production and liquid biofuels from gasification of biomass,

91
comprehensive research and development is needed in this area. Commercial-scale
implementation is expected in the 2020 timeframe.
Some studies advocate that anaerobic digestion will be the main source of biomethane to 2020
with thermal gasification contributing onwards (NPC, 2012).
92
References
Acrion Technologies. http://www.acrion.com/
Articnova- http://www.articnova.se/biosling_e.html
Ahrenfedt J., Jørgensen B., Thomsen T. (2010). Bio-SNG potential assessment: Denmark 2020. ISSN 0106-2840. ForskNG-projekt nr. 10299.
Ajhar M., Melin T. (2006) Siloxane removal with gas permeation membranes. Desalination 200:234e5
Ajhar M., Travesset M., Yüce A. and Melin T. (2010). Siloxane removal from landfill and digester gas – A technology overview. Bioresource Technology 101, pg. 2913 – 2923
Al Seadi T., Rutz D., Prassl H., Köttner M., Finsterwalder T., Volk S. and Janssen R.(2008). Biogas Handbook. University of Southern Denmark Esbjerg
Bauen A., Berndes G., Junginger M., Londo M. and Vuilli F. (2009). Bioenergy – A sustainable and reliable energy source. A review of status and prospects. IEA Bioenergy: ExCo: 2009:06
Beil M. and Hoffsted U. (2010). Guidelines for the implementation and operation of biogas upgrading systems. Biogasmax. Project suuported by the EU under RTC contract: 019795
Bekkering J., Broekhuis A.A., van Gemert W.J.T (2010). Optimisation of a green gas supply chain – A review. Bioresource Technology 101, pg. 450 – 456
Benjaminsson, J. and Anders D. (2008). “Upggradering av biogas. Kusrsuskompendium”
BC Innovation Council (2008). Feasibility Study – Biogas upgrading and grid injection in the Fraser Valley, British Columbia
Biomass for Energy (2012). Focus on Biomethane. Deutsches BiomasseForschungsZentrum gemeinnützige GmbH (DBFZ)
CO2 Solutions. http://www.co2solutions.com
Chambers, A. K. and Potter, I. (2002). Gas Utilization from Sewage Waste. AIDIS-Canada. Environmental project
Cline, C., Hoksberg, A., et al. (2002). Biological process for H2S removal from gas streams: The Shell-Paques/Thiopaq™ gas desulfurization process. Paper for the LRGCC, 23 – 26 February 2003, Norman (Oklahoma)
Dayton D.C., Ratcliff M., and Bain R. (2001). Fuel Cell Integration – A study of the impacts of gas quality and impurities. Milestone Completion Report. National Renewable Energy Laboratory (NREL), NREL-MP-510-30298
Delsinne S. (2010). Biogas Safety and Regulation. Discussion document for the workshop organized on 24 November 2010 in Paris. Project 12055
Dumont M. (2011). Green Gas: The Dutch Experience. Workshop Energy from Biogas, Cork 15 September 2011
El–Fadel M., Findikakis A.N., and Leckie J.O. (1997). Environmental Impacts of Solid Waste Landfilling. Journal of Environmental Management 50, pg. 1 – 25
Environment-Agency (2004). Guidance on Gas treatment Technologies for Landfill Gas Engines
93
European Biofuels Technology Platform (2012). Biomass to Liquids (BTL). http://www.biofuelstp.eu/btl.html
Erler R. (2009). Biogas utilization chains. Work package WP09, Deliverable: D35, REDUBAR
Firor R.L. (2002). Chemical Analysis in Fuel Cell Systems: Application of the Agilent 5000A Real-Time Gas Analyser for Monitoring Low–Level Sulfur. Agilent Technologies, Inc
Fuel Cell Handbook, Seventh Edition (2004). EG&Technical Services, Inc. Contract No. DE–AM26–99FT40575. U.S. Department of Energy, Office of Fossil Energy, National Energy Technology Laboratory
Geber M. (2008). An analysis of available mathematical models for anaerobic digestion of organic substances for production of biogas. International Gas Union Research Conference Paris 2008
GPP. Gastreatment power package of GtS. http://www.gastreatmentservices.com/index.php?option=com_content&view=article&id=31&Itemid=60&lang=en
Greenhouse Gas Technology Center (2004). Test and Quality Assurance Plan Paques: THIOPAQ and Shell–Paques Gas Purification Technology. Southern/USEPA–GHG–QAP–32
Gruijthuijsen van L. (2012). Testcenter for grønne gasser. Gastekniske Dage, 16 May 2012.
Hagen M., Polman, E., Myken A., Jensen J., Jönsson O., AB B. and Dahl A. (2001). Adding gas from biomass to the gas grid. Final report Contract No: XVII/4.1030/Z/99 -412
Hannula I. (2009). Hydrogen production via thermal gasification of biomass in near-to-medium term. VVT Working Papers 131
Held J. (2012). Gasification – Status and technology. Rapport SGC 240. ISRN SGC-R-240-SE. Swedish Gas Centre (SGC).
Holm–Nielsen J.B., Al Seadi T. and Oleskowicz–Popiel P. (2009). The future of anaerobic digestion and biogas utilization. Bioresource Technology 100, pg. 5478–5484
Hullu, J., Maassen J.I.W., van Meel P.A., Shazad S., and Vaessen J.M.P (2008). Comparing different biogas upgrading techniques. Final report. Eindhoven University of Technology
IEA Bioenergy (2012). Up–grading Plant List, updated at 05/2012. http://www.iea-biogas.net/_content/plant–list/plant–list.html
IEA Bioenergy Task 37 (2012). Newsletter IEA Bioenergy Task 37: Focus Biomethane, 3/12.
Janssen, A., Leerdam Van, R., et al. (2007). Development of a family of large-scale biotechnological processes to desulphurise industrial gasses. Proceedings of the II International Congress on Biotechniques for Air Pollution Control. A Coruña. Spain, October 3 – 5, 2007
Johansson N. (2008). Production of liquid biogas, LBG, with cryogenic and conventional upgrading technology – Description of systems and evaluations of energy balances. Master thesis. Lunds Tekniska Högskola
Jonsson S. and Johan W. (2011). Cryogenic biogas upgrading using plate heat exchangers. Master´s thesis within the Sustainable Energy System Master´s programme. Chalmers University of Technology. Sweden
Jørgensen P.J. (2009). Biogas – green energy. Faculty of Agricultural Sciences, Aarhus University
94
Knoef H.A.M. (2008). BTG Biomass Gasification. BTG biomass technology group BV.
Kohl, A. and Neilsen, R. (1997). Gas Purification. Golf Publishing Company, Houston, Texas. Cited in: McKinsey S.Z. (2003). "Removal of Hydrogen Sulphide from Biogas using cow-manure compost." A Thesis Faculty of the Graduate School of Cornell University
Krich, K., Augenstein, D., et al. (2005). Biomethane from Dairy Waste: A Sourcebook for the Production and Use of Renewable Natural Gas in California. Western United Dairymen
Kvist T. (2011). Establishment of a biogas grid and interaction between a biogas grid and a natural gas grid. Danish Gas Technology Centre
Lampe S. (2006). Assessment of fuel gas cleanup systems for waste gas fueled power generation. EPRI, Palo Alto, CA. 1012763
Lems R., Langerak J., Dirkse E.H.M. (2012). Next generation biogas upgrading using highly selective gas separation membranes – showcasing the Poundbury project. 17
th European Biosolids & Organic
Resources Conference. 19th – 21
th November 2012, The Royal Armouries, Leeds.
Lindberg, A (2003). Developmente of in–situ methane enrichment as a method for upgrading biogas to vehicle fuel standard. Licentiate thesis, KTH, Chemical Engineering and Technology, Stockholm
Lymberopoulos N. (2005). Fuel Cells and their application in Bio–energy. Centre for Renewable Energy
Sources (C.R.E.S). European Commission DB-TREN EESD Contract N: NNE%-PTA-2002-2003/1
Mattiasson B. (2005). ”Ekologisk lunga för biogasuppgradering. Nationellt Samverkansprojekt Biogas i Fordon”
McKinsey, S. Z. (2003). Removal of Hydrogen Sulfide from Biogas using cow-manure compost. A Thesis Faculty of the Graduate School of Cornell University
McPhail S.J., Aarva A., Devianto H., Bove R. and Moreno A. (2011). SOFC and MCFC: Commonalities and opportunities for integrated research. International journal of hydrogen energy 36, pg. 1033 – 10345
Merkel T.C., Gupta R.P., Jain S.C., Turk B.S, Cicero D.C. (2005). Hybrid gas cleaning process for production of ultraclean syngas. Research Triangle Inst., NY.
Mezei S. (2010). Options for upgrading digester biogas to pipeline quality. Flotech
Membrane Technology and Research, MTR (2011). CO2 removal from syngas. http://www.mtrinc.com/co2_removal_from_syngas.html
Christensen J.M. (2011). Catalytic synthesis of long-chained alcohols from syngas. PhD Thesis. CHEC Research Centre, Department of Chemical and Biochemical Engineering Technical University of Denmark
Nagl G. (1997). Controlling H2S emission. Chemical Engineering Journal 104(March): 125 – 128
Naskeo Environnment (2009). Biogas Composition. http://www.biogas-renewable-energy.info/biogas_composition.html
Nordberg Å., Edström M., Uusi-Pentillä M. and Rasmusson Å. (2005). “Processintern metananrikning. JTI–rapport Kretslopp & Avfall 33”
NPC, 2012. Renewable Natural Gas for Transportation: an overview of the feedstock capacity, economics, and GHG emission reduction benefits of RNG as a low-carbon fuel. A white paper for the National Petroleum Council
95
Öhman A. (2009). ”Kryotekniskt behandlad flytande biogas – en utvärdering med utgångspunkt i Stockholm. Examensarbete. Lunds Universitet”
Panousos P. (2010). Gas network reinforcement plans and the integration of biogas. Biogas injection to the transmission network. International Conference of the EU Project SUSPLAN, Berlin 7
th December
Persson M. (2003). ”Utvärdering av uppgraderingsteknikker för biogas. SGC rapport 142. 2003”
Persson M. (2007). Biogas upgrading and utilization as vehicle fuel. European Biogas Workshop. The future of biogas in Europe III
Persson M., Jönsson O. and Wellinger A. (2006). Biogas Upgrading to Vehicle Fuel Standards and Grid Injection. IEA Bioenergy. Task 37
Petersson A. (2009). Modern technologies of biogas upgrading. Citation from Urban W., Girod K., Lohmann H.(2008) ”Technologien und kosten der biogasaufbereitung und einspeisung in das erdgasnetz. Ergebnisse der markterhebung 2007 – 2008. Fraunhofer UMSICH”
Petersson A., and Wellinger A. (2009). Biogas upgrading technologies–developments and innovations. IEA Bioenergy. Task 37
Rasi S. (2009). Biogas composition and upgrading to biomethane. Jyväskylä studies in biological and environmental science 202
Rasi S., Läntelä J. and Rintala J. (2011). Trace compounds affecting biogas energy utilization – A review. Energy Conversion and Management 52(12), pg. 3369 – 3375
Rasmussen N.B. (2012). Technologies relevant for gasification and methanation in Denmark. Project: Detailed analysis of bio-SNG technologies and other RE-gases. ForskNG 10689. Danish Gas Technology Centre
Rutz D. and Janssen R. (2008). Biofuel technology handbook. WIP Renewable Energies
Ryckebosch E., Drouillon M. and Vervaeren H. (2011). Techniques for transformation of biogas to biomethane. Biomass and Bioenergy 35, pg. 1633 – 1645
Shareefdeen, Z. and Singh, A. (2005). Biotechnology for odor and air pollution control. Springer
Skála Z., Ochrana L., Lisý M., Baláš M., Kohout R., Skoblja S. “Research into Biomass and Waste Gasification in Atmospheric Fluidized Bed”. http://www.worldenergy.org/documents/p000657.pdf
Spath P.L., Dayton D.C. (2003). Preliminary Screening – Technical and economic assessment of synthesis gas to fuels and chemicals with emphasis on the potential for biomass-derived syngas. National Renewable Energy Laboratory, NREL/TP-510-34929
Sternovem. Committee for Green Gas. From biogas to green gas. Upgrading techniques and suppliers. 2ETPNG0840
Strauch S., and Krassowski J. Overview of biomethane markets and regulations in partner countries. Green Gas Grids WP2/D 2.2
Svensson M. (2010). Position Paper: Biomethane. The renewable natural gas. NGVA Europe
Trogisch, S., Baaske, W. E., et al. (2004). Biogas Powered Fuel Cells. Trauner Verlag, Linz
Weiland P. (2010). Biogas production: current state and perspectives. Appl. Microbiol. Biotechnol. 88, pg. 849 – 860

96
Wellinger A., Kovacs A., Baldwin J., and Mezzullo William (2012). Discussion paper on biomethane focus issues: sustainability, technical standards, trade and country targets. Green Gas Grids project. Funded by the Intelligent Energy for Europe (IEE) program
Wellinger A., and Lindberg A. (2000). Biogas upgrading and utilization. IEA Bionergy. Task 24
Zappa, L. P. (2001). "Options in Odor Control." Water & Wastewater Products 1(1): 38
Zinn E., Kuenzler W., Le Saux G. And Huguen P. (2010). Guidelines on technical, economical, and legal aspects of grid injection and possible strategies for different local conditions. Biogasmax. Project suuported by the EU under RTC contract: 019795
97
List of abbreviations
AC: Activated Carbon
AD: Anaerobic Digestion
AFC: Alkaline Fuel Cell
BFB: Bubbling Fluidized Bed
Bio-SNG (bio-synthetic natural gas)
BTL: Biomass to Liquid
BTX: Benzene, Toluene, and Xylene isomers
CBG: Compressed Biogas
CBM: Compressed Biomethane
CFB: Circulating Fluidized Bed
CNG: Compressed Natural Gas
CSTR: Continuously Stirred Tank Reactor
DMFC: Direct Methanol Fuel Cell
EFG: Entrained Flow Gasifiers
ESA: Electric Swing Adsorption
FT: Fischer-Tropsch
GHG: Green House Gas
GTL: Gas to Liquid
HRT: Hydraulic Retention Time
LBG: Liquefied Biogas
LBM: Liquefied Biomethane
LNG: Liquefied Natural Gas
MCFC: Molten Carbonate Fuel Cell
PAFC: Phosphoric Acid Fuel Cell
PEFC: Polymer Electrolyte Fuel Cell
PSA: Pressure Swing Adsorption
RME: Rapeseed oil Methyl Ester
SOFC: Solid Oxide Fuel Cell
TS: Total Solids
TSA: Temperature Swing Adsorption
UASB: Upflow Anaerobic Sludge Blanket
UCG: Ultra Clean Gas
VFA: Volatile Fatty Acids
VOCs: Volatile Organic Compounds
VSA: Vacuum Swing Adsorption
WWTPs: Waste Water Treatment Plants