Embed Size (px)
Citation preview
AquaFit4Use is co-financed by the European Union’s 7th Framework Programme
The project for sustainable water use in chemical, paper, textile and
food industries
Biofouling potential reduction of waste water treatment effluents through biofiltration with Denutritor
Jan Gerritse and Paul ter Huurne - Deltares February 2011
Biofouling reduction through biofiltration of activated sludge or MBR effluents Jan Gerritse, Deltares, February 2011
Page | 2
Executive summary This report is a result of the project AquaFit4Use, a large-scale European research project co-financed by the 7th framework programme of the European Union on water treatment technologies and processes. Biofouling is the undesirable accumulation of microorganisms, plants, algae, and/or animals on wetted surfaces. In industry, biofouling causes serious problems in for example membrane bioreactors, reversed osmosis membranes, cooling water systems, pipelines, heat exchangers, etc. Biofouling is caused by inorganic nutrients (e.g. ammonium, nitrate, sulfate and phosphate) and organic compounds, which are dissolved in the water. These compounds promote the growth of microbial populations and are the source of biofouling. Denutritor is a biofilter which reduces biofouling in water systems by removing these growth substrates. Perstorp Specialty Chemicals aims to re-use the effluent from their wastewater treatment plant for cooling or other industrial processes. To this end, different waste water production and post-treatment systems were tested on pilot scale. The wastewater effluent produced by the conventional Active Sludge (AS) system of Perstorp was compared to that produced by a Membrane BioReactor (MBR) pilot installed by Logisticon. The possibilities to remove organic compounds, biofouling potential and salts from AS or MBR effluents largely determines the re-use possibilities. Therefore, different post-treatment systems were tested to polish the AS or MBR effluents: Advanced Oxidation (AOP) to reduce organic compounds; Denutritor to reduce biofouling potential; and Reversed Osmosis (RO) to remove salts. The objective of this work as part of SP 5 Task 5.2.2.2 was to assess the potential benefits and risks of Denutritor, in combination with other treatment techniques, for producing recycled water for use as process water or cooling water at Perstorp. A Denutritor pilot installation was constructed and operated for eleven months on effluent from the AS system of Perstorp, or on water from the MBR or AOP pilot installations. Within this period about 3000 m3 water has been treated. When operated with AS effluent water, Denutritor removed up to 92% of the biofouling potential. Effluent water from the MBR installation had a five-fold lower biofouling potential than AS effluent water. With MBR effluent no further reduction of biofouling potential by Denutritor was observed. Treatment of AS-effluent by AOP resulted in a twenty-fold increase of biofouling potential. Further treatment of AS-AOP effluent by Denutritor reduced its biofouling potential up to 91%. It is concluded that Denutritor is useful as a post-treatment step to reduce biofouling potential of AS or AS-AOP effluent, and as pre-treatment step to protect RO membranes. Re-use possibilities Quality requirements for process water used in chemical synthesis and for steam production are relatively high and much effort will be needed to meet their demands. For the production of feed water for cooling systems, AS effluent treated by Denutritor and RO seems to be a promising alternative, especially in combination with a Denutritor system integrated in the recirculating cooling water.

Biofouling reduction through biofiltration of activated sludge or MBR effluents Jan Gerritse, Deltares, February 2011
Page | 3
Content
EXECUTIVE SUMMARY................................................................................................................ 2
CONTENT ..................................................................................................................................... 3
1 INTRODUCTION .................................................................................................................... 4 1.1 STATE OF THE ART ..........................................................................................................................4
1.1.1 Biofouling reduction...............................................................................................................4 1.1.2 Wastewater re-use at Perstorp..............................................................................................5
2 METHODS.............................................................................................................................. 7 2.1 METHODS ......................................................................................................................................7
2.1.1 Pilot testing program at Perstorp...........................................................................................7 2.1.2 Monitoring operational conditions of the Denutritor pilot.........................................................7 2.1.3 Cleaning of Denutritor filler material.......................................................................................8 2.1.4 Biofouling potential................................................................................................................8 2.1.5 Analysis of water samples.....................................................................................................9
2.2 MATERIALS AND EQUIPMENT.............................................................................................................9 3 RESULTS AND ACHIEVEMENTS........................................................................................ 13
3.1 MAJOR RESULTS AND ACHIEVEMENTS..............................................................................................13 3.2 TECHNICAL PROGRESS OF THE WORK..............................................................................................13
3.2.1 Treatment of Activated Sludge (AS) effluent by Denutritor...................................................14 3.2.2 Treatment of Membrane Bioreactor (MBR) effluent by Denutritor ........................................19 3.2.3 Treatment of AOP (ozone) treated activated sludge (AS) effluent by Denutritor...................23 3.2.4 Evaluation of water production versus water quality needs..................................................25
4 CONCLUSIONS ................................................................................................................... 27 4.1 MAJOR ACHIEVEMENTS..................................................................................................................27 4.2 FUTURE WORK .............................................................................................................................27
5 LITERATURE ....................................................................................................................... 28
Biofouling reduction through biofiltration of activated sludge or MBR effluents Jan Gerritse, Deltares, February 2011
Page | 4
1 Introduction This report is a result of the project AquaFit4Use, a large-scale European research project co-financed by the 7th framework programme of the European Union on water treatment technologies and processes. The research objectives of AquaFit4Use are the development of new, reliable cost-effective technologies, tools and methods for sustainable water supply use and discharge in the main water using industries in Europe in order to reduce fresh water needs, mitigate environmental impact, produce and use water of a quality in accordance with the industries specifications (fit-for-use), leading to a further closure of water cycle. This report corresponds to SP5 Task 5.2.2.2 For more information on AquaFit4Use, please visit the project website: www.aquafit4use.eu. 1.1 State of the art 1.1.1 Biofouling reduction Biofouling or biological fouling is the undesirable accumulation of microorganisms, plants, algae, and/or animals on wetted structures (http://en.wikipedia.org/wiki/Biofouling). Biofouling occurs on almost all surfaces, which are in contact with water. In industry, biofouling causes serious problems in for example membrane bioreactors (MBR), reversed osmosis (RO) membranes, cooling water systems, pipelines, heat exchangers, etc. Economical significant consequences of biofouling are clogging of equipment (e.g. membranes), corrosion damage (microbial influenced corrosion), spoiling of products (e.g. food or drinking water), energy losses (e.g. inefficient heat exchange or increased pumping resistance) and health risks due to accumulation of pathogenic microorganisms (Walker et al., 2000). Biofouling is generally caused by the presence of inorganic nutrients (e.g. nitrate, sulfate and phosphate) and “Assimilable Organic Carbon” (AOC) or “”Biodegradable Organic Carbon” (BOC) substrates, which are dissolved in the water. The intensity of biofouling depends on the concentration of these microbiological growth substrates (Flemming et al., 1996, Meesters et al., 2003). Currently, biofouling control in industry mainly involves the following strategies: Design of water systems from materials that allow little microbial growth or corrosion (e.g.
copper pipelines, coatings, cathodic protection) and smooth constructions without dead ends. Use of anti fouling chemicals such as biocides and biodispergents. Mechanical cleaning during maintenance stops or in situ cleaning e.g. by adding sponges to
the water system. Using as clean as possible makeup or process water without any substrates for microbial
growth. A comprehensive overview of biofouling problems and control strategies in chemical, paper, textile and food industry is given in AquaFit4Use report I1.2.1.1. Unfortunately, biofouling control strategies are often inadequate, expensive or damaging for equipment or the environment.
Biofouling reduction through biofiltration of activated sludge or MBR effluents Jan Gerritse, Deltares, February 2011
Page | 5
Therefore, there is a need for relatively cheep, effective and environmentally sustainable methods for biofouling prevention and control. Biofiltration of process water is one of such methods. During biofiltration, the process water is passed over a biofilter in which microorganisms degrade AOC/BOC and remove other nutrients from the water. In this way, the source of biofouling is removed and the potential for re-use of the treated water is enhanced. In the biofilter, the active microorganisms usually grow in biofilms on a surface filler material. The filler material can consist of sand (Daamen et al., 2000, Griebe and Flemming, 1998, Pand and Liu, 2006), activated clay or zeolite (Hu et al., 2005) activated carbon or iron oxide coated sand (Wend et al., 2003) or synthetic material (Meesters et al., 2003). Denutritor is one type of biofilter which reduces biofouling in water systems. In Denutritor microbial populations are grown in biofilms on fillers of reticulated polyurethane (PUR) foams. The microorganisms in these biofilms degrade the AOC/BOC substrates (Meesters e.a, 2003). Because the PUR foams in Denutritor have a very high porosity, combined with a large specific surface area for the formation of active biofilms, they allow the treatment of water at low hydraulic retention time. Thus Denutritor filters can be smaller than biofilters with alternative filling materials. In addition, the porosity of the filters (e.g. course, medium, fine) can be adjusted to cope with the presence of particles in the treated water. In previous pilot studies we demonstrated the biofiltration approach on pilot scale for treatment of cooling water or surface water, respectively. With cooling water up to 90% reduction of the biofouling potential was be obtained (Gerritse et al., 2003, Meesters et al., 2006). In a second pilot test, where Denutritor was used as a pre-filter to treat surface water, the biofouling rate on RO membranes was reduced up to 7-fold (Brouwer et al., 2006) In Aquafit4Use, laboratory-scale Denutritor biofilters are tested and further developed for the treatment of water from chemical, food, paper, or textile industry, respectively. On pilot scale, Denutritor is tested for treatment of water for re-use in chemical and food industry. 1.1.2 Wastewater re-use at Perstorp This report presents the results of Denutritor pilot tests at Perstorp Specialty Chemicals. Perstorp Specialty Chemicals aims to re-use effluent from their wastewater treatment plant for cooling or other industrial processes. To this end, different waste water production and post-treatment systems were tested during the AquaFit4Use project. The wastewater effluent produced by the conventional AS system of Perstorp was compared to that produced by an MBR pilot installed by Logisticon. The possibilities to remove organic compounds, biofouling potential and salts from AS or MBR effluents largely determines the re-use possibilities. Therefore, the following post-treatment systems were tested to polish the AS or MBR effluents: An advanced oxidation system (AOP) of ITT/WEDECO. AOP was done to oxidize and
remove organic compounds. A Denutritor pilot of Deltares/TNO, to reduce the biofouling potential of the effluents. With a
laboratory Denutritor set-up, a reduction of biofouling potential up to 86% was obtained, using "synthetic" Perstorp AS effluent (Van der Zaan et al., 2010).
A reversed osmosis (RO) system of Perstorp, to remove salts. During the tests the operational robustness of the pilot systems and the chemical and microbiological quality of the produced waters were monitored.

Biofouling reduction through biofiltration of activated sludge or MBR effluents Jan Gerritse, Deltares, February 2011
Page | 6
Objectives of this study: Technological evaluation to assess potential benefits and risks of producing recycled water
for use as process water or cooling water. Monitoring biofilm and hygienic relevant micro-organisms for the different water qualities
produced.
Biofouling reduction through biofiltration of activated sludge or MBR effluents Jan Gerritse, Deltares, February 2011
Page | 7
2 Methods 2.1 Methods 2.1.1 Pilot testing program at Perstorp At Perstorp various process train configurations were tested for treatment of effluent of wastewater from their conventional AS Waste Water Treatment Plant (WTTP), or an MBR pilot, respectively. The overall test program of the pilot trials at Perstorp was from June 2009 until September 2010 (Table 1). The tests involving Denutritor took place from June 2009 until April 2010. The operational performance and test results of the AS, MBR, AOP and RO technologies are presented in separate AquaFit4Use reports.
Table 1. Overview of process configurations tested at Perstorp Specialty Chemicals
Test period Wastewater treatment
Post- treatment
Post-treatment
Post-treatment
Remark
June 10 2009 October 3 2009
Activated Sludge
Denutritor Adaptation period Denutritor
October 3 2009 October 21 2009
Activated sludge
Denutritor Reversed Osmosis
Advanced oxidation on RO concentrate
March 22 2010 April 16 2010
Activated Sludge
Advanced Oxidation
Denutritor Reversed Osmosis
September 2010 Activated Sludge
Reversed Osmosis
October 22 2009 November 20 2009
Membrane Bioreactor
Reversed Osmosis
November 20 2009 February 1 2010
Membrane Bioreactor
Denutritor Reverse Osmosis
Advanced oxidation on RO concentrate
February 8 2010 March 8 2010
Membrane Bioreactor
Advanced Oxidation
Denutritor Reversed Osmosis
AOP on MBR effluent and recycled to MBR
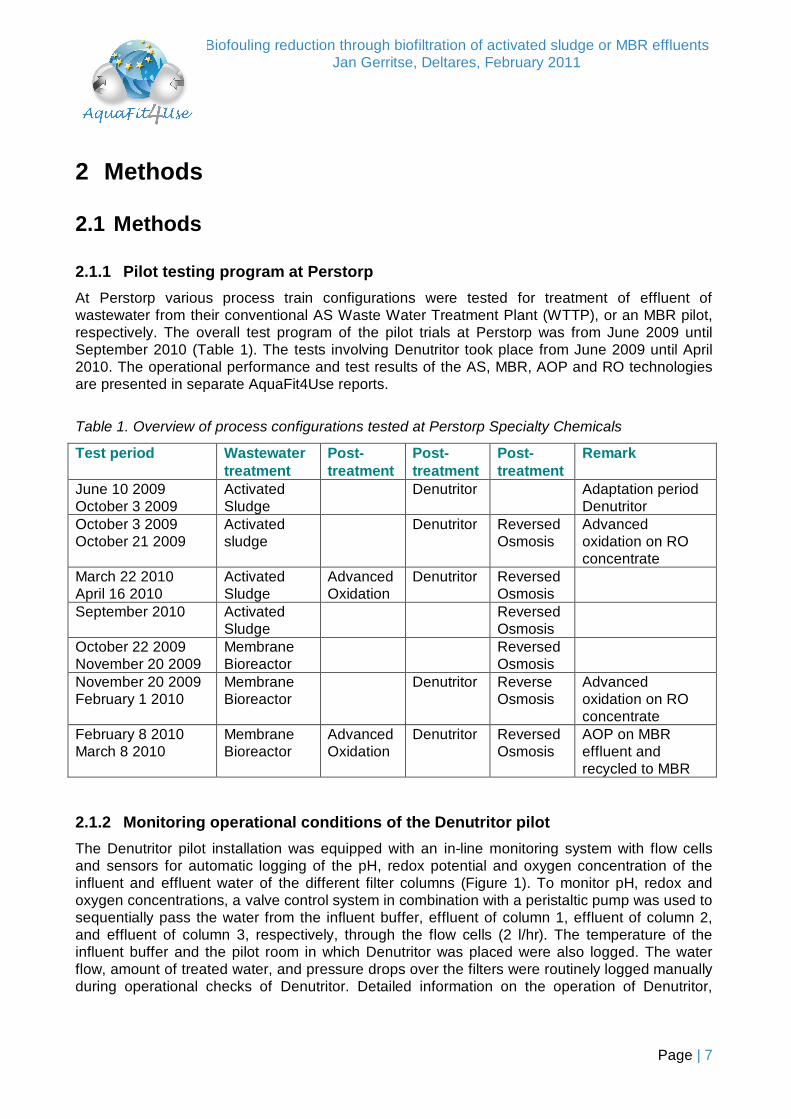
2.1.2 Monitoring operational conditions of the Denutritor pilot The Denutritor pilot installation was equipped with an in-line monitoring system with flow cells and sensors for automatic logging of the pH, redox potential and oxygen concentration of the influent and effluent water of the different filter columns (Figure 1). To monitor pH, redox and oxygen concentrations, a valve control system in combination with a peristaltic pump was used to sequentially pass the water from the influent buffer, effluent of column 1, effluent of column 2, and effluent of column 3, respectively, through the flow cells (2 l/hr). The temperature of the influent buffer and the pilot room in which Denutritor was placed were also logged. The water flow, amount of treated water, and pressure drops over the filters were routinely logged manually during operational checks of Denutritor. Detailed information on the operation of Denutritor,
Biofouling reduction through biofiltration of activated sludge or MBR effluents Jan Gerritse, Deltares, February 2011
Page | 8
monitoring equipment and its calibration can be found in the Denutritor manual (Ter Huurne and Gerritse, 2009).
Sensors
O2, pH, Eh
O2
Biofoulingmonitors
Data logger & equipment
PC for in-line data acquisition
Valve control
unit
Sensors
O2, pH, Eh
O2
Biofoulingmonitors
Data logger & equipment
PC for in-line data acquisition
Valve control
unit
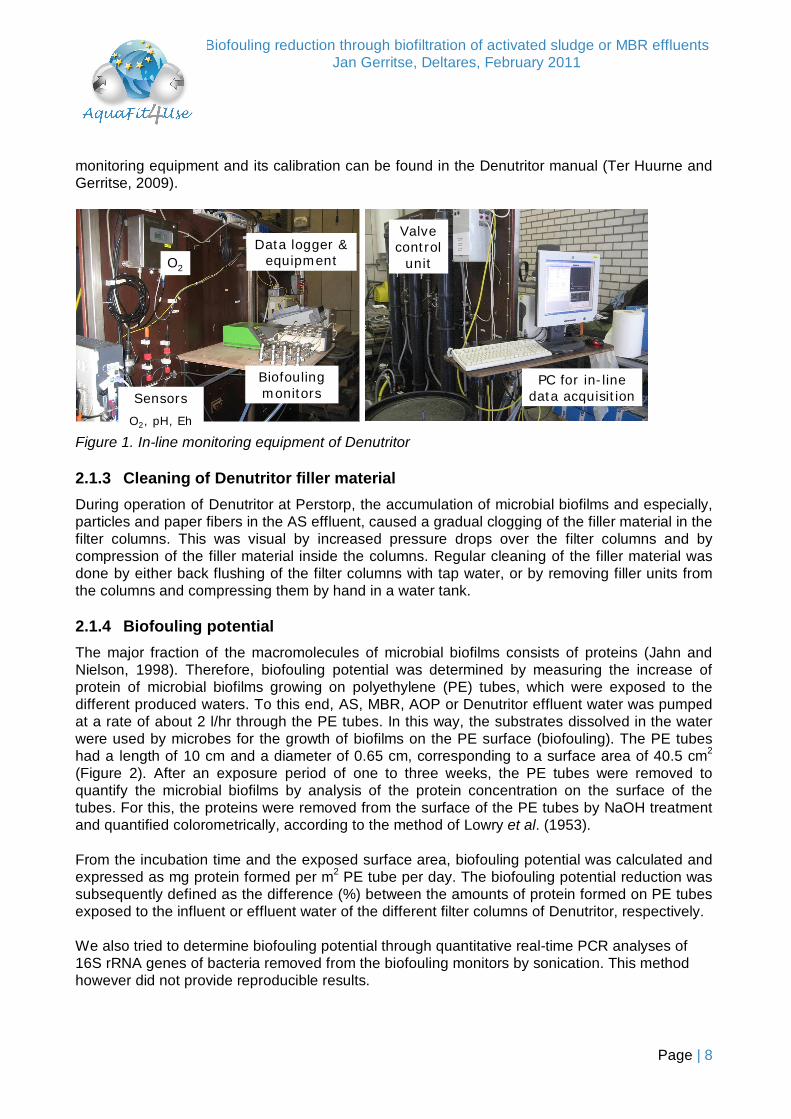
Figure 1. In-line monitoring equipment of Denutritor 2.1.3 Cleaning of Denutritor filler material During operation of Denutritor at Perstorp, the accumulation of microbial biofilms and especially, particles and paper fibers in the AS effluent, caused a gradual clogging of the filler material in the filter columns. This was visual by increased pressure drops over the filter columns and by compression of the filler material inside the columns. Regular cleaning of the filler material was done by either back flushing of the filter columns with tap water, or by removing filler units from the columns and compressing them by hand in a water tank. 2.1.4 Biofouling potential The major fraction of the macromolecules of microbial biofilms consists of proteins (Jahn and Nielson, 1998). Therefore, biofouling potential was determined by measuring the increase of protein of microbial biofilms growing on polyethylene (PE) tubes, which were exposed to the different produced waters. To this end, AS, MBR, AOP or Denutritor effluent water was pumped at a rate of about 2 l/hr through the PE tubes. In this way, the substrates dissolved in the water were used by microbes for the growth of biofilms on the PE surface (biofouling). The PE tubes had a length of 10 cm and a diameter of 0.65 cm, corresponding to a surface area of 40.5 cm2 (Figure 2). After an exposure period of one to three weeks, the PE tubes were removed to quantify the microbial biofilms by analysis of the protein concentration on the surface of the tubes. For this, the proteins were removed from the surface of the PE tubes by NaOH treatment and quantified colorometrically, according to the method of Lowry et al. (1953). From the incubation time and the exposed surface area, biofouling potential was calculated and expressed as mg protein formed per m2 PE tube per day. The biofouling potential reduction was subsequently defined as the difference (%) between the amounts of protein formed on PE tubes exposed to the influent or effluent water of the different filter columns of Denutritor, respectively. We also tried to determine biofouling potential through quantitative real-time PCR analyses of 16S rRNA genes of bacteria removed from the biofouling monitors by sonication. This method however did not provide reproducible results.
Biofouling reduction through biofiltration of activated sludge or MBR effluents Jan Gerritse, Deltares, February 2011
Page | 9
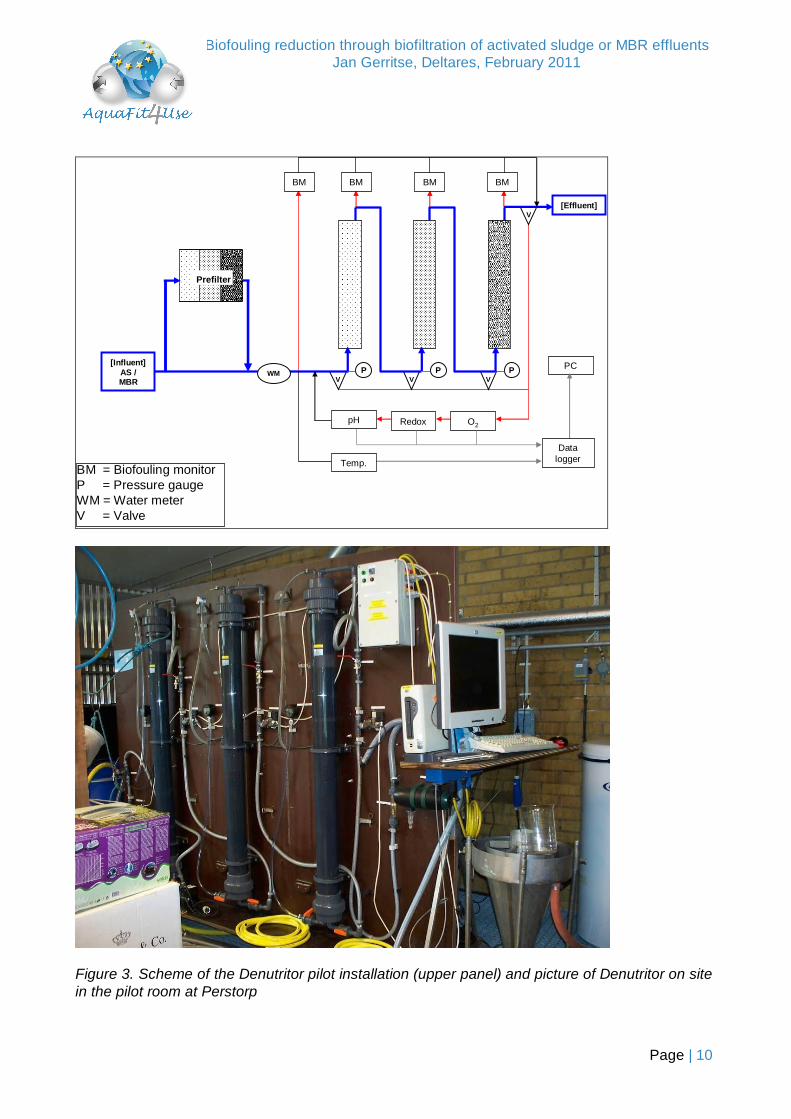
Figure 2. Biofouling monitors constructed from polyethylene tubes and Swage Lock connectors 2.1.5 Analysis of water samples During the pilot tests, water of the influent and effluent of the Denutritor filter columns was sampled frequently, to determine its chemical and microbiological quality. Chemical analyses (TOC, COD, BOD, nitrate-N, total-N and phosphate-P) were done by Perstorp and DHI. Analyses of cultivable aerobic heterotrophic bacteria, coliforms and E. coli were done by Deltares. Fluorescent In Situ Hybridization (FISH) analyses of different microbial groups, including pathogens were done by Vermicon on water samples and on samples of Denutritor filler material. 2.2 Materials and equipment A Denutritor pilot installation was constructed by Deltares/TNO and delivered in June 2009 at Perstorp. The Denutritor pilot installation consists of 3 water filtration columns (Figure 3). Each column has a volume of 12.5 L. The columns are filled with polyurethane (PUR) foams. The filters are connected in series and water is pumped up-flow, sequentially through the first, the second and the third filter column, respectively. The first column is filled with coarse foam elements with large pore sizes and a specific surface area of approximately 200 m2/m3 (Figure 4). This first filter catches the relatively large particles in the water, which reduces the risk of clogging. The second filter contains foam with medium sized pores and a specific surface area of 400 m2/m3. The third filter contains foam with fine pores and an especially large specific surface area of 700 m2/m3. Thus in the third filter there is a large surface area for attachment and growth of microbial biofilms, which can actively remove the last concentrations of growth substrates and nutrients from the treated water.
Biofouling reduction through biofiltration of activated sludge or MBR effluents Jan Gerritse, Deltares, February 2011
Page | 10
PCVVV
BM = Biofouling monitorP = Pressure gaugeWM = Water meterV = Valve
V
P P P
[Effluent]
WM[Influent]
AS /MBR
Redox O2
Data loggerTemp.
BM BM BMBM
pH
Prefilter
Figure 3. Scheme of the Denutritor pilot installation (upper panel) and picture of Denutritor on site in the pilot room at Perstorp
Biofouling reduction through biofiltration of activated sludge or MBR effluents Jan Gerritse, Deltares, February 2011
Page | 11
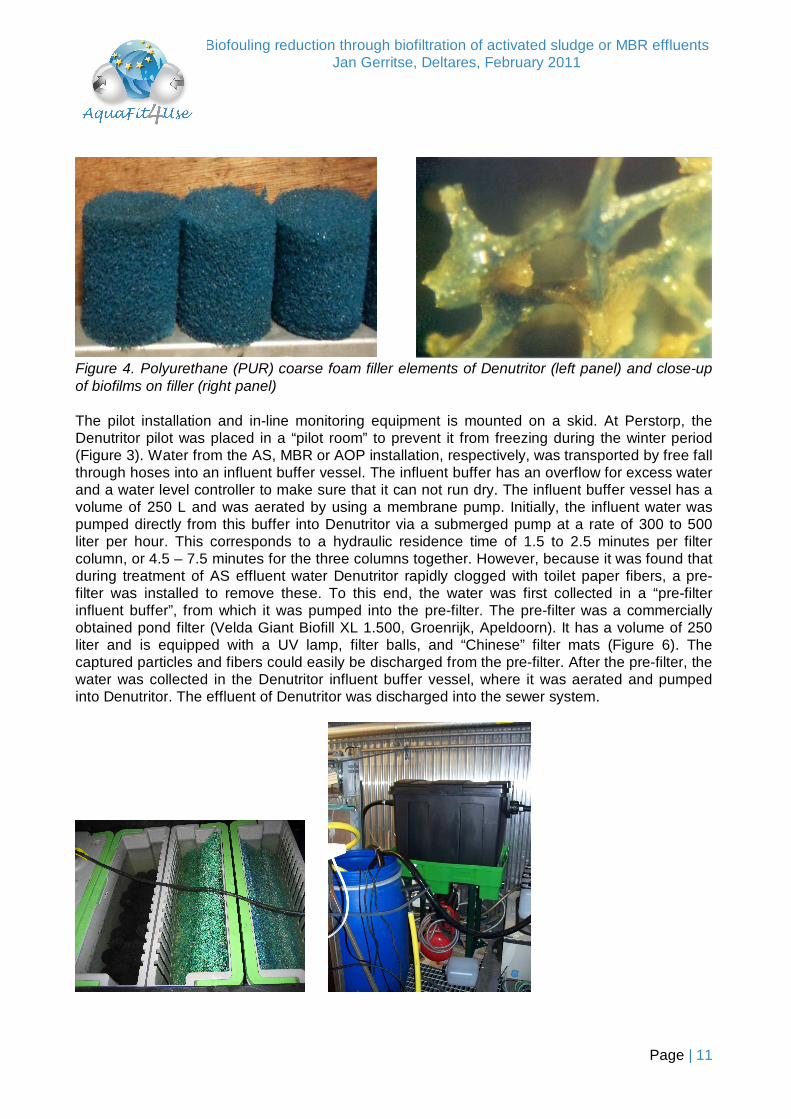
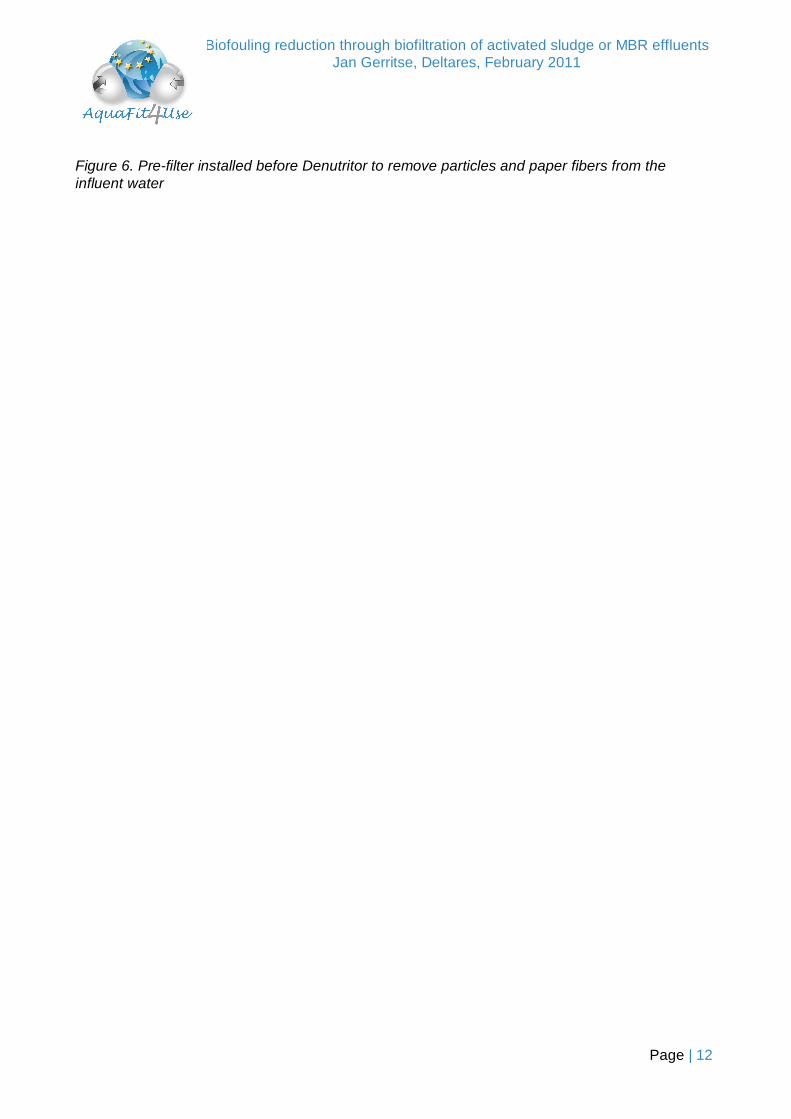
Figure 4. Polyurethane (PUR) coarse foam filler elements of Denutritor (left panel) and close-up of biofilms on filler (right panel) The pilot installation and in-line monitoring equipment is mounted on a skid. At Perstorp, the Denutritor pilot was placed in a “pilot room” to prevent it from freezing during the winter period (Figure 3). Water from the AS, MBR or AOP installation, respectively, was transported by free fall through hoses into an influent buffer vessel. The influent buffer has an overflow for excess water and a water level controller to make sure that it can not run dry. The influent buffer vessel has a volume of 250 L and was aerated by using a membrane pump. Initially, the influent water was pumped directly from this buffer into Denutritor via a submerged pump at a rate of 300 to 500 liter per hour. This corresponds to a hydraulic residence time of 1.5 to 2.5 minutes per filter column, or 4.5 – 7.5 minutes for the three columns together. However, because it was found that during treatment of AS effluent water Denutritor rapidly clogged with toilet paper fibers, a pre-filter was installed to remove these. To this end, the water was first collected in a “pre-filter influent buffer”, from which it was pumped into the pre-filter. The pre-filter was a commercially obtained pond filter (Velda Giant Biofill XL 1.500, Groenrijk, Apeldoorn). It has a volume of 250 liter and is equipped with a UV lamp, filter balls, and “Chinese” filter mats (Figure 6). The captured particles and fibers could easily be discharged from the pre-filter. After the pre-filter, the water was collected in the Denutritor influent buffer vessel, where it was aerated and pumped into Denutritor. The effluent of Denutritor was discharged into the sewer system.
Biofouling reduction through biofiltration of activated sludge or MBR effluents Jan Gerritse, Deltares, February 2011
Page | 12
Figure 6. Pre-filter installed before Denutritor to remove particles and paper fibers from the influent water

Biofouling reduction through biofiltration of activated sludge or MBR effluents Jan Gerritse, Deltares, February 2011
Page | 13
3 Results and achievements 3.1 Major results and achievements A Denutritor pilot installation was constructed and operated for eleven months (June 2009 – April 2010) on effluent from the AS WWTP of Perstorp, or water from the different pilot installations (MBR & AOP). Within this period about 3000 m3 water has been treated. When operated with AS effluent water, Denutritor removed up to 92% of the biofouling potential. There were problems with operation of the installation on AS effluent due to clogging with paper fibres, but these problems were solved by installing a pre-filter. Effluent water from the MBR installation had a five-fold lower biofouling potential than AS effluent water. With MBR effluent no further reduction of biofouling potential by Denutritor was observed. Treatment of AS-effluent by AOP increased the level of easily degradable COD from almost zero to 13-25 mg/l (Kristensen et al., 2011). This resulted in a twenty-fold increase of biofouling potential. Further treatment of AS-AOP effluent by Denutritor reduced its biofouling potential by 91%. Re-use of waste water effluent for major water consuming processes at the Perstorp factory (chemical synthesis, steam production and cooling) could significantly reduce their current intake of drinking water. In addition, re-use would reduce the discharge load (total effluent and TOC) of waste water from the factory, thus reducing environmental impact and cutting costs on discharge permits. The water quality standards recommended for chemicals, polymer and steam production, are very high. Thus additional purification steps are needed for re-using the AS effluent in these processes, such as AOP and RO. Denutritor is useful as post-treatment step to reduce biofouling potential of AS or AS-AOP effluent, and as pre-treatment step in order to protect RO membranes. The quality standards for (feed) water for cooling processes are usually less stringent than for chemicals and steam production. Thus it is likely that re-use of waste water effluent, after treatment to remove organics and salts, is easier within reach in industrial cooling processes. Generally, the water of cooling systems must not contain particles >0.1 mm, fibers, oil or grease, must not nourish the growth of micro-organisms, and must not form inorganic precipitates at the highest operational temperature (AquaFit4Use report I1.2.1.1.). For the production of feed water for cooling systems, AS effluent, treated by Denutritor and RO seems to be a promising alternative. A further cost/benefits analysis, also based on the results of the other technologies tested at Perstorp (MBR, AOP, RO), is needed to assess which process train(s) for waste water re-use is (are) technically and economically feasible in different industrial processes (AquaFit4Use report D5.2.2). 3.2 Technical progress of the work
Biofouling reduction through biofiltration of activated sludge or MBR effluents Jan Gerritse, Deltares, February 2011
Page | 14
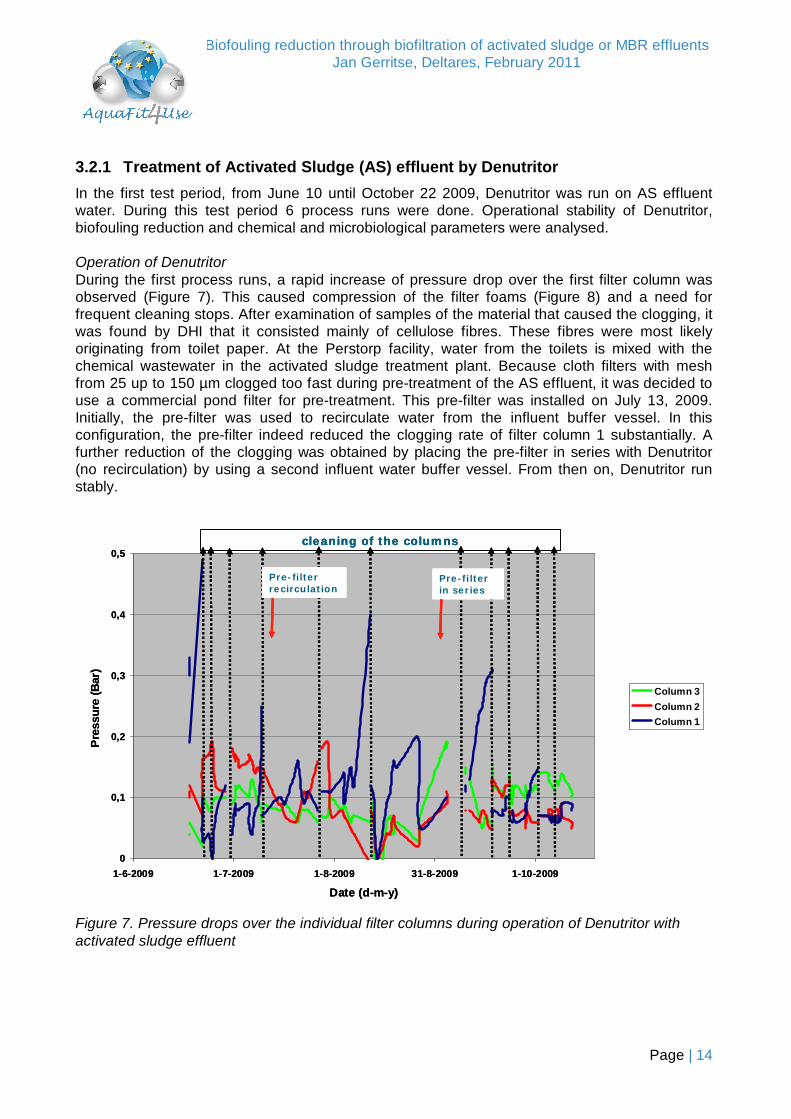
3.2.1 Treatment of Activated Sludge (AS) effluent by Denutritor In the first test period, from June 10 until October 22 2009, Denutritor was run on AS effluent water. During this test period 6 process runs were done. Operational stability of Denutritor, biofouling reduction and chemical and microbiological parameters were analysed. Operation of Denutritor During the first process runs, a rapid increase of pressure drop over the first filter column was observed (Figure 7). This caused compression of the filter foams (Figure 8) and a need for frequent cleaning stops. After examination of samples of the material that caused the clogging, it was found by DHI that it consisted mainly of cellulose fibres. These fibres were most likely originating from toilet paper. At the Perstorp facility, water from the toilets is mixed with the chemical wastewater in the activated sludge treatment plant. Because cloth filters with mesh from 25 up to 150 µm clogged too fast during pre-treatment of the AS effluent, it was decided to use a commercial pond filter for pre-treatment. This pre-filter was installed on July 13, 2009. Initially, the pre-filter was used to recirculate water from the influent buffer vessel. In this configuration, the pre-filter indeed reduced the clogging rate of filter column 1 substantially. A further reduction of the clogging was obtained by placing the pre-filter in series with Denutritor (no recirculation) by using a second influent water buffer vessel. From then on, Denutritor run stably.
0
0,1
0,2
0,3
0,4
0,5
1-6-2009 1-7-2009 1-8-2009 31-8-2009 1-10-2009
Date (d-m-y)
Pres
sure
(Bar
)
Column 3Column 2Column 1
cleaning of the columns
Pre-filter recirculation
Pre-filter in series
0
0,1
0,2
0,3
0,4
0,5
1-6-2009 1-7-2009 1-8-2009 31-8-2009 1-10-2009
Date (d-m-y)
Pres
sure
(Bar
)
Column 3Column 2Column 1
cleaning of the columnscleaning of the columns
Pre-filter recirculation
Pre-filter in series
Pre-filter recirculationPre-filter recirculation
Pre-filter in seriesPre-filter in series
Figure 7. Pressure drops over the individual filter columns during operation of Denutritor with activated sludge effluent

Biofouling reduction through biofiltration of activated sludge or MBR effluents Jan Gerritse, Deltares, February 2011
Page | 15
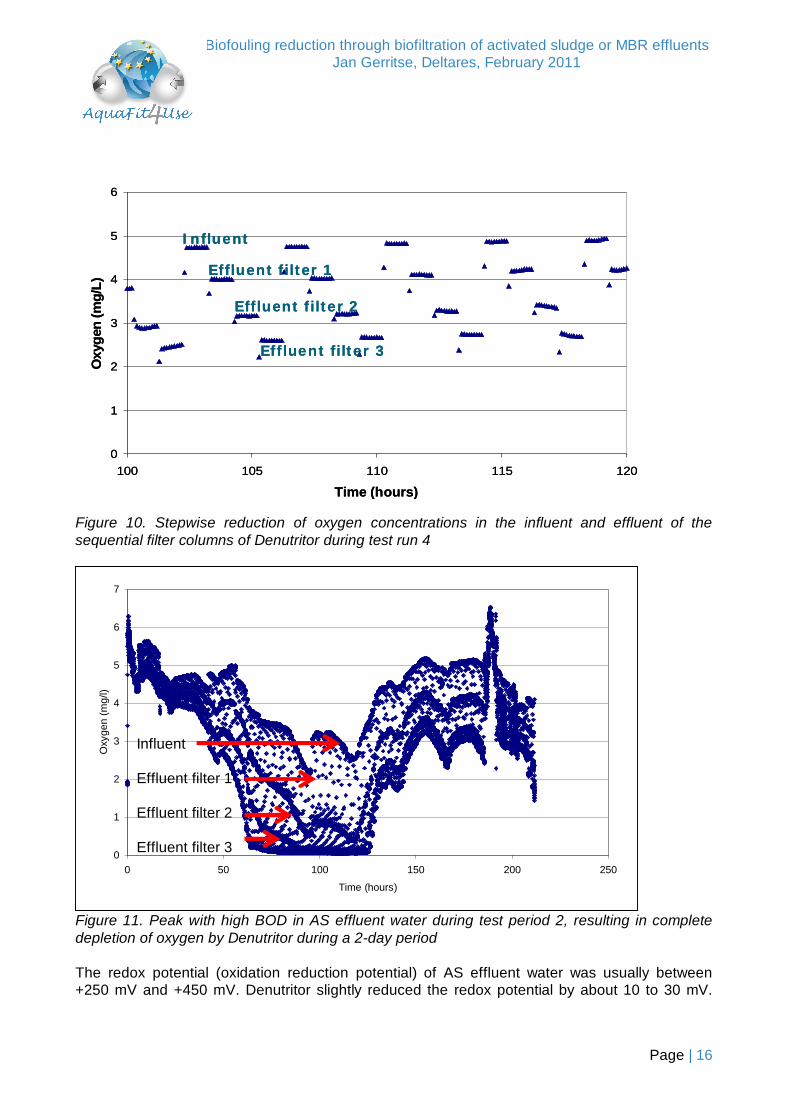
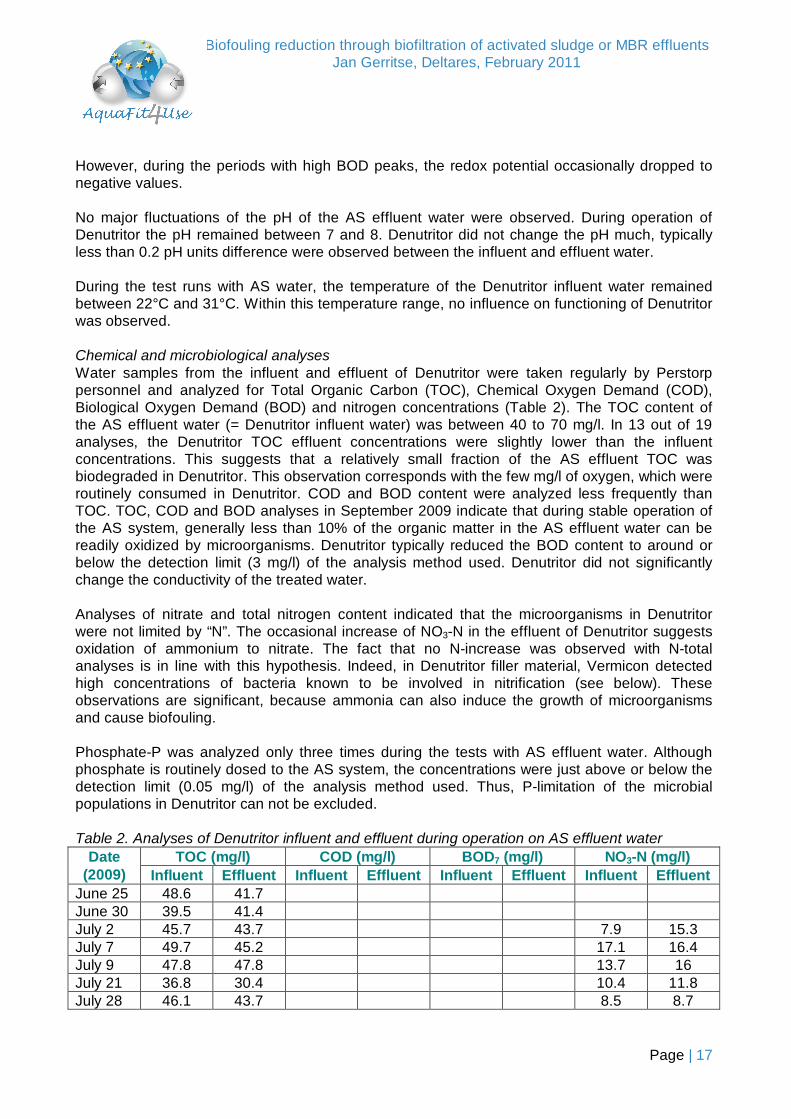
Figure 8. Denutritor filler material, compressed due to clogging with paper fibers In-line monitoring After connection to AS effluent water, the stepwise reduction of the oxygen concentration in the effluent of the sequential filters indicated the activity of the microbial populations in Denutritor within one day (Figure 9). At 15 hours after start-up, the three filter columns together consumed about 0.25 mg/l of oxygen. After adaptation to AS effluent water Denutritor generally consumed between 1 to 2.5 mg/l of oxygen (Figure 10). After cleaning stops the oxygen consumption by Denutritor typically stabilized within a few days. At times, the waste water at Perstorp appeared to have peaks with very high BOD content. This could result in complete depletion of the oxygen by Denutritor (Figure 11).
5,0
5,5
6,0
6,5
7,0
14 15 16 17Time (hours)
Oxy
gen
(mg/
l) influent influent
effluent filter 1
effluent filter 1effluent
filter 2effluent filter 2effluent
filter 3
effluent filter 3
Figure 9. Stepwise reduction of oxygen concentrations in the influent and effluent of the sequential filter columns at 14 to 17 hours after startup of Denutritor
Biofouling reduction through biofiltration of activated sludge or MBR effluents Jan Gerritse, Deltares, February 2011
Page | 16
0
1
2
3
4
5
6
100 105 110 115 120
Time (hours)
Oxy
gen
(mg/
L)
Influent
Effluent filter 1
Effluent filter 2
Effluent filter 3
0
1
2
3
4
5
6
100 105 110 115 120
Time (hours)
Oxy
gen
(mg/
L)
Influent
Effluent filter 1
Effluent filter 2
Effluent filter 3
Figure 10. Stepwise reduction of oxygen concentrations in the influent and effluent of the sequential filter columns of Denutritor during test run 4
0
1
2
3
4
5
6
7
0 50 100 150 200 250
Time (hours)
Oxy
gen
(mg/
l)
Figure 11. Peak with high BOD in AS effluent water during test period 2, resulting in complete depletion of oxygen by Denutritor during a 2-day period The redox potential (oxidation reduction potential) of AS effluent water was usually between +250 mV and +450 mV. Denutritor slightly reduced the redox potential by about 10 to 30 mV.
Influent Effluent filter 1 Effluent filter 2 Effluent filter 3
Biofouling reduction through biofiltration of activated sludge or MBR effluents Jan Gerritse, Deltares, February 2011
Page | 17
However, during the periods with high BOD peaks, the redox potential occasionally dropped to negative values. No major fluctuations of the pH of the AS effluent water were observed. During operation of Denutritor the pH remained between 7 and 8. Denutritor did not change the pH much, typically less than 0.2 pH units difference were observed between the influent and effluent water. During the test runs with AS water, the temperature of the Denutritor influent water remained between 22°C and 31°C. Within this temperature range, no influence on functioning of Denutritor was observed. Chemical and microbiological analyses Water samples from the influent and effluent of Denutritor were taken regularly by Perstorp personnel and analyzed for Total Organic Carbon (TOC), Chemical Oxygen Demand (COD), Biological Oxygen Demand (BOD) and nitrogen concentrations (Table 2). The TOC content of the AS effluent water (= Denutritor influent water) was between 40 to 70 mg/l. In 13 out of 19 analyses, the Denutritor TOC effluent concentrations were slightly lower than the influent concentrations. This suggests that a relatively small fraction of the AS effluent TOC was biodegraded in Denutritor. This observation corresponds with the few mg/l of oxygen, which were routinely consumed in Denutritor. COD and BOD content were analyzed less frequently than TOC. TOC, COD and BOD analyses in September 2009 indicate that during stable operation of the AS system, generally less than 10% of the organic matter in the AS effluent water can be readily oxidized by microorganisms. Denutritor typically reduced the BOD content to around or below the detection limit (3 mg/l) of the analysis method used. Denutritor did not significantly change the conductivity of the treated water. Analyses of nitrate and total nitrogen content indicated that the microorganisms in Denutritor were not limited by “N”. The occasional increase of NO3-N in the effluent of Denutritor suggests oxidation of ammonium to nitrate. The fact that no N-increase was observed with N-total analyses is in line with this hypothesis. Indeed, in Denutritor filler material, Vermicon detected high concentrations of bacteria known to be involved in nitrification (see below). These observations are significant, because ammonia can also induce the growth of microorganisms and cause biofouling. Phosphate-P was analyzed only three times during the tests with AS effluent water. Although phosphate is routinely dosed to the AS system, the concentrations were just above or below the detection limit (0.05 mg/l) of the analysis method used. Thus, P-limitation of the microbial populations in Denutritor can not be excluded. Table 2. Analyses of Denutritor influent and effluent during operation on AS effluent water
TOC (mg/l) COD (mg/l) BOD7 (mg/l) NO3-N (mg/l) Date (2009) Influent Effluent Influent Effluent Influent Effluent Influent Effluent
June 25 48.6 41.7 June 30 39.5 41.4 July 2 45.7 43.7 7.9 15.3 July 7 49.7 45.2 17.1 16.4 July 9 47.8 47.8 13.7 16 July 21 36.8 30.4 10.4 11.8 July 28 46.1 43.7 8.5 8.7
Biofouling reduction through biofiltration of activated sludge or MBR effluents Jan Gerritse, Deltares, February 2011
Page | 18
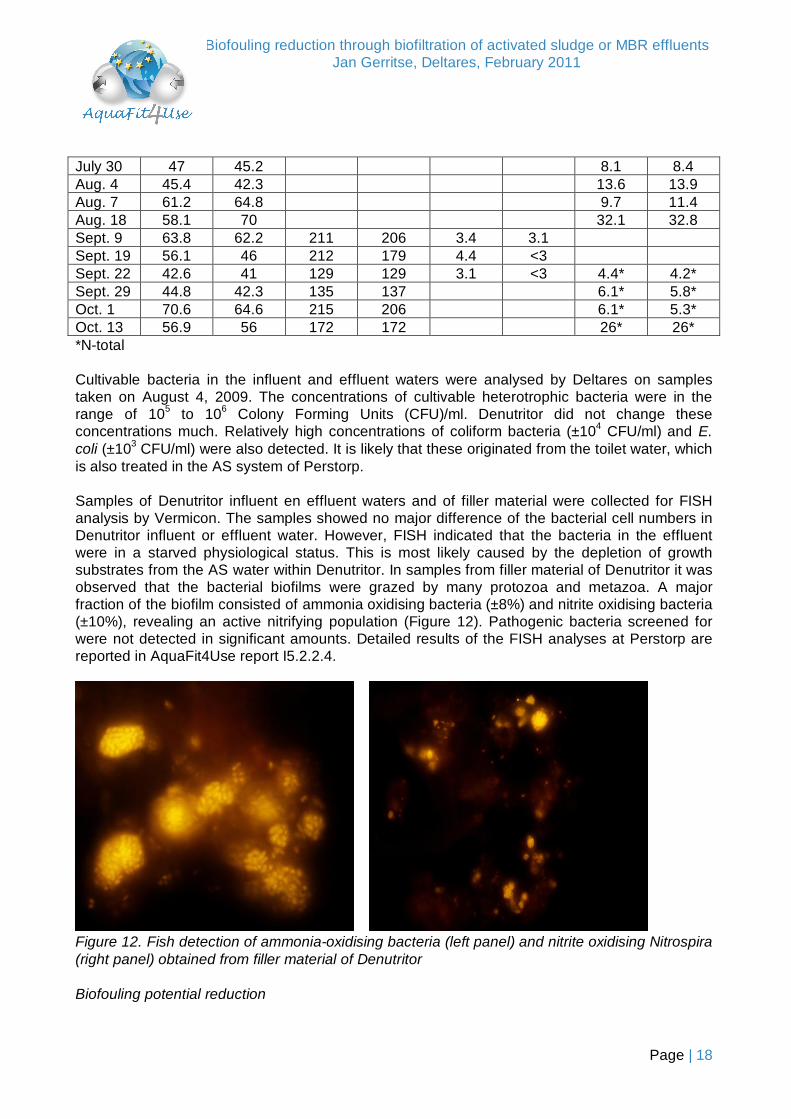
July 30 47 45.2 8.1 8.4 Aug. 4 45.4 42.3 13.6 13.9 Aug. 7 61.2 64.8 9.7 11.4 Aug. 18 58.1 70 32.1 32.8 Sept. 9 63.8 62.2 211 206 3.4 3.1 Sept. 19 56.1 46 212 179 4.4 <3 Sept. 22 42.6 41 129 129 3.1 <3 4.4* 4.2* Sept. 29 44.8 42.3 135 137 6.1* 5.8* Oct. 1 70.6 64.6 215 206 6.1* 5.3* Oct. 13 56.9 56 172 172 26* 26* *N-total Cultivable bacteria in the influent and effluent waters were analysed by Deltares on samples taken on August 4, 2009. The concentrations of cultivable heterotrophic bacteria were in the range of 105 to 106 Colony Forming Units (CFU)/ml. Denutritor did not change these concentrations much. Relatively high concentrations of coliform bacteria (±104 CFU/ml) and E. coli (±103 CFU/ml) were also detected. It is likely that these originated from the toilet water, which is also treated in the AS system of Perstorp. Samples of Denutritor influent en effluent waters and of filler material were collected for FISH analysis by Vermicon. The samples showed no major difference of the bacterial cell numbers in Denutritor influent or effluent water. However, FISH indicated that the bacteria in the effluent were in a starved physiological status. This is most likely caused by the depletion of growth substrates from the AS water within Denutritor. In samples from filler material of Denutritor it was observed that the bacterial biofilms were grazed by many protozoa and metazoa. A major fraction of the biofilm consisted of ammonia oxidising bacteria (±8%) and nitrite oxidising bacteria (±10%), revealing an active nitrifying population (Figure 12). Pathogenic bacteria screened for were not detected in significant amounts. Detailed results of the FISH analyses at Perstorp are reported in AquaFit4Use report I5.2.2.4.
Figure 12. Fish detection of ammonia-oxidising bacteria (left panel) and nitrite oxidising Nitrospira (right panel) obtained from filler material of Denutritor Biofouling potential reduction
Biofouling reduction through biofiltration of activated sludge or MBR effluents Jan Gerritse, Deltares, February 2011
Page | 19
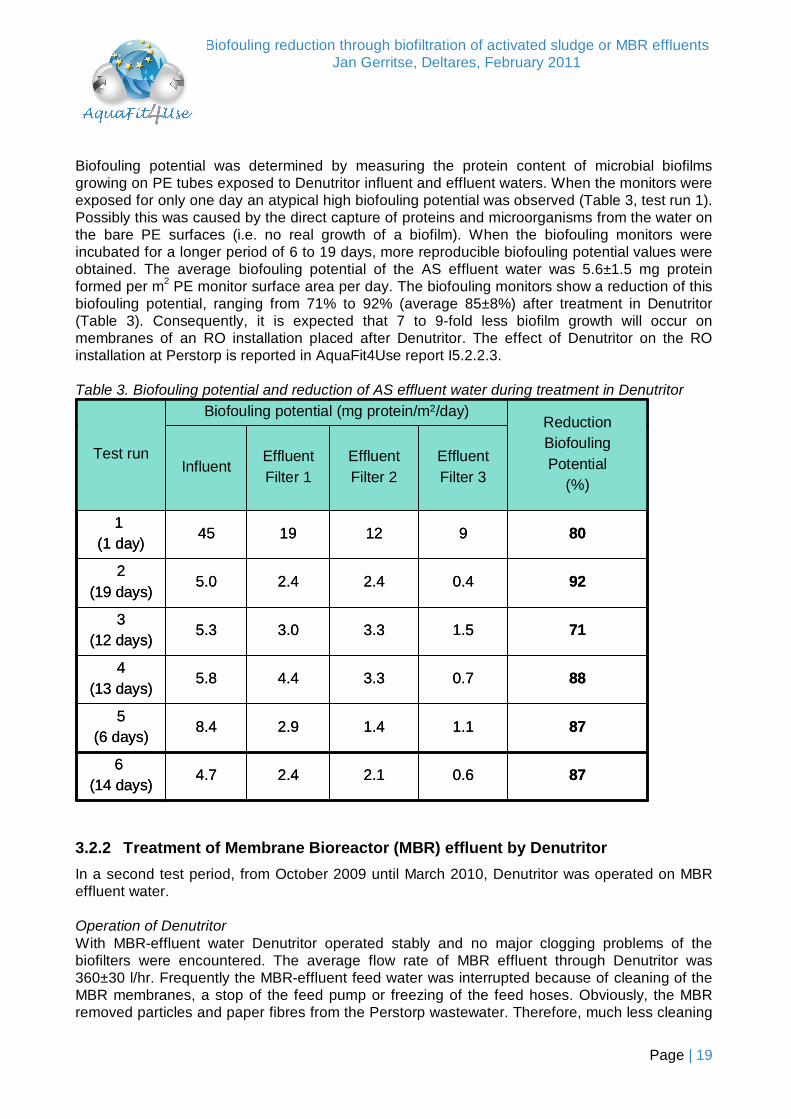
Biofouling potential was determined by measuring the protein content of microbial biofilms growing on PE tubes exposed to Denutritor influent and effluent waters. When the monitors were exposed for only one day an atypical high biofouling potential was observed (Table 3, test run 1). Possibly this was caused by the direct capture of proteins and microorganisms from the water on the bare PE surfaces (i.e. no real growth of a biofilm). When the biofouling monitors were incubated for a longer period of 6 to 19 days, more reproducible biofouling potential values were obtained. The average biofouling potential of the AS effluent water was 5.6±1.5 mg protein formed per m2 PE monitor surface area per day. The biofouling monitors show a reduction of this biofouling potential, ranging from 71% to 92% (average 85±8%) after treatment in Denutritor (Table 3). Consequently, it is expected that 7 to 9-fold less biofilm growth will occur on membranes of an RO installation placed after Denutritor. The effect of Denutritor on the RO installation at Perstorp is reported in AquaFit4Use report I5.2.2.3. Table 3. Biofouling potential and reduction of AS effluent water during treatment in Denutritor
Test run
Biofouling potential (mg protein/m2/day)ReductionBiofoulingPotential
(%)Influent
EffluentFilter 1
EffluentFilter 2
EffluentFilter 3
1 (1 day)
45 19 12 9 80
2(19 days)
5.0 2.4 2.4 0.4 92
3(12 days)
5.3 3.0 3.3 1.5 71
4(13 days)
5.8 4.4 3.3 0.7 88
5(6 days)
8.4 2.9 1.4 1.1 87
6 (14 days)
4.7 2.4 2.1 0.6 87
3.2.2 Treatment of Membrane Bioreactor (MBR) effluent by Denutritor In a second test period, from October 2009 until March 2010, Denutritor was operated on MBR effluent water. Operation of Denutritor With MBR-effluent water Denutritor operated stably and no major clogging problems of the biofilters were encountered. The average flow rate of MBR effluent through Denutritor was 360±30 l/hr. Frequently the MBR-effluent feed water was interrupted because of cleaning of the MBR membranes, a stop of the feed pump or freezing of the feed hoses. Obviously, the MBR removed particles and paper fibres from the Perstorp wastewater. Therefore, much less cleaning
Biofouling reduction through biofiltration of activated sludge or MBR effluents Jan Gerritse, Deltares, February 2011
Page | 20
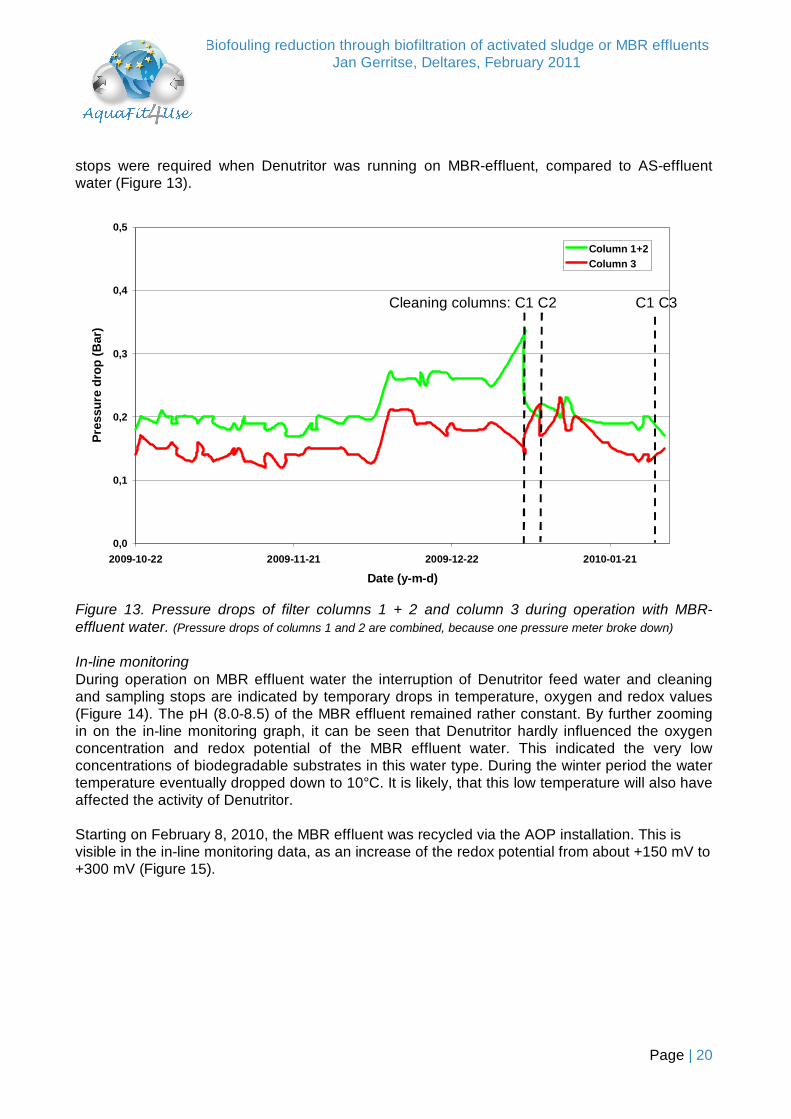
stops were required when Denutritor was running on MBR-effluent, compared to AS-effluent water (Figure 13).
0,0
0,1
0,2
0,3
0,4
0,5
2009-10-22 2009-11-21 2009-12-22 2010-01-21
Date (y-m-d)
Pres
sure
dro
p (B
ar)
Column 1+2Column 3
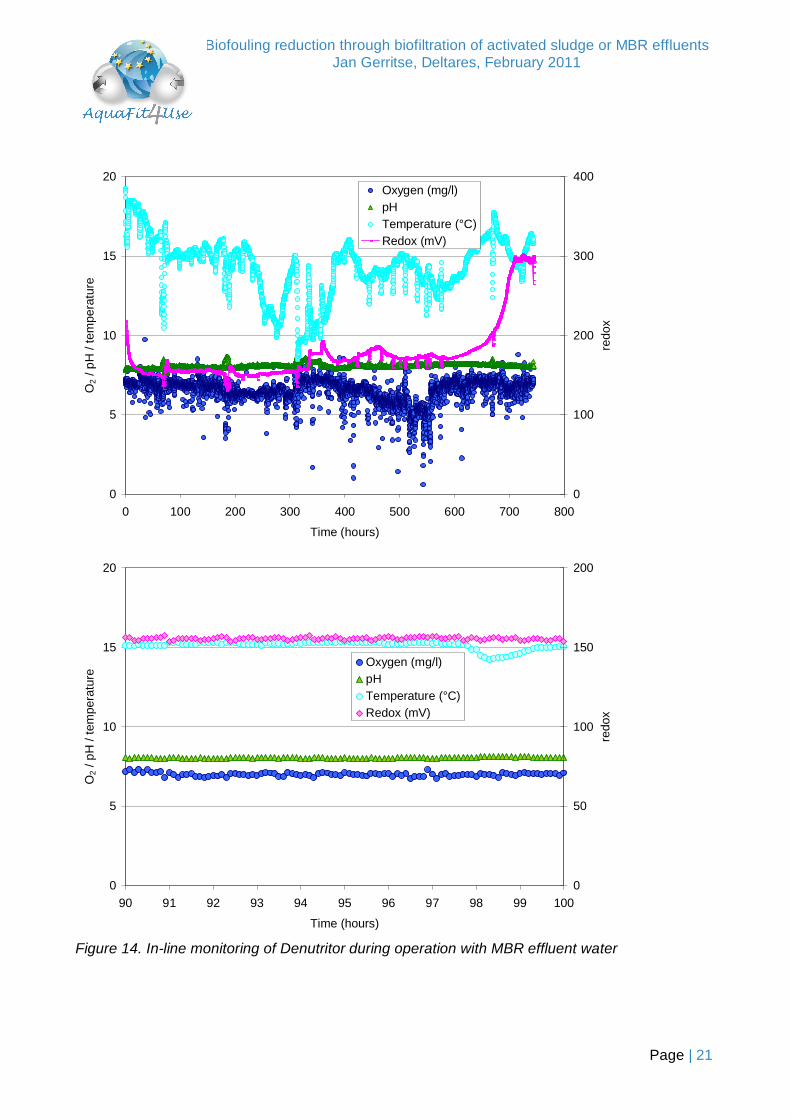
Figure 13. Pressure drops of filter columns 1 + 2 and column 3 during operation with MBR-effluent water. (Pressure drops of columns 1 and 2 are combined, because one pressure meter broke down) In-line monitoring During operation on MBR effluent water the interruption of Denutritor feed water and cleaning and sampling stops are indicated by temporary drops in temperature, oxygen and redox values (Figure 14). The pH (8.0-8.5) of the MBR effluent remained rather constant. By further zooming in on the in-line monitoring graph, it can be seen that Denutritor hardly influenced the oxygen concentration and redox potential of the MBR effluent water. This indicated the very low concentrations of biodegradable substrates in this water type. During the winter period the water temperature eventually dropped down to 10°C. It is likely, that this low temperature will also have affected the activity of Denutritor. Starting on February 8, 2010, the MBR effluent was recycled via the AOP installation. This is visible in the in-line monitoring data, as an increase of the redox potential from about +150 mV to +300 mV (Figure 15).
Cleaning columns: C1 C2 C1 C3
Biofouling reduction through biofiltration of activated sludge or MBR effluents Jan Gerritse, Deltares, February 2011
Page | 21
0
5
10
15
20
0 100 200 300 400 500 600 700 800
Time (hours)
O2 /
pH
/ te
mpe
ratu
re
0
100
200
300
400
redo
x
Oxygen (mg/l)pHTemperature (°C)Redox (mV)
0
5
10
15
20
90 91 92 93 94 95 96 97 98 99 100
Time (hours)
O2 /
pH
/ te
mpe
ratu
re
0
50
100
150
200
redo
x
Oxygen (mg/l)pHTemperature (°C)Redox (mV)
Figure 14. In-line monitoring of Denutritor during operation with MBR effluent water
Biofouling reduction through biofiltration of activated sludge or MBR effluents Jan Gerritse, Deltares, February 2011
Page | 22
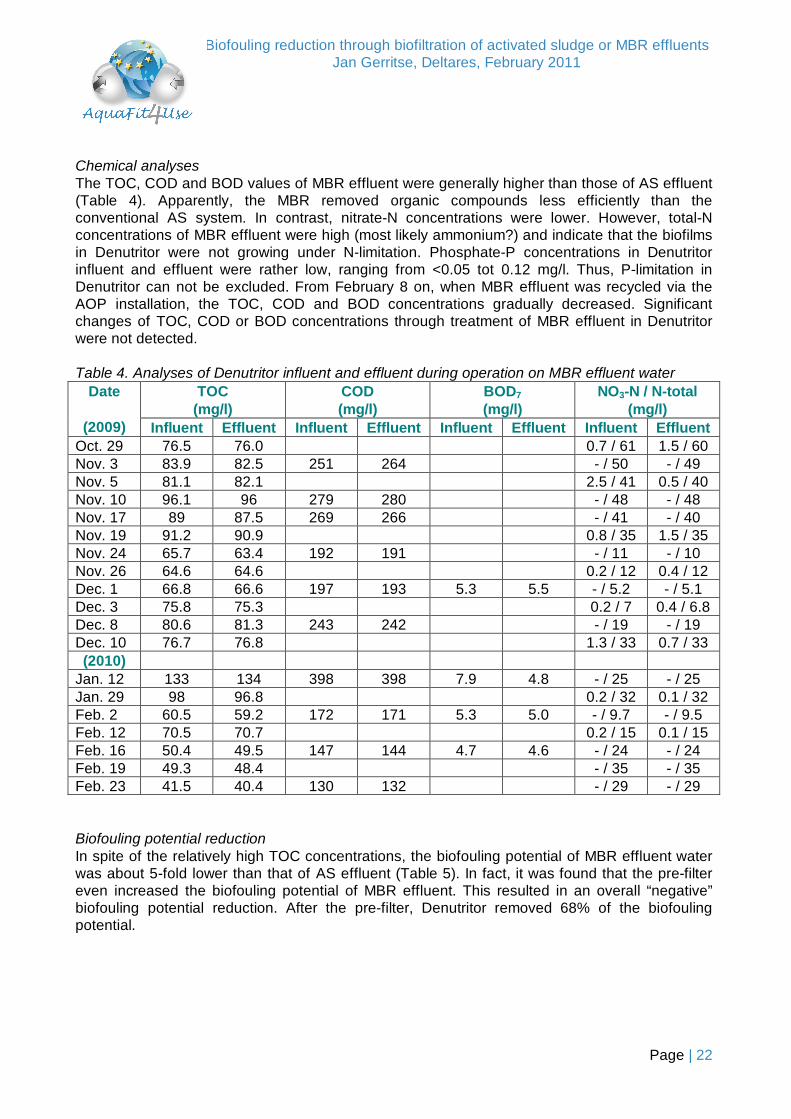
Chemical analyses The TOC, COD and BOD values of MBR effluent were generally higher than those of AS effluent (Table 4). Apparently, the MBR removed organic compounds less efficiently than the conventional AS system. In contrast, nitrate-N concentrations were lower. However, total-N concentrations of MBR effluent were high (most likely ammonium?) and indicate that the biofilms in Denutritor were not growing under N-limitation. Phosphate-P concentrations in Denutritor influent and effluent were rather low, ranging from <0.05 tot 0.12 mg/l. Thus, P-limitation in Denutritor can not be excluded. From February 8 on, when MBR effluent was recycled via the AOP installation, the TOC, COD and BOD concentrations gradually decreased. Significant changes of TOC, COD or BOD concentrations through treatment of MBR effluent in Denutritor were not detected. Table 4. Analyses of Denutritor influent and effluent during operation on MBR effluent water
TOC (mg/l)
COD (mg/l)
BOD7 (mg/l)
NO3-N / N-total (mg/l)
Date
(2009) Influent Effluent Influent Effluent Influent Effluent Influent Effluent Oct. 29 76.5 76.0 0.7 / 61 1.5 / 60 Nov. 3 83.9 82.5 251 264 - / 50 - / 49 Nov. 5 81.1 82.1 2.5 / 41 0.5 / 40 Nov. 10 96.1 96 279 280 - / 48 - / 48 Nov. 17 89 87.5 269 266 - / 41 - / 40 Nov. 19 91.2 90.9 0.8 / 35 1.5 / 35 Nov. 24 65.7 63.4 192 191 - / 11 - / 10 Nov. 26 64.6 64.6 0.2 / 12 0.4 / 12 Dec. 1 66.8 66.6 197 193 5.3 5.5 - / 5.2 - / 5.1 Dec. 3 75.8 75.3 0.2 / 7 0.4 / 6.8 Dec. 8 80.6 81.3 243 242 - / 19 - / 19 Dec. 10 76.7 76.8 1.3 / 33 0.7 / 33 (2010)
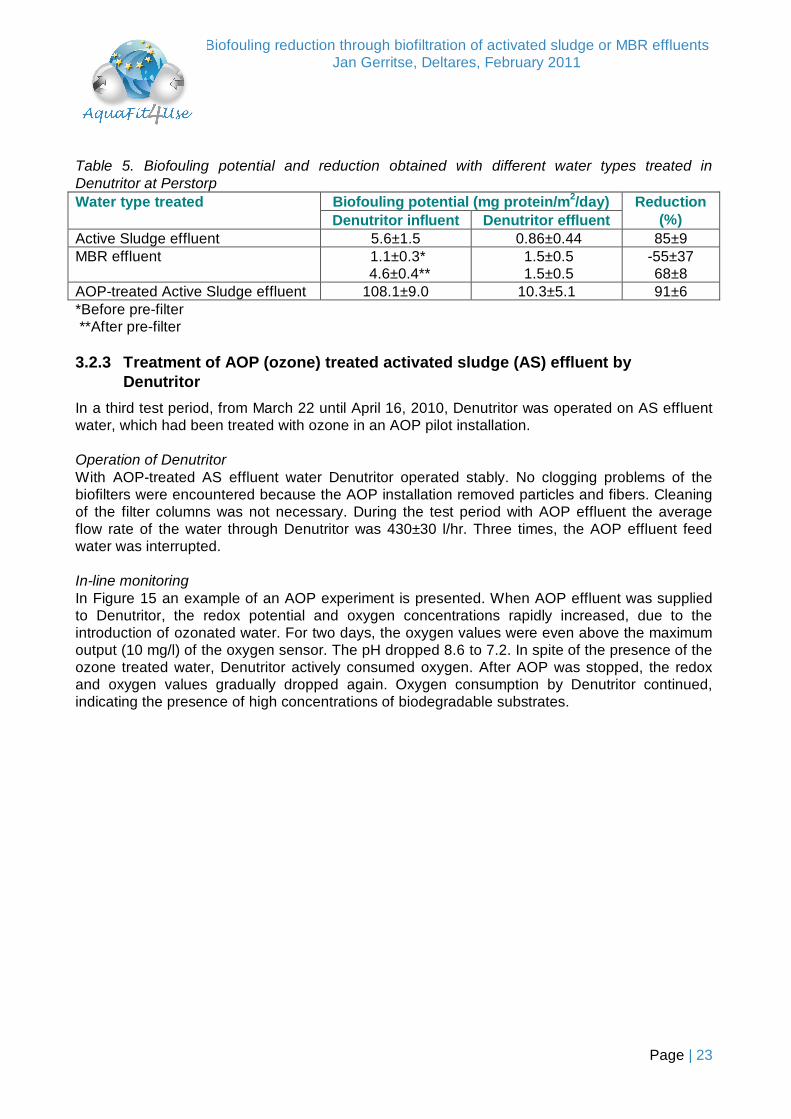
Jan. 12 133 134 398 398 7.9 4.8 - / 25 - / 25 Jan. 29 98 96.8 0.2 / 32 0.1 / 32 Feb. 2 60.5 59.2 172 171 5.3 5.0 - / 9.7 - / 9.5 Feb. 12 70.5 70.7 0.2 / 15 0.1 / 15 Feb. 16 50.4 49.5 147 144 4.7 4.6 - / 24 - / 24 Feb. 19 49.3 48.4 - / 35 - / 35 Feb. 23 41.5 40.4 130 132 - / 29 - / 29 Biofouling potential reduction In spite of the relatively high TOC concentrations, the biofouling potential of MBR effluent water was about 5-fold lower than that of AS effluent (Table 5). In fact, it was found that the pre-filter even increased the biofouling potential of MBR effluent. This resulted in an overall “negative” biofouling potential reduction. After the pre-filter, Denutritor removed 68% of the biofouling potential.
Biofouling reduction through biofiltration of activated sludge or MBR effluents Jan Gerritse, Deltares, February 2011
Page | 23
Table 5. Biofouling potential and reduction obtained with different water types treated in Denutritor at Perstorp
Biofouling potential (mg protein/m2/day) Water type treated Denutritor influent Denutritor effluent
Reduction (%)
Active Sludge effluent 5.6±1.5 0.86±0.44 85±9 MBR effluent 1.1±0.3*
4.6±0.4** 1.5±0.5 1.5±0.5
-55±37 68±8
AOP-treated Active Sludge effluent 108.1±9.0 10.3±5.1 91±6 *Before pre-filter **After pre-filter 3.2.3 Treatment of AOP (ozone) treated activated sludge (AS) effluent by
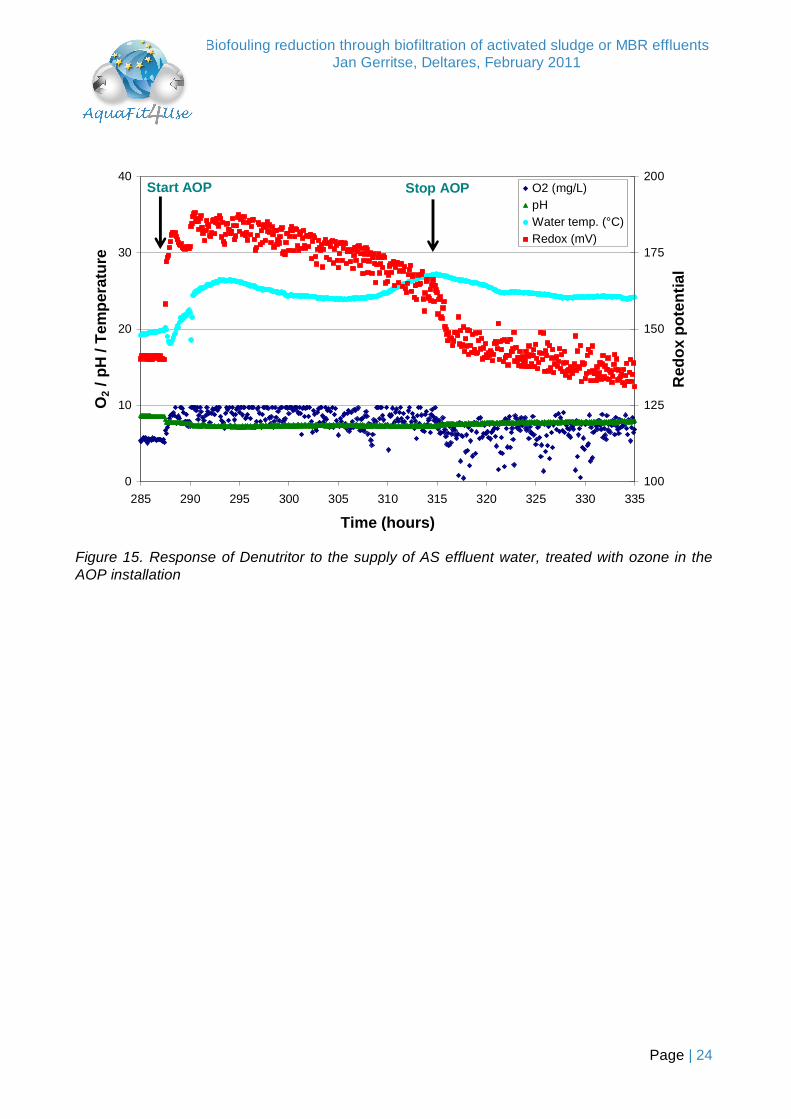
Denutritor In a third test period, from March 22 until April 16, 2010, Denutritor was operated on AS effluent water, which had been treated with ozone in an AOP pilot installation. Operation of Denutritor With AOP-treated AS effluent water Denutritor operated stably. No clogging problems of the biofilters were encountered because the AOP installation removed particles and fibers. Cleaning of the filter columns was not necessary. During the test period with AOP effluent the average flow rate of the water through Denutritor was 430±30 l/hr. Three times, the AOP effluent feed water was interrupted. In-line monitoring In Figure 15 an example of an AOP experiment is presented. When AOP effluent was supplied to Denutritor, the redox potential and oxygen concentrations rapidly increased, due to the introduction of ozonated water. For two days, the oxygen values were even above the maximum output (10 mg/l) of the oxygen sensor. The pH dropped 8.6 to 7.2. In spite of the presence of the ozone treated water, Denutritor actively consumed oxygen. After AOP was stopped, the redox and oxygen values gradually dropped again. Oxygen consumption by Denutritor continued, indicating the presence of high concentrations of biodegradable substrates.
Biofouling reduction through biofiltration of activated sludge or MBR effluents Jan Gerritse, Deltares, February 2011
Page | 24
0
10
20
30
40
285 290 295 300 305 310 315 320 325 330 335
Time (hours)
O2 /
pH
/ Te
mpe
ratu
re
100
125
150
175
200
Red
ox p
oten
tial
O2 (mg/L)pHWater temp. (°C)Redox (mV)
Start AOP Stop AOP
Figure 15. Response of Denutritor to the supply of AS effluent water, treated with ozone in the AOP installation
Biofouling reduction through biofiltration of activated sludge or MBR effluents Jan Gerritse, Deltares, February 2011
Page | 25
Chemical analyses During the test period, AOP-treatment reduced the TOC concentration of AS effluent water by 25±8 mg/l, corresponding to 38±9%. After adaptation, Denutritor reduced the TOC concentration of the AOP effluent water by 6.5±1.0 mg/l (Table 6). This corresponds to an additional 25±4% TOC reduction. This TOC reduction, in combination with the relatively high oxygen consumption by Denutritor, indicates that AOP created relatively high concentrations of biodegradable substrates. Table 6. Analyses of Denutritor influent and effluent water during operation on AOP-treated AS effluent water
TOC (mg/l) COD (mg/l) N-total (mg/l) Date (2010) Influent Effluent Influent Effluent Influent Effluent
March 31 72.9 70.3 17 16
April 9 31.4 8.6 April 14 26 18.2 56 9.8 9.9 April 15 22.5 17.2 12 13 April 16 29.7 23.3 77.6 52.1 12 12 Biofouling potential reduction The biofouling potential of AOP-treated AS effluent water was about 20-fold higher than that of untreated AS effluent (Table 5). This is in line with the generation of high concentrations of biodegradable substrates by AOP. Denutritor accomplished a 10-fold reduction of the biofouling potential of AOP effluent. But still, with AOP feed water, the Denutritor effluent had a ten times higher biofouling potential than with water without AOP treatment. It can be concluded that a larger Denutritor biofilter, or operation with longer HRT, is required to obtain acceptable low biofouling potential of ozone-treated AS effluent water. 3.2.4 Evaluation of water production versus water quality needs At Perstorp Specialty Chemicals, the major uses of water are:
Process water for the production of organic monomers and polymer chemicals, Water for the production of steam, Water used in cooling towers.
Currently, water of drinking quality, produced by the water treatment plant of Perstorp is used as influent of the factory. Re-use of waste water effluent of the Perstorp factory in their major water consuming industrial processes could significantly reduce the intake of drinking water. In addition, re-use would reduce the effluent load (amount of water and TOC) of waste water from the factory, thus reducing environmental impact and cutting costs on discharge permits. The water quality required for the core processes at Perstorp, chemicals and polymer production, is relatively high (Helsen et al., 2010). Low salts (conductivity <500 µS/cm) and TOC concentrations (<5 ppm) certainly require additional purification steps for re-use as process water of AS effluent, such as AOP reversed osmosis (RO). Denutritor itself is not able to reach such low salts and TOC concentrations, but is useful as pretreatment step to reduce biofouling potential of AS or AOP effluent in order to protect, for example RO membranes (AquaFit4Use report I1.2.1.1). Perhaps the alternative treatment train MBR-RO is sufficient to reach the required water quality standards (AquaFit4Use report D 5.2.2).
Biofouling reduction through biofiltration of activated sludge or MBR effluents Jan Gerritse, Deltares, February 2011
Page | 26
Water quality standards for steam production are also quite stringent. The recommended feed water limits for operation of low drum pressure tube boilers are <1 ppm TOC and a conductivity <5400 µS/cm (AquaFit4Use report I1.2.1.1). Especially the low TOC concentration will be difficult to reach with WWTP effluents. The quality standards for (feed) water for cooling processes are usually less stringent than for chemicals and steam production. Thus it is likely that re-use of waste water effluent in industrial cooling processes is easier within reach. Generally, the water of cooling systems must: not contain particles >0.1 mm, fibers, oil or grease; not nourish the growth of micro-organisms; not form inorganic precipitates at the highest operational temperature (AquaFit4Use report I1.2.1.1.). For the production of feed water for cooling systems, AS effluent, treated by Denutritor and RO seems to be a promising alternative. Although TOC concentrations may be above “traditional” standards, the TOC is hardly available as a substrate for microbial growth and biofouling in the cooling system. The microbiological and chemical quality of the cooling water can further be enhanced by planning a Denutritor-like biofiltration system in the recirculating cooling water itself (Microweb configuration; Meesters et al., 2006). A further cost/benefits analysis, also based on the results of the other technologies tested (MBR, AOP, RO), is needed to assess which process train(s) for waste water re-use is (are) technically and economically most feasible in different industrial processes (AquaFit4Use report D5.2.2).

Biofouling reduction through biofiltration of activated sludge or MBR effluents Jan Gerritse, Deltares, February 2011
Page | 27
4 Conclusions 4.1 Major achievements
A pilot Denutritor installation was constructed and installed at Perstorp facilities. For eleven months (June 2009 – April 2010), the Denutritor pilot has been operated on
effluent from the AS WWTP of Perstorp, or water from the MBR pilot or AOP pilot. Within this period operational problems (e.g. clogging with paper fibres) were solved and about 3000 m3 water has been treated.
When operated with AS effluent water, Denutritor removed up to 92% of the biofouling potential.
With effluent water from the MBR installation, a five-fold lower biofouling potential was measured than with AS effluent water. With MBR effluent there was no significant further reduction of biofouling potential by Denutritor.
With AOP treated AS-effluent water a 20-fold increase of biofouling potential was measured. Treatment of AS-AOP effluents by Denutritor reduced its biofouling potential up to 91%.
4.2 Future work
Demonstrate Denutritor on pilot and full-scale in different industrial water systems, in collaboration with a constructor of water treatment equipment and end-users.
Biofouling reduction through biofiltration of activated sludge or MBR effluents Jan Gerritse, Deltares, February 2011
Page | 28
5 Literature Brouwer, H., Meesters, K., Van Groenestijn, J. 2006. Biofouling control in reverse osmosis membranes using rapid biofiltration technology. Desalination 199:15-17 Daamen, E.J., Wouters, J.W., Savelkoul, J.T.G. 2000. Side stream biofiltration for improved biofouling control in cooling water systems. Water Science and Technology 41(4-5)445-451 Flemming, H-C., Griebe, T., Schaule, G. 1996. Antifouling strategies in technical systems – a short review. Water Science and Technology 34:517-524 Gerritse, J., Ballerstedt, H., Meesters, K.P.H., Van der Zaan, B.M., Van Groenesteijn, J.W., 2003. Biofouling reduction in recirculating cooling water systems through water treatment in Microweb biofilters. TNO-report R 2003/503 Griebe, T., Flemming, H.-C. 1998. Biocide-free antifouling strategy to protect RO membranes from biofouling. Desalination 118:153-156 Helsen, J. et al. 2010. Water quality demands in paper, chemical, food and textile companies. Aquafit4Use, I1.2.2.1 Hu, J.Y., Song, L.F., Ong, S.L., Phua, E.T., Ng, W.J. 2005. Biofiltration pretreatment for reverse osmosis (RO) membrane in a water reclamation system. Chemosphere 59:127-133 Jahn, A., Nielson, P.H. 1998. Cell biomass and exopolymer composition in sewer biofilms. Water Science and Technology 37(1):17-24 Kristensen, G.H., JØrgensen, P.E., Birch, H., Van Staveren, P., De Wever, H., Huiskens, C., Beimfohr, C., Gerritse, J., Lengden, G. 2011. Preferred conditions for producing reusable water from effluent from biological treatment. AquaFit4Use I5.2.2.1 Lowrey, O.H., Rosenbrough, N.J., Farr, A.L., Randall, R.J. 1951. Protein measurements with Folin phenol reagent. Journal of Biological Chemistry. 193:265-275 Meesters, K.P.H., Van Groenesteijn, J.W., Gerritse, J. 2003. Biofouling reduction in recirculating cooling systems through biofiltration of process water. Water Research 37:525-532 Meesters, K.P.H., Gerritse, J., Van Groenesteijn, J.W., 2006. Prevention of biofouling in cooling water systems using Microweb; tests at a Henkel site. TNO-report KvL-A R 2006/005 Pang, C.M., Liu, W.-T. 2000. Biological filtration limits carbon availability and affects downstream biofilm formation and community structure. Applied and Environmental Microbiology 72(9):5702-5712 Ter Huurne, P., Gerritse, J. 2009. Denutritor Manual. Van der Zaan, B.M., Ter Huurne, P., Gerritse, J. 2010. Applicability of Denutritor for biofouling prevention on different industrial water qualities. AquaFit4Use I3.2.1.1.
Biofouling reduction through biofiltration of activated sludge or MBR effluents Jan Gerritse, Deltares, February 2011
Page | 29
Walker, J., Surman, S., Jass, J. eds. 2000. Industrial Biofouling – Detection, Prevention and Control. John Wiley & Sons, LTD, Chicester Wend, C.F., Stewart, P.S., Jones, W., Camper, A.K. 2003. Pretreatment for membrane water treatment systems: a laboratory study. Water Research 37:3367-3378


![RESET CLUTEX-AquaFit4Use v2 [Sola lettura]](https://img.dokumen.tips/doc/110x75/62afacaf1908a34ecb2a7a7a/reset-clutex-aquafit4use-v2-sola-lettura.jpg)