Embed Size (px)
Citation preview
BIOASSAY-GUIDED FRACTIONATION TO ISOLATE
COMPOUNDS OF ONION (ALLIUM CEPA L.) AFFECTING
BONE RESORPTION
Inauguraldissertation
zur
Erlangung der Würde eines Doktors der Philosophie
vorgelegt der
Philosophisch-Naturwissenschaftlichen Fakultät
der Universität Basel
von
Herbert Alexander Wetli
aus Oberwil-Lieli (AG)
Basel, 2004
II
Genehmigt von der Philosophisch-Naturwissenschaftlichen Fakultät
auf Antrag von
Herr Prof. Dr. Rudolf Brenneisen, Herr Prof. Dr. Stephan Krähenbühl, und Herr Prof. Dr.
Beat Meier
Basel, den 20. Januar 2004
Prof. Dr. Marcel Tanner
Dekan
III
Acknowledgements
This work was carried out at the Department of Clinical Research, University of Bern.
I would like to thank Prof. Rudolf Brenneisen and Dr. h.c. Roman Mühlbauer for providing
me with the working facilities and for their guidance and support. Special thanks are due to
Ingrid Tschudi, who performed all the in vitro experiments. I also wish to express my
gratitude to Dr. Thomas Sprang and Prof. Peter Bigler for assessing and interpreting the NMR
spectra, Dr. Stefan Schürch for performing the ESI-MS-MS measurements and Dr. Martin
Shaw from the New Zealand Institute for Crop & Food Research for providing us with a
reference sample for the structure elucidation experiments. Thanks are also due to Michael
Staub for developing a method to extract specifically the flavonoids from onion.
Great thanks are due to all the group members of the Laboratory of Phytopharmacology,
Bioanalytics & Pharmacokinetics and the Bone Biology Group for their help and the pleasant
working atmosphere.
Finally I wish to express my warmest and deepest gratitude to my family as well for their
support as for their patience during this work.
IV
Contents
Summary 1
Zusammenfassung 2
1 Introduction 4
1.1 Allium cepa L. (onion) 4
1.1.1 Systematics and distribution of Allium cepa L. 4
1.1.2 Chemistry of Allium cepa L. 6
1.1.3 Medicinal use of Allium cepa L. 9
1.1.3.1 Allium cepa L. in the traditional folk medicine 9
1.1.3.2 Current pharmacology of Allium cepa L. 10
1.2 Biology of the bone 11
1.2.1 Function, structure and composition of the bone 11
1.2.1.1 Bone formation and bone resorption 11
1.2.1.2 The osteoclast - the bone resorbing cell 12
1.2.2 Osteoporosis 13
1.2.2.1 Current pharmacological treatment of osteoporosis 14
1.2.2.2 Current opinions in nutrition and osteoporosis 15
2 Aim of this work 17
3 Results 18
3.1 Experimental background 18
3.2 Bioassay-guided fractionation 23
3.2.1 Fractionation of fraction A by reversed phase - medium pressure liquid
chromatography 23
3.2.1.1 Results 24
3.2.1.2 Discussion and conclusion 26
3.2.2 Development of a fractionation method for fraction A1 28
V
3.2.2.1 Results 28
3.2.2.2 Discussion and conclusion 29
3.2.3 Fractionation of fraction A1 by normal phase - medium pressure liquid
chromatography 29
3.2.3.1 Results 30
3.2.3.2 Discussion and conclusion 32
3.2.4 Fractionation of fraction A1-4 by semi preparative - reversed phase - high
performance liquid chromatography 32
3.2.4.1 Results 34
3.2.4.2 Discussion and conclusion 36
3.2.5 Overview on the bioassay-guided fractionation 36
3.3 Structure elucidation of A1-4C 38
3.3.1 High performance liquid chromatography - electrospray ionization - mass
spectroscopy of A1-4C 38
3.3.1.1 Results 38
3.3.1.2 Discussion and conclusion 42
3.3.2 Electrospray ionization - mass spectroscopy of A1-4C after acid hydrolysis 43
3.3.2.1 Results 43
3.3.2.2 Discussion and conlusion 45
3.3.3 Nuclear magnetic resonance experiments of A1-4C 46
3.3.3.1 Results 46
3.3.3.2 Discussion and conclusion 51
3.3.4 Summary of the structural elucidation experiments 51
3.4 Up-scaled isolation of γ-GPeCSO 53
3.4.1 Isolation of γ-GPeCSO by ion exchange - column chromatography 54
3.4.1.1 Results 54
3.4.1.2 Discussion and conclusion 57
3.4.1.3 Overview on the isolation with ion exchange chromatography 59
3.4.2 Purification of γ-GPeCSO with solid phase extraction chromatography 60
3.4.2.1 Results 60
3.4.2.2 Discussion and conclusion 61
3.4.3 Quantification of γ-GPeCSO with reversed phase - high performance liquid
chromatography 61
VI
3.4.3.1 Results 61
3.4.3.2 Discussion and conclusion 63
3.4.4 Correlation between γ-GPeCSO content and biological activity 63
3.4.4.1 Results 63
3.4.4.2 Discussion and conclusion 66
3.4.5 Quantification of γ-GPeCSO in dry onion powder 66
3.4.5.1 Results 67
3.4.5.2 Discussion and conclusion 67
4 Conclusions and Outlook 68
5 Material and Methods 70
5.1 Plant material and ethanolic extraction of onion powder 70
5.2 General laboratory equipment and solvents 70
5.3 Assays for the assessment of bone resorption 71
5.3.1 [3H]-Tetracycline urine excretion model of bone resorption (in vivo) 71
5.3.2 Osteoclast resorption pit assay (in vitro) 73
5.4 Chromatographic techniques 76
5.4.1 Chromatographic techniques for analytical separations 76
5.4.1.1 Reversed phase - high performance liquid chromatography 76
5.4.1.2 Reversed phase - high performance liquid chromatography - electrospray
ionization-mass spectroscopy 76
5.4.1.3 Thin layer chromatography systems 77
5.4.1.3.1 Normal phase - thin layer chromatography 77
5.4.1.3.2 Reversed phase - high performance thin layer chromatography 77
5.4.1.3.3 Thin layer chromatography detection reagents 77
5.4.2 Chromatographic techniques for preparative separations 79
5.4.2.1 Adsorption column chromatography 79
5.4.2.2 Medium pressure liquid chromatography 80
5.4.2.2.1 Reversed phase - medium pressure liquid chromatography 80
5.4.2.2.2 Normal phase - medium pressure liquid chromatography 81
5.4.2.3 Semi preparative - high performance liquid chromatography 81
VII
5.4.2.4 Ion exchange - column chromatography 82
5.4.2.4.1 Cation exchange - column chromatography 82
5.4.2.4.2 Anion exchange - column chromatography 83
5.4.2.5 Solid phase extraction chromatography 84
5.5 Spectroscopic techniques for structure elucidation 85
5.5.1 Electrospray ionization - mass spectroscopy 85
5.5.2 Nuclear magnetic resonance spectroscopy 85
5.6 Statistical analysis 85
6 References 86
7 Appendix 97
7.1 Tables of the pits per cell ratios 97
7.1.1 RP-MPLC fractions A1 and A2 97
7.1.2 NP-MPLC fractions A1-1 to A1-4 98
7.1.3 SP-RP-HPLC fractions A1-4A to A1-4C 98
7.1.4 Biological activity and content of γ-GPeCSO in fractions A to A1-4 99
7.2 Values of the calibration curve 99
7.3 ESI-mass spectra 100
7.3.1 ESI-MS of compound A1-4C 100
7.3.2 ESI-MS of γ-GPeCSO (New Zealand sample) 101
7.3.3 ESI-MS of γ-GPeCSO isolated by IE-CC 102
7.4 RP-HPLC-DAD chromatograms 103
7.4.1 Fractions A, A1, A1-4 and A1-4C 103
7.4.2 IE-CC fractions 104
7.5 ESI-mass spectra after acidic hydrolysis 105
7.5.1 ESI-MS of γ-GPeCSO after acidic hydrolysis 105
7.5.2 ESI-MS of m/z 148 after acidic hydrolysis 105
7.5.3 ESI-MS of m/z 241 after acidic hydrolysis 106
VIII
7.6 1H-NMR Spectra of γ-GPeCSO 107
7.6.1 1H-NMR spectrum of γ-GPeCSO contaminated with acetic acid 107
7.6.2 1H-NMR spectrum of SPE-purified γ-GPeCSO 108
7.7 Publications and poster presentations 109
7.7.1 Publication 109
7.7.2 Posters 109
7.8 Curriculum vitae 110
1
Summary
In this work a hydrophilic ethanolic extract of onion (Allium cepa L.) devoid of flavonoids
was found to inhibit significantly bone resorption in vitro and in vivo, whereas the flavonoids,
claimed to posses phytoestrogen-like properties, were devoid of activity in vivo and toxic in
vitro. Thus, in order to isolate the bone resorption inhibitory constituent(s) of onion, the
hydrophilic ethanolic onion extract was subjected to an in vitro bioassay-guided fractionation
using (semi)-preparative chromatographic techniques.
Biological activity, i.e. bone resorption inhibitory activity, was determined in vitro using the
osteoclast resorption pit assay: Medium, containing the fraction under investigation, was
added to osteoclasts settled on ivory slices. After a 24-hour incubation period osteoclasts were
counted and the number of resorption pits was determined. Activity was calculated as the
ratio of resorption pits per osteoclasts and was compared to a negative control, i.e. medium
only, and to calcitonin (10-12 M) as positive control. In this way, from the starting fraction
which inhibited significantly (p < 0.05) the osteoclast activity at a dose of 30.0 mg / ml, a
compound inhibiting significantly the osteoclast activity (0.53 mg / ml; p < 0.05) could be
isolated.
Structural analysis performed as well by nuclear magnetic resonance (NMR) as by
electrospray-ionization mass-spectroscopy identified unambiguously the compound as γ-L-
glutamyl-trans-S-1-propenyl-L-cysteine sulphoxide (γ-GPeCSO).
Consequently, an adapted, scaled-up isolation by means of ion exchange - column
chromatography was performed in order to isolate γ-GPeCSO in large amounts. Thus,
sufficient amounts of γ-GPeCSO could be isolated to develop a high performance liquid
chromatography method to quantify γ-GPeCSO in the fractions of the bioassay-guided
fractionation. NMR experiments performed for structural confirmation of the isolated
compound, revealed the presence of 5 % acetic acid (weight/weight) in the sample which
originated from solvents used in the ion exchange procedures. However, the acetic acid could
be removed by solid phase extraction chromatography.
Quantification of γ-GPeCSO in the fractions of the bioassay guided fractionation showed a
significant (p < 0.05) correlation between the amounts of γ-GPeCSO therein and the
osteoclast activity inhibition, thus indicating that γ-GPeCSO inhibited osteoclast activity in
vitro.
2
Zusammenfassung
In der vorliegenden Arbeit wurde festgestellt, dass ein hydrophiler, ethanolischer
flavonoidfreier Zwiebelextrakt die Knochenresorption in vitro und in vivo signifikant
hemmte, während die Zwiebelflavonoide, welchen in der Literatur ein Phytoöstrogen-
ähnlicher Effekt nachgesagt wurde, in vitro toxisch waren und in vivo keinen Effekt zeigten.
Aus diesem Grunde wurde eine in vitro Knochenresorptionsmodell-gesteuerte Fraktionierung
des ethanolischen, hydrophilen Zwiebelextraktes mittels (semi)-präparativen
chromatographischen Methoden durchgeführt.
Die biologische Aktivität, d.h. die knochenresorptionshemmende Aktivität, wurde in vitro
mittels dem Osteoklasten-Knochenresorptions-Modell gemessen. Hierbei wurde die zu
untersuchende Zwiebelfraktion dem Nährmedium beigemischt und den sich auf
Elfenbeinplättchen befindenden Osteoklasten zugegeben. Nach 24 Stunden Inkubationszeit
wurden die Osteoklasten und die Resorptionslöcher der Osteoklasten im Elfenbein gezählt.
Die knochenresorptionshemmende Aktivität wurde als das Verhältnis zwischen der Anzahl
Resorptionslöcher pro Osteoklast berechnet. Diese wurde sowohl mit einer negativen
Kontrolle, d.h Nährmedium ohne Zwiebelfraktion, als auch mit einer positiven Kontrolle,
bestehend aus einer 10-12 M Calcitonin-Lösung, verglichen. Auf diese Weise konnte von der
Startfraktion, die bei einer Dosis von 30 mg/ml die Osteoklastenaktivität signifikant hemmte
(p < 0.05), eine Fraktion bestehend aus einer einzelnen Substanz isoliert werden, die ebenfalls
eine signifikante Hemmung der Osteoklastenaktivität zeigte (0.53 mg/ml; p < 0.05).
Strukturelle kernresonanz- (NMR) und massenspektroskopische Analysen ergaben, dass es
sich bei der osteoklastenhemmenden Substanz um γ-L-Glutamyl-trans-S-1-propenyl-L-cystein
sulphoxid (γ-GPeCSO) handelte.
Nachfolgend wurde eine adaptierte Isolierung von γ-GPeCSO mittels
Ionentauscherchromatographie in grösserem Massstab durchgeführt. Auf diese Weise konnten
genügend grosse Mengen von γ-GPeCSO isoliert werden um eine Hochleistungs-
Flüssigchromatographische Methode zu entwickeln um den Gehalt an γ-GPeCSO in den
Fraktionen bestimmen zu können. Nachfolgend zur Strukturbestätigung erfolgte NMR
Messungen ergaben eine 5-prozentige (gewichtsbezogene) Verunreinigung mit Essigsäure,
die von der Ionentauscherchromatographie herrührte welche jedoch mittels Solid Phase
Extraktions-Chromatographie entfernt werden konnte.
Die anschliessende Quantifizierung von γ-GPeCSO in den Fraktionen der Fraktionierung
ergab eine signifikante Korrelation (p < 0.05) zwischen der darin enthaltenen Menge von γ-

3
GPeCSO und der entsprechenden hemmenden Wirkung auf die Aktivität der Osteoklasten,
die darauf hinwies, dass γ-GPeCSO für die osteoklastenhemmende Wirkung in vitro
verantwortlich war.
4
1 Introduction
1.1 Allium cepa L. (onion)
1.1.1 Systematics and distribution of Allium cepa L.
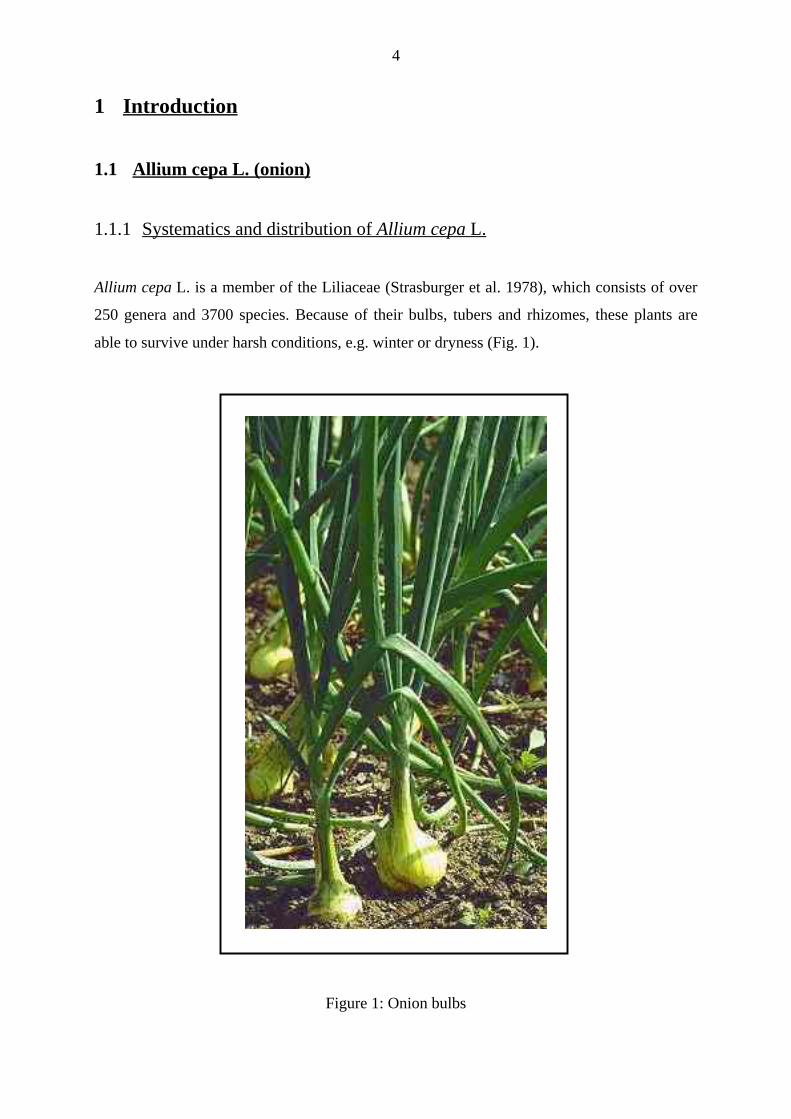
Allium cepa L. is a member of the Liliaceae (Strasburger et al. 1978), which consists of over
250 genera and 3700 species. Because of their bulbs, tubers and rhizomes, these plants are
able to survive under harsh conditions, e.g. winter or dryness (Fig. 1).
Figure 1: Onion bulbs
5
Plants of the Liliaceae show very different habits and contain various classes of chemical
compounds. Therefore, the classification of the Liliaceae has been discussed for a long time:
Hutchinson (1959) assigned Allium cepa L. to the subfamily Allioideae, belonging to the
Amaryllidaceae. Because of the lack of alkaloids, which are normally typical of
Amaryllidaceae, the Allioideae were also classified as a member of the Liliaceae (Hegnauer
1963). Finally, plants of the genus Allium were classified in the independent family of
Alliaceae (Dahlgren et al. 1985).
Section: Spermatophyta
Subsection: Angiospermae
Class: Monocotyledonae (= Liliatae)
Subclass: Liliidae
Order: Liliales (= Liliflorae)
Family: Alliaceae
Subfamily: Allioideae
Tribe: Allieae
Subtribe: Alliinae
Genus: Allium
Synonyms of Allium cepa L. are Allium esculentum Salisb. or Allium porrum cepa Rchb.
(Hegi 1939).
The genus Allium includes about 550 species (Dahlgren et al. 1985). A few of these are
important as food plants and as drugs in folk medicine, notably onion (A. cepa L.) and garlic
(A. sativum L.). In addition, A. ursinum L. (wild garlic), A schoenoprasum L. (chives) and A.
porrum L. (leek) are popular representatives of the genus Allium (Hegi 1939). The origin of A.
cepa L. may be the region between the rivers Euphrates and Tigris, i.e. former Mesopotamia
and actually Iraq (Hegi 1939). Today, A. cepa L. is cultivated all over the world, especially in
moderate climates (Breu 1996).
6
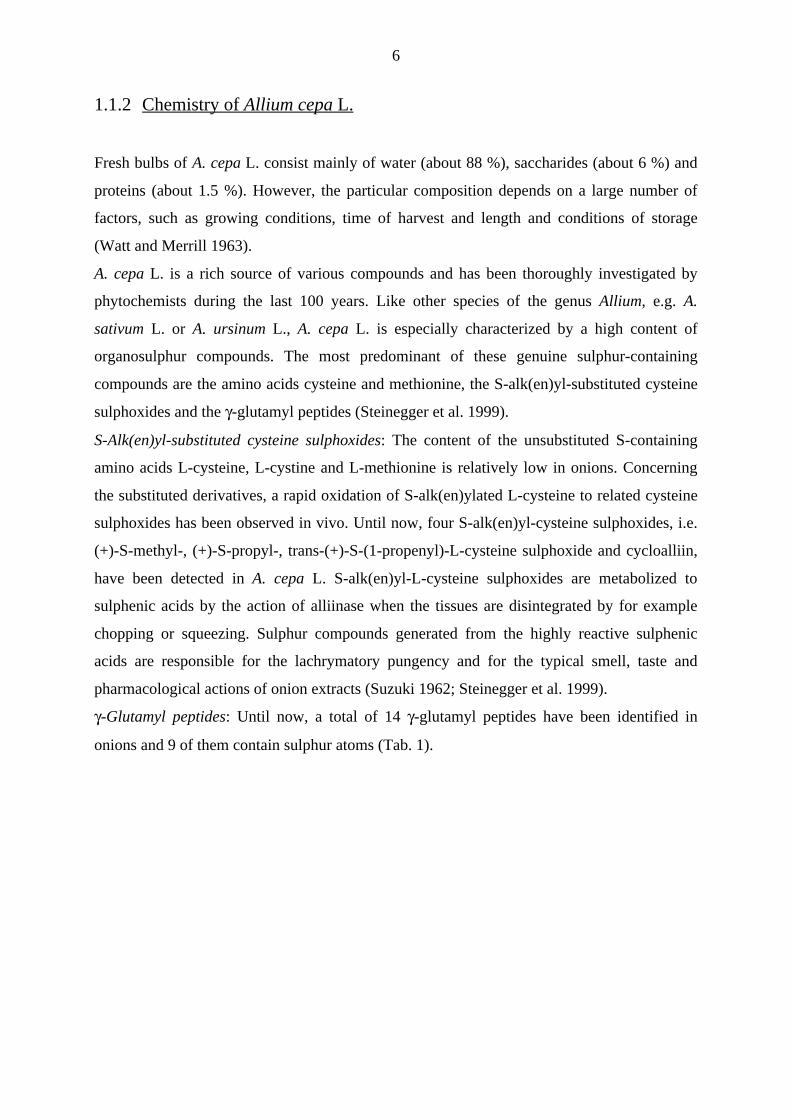
1.1.2 Chemistry of Allium cepa L.
Fresh bulbs of A. cepa L. consist mainly of water (about 88 %), saccharides (about 6 %) and
proteins (about 1.5 %). However, the particular composition depends on a large number of
factors, such as growing conditions, time of harvest and length and conditions of storage
(Watt and Merrill 1963).
A. cepa L. is a rich source of various compounds and has been thoroughly investigated by
phytochemists during the last 100 years. Like other species of the genus Allium, e.g. A.
sativum L. or A. ursinum L., A. cepa L. is especially characterized by a high content of
organosulphur compounds. The most predominant of these genuine sulphur-containing
compounds are the amino acids cysteine and methionine, the S-alk(en)yl-substituted cysteine
sulphoxides and the γ-glutamyl peptides (Steinegger et al. 1999).
S-Alk(en)yl-substituted cysteine sulphoxides: The content of the unsubstituted S-containing
amino acids L-cysteine, L-cystine and L-methionine is relatively low in onions. Concerning
the substituted derivatives, a rapid oxidation of S-alk(en)ylated L-cysteine to related cysteine
sulphoxides has been observed in vivo. Until now, four S-alk(en)yl-cysteine sulphoxides, i.e.
(+)-S-methyl-, (+)-S-propyl-, trans-(+)-S-(1-propenyl)-L-cysteine sulphoxide and cycloalliin,
have been detected in A. cepa L. S-alk(en)yl-L-cysteine sulphoxides are metabolized to
sulphenic acids by the action of alliinase when the tissues are disintegrated by for example
chopping or squeezing. Sulphur compounds generated from the highly reactive sulphenic
acids are responsible for the lachrymatory pungency and for the typical smell, taste and
pharmacological actions of onion extracts (Suzuki 1962; Steinegger et al. 1999).
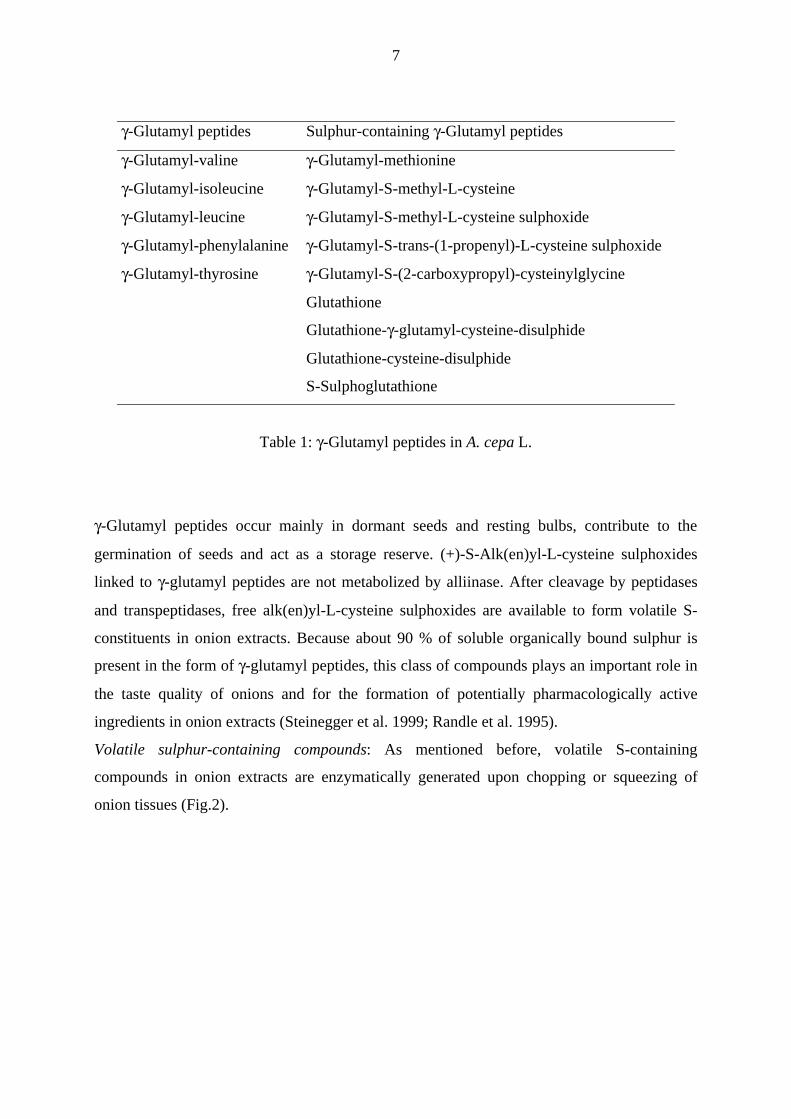
γ-Glutamyl peptides: Until now, a total of 14 γ-glutamyl peptides have been identified in
onions and 9 of them contain sulphur atoms (Tab. 1).
7
γ-Glutamyl peptides Sulphur-containing γ-Glutamyl peptides
γ-Glutamyl-valine γ-Glutamyl-methionine
γ-Glutamyl-isoleucine γ-Glutamyl-S-methyl-L-cysteine
γ-Glutamyl-leucine γ-Glutamyl-S-methyl-L-cysteine sulphoxide
γ-Glutamyl-phenylalanine γ-Glutamyl-S-trans-(1-propenyl)-L-cysteine sulphoxide
γ-Glutamyl-thyrosine γ-Glutamyl-S-(2-carboxypropyl)-cysteinylglycine
Glutathione
Glutathione-γ-glutamyl-cysteine-disulphide
Glutathione-cysteine-disulphide
S-Sulphoglutathione
Table 1: γ-Glutamyl peptides in A. cepa L.
γ-Glutamyl peptides occur mainly in dormant seeds and resting bulbs, contribute to the
germination of seeds and act as a storage reserve. (+)-S-Alk(en)yl-L-cysteine sulphoxides
linked to γ-glutamyl peptides are not metabolized by alliinase. After cleavage by peptidases
and transpeptidases, free alk(en)yl-L-cysteine sulphoxides are available to form volatile S-
constituents in onion extracts. Because about 90 % of soluble organically bound sulphur is
present in the form of γ-glutamyl peptides, this class of compounds plays an important role in
the taste quality of onions and for the formation of potentially pharmacologically active
ingredients in onion extracts (Steinegger et al. 1999; Randle et al. 1995).
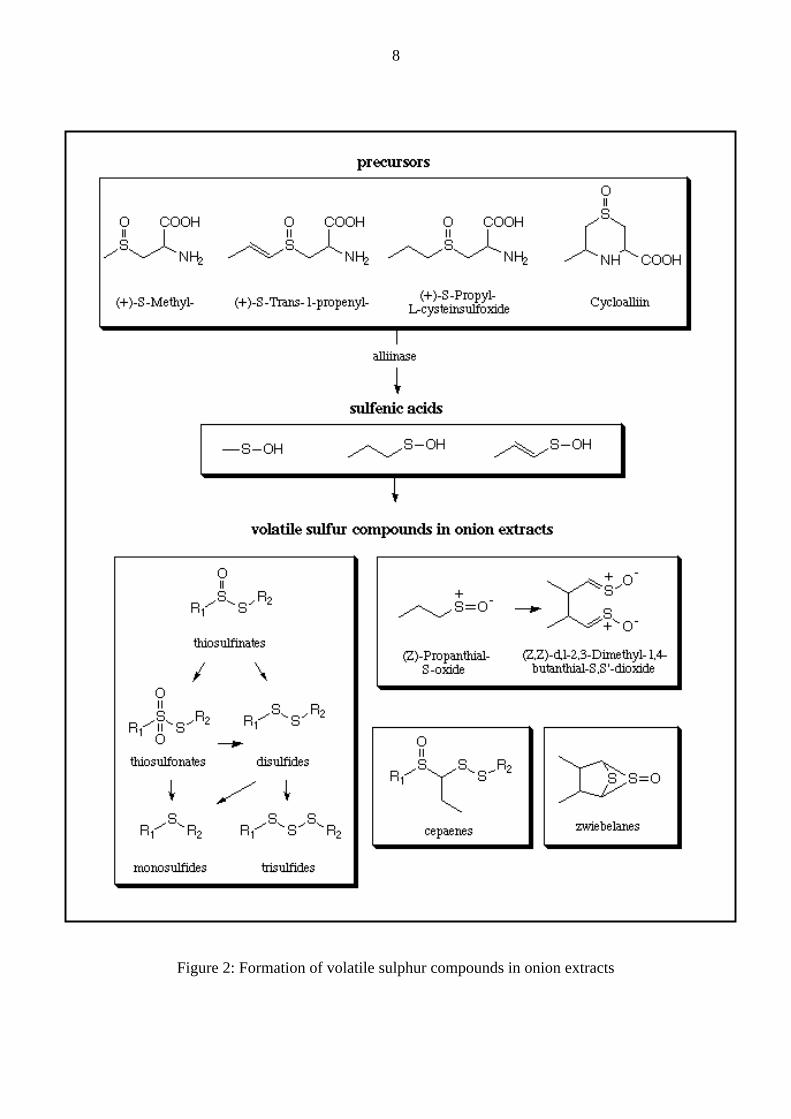
Volatile sulphur-containing compounds: As mentioned before, volatile S-containing
compounds in onion extracts are enzymatically generated upon chopping or squeezing of
onion tissues (Fig.2).
8
Figure 2: Formation of volatile sulphur compounds in onion extracts
9
Among the volatile sulphur-containing compounds the probably most famous is (Z)-
propanthial-S-oxide: Its lachrymatory properties cause irritation of the eyes and it is claimed
that this constituent dimerizes to a further lachrymatory factor, i.e. (Z,Z)-d,l-2,3-dimethyl-1,4-
butanthiol-S,S’-dioxide. Other volatile sulphur-containing compounds are zwiebelanes, the
cepaenes and the mono-, di- and trisulphides originating from spontaneously formed
thiosulphinates, which on the other hand are responsible for the characteristic onion flavour
(Steinegger et al. 1999; Breu 1996). Interestingly, recent investigations hypothesize a specific
enzymatic conversion of 1-propensulphenic acid to the lachrymatory factor, thus possibly
enabling the production of non-lachrymatory onions by knocking-out the gene encoding for
this enzyme without influencing the flavour and nutritional value of onions (Imai et al. 2002).
Furthermore, many other onion-characteristic compounds, devoid of sulphur, have been found
in A. cepa L., such as steroid saponins of the spirostanol- and the furostanol-type basing on
the aglyca diosgenin, ruscogenin and cepagenin (Kintya 1987). Other constituents are
flavonoids, such as quercetin and kaempferol, which are found as a wide variety of mono- and
diglycosides, e.g. rutin (= quercetin-3-rutinoside).
1.1.3 Medicinal use of Allium cepa L.
1.1.3.1 Allium cepa L. in the traditional folk medicine
Allium cepa L. has been cultivated and used as a nutrient for more than 6000 years. People
detected pharmacological properties of the plant and used it in traditional and folk medicine
for many different major and minor disorders. Convincing scientific data to support most of
these claims are, however, lacking (Dorsch 1996; Koch 1994).
Fresh onion juice is often recommended in folk medicine of various countries for pain and
swelling after bee or wasp stings, which are followed by an allergy-induced reaction of the
skin. The observed inhibitory effects of onion extracts on that kind of cutaneous reactions led
to the discovery of antiinflammatory and antiasthmatic thiosulphinates and cepaenes (Dorsch
et al. 1989; Dorsch and Wagner 1991).
The Egyptian papyrus Ebers mentions onion-containing remedies against worm infections,
diarrhoea and other infectious and inflammatory diseases (Joachim 1890). These and other
prescriptions from traditional medicine have prompted several investigators in the second part
10
of the last century to test onion extracts or onion oils for antimicrobial activities suppressing
the growth of intestinal worms, fungi and bacteria both in vivo and in vitro (Didry et al. 1987;
Kim 1997). The active principles, however, are unknown. Unfortunately, the techniques used
to prepare and to store onion extracts varied greatly from one investigator to the other. Thus,
the doses or concentrations used are not comparable (Dorsch 1996; Augusti 1996).
1.1.3.2 Current pharmacology of Allium cepa L.
A. cepa L. has never got the same scientific attention like its related and more known plant
relative A. sativum L. (garlic). However, a few studies have been performed.
Onion and onion extracts have been shown to exert cardiovascular effects. Essential oils
suppressed arachidonic acid- and collagen-induced platelet aggregation in vitro and ex vivo in
humans. Part of this antiaggregation activity of onion preparations seems to be mediated by
the inhibition of thromboxane biosynthesis (Makheja et al. 1979; Makheja et al.1980).
Additionally, essential onion oils and raw onions increase fibrinolysis in ex vivo experiments
on rabbits and human volunteers. Onion exerts beneficial effects not only in cardiovascular
diseases, but also on metabolic diseases like diabetes and hyperlipidaemia. In diabetic
patients, raw onion lowered the need for oral antidiabetics. In patients with alimentary
lipaemia, onion prevented the rise of serum cholesterol and serum triglycerides (Mathew and
Augusti 1975).
Nevertheless, the exact mechanism of action of these pharmacological effects remains
unknown and further investigations are necessary.
11
1.2 Biology of the bone
1.2.1 Function, structure and composition of the bone
Bone has several functions: It gives mechanical stability to the body and protects vital organs
like the heart, the brain or the spinal cord from external hits. Also, it is the support and site
where the muscles attach, allowing locomotion and stores vital ions such as calcium,
magnesium and phosphate, which are essential for serum homeostasis and organ functions.
Two different structural forms of bone exist: Cancellous or spongy bone and compact or
cortical bone. Cancellous bone is made of a spongy network of thin bony structures, i.e. the
trabeculae, which give maximal stability to withstand to bending and torsion forces with as
little material as needed. On the other hand, the cortical bone is compact and protects the
cancellous bone from external blows by surrounding the latter. Additionally, the tube
structure of long bones is very rigid and resistant.
Two phases, a mineral inorganic and an organic matrix, which account for 65 % and 35 % of
the dry weight, respectively, compose bone. The mineral matrix consists of hydroxyapatite,
which is calciumphosphate ( = Ca10(PO4)6(OH)2 ) containing carbonate and is responsible for
the rigidity of the bones. Its organic counterpart is made up of collagen and non-collagenous
matrix proteins, which build a net that serves as a surface for crystal deposition (Baron 1999).
1.2.1.1 Bone formation and bone resorption
Bone is constantly being turned over by two cell types, i.e. the osteoblasts and the osteoclasts.
The osteoblasts, which are derived from mesenchymal stem cells, are able to form organic
bone matrix onto which mineral is deposited. Both can be degraded by the osteoclasts, which
are derived from hemopoietic progenitors (Ducy et al. 2000).
In healthy bones, this continuous process of bone formation and bone resorption is in
equilibrium and thus ensuring maintenance of bone mass. However, this equilibrium can
seriously be disrupted, either through increased or decreased bone formation or bone
resorption, which leads to pathological changes in bone mass (Mundy 1999).
12
1.2.1.2 The osteoclast - the bone resorbing cell
The bone resorbing cells are the osteoclasts. Like the macrophages, they are derived from
hemopoietic stem cells and are multinucleated.
Their osteoclast-specific differentiation is triggered by cytokines, such as the macrophage
colony-stimulating factor (M-CSF) and the receptor activator of nuclear factor kappa B ligand
(RANKL). Both cytokines are expressed by stromal cells and osteoblasts, which can be up-
regulated by osteoclastogenic molecules such as parathyroid hormone (PTH). In opposition to
that, osteoprotegerin, a soluble decoy receptor regulates the osteoclastic differentiation and
activity by binding to RANKL and thus preventing an overshoot of bone resorbing cells in
bone.
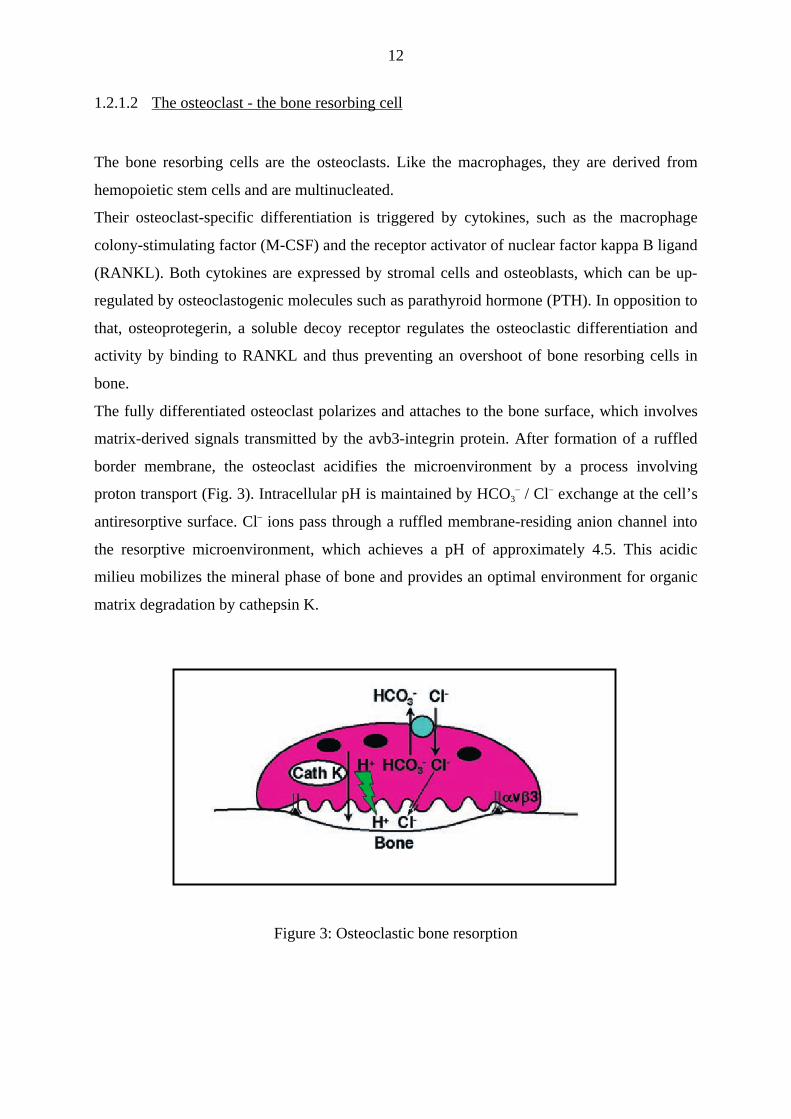
The fully differentiated osteoclast polarizes and attaches to the bone surface, which involves
matrix-derived signals transmitted by the avb3-integrin protein. After formation of a ruffled
border membrane, the osteoclast acidifies the microenvironment by a process involving
proton transport (Fig. 3). Intracellular pH is maintained by HCO3– / Cl– exchange at the cell’s
antiresorptive surface. Cl– ions pass through a ruffled membrane-residing anion channel into
the resorptive microenvironment, which achieves a pH of approximately 4.5. This acidic
milieu mobilizes the mineral phase of bone and provides an optimal environment for organic
matrix degradation by cathepsin K.
Figure 3: Osteoclastic bone resorption
13
After the resorption process has been accomplished osteoclasts are thought to go into
apoptosis, leaving excavated pits behind, so-called howship-lacunae. By this way one single
osteoclast is able to resorb the same amount of bone built previously by 100 to 150
osteoblasts in the same amount of time (Junqueira and Carneiro 1991). The resorptive activity
of osteoclasts is under hormonal control: Calcitonin (CT) and estrogen inhibit, whereas PTH
stimulates osteoclastic resorption activity. A further feature of the osteoclasts is the
expression of tartrate-resistant acid phosphatases (TRAP) unlike the other bone cells. This
feature enables specific staining of the osteoclasts in order to diffentiate them visually from
other bone cells (Baron 1999).
1.2.2 Osteoporosis
Osteoporosis is defined as a metabolic bone disease characterized by low bone mass and a
deterioration of the microarchitecture of the bones leading to enhanced bone fragility and a
consequent increase in fracture that affect 40 % of women and 14 % of men over the age of
50 years. In osteoporosis, the net rate of bone resorption exceeds the rate of bone formation,
resulting in a decrease in bone mass without a defect in bone mineralization. The amount of
bone available for mechanical support of the skeleton eventually falls below the fracture
threshold, and the patient may sustain a fracture with little trauma.
Several genetic but also many environmental factors are involved in this deleterious process:
Among the genetic factors the acquisition of peak bone mass, i.e. the maximum amount of
bone acquired at skeletal maturity, is critical. Also, the deprivation of sexual hormones, i.e.
estrogen in women after menopause, is determinant as it increases osteoclast activity. Men
with prematurely decreased testosterone may also have increased osteoclast activity. These
changes result in net loss of bone. But also adverse vitamin D3-receptors polymorphisms
further enhance bone loss. These innate factors are thought to determine to a great extent (70-
80 %) peak bone mass.
The remaining 20-30 % of variation in bone mass can be attributed to environmental factors
which are of particular interest as they can be modified. The vitamin D3 production
influenced by sunlight exposure, exercise and nutritional habits, particularly calcium
nutrition, are such factors (Eastell 1999; Einhorn 1999; Orwoll 1999).
14
1.2.2.1 Current pharmacological treatment of osteoporosis
Currently, there are three main pharmacological therapies for the acute treatment of
osteoporosis: Estrogens or selective estrogen receptor modulators (SERMs), bisphosphonates
and calcitonin (Rodan and Martin 2000).
Estrogens and SERMs inhibit bone resorption by blocking the production of cytokines that
promote osteoclast differentiation. However, estrogen treatment is associated with a well-
established increase of breast and uterine cancer risk. On the other hand, the SERMs are
lacking these side effects of the estrogens but they inhibit bone loss also less strongly (Rodan
and Martin 2000).
Bisphosphonates are a class of compounds that act as inhibitors of bone resorption. They
adsorb to mineral surfaces, making them specific for bone. The mechanism of action of
aminobisphosphonates has been elucidated in recent years, showing an inhibition of two
enzymes in the mevalonic pathway essential for the prenylation of proteins needed for the
intracellular signaling. In their absence the osteoclasts are driven into apoptosis. Because
bisphosphonates reduce elevated bone resorption regardless of the cause, they are also used to
treat other bone diseases, such as Paget’s disease or bone tumors.
Calcitonin is a polypeptide hormone that inhibits bone resorption by acutely blocking
osteoclast activity. In osteoporosis therapy human and animal calcitonins, e.g. from salmon,
have been used. Salmon calcitonin therapy also has analgesic properties. However, calcitonin
induces a down-regulation of the calcitonin receptors, which finally results in a resistance
towards the calcitonin-therapy. This represents an unsolvable problem until now.
Furthermore, combined therapy with sodium fluoride and supplemental calcium appears to
increase bone mass, but the bone becomes abnormal (increased trabecular but decreased
cortical bone density) and more fragile. Thus, fluoride is not recommended. Slow-release
fluoride is reported to be beneficial; however, the long-term benefit of this therapy is
unknown (Rodan and Martin 2000).
Additionally, growth factors can be used as stimulants to produce new bone; e.g. small and
intermittent daily doses of PTH stimulate bone formation without stimulating bone resorption.
In severe, uncontrolled fractures caused by osteoporosis, short-term androgens (less than 3
months) is an option for women when every other therapy fails, but their use is limited
because they lower the serum concentration of high density lipoproteins, cause virilization
and are potentially hepatotoxic. Men with osteoporosis also require evaluation for androgen
15
deficiency, for which replacement therapy may be considered. (Dawson-Hughes 1999, Reid
1999).
1.2.2.2 Current opinions in nutrition and osteoporosis
As mentioned before, osteoporosis development is influenced both by innate and
environmental factors and among the environmental factors nutrition is thought to play an
important role in the modulation of the severity of this bone disease.
Epidemiological studies and prospective, randomized, controlled trials in children and
adolescents have provided evidence that calcium does positively influence bone
mineralization during growth if dietary calcium before was low, i.e. 800–900 mg/day
(Bonjour et al. 1997). Thus, calcium nutrition might play a crucial role in the development of
peak bone mass. At the same time, the concept of a threshold for calcium intake during
adolescence has been proposed: It is likely that increasing ingestion of calcium up to
approximately 1500 mg/day has a positive effect on the skeleton, but no further benefit is
observed above this level.
Additionally, milk and dairy products are suggested to be determinant for achieving a high
peak bone mass. Not only because of their high content in calcium but also due to their high
protein content they are claimed to stimulate bone growth via the Insulin-like growth factor 1
(IGF-1). Circulating IGF-1 is closely involved in calcium and phosphate metabolism and
stimulation of the chondrocytes in the epiphyseal plate. Thus, milk is an important source of a
number of nutrients including other minerals, which are discussed below, and factors which
have only recently been identified, such as milk basic protein, which enhances bone strength
by the stimulation of bone formation and collagen synthesis.
Among the most important vitamins involved in bone development known until today are the
vitamins D and K. Vitamin D, in its active form, plays an important role in maintaining
calcium homeostasis: It acts on intestinal cells to increase the absorption of dietary calcium by
increasing the synthesis of Calbindin and on bone cells to mobilize calcium stores when
serum levels are low. The major source of vitamin D is, however, not dietary; it is produced
from 7-dehydrocholesterol in the skin during exposure to sunlight. Vitamin D3 is then
hydroxylated in the liver to produce 25-hydroxyvitamin which is the major circulating form
of vitamin D. Further hydroxylation in the kidney results in the formation of the active form
16
of vitamin D, 1,25-dihydroxyvitamin D (1,25(OH2D)). This conversion is stimulated by high
serum PTH levels, as well as by low serum calcium and phosphorus levels and by low levels
of 1,25(OH2D) itself. In most healthy individuals, dietary intake of vitamin D is therefore of
secondary importance if sunlight exposure is sufficient. Vitamin K, on the other hand, is
essential for the gamma-carboxylation of bone-matrix proteins, such as osteocalcin and low
dietary ingestion of vitamin K is associated with an increased risk of hip fracture in adults
(Booth et al. 2000).
Concerning the minerals, increased sodium intake results in increased urinary excretion of
sodium and calcium, leading to low serum calcium levels and hence raised PTH and increased
bone turnover and bone loss. High levels of dietary sodium may therefore have a detrimental
effect on bone metabolism. Other minerals important for bone health include magnesium and
zinc. Magnesium supplementation has been shown to result in increased bone mineral density
(BMD) and reduced fracture risk in menopausal women (Sojka and Weaver 1995). It is likely
that magnesium plays a role in peak bone mass development, but it is not known to what
extent it might be limiting. Zinc is necessary for optimal growth and stimulates production of
IGF-1.
Recently, interest has focused on the importance of acid–base metabolism in bone health, and
particularly on the role of fruits and vegetables. There is epidemiological evidence that the
intake of nutrients found in fruits and vegetables (potassium, magnesium, fiber, vitamin C, β-
carotene), as well as the intake of fruits and vegetables themselves, is positively associated
with BMD in adults (Tucker et al 1999; Tucker et al 2002; New et al. 2002). However, the
exact mechanism of the protective effect of fruits and vegetables on bone metabolism still
remains unclear. Several authors explain the positive effect of fruits and vegetables with their
base excess buffering the effect of the sulphuric amino acids, i.e. cysteine and methionine
(Remer 2001). These amino acids are metabolized to sulphuric acid which then is thought to
induce a slight, but significant, metabolic acidosis causing the bone to release calcium
carbonate from its mineral matrix in order to counteract the decrease of the pH (Bushinsky
2001; Tucker 2001). However, this theory assumes a very limited acid excretory capacity of
the kidneys, which is only apparent in patients with insufficient renal function as it can occurr
in old age. Healthy persons are fully capable of regulating the plasma pH and therefore do not
rely on the hypothetical decrease of the pH leading to bone dissolution (Oh et al. 1996).
Thus, nutritional factors can positively modulate bone mass, especially during growth and in
undernourished individuals. Strategies for enhancing skeletal health in the elderly must begin
in early childhood and continue throughout life (Heaney 1999; Lindsay and Cosman 1999).
17
2 Aim of this work
Recent findings showed a positive modulation of bone metabolism by vegetable consumption
in animal models (Mühlbauer and Li 1999) as well as in retrospective human epidemiological
studies (Tucker et al 1999; Tucker et al 2002; New et al. 2002). These findings open the
possibility for an effective and inexpensive nutritional approach to decrease the incidence of
low bone mass, the main risk factor for osteoporotic fractures. Furthermore, the identification
of the natural compound(s) responsible for this effect would give a rational and quantifiable
basis for dietary guidelines not only to prevent bone loss in old age but also to achieve a high
peak bone mass during adolescence.
A protective effect of various vegetables, among them onion, had been shown in a rat model
of bone resorption (Mühlbauer and Li 1999). Additionally, a dose-dependent inhibition of
osteoclast activity was found in vitro by an onion extract (Mühlbauer et al. 1998).
The effect of onion in vivo could not be explained by an additional intake of minerals or
vitamins, due to the fact that the rat diet already contained all essential nutrients in sufficient
amounts (Mühlbauer and Li 1999). An effect of the onion flavonoids, especially rutin, could
be excluded early with in vivo data (Mühlbauer 2001) and confirmed later in this work by
chemical means.
Concerning the acid-base hypothesis described above, rats fed onion excreted alkaline urine.
However, the bone protective effect of onion was independent of its base excess (Mühlbauer
et al. 2002) and, therefore, it was concluded that other compound(s) were possibly responsible
for the bone-saving effect of onion.
Thus, the bone resorbing inhibitory activity of onion could not be explained by up-to-date
knowledge and the dose-dependent inhibition of osteoclast activity in vitro indicated possibly
the presence of (a) pharmacologically active compound(s) inhibiting directly the cells
resorbing bone. Therefore, a detailed investigation to identify the in vitro bone resorption
inhibitory compounds of onion was started.
18
3 Results
3.1 Experimental background
First experiments had shown that a freeze-dried, ethanolic extract of onion inhibited bone
resorption in vivo and in vitro (Ingold et al. 1998, Mühlbauer et al. 1998). Thus, the bone
resorption inhibitory activity of onion was extractable and a reduction of the activity to single
compound(s) could theoretically be presumed.
Several researchers have claimed that flavonoids might act as phytoestrogens and therefore
inhibit bone resorption (Arjmandi et al. 1996; Draper et al. 1997). Additionally, Horcajada-
Molteni and co-workers (2000) have shown recently an inhibition of bone resorption in rats
by rutin added to the food. This glycosilated quercetin-derivative is an abundant flavonoid in
onion. This led to the hypothesis that rutin could be responsible for the bone-saving effect of
onion.
In order to challenge this hypothesis, the flavonoids had been extracted from dry onion
powder by means of adsorption column chromatography using Amberlite® XAD-4 as solid
phase. This separation yielded a major fraction devoid of flavonoids, i.e. a hydrophilic
fraction A, and a minor fraction containing the flavonoids, i.e. a lipophilic fraction B, as can
be seen in Table 2.
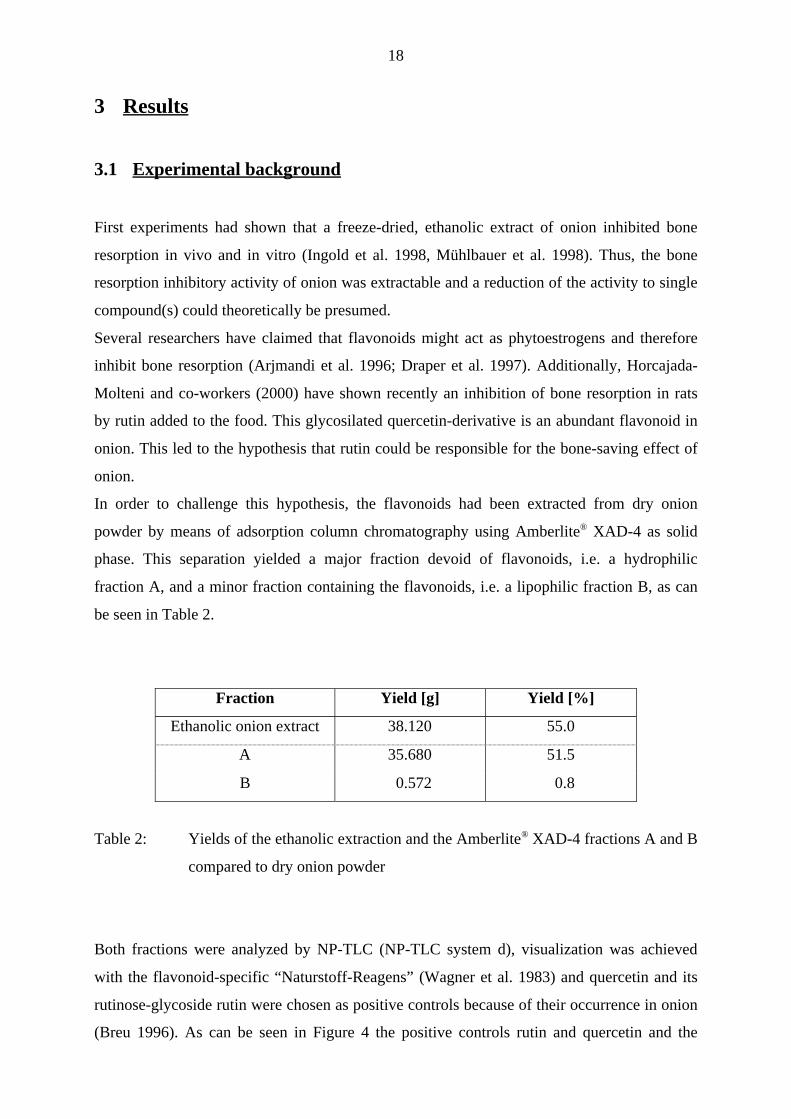
Fraction Yield [g] Yield [%]
Ethanolic onion extract 38.120 55.0
A 35.680 51.5
B 0.572 0.8
Table 2: Yields of the ethanolic extraction and the Amberlite® XAD-4 fractions A and B
compared to dry onion powder
Both fractions were analyzed by NP-TLC (NP-TLC system d), visualization was achieved
with the flavonoid-specific “Naturstoff-Reagens” (Wagner et al. 1983) and quercetin and its
rutinose-glycoside rutin were chosen as positive controls because of their occurrence in onion
(Breu 1996). As can be seen in Figure 4 the positive controls rutin and quercetin and the
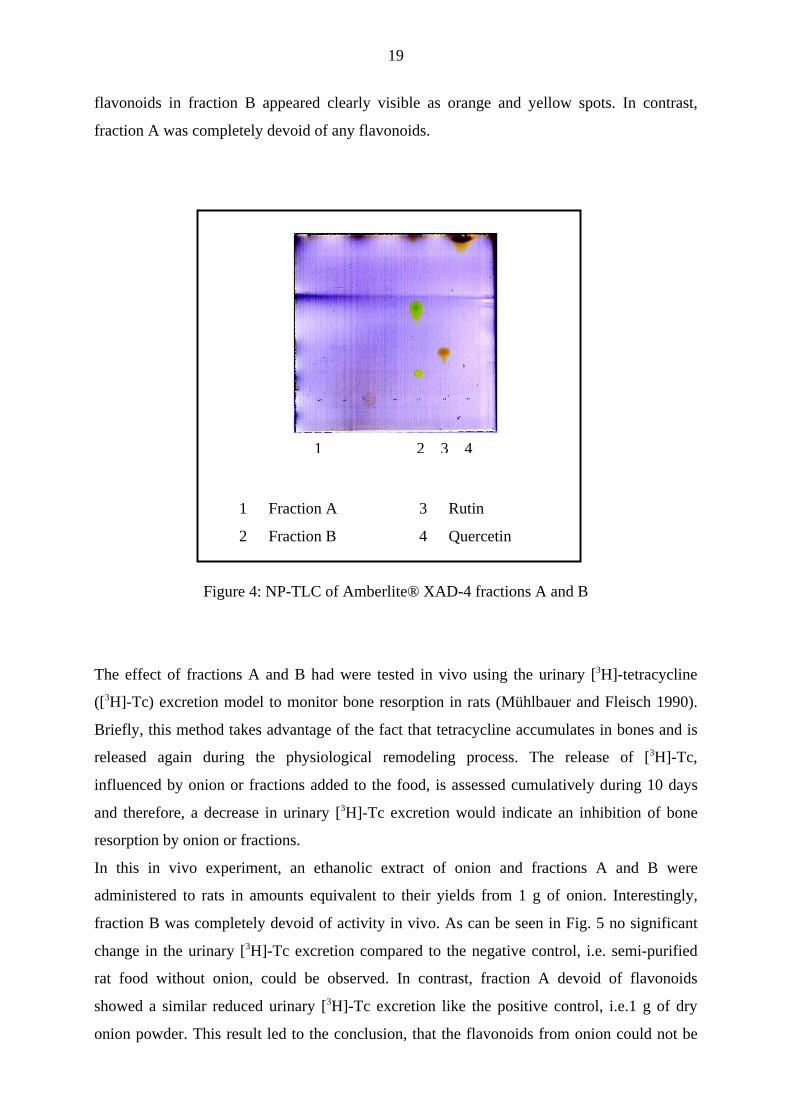
19
flavonoids in fraction B appeared clearly visible as orange and yellow spots. In contrast,
fraction A was completely devoid of any flavonoids.
1 Fraction A 3 Rutin
2 Fraction B 4 Quercetin
Figure 4: NP-TLC of Amberlite® XAD-4 fractions A and B
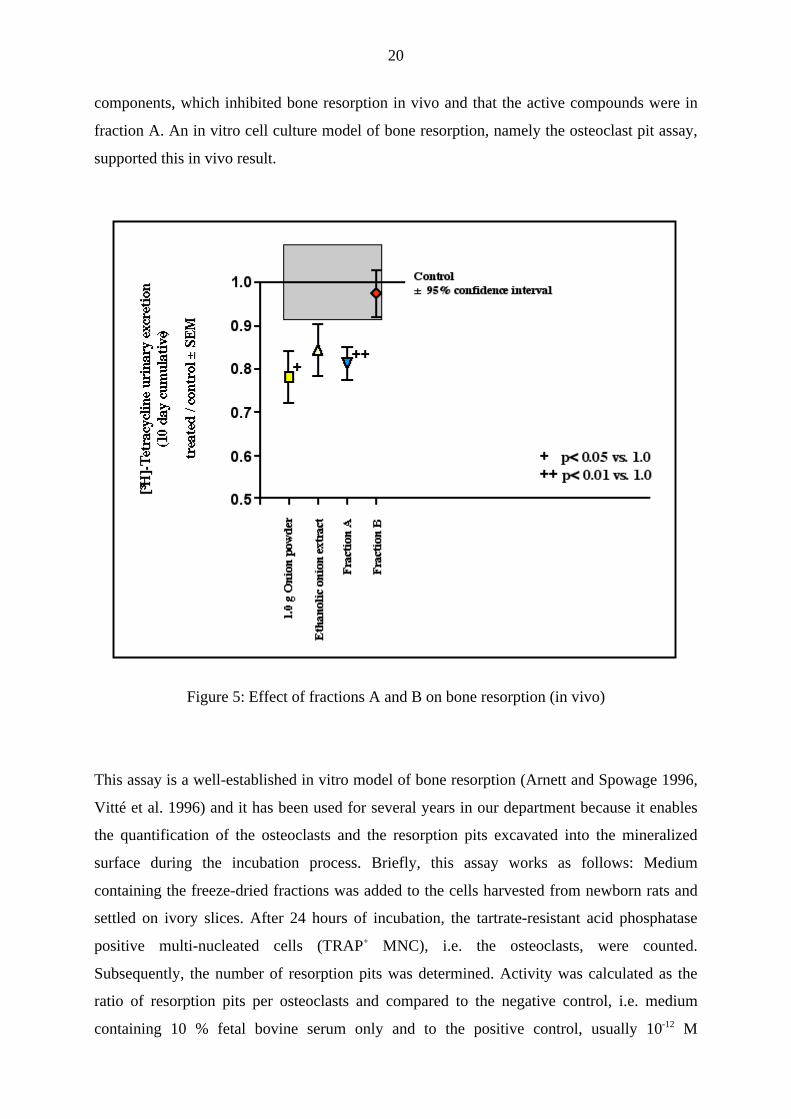
The effect of fractions A and B had were tested in vivo using the urinary [3H]-tetracycline
([3H]-Tc) excretion model to monitor bone resorption in rats (Mühlbauer and Fleisch 1990).
Briefly, this method takes advantage of the fact that tetracycline accumulates in bones and is
released again during the physiological remodeling process. The release of [3H]-Tc,
influenced by onion or fractions added to the food, is assessed cumulatively during 10 days
and therefore, a decrease in urinary [3H]-Tc excretion would indicate an inhibition of bone
resorption by onion or fractions.
In this in vivo experiment, an ethanolic extract of onion and fractions A and B were
administered to rats in amounts equivalent to their yields from 1 g of onion. Interestingly,
fraction B was completely devoid of activity in vivo. As can be seen in Fig. 5 no significant
change in the urinary [3H]-Tc excretion compared to the negative control, i.e. semi-purified
rat food without onion, could be observed. In contrast, fraction A devoid of flavonoids
showed a similar reduced urinary [3H]-Tc excretion like the positive control, i.e.1 g of dry
onion powder. This result led to the conclusion, that the flavonoids from onion could not be
1 2 3 4
20
components, which inhibited bone resorption in vivo and that the active compounds were in
fraction A. An in vitro cell culture model of bone resorption, namely the osteoclast pit assay,
supported this in vivo result.
Figure 5: Effect of fractions A and B on bone resorption (in vivo)
This assay is a well-established in vitro model of bone resorption (Arnett and Spowage 1996,
Vitté et al. 1996) and it has been used for several years in our department because it enables
the quantification of the osteoclasts and the resorption pits excavated into the mineralized
surface during the incubation process. Briefly, this assay works as follows: Medium
containing the freeze-dried fractions was added to the cells harvested from newborn rats and
settled on ivory slices. After 24 hours of incubation, the tartrate-resistant acid phosphatase
positive multi-nucleated cells (TRAP+ MNC), i.e. the osteoclasts, were counted.
Subsequently, the number of resorption pits was determined. Activity was calculated as the
ratio of resorption pits per osteoclasts and compared to the negative control, i.e. medium
containing 10 % fetal bovine serum only and to the positive control, usually 10-12 M
21
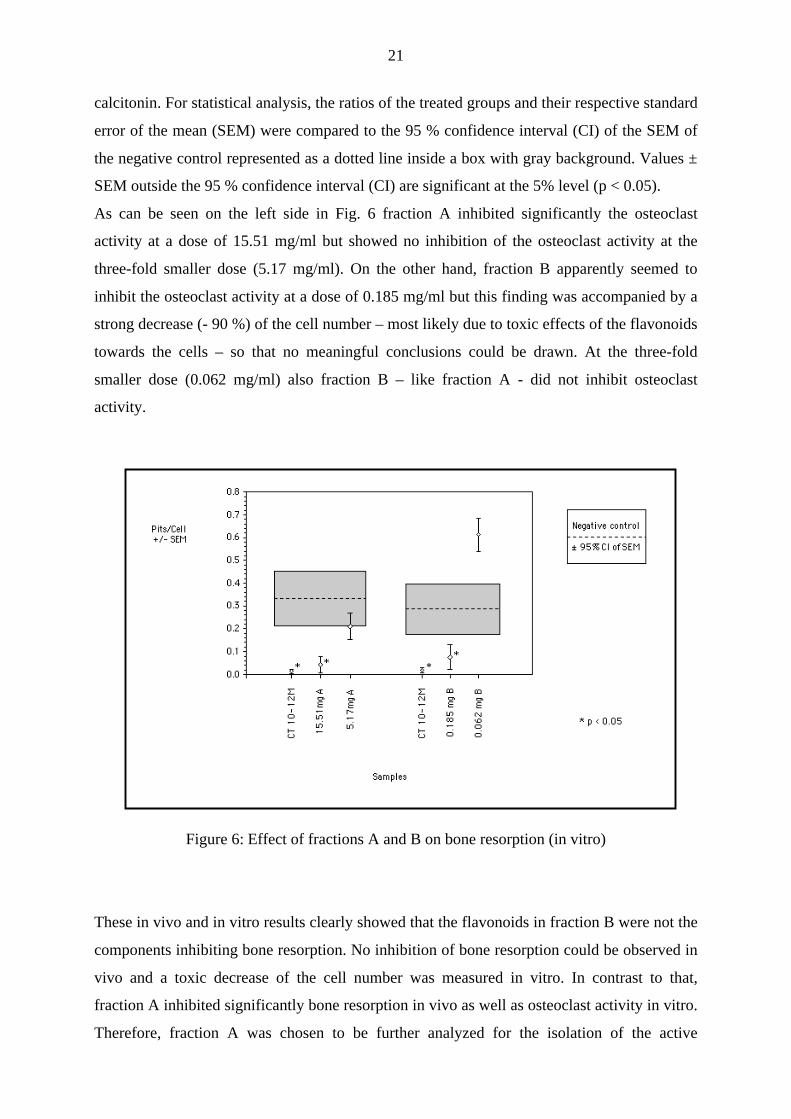
calcitonin. For statistical analysis, the ratios of the treated groups and their respective standard
error of the mean (SEM) were compared to the 95 % confidence interval (CI) of the SEM of
the negative control represented as a dotted line inside a box with gray background. Values ±
SEM outside the 95 % confidence interval (CI) are significant at the 5% level (p < 0.05).
As can be seen on the left side in Fig. 6 fraction A inhibited significantly the osteoclast
activity at a dose of 15.51 mg/ml but showed no inhibition of the osteoclast activity at the
three-fold smaller dose (5.17 mg/ml). On the other hand, fraction B apparently seemed to
inhibit the osteoclast activity at a dose of 0.185 mg/ml but this finding was accompanied by a
strong decrease (- 90 %) of the cell number – most likely due to toxic effects of the flavonoids
towards the cells – so that no meaningful conclusions could be drawn. At the three-fold
smaller dose (0.062 mg/ml) also fraction B – like fraction A - did not inhibit osteoclast
activity.
Figure 6: Effect of fractions A and B on bone resorption (in vitro)
These in vivo and in vitro results clearly showed that the flavonoids in fraction B were not the
components inhibiting bone resorption. No inhibition of bone resorption could be observed in
vivo and a toxic decrease of the cell number was measured in vitro. In contrast to that,
fraction A inhibited significantly bone resorption in vivo as well as osteoclast activity in vitro.
Therefore, fraction A was chosen to be further analyzed for the isolation of the active
22
constituents whereas fraction B was discarded. Although other authors showed an inhibition
of bone resorption by rutin (Horcajada-Molteni et al. 2000), it must be emphasized that the
doses of rutin administered in that study were 6 times higher than its content in 1 g of onion
powder used in this work and could therefore not explain the effect of onion on bone
metabolism in our in vivo model (Mühlbauer 2001). As can be concluded from our in vivo
data other compounds than flavonoids inhibiting bone resorption must be present.
23
3.2 Bioassay-guided fractionation
In order to isolate the bone resorbing inhibitory compound(s) of fraction A, a bioassay-guided
fractionation of fraction A could have been performed by using large-scale preparative
chromatography and an in vivo model of bone resorption, e.g. the urinary [3H]-Tc excretion
model of bone resorption described in the previous chapter. This type of assay would always
have required fractionations equivalent of over 50 g of onion powder for each experiment
because each group of rats (n = 5) had to be fed with onion fractions equivalent to 1 g of
onion powder per day for a total experiment time of 10 days (Mühlbauer et al. 2002). This
approach of a bioassay-guided fractionation would have been too time-consuming.
Additionally, two in vitro tissue-culture models of bone resorption failed to show any
inhibitory activity of fraction A. Therefore, we used the osteoclast pit assay to assess bone
resorbing inhibitory activity. This cell-culture assay offered the important advantage over an
in vivo approach that smaller amounts of onion fractions, e.g. in the mg range, could be used
to assess their activity. Consequently, a fractionation of fraction A was started using
preparative chromatography techniques in order to test the inhibitory bone resorbing activities
of the recovered fractions in vitro.
3.2.1 Fractionation of fraction A by reversed phase - medium pressure liquid
chromatography
In order to narrow down the search for the active constituents of fraction A, and because dry
onion powder contains up to 50 % (w/w) of the inactive saccharides fructose, glucose and
sucrose (Jaime et al. 2001), the first challenge consisted in separating these carbohydrates
from the other compounds of interest.
For this purpose, preliminary reversed phase - high performance thin layer chromatography
(RP-HPTLC) experiments had shown that a RP-HPTLC system, using 5 % aqueous methanol
as mobile phase, enabled an appropriate isolation of the mentioned sugars showing an
appearance at the elution front of the RP-HPTLC. Due to their high polarity, they were clearly
separated from other compounds. Consequently, this method was directly scaled-up on a
reversed phase - medium pressure liquid chromatography (RP-MPLC) column and aliquots of
1.0 g of fraction A were used for further separation. Higher sample amounts were not injected
in order to avoid column overloading. As no compounds absorbing at UV 254 nm or 366 nm
24
could be observed in fraction A the monitoring of the fractionation process had to be
performed by RP-HPTLC using the anisaldehyde reagent (Wagner et al. 1983) for detection.
This reagent was chosen for visualization because it reacts with hydroxyl groups, especially
with those of saccharides, resulting in red- or blue-colored complexes (Becker at al. 1996).
After TLC screening, equal fractions were pooled and freeze dried after removal of methanol
by evaporation. In order to elute completely all the compounds at the end, the RP-MPLC
column was thoroughly eluted after each fractionation run with 100 % methanol, a solvent of
much higher elution strength for reversed phases than 5 % aqueous methanol (Hostettmann et
al. 1985).
3.2.1.1 Results
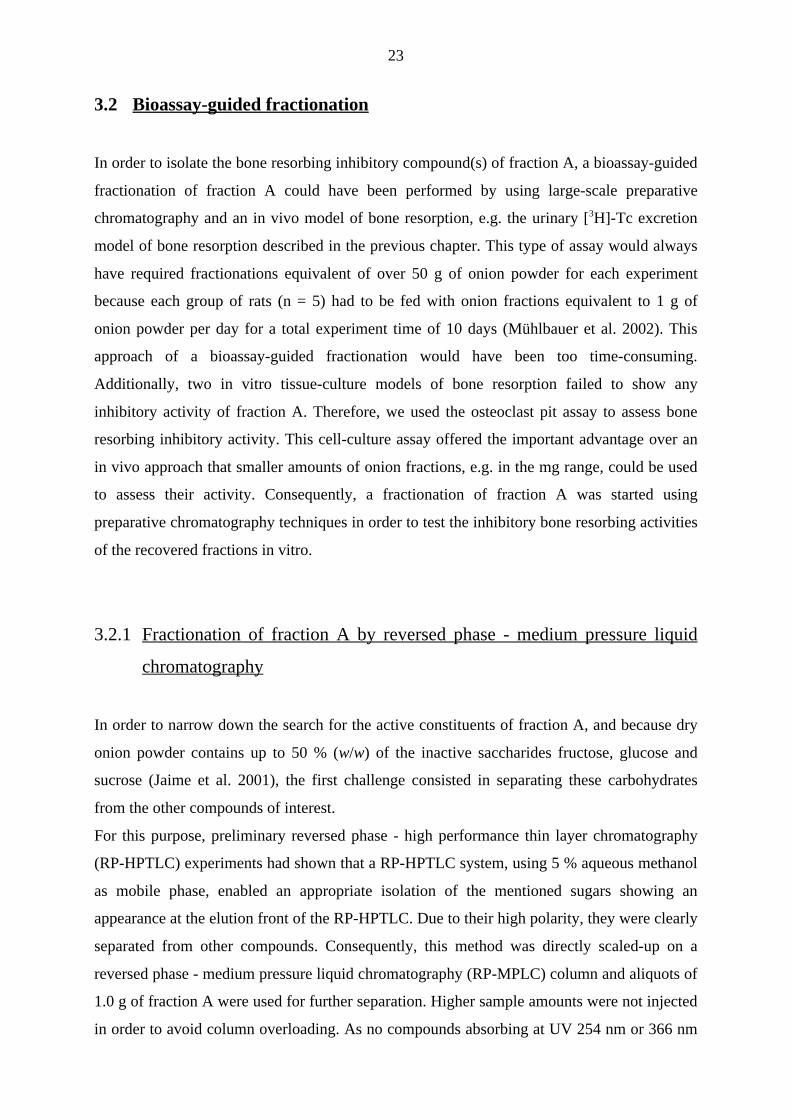
As can be seen in Fig. 7 the pooled saccharides fructose, glucose and sucrose (no. 6) of the
starting material, i.e. fraction A (no. 5), eluted at the front like the reference saccharides alone
and a mixture thereof (no. 1 - 4), clearly separated from the other compounds (no. 7). The
fraction containing the reference saccharides was named „Fraction A1“ whereas the fraction
devoid of these saccharides „Fraction A2“. The yields of the pooled fractions A1 and A2 from
twelve RP-MPLC fractionations are summarized in Table 3.
25
1 Fructose 5 Fraction A
2 Glucose 6 Fraction A1
3 Sucrose 7 Fraction A2
4 Fructose, glucose & sucrose
Figure 7: RP-HPTLC of pooled RP-MPLC fractions A1 and A2 of fraction A (for
methods see chapter 5.4.1.3.2)
Fraction Yield [g] Yield [%]
A1 4.75 36.5
A2 7.18 55.2
Total 11.93 91.7
Table 3: Yields of RP-MPLC fractions A1 and A2
Fractions A1 and A2 were tested together with calcitonin as positive control and/or with
fraction A in order to directly compare the activities with respect to the starting material.
Fraction A1 was tested in a dose-response like manner at a 1-, 2- and 2.5-fold equivalent yield
corresponding to fraction A (12, 24 and 30 mg/ml) whereas fraction A2 was tested either at
1 2 3 4 5 6 7
26
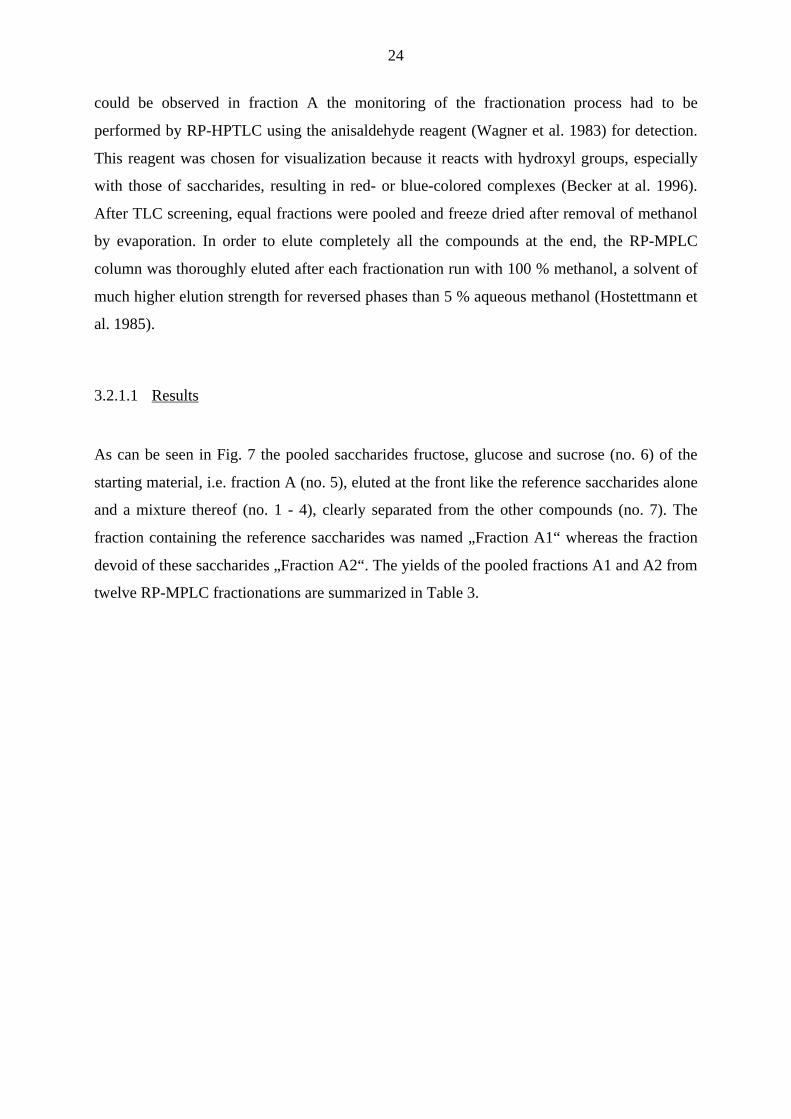
the 1-fold equivalent yield equivalent to fraction A (18 mg/ml, not shown) or at a dose of 30
mg/ml. Higher doses than 30 mg per ml were not used in order to prevent a hyper osmotic
toxicity in the cell culture (Fig. 8). For exact values see chapter 7.1.
Figure 8: Osteoclast pit assay of the RP-MPLC fractions A1 and A2 (pits per cell ratios ±
SEM)
3.2.1.2 Discussion and conclusion
As can be seen in Fig. 8 fraction A1 did not significantly inhibit osteoclast activity tested at
the 1-fold proportional amount (12 mg/ml). The double dose (24 mg/ml) decreased osteoclast
activity significantly to a pits/cells ratio of 0.144 (- 40 % compared to 12 mg/ml). At 30
mg/ml an even stronger inhibition of osteoclast activity, i.e. 0.015 and 0.020 pits/cell (- 90 %
compared to 12 mg/ml) could be measured. Thus, we concluded that fraction A1 contained
the compound(s), which inhibited osteoclast activity.
In contrast to that, fraction A2 showed only a low inhibition of osteoclast activity at the
maximum dose of 30 mg/ml (0.399 and 0.384 pits/cell). Residues of compounds from fraction

27
A1 could explain the slight osteoclast activity inhibition of fraction A2, detectable by RP-
HPTLC.
Thus, fraction A1 was subjected to further bioassay-guided fractionation whereas fraction A2
was discarded. However, the bone resorbing inhibitory compound(s) were still eluting with
the saccharides and therefore an additional fractionation had to be performed to separate the
saccharides from the active component(s).
28
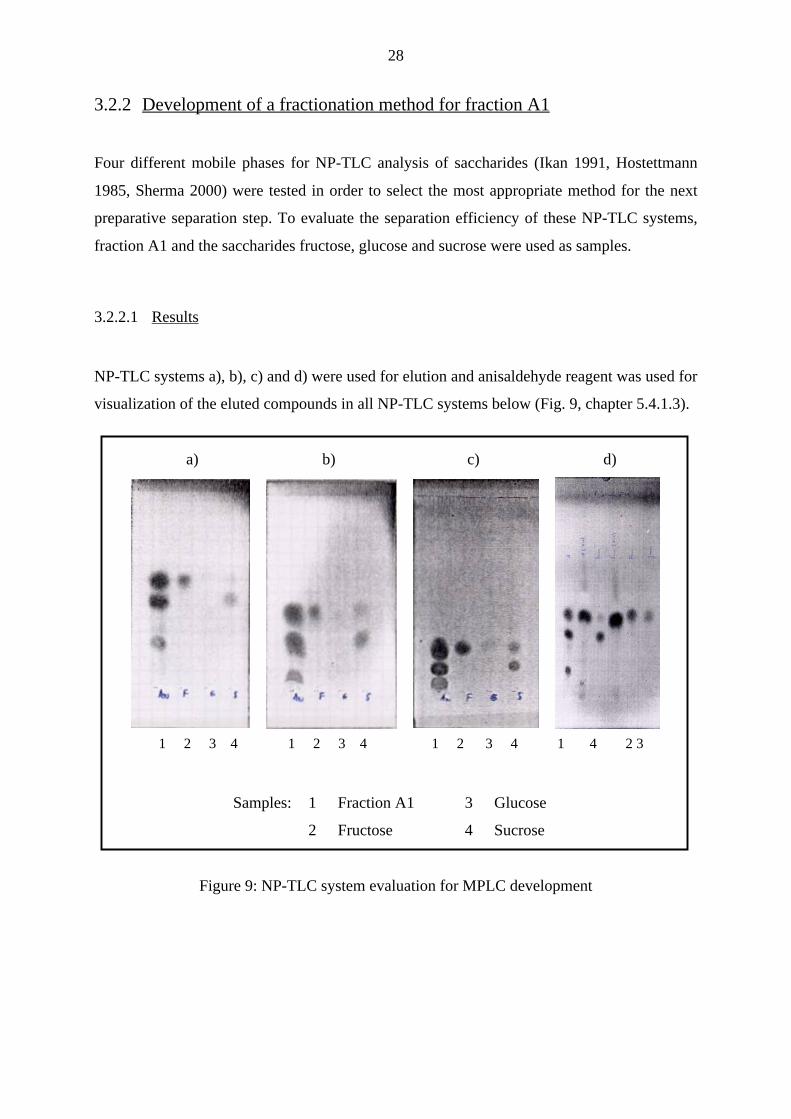
3.2.2 Development of a fractionation method for fraction A1
Four different mobile phases for NP-TLC analysis of saccharides (Ikan 1991, Hostettmann
1985, Sherma 2000) were tested in order to select the most appropriate method for the next
preparative separation step. To evaluate the separation efficiency of these NP-TLC systems,
fraction A1 and the saccharides fructose, glucose and sucrose were used as samples.
3.2.2.1 Results
NP-TLC systems a), b), c) and d) were used for elution and anisaldehyde reagent was used for
visualization of the eluted compounds in all NP-TLC systems below (Fig. 9, chapter 5.4.1.3).
a) b) c) d)
Samples: 1 Fraction A1 3 Glucose
2 Fructose 4 Sucrose
Figure 9: NP-TLC system evaluation for MPLC development
1 2 3 4 1 2 3 4 1 2 3 4 1 4 2 3
29
3.2.2.2 Discussion and conclusion
As can be seen by Fig. 9 in all of these TLC-systems the saccharides fructose, glucose and
sucrose eluted clearly separated from other compounds of fraction A1. The elution profiles
were similar and a clear advantage of one system over another concerning a more accurate
separation was not visible. The NP-TLC system b) was eliminated because the silica gel layer
on the bottom of the aluminium plate was dissolved, which would have lead to considerable
amounts of silica in NP-MPLC fractions later on. Preliminary solubilisation experiments of
0.5 g of a mixture of equal parts of fructose, glucose and sucrose to mimic fraction A1 in 5 ml
of either NP-TLC system a), c) or d) showed a strong precipitation of the saccharides in NP-
TLC systems a) and c), whereas only an slight opalescent turbidity in NP-TLC system d) was
observed. Therefore, in order to inject a totally dissolved sample into the MPLC system and
to prevent precipitations on the column, NP-TLC system d) was chosen to perform the next
preparative separation step.
3.2.3 Fractionation of fraction A1 by normal phase - medium pressure liquid
chromatography
To further isolate the active constituents of fraction A1 NP-TLC system d) was directly
scaled-up on a NP-MPLC column and samples of 400 mg of fraction A1 were subjected to
fractionation. Higher sample amounts were not injected to avoid column overloading.
Fractionation monitoring was performed by TLC with NP-TLC system c) and using fructose,
glucose and sucrose as standards. Anisaldehyde reagent was again used as detection reagent.
Equal fractions were pooled and after removal of the organic solvents the aqueous phases
were freeze-dried.
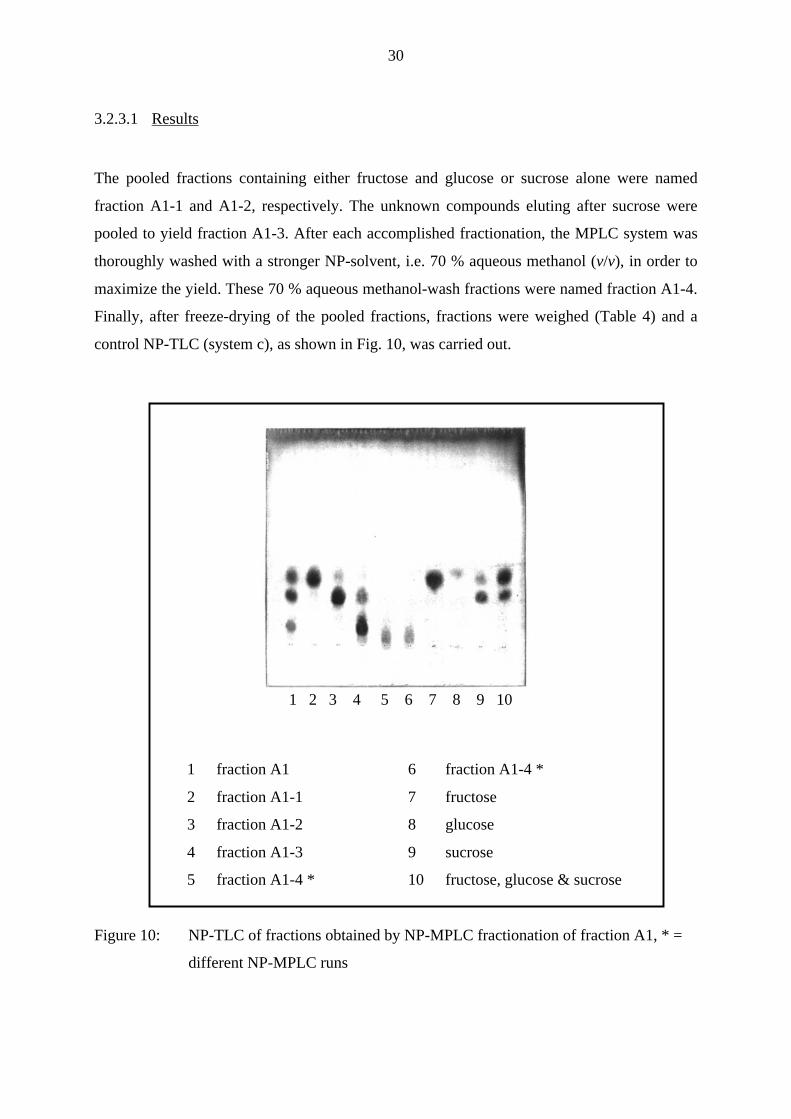
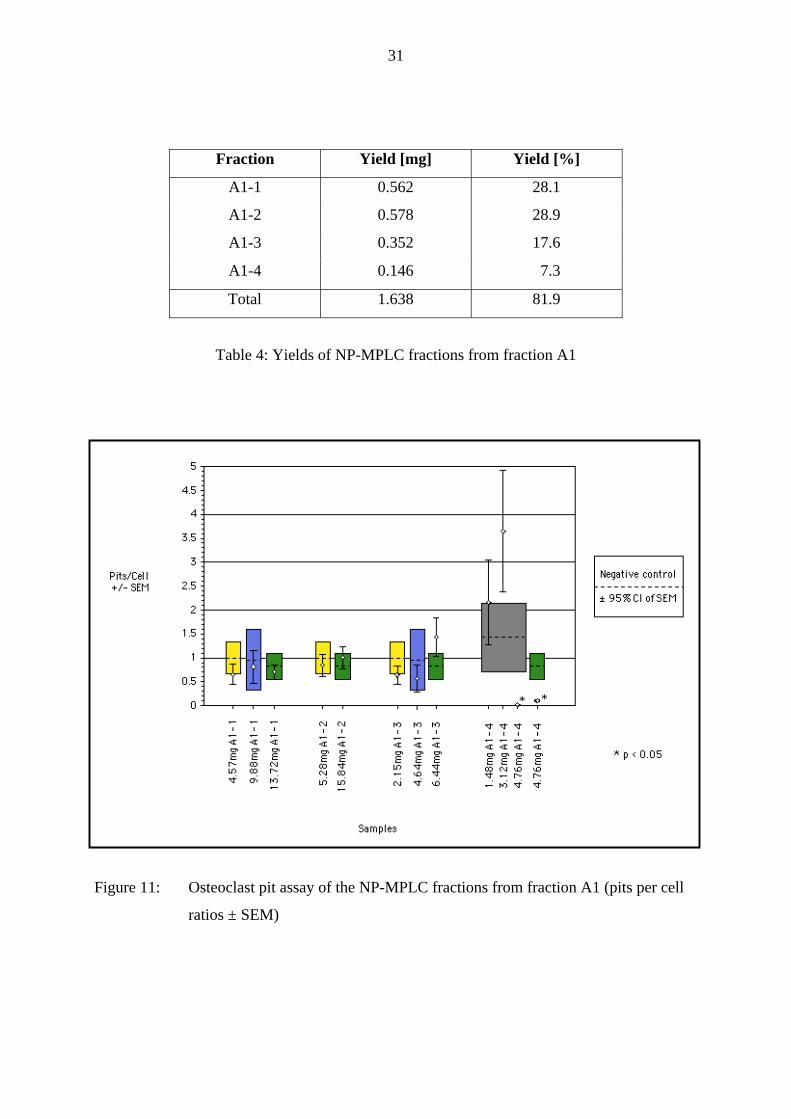
Doses shown in Fig. 11 are in mg per ml and results are given as resorption pits per TRAP+
cells ± SEM. In order to counteract losses during the fractionation, fractions A1-1, A1-3 and
A1-4 were all tested at the 1-, 2- and 3-fold proportional amount of their respective yields
compared to fraction A, whereas fraction A1-2 was tested only at the 1- and 3-fold
proportional amount due to testing restrictions in the assay. For exact values see Ch. 7.1.
30
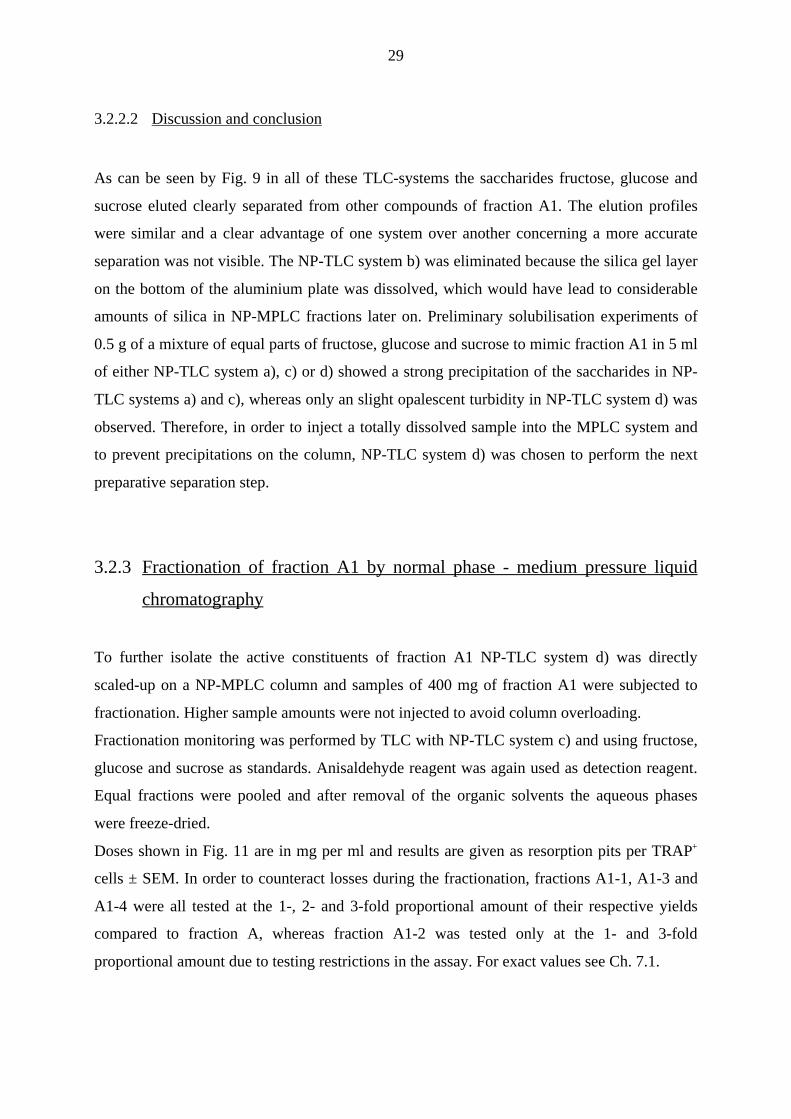
3.2.3.1 Results
The pooled fractions containing either fructose and glucose or sucrose alone were named
fraction A1-1 and A1-2, respectively. The unknown compounds eluting after sucrose were
pooled to yield fraction A1-3. After each accomplished fractionation, the MPLC system was
thoroughly washed with a stronger NP-solvent, i.e. 70 % aqueous methanol (v/v), in order to
maximize the yield. These 70 % aqueous methanol-wash fractions were named fraction A1-4.
Finally, after freeze-drying of the pooled fractions, fractions were weighed (Table 4) and a
control NP-TLC (system c), as shown in Fig. 10, was carried out.
1 fraction A1 6 fraction A1-4 *
2 fraction A1-1 7 fructose
3 fraction A1-2 8 glucose
4 fraction A1-3 9 sucrose
5 fraction A1-4 * 10 fructose, glucose & sucrose
Figure 10: NP-TLC of fractions obtained by NP-MPLC fractionation of fraction A1, * =
different NP-MPLC runs
1 2 3 4 5 6 7 8 9 10
31
Fraction Yield [mg] Yield [%]
A1-1 0.562 28.1
A1-2 0.578 28.9
A1-3 0.352 17.6
A1-4 0.146 7.3
Total 1.638 81.9
Table 4: Yields of NP-MPLC fractions from fraction A1
Figure 11: Osteoclast pit assay of the NP-MPLC fractions from fraction A1 (pits per cell
ratios ± SEM)
32
3.2.3.2 Discussion and conclusion
As can be seen in Fig. 10 the evaluated NP-MPLC system did properly separate fructose,
glucose and sucrose from fraction A1, the starting material (no. 1). Fraction A1-3 (no. 4)
contained still traces of sucrose, however, fraction A1-4 (no. 5 and 6), obtained after elution
of the column with 70 % aqueous methanol, was completely devoid of the three major mono-
and disaccharides (no. 7 - 10).
Fractions A1-1 and A1-2, containing the mono- and disaccharides, made up the major part of
fraction A1, namely almost 60 % (w/w, Table 4), whereas fractions A1-3 and A1-4 compared
to fraction A1 were 17.6 % and only 7.3 % (w/w), respectively. However, a loss of nearly 20
% of fraction A1 couldn’t be avoided although the column had been washed with 70 %
aqueous methanol.
As can be seen in Fig. 11 no osteoclast activity inhibition could be measured at all in fractions
A1-1, A1-2 and A1-3: The pits per cell ± SEM ratios of these fractions were all inside or
overlapping the 95 % confidence interval of the SEM of the negative control and therefore the
treatment with these samples did not have a significant effect on resorptive activity.
However, fraction A1-4 showed two times a significant osteoclast activity inhibition in two
independent assays, although only at the 3-fold proportional dose. At the 1- and 2-fold dose
the apparent stimulation of the cell activity in one assay could be explained by a strong
decrease of cell number in this assay.
Therefore, fraction A1-4 was chosen to be further fractionated. It was completely devoid of
the inactive sugars fructose, glucose and sucrose and showed a significant inhibition on
osteoclast activity.
3.2.4 Fractionation of fraction A1-4 by semi preparative - reversed phase - high
performance liquid chromatography
In the next fractionation step fraction A1-4 was subjected to semi preparative (SP) RP-HPLC
in order to locate more precisely the bone resorbing inhibitory molecule(s). The advantage of
SP-RP-HPLC over an MPLC system was due to the fact, that a more accurate separation of
compounds could be accomplished if the detected peaks didn’t overlap and if their baselines
were clearly separated from each other (Hostettmann 1985). Preliminary RP-HPLC
experiments performed with fraction A1-4 showed that an isocratic system using water and

33
acetonitrile was suited to separate fraction A1-4 at a semi preparative scale. To stabilize the
mobile phase formic acid was added which allowed complete removal by evaporation and
freeze-drying due to its low boiling point of 46.0°C (Becker et al. 1996).
34
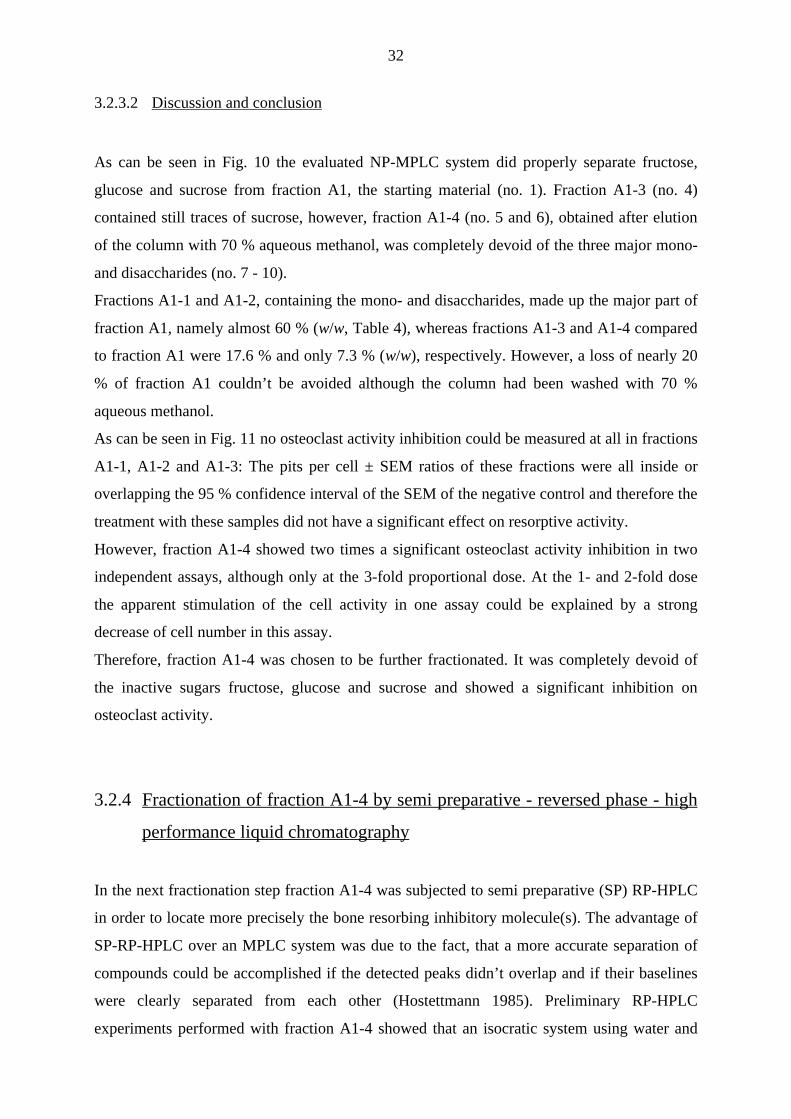
3.2.4.1 Results
Due to the lack of strong chromophores in fraction A1-4 detection was carried by diode array
detection (DAD) and measuring in the low UV range at 195 nm, as shown in the DAD
chromatogram in Fig. 12. Fractionation was performed manually by switching a valve at the
outlet line of the HPLC. Fraction A1-4 was separated in fractions A1-4A and A1-4D, i.e. the
pre- and the after-run, respectively, in fraction A1-4 B, consisting mainly of two peaks, and
finally in fraction A1-4C, containing the major peak. Equal fractions were pooled, the
acetonitrile was evaporated and the aqueous solution freeze-dried. The yields are summarized
in Table 5.
Figure 12: HPLC-DAD profile and fractionation ranges of fraction A1-4
A1-4A A1-4B A1-4C A1-4D
35
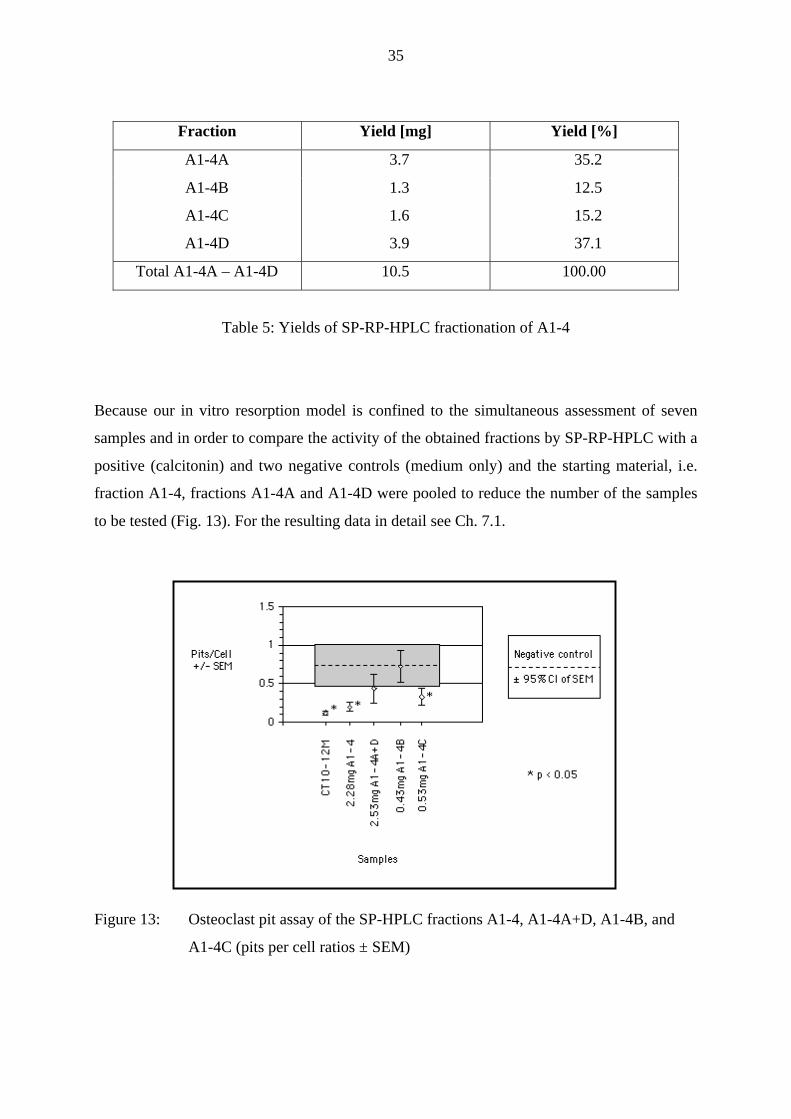
Fraction Yield [mg] Yield [%]
A1-4A 3.7 35.2
A1-4B 1.3 12.5
A1-4C 1.6 15.2
A1-4D 3.9 37.1
Total A1-4A – A1-4D 10.5 100.00
Table 5: Yields of SP-RP-HPLC fractionation of A1-4
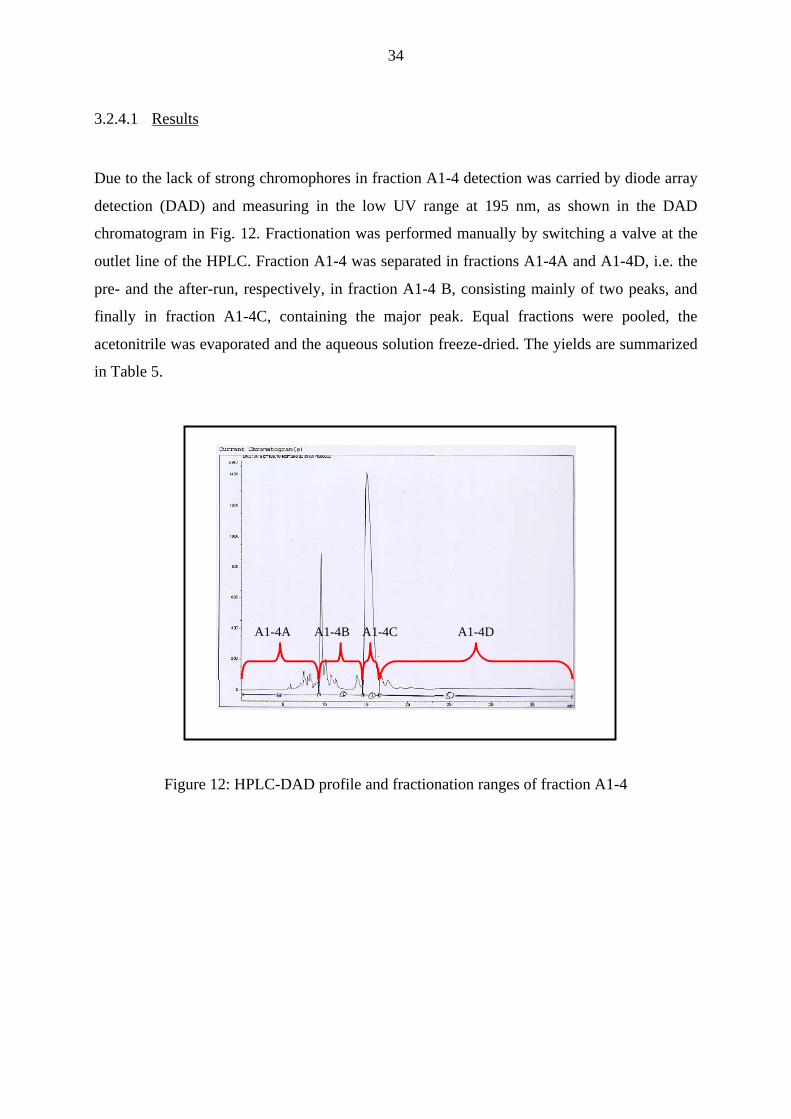
Because our in vitro resorption model is confined to the simultaneous assessment of seven
samples and in order to compare the activity of the obtained fractions by SP-RP-HPLC with a
positive (calcitonin) and two negative controls (medium only) and the starting material, i.e.
fraction A1-4, fractions A1-4A and A1-4D were pooled to reduce the number of the samples
to be tested (Fig. 13). For the resulting data in detail see Ch. 7.1.
Figure 13: Osteoclast pit assay of the SP-HPLC fractions A1-4, A1-4A+D, A1-4B, and
A1-4C (pits per cell ratios ± SEM)
36
3.2.4.2 Discussion and conclusion
As can be seen in Fig. 13 only the positive control, fraction A1-4 at the 3-fold proportional
dose corresponding to fraction A1, and fraction A1-4C were significantly inhibiting bone
resorption (all p < 0.5). Moreover, fraction A1-4C inhibited osteoclast activity nearly as
strong as fraction A1-4, indicating A1-4C to be the single active bone resorptive inhibitory
component in fraction A1-4.
All the other fractions, i.e. the pooled fractions A1-4A and A1-4D, and fraction A1-4B,
containing the second major component of fraction A1-4, overlapped the 95 % confidence
interval of SEM of the negative control and were therefore regarded as inactive.
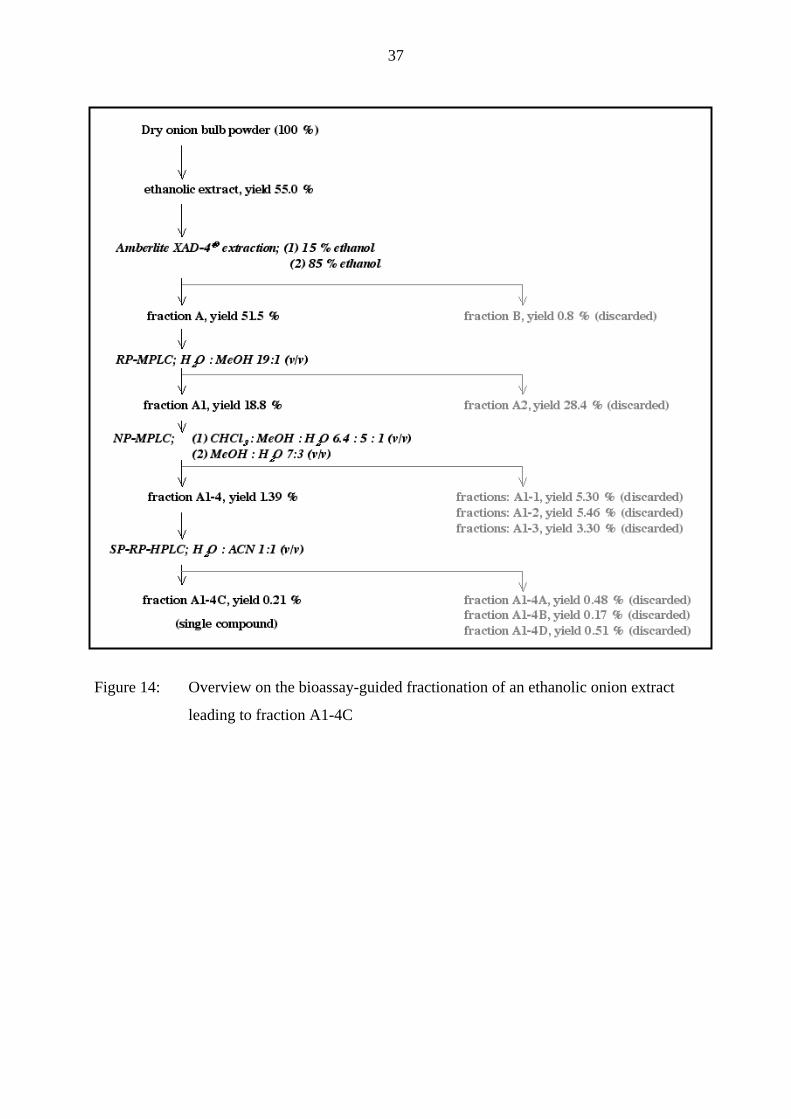
3.2.5 Overview on the bioassay-guided fractionation
As summarized by Fig. 14 the isolation of a fraction containing a single compound from an
ethanolic bulb extract from onion, namely fraction A1-4C, could be accomplished. All the
fractions on the right side of Fig. 14 showed either only a weak osteoclast activity inhibition,
e.g. fraction A2, or none, like fractions A1-1, A1-2 and A1-3, or, as in the case of fraction B,
were even cell-toxic.
On the other hand, the fractions on the left side of Fig. 14 showed all an inhibition of
osteoclast activity which finally led to the isolation of fraction A1-4C. The yield of fraction
A1-4C compared to onion powder was 0.21 % (w/w) which corresponded to a purification
factor of 476 compared to the weight of the starting material. Compared to fraction A a
purification factor of 245 was achieved. Unfortunately, only about 10 mg of fraction A1-4
were left after the whole fractionation procedure, thus preventing a reproduction of this
experiment. Therefore, the remaining 10 mg of fraction A1-4 were again subjected to SP-RP-
HPLC and the resulting fraction A1-4C only used for structure elucidation experiments.
37
Figure 14: Overview on the bioassay-guided fractionation of an ethanolic onion extract
leading to fraction A1-4C
38
3.3 Structure elucidation of A1-4C
In this chapter the results obtained by means of mass spectroscopy (MS) and nuclear magnetic
resonance (NMR) spectroscopy of fraction A1-4C are presented. The obtained data helped to
clarify the three-dimensional structure of fraction A1-4C.
3.3.1 High performance liquid chromatography - electrospray ionization - mass
spectroscopy of A1-4C
In order to get first structural informations, A1-4C was subjected to analysis by gas-
chromatography-electron impact-mass spectroscopy (GC-EI-MS). However, no useful data
resulted as the compound apparently decomposed due to its thermolability. Therefore, the MS
experiments were performed using a RP-HPLC electrospray ionization (ESI) MS equipment.
This mass spectrometric technique is used for compounds that have a high molecular weight
or are too polar and sensitive to heat to be analyzed by GC, as it was the case for A1-4C
(Rücker et al. 1992). The most common ionization principles interfaced to HPLC are ESI but
also atmospheric pressure chemical ionization (APCI) in both positive and negative ionization
modes. ESI-MS is used for masses ranging from m/z 50 up to m/z 2’000 and is less sensitive
than GC-EI-MS machines, therefore the detection is limited to the microgram level. HPLC-
ESI-MS can be used to analyze non-volatile compounds including peptides, proteins,
oligonucleotides and lipids (Cole 1997).
Hence, this technique would deliver important information about our compound, e.g. the
molecular weight. Therefore, in parallel to the detection by DAD, mass detection and
fragmentation of fraction A1-4C was achieved by colliding the charged molecule with helium
gas.
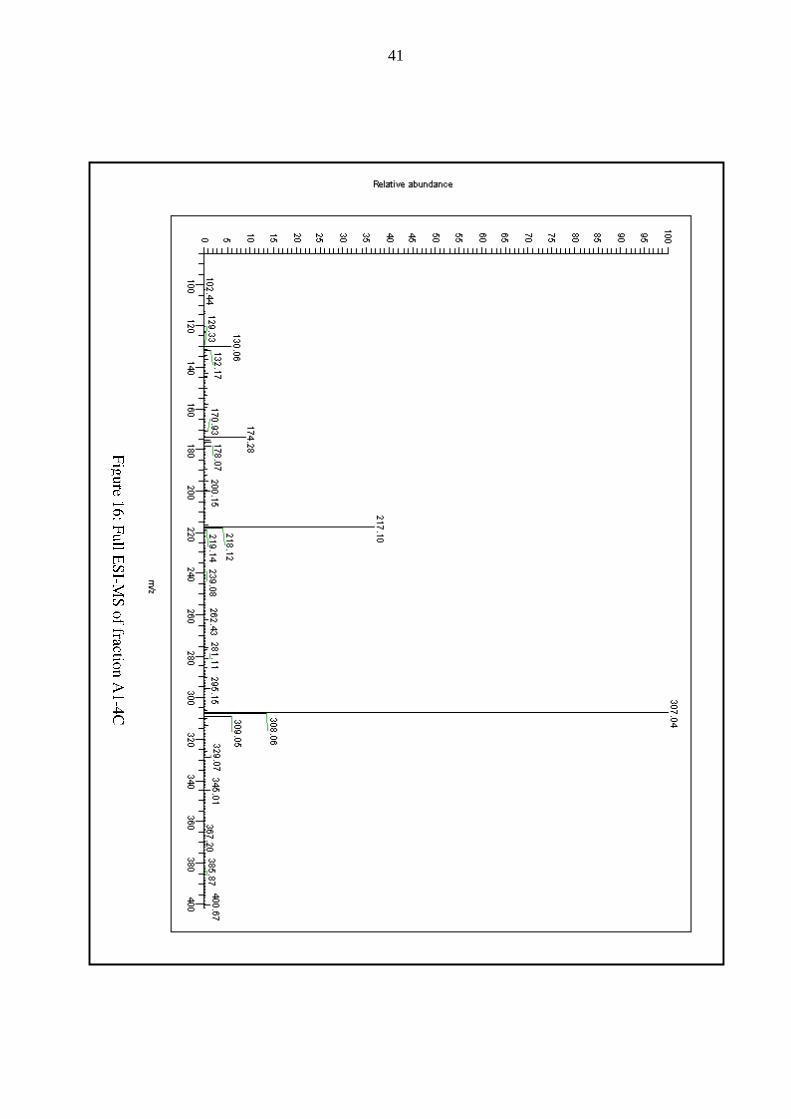
3.3.1.1 Results
In the positive ionization mode a parent ion of m/z 307 (Fig. 16) was detected whereas in the
negative mode a parent ion of m/z 305 could be measured. Thus, the uncharged molecular ion
of the compound in fraction A1-4C was 306 u. Additionally, the ability of this compound to
ionize positively as well negatively, revealed the presence of amino and carboxylic groups,
39
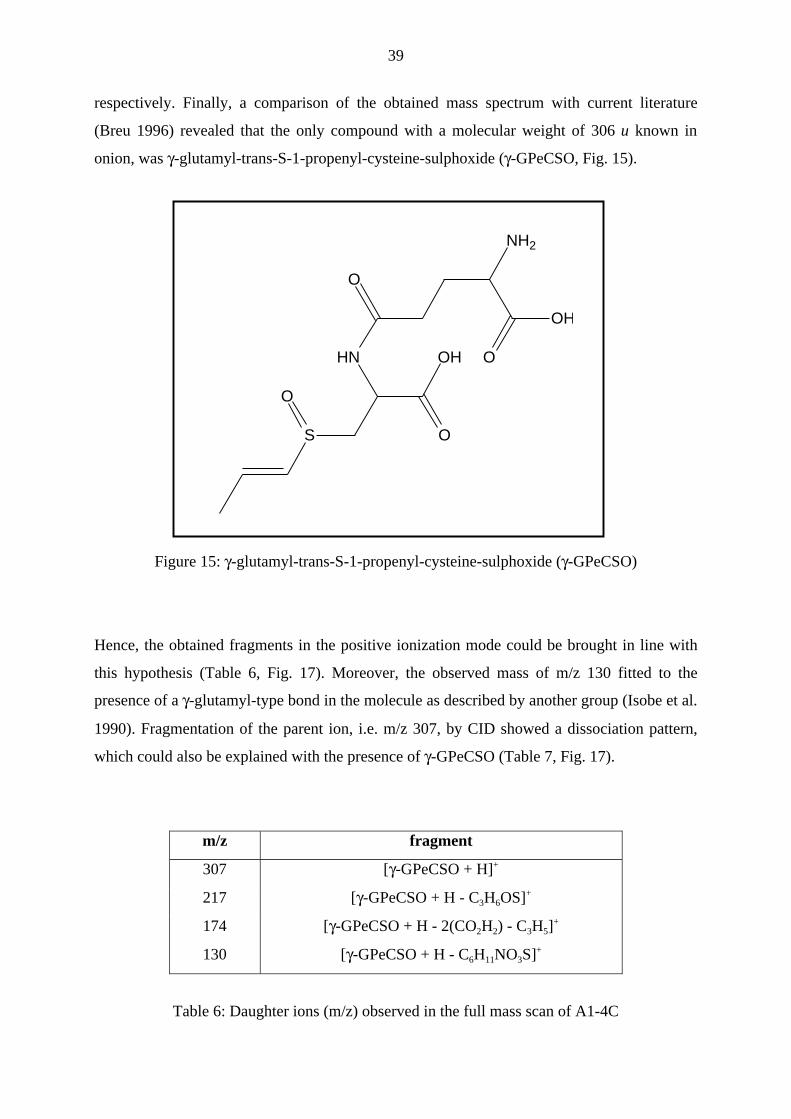
respectively. Finally, a comparison of the obtained mass spectrum with current literature
(Breu 1996) revealed that the only compound with a molecular weight of 306 u known in
onion, was γ-glutamyl-trans-S-1-propenyl-cysteine-sulphoxide (γ-GPeCSO, Fig. 15).
S
O
O
OHHN
O
NH2
OH
O
Figure 15: γ-glutamyl-trans-S-1-propenyl-cysteine-sulphoxide (γ-GPeCSO)
Hence, the obtained fragments in the positive ionization mode could be brought in line with
this hypothesis (Table 6, Fig. 17). Moreover, the observed mass of m/z 130 fitted to the
presence of a γ-glutamyl-type bond in the molecule as described by another group (Isobe et al.
1990). Fragmentation of the parent ion, i.e. m/z 307, by CID showed a dissociation pattern,
which could also be explained with the presence of γ-GPeCSO (Table 7, Fig. 17).
m/z fragment
307 [γ-GPeCSO + H]+
217 [γ-GPeCSO + H - C3H6OS]+
174 [γ-GPeCSO + H - 2(CO2H2) - C3H5]+
130 [γ-GPeCSO + H - C6H11NO3S]+
Table 6: Daughter ions (m/z) observed in the full mass scan of A1-4C

40
m/z fragment
217 [γ-GPeCSO + H - C3H6OS]+
178 [γ-GPeCSO + H - C5H7NO3]+
130 [γ-GPeCSO + H - C6H11NO3S]+
Table 7: Daughter ions (m/z) observed in the full mass scan after fragmentation of A1-4C
41
42
S
OH
O
O
HN
O
NH3+
OH
O
+H2C
OH
O
HN
O
NH2
OH
O
S
OH
O
O
+H3N
O
NH2
COOH+
m/z 130
- C6H11NO3S
- C5H7NO3
- C3H6OS
- 2 HCOOH- C3H5
m/z 307
m/z 217
m/z 174
m/z 178
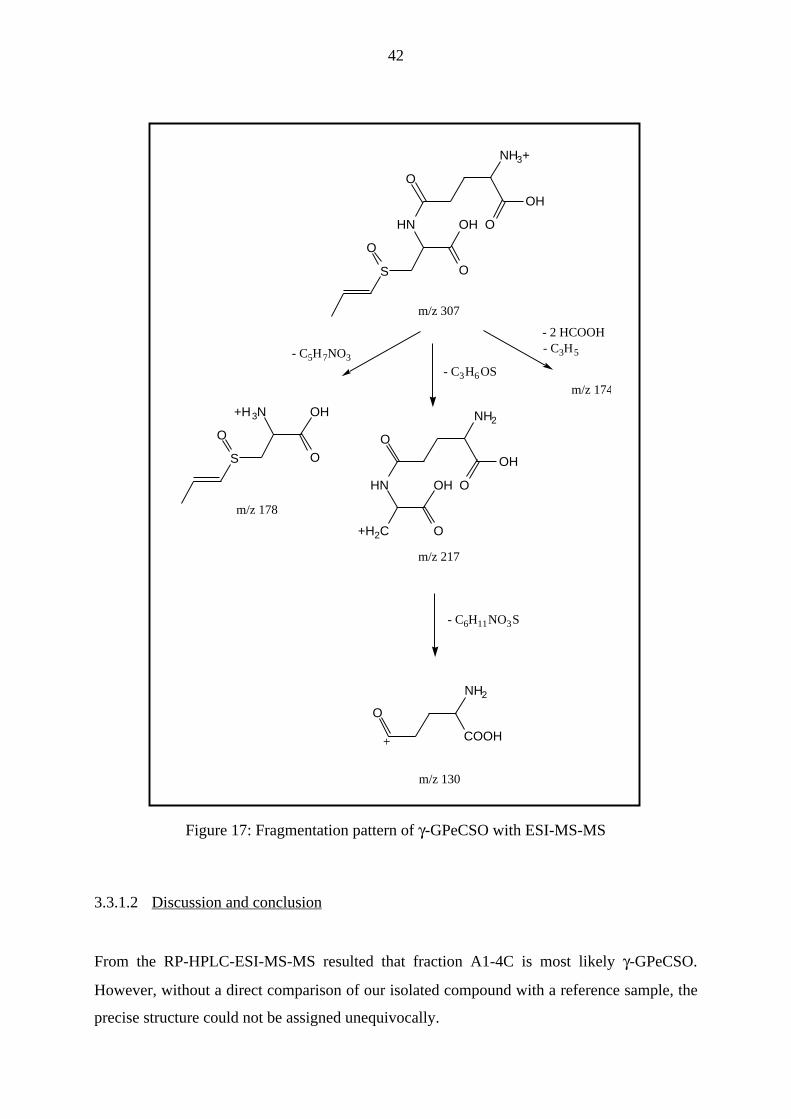
Figure 17: Fragmentation pattern of γ-GPeCSO with ESI-MS-MS
3.3.1.2 Discussion and conclusion
From the RP-HPLC-ESI-MS-MS resulted that fraction A1-4C is most likely γ-GPeCSO.
However, without a direct comparison of our isolated compound with a reference sample, the
precise structure could not be assigned unequivocally.
43
3.3.2 Electrospray ionization - mass spectroscopy of A1-4C after acid
hydrolysis
In order to confirm the structural results obtained by RP-HPLC-ESI-MS-MS, additional direct
inlet ESI-MS-MS experiments were performed after prior acid hydrolysis with formic acid.
Acid hydrolysis is a very often-used method to cleave the compounds of interest, especially if
they contain ester or amid bonds like it was the case of A1-4C (Becker et al. 1996). Therefore,
if the supposed compound would really be γ-GPeCSO, hydrolytic cleavages between the
glutamyl (Glu), cysteine (Cys) and propenyl moiety should occur.
Basically, the principle of direct inlet ESI-MS-MS is the same as for RP-HPLC-ESI-MS-MS
(see Ch. 3.3.1), but with the difference that the sample is not chromatographically separated
prior to detection. All measurements were performed in the positive ionization mode.
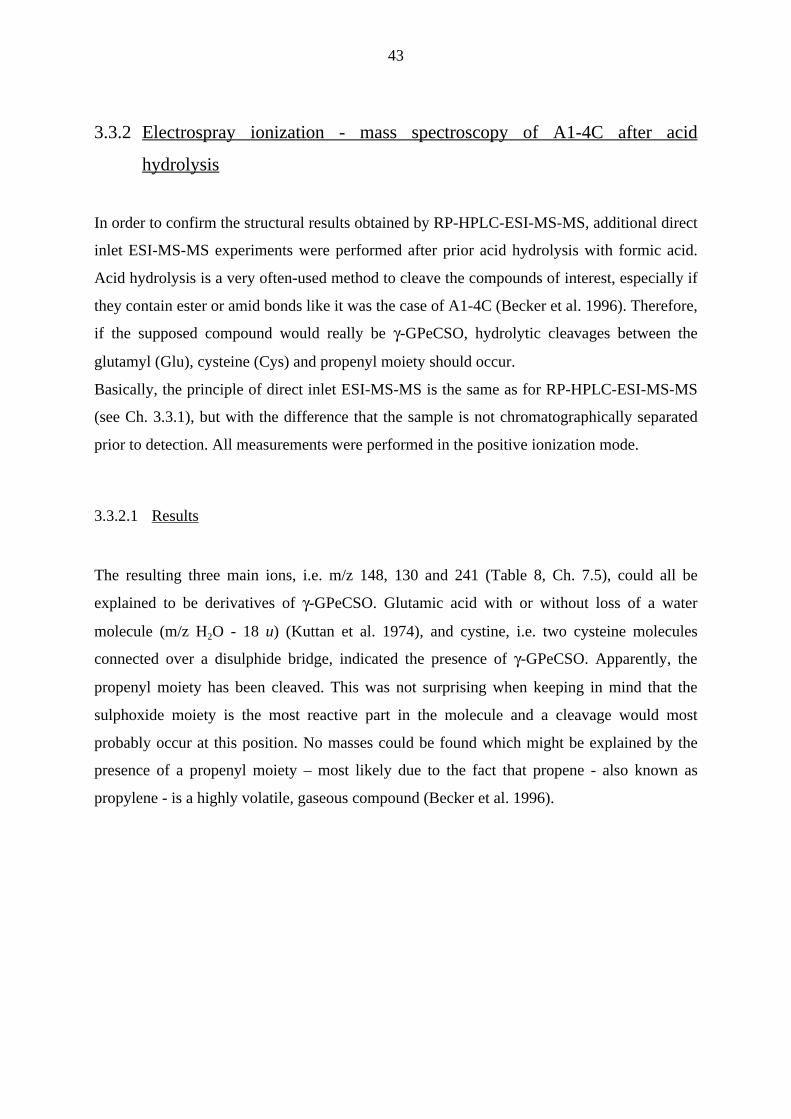
3.3.2.1 Results
The resulting three main ions, i.e. m/z 148, 130 and 241 (Table 8, Ch. 7.5), could all be
explained to be derivatives of γ-GPeCSO. Glutamic acid with or without loss of a water
molecule (m/z H2O - 18 u) (Kuttan et al. 1974), and cystine, i.e. two cysteine molecules
connected over a disulphide bridge, indicated the presence of γ-GPeCSO. Apparently, the
propenyl moiety has been cleaved. This was not surprising when keeping in mind that the
sulphoxide moiety is the most reactive part in the molecule and a cleavage would most
probably occur at this position. No masses could be found which might be explained by the
presence of a propenyl moiety – most likely due to the fact that propene - also known as
propylene - is a highly volatile, gaseous compound (Becker et al. 1996).
44
m/z fragment
148 [Glu + H]+
130 [Glu + H - H2O]+
241 [(Cys)2 + H]+
Table 8: Prominent masses (m/z) found after acidic hydrolysis
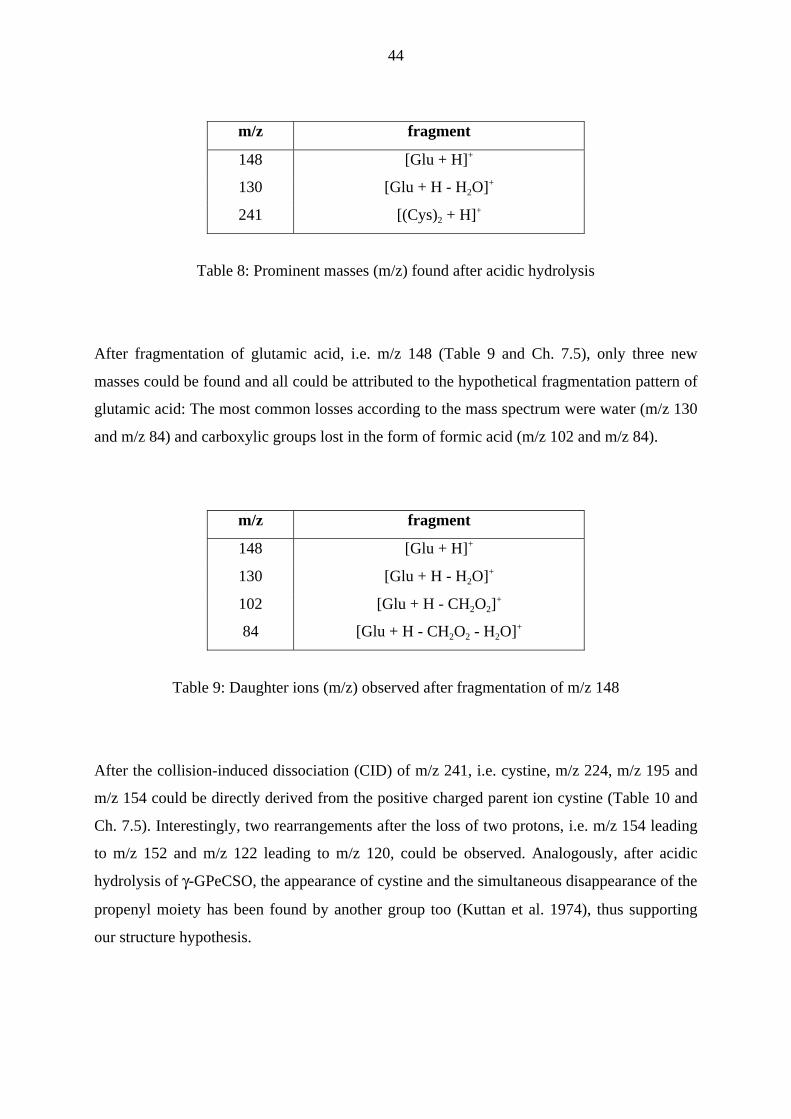
After fragmentation of glutamic acid, i.e. m/z 148 (Table 9 and Ch. 7.5), only three new
masses could be found and all could be attributed to the hypothetical fragmentation pattern of
glutamic acid: The most common losses according to the mass spectrum were water (m/z 130
and m/z 84) and carboxylic groups lost in the form of formic acid (m/z 102 and m/z 84).
m/z fragment
148 [Glu + H]+
130 [Glu + H - H2O]+
102 [Glu + H - CH2O2]+
84 [Glu + H - CH2O2 - H2O]+
Table 9: Daughter ions (m/z) observed after fragmentation of m/z 148
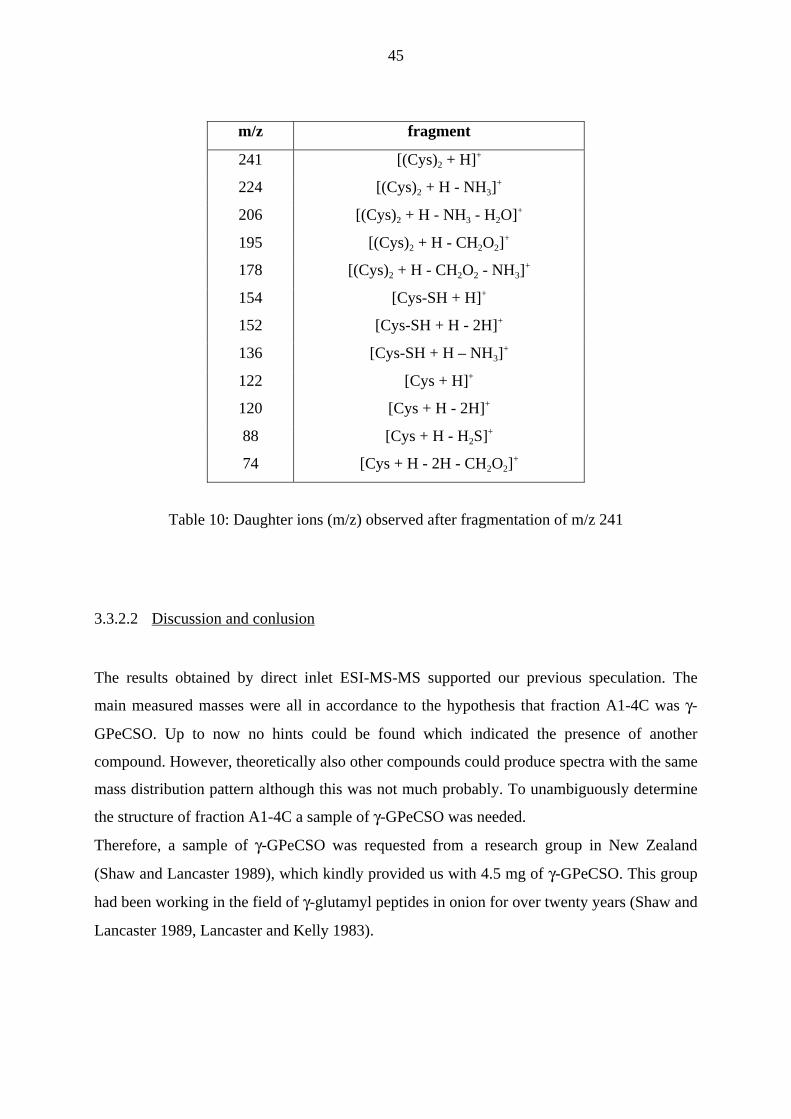
After the collision-induced dissociation (CID) of m/z 241, i.e. cystine, m/z 224, m/z 195 and
m/z 154 could be directly derived from the positive charged parent ion cystine (Table 10 and
Ch. 7.5). Interestingly, two rearrangements after the loss of two protons, i.e. m/z 154 leading
to m/z 152 and m/z 122 leading to m/z 120, could be observed. Analogously, after acidic
hydrolysis of γ-GPeCSO, the appearance of cystine and the simultaneous disappearance of the
propenyl moiety has been found by another group too (Kuttan et al. 1974), thus supporting
our structure hypothesis.
45
m/z fragment
241 [(Cys)2 + H]+
224 [(Cys)2 + H - NH3]+
206 [(Cys)2 + H - NH3 - H2O]+
195 [(Cys)2 + H - CH2O2]+
178 [(Cys)2 + H - CH2O2 - NH3]+
154 [Cys-SH + H]+
152 [Cys-SH + H - 2H]+
136 [Cys-SH + H – NH3]+
122 [Cys + H]+
120 [Cys + H - 2H]+
88 [Cys + H - H2S]+
74 [Cys + H - 2H - CH2O2]+
Table 10: Daughter ions (m/z) observed after fragmentation of m/z 241
3.3.2.2 Discussion and conlusion
The results obtained by direct inlet ESI-MS-MS supported our previous speculation. The
main measured masses were all in accordance to the hypothesis that fraction A1-4C was γ-
GPeCSO. Up to now no hints could be found which indicated the presence of another
compound. However, theoretically also other compounds could produce spectra with the same
mass distribution pattern although this was not much probably. To unambiguously determine
the structure of fraction A1-4C a sample of γ-GPeCSO was needed.
Therefore, a sample of γ-GPeCSO was requested from a research group in New Zealand
(Shaw and Lancaster 1989), which kindly provided us with 4.5 mg of γ-GPeCSO. This group
had been working in the field of γ-glutamyl peptides in onion for over twenty years (Shaw and
Lancaster 1989, Lancaster and Kelly 1983).
46
3.3.3 Nuclear magnetic resonance experiments of A1-4C
Nuclear magnetic resonance (NMR) spectroscopy is by far the most powerful spectroscopic
technique to obtain detailed structural information about organic compounds. NMR is a
technique for studying nuclear magnetic mechanisms. Briefly, nuclei that have a nonzero spin
quantum number (e. g. 1H/ 13C) are placed into a strong magnetic field, where they can occupy
either of two possible energy states. Depending on their surrounding electron density, the
observed nuclei are able to absorb energy if they are irradiated with the correct radio
frequency. This results in an emission signal from the excited nuclei. Fourier transformation
of this emission signal yields the NMR spectrum. The NMR technique defines not only the
number and types of nuclei present in a molecule but also supplies information about their
individual chemical environments and their connections by showing neighbouring
relationships. Given a molecular mass, NMR spectroscopy can usually provide all the
additional information to unambiguously identify a completely unknown compound
(Friebolin 1998).
3.3.3.1 Results
Due to the high polarity of compound A1-4C and consequently its insolubility in organic
solvents, the analysis had to be performed in D2O, thus disabling the measurement of possible
protons of amino and carboxylic groups. In order to not contaminating the sample with an
internal standard, an external standard, i.e. trimethylsilyl-propane-sulphonic acid, was used.
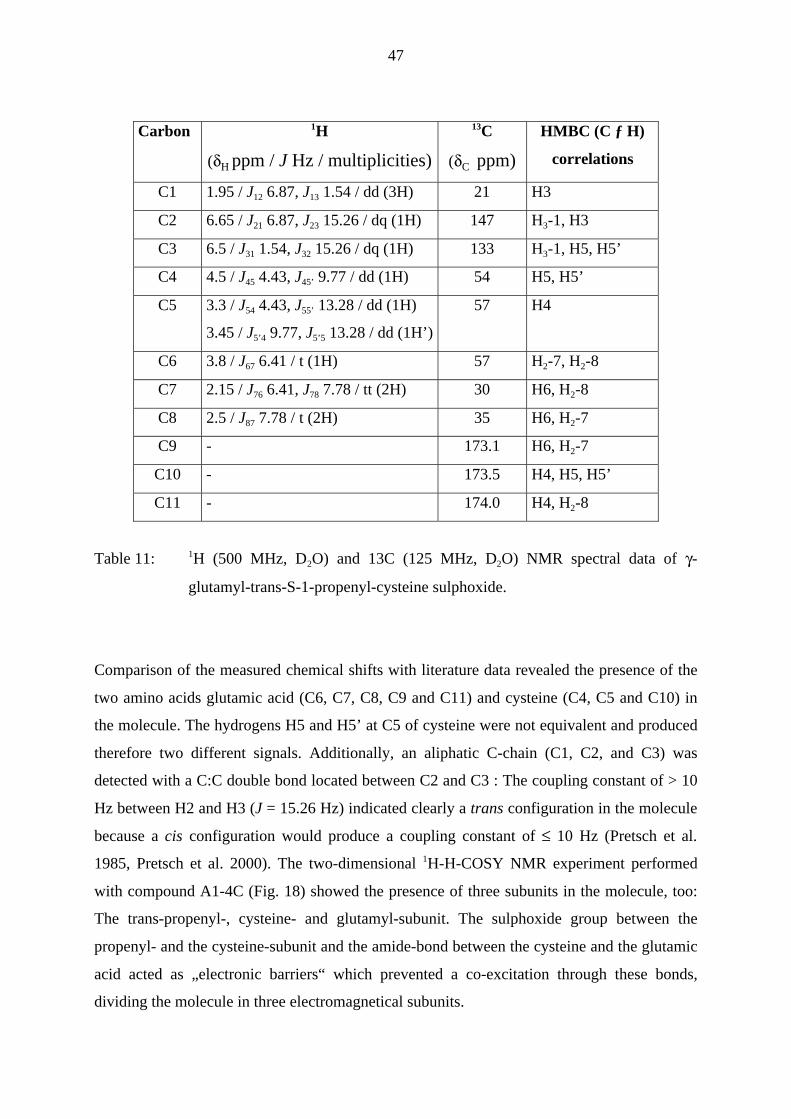
The data from the 1H-NMR and 1JCH-COSY-NMR experiments provided first structural
information about the compound in fraction A1-4C. Due to the small amount of analyte, the1JCH-COSY NMR experiment was performed by detection of the protons after a prior 13C-
excitation, thus enabling to determine the correlation of the protons with their corresponding
C-atoms (Table 11).
47
Carbon 1H
(δH ppm / J Hz / multiplicities)
13C
(δC ppm)
HMBC (C ƒ H)
correlations
C1 1.95 / J12 6.87, J13 1.54 / dd (3H) 21 H3
C2 6.65 / J21 6.87, J23 15.26 / dq (1H) 147 H3-1, H3
C3 6.5 / J31 1.54, J32 15.26 / dq (1H) 133 H3-1, H5, H5’
C4 4.5 / J45 4.43, J45’ 9.77 / dd (1H) 54 H5, H5’
C5 3.3 / J54 4.43, J55’ 13.28 / dd (1H)
3.45 / J5’4 9.77, J5’5 13.28 / dd (1H’)
57 H4
C6 3.8 / J67 6.41 / t (1H) 57 H2-7, H2-8
C7 2.15 / J76 6.41, J78 7.78 / tt (2H) 30 H6, H2-8
C8 2.5 / J87 7.78 / t (2H) 35 H6, H2-7
C9 - 173.1 H6, H2-7
C10 - 173.5 H4, H5, H5’
C11 - 174.0 H4, H2-8
Table 11: 1H (500 MHz, D2O) and 13C (125 MHz, D2O) NMR spectral data of γ-
glutamyl-trans-S-1-propenyl-cysteine sulphoxide.
Comparison of the measured chemical shifts with literature data revealed the presence of the
two amino acids glutamic acid (C6, C7, C8, C9 and C11) and cysteine (C4, C5 and C10) in
the molecule. The hydrogens H5 and H5’ at C5 of cysteine were not equivalent and produced
therefore two different signals. Additionally, an aliphatic C-chain (C1, C2, and C3) was
detected with a C:C double bond located between C2 and C3 : The coupling constant of > 10
Hz between H2 and H3 (J = 15.26 Hz) indicated clearly a trans configuration in the molecule
because a cis configuration would produce a coupling constant of ≤ 10 Hz (Pretsch et al.
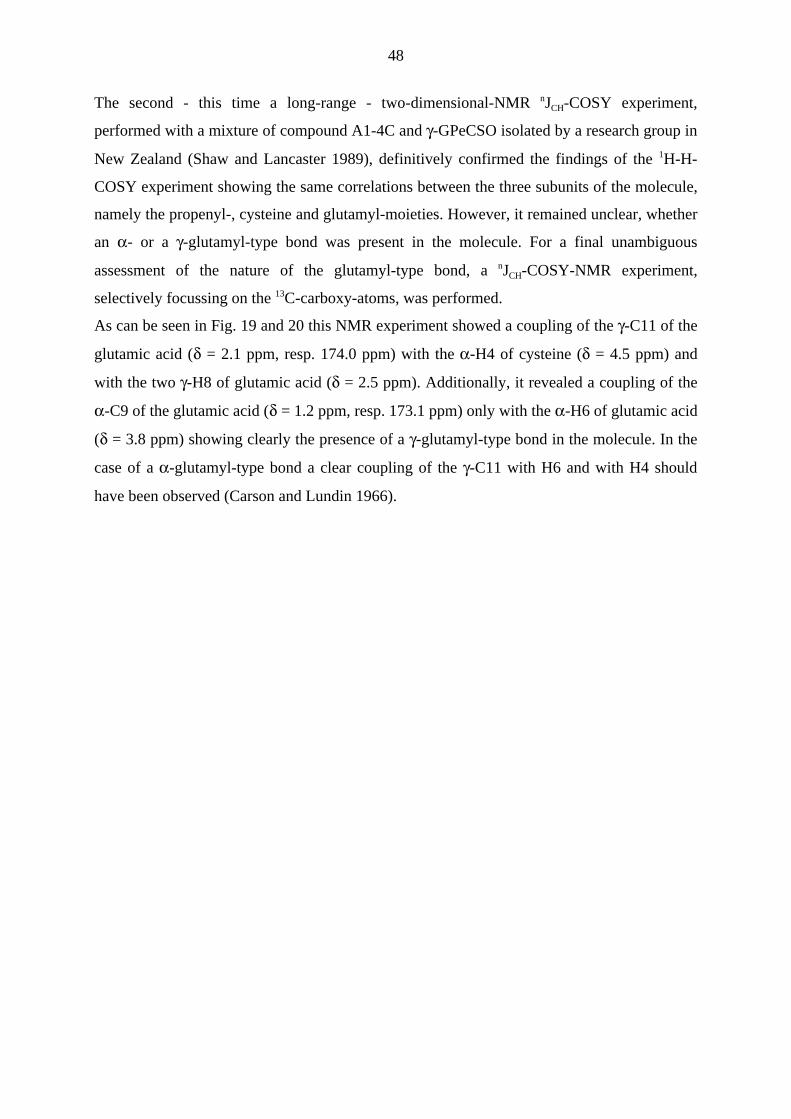
1985, Pretsch et al. 2000). The two-dimensional 1H-H-COSY NMR experiment performed
with compound A1-4C (Fig. 18) showed the presence of three subunits in the molecule, too:
The trans-propenyl-, cysteine- and glutamyl-subunit. The sulphoxide group between the
propenyl- and the cysteine-subunit and the amide-bond between the cysteine and the glutamic
acid acted as „electronic barriers“ which prevented a co-excitation through these bonds,
dividing the molecule in three electromagnetical subunits.
48
The second - this time a long-range - two-dimensional-NMR nJCH-COSY experiment,
performed with a mixture of compound A1-4C and γ-GPeCSO isolated by a research group in
New Zealand (Shaw and Lancaster 1989), definitively confirmed the findings of the 1H-H-
COSY experiment showing the same correlations between the three subunits of the molecule,
namely the propenyl-, cysteine and glutamyl-moieties. However, it remained unclear, whether
an α- or a γ-glutamyl-type bond was present in the molecule. For a final unambiguous
assessment of the nature of the glutamyl-type bond, a nJCH-COSY-NMR experiment,
selectively focussing on the 13C-carboxy-atoms, was performed.
As can be seen in Fig. 19 and 20 this NMR experiment showed a coupling of the γ-C11 of the
glutamic acid (δ = 2.1 ppm, resp. 174.0 ppm) with the α-H4 of cysteine (δ = 4.5 ppm) and
with the two γ-H8 of glutamic acid (δ = 2.5 ppm). Additionally, it revealed a coupling of the
α-C9 of the glutamic acid (δ = 1.2 ppm, resp. 173.1 ppm) only with the α-H6 of glutamic acid
(δ = 3.8 ppm) showing clearly the presence of a γ-glutamyl-type bond in the molecule. In the
case of a α-glutamyl-type bond a clear coupling of the γ-C11 with H6 and with H4 should
have been observed (Carson and Lundin 1966).
49
1
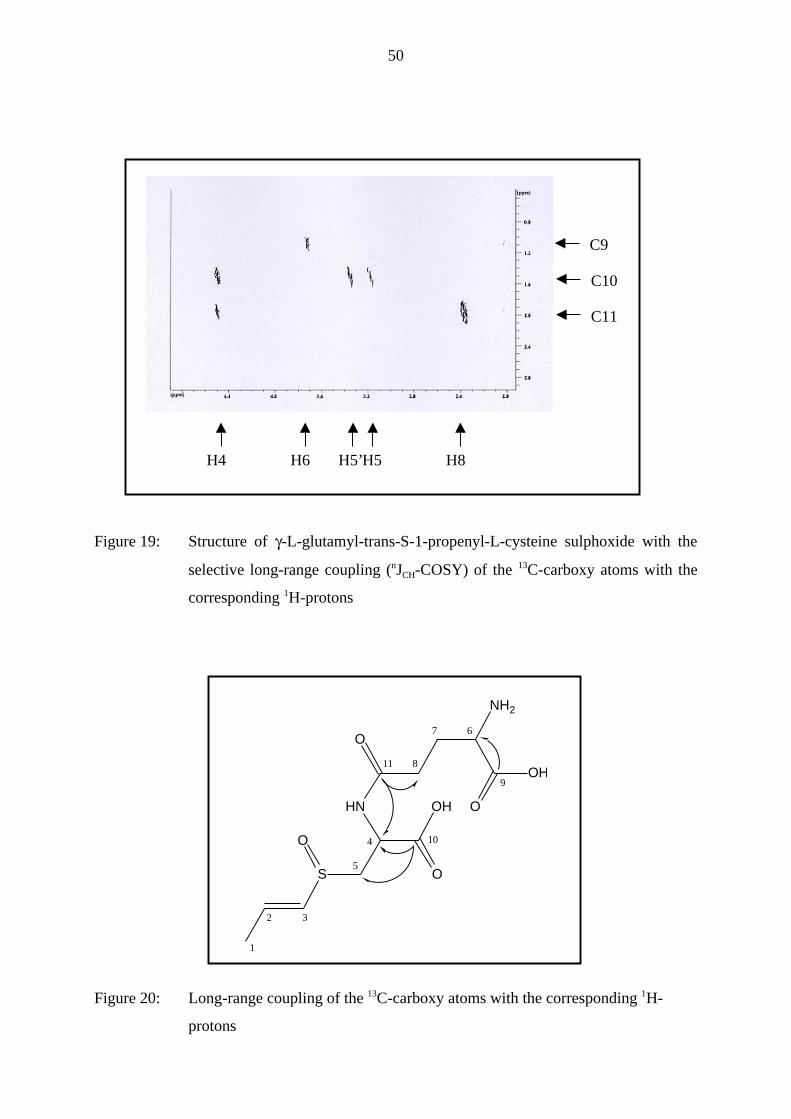
50
Figure 19: Structure of γ-L-glutamyl-trans-S-1-propenyl-L-cysteine sulphoxide with the
selective long-range coupling (nJCH-COSY) of the 13C-carboxy atoms with the
corresponding 1H-protons
S
O
O
OHHN
O
NH2
OH
O
11
1
2 3
4
5
67
9
10
8
Figure 20: Long-range coupling of the 13C-carboxy atoms with the corresponding 1H-
protons
C9
C10
C11
H4 H6 H8H5H5’
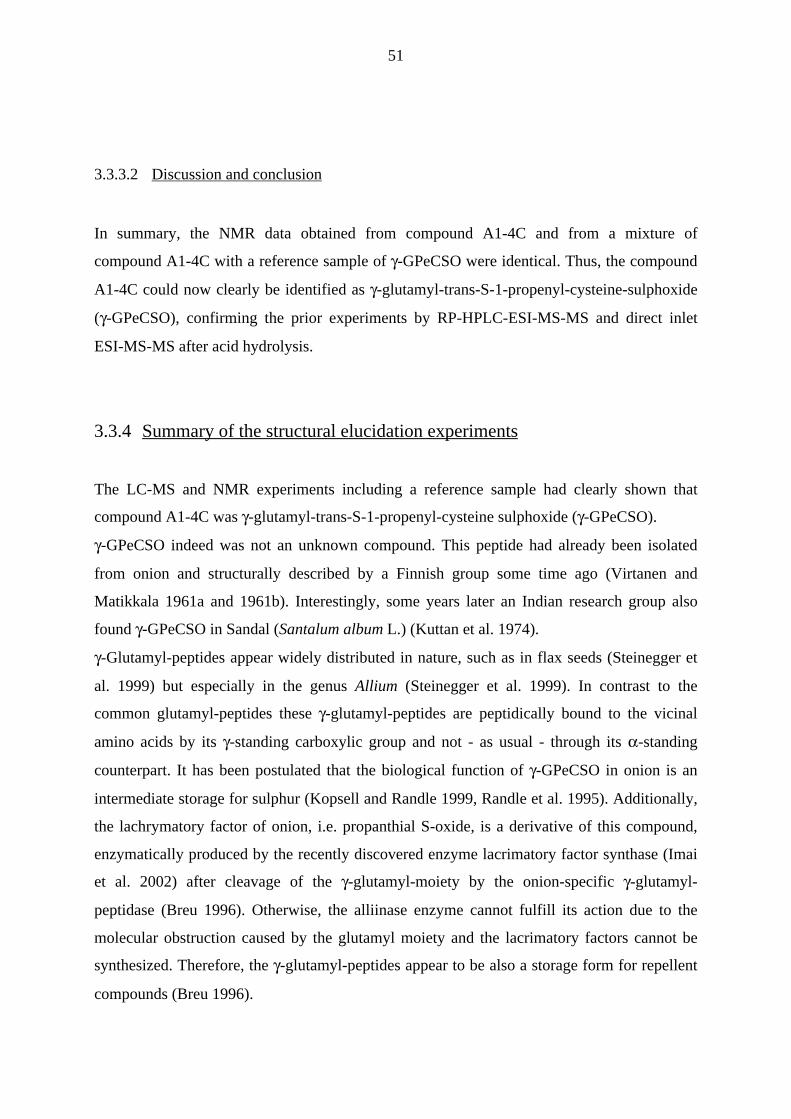
51
3.3.3.2 Discussion and conclusion
In summary, the NMR data obtained from compound A1-4C and from a mixture of
compound A1-4C with a reference sample of γ-GPeCSO were identical. Thus, the compound
A1-4C could now clearly be identified as γ-glutamyl-trans-S-1-propenyl-cysteine-sulphoxide
(γ-GPeCSO), confirming the prior experiments by RP-HPLC-ESI-MS-MS and direct inlet
ESI-MS-MS after acid hydrolysis.
3.3.4 Summary of the structural elucidation experiments
The LC-MS and NMR experiments including a reference sample had clearly shown that
compound A1-4C was γ-glutamyl-trans-S-1-propenyl-cysteine sulphoxide (γ-GPeCSO).
γ-GPeCSO indeed was not an unknown compound. This peptide had already been isolated
from onion and structurally described by a Finnish group some time ago (Virtanen and
Matikkala 1961a and 1961b). Interestingly, some years later an Indian research group also
found γ-GPeCSO in Sandal (Santalum album L.) (Kuttan et al. 1974).
γ-Glutamyl-peptides appear widely distributed in nature, such as in flax seeds (Steinegger et
al. 1999) but especially in the genus Allium (Steinegger et al. 1999). In contrast to the
common glutamyl-peptides these γ-glutamyl-peptides are peptidically bound to the vicinal
amino acids by its γ-standing carboxylic group and not - as usual - through its α-standing
counterpart. It has been postulated that the biological function of γ-GPeCSO in onion is an
intermediate storage for sulphur (Kopsell and Randle 1999, Randle et al. 1995). Additionally,
the lachrymatory factor of onion, i.e. propanthial S-oxide, is a derivative of this compound,
enzymatically produced by the recently discovered enzyme lacrimatory factor synthase (Imai
et al. 2002) after cleavage of the γ-glutamyl-moiety by the onion-specific γ-glutamyl-
peptidase (Breu 1996). Otherwise, the alliinase enzyme cannot fulfill its action due to the
molecular obstruction caused by the glutamyl moiety and the lacrimatory factors cannot be
synthesized. Therefore, the γ-glutamyl-peptides appear to be also a storage form for repellent
compounds (Breu 1996).
52
However, no biological effects of γ-GPeCSO itself have been described until now in other
biological systems than in onion plants. Glutamate receptors for instance are claimed to be
involved in the process of bone metabolism in vitro (Chenu and Serre 1998), but its relevance
in vivo still remains unclear (Gray et al 2001).
However, one compound, which exhibits biological activity and is structurally related to γ-
GPeCSO is S-allylcysteine (Breu 1996). Like γ-GPeCSO this compound has an unsaturated
C-3 side chain bound to cysteine. It is a degradation product in aged garlic extract and inhibits
the NFκB pathway (Geng et al. 1997; Ide and Lau 2001). This pathway plays a crucial role
during osteoclast differentiation (Teitelbaum 2000) but is also involved in many other cell
processes (Löffler and Petrides 2002). However, a decrease in osteoclast recruitment would
have lead to a decreased cell number - which was not the case of γ-GPeCSO. As shown in Ch.
3.2 the isolation of γ-GPeCSO had been accomplished by an activity-guided fractionation
using an osteoclast cell culture system. Thus, the osteoclast activity inhibiting effect of γ-
GPeCSO might have been mediated by another mechanism of action related to the NFκB
pathway.
53
3.4 Up-scaled isolation of γ-GPeCSO
The next problem was to prepare larger amounts of γ-GPeCSO in order to assess its content in
dry onion and in the fractions of the bioassay-guided fractionation. To achieve this, several
approaches were considered:
a) Synthesis of γ-GPeCSO
Synthesis would deliver the high amount of γ-GPeCSO necessary for further methodological
and biological experiments. A chemical synthesis by using allylbromide and cysteine forming
S-allyl-cysteine (Carson and Wong 1974), followed by a γ-glutamylic targeted attachment of
glutamic acid to the amino group of cysteine (Carson and Wong 1974), and a consequent
oxidation of the thioether with hydrogen peroxide giving a sulphoxide (Yu et al. 1994) was
described. However, the appropriate isomerization of the allyl unit to build an unsaturated
trans 1-propenyl side chain has not been achieved until now. Boggs and co-workers tried
several years to accomplish this synthesis, but they only succeeded in synthesizing its cis
counterpart (Lancaster and Kelly 1983, Freeman and Whenham 1975, Carson and Boggs
1966). Therefore, the approach of synthesis was disregarded.
b) Up scaling of the previously used MPLC isolation methods
MPLC would allow using an already established isolation protocol. Indeed, such an approach
had been tried at a pilot plant of our industrial partner in this project, by up-scaling first the
RP-MPLC and secondly the NP-MPLC fractionation method. However, at the second up-
scaling chromatography step all fractions became deeply orange-colored although the starting
material, i.e. the up-scaled fraction A1, was originally slightly yellow. Apparently, this
phenomenon originated from a contamination in the filter at the end of the column and all the
resulting fractions inhibited osteoclast activity and decreased cell number markedly in the
osteoclast pit assay. As a consequence, an alternative fractionation procedure had to be
developed.
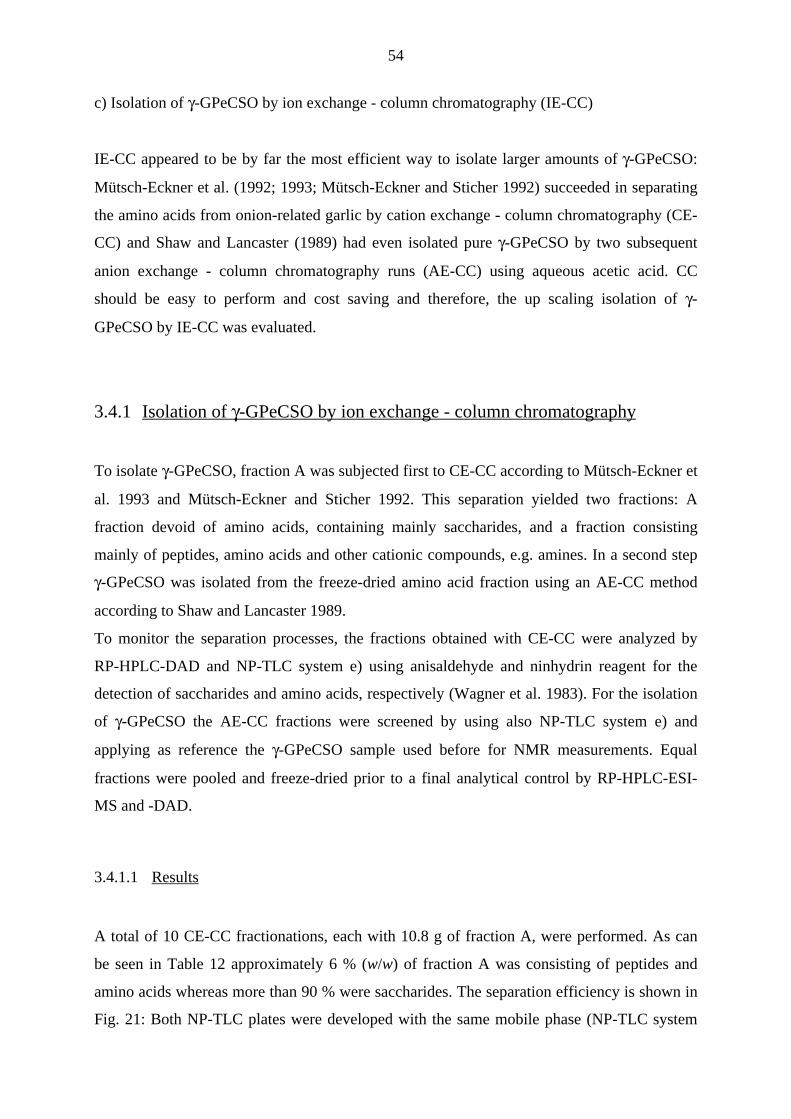
54
c) Isolation of γ-GPeCSO by ion exchange - column chromatography (IE-CC)
IE-CC appeared to be by far the most efficient way to isolate larger amounts of γ-GPeCSO:
Mütsch-Eckner et al. (1992; 1993; Mütsch-Eckner and Sticher 1992) succeeded in separating
the amino acids from onion-related garlic by cation exchange - column chromatography (CE-
CC) and Shaw and Lancaster (1989) had even isolated pure γ-GPeCSO by two subsequent
anion exchange - column chromatography runs (AE-CC) using aqueous acetic acid. CC
should be easy to perform and cost saving and therefore, the up scaling isolation of γ-
GPeCSO by IE-CC was evaluated.
3.4.1 Isolation of γ-GPeCSO by ion exchange - column chromatography
To isolate γ-GPeCSO, fraction A was subjected first to CE-CC according to Mütsch-Eckner et
al. 1993 and Mütsch-Eckner and Sticher 1992. This separation yielded two fractions: A
fraction devoid of amino acids, containing mainly saccharides, and a fraction consisting
mainly of peptides, amino acids and other cationic compounds, e.g. amines. In a second step
γ-GPeCSO was isolated from the freeze-dried amino acid fraction using an AE-CC method
according to Shaw and Lancaster 1989.
To monitor the separation processes, the fractions obtained with CE-CC were analyzed by
RP-HPLC-DAD and NP-TLC system e) using anisaldehyde and ninhydrin reagent for the
detection of saccharides and amino acids, respectively (Wagner et al. 1983). For the isolation
of γ-GPeCSO the AE-CC fractions were screened by using also NP-TLC system e) and
applying as reference the γ-GPeCSO sample used before for NMR measurements. Equal
fractions were pooled and freeze-dried prior to a final analytical control by RP-HPLC-ESI-
MS and -DAD.
3.4.1.1 Results
A total of 10 CE-CC fractionations, each with 10.8 g of fraction A, were performed. As can
be seen in Table 12 approximately 6 % (w/w) of fraction A was consisting of peptides and
amino acids whereas more than 90 % were saccharides. The separation efficiency is shown in
Fig. 21: Both NP-TLC plates were developed with the same mobile phase (NP-TLC system
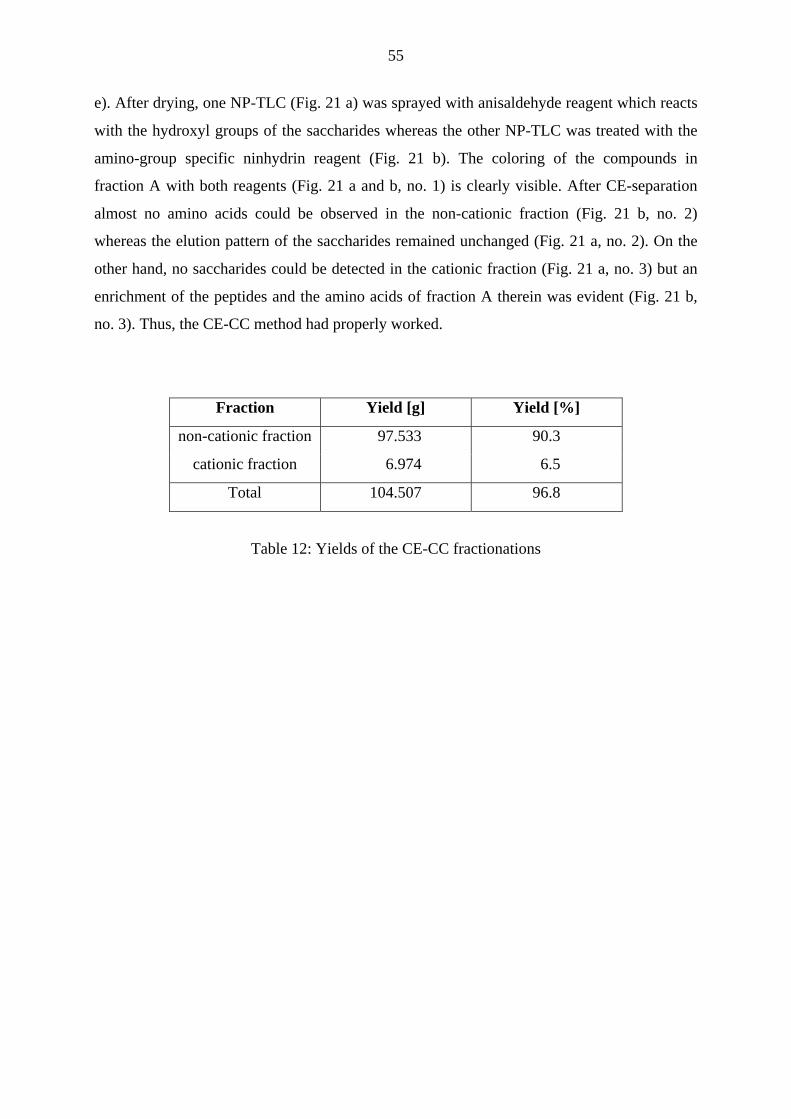
55
e). After drying, one NP-TLC (Fig. 21 a) was sprayed with anisaldehyde reagent which reacts
with the hydroxyl groups of the saccharides whereas the other NP-TLC was treated with the
amino-group specific ninhydrin reagent (Fig. 21 b). The coloring of the compounds in
fraction A with both reagents (Fig. 21 a and b, no. 1) is clearly visible. After CE-separation
almost no amino acids could be observed in the non-cationic fraction (Fig. 21 b, no. 2)
whereas the elution pattern of the saccharides remained unchanged (Fig. 21 a, no. 2). On the
other hand, no saccharides could be detected in the cationic fraction (Fig. 21 a, no. 3) but an
enrichment of the peptides and the amino acids of fraction A therein was evident (Fig. 21 b,
no. 3). Thus, the CE-CC method had properly worked.
Fraction Yield [g] Yield [%]
non-cationic fraction 97.533 90.3
cationic fraction 6.974 6.5
Total 104.507 96.8
Table 12: Yields of the CE-CC fractionations
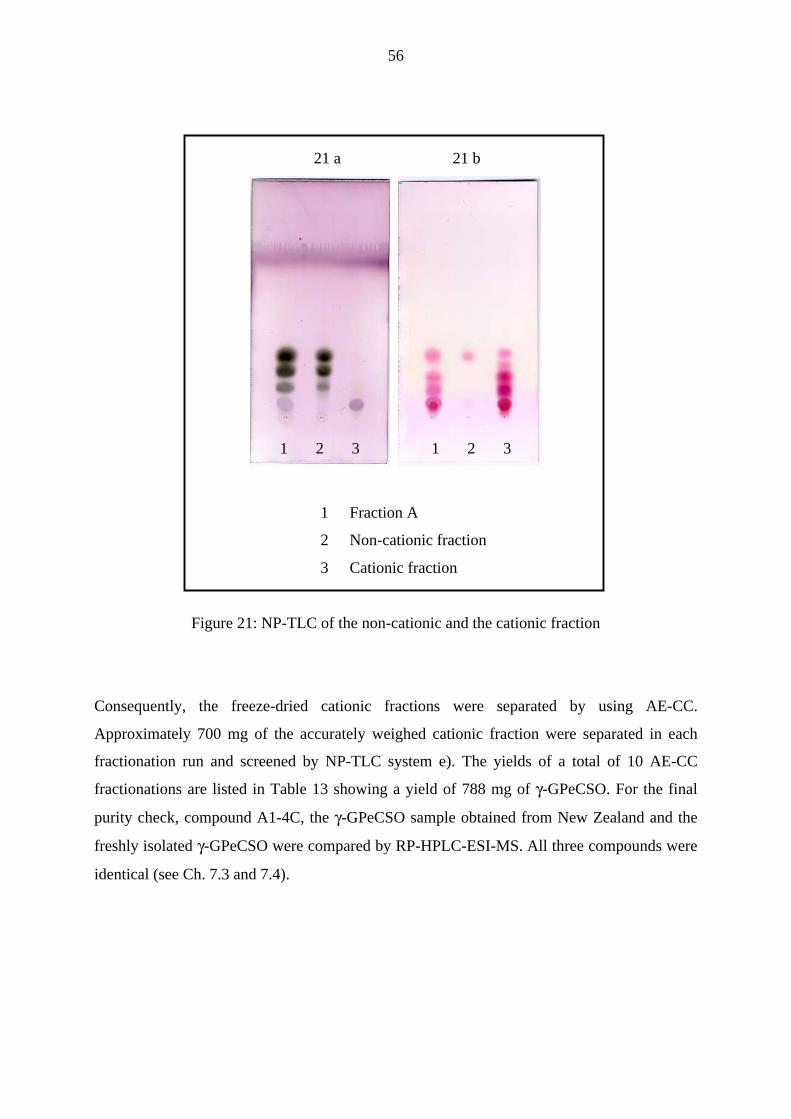
56
21 a 21 b
1 Fraction A
2 Non-cationic fraction
3 Cationic fraction
Figure 21: NP-TLC of the non-cationic and the cationic fraction
Consequently, the freeze-dried cationic fractions were separated by using AE-CC.
Approximately 700 mg of the accurately weighed cationic fraction were separated in each
fractionation run and screened by NP-TLC system e). The yields of a total of 10 AE-CC
fractionations are listed in Table 13 showing a yield of 788 mg of γ-GPeCSO. For the final
purity check, compound A1-4C, the γ-GPeCSO sample obtained from New Zealand and the
freshly isolated γ-GPeCSO were compared by RP-HPLC-ESI-MS. All three compounds were
identical (see Ch. 7.3 and 7.4).
1 2 3 1 2 3
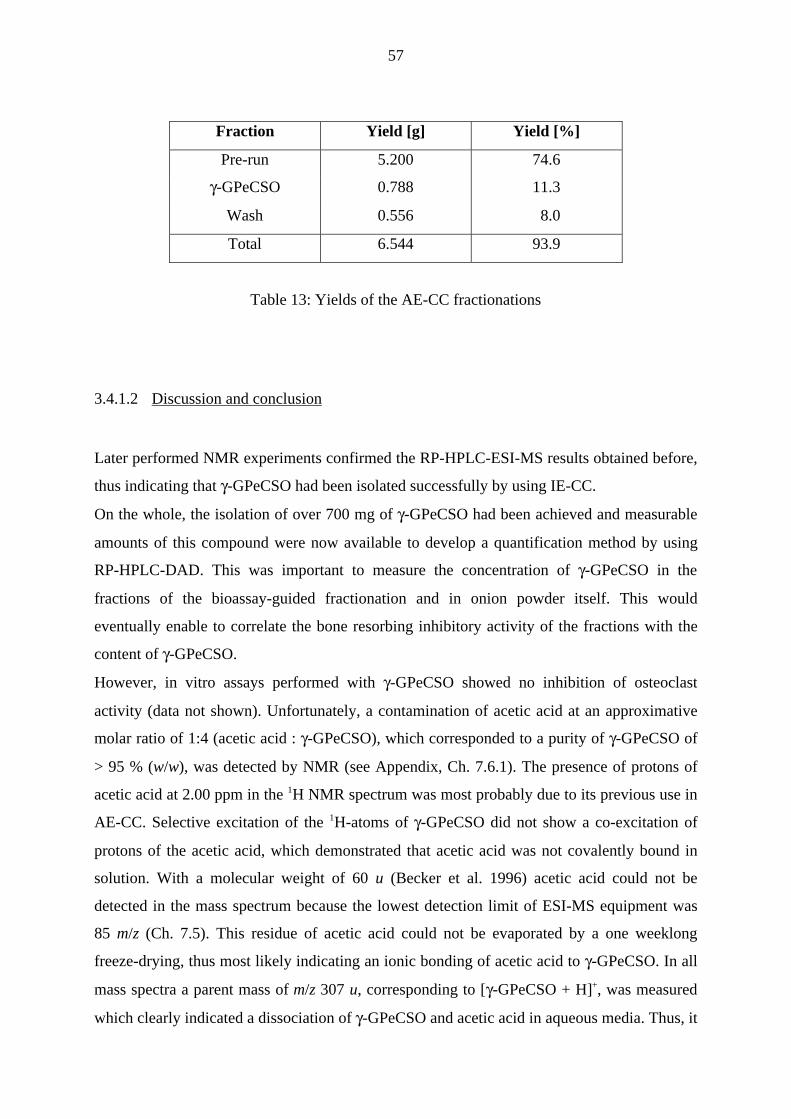
57
Fraction Yield [g] Yield [%]
Pre-run 5.200 74.6
γ-GPeCSO 0.788 11.3
Wash 0.556 8.0
Total 6.544 93.9
Table 13: Yields of the AE-CC fractionations
3.4.1.2 Discussion and conclusion
Later performed NMR experiments confirmed the RP-HPLC-ESI-MS results obtained before,
thus indicating that γ-GPeCSO had been isolated successfully by using IE-CC.
On the whole, the isolation of over 700 mg of γ-GPeCSO had been achieved and measurable
amounts of this compound were now available to develop a quantification method by using
RP-HPLC-DAD. This was important to measure the concentration of γ-GPeCSO in the
fractions of the bioassay-guided fractionation and in onion powder itself. This would
eventually enable to correlate the bone resorbing inhibitory activity of the fractions with the
content of γ-GPeCSO.
However, in vitro assays performed with γ-GPeCSO showed no inhibition of osteoclast
activity (data not shown). Unfortunately, a contamination of acetic acid at an approximative
molar ratio of 1:4 (acetic acid : γ-GPeCSO), which corresponded to a purity of γ-GPeCSO of
> 95 % (w/w), was detected by NMR (see Appendix, Ch. 7.6.1). The presence of protons of
acetic acid at 2.00 ppm in the 1H NMR spectrum was most probably due to its previous use in
AE-CC. Selective excitation of the 1H-atoms of γ-GPeCSO did not show a co-excitation of
protons of the acetic acid, which demonstrated that acetic acid was not covalently bound in
solution. With a molecular weight of 60 u (Becker et al. 1996) acetic acid could not be
detected in the mass spectrum because the lowest detection limit of ESI-MS equipment was
85 m/z (Ch. 7.5). This residue of acetic acid could not be evaporated by a one weeklong
freeze-drying, thus most likely indicating an ionic bonding of acetic acid to γ-GPeCSO. In all
mass spectra a parent mass of m/z 307 u, corresponding to [γ-GPeCSO + H]+, was measured
which clearly indicated a dissociation of γ-GPeCSO and acetic acid in aqueous media. Thus, it

58
was hypothesized, that acetic acid could have blunted the inhibitory effect of γ-GPeCSO and a
chromatographic approach to purify γ-GPeCSO was evaluated (see Ch. 3.4.2).
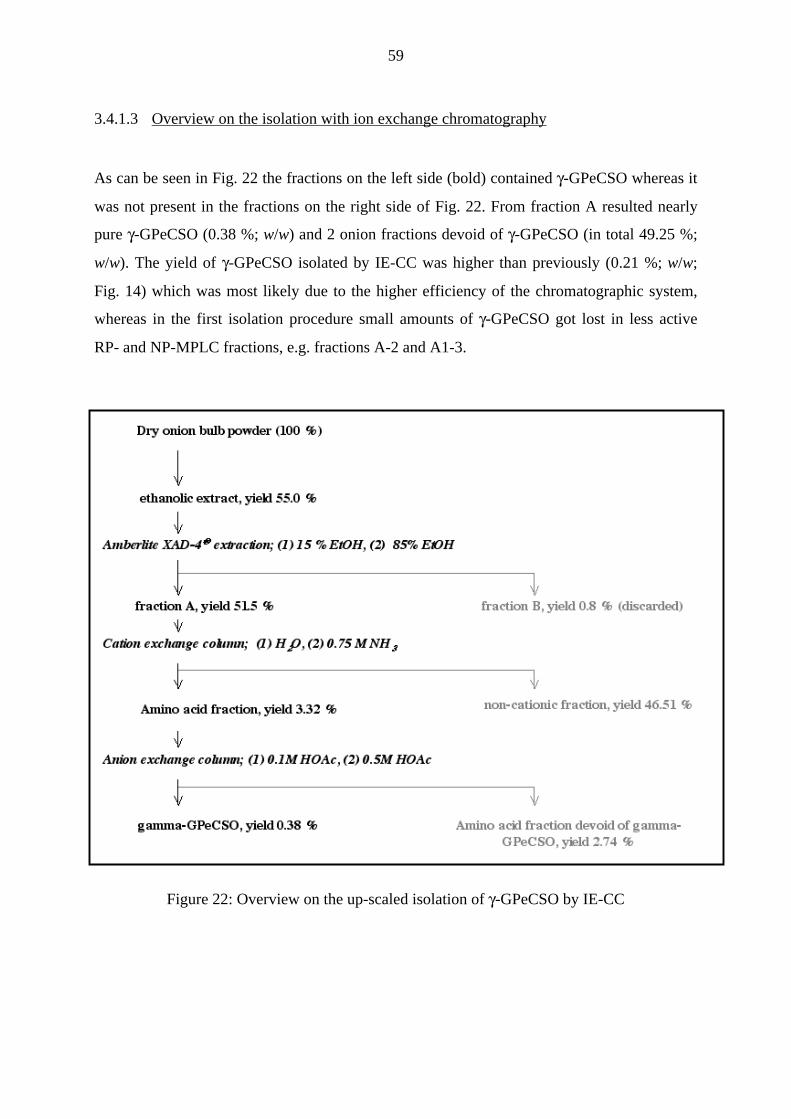
59
3.4.1.3 Overview on the isolation with ion exchange chromatography
As can be seen in Fig. 22 the fractions on the left side (bold) contained γ-GPeCSO whereas it
was not present in the fractions on the right side of Fig. 22. From fraction A resulted nearly
pure γ-GPeCSO (0.38 %; w/w) and 2 onion fractions devoid of γ-GPeCSO (in total 49.25 %;
w/w). The yield of γ-GPeCSO isolated by IE-CC was higher than previously (0.21 %; w/w;
Fig. 14) which was most likely due to the higher efficiency of the chromatographic system,
whereas in the first isolation procedure small amounts of γ-GPeCSO got lost in less active
RP- and NP-MPLC fractions, e.g. fractions A-2 and A1-3.
Figure 22: Overview on the up-scaled isolation of γ-GPeCSO by IE-CC
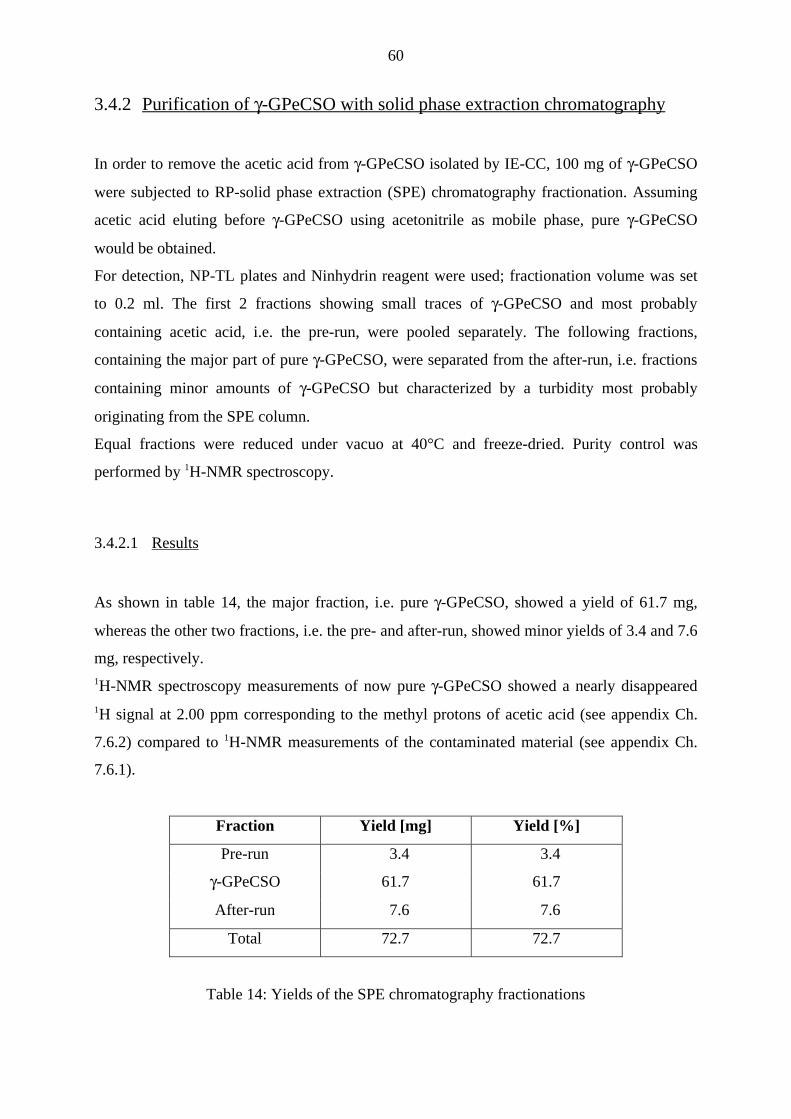
60
3.4.2 Purification of γ-GPeCSO with solid phase extraction chromatography
In order to remove the acetic acid from γ-GPeCSO isolated by IE-CC, 100 mg of γ-GPeCSO
were subjected to RP-solid phase extraction (SPE) chromatography fractionation. Assuming
acetic acid eluting before γ-GPeCSO using acetonitrile as mobile phase, pure γ-GPeCSO
would be obtained.
For detection, NP-TL plates and Ninhydrin reagent were used; fractionation volume was set
to 0.2 ml. The first 2 fractions showing small traces of γ-GPeCSO and most probably
containing acetic acid, i.e. the pre-run, were pooled separately. The following fractions,
containing the major part of pure γ-GPeCSO, were separated from the after-run, i.e. fractions
containing minor amounts of γ-GPeCSO but characterized by a turbidity most probably
originating from the SPE column.
Equal fractions were reduced under vacuo at 40°C and freeze-dried. Purity control was
performed by 1H-NMR spectroscopy.
3.4.2.1 Results
As shown in table 14, the major fraction, i.e. pure γ-GPeCSO, showed a yield of 61.7 mg,
whereas the other two fractions, i.e. the pre- and after-run, showed minor yields of 3.4 and 7.6
mg, respectively.1H-NMR spectroscopy measurements of now pure γ-GPeCSO showed a nearly disappeared1H signal at 2.00 ppm corresponding to the methyl protons of acetic acid (see appendix Ch.
7.6.2) compared to 1H-NMR measurements of the contaminated material (see appendix Ch.
7.6.1).
Fraction Yield [mg] Yield [%]
Pre-run 3.4 3.4
γ-GPeCSO 61.7 61.7
After-run 7.6 7.6
Total 72.7 72.7
Table 14: Yields of the SPE chromatography fractionations
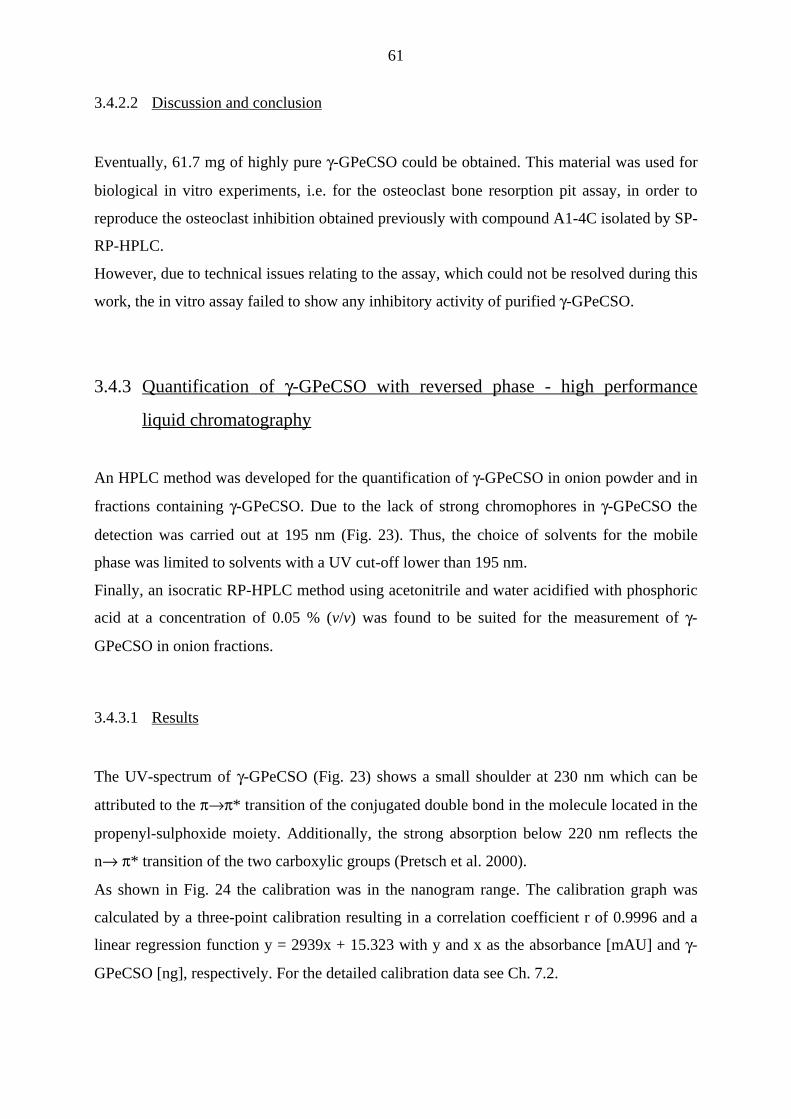
61
3.4.2.2 Discussion and conclusion
Eventually, 61.7 mg of highly pure γ-GPeCSO could be obtained. This material was used for
biological in vitro experiments, i.e. for the osteoclast bone resorption pit assay, in order to
reproduce the osteoclast inhibition obtained previously with compound A1-4C isolated by SP-
RP-HPLC.
However, due to technical issues relating to the assay, which could not be resolved during this
work, the in vitro assay failed to show any inhibitory activity of purified γ-GPeCSO.
3.4.3 Quantification of γ-GPeCSO with reversed phase - high performance
liquid chromatography
An HPLC method was developed for the quantification of γ-GPeCSO in onion powder and in
fractions containing γ-GPeCSO. Due to the lack of strong chromophores in γ-GPeCSO the
detection was carried out at 195 nm (Fig. 23). Thus, the choice of solvents for the mobile
phase was limited to solvents with a UV cut-off lower than 195 nm.
Finally, an isocratic RP-HPLC method using acetonitrile and water acidified with phosphoric
acid at a concentration of 0.05 % (v/v) was found to be suited for the measurement of γ-
GPeCSO in onion fractions.
3.4.3.1 Results
The UV-spectrum of γ-GPeCSO (Fig. 23) shows a small shoulder at 230 nm which can be
attributed to the π→π* transition of the conjugated double bond in the molecule located in the
propenyl-sulphoxide moiety. Additionally, the strong absorption below 220 nm reflects the
n→ π* transition of the two carboxylic groups (Pretsch et al. 2000).
As shown in Fig. 24 the calibration was in the nanogram range. The calibration graph was
calculated by a three-point calibration resulting in a correlation coefficient r of 0.9996 and a
linear regression function y = 2939x + 15.323 with y and x as the absorbance [mAU] and γ-
GPeCSO [ng], respectively. For the detailed calibration data see Ch. 7.2.
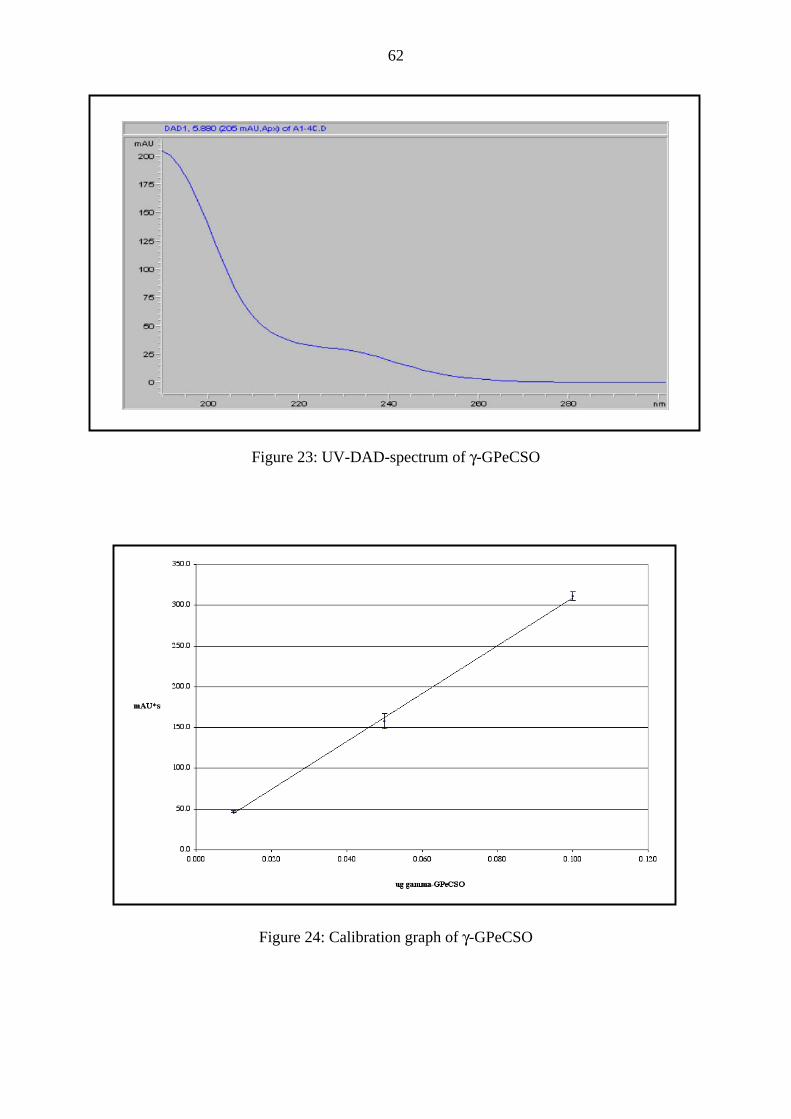
62
Figure 23: UV-DAD-spectrum of γ-GPeCSO
Figure 24: Calibration graph of γ-GPeCSO
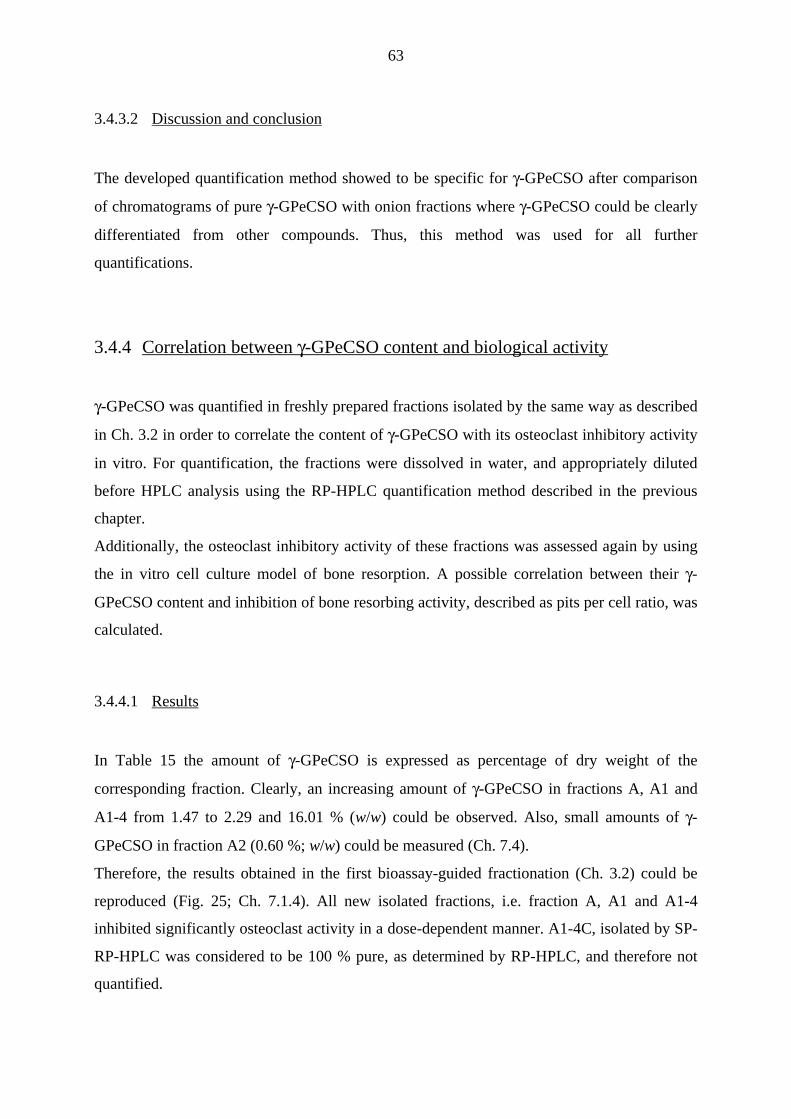
63
3.4.3.2 Discussion and conclusion
The developed quantification method showed to be specific for γ-GPeCSO after comparison
of chromatograms of pure γ-GPeCSO with onion fractions where γ-GPeCSO could be clearly
differentiated from other compounds. Thus, this method was used for all further
quantifications.
3.4.4 Correlation between γ-GPeCSO content and biological activity
γ-GPeCSO was quantified in freshly prepared fractions isolated by the same way as described
in Ch. 3.2 in order to correlate the content of γ-GPeCSO with its osteoclast inhibitory activity
in vitro. For quantification, the fractions were dissolved in water, and appropriately diluted
before HPLC analysis using the RP-HPLC quantification method described in the previous
chapter.
Additionally, the osteoclast inhibitory activity of these fractions was assessed again by using
the in vitro cell culture model of bone resorption. A possible correlation between their γ-
GPeCSO content and inhibition of bone resorbing activity, described as pits per cell ratio, was
calculated.
3.4.4.1 Results
In Table 15 the amount of γ-GPeCSO is expressed as percentage of dry weight of the
corresponding fraction. Clearly, an increasing amount of γ-GPeCSO in fractions A, A1 and
A1-4 from 1.47 to 2.29 and 16.01 % (w/w) could be observed. Also, small amounts of γ-
GPeCSO in fraction A2 (0.60 %; w/w) could be measured (Ch. 7.4).
Therefore, the results obtained in the first bioassay-guided fractionation (Ch. 3.2) could be
reproduced (Fig. 25; Ch. 7.1.4). All new isolated fractions, i.e. fraction A, A1 and A1-4
inhibited significantly osteoclast activity in a dose-dependent manner. A1-4C, isolated by SP-
RP-HPLC was considered to be 100 % pure, as determined by RP-HPLC, and therefore not
quantified.
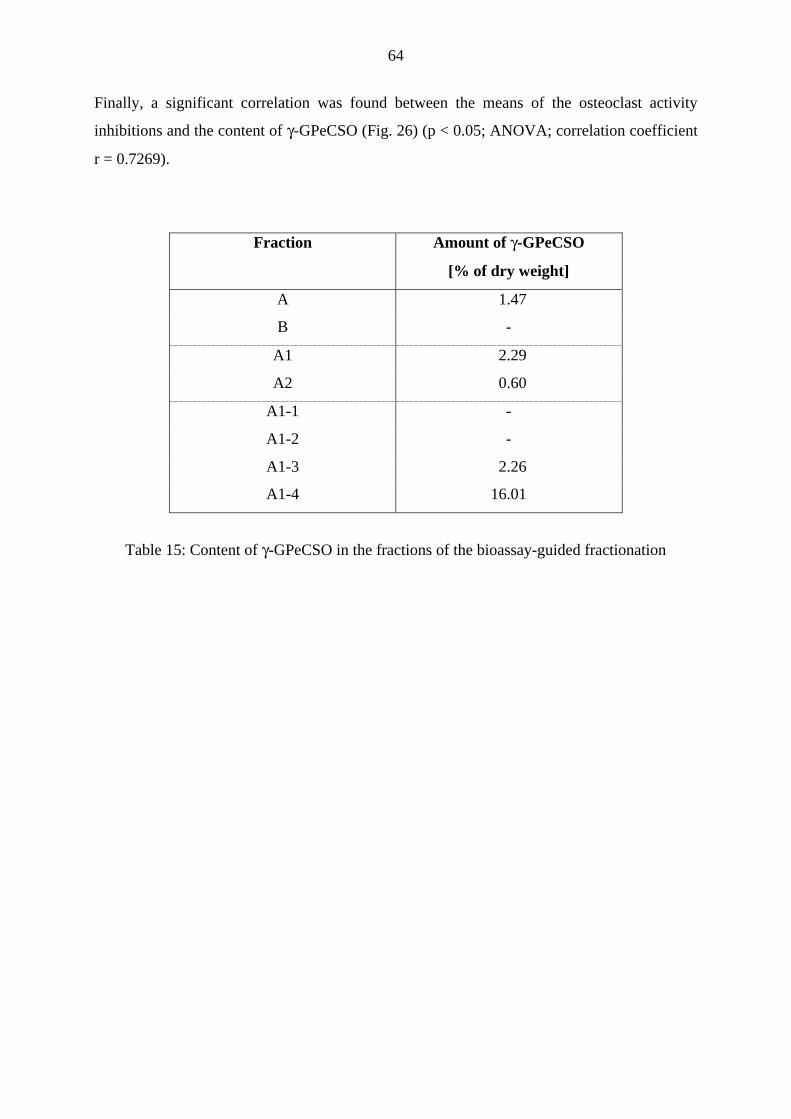
64
Finally, a significant correlation was found between the means of the osteoclast activity
inhibitions and the content of γ-GPeCSO (Fig. 26) (p < 0.05; ANOVA; correlation coefficient
r = 0.7269).
Fraction Amount of γ-GPeCSO
[% of dry weight]
A 1.47
B -
A1 2.29
A2 0.60
A1-1 -
A1-2 -
A1-3 2.26
A1-4 16.01
Table 15: Content of γ-GPeCSO in the fractions of the bioassay-guided fractionation
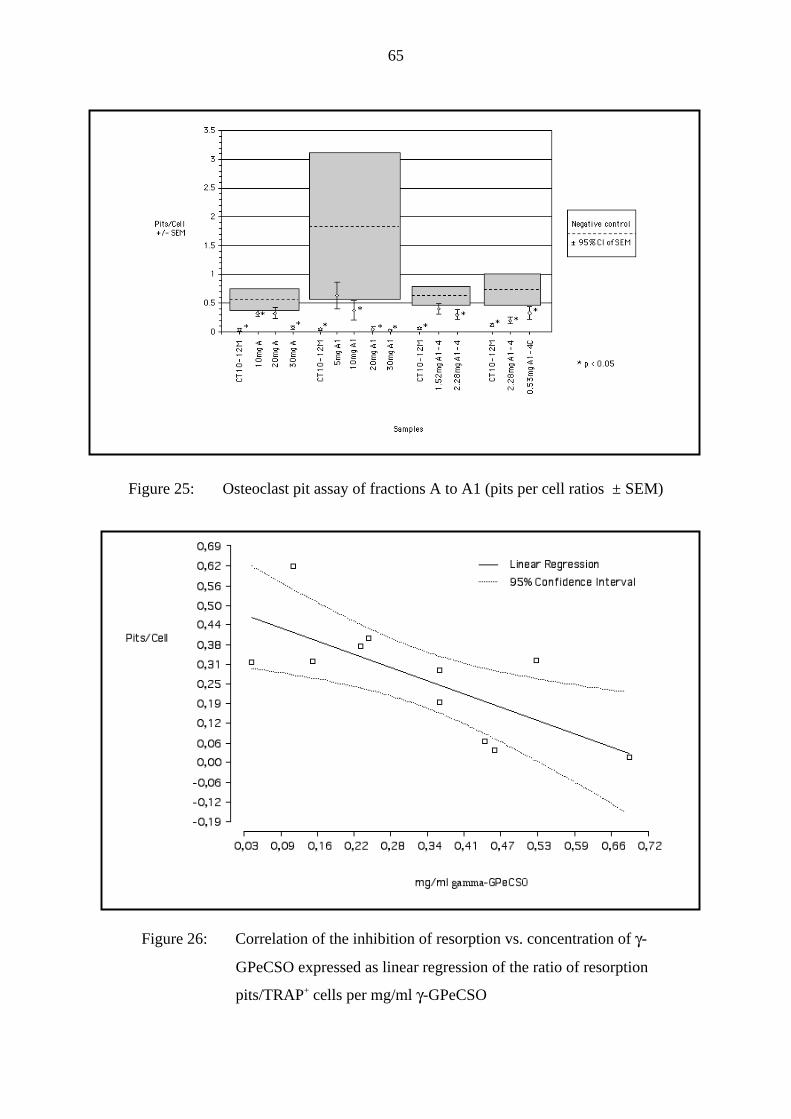
65
Figure 25: Osteoclast pit assay of fractions A to A1 (pits per cell ratios ± SEM)
Figure 26: Correlation of the inhibition of resorption vs. concentration of γ-
GPeCSO expressed as linear regression of the ratio of resorption
pits/TRAP+ cells per mg/ml γ-GPeCSO
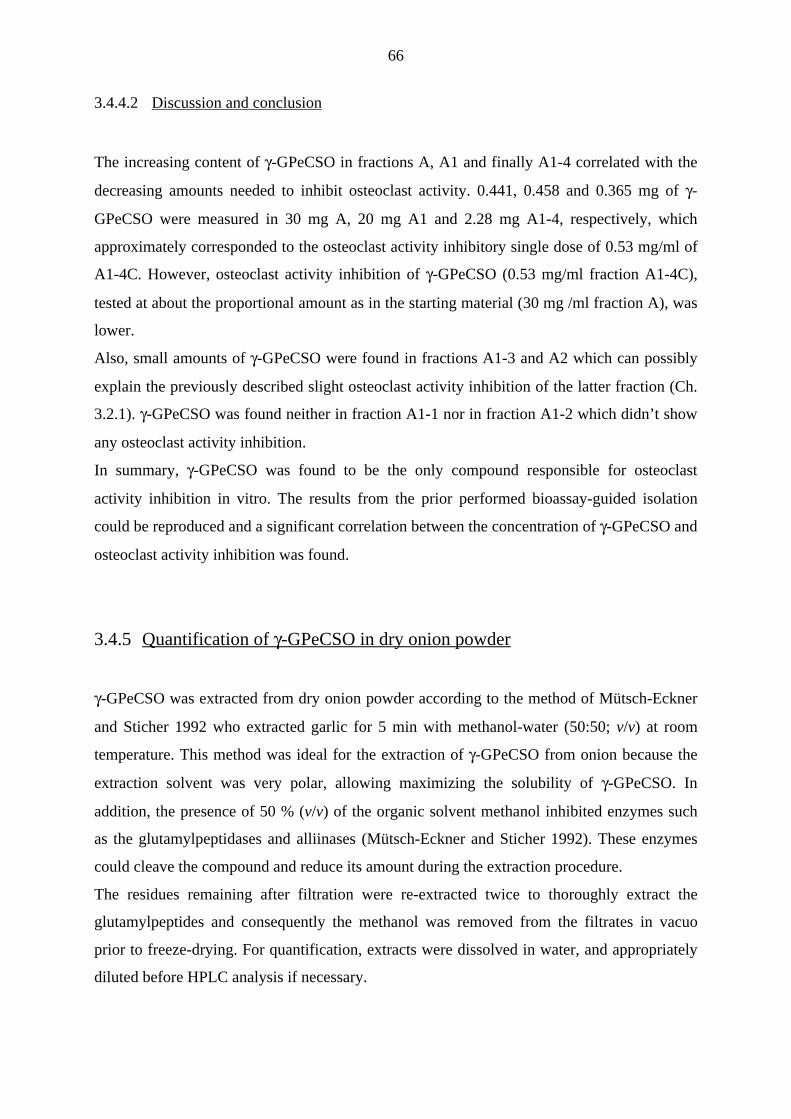
66
3.4.4.2 Discussion and conclusion
The increasing content of γ-GPeCSO in fractions A, A1 and finally A1-4 correlated with the
decreasing amounts needed to inhibit osteoclast activity. 0.441, 0.458 and 0.365 mg of γ-
GPeCSO were measured in 30 mg A, 20 mg A1 and 2.28 mg A1-4, respectively, which
approximately corresponded to the osteoclast activity inhibitory single dose of 0.53 mg/ml of
A1-4C. However, osteoclast activity inhibition of γ-GPeCSO (0.53 mg/ml fraction A1-4C),
tested at about the proportional amount as in the starting material (30 mg /ml fraction A), was
lower.
Also, small amounts of γ-GPeCSO were found in fractions A1-3 and A2 which can possibly
explain the previously described slight osteoclast activity inhibition of the latter fraction (Ch.
3.2.1). γ-GPeCSO was found neither in fraction A1-1 nor in fraction A1-2 which didn’t show
any osteoclast activity inhibition.
In summary, γ-GPeCSO was found to be the only compound responsible for osteoclast
activity inhibition in vitro. The results from the prior performed bioassay-guided isolation
could be reproduced and a significant correlation between the concentration of γ-GPeCSO and
osteoclast activity inhibition was found.
3.4.5 Quantification of γ-GPeCSO in dry onion powder
γ-GPeCSO was extracted from dry onion powder according to the method of Mütsch-Eckner
and Sticher 1992 who extracted garlic for 5 min with methanol-water (50:50; v/v) at room
temperature. This method was ideal for the extraction of γ-GPeCSO from onion because the
extraction solvent was very polar, allowing maximizing the solubility of γ-GPeCSO. In
addition, the presence of 50 % (v/v) of the organic solvent methanol inhibited enzymes such
as the glutamylpeptidases and alliinases (Mütsch-Eckner and Sticher 1992). These enzymes
could cleave the compound and reduce its amount during the extraction procedure.
The residues remaining after filtration were re-extracted twice to thoroughly extract the
glutamylpeptides and consequently the methanol was removed from the filtrates in vacuo
prior to freeze-drying. For quantification, extracts were dissolved in water, and appropriately
diluted before HPLC analysis if necessary.
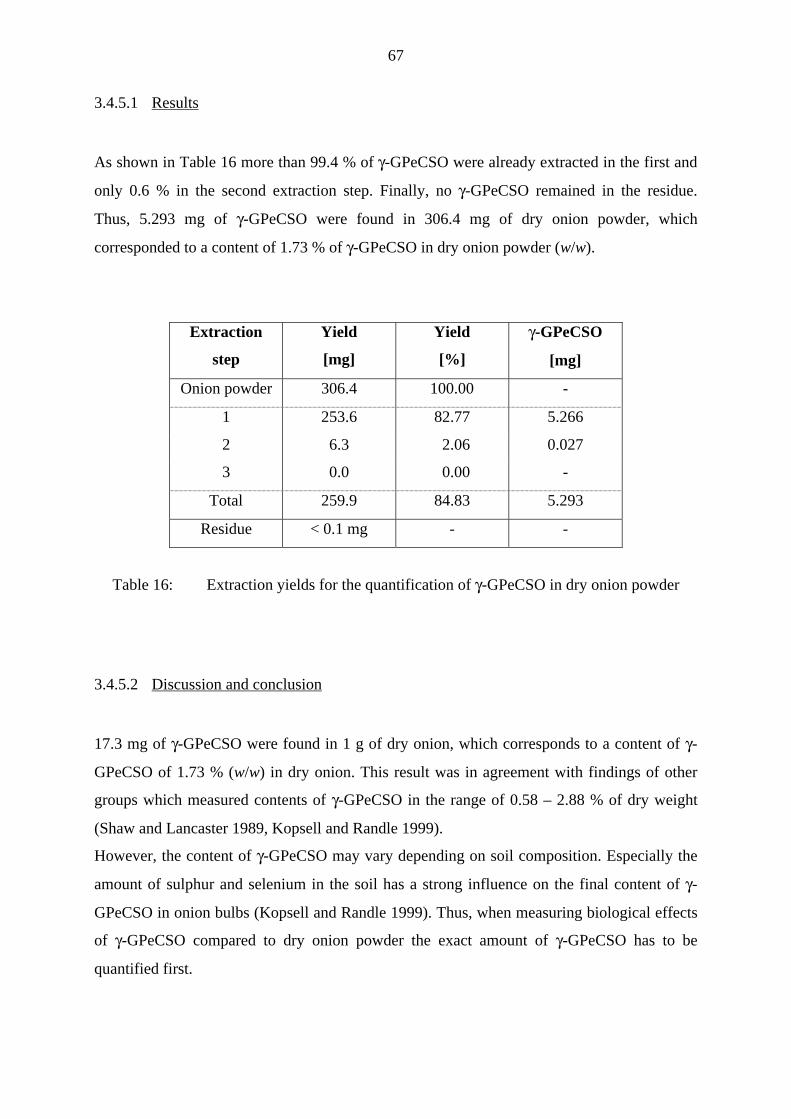
67
3.4.5.1 Results
As shown in Table 16 more than 99.4 % of γ-GPeCSO were already extracted in the first and
only 0.6 % in the second extraction step. Finally, no γ-GPeCSO remained in the residue.
Thus, 5.293 mg of γ-GPeCSO were found in 306.4 mg of dry onion powder, which
corresponded to a content of 1.73 % of γ-GPeCSO in dry onion powder (w/w).
Extraction
step
Yield
[mg]
Yield
[%]
γ-GPeCSO
[mg]
Onion powder 306.4 100.00 -
1 253.6 82.77 5.266
2 6.3 2.06 0.027
3 0.0 0.00 -
Total 259.9 84.83 5.293
Residue < 0.1 mg - -
Table 16: Extraction yields for the quantification of γ-GPeCSO in dry onion powder
3.4.5.2 Discussion and conclusion
17.3 mg of γ-GPeCSO were found in 1 g of dry onion, which corresponds to a content of γ-
GPeCSO of 1.73 % (w/w) in dry onion. This result was in agreement with findings of other
groups which measured contents of γ-GPeCSO in the range of 0.58 – 2.88 % of dry weight
(Shaw and Lancaster 1989, Kopsell and Randle 1999).
However, the content of γ-GPeCSO may vary depending on soil composition. Especially the
amount of sulphur and selenium in the soil has a strong influence on the final content of γ-
GPeCSO in onion bulbs (Kopsell and Randle 1999). Thus, when measuring biological effects
of γ-GPeCSO compared to dry onion powder the exact amount of γ-GPeCSO has to be
quantified first.
68
4 Conclusions and Outlook
The results of the present investigations demonstrated that γ-GPeCSO, a glutamylpeptide
isolated from onion (Allium cepa L.), inhibited osteoclast activity in vitro. Furthermore,
quantification of γ-GPeCSO in the active fractions of the bioassay-guided fractionation
revealed a significant inverse correlation between the content of γ-GPeCSO and the osteoclast
activity in vitro. As mentioned previously, Geng et al. (1997) and Ide and Lau (2001)
demonstrated in vitro inhibition of the NFκB-pathway by a similar compound from garlic, i.e.
S-allyl-cysteine. The NFκB-pathway is essential for osteoclast recruitment (Baron 1999) but
is also involved in many other cell processes (Löffler and Petrides 2002). Like γ-GPeCSO,
this compound possesses a lipophilic alkenyl side chain bound through the sulphur atom to
cysteine. It is likely that the glutamyl-moiety from γ-GPeCSO is cleaved in vitro by proteases
(Löffler and Petrides 2002) and the sulphoxide reduced to a thioether in aqueous media
(Kuttan et al. 1974). This change would lead eventually to S-1-propenyl-cysteine which, due
to its structural similarity with S-allyl-cysteine, could have similar inhibiting effects on the
NFκB-pathway and finally on bone resorption. However, a decrease in osteoclast recruitment
would have lead to a decreased cell number in our assay, an effect, which γ-GPeCSO did not
show. Thus, γ-GPeCSO might probably inhibit directly osteoclast activity through another
pathway related to NFκB.
However, osteoclast activity inhibition of γ-GPeCSO alone was weaker than the starting
material (fraction A), thus indicating a decrease of inhibitory activity. It cannot be excluded
that maybe other γ-glutamylpeptides also inhibit osteoclast activity, which might have
decomposed during the fractionation process and could therefore not be isolated. It is known,
that when working with plant extracts, generally the activity of about 50 % of the samples is
lost during the process of bioassay-directed fractionation (Pezzuto 1997) and that most
bioassays are sensitive to interferences from other plant metabolites (Hamburger and
Hostettmann 1991). Thus, the loss of biological activity during fractionation can be due to
lack of chemical stability of other active compounds or to synergistic effects of various
compounds.
Experiments performed with γ-GPeCSO contaminated with acetic acid isolated in larger
amounts by ion exchange - column chromatography yielded negative results (data not shown).
Osteoclast activity is closely linked to small pH variations. For instance, osteoclasts are more
active at a lower than at a higher pH (Arnett and Spowage 1996). Thus, acetic acid might well
69
have masked the osteoclast inhibitory effect of γ-GPeCSO. Further experiments with pure γ-
GPeCSO failed due to technical assay-related issues, which could not be resolved during this
work. However, further testing of pure γ-GPeCSO in vitro is planned beyond this work.
To test the bone resorption inhibitory activity of γ-GPeCSO in vivo, e.g. in a model of bone
resorption in rats, a simple method to isolate γ-GPeCSO in large amounts by using IE-CC was
elaborated. Further work should show whether γ-GPeCSO is responsible for the inhibition of
bone resorption exhibited by onions in vivo. However, digestive enzymes, such as trypsin and
proteases, could cleave a peptide like γ-GPeCSO and, therefore, blunt the effect.
Alternatively, vegetables contain natural components, e.g. lectin, amylase, and trypsin
inhibitors, which might affect the nutritional properties of ingested foodstuffs (Lajolo and
Genovese 2002). Such compounds are saponins (Gupta 1987), flavonoids (Salunkhe et al.
1982) and flatulence-producing oligosaccharides (Liener 1994), which are not only present in
onion but also in other species of the Allium genus. If onion is consumed as a whole these
compounds could prevent a gastrointestinal digestion of γ-GPeCSO. Additionally, the
oligosaccharides should be considered in in vivo experiments because they can make up to 15
% of the dry matter of onion (Jaime et al. 2001) and are known to increase in rats colonic
absorption of several nutrients, such as minerals and flavonoids if administered in high doses
of 5-10 % of daily food (Ohta et al. 2002; Coudray et al. 2003; Uehara et al. 2001).
Furthermore, administration of these saccharides at the named amounts is known to enhance
bone volume and to increase the concentration of the calcium transporting protein Calbindin-
D9k in the intestine of rats (Ohta et al. 1998; Takahara et al. 2000). However, these
saccharides are not known to inhibit osteoclast activity directly. Therefore, the direct
osteoclast activity inhibition in vitro must be due to γ-GPeCSO and other still unknown
compounds. However, inhibition by γ-GPeCSO in vivo is rather unlikely; in vivo inhibition of
bone resorption by onion is most probably caused by the oligosaccharides.
70
5 Material and Methods
5.1 Plant material and ethanolic extraction of onion powder
From commercially available dry onion flakes the moisture was removed by adsorption over
silica gel before grinding. This onion powder was stored in polyethylene bags from which the
air was evacuated before sealing and was kept at 4°C until use (Mühlbauer et al. 2002).
Ethanolic onion extracts were obtained as follows: about 400 g of dry onion powder
(accurately weighed) were extracted twice with 2000 ml of aqueous ethanol (85 %; v/v) at
60°C for 1 h and filtered through a towel. After complete evaporation of the ethanol the
aqueous residues were freeze-dried and stored at -20°C.
5.2 General laboratory equipment and solvents
Evaporator system: Rotavapor R-124, water bath B-480 and vacuum system B-172,
all from Büchi AG, Flawil, Switzerland.
Freeze drier: Lyolab A, Secfroid AG, Lausanne, Switzerland.
Chemicals and solvents: Solvents for HPLC-DAD and HPLC-ESI-MS were of
Lichrosolv® gradient grade quality, Merck AG, Darmstadt,
Germany.
Chemicals and solvents for MPLC and IE-CC separations and
TLC detection reagents were of p.a. quality, Merck AG,
Darmstadt, Germany.
Ultrasonic bath: TEC25, Telsonic AG, Bronschhofen, Switzerland.
Water: Reagent grade water (aqua purif.), obtained with a Milli-Q water
purification system, Millipore corp., Bedford, USA.
All material from Merck was bought through its Swiss distributor Grogg Chemie AG,
Stettlen-Deisswil, Switzerland.
71
5.3 Assays for the assessment of bone resorption
5.3.1 [3H]-Tetracycline urine excretion model of bone resorption (in vivo)
Procedure:
Male rats were kept in standard animal facilities that complied to the Swiss guidelines for care
and use of experimental animals. The Swiss State Committee for the Control of Animal
Experimentation approved the experiments performed.
To monitor bone resorption, the urinary excretion of 3H-labeled tetracycline ([3H]-Tc) was
used. To label homogeneously the skeletal bones of the rats with [3H]-Tc, rats were injected
subcutaneously from birth to the 6th week of their life a solution containing 10 µCi/ml of 7-
[3H](N) tetracycline dissolved in 0.15 M of NaCl. The doses were 1 x 100 µl in the 1st, 2 x
100 µl in the 2nd, 2 x 150 µl in the 3rd, 2 x 200 µl in the 4th, and finally 2 x 250 µl in the 5th
and 6th week. In the 7th week injections were stopped and the rats were translocated into
individual metabolic cages.
Before the experiments, all rats had free access to tap water and were fed ad libitum pellets of
a standard laboratory chow containing 1.1 % calcium and 0.8 % phosphate (w/w of dry food).
From the time when the rats were put into metabolic cages, all animals were given
demineralized water to drink and the diets were given as wet food by adding deionized water
to the food powder to give a wet consistency.
For this experiment a total of 26 animals with 5 animals in each treated group and 6 animals
in the negative control group (diet without onion fraction additions) were used. During the 10-
day equilibration period in the metabolic cages the animals were fed a “vegetarian diet”
containing 20 % soy flour, 10 % potato protein, and 2 % casein as protein source. Then,
during the 10-day period of bone resorption assessment, animals were switched to a
„semipurified diet“ containing the onion fractions with animal protein (20 % casein) as the
only protein source in order to avoid inhibitory effects on bone resorption from plant derived
compounds. For this, dry onion powder was mixed with the diet to provide a daily dose of 1
g/rat and as well ethanolic onion extract and adsorption CC fractions A and B were mixed
into the diet corresponding to 1 g of dry onion. 24-h urine was collected for 10 days to
monitor bone resorption; 3H in urine was determined by liquid scintillation counting. Aliquots
of 1 ml of urine were counted in 10 ml of Irga-Safe Plus scintillator and the result was
multiplied by the urine volume.
72
Results were given as mean values ± SEM and were compared to the hypothetical mean of the
negative control given as 1.0. The 95 % CI of the negative control was calculated by
multiplying the SEM with 1.96. Means of groups outside the 95 % CI were significantly
different from the control (p < 0.05) (Sachs 1974). Furthermore, the significance of
differences versus the hypothetical mean of 1.0 was calculated.
Animals, animal foods and reagents:
Rats: Male Wistar HANLNM rats, RCC Ltd., Füllinsdorf,
Switzerland.
Standard laboratory chow: Kliba 343, Kliba-Mühlen, Kaiseraugst, Switzerland.
“Vegetarian diet”: SoDi 2134 containing 1.1 % calcium, 1.2 % phosphate, 20 %
soy flour, 10 % potato protein, and 2 % casein as protein source,
Kliba-Mühlen, Kaiseraugst, Switzerland.
„Semipurified diet”: SoDi 2160, (AIN 76 based diet) containing 1.1 % calcium,
1.2 % phosphate and animal protein (20 % casein) as the only
protein source („casein-diet“;), Kliba-Mühlen, Kaiseraugst,
Switzerland.
[3H]-Tetracycline: 7-[3H](N) tetracycline, New England Nuclear, Boston, USA.
Scintillator: Irga-Safe Plus scintillator, Packard International, Zürich, CH.
73
5.3.2 Osteoclast resorption pit assay (in vitro)
Procedure:
Osteoclast-containing bone cell cultures were prepared by chopping the femurs of 5 to 7, 1-2
days old rat pups and put into medium consisting of Arnett’s MEM (Arnett and Spowage
1996) and 10 % fetal bovine serum. The cells were allowed to adhere for 40 min onto 4 x 4
mm bone slices in individual plastic wells (2 x 1 cm). Slices were then washed by dipping in
PBS solution pH 7.4 before transfer to test media in 48-well plates. Each experiment
consisted of 6-7 groups with 8 slices in each group: 2 x 8 slices for the negative control group
(medium only), 8 slices for the positive control group, i.e. medium with 10-12 M calcitonin or
fraction A or A1 at a dose of 30 mg per ml medium, and 3 to 4 treated groups with a defined
amount of the fraction to be tested dissolved in medium. Higher doses than 30 mg per ml
were avoided in order to prevent a hyper-osmotic toxicity in the cell culture. Each group was
cultured in 2 ml of testing medium and media containing onion fractions were sterilized by
filtering through sterile filters (0.45 µm). The cultures were then replaced into an incubator
with 5 % CO2 in air at 37°C for 24 h with a pH < 7.4 (Arnett and Spowage 1996). At the end
of the incubation period, bone slices were fixed for 1 min with fixation solution containing
acetone and stained for TRAP, both using a commercially available test. The total numbers of
TRAP+ MNCs, i.e. osteoclasts, were then counted on each slice. Cells were then removed by
gentle rubbing and the number of resorption pits excavated into the ivory surface was
determined by tangential illumination of the slices after prior sputtering with gold (Vitté and
Fleisch 1996).
Activities of each group were calculated as the ratio of resorption pits per TRAP+ MNC ±
SEM. For statistical significance analysis of the activities, the ratios of the treated groups ±
their respective SEM values were compared to the 95 % CI of the SEM of the negative
control.
74
Solutions and media:
PBS solution pH 7.4: Phosphate buffered saline solution consisting of NaCl 137 mM,
KCl 2.7 mM, Na2HPO4 8.1 mM, KH2PO4 1.47 mM, CaCl2 0.9
mM, MgCl2 0.49 mM.
Arnett’s MEM: Arnett’s Minimum Essential Medium (MEM) is a cell culture
medium consisting of Earle’s balanced salt solution (Invitrogen
corp., Carlsbad, USA), NaHCO3 24.5 mM (Merck AG,
Darmstadt, Germany), amino acids (MEM amino acids without
L-glutamine, Invitrogen corp., Carlsbad, USA), L-glutamine 200
mM (Invitrogen corp., Carlsbad, USA), vitamins (MEM
vitamins solution, Invitrogen corp., Carlsbad, USA), 100 U/ml
penicillin and 100 µg/ml streptomycin (both Invitrogen corp.,
Carlsbad, USA) and hydrochloric acid 10 mM (Merck AG,
Darmstadt, Germany).
FBS: Fetal bovine serum, Invitrogen corp., Carlsbad, USA.
Fixation solution: 60 % aqueous acetone containing 15.2 mM citric acid; part of
the Acid Phosphatase Kit, Sigma Diagnostics, Buchs,
Switzerland.
Bone slices: Ivory slices kindly provided from Dr. B. Irrall, The Federal
Veterinary Office, Bern, Switzerland.
TRAP-staining: Acid Phosphatase Kit, Sigma Diagnostics, Buchs, Switzerland;
This test is based upon the enzymatic activity of acid
phosphatases which hydrolyze Naphtol-AS-BI-phosphate into
Naphtol-AS-BI. The latter forms insoluble maroon dyes by
coupling to a diazo compound (fast Garnet GBC salt) added to
the cell culture. By the addition of tartrate, cells containing
tartaric acid-sensitive acid phosphatases are devoid of activity,
while those cells containing tartaric acid-resistant phosphatase
are not affected by such a treatment.
Calcitonin: Novartis AG, Basel, Switzerland.
Water: Reagent grade water, obtained with a Milli-Q water purification
system, Millipore corp., Bedford, USA.

75
48-well plates: Becton Dickinson Labware, Franklin Lakes, USA.
Sterile filters: Schleicher & Schuell, Düren, Germany.
Sputter coater: SCD 004, Balzers, Liechtenstein.
76
5.4 Chromatographic techniques
5.4.1 Chromatographic techniques for analytical separations
5.4.1.1 Reversed phase - high performance liquid chromatography
Equipment: 1090 liquid chromatograph with diode array detection, Hewlett-
Packard, Palo Alto, USA.
Column: 125 x 4 mm, Macherey-Nagel GmbH, Düren, Germany.
Stationary phase: Spherisorb ODS-1, 3 µm particle size.
Mobile phase: Water : acetonitrile (1:3; v/v) acidified with 0.05 % phosphoric
acid (v/v).
Flow: 0.7 ml/min, isocratic.
Column oven: 40°C.
Detection: UV at 195 nm ± 5 nm.
Calibration: Solutions were properly diluted from a stock solution of 20 mg
γ-GPeCSO in 2 ml of mobile phase.
5.4.1.2 Reversed phase - high performance liquid chromatography - electrospray ionization-
mass spectroscopy
Equipment: ESI-MS: LCQ, Finnigan GmbH, Bremen, Germany.
HPLC: 1100 Series liquid chromatograph with diode array
detection, Hewlett-Packard, Palo Alto, USA.
Column: 125 x 4 mm, Macherey-Nagel GmbH, Düren, Germany.
Stationary phase: Spherisorb ODS-1, 3 µm particle size.
Mobile phase: Water : acetonitrile (1 : 4; v/v) acidified with 0.05 % formic acid
(v/v).
Flow: 0.7 ml/min, isocratic.
Column oven: 40°C.
Detection: ESI-MS.
Collision gas and energy: Helium, 35 % (arbitrary unit).
77
5.4.1.3 Thin layer chromatography systems
All TLC separations were performed in 13.0 x 13.5 x 5.8 cm (width x height x depth) glass
chambers from Camag AG, Muttenz, Switzerland. The sample amount ranged from 10 to 50
µg.
5.4.1.3.1 Normal phase - thin layer chromatography
Stationary phase: All NP-TLC separations were performed using 10 x 10 cm
Kieselgel 60 F254 TLC-plates from Merck AG, Darmstadt,
Germany.
Mobile phases: a) Methylethylketone - acetic acid - methanol 6:5:3 (v/v).
b) Acetone - water – hydrochloric acid 37 % 9ml :1ml: 1drop.
c) n-Butanol - acetic acid - diethyl ether - water 9:6:3:1 (v/v).
d) Chloroform - methanol - water 6.4:5:1 (v/v).
e) n-Butanol - n-propanol - acetic acid - water 3:1:1:1 (v/v).
Development distance: 9.5 cm.
5.4.1.3.2 Reversed phase - high performance thin layer chromatography
Stationary phase: 10 x 10 cm RP-18 WF254S, Merck AG, Darmstadt, Germany.
Mobile phase: Water - methanol 19:1 (v/v).
Development distance: 9.5 cm.
5.4.1.3.3 Thin layer chromatography detection reagents
According to Wagner et al. (1983):
Anisaldehyde reagent: 5 % acetic acid solution of anisaldehyde followed by heating at
120°C; visual detection.
78
Naturstoff reagent: 1 % methanolic solution of diphenylboric acid-β-ethylaminoate
followed by a 5 % ethanolic solution of polyethyleneglycole
4000; visual detection or at 365 nm.
Ninhydrin reagent: 30 mg of ninhydrin diluted with 10 ml of n-butanol followed by
addition of 0.3 ml of acetic acid; visual detection after heating.
79
5.4.2 Chromatographic techniques for preparative separations
5.4.2.1 Adsorption column chromatography
The column was slurry-filled by using aqueous ethanol 85 % (v/v). After filling, the stationary
phase was stepwise washed with 400 ml of methanol, 500 ml of aqueous ethanol 85 %, 2500
ml of water and 500 ml of aqueous ethanol 85 %. After washing, the stationary phase was
conditioned with the first solvent used for separation, i.e. aqueous ethanol 15 %.
38.10 g of ethanolic onion extract were dissolved in 600 ml of aqueous ethanol 15 % and
heated at 60°C for 30 min under constant stirring. After cooling to room temperature, the
turbid solution was centrifuged for 20 min at 7000 rounds per minute and the supernatant
subjected to fractionation. The residue was discarded.
The pooled fractions resulting from elution by 15 % ethanol and devoid of flavonoids, e.g.
quercetin, and the fraction resulting from elution by 85 % ethanol and containing the
flavonoids were reduced under vacuum at 40°C and freeze-dried. The water fraction was
discarded.
Column: 48 x 4 cm, Brand GmbH, Wertheim, Germany.
Sample amount: 38.10 g dry onion powder.
Stationary phase: Amberlite XAD-4, Fluka Chemie GmbH, Buchs, Switzerland.
Mobile phase: 1. 1280 ml of aqueous ethanol 15 % (v/v),
2. 1280 ml of water,
3. 1400 ml of aqueous ethanol 85 % (v/v).
Flow: 10 ml/min.
Detection of eluates: NP-TLC monitoring with NP-TLC system d); Naturstoff
reagent.
Heated stirrer: Heidolph MR 3003, Faust AG, Schaffhausen, Switzerland.
Centrifuge: Suprafuge 22, Heraeus GmbH, Osterode am Harz, Germany.
80
5.4.2.2 Medium pressure liquid chromatography
All MPLC columns used in this work were dry-packed in our laboratory. After packing
vacuum was applied and the columns were conditioned with the first eluent used for
separation. Samples for reversed phase MPLC and for normal phase-MPLC were dissolved in
5 ml and 6 ml of mobile phase, respectively. All MPLC separations were performed by using
a 681 chromatography pump and a 684 fraction collector, Büchi AG, Flawil, Switzerland.
5.4.2.2.1 Reversed phase - medium pressure liquid chromatography
Pre-column: 13.0 x 1.0 cm.
Column: 46 x 2.5 cm.
Sample amount: 1.0 - 2.0 g.
Stationary phase: Lichroprep RP-18, 15 - 25 µm particle size, Merck AG,
Darmstadt, Germany.
Mobile phases: 1. 340 ml of aqueous methanol 5 % (v/v),
2. 300 ml of methanol (wash).
Flow: 4 ml/min.
Fractionation: 60 fractions of 4 ml each; start after 100 ml, end after 340 ml.
Fraction monitoring: RP-HPTLC; anisaldehyde reagent.
81
5.4.2.2.2 Normal phase - medium pressure liquid chromatography
Pre-column: 13.0 x 1.0 cm.
Column: 22.0 x 2.5 cm.
Sample amount: 400 mg.
Stationary phase: Kieselgel 60, 15 - 40 µm particle size, Merck AG, Darmstadt,
Germany.
Mobile phases: 1. 1208 ml of chloroform - methanol - water (6.4 : 5 : 1; v/v), or
1208 ml of dichloromethane - methanol - water (6.4 : 5 : 1; v;v);
2. 300 ml of aqueous methanol 70 % (v/v) (wash).
Flow: 4 ml/min.
Fractionation: 120 fractions of 8 ml each.
Fraction monitoring: NP-TLC monitoring using NP-TLC system e); anisaldehyde
reagent.
5.4.2.3 Semi preparative - high performance liquid chromatography
Equipment: 1090 liquid chromatograph with diode array detection, Hewlett-
Packard, Palo Alto, USA.
Column: 250 x 10 mm.
Sample amount: 125 µg.
Stationary phase: Spherisorb ODS-1, 5 µm particle size.
Mobile phase: Water - acetonitrile (1:1; v/v) acidified with 0.00625 % formic
acid; isocratic elution.
Flow: 1.5 ml/min.
Column oven: 40°C.
Fractionation: Manually.
Detection: UV at 195 nm.
82
5.4.2.4 Ion exchange - column chromatography
5.4.2.4.1 Cation exchange - column chromatography
Column: 43 x 3 cm, Kuhn AG, Bern, Switzerland.
Stationary phase: Cation exchange beads Dowex 50WX8, Fluka Chemie GmbH,
Buchs, Switzerland.
Filling volume (slurry): 150 cm3.
Bed volume (BV): 75 cm3 (~ 75 ml).
Mobile phase: 1. 975 ml of aqua purif. (non-cationic fraction),
2. 1'425 ml of 0.75 M ammonia (cationic fraction).
Flow: 15 - 20 ml/min.
Sample: 10.8 g of fraction A dissolved in 100 ml of aqua purif.
Resin storage solution: 20 % aqueous NaCl.
Resin wash: 500 ml of aqua purif.
Resin regeneration: 750 ml of 6 % aqueous HCl.
Fraction monitoring: NP-TLC-system using NP-TLC system e); anisaldehyde and
ninhydrin reagent.
83
5.4.2.4.2 Anion exchange - column chromatography
Pump: Pericyclic pump Minipuls 3, Gilson SA, Villiers-le-Bel, France.
Fraction collector: 7000 Ultrorac, Amersham Biosciences GmbH, Dübendorf,
Switzerland.
Columns: Chromatography C columns 16 mm i.d. x 20 cm length (small)
and 26 mm i.d. x 40 cm length (large), Amersham Biosciences
GmbH, Dübendorf, Switzerland.
Stationary phase: Anion exchange resin Dowex 1X8, Fluka Chemie GmbH,
Buchs, Switzerland.
Filling volume: 18 cm3 ~ 18 ml (small), 90 cm3 ~ 90 ml (large).
Bed volume: 9 cm3 (small), 45 cm3 (large).
Mobile phase: 1. 47.5 ml of 0.1 M acetic acid, 2. 250 ml of 0.5 M acetic acid,
3. 200 ml of 2.0 M acetic acid (small).
1. 237.5 ml of 0.1 M acetic acid, 2. 1250 ml of 0.5 M acetic
acid, 3. 1000 ml of 2.0 M acetic acid (large).
Flow: 19 ml/h (small), 95 ml/h (large).
Sample: Cationic fraction corresponding to 50 mio. mAU (small) and
250 mio. mAU (large) of γ-GPeCSO.
Volume of fractions: 2.5 ml (small), 12.5 ml (large).
Resin storage solution: 20 % aqueous NaCl.
Resin wash: Stepwise elution with 15 % NaCl, 10 % NaCl and 5 % NaCl,
water.
Resin regeneration: 100 ml 6 % NaOH (small), 500 ml 6 % NaOH (large).
Resin activation: 1 liter of 1 M NaAc (small) and 1 liter of 5 M NaAc (large) until
the precipitation of AgCl stopped after addition of 1-2 drops of a
1 % solution of AgNO3 to 1 ml of eluate.
Fraction monitoring: NP-TLC-system e); Ninhydrin reagent.
84
5.4.2.5 Solid phase extraction chromatography
All SPE columns were pre-conditioned with 3.0 ml of reagent grade water. Samples
consisting of 10 mg of γ-GPeCSO contaminated with acetic acid were diluted in 0.1 ml of
reagent grade water and eluted through the SPE column with 4.0 ml of acetonitrile.
Fractions were collected as follows: The first 2.0 ml of acetonitrile were collected in 0.2 ml
and the second 2.0 ml of acetonitrile in 1.0 ml fractions, respectively.
SPE columns: C18 Mega Bond Elut™, size 6CC, Varian Sample Preparation
Products, Harbor City, California, USA.
Vacuum elution chamber: Adsorbex Sample Preparation Unit, Merck AG, Darmstadt,
Germany.
Flow: 1 ml/min.
Detection: NP-TL plates; Ninhydrin reagent.
85
5.5 Spectroscopic techniques for structure elucidation
5.5.1 Electrospray ionization - mass spectroscopy
Acidic hydrolysis of fraction A1-4C was performed with formic acid (70 %) at 100°C for 22 h
in a closed vial.
ESI-MS-MS measurements were performed on an Applied Biosystems / Sciex Qstar Pulsar
Mass Spectrometer (Foster City, California, USA). This is a hybrid quadrupole time-of-flight
(TOF) mass spectrometer equipped with a nano-electrospray ion source.
The ESI-MS-MS measurements were performed in Dr. Stefan Schürchs’s Group of Mass
Spectroscopy at the Institute of Organic Chemistry of the University of Bern.
5.5.2 Nuclear magnetic resonance spectroscopy
NMR experiments were performed on a Bruker Avance DRX500 instrument (Karlsruhe,
Germany). D2O was purchased from Euriso-Top (Gif-sur-Yvette, France) and trimethylsilyl-
propane sulphonic acid obtained from Wilmad corp. (Buena, New Jersey, USA).
All NMR measurements were kindly performed in Prof. Peter Bigler’s Nuclear Magnetic
Resonance Group at the Institute of Organic Chemistry of the University of Bern.
5.6 Statistical analysis
Statistical analysis of the correlation between biological activity and amount of γ-GPeCSO in
the fractions was performed by using InStat® application software vers. 3.0a for the
Macintosh®, GraphPad Software Inc., San Diego, USA.
86
6 References
Arjmandi B.H.; Alekel L.; Hollis B.W.; Amin D.; Stacewicz-Sapuntzakis M.; Guo P.;
Kukreja S.C. (1996), Dietary soybean protein prevents bone loss in an ovariectomized rat
model of osteoporosis. J. Nutr. 126:161-7.
Arnett T.R.; Spowage M. (1996), Modulation of the resorptive activity of rat osteoclasts by
small changes in extracellular pH near the physiological range. Bone 18: 277-9.
Augusti K.T. (1996), Therapeutic values of onion (Allium cepa L.) and garlic (Allium sativum
L.). Indian J. Exp. Biol. 34:634-40.
Baron R. (1999), Anatomy and ultrastructure of bone. In: Murray J.; Favus M.D. (Eds),
Primer on the metabolic bone diseases and disorders of mineral metabolism. 4th ed.,
Lippincott Williams and Wilkins, Philadelphia, Baltimore, New York, p. 3-10.
Becker H.G.O.; Berger W.; Domschke G.; Fanghänel E.; Faust J.; Fischer M.; Gentz F.;
Gewald K.; Gluch R.; Mayer R.; Müller K.; Pavel D.; Schmidt H.; Schollberg K.; Schwetlick
K.; Seiler E; Zeppenfeld G. (1996), Organikum. 20th ed., Johann Ambrosius Barth Verlag,
Heidelberg, Leipzig.
Booth S.L.; Tucker K.L.; Chen H.; Hannan M.T.; Gagnon D.R.; Cupples L.A.; Wilson P.W.;
Ordovas J.; Schaefer E.J.; Dawson-Hughes B.; Kiel D.P. (2000), Dietary vitamin K intakes
are associated with hip fracture but not with bone mineral density in elderly men and women.
Am. J. Clin. Nutr. 71:1201-8.
Breu W. (1996), Allium cepa L. (onion) part 1: Chemistry and analysis. Phytomed. 3:293-306.
Bonjour J.P.; Carrie A.L.; Ferrari S.; Clavien H.; Slosman D.; Theintz G.; Rizzoli R. (1997),
Calcium-enriched foods and bone mass growth in prepubertal girls: a randomized, double-
blind, placebo-controlled trial. J. Clin. Invest. 99:1287-94.
Bushinsky D.A. (2001), Acid-base imbalance and the skeleton. Eur. J. Nutr. 40:238-44.
87
Carson J.F.; Boggs L.E. (1966), The synthesis and base-catalyzed cyclization of (+) and (-)-
cis-S-(1-propenyl)-L-cysteine sulphoxides. J. Org. Chem. 31:2862-4.
Carson J.F.; Lundin R.E. (1966), The configuration of (+)-S-(1-propenyl)-L-cysteine S-oxide
from Allium cepa. J. Org. Chem. 31:1634-5.
Carson J.F.; Wong F.F. (1974), Preparation of γ-glutamyl dipeptides of sulphur-containing
amino-acids. J. Org. Chem. 41:685-7.
Chenu C.; Serre C.M. (1998), Glutamate receptors are expressed by bone cells and are
involved in bone resorption. Bone 22:295-9.
Cole R.B. (1997), Electrospray ionization mass spectrometry. 1st ed., John Wiley & Sons,
New York, Chichester, Weinheim.
Coudray C.; Tressol J.C.; Gueux E.; Rayssiguier Y. (2003), Effects of inulin-type fructans of
different chain length and type of branching on intestinal absorption and balance of calcium
and magnesium in rats. Eur. J. Nutr. 42:91-8.
Dahlgren R.M; Clifford T.; Yeo P. (1985), The families of the monocotyledons. Springer-
Verlag, Berlin, Heidelberg, New York.
Dawson-Hughes B. (1999), Pharmacologic treatment of postmenopausal osteoporosis. In:
Murray J.; Favus M.D. (Eds), Primer on the metabolic bone diseases and disorders of mineral
metabolism. 4th ed., Lippincott Williams and Wilkins, Philadelphia, Baltimore, New York, p.
283-9.
Didry N.; Pinkas M.; Dubreuil L. (1987), Activité antibactérienne d’espèces du genre Allium.
Pharmazie 42:687-8.
Dorsch W.; Scharff J.; Bayer T.; Wagner H. (1989), Antiasthmatic effects of onions:
Prevention of platelet-activating factor induced bronchial hyper reactivity to histamine in
guinea pigs by diphenylthiosulphinate. Int. Arch. Allergy Appl. Immunol. 88:228-30.
88
Dorsch W. (1996), Allium cepa L. (onion) part 2: Chemistry, analysis and pharmacology.
Phytomed. 3:391-7.
Dorsch W.; Wagner H. (1991), New antiasthmatic drugs from traditional medicine? Int. Arch.
Allergy Appl. Immunol. 94:262-5.
Draper C.R.; Edel M.J.; Dick I.M.; Randall A.G.; Martin G.B., Prince R.L. (1997),
Phytoestrogens reduce bone loss and bone resorption in oophorectomized rats. J. Nutr.
127:1795-9.
Ducy P.; Schinke T.; Karsenty G. (2000), The osteoblast: A sophisticated fibroblast under
central surveillance. Science 289:1501-4.
Eastell R. (1999), Pathogenesis of postmenopausal osteoporosis. In: Murray J.; Favus M.D.
(Eds), Primer on the metabolic bone diseases and disorders of mineral metabolism. 4th ed.,
Lippincott Williams and Wilkins, Philadelphia, Baltimore, New York, p. 260-2.
Einhorn T.A. (1999), Orthopedic complications of osteoporosis. In: Murray J.; Favus M.D.
(Eds), Primer on the metabolic bone diseases and disorders of mineral metabolism. 4th ed.,
Lippincott Williams and Wilkins, Philadelphia, Baltimore, New York, p. 307-13.
Felix R.; Fleisch H.; Frandsen P.L. (1992), Effect of Pasteurella multocida toxin on bone
resorption in vitro. Infection Immunity 60:4984-8.
Feyen J.H.M.; Kuntzelmann G.M.M. (1991), Inhibitory effect of okadoic acid on bone
resorption in neonatal mouse calvaria in vitro. Biochem. Biophys. Res. 178:758-60.
Flamm G.; Glinsmann W.; Kritchevsky D.; Prosky L.; Roberfroid M. (2001), Inulin and
oligofructose as dietary fiber: a review of the evidence. Crit. Rev. Food. Sci. Nutr. 41:353-62.
Freeman G.G.; Whenham R.J. (1975), The use of synthetic (±)-S-1-propyl-L-cysteine
sulphoxide and of alliinase preparations in studies of flavour changes resulting from
processing of onion (Allium cepa L.). J. Sci. Food Agric. 26:1333-46.
89
Friebolin H. (1998), Basic one- and two-dimensional NMR spectroscopy. 3rd ed., Wiley-
VCH, Weinheim, New York, Chichester.
Geng Z.; Rong Y.; Lau B.H. (1997), S-allyl cysteine inhibits activation of nuclear factor
kappa B in human T cells. Free Radic. Biol. Med. 23:345-50.
Gray C.; Marie H.; Arora M.; Tanaka K.; Boyde A.; Jones S.; Attwell D. (2001), Glutamate
does not play a major role in controlling bone growth. J. Bone Miner. Res. 16:742-9.
Gupta Y.P. (1987), Anti-nutritional and toxic factors in food legumes: a review. Plant Foods
Hum. Nutr. 37:201-28.
Hamburger M.; Hostettmann K. (1991), Bioactivity in plants: The link between
phytochemistry and medicine Phytochem. 30:3864-74.
Heaney R.P. (1999), Nutrition and osteoporosis. In: Murray J.; Favus M.D. (Eds), Primer on
the metabolic bone diseases and disorders of mineral metabolism. 4th ed., Lippincott
Williams and Wilkins, Philadelphia, Baltimore, New York, p. 270-3.
Hegi G. (1939), Illustrierte Flora von Mitteleuropa, Vol II, (ed. Suessenguth K.) J.F.
Lehmanns Verlag, München, Berlin.
Hegnauer R. (1963), Chemotaxonomie der Pflanzen, Vol. 2, Birkhäuser Verlag Basel,
Stuttgart.
Horcajada-Molteni M.N.; Crespy V.; Coxam V.; Davicco M.J.; Remesy C.; Barlet J.P.
(2000), Rutin inhibits ovariectomy-induced osteopenia in rats. J. Bone Miner. Res. 15:2251-8.
Hostettmann K; Marston A.; Hostettmann M. (1985), Preparative Chromatography
Techniques. Springer-Verlag, Berlin, Heidelberg, New York.
Hutchinson C. (1959), The families of flowering plants. 2nd ed., Vol. I-II, Oxford.
90
Ide N.; Lau H.S. (2001), Garlic compounds minimize intracellular oxidative stress and inhibit
nuclear factor-κB activation. J. Nutr. 131:1020S-6S.
Ikan R. (1991), Natural products. 2nd ed., Academic press, San Diego, New York, Boston.
Imai S.; Tsuge N.; Tomotake M.; Nagatome Y.; Sawada H.; Nagata T.; Kumagai H. (2002),
Plant biochemistry: an onion enzyme that makes the eyes water. Nature 419:685.
Ingold P.; Kneissel M.; Mühlbauer R.C.; Gasser J.A. (1998), Extracts from onion prevent
tibial cortical and cancellous bone loss induced by a high phosphate/low protein diet in aged
retired breeder rats. Bone 23:S387.
Isobe M.; Uyakul D.; Liu K.L.; Goto T. (1990), FAB-MS/MS spectrometry in determining
the primary structure of γ-glutamyl-containing peptides. Agric. Biol. Chem. 54:1651-60.
Jaime L.; Martin-Cabrejas M.A.; Molla E.; Lopez-Andreu F.J.; Esteban R.M. (2001), Effect
of storage on fructan and fructooligosaccharide of onion (Allium cepa L.). J. Agric. Food.
Chem. 49:982-8.
Joachim, K. (1890), Papyrus Ebers. Georg Reimer Verlag, Berlin.
Junqueira L.C.; Carneiro J. (1991), Zytologie, Histologie und mikroskopische Anatomie des
Menschen. 3. Aufl., Springer Verlag Berlin, Heidelberg, New York, S. 190-217.
Kim J.-H. (1997), Anti-bacterial action of onion (Allium cepa L.) extracts against oral
pathogenic bacteria. J. Nihon. Univ. Sch. Dent. 39:136-41.
Kintya P.K. (1987), FECS Int. Conf. Chem. Biotechnol. Biol. Act. Nat. Prod., 3rd, Meeting
date 1985 5:166.
Koch H.P. (1994), Die Küchenzwiebel – eine zu Unrecht vernachlässigte Arzneipflanze.
Pharm. uns. Zeit 23:333-8.
91
Kopsell D.A.; Randle W.M. (1999), Selenium affects the S-alk(en)yl cysteine sulphoxides
among short-day onion cultivars. J. Amer. Soc. Hort. Sci. 124:307-11.
Kuttan R.; Nair N.G.; Radhakrishnan A.N.; Spande T.F.; Yeh H.J.; Witkop B. (1974), The
isolation and characterization of γ-L-glutamyl-S-(trans-1-propenyl)-L-cysteine sulphoxide
from Sandal (Santalum album L.). An interesting occurrence of sulphoxide diastereoisomers
in nature. Biochem. 13:4394-400.
Lajolo F.M.; Genovese M.I. (2002), Nutritional significance of lectins and enzyme inhibitors
from legumes. J. Agric. Food Chem. 50:6592-8.
Lancaster J.E.; Kelly K.E. (1983), Quantitative analysis of the S-alk(en)yl-L-cysteine
sulphoxides in onion (Allium cepa L.). J. Sci. Food. Agric. 34:1229-35.
Liener I.E. (1994), Implications of antinutritional components in soybean foods. Crit. Rev.
Food Sci. Nutr. 34:31-67.
Lindsay R.; Cosman F. (1999), Prevention of osteoporosis. In: Murray J.; Favus M.D. (Eds),
Primer on the metabolic bone diseases and disorders of mineral metabolism. 4th ed.,
Lippincott Williams and Wilkins, Philadelphia, Baltimore, New York, p. 264-9.
Löffler G.; Petrides P.E. (2002), Biochemie und Pathobiochemie, Springer Verlag, Berlin.
Makheja A.N.; Vanderhoek J.Y.; Bailey J.M. (1979), Inhibition of platelet aggregation and
thromboxane synthesis by onion and garlic. Lancet 1:781.
Makheja A.N.; Vanderhoek J.Y.; Bryant R.W.; Baily J.M. (1980), Altered arachidonic acid
metabolism in platelets inhibited by onion or garlic extracts. Adv. Prostagland. Thrombox.
Res. 6:309-12.
Mathew P.T.; Augusti K.T. (1975). Onion prevents the rise of serum cholesterol and serum
triglycerides in patients with alimentary lipaemia. Ind. J. Physiol. Pharmacol. 19:213-6.
92
Mundy G.R. (1999), Bone remodeling. In: Murray J.; Favus M.D. (Eds), Primer on the
metabolic bone diseases and disorders of mineral metabolism. 4th ed., Lippincott Williams
and Wilkins, Philadelphia, Baltimore, New York, p. 30-8.
Mühlbauer R.C. (1994), Biochemical assessment of bone metabolism in rodents. In: Sex
Steroids and Bone. Ziegler R., Pfeilschifter J. and Bräutigam M, Eds. Springer, Berlin,
Heidelberg, New York, p. 191-202.
Mühlbauer R.C. (2001), Rutin cannot explain the effect of vegetables on bone metabolism. J.
Bone Miner. Res. 16:970-1.
Mühlbauer R.C.; Fleisch H. (1990), A method for continual monitoring of bone resorption in
rats: Evidence for a diurnal rhythm. Am. J. Physiol. 259:R679-89.
Mühlbauer R.C.; Li F.; Guenther H.L. (1998), Common vegetables consumed by humans
potently modulate bone metabolism in vitro and in vivo. Bone 23:S388.
Mühlbauer R.C.; Li F. (1999), Effect of vegetables on bone metabolism. Nature 401:343-4.
Mühlbauer R.C.; Lozano A.; Reinli A. (2002), Onion and a mixture of vegetables, salads and
herbs affect bone resorption in the rat by a mechanism independent of their base excess. J.
Bone Miner. Res. 17:1230-6.
Mütsch-Eckner M.; Meier B.; Wright A.D.; Sticher O. (1992), γ-glutamyl peptides from
allium sativum bulbs. Phytochem. 31:2389-91.
Mütsch-Eckner M.; Erdelmeier C.A.; Sticher O.; Reuter H.D. (1993), A novel amino acid
glycoside and three amino acids from Allium sativum. J. Nat. Prod. 56:864-9.
Mütsch-Eckner M; Sticher O. (1992), Reversed phase – high performance liquid
chromatography of S-alk(en)yl-L-cysteine derivatives in Allium sativum including the
determination of (+)-S-allyl-L-cysteine sulphoxide, γ-L-glutamyl-S-allyl-cysteine and γ-L-
glutamyl-S-(trans-1-propenyl)-L-cysteine. J. Chromatogr. 625:183-90.
93
New S.A.; Robins S.P.; Campbell M.K.; Martin J.C.; Garton M.J.; Bolton-Smith C.; Grubb
D.A.; Lee S.J.; Reid D.M. (2000), Dietary influences on bone mass and bone metabolism:
Further evidence of a positive link between fruit and vegetable consumption and bone health?
Am. J. Clin. Nutr. 71:142-51.
Niessen W.M.A. (1999), State-of-the-art in liquid chromatography-mass spectrometry. J.
Chromatogr. A 856:179-97.
Oh M.S.; Uribarri J. (1996), Bone buffering of acid: Fact or fancy? J. Nephr. 9:261-2.
Ohta A.; Ohtsuki M.; Uehara M.; Hosono A.; Hirayama M.; Adachi T.; Hara H. (1998),
Dietary fructooligosaccharides change the concentration of Calbindin-D9k differently in the
mucosa of the small and large intestine of rats. J. Nutr. 128:934-9.
Ohta A.; Uehara M.; Sakai K.; Takasaki M.; Adlercreutz H.; Morohashi T.; Ishimi Y. (2002),
A combination of dietary fructooligosaccharides and isoflavone conjugates increases femoral
bone mineral density and equol production in ovariectomized mice. J. Nutr. 132:2048-54.
Orwoll E.S. (1999), Osteoporosis in men. In: Murray J.; Favus M.D. (Eds), Primer on the
metabolic bone diseases and disorders of mineral metabolism. 4th ed., Lippincott Williams
and Wilkins, Philadelphia, Baltimore, New York, p. 289-92.
Pezzuto J. M. (1997), Plant-derived anticancer agents. Biochem. Pharmacol. 53:121-33.
Pretsch E.; Bühlmann P.; Affolter C. (2000), Structure determination of organic compounds.
1st ed., Springer, Berlin, Heidelberg, New York.
Pretsch E.; Clerc T.; Seibl J.; Simon W. (1985), Tabellen zur Strukturaufklärung organischer
Verbindungen mit spektroskopischen Methoden. 3rd ed., Springer-Verlag, Berlin, Heidelberg,
New York.
Randle W.M.; Lancaster J.E.; Shaw M.L.; Sutton K.H.; Hay R.L.; Bussard M.L. (1995),
Quantifying onion flavor compounds responding to sulphur fertility – Sulphur increases levels
94
of alk(en)yl cysteine sulphoxides and biosynthetic intermediates. J. Amer. Soc. Hort. Sci.
120:1075-81.
Remer T. (2001), Influence of nutrition on acid-base balance - metabolic aspects. Eur. J. Nutr.
40:214-20.
Reid I.R. (1999), Menopause. In: Murray J.; Favus M.D. (Eds), Primer on the metabolic bone
diseases and disorders of mineral metabolism. 4th ed., Lippincott Williams and Wilkins,
Philadelphia, Baltimore, New York, p. 55-6.
Rodan G.A.; Martin T.J. (2000), Therapeutic approaches to bone diseases. Science 289:1508-
14.
Rücker G.; Neugebauer M.; Willems G.G. (1992), Instrumentelle pharmazeutische Analytik.
2. Aufl., Wissenschaftliche Verlagsgesellschaft Stuttgart.
Sachs L. (1974), Der Weg zum statistischen Test. Statistische Sicherheit. In: Angewandte
Statistik. Springer-Verlag, Berlin, Heidelberg, New York, p. 90-1.
Salunkhe D.K.; Jadhav S.J.; Kadam S.S.; Chavan J.K. (1982), Chemical, biochemical, and
biological significance of polyphenols in cereals and legumes. Crit. Rev. Food Sci. Nutr.
17:277-305.
Shaw M.L.; Lancaster J.E. (1989), Quantitative analysis of the major γ-glutamyl peptides in
onion bulbs (Allium Cepa L.). J. Sci. Food. Agric. 48:459-67.
Sherma J. (2000), Thin-layer chromatography in food and agricultural anlysis. J. Chromatogr.
A 880:129-47.
Sojka J.E.; Weaver C.M. (1995), Magnesium supplementation and osteoporosis. Nutr. Rev.
53:29-33.
Strasburger E.; Sitte P.; Weiler E.W.; Kadereit J.W.; Bresinsky A.; Körner C. (1978),
Lehrbuch der Botanik für Hochschulen. Gustav Fischer Verlag Stuttgart,, New York.
95
Steinegger E.; Sticher O.; Hänsel R. (1999), Pharmakognosie, Phytopharmazie, 6. Aufl.,
Springer Verlag, Berlin, Heidelberg, New York.
Suzuki T. (1962), Chemical analysis of the lacrimatory compounds. Chem. Pharm. Bull.
(Tokyo) 10:328-30.
Takahara S.; Morohashi T.; Sano T.; Ohta A.; Yamada S.; Sasa R. (2000),
Fructooligosaccharide consumption enhances femoral bone volume and mineral
concentrations in rats. J. Nutr. 130:1792-5.
Teitelbaum S.L. (2000), Bone resorption by osteoclasts. Science 289:1504-8.
Tucker K.L.; Chen H.; Hannan M.T.; Cupples L.A.; Wilson P.W.; Felson D.; Kiel D.P.
(2002), Bone mineral density and dietary patterns in older adults: The Framingham
osteoporosis study. Am. J. Clin. Nutr. 76:245-52.
Tucker K.L.; Hannan M.T.; Chen H.; Cupples L.A.; Wilson P.W.; Kiel D.P. (1999),
Potassium, magnesium, and fruit and vegetable intakes are associated with greater bone
mineral density in elderly men and women. Am. J. Clin. Nutr. 69:727-36.
Tucker K.L.; Hannan M.T.; Kiel D.P. (2001), The acid-base hypothesis: Diet and bone in the
Framingham osteoporosis study. Eur. J. Nutr. 40:231-7.
Uehara M.; Ohta A.; Sakai K.; Suzuki K.; Watanabe S.; Adlercreutz H. (2001), Dietary
fructooligosaccharides modify intestinal bioavailability of a single dose of genistein and
daidzein and affect their urinary excretion and kinetics in blood of rats. J. Nutr. 131:787-95.
Virtanen A.I.; Matikkala E.J. (1961a). γ-Glutamyl peptides from onions (1). Suom.
Kemistilehti B 34:53.
Virtanen A.I.; Matikkala E.J. (1961b). γ-Glutamyl peptides from onions (2). Suom.
Kemistilehti B 34:84.
96
Vitté C.; Fleisch H. (1996), Bisphosphonates induce osteoblasts to secrete an inhibitor of
osteoclast-mediated resorption. Endocrinol. 137:2324-33.
Wagner H.; Bladt S.; Zgainski E.M. (1983), Drogenanalyse. Springer-Verlag, Berlin
Heidelberg, New York.
Watt B.K.; Merrill A.L. (1963), Composition of foods; raw, processed, prepared, Agricultural
handbook No 8. U.S. Department of Agriculture, Washington D.C.
Yu T.-H.; Wu C.M.; Rosen R.T.; Hartman T.G.; Ho C.T. (1994), Volatile compounds
generated from thermal degradation of alliin and deoxyalliin in an aqueous solution. J. Agric.
Food. Chem. 42:146-53.
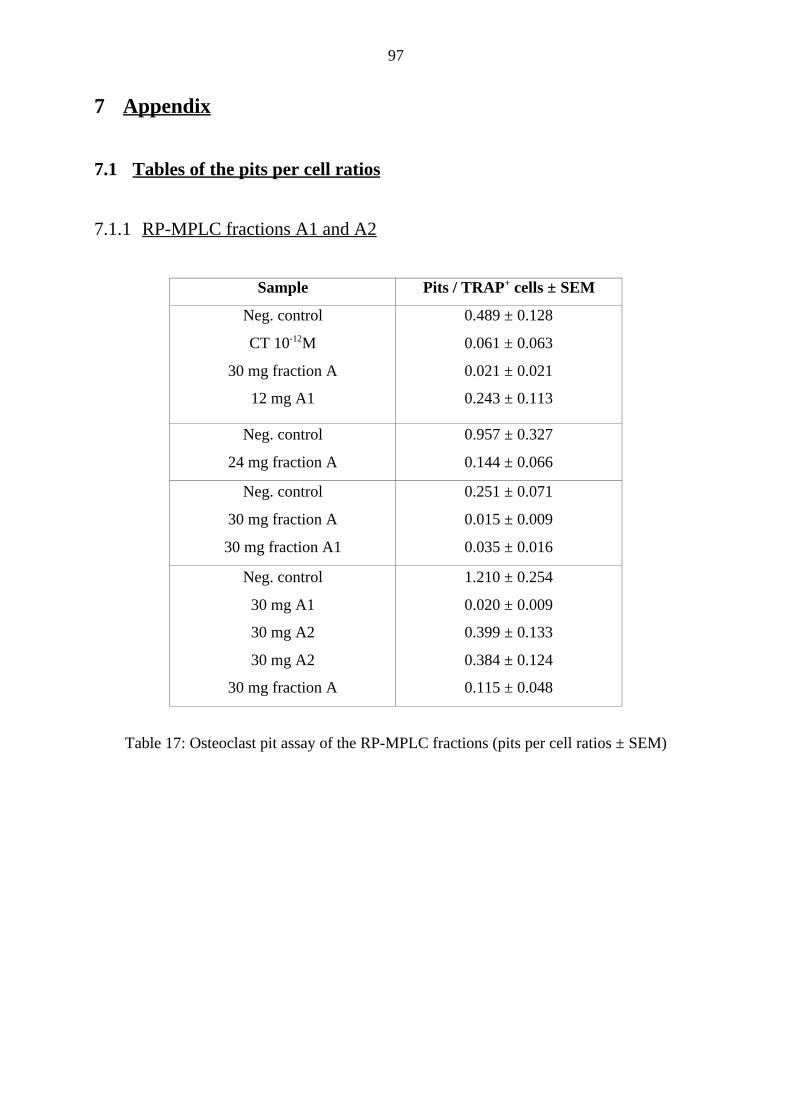
97
7 Appendix
7.1 Tables of the pits per cell ratios
7.1.1 RP-MPLC fractions A1 and A2
Sample Pits / TRAP+ cells ± SEM
Neg. control
CT 10-12M
30 mg fraction A
12 mg A1
0.489 ± 0.128
0.061 ± 0.063
0.021 ± 0.021
0.243 ± 0.113
Neg. control
24 mg fraction A
0.957 ± 0.327
0.144 ± 0.066
Neg. control
30 mg fraction A
30 mg fraction A1
0.251 ± 0.071
0.015 ± 0.009
0.035 ± 0.016
Neg. control
30 mg A1
30 mg A2
30 mg A2
30 mg fraction A
1.210 ± 0.254
0.020 ± 0.009
0.399 ± 0.133
0.384 ± 0.124
0.115 ± 0.048
Table 17: Osteoclast pit assay of the RP-MPLC fractions (pits per cell ratios ± SEM)
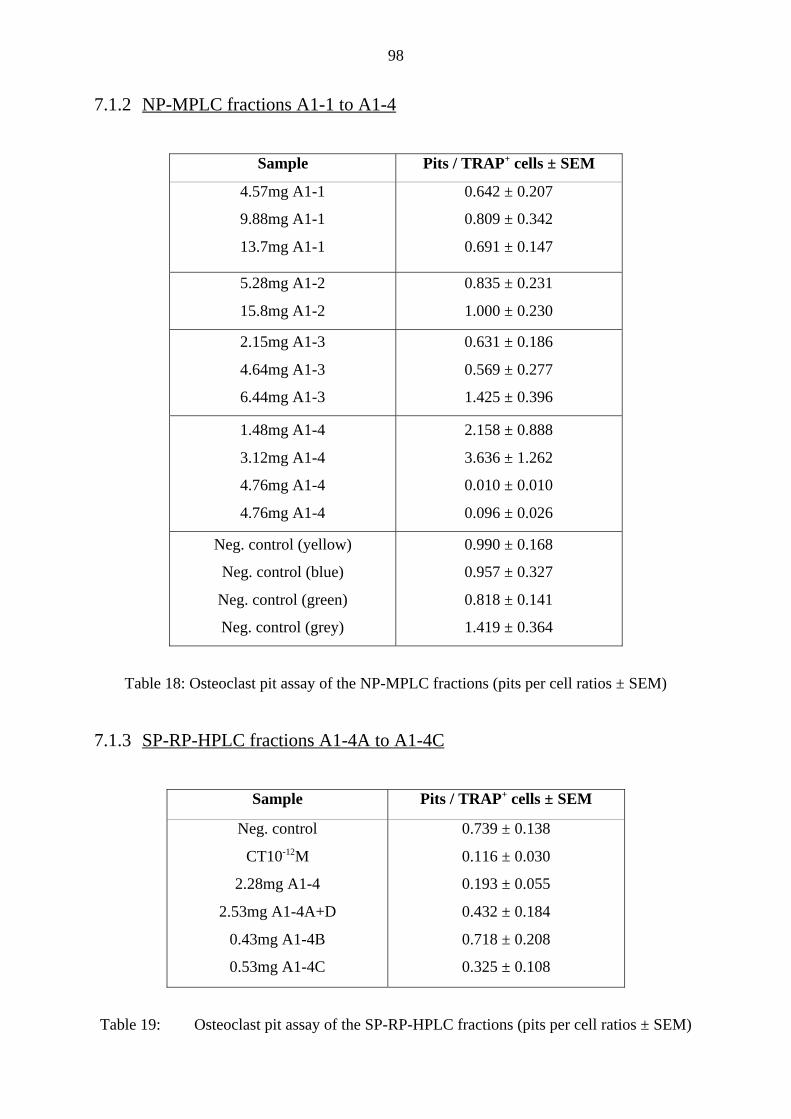
98
7.1.2 NP-MPLC fractions A1-1 to A1-4
Sample Pits / TRAP+ cells ± SEM
4.57mg A1-1
9.88mg A1-1
13.7mg A1-1
0.642 ± 0.207
0.809 ± 0.342
0.691 ± 0.147
5.28mg A1-2
15.8mg A1-2
0.835 ± 0.231
1.000 ± 0.230
2.15mg A1-3
4.64mg A1-3
6.44mg A1-3
0.631 ± 0.186
0.569 ± 0.277
1.425 ± 0.396
1.48mg A1-4
3.12mg A1-4
4.76mg A1-4
4.76mg A1-4
2.158 ± 0.888
3.636 ± 1.262
0.010 ± 0.010
0.096 ± 0.026
Neg. control (yellow)
Neg. control (blue)
Neg. control (green)
Neg. control (grey)
0.990 ± 0.168
0.957 ± 0.327
0.818 ± 0.141
1.419 ± 0.364
Table 18: Osteoclast pit assay of the NP-MPLC fractions (pits per cell ratios ± SEM)
7.1.3 SP-RP-HPLC fractions A1-4A to A1-4C
Sample Pits / TRAP+ cells ± SEM
Neg. control
CT10-12M
2.28mg A1-4
2.53mg A1-4A+D
0.43mg A1-4B
0.53mg A1-4C
0.739 ± 0.138
0.116 ± 0.030
0.193 ± 0.055
0.432 ± 0.184
0.718 ± 0.208
0.325 ± 0.108
Table 19: Osteoclast pit assay of the SP-RP-HPLC fractions (pits per cell ratios ± SEM)
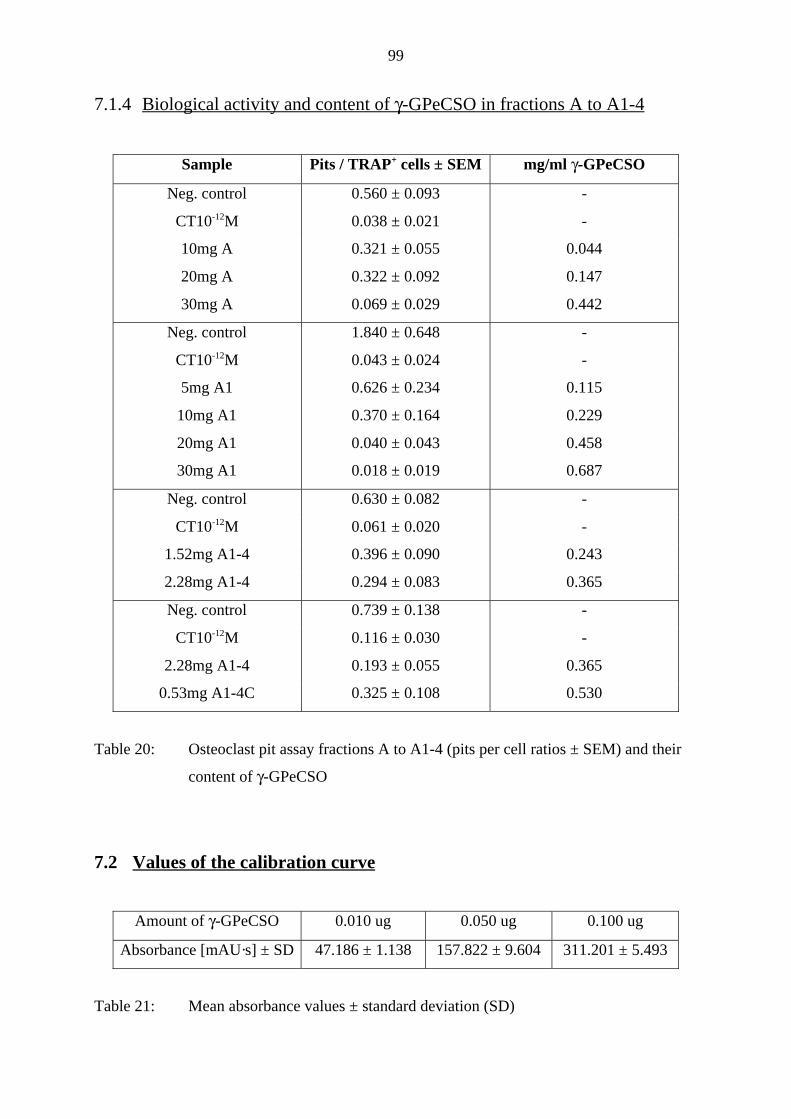
99
7.1.4 Biological activity and content of γ-GPeCSO in fractions A to A1-4
Sample Pits / TRAP+ cells ± SEM mg/ml γ-GPeCSO
Neg. control 0.560 ± 0.093 -
CT10-12M 0.038 ± 0.021 -
10mg A 0.321 ± 0.055 0.044
20mg A 0.322 ± 0.092 0.147
30mg A 0.069 ± 0.029 0.442
Neg. control 1.840 ± 0.648 -
CT10-12M 0.043 ± 0.024 -
5mg A1 0.626 ± 0.234 0.115
10mg A1 0.370 ± 0.164 0.229
20mg A1 0.040 ± 0.043 0.458
30mg A1 0.018 ± 0.019 0.687
Neg. control 0.630 ± 0.082 -
CT10-12M 0.061 ± 0.020 -
1.52mg A1-4 0.396 ± 0.090 0.243
2.28mg A1-4 0.294 ± 0.083 0.365
Neg. control 0.739 ± 0.138 -
CT10-12M 0.116 ± 0.030 -
2.28mg A1-4 0.193 ± 0.055 0.365
0.53mg A1-4C 0.325 ± 0.108 0.530
Table 20: Osteoclast pit assay fractions A to A1-4 (pits per cell ratios ± SEM) and their
content of γ-GPeCSO
7.2 Values of the calibration curve
Amount of γ-GPeCSO 0.010 ug 0.050 ug 0.100 ug
Absorbance [mAU·s] ± SD 47.186 ± 1.138 157.822 ± 9.604 311.201 ± 5.493
Table 21: Mean absorbance values ± standard deviation (SD)
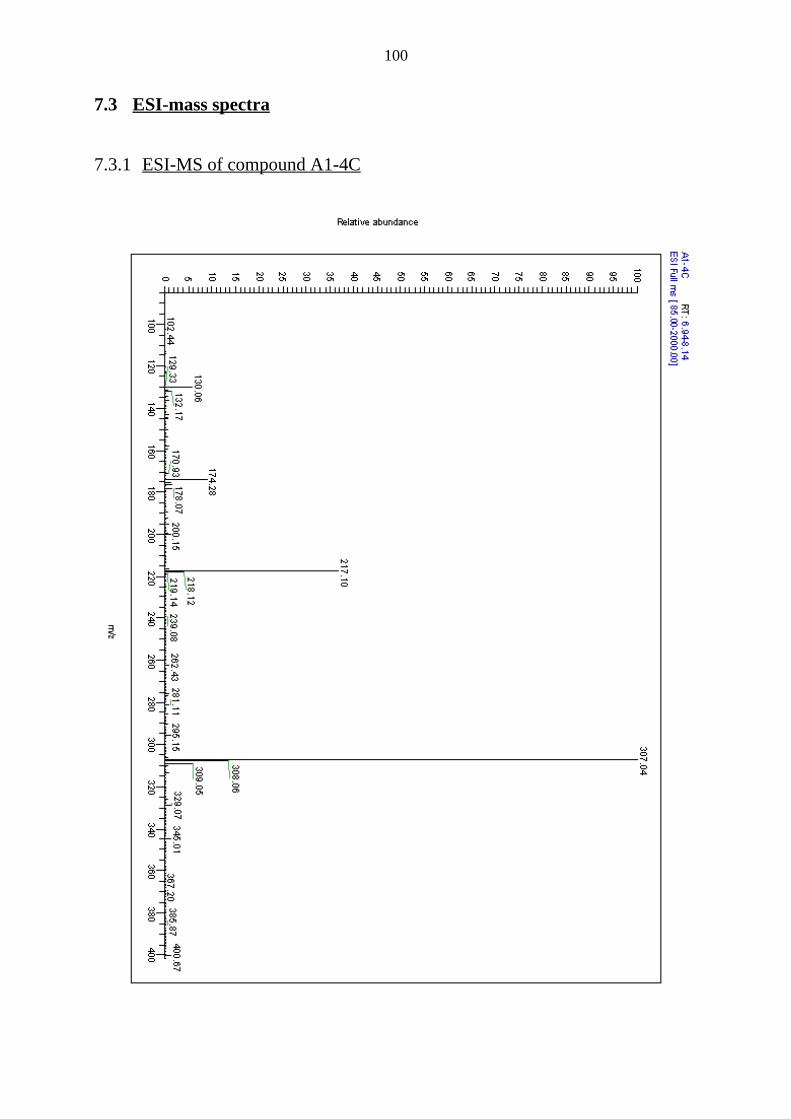
100
7.3 ESI-mass spectra
7.3.1 ESI-MS of compound A1-4C
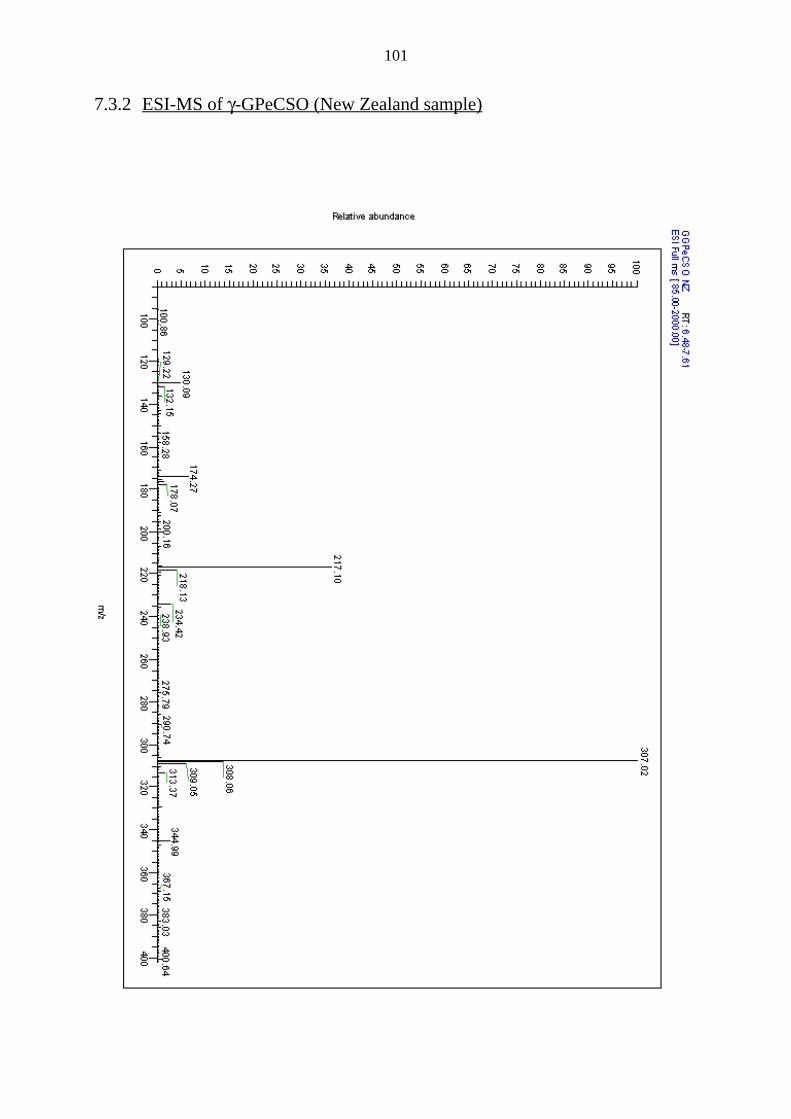
101
7.3.2 ESI-MS of γ-GPeCSO (New Zealand sample)
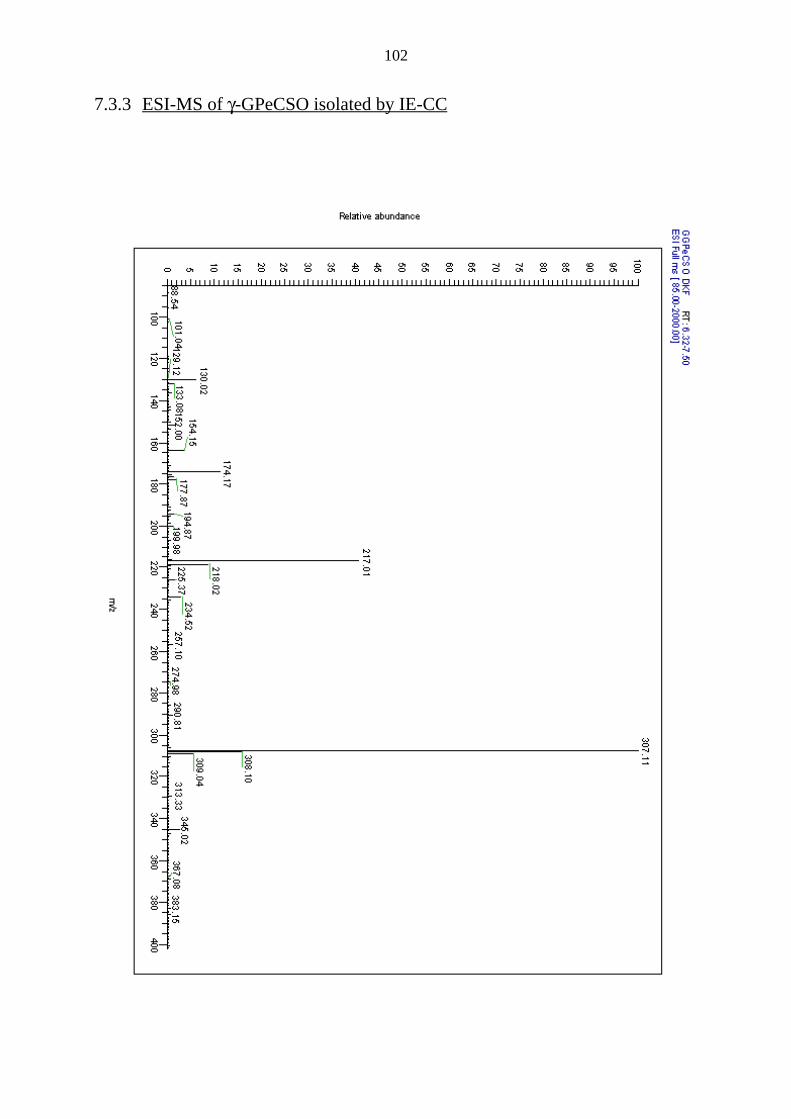
102
7.3.3 ESI-MS of γ-GPeCSO isolated by IE-CC
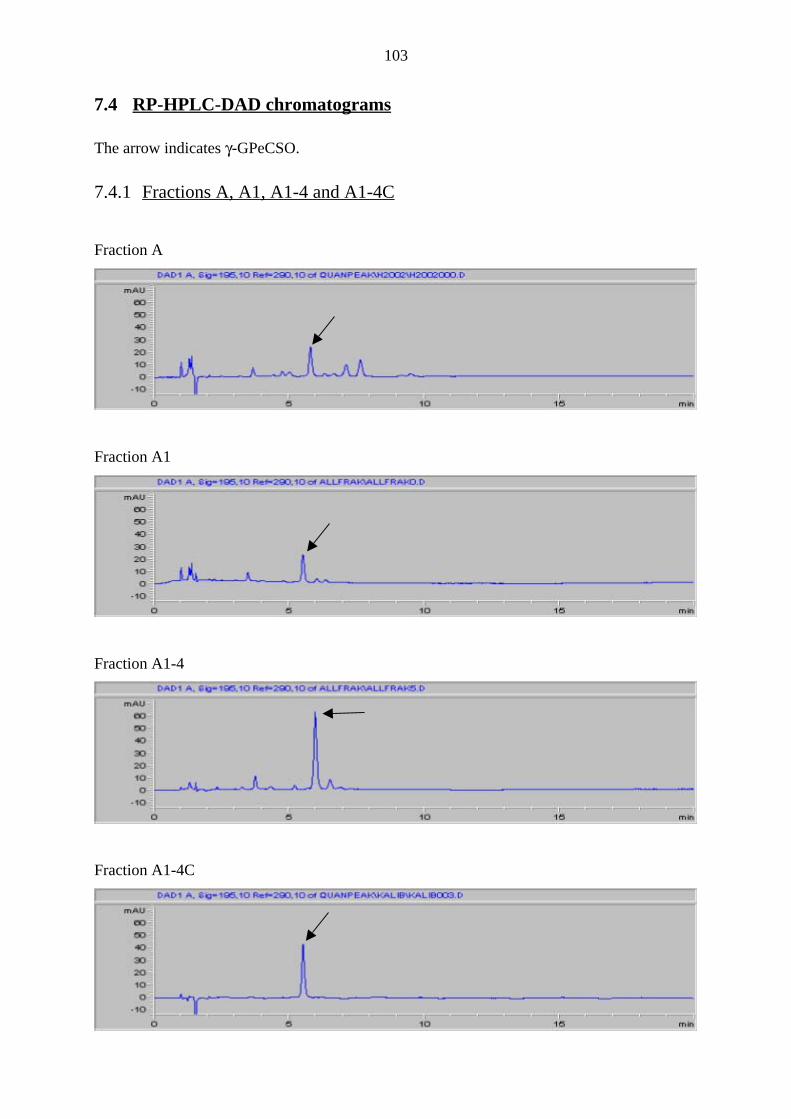
103
7.4 RP-HPLC-DAD chromatograms
The arrow indicates γ-GPeCSO.
7.4.1 Fractions A, A1, A1-4 and A1-4C
Fraction A
Fraction A1
Fraction A1-4
Fraction A1-4C
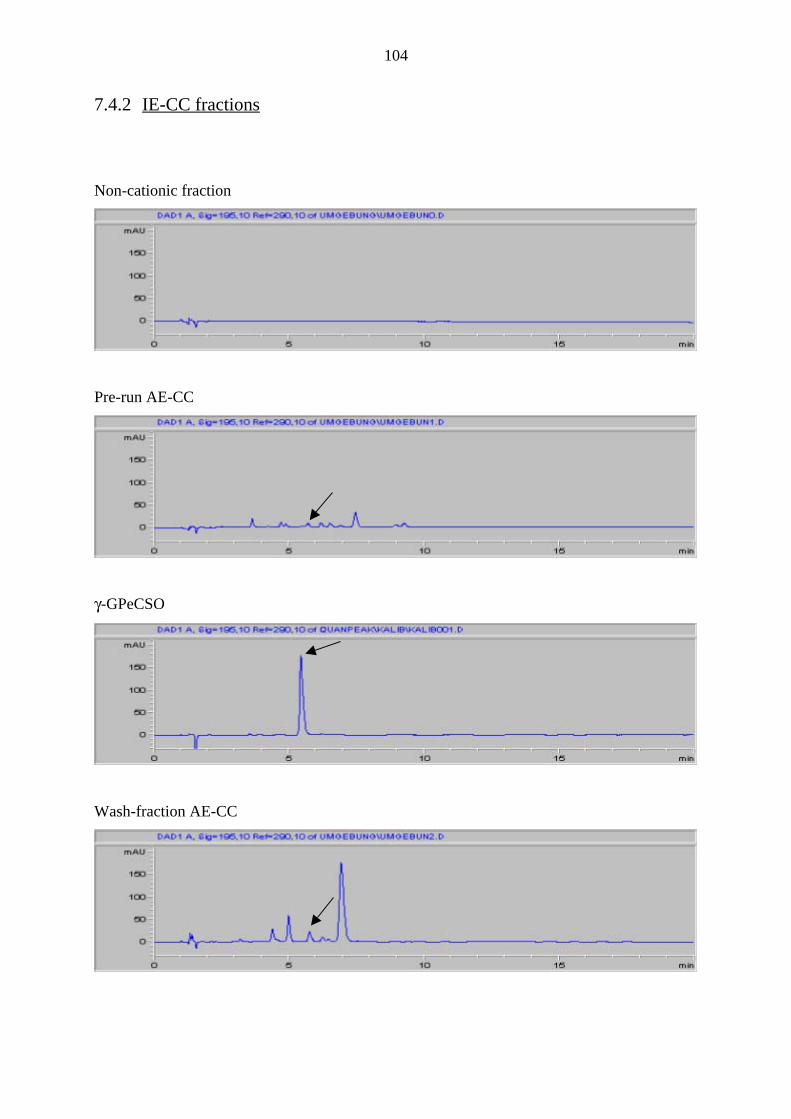
104
7.4.2 IE-CC fractions
Non-cationic fraction
Pre-run AE-CC
γ-GPeCSO
Wash-fraction AE-CC
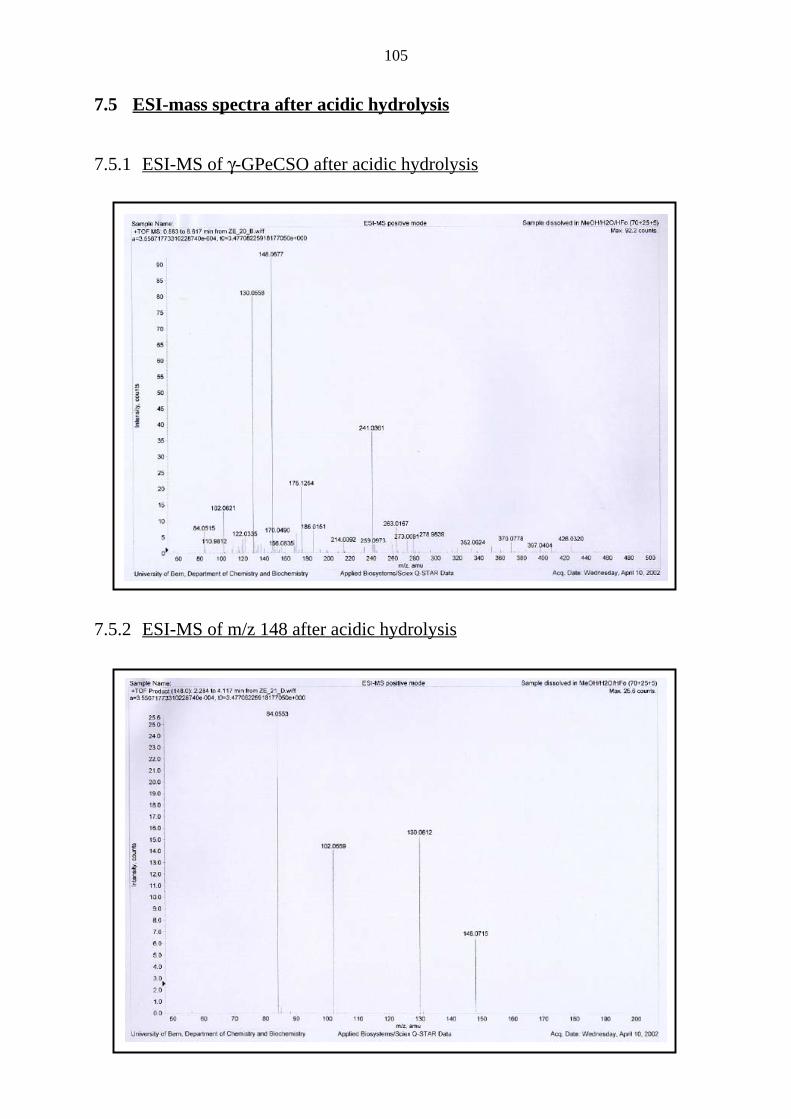
105
7.5 ESI-mass spectra after acidic hydrolysis
7.5.1 ESI-MS of γ-GPeCSO after acidic hydrolysis
7.5.2 ESI-MS of m/z 148 after acidic hydrolysis
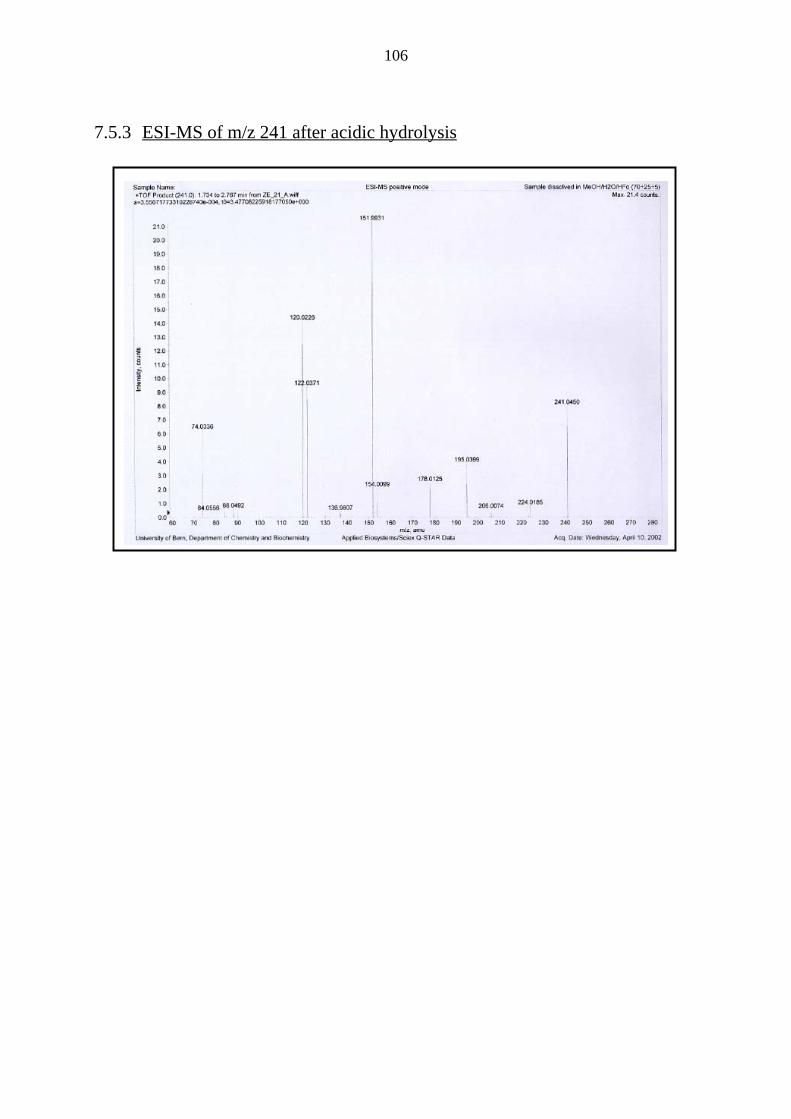
106
7.5.3 ESI-MS of m/z 241 after acidic hydrolysis
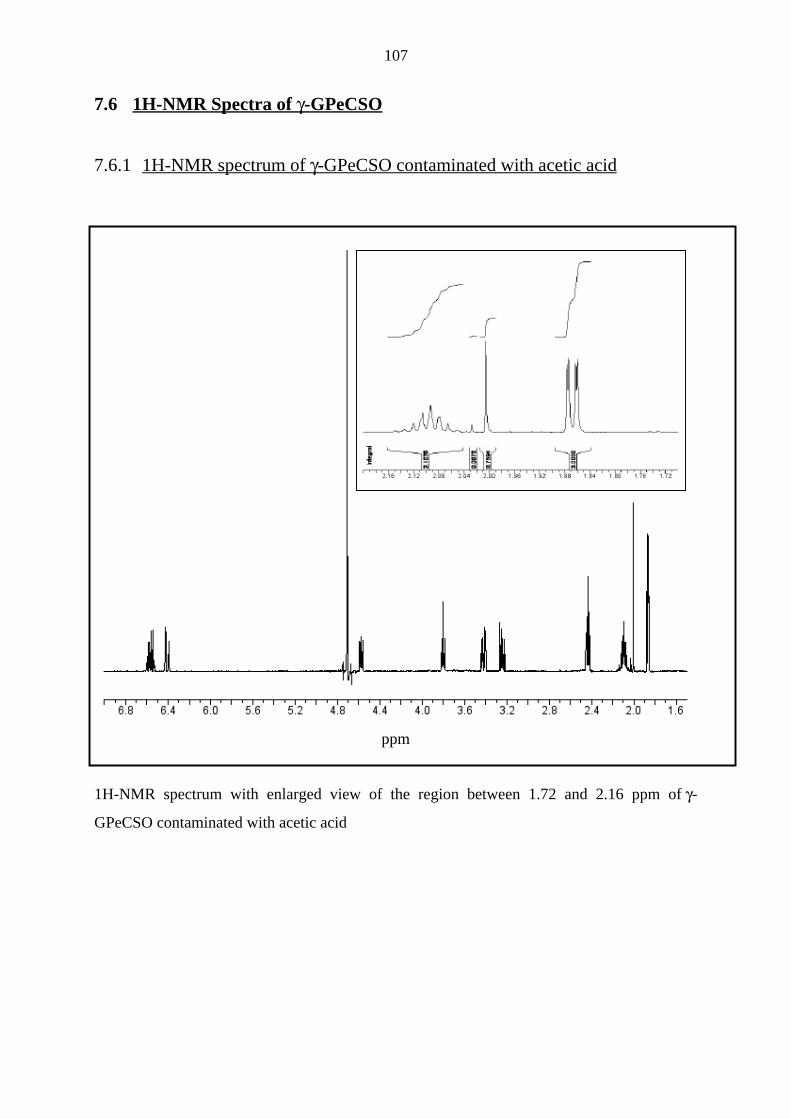
107
7.6 1H-NMR Spectra of γ-GPeCSO
7.6.1 1H-NMR spectrum of γ-GPeCSO contaminated with acetic acid
ppm
1H-NMR spectrum with enlarged view of the region between 1.72 and 2.16 ppm of γ -
GPeCSO contaminated with acetic acid
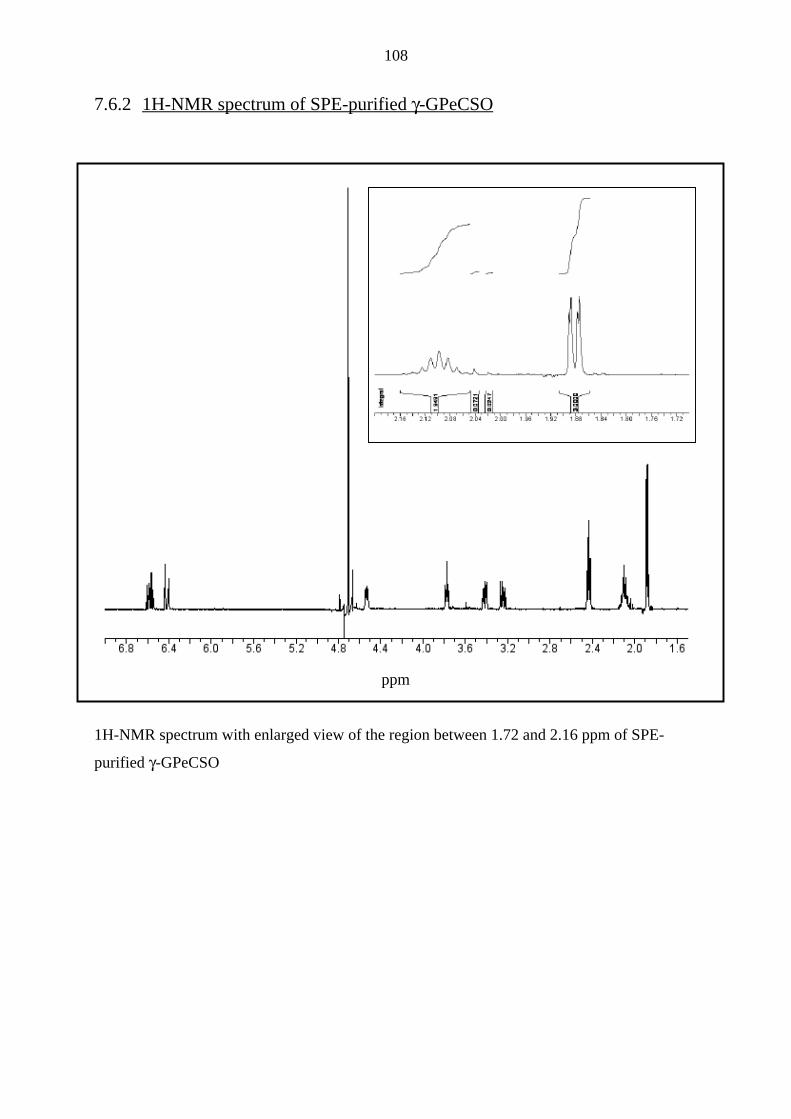
108
7.6.2 1H-NMR spectrum of SPE-purified γ-GPeCSO
ppm
1H-NMR spectrum with enlarged view of the region between 1.72 and 2.16 ppm of SPE-
purified γ-GPeCSO
109
7.7 Publications and poster presentations
7.7.1 Publication
Mühlbauer R.C.; Lozano A.; Reinli A.; Wetli H. (2003), Various selected vegetables, fruits,
mushrooms and red wine residue inhibit bone resorption in rats. J. Nutr. 133:3592-7.
7.7.2 Posters
• Wetli H.A., Brenneisen R., Staub M.M., Tschudi I. and Mühlbauer R.C., Bioassay-
guided fractionation to isolate compounds of onion affecting bone metabolism, Day of
Clinical Research 2000 of the University of Bern, November 15th, Bern, Switzerland
• Wetli H.A., Brenneisen R., Tschudi I. and Mühlbauer R.C., Bioassay-guided
fractionation to isolate compounds of onion affecting bone metabolism, Day of Clinical
Research 2002 of the University of Bern, November 13th, Bern, Switzerland
110
7.8 Curriculum vitae
Date of birth: September 27th, 1972, Dornach (SO), Switzerland
Education: Matura type B, Realgymnasium Basel, Switzerland (1984 –
1992)
Federal diploma (M.S.) in Pharmaceutical Sciences, University
of Basel, Switzerland (1993 – 1998)
Ph.D. study under the supervision of Prof. Dr. R. Brenneisen
and Dr. h.c. R. Mühlbauer, Department of Clinical Research
University of Bern, Switzerland (1999 – 2003)
Working experience: Internship at a pharmacy, Kronen Apotheke, Binningen (BL),
Switzerland (09/95 – 09/96)
Internship, Enzyme Kinetics Laboratory, Pentapharm AG,
Aesch (BL), Switzerland (07/97 – 08/97)
Production projects assistant, Liquid Production Plant, Roche
AG, Basel, Switzerland (01/99 – 09/99)
Postdoctoral fellowship, Central Technologies, Novartis AG,
Basel, Switzerland (04/03 – current)