Embed Size (px)
Citation preview

Bille, Harner, Loesel
New Frontiers in Vision and
Aberration-Free Refractive Surgery
Springer-Verlag
Berlin Heidelberg NewYorkBarcelona HongKong LondonMilan Paris Singapore Tokyo

Preface
In recent years, new surgical techniques have evolved for customized correc-tion of refractive disorders, based on groundbreaking achievements in objec-tive assessment of refractive properties of the human eye and greatly refinedexcimer laser surgical vision correction systems. This book comprises a thor-ough discussion of the underlying optical and laser-technological principlesas well as the first clinical studies for Wavefront-guided LASIK-ablations.
In the first two chapters, the development of wavefront technology andits application to ophthalmology and the assessment of the quality of thehuman eye are presented. In the following chapters 3 and 4 first clinical re-sults with WaveScanTM in American and European clinics are summarized.The basic technologies, three-dimensional eye-tracking and wavefront-drivencustom ablation procedures are covered in chapter 5 and 6. First clinical re-sults of wavefront-driven custom ablation, the so called Heidelberg Study aresummarized in chapter 7. In chapter 8 the state of the art in photorefrac-tive keratectomy and LASEK clinical results is presented. Chapter 9 containswith first surgical applications of ultra-short pulse femtosecond laser surgerya glimpse into one of the promising future technological developments in re-fractive surgery. In Appendix A several contributions of the Refractive SocietySymposium(New Orleans, November 11, 2001) are briefly summarized. Thebook is concluded with Appendix B: Refractive Outcomes With “One Step”
Wavefront-Guided LASIK with was presented the recent ASCRS-Conferencein Philadelphia(June 2002), summarizing the status of the clinical VISX US-FDA study on custom ablations.
On the front cover of the book an artist view of the custom ablationvision correction procedure is illustrated. On the back cover a painting ofthe Heidelberg Castle is presented. Most of the underlying technologies inwavefront measurements and adaptive optics were developed in the early1980s at the University of Heidelberg. In addition, the first internationalclinical study of Wavefront-guided LASIK-Ablation was performed at thesurgical eye center(“Augenpraxisklinik”) in Heidelberg.
The editors are grateful to the authors of this book who have made thismultifacetted overview on basic science and engineering as well as surgicaland clinical topics possible. It was our intend to provide the refractive sur-

VI Preface
gical community with the most recent results in Wavefront-guided LASIK-Ablations.
The editors are grateful to the editorial group at Springer, Heidelberg fortheir strong support and are especially indebted to Michael Schottner, M.S.whose considerable editorial skills and excellent computer professionalism wasinvaluable to the creation of this book, although Dr. Meng Han contributedgreatly to finalize the format of the book.
Heidelberg and Santa Clara, J.F. Bille
August 2002 C. F.H. Harner
F. Loesel

About the Editors
Josef F. Bille, PhD
Josef F. Bille, PhD received the Ph.D. degree from Karlsruhe University,Germany, in 1970. From 1970 to 1974, he was an Assistant Professor at theInstitute for Applied Physics of Karlsruhe University, Germany, and from1974 to 1978, he did research at Hoechst AG,Frankfurt, Germany. Since 1978, he has been a full professor at the Kirchhoff Institute for Physics, HeidelbergUniversity, Germany. He has been a Guest Professor at the Ecole Polytech-nique, Lausanne, Switzerland, at the Optical Sciences Center, University ofArizona, Tucson, and at the Department of Ophthalmology, University ofCalifornia, San Diego. His research interests include biomedical optics andthe development and therapeutical application of medical lasers.
Carol F.H. Harner, PhD
Carol F.H. Harner earned her B.S. and PhD-degrees in Physics at UK-and-US-Universities respectively. After an academic career as a physics professorin Biophysics, she worked in R&D-positions at various companies mainlyin the field of cornea-shield biophysiological developments. Since 1999, shethe Vice-president of Research&Development with VISX Inc. at Santa Clara,Cal.. Dr. Harner is responsible for the VISX-Custom-Ablation R&D-programand related clinical studies.
Frieder H. Loesel, PhD
Frieder H.Loesel received the Diploma in Physics and the Ph.D. in physicsfrom the University of Heidelberg in 1992 and 1995, respectively. He workedas a scientist at UC Irvine, ETH Zurich, and the University of Michigan. Cur-rently, he is serving as chief executive officer of 20/10 PERFECT VISION,Heidelberg, Germany. Dr. Loesel has published numerous papers on funda-mental aspects of laser-tissue interactions and development and applicationof medical ultrashort pulsed laser systems. Dr. Loesel is a member of severalnational and international societies for ophthalmology and physics

VIII Editors
Addresses of the editors
Prof. Dr. Josef F. Bille
Kirchhoff Institute of PhysicsUniversity of HeidelbergIm Neuenheimer Feld 22769120 HeidelbergGermany
Carol F.H. Harner, PhD
VISX,Incorporated3400 Central ExpresswaySanta Clara, CA 95051USA
Dr. Frieder Loesel
20/10 Perfect VisionOptische Gerate GmbHIm Taubenfeld 21-169123 HeidelbergGermany

Contents
1 The Development of Wavefront Technologyand Its Application to OphthalmologyJ.F. Bille . . . . . . . . . . . . . . . . . . . . . . . . . . . . . . . . . . . . . . . . . . . . . . . . . . . . . . 1
1.1 Abstract . . . . . . . . . . . . . . . . . . . . . . . . . . . . . . . . . . . . . . . . . . . . . . . . . 11.2 Introduction . . . . . . . . . . . . . . . . . . . . . . . . . . . . . . . . . . . . . . . . . . . . . . 11.3 History . . . . . . . . . . . . . . . . . . . . . . . . . . . . . . . . . . . . . . . . . . . . . . . . . . 31.4 Principle of Aberration Measurement . . . . . . . . . . . . . . . . . . . . . . . . 41.5 Definitions of Optical Imaging Quality . . . . . . . . . . . . . . . . . . . . . . . 61.6 Principle of Closed Loop Adaptive Optical Control . . . . . . . . . . . . 91.7 CLAO/BILLE-Aberrometer . . . . . . . . . . . . . . . . . . . . . . . . . . . . . . . . 141.8 Demonstration of CLAO/BILLE-Aberrometer . . . . . . . . . . . . . . . . . 191.9 Summary . . . . . . . . . . . . . . . . . . . . . . . . . . . . . . . . . . . . . . . . . . . . . . . . . 21References . . . . . . . . . . . . . . . . . . . . . . . . . . . . . . . . . . . . . . . . . . . . . . . . . . . . . 22
2 Optical Quality of the Human EyeJ.F. Bille, J. Buchler Costa, F. Muller . . . . . . . . . . . . . . . . . . . . . . . . . . . . 24
2.1 Introduction . . . . . . . . . . . . . . . . . . . . . . . . . . . . . . . . . . . . . . . . . . . . . . 242.2 The Quality of the Human Eye . . . . . . . . . . . . . . . . . . . . . . . . . . . . . . 242.3 Linear Systems . . . . . . . . . . . . . . . . . . . . . . . . . . . . . . . . . . . . . . . . . . . . 27
2.3.1 Optical Systems . . . . . . . . . . . . . . . . . . . . . . . . . . . . . . . . . . . . 282.4 Representation of Aberrations . . . . . . . . . . . . . . . . . . . . . . . . . . . . . . . 312.5 Simulations . . . . . . . . . . . . . . . . . . . . . . . . . . . . . . . . . . . . . . . . . . . . . . . 35References . . . . . . . . . . . . . . . . . . . . . . . . . . . . . . . . . . . . . . . . . . . . . . . . . . . . . 44
3 First Clinical Results with WaveScanTM
A. Gleibs . . . . . . . . . . . . . . . . . . . . . . . . . . . . . . . . . . . . . . . . . . . . . . . . . . . . . . 46
3.1 First Clinical Results with WaveScanTM . . . . . . . . . . . . . . . . . . . . . . 463.2 The Performance of a Wavefront-measurement
and the Understanding of the WavePrintTM Maps . . . . . . . . . . . . . 463.3 Application of the WaveScanTM in the Refractive Surgery . . . . . . 513.4 Results of this Study: The Reliability of the WaveScanTM
Compared to Manifest Refraction. . . . . . . . . . . . . . . . . . . . . . . . . . . . 513.5 Final Review . . . . . . . . . . . . . . . . . . . . . . . . . . . . . . . . . . . . . . . . . . . . . 53

X Contents
4 Wavefront Analysis – Clinical PrimerJ.F. Doane, S. Morris, A.D. Border, L.S. EuDaly, Ja.A. Denning . . . . . . 55
4.1 Definition of Important Terms . . . . . . . . . . . . . . . . . . . . . . . . . . . . . . 554.2 Current Ocular Refraction Evaluation Systems . . . . . . . . . . . . . . . . 58
4.2.1 Phoroptor and Autorefractors . . . . . . . . . . . . . . . . . . . . . . . . 584.2.2 Corneal Topography . . . . . . . . . . . . . . . . . . . . . . . . . . . . . . . . 584.2.3 20/10 Perfect Vision Wavefront System . . . . . . . . . . . . . . . . 584.2.4 Other Wavefront Sensing Devices . . . . . . . . . . . . . . . . . . . . . 58
4.3 How the Visx 20/10 Wavefront System Works . . . . . . . . . . . . . . . . . 604.4 How to Read a Wavefront Map . . . . . . . . . . . . . . . . . . . . . . . . . . . . . . 624.5 What are the Shortcomings of Shack-Hartmann
Wavefront Analysis? . . . . . . . . . . . . . . . . . . . . . . . . . . . . . . . . . . . . . . . 644.6 Reproducibility and Effect of Pupil Size . . . . . . . . . . . . . . . . . . . . . . 664.7 Clinical Examples . . . . . . . . . . . . . . . . . . . . . . . . . . . . . . . . . . . . . . . . . 68
4.7.1 Case 1. Keratoconus . . . . . . . . . . . . . . . . . . . . . . . . . . . . . . . . 684.7.2 Case 2. Status Post Radial Keratotomy . . . . . . . . . . . . . . . . 694.7.3 Case 3. Posterior Subcapsular Cataract
and Anterior Cortical Cataract . . . . . . . . . . . . . . . . . . . . . . . 714.7.4 Case 4. Status Post Penetrating Keratoplasty
for Keratoconus . . . . . . . . . . . . . . . . . . . . . . . . . . . . . . . . . . . . 724.7.5 Case 5. Unoperated “Normal” Eyes . . . . . . . . . . . . . . . . . . . 734.7.6 Case 6. Irregular LASIK Ablation . . . . . . . . . . . . . . . . . . . . . 754.7.7 Case 7. Status Post Hyperopic LASIK . . . . . . . . . . . . . . . . 764.7.8 Case 8. Normal Examination / No Refractive Error . . . . . 784.7.9 Case 9. Status Post Myopic LASIK . . . . . . . . . . . . . . . . . . . 794.7.10 Case 10. Normal Examination / Minimal
Refractive Error . . . . . . . . . . . . . . . . . . . . . . . . . . . . . . . . . . . . 82References . . . . . . . . . . . . . . . . . . . . . . . . . . . . . . . . . . . . . . . . . . . . . . . . . . . . . 84
5 The VISX STAR S3TM ActiveTrakTM Eye TrackerJ. Shimmick, K. Yee, B. Cutrer . . . . . . . . . . . . . . . . . . . . . . . . . . . . . . . . . . . 85
5.1 Introduction . . . . . . . . . . . . . . . . . . . . . . . . . . . . . . . . . . . . . . . . . . . . . . 855.2 Design Requirements . . . . . . . . . . . . . . . . . . . . . . . . . . . . . . . . . . . . . . 87
5.2.1 Measured Eye Motion is of Sufficient Amplitudeto Warrant an Eye Tracker . . . . . . . . . . . . . . . . . . . . . . . . . . . 88
5.2.2 The Eye Tracking System Maintains the Safety of theProcedure . . . . . . . . . . . . . . . . . . . . . . . . . . . . . . . . . . . . . . . . . 91
5.2.3 The ActiveTrakTM SystemAccurately Tracks Eye Movement . . . . . . . . . . . . . . . . . . . . . 92
5.2.4 The VISX STAR S3TM Laser SystemAppropriately Responds to Eye Motion . . . . . . . . . . . . . . . . 95
5.2.5 Ablations Made While Using the ActiveTrakTM EyeTracker Closely Match the Theoretical Profiles . . . . . . . . . 97
5.3 Conclusion . . . . . . . . . . . . . . . . . . . . . . . . . . . . . . . . . . . . . . . . . . . . . . . 98

Contents XI
References . . . . . . . . . . . . . . . . . . . . . . . . . . . . . . . . . . . . . . . . . . . . . . . . . . . . . 99
6 Method for Wavefront Driven Custom AblationsJ. Watson, J. Shimmick, B. Cutrer, E. Gross, J. Wong, L. Bechtel,C.F.H. Harner . . . . . . . . . . . . . . . . . . . . . . . . . . . . . . . . . . . . . . . . . . . . . . . . . . 100
6.1 Introduction . . . . . . . . . . . . . . . . . . . . . . . . . . . . . . . . . . . . . . . . . . . . . . 1006.2 Variable Spot Scanning . . . . . . . . . . . . . . . . . . . . . . . . . . . . . . . . . . . . 1016.3 Discussion of the Computation Problem . . . . . . . . . . . . . . . . . . . . . . 101
6.3.1 Algorithm Input . . . . . . . . . . . . . . . . . . . . . . . . . . . . . . . . . . . . 1016.3.2 Algorithm Output . . . . . . . . . . . . . . . . . . . . . . . . . . . . . . . . . . 102
6.4 VSSTM for Pure Refractive Targets . . . . . . . . . . . . . . . . . . . . . . . . . . 1026.5 VSS for Arbitrary Shapes . . . . . . . . . . . . . . . . . . . . . . . . . . . . . . . . . . 1046.6 Wavefront Corrections . . . . . . . . . . . . . . . . . . . . . . . . . . . . . . . . . . . . . 106
6.6.1 VISX WaveScan Wavefront Sensor . . . . . . . . . . . . . . . . . . . . 1076.7 Creating Corrective Ablation Targets . . . . . . . . . . . . . . . . . . . . . . . . 1096.8 PreVueTM Lenses . . . . . . . . . . . . . . . . . . . . . . . . . . . . . . . . . . . . . . . . . . 1116.9 Conclusion . . . . . . . . . . . . . . . . . . . . . . . . . . . . . . . . . . . . . . . . . . . . . . . 1146.10 Addendum: Search Algorithms . . . . . . . . . . . . . . . . . . . . . . . . . . . . . . 114References . . . . . . . . . . . . . . . . . . . . . . . . . . . . . . . . . . . . . . . . . . . . . . . . . . . . . 116
7 Wavefront Driven Custom Ablation: First Clinical ResultsR. Volz, U. von Pape . . . . . . . . . . . . . . . . . . . . . . . . . . . . . . . . . . . . . . . . . . . . 117
7.1 Introduction . . . . . . . . . . . . . . . . . . . . . . . . . . . . . . . . . . . . . . . . . . . . . . 1177.2 History . . . . . . . . . . . . . . . . . . . . . . . . . . . . . . . . . . . . . . . . . . . . . . . . . . 1177.3 Methods . . . . . . . . . . . . . . . . . . . . . . . . . . . . . . . . . . . . . . . . . . . . . . . . . 118
7.3.1 Wavefronts . . . . . . . . . . . . . . . . . . . . . . . . . . . . . . . . . . . . . . . . . 1187.3.2 Single Pass Wavefront Measurement . . . . . . . . . . . . . . . . . . . 1197.3.3 Principle of the Shack-Hartmann Sensor (SHS) . . . . . . . . . 1207.3.4 Techniques . . . . . . . . . . . . . . . . . . . . . . . . . . . . . . . . . . . . . . . . . 1217.3.5 Presentation of WaveScanTM Results . . . . . . . . . . . . . . . . . . 1247.3.6 What Can a Wavefront Map Tell Us . . . . . . . . . . . . . . . . . . 1247.3.7 What is the RMS/OAI? . . . . . . . . . . . . . . . . . . . . . . . . . . . . . 1257.3.8 Treatment Tables . . . . . . . . . . . . . . . . . . . . . . . . . . . . . . . . . . . 127
7.4 The Study . . . . . . . . . . . . . . . . . . . . . . . . . . . . . . . . . . . . . . . . . . . . . . . . 1297.4.1 Scope of Study . . . . . . . . . . . . . . . . . . . . . . . . . . . . . . . . . . . . . 1297.4.2 Study Group . . . . . . . . . . . . . . . . . . . . . . . . . . . . . . . . . . . . . . . 1297.4.3 Subject Eligibility . . . . . . . . . . . . . . . . . . . . . . . . . . . . . . . . . . 130
7.5 Results . . . . . . . . . . . . . . . . . . . . . . . . . . . . . . . . . . . . . . . . . . . . . . . . . . . 1317.5.1 Uncorrected Visual Acuity . . . . . . . . . . . . . . . . . . . . . . . . . . . 1317.5.2 Best Corrected Visual Acuity . . . . . . . . . . . . . . . . . . . . . . . . 1317.5.3 Refractive Error . . . . . . . . . . . . . . . . . . . . . . . . . . . . . . . . . . . . 1317.5.4 Higher Order Aberrations . . . . . . . . . . . . . . . . . . . . . . . . . . . . 132
7.6 Conclusion . . . . . . . . . . . . . . . . . . . . . . . . . . . . . . . . . . . . . . . . . . . . . . . 133References . . . . . . . . . . . . . . . . . . . . . . . . . . . . . . . . . . . . . . . . . . . . . . . . . . . . . 134

XII Contents
8 Photorefractive KeratectomyW.B. Jackson . . . . . . . . . . . . . . . . . . . . . . . . . . . . . . . . . . . . . . . . . . . . . . . . . . 136
8.1 Introduction . . . . . . . . . . . . . . . . . . . . . . . . . . . . . . . . . . . . . . . . . . . . . . 1368.2 Indications for PRK . . . . . . . . . . . . . . . . . . . . . . . . . . . . . . . . . . . . . . . 1368.3 Pre-operative Management . . . . . . . . . . . . . . . . . . . . . . . . . . . . . . . . . 1378.4 Surgical Technique . . . . . . . . . . . . . . . . . . . . . . . . . . . . . . . . . . . . . . . . 1388.5 Pre-operative Medications . . . . . . . . . . . . . . . . . . . . . . . . . . . . . . . . . . 1388.6 Epithelial Removal . . . . . . . . . . . . . . . . . . . . . . . . . . . . . . . . . . . . . . . . 138
8.6.1 Mechanical . . . . . . . . . . . . . . . . . . . . . . . . . . . . . . . . . . . . . . . . 1398.6.2 Chemical . . . . . . . . . . . . . . . . . . . . . . . . . . . . . . . . . . . . . . . . . . 1398.6.3 LASEK . . . . . . . . . . . . . . . . . . . . . . . . . . . . . . . . . . . . . . . . . . . 1398.6.4 Laser . . . . . . . . . . . . . . . . . . . . . . . . . . . . . . . . . . . . . . . . . . . . . . 1408.6.5 Transepithelial . . . . . . . . . . . . . . . . . . . . . . . . . . . . . . . . . . . . . 1408.6.6 Stromal Treatment . . . . . . . . . . . . . . . . . . . . . . . . . . . . . . . . . . 140
8.7 Nomogram and Laser Algorithm . . . . . . . . . . . . . . . . . . . . . . . . . . . . 1418.7.1 Centration . . . . . . . . . . . . . . . . . . . . . . . . . . . . . . . . . . . . . . . . . 1418.7.2 Stromal Cooling . . . . . . . . . . . . . . . . . . . . . . . . . . . . . . . . . . . . 141
8.8 Postoperative Management . . . . . . . . . . . . . . . . . . . . . . . . . . . . . . . . . 1428.8.1 Medications . . . . . . . . . . . . . . . . . . . . . . . . . . . . . . . . . . . . . . . . 1428.8.2 Epithelial Healing . . . . . . . . . . . . . . . . . . . . . . . . . . . . . . . . . . . 142
8.9 Complications . . . . . . . . . . . . . . . . . . . . . . . . . . . . . . . . . . . . . . . . . . . . 1438.9.1 Haloes and Glare . . . . . . . . . . . . . . . . . . . . . . . . . . . . . . . . . . . 1438.9.2 Loss of Visual Performance . . . . . . . . . . . . . . . . . . . . . . . . . . 143
8.10 Late Complications . . . . . . . . . . . . . . . . . . . . . . . . . . . . . . . . . . . . . . . . 1438.10.1 Undercorrection . . . . . . . . . . . . . . . . . . . . . . . . . . . . . . . . . . . . 1438.10.2 Overcorrection . . . . . . . . . . . . . . . . . . . . . . . . . . . . . . . . . . . . . 1448.10.3 Haze and Regression . . . . . . . . . . . . . . . . . . . . . . . . . . . . . . . . 1448.10.4 Treatment of Haze and Regression . . . . . . . . . . . . . . . . . . . . 1458.10.5 Decentration . . . . . . . . . . . . . . . . . . . . . . . . . . . . . . . . . . . . . . . 1468.10.6 Irregular Astigmatism . . . . . . . . . . . . . . . . . . . . . . . . . . . . . . . 146
8.11 Results . . . . . . . . . . . . . . . . . . . . . . . . . . . . . . . . . . . . . . . . . . . . . . . . . . . 1478.11.1 Myopic PRK . . . . . . . . . . . . . . . . . . . . . . . . . . . . . . . . . . . . . . . 1478.11.2 Hyperopic PRK . . . . . . . . . . . . . . . . . . . . . . . . . . . . . . . . . . . . 147
8.12 Summary . . . . . . . . . . . . . . . . . . . . . . . . . . . . . . . . . . . . . . . . . . . . . . . . . 148
9 Refractive Surgical Applications of Ultrashort Pulse LasersF.H. Loesel, L. Zickler, R. Kessler . . . . . . . . . . . . . . . . . . . . . . . . . . . . . . . . . 151
9.1 Introduction . . . . . . . . . . . . . . . . . . . . . . . . . . . . . . . . . . . . . . . . . . . . . . 1519.2 Laser-Tissue Interaction . . . . . . . . . . . . . . . . . . . . . . . . . . . . . . . . . . . . 1539.3 All-Solid-State Femtosecond Laser Technology . . . . . . . . . . . . . . . . 1559.4 Instrumentation . . . . . . . . . . . . . . . . . . . . . . . . . . . . . . . . . . . . . . . . . . . 158
9.4.1 Femtosecond Laser Application System for Clinical Use . . 1589.4.2 Ophthalmic Femtosecond Laser Procedures . . . . . . . . . . . . 159
9.5 Experimental Results . . . . . . . . . . . . . . . . . . . . . . . . . . . . . . . . . . . . . . 162

Contents XIII
9.6 Conclusion and Outlook . . . . . . . . . . . . . . . . . . . . . . . . . . . . . . . . . . . . 165References . . . . . . . . . . . . . . . . . . . . . . . . . . . . . . . . . . . . . . . . . . . . . . . . . . . . . 166
A Refractive Society Symposium . . . . . . . . . . . . . . . . . . . . . . . . . . . . . 171A.1 Comparing WavescanTM and Manifest Refractions
D.D. Koch . . . . . . . . . . . . . . . . . . . . . . . . . . . . . . . . . . . . . . . . . . . . . . . . 173A.2 Patient Selection for LVC Using Wavefront Technology
J.F. Doane . . . . . . . . . . . . . . . . . . . . . . . . . . . . . . . . . . . . . . . . . . . . . . . 175A.3 Multi-center Wavefront Ablations
Te.P. O’Brien . . . . . . . . . . . . . . . . . . . . . . . . . . . . . . . . . . . . . . . . . . . . . 177A.4 Six-month U.S. Refractive Wavefront Ablation Results
C. Kraff . . . . . . . . . . . . . . . . . . . . . . . . . . . . . . . . . . . . . . . . . . . . . . . . . . 179A.5 Preliminary Therapeutic Wavefront Ablation Results
R.K. Maloney . . . . . . . . . . . . . . . . . . . . . . . . . . . . . . . . . . . . . . . . . . . . . 181A.6 Presbyobic LASIK Techniques
G.E. Tamayo . . . . . . . . . . . . . . . . . . . . . . . . . . . . . . . . . . . . . . . . . . . . . 183A.7 Diagnostic Wavefront Compensation with Adaptive Optics
F.H. Loesel . . . . . . . . . . . . . . . . . . . . . . . . . . . . . . . . . . . . . . . . . . . . . . . 185
B Refractive Outcomes With“One-Step”-Wavefront-Guided LASIKD.D. Koch, L. Wang, Multicenter VISX Study Group . . . . . . . . . . . . . . . . 187
B.1 Introduction . . . . . . . . . . . . . . . . . . . . . . . . . . . . . . . . . . . . . . . . . . . . . . 187B.2 Patients and Methods . . . . . . . . . . . . . . . . . . . . . . . . . . . . . . . . . . . . . . 187
B.2.1 Patient Selection . . . . . . . . . . . . . . . . . . . . . . . . . . . . . . . . . . . 187B.2.2 WaveScanTM Treatment Design . . . . . . . . . . . . . . . . . . . . . . 187B.2.3 WavePrintTM Treatment Methods . . . . . . . . . . . . . . . . . . . . 188B.2.4 Main Outcome Measures . . . . . . . . . . . . . . . . . . . . . . . . . . . . 188
B.3 Results . . . . . . . . . . . . . . . . . . . . . . . . . . . . . . . . . . . . . . . . . . . . . . . . . . . 188B.3.1 Cohort Description. . . . . . . . . . . . . . . . . . . . . . . . . . . . . . . . . . 188B.3.2 UCVA. . . . . . . . . . . . . . . . . . . . . . . . . . . . . . . . . . . . . . . . . . . . . 188B.3.3 Change in BSCVA . . . . . . . . . . . . . . . . . . . . . . . . . . . . . . . . . . 189B.3.4 Predictability . . . . . . . . . . . . . . . . . . . . . . . . . . . . . . . . . . . . . . 189B.3.5 Stability . . . . . . . . . . . . . . . . . . . . . . . . . . . . . . . . . . . . . . . . . . . 189B.3.6 Higher-Order Aberration Changes . . . . . . . . . . . . . . . . . . . . 190B.3.7 Complications and Adverse Events . . . . . . . . . . . . . . . . . . . . 190
B.4 Conclusion . . . . . . . . . . . . . . . . . . . . . . . . . . . . . . . . . . . . . . . . . . . . . . . 191
Index . . . . . . . . . . . . . . . . . . . . . . . . . . . . . . . . . . . . . . . . . . . . . . . . . . . . . . . . . 193


List of Contributors
Josef BilleKirchhoff Institute of PhysicsUniversity of HeidelbergIm Neuenheimer Feld 22769120 HeidelbergGermany
Lorne BechtelVISX,Incorporated 3400Central ExpresswaySanta Clara, CA 95051USA
Joana BuchlerKirchhoff Institute of PhysicsUniversity of HeidelbergIm Neuenheimer Feld 22769120 HeidelbergGermany
Beth CurtrerVISX,Incorporated3400 Central ExpresswaySanta Clara, CA 95051USA
John DoaneDiscover Vision Center4741 South Cochise DriveKansas City, Missouri 64055U.S.A
Axel GleibsAugenpraxisklinik HeidelbergBergheimerstrasse 10-12
D-69115 HeidelbergGermany
Erik GrossVISX,Incorporated3400 Central ExpresswaySanta Clara, CA 95051USA
Carol F.H. HarnerVISX,Incorporated3400 Central ExpresswaySanta Clara, CA 95051USA
W. Bruce JacksonUniversity of Ottawa Eye Institute501 Smyth Road OttawaOntario, Canada K1H 8L6
Ralf Kesseler20/10 Perfect VisionOptische Gerate GmbHIm Taubenfeld 21-169123 HeidelbergGermany
Douglas D. KochCullen Eye InstituteBaylor College of Medicine6565 Fannin, NC-205Houston, TX 77030USA

XVI List of Contributors
Colman KraffKraff Eye Institute25 East Washington, Suite 606Chicago, IL 60602USA
Frieder Loesel20/10 Perfect VisionOptische Gerate GmbHIm Taubenfeld 21-169123 HeidelbergGermany
Robert K. MaloneyMaloney-Seibel Vision Institute10921 Wilshire Blvd., Ste. 900Los Angeles, CA 90024USA
Frank MullerKirchhoff Institute of PhysicsUniversity of HeidelbergIm Neuenheimer Feld 22769120 HeidelbergGermany
Terrence O’BrienWilmer Ophthalmological InstituteWoods 225The Johns Hopkins Hospital601 N. BroadwayBaltimore, MD 21287-9121USA
Ulrich von Pape20/10 Perfect VisionOptische Gerate GmbHIm Taubenfeld 21-169123 HeidelbergGermany
John ShimmickVISX,Incorporated3400 Central ExpresswaySanta Clara, CA 95051USA
Gustavo Tamayo Bogota LaserRefractive InstituteCalle 114#9-45Torre Bonite 718Bogota, Columbia
Rainer VolzAugenpraxisklinik HeidelbergBergheimerstrasse 10-12D-69115 HeidelbergGermany
Jason WatsonVISX,Incorporated3400 Central ExpresswaySanta Clara, CA 95051USA
Jonathan WongVISX,Incorporated3400 Central ExpresswaySanta Clara, CA 95051USA
Kingman YeeVISX,Incorporated3400 Central ExpresswaySanta Clara, CA 95051USA
Leander ZicklerKirchhoff Institute of PhysicsUniversity of HeidelbergIm Neuenheimer Feld 22769120 HeidelbergGermany

1 The Development of Wavefront Technologyand Its Application to Ophthalmology
J.F. Bille
1.1 Abstract
Wavefront-technology was originally developed for the improvement of starimages in optical astronomy. In 1978, this technology was for the first timeapplied to ophthalmology. At the University of Heidelberg, Germany, a closedloop adaptive-optical system was designed to compensate for optical aberra-tions of the human eye. In the meantime, superresolution in retinal imaginghas been achieved, providing detailed information on photoreceptors, smallblood vessels and nerve fibre structure in the human eye in vivo. Recently,new wavefront technology has been developed for the assessment of the hu-man eye and it is now possible to apply a custom treatment to the eye, usingthe excimer laser. An adaptive optical closed loop system has been devisedfor preoperative simulation of refractive outcomes of aberration-free refractivesurgical procedures. Treatment of a patient’s entire wavefront error has beendemonstrated to improve the patient’s visual acuity beyond best-spectaclecorrected vision.
1.2 Introduction
Wavefront technology was originally developed nearly fifty years ago for as-tronomical applications. It was used to measure wavefront distortions thatoccurred when light travelling through the atmosphere entered an optical tele-scope. By applying adaptive optical closed loop controls the speckle patternsof the star images could be improved towards diffraction-limited performance.Most of the technology was developed in association with research towardsanti-missile-defence systems in the late nineteen-hundredseventies.
Historically, refractive errors of the human eye were corrected by glassesor contact lenses or more recently eximer-laser-surgery: but such correctionswere limited to the compensation of myopia, hyperopia, or regular astigma-tism. Indeed the optical system of the human eye as a genuine optical systemgenerates more complex distortions to the retinal images, the so-called higherorder aberrations. These aberrations are unique for the very particular eyeof the patient. Under daylight vision conditions the pupil of the human eyeis small, e.g. 2-3mm diameter. so that the light travels essentially along the

2 J.F. Bille
optical axis of the human eye (Fig. 1.1). Under these conditions higher orderaberrations are limited so that a sharp retinal image is formed. Under twilightvision conditions the pupil of the human eye dilates to approx. 5-7mm diam-eter resulting in increased importance of higher order aberrations. (Fig. 1.2).These higher order aberrations result in considerable distortions to the reti-nal image as a considerable part of the light is transmitted through marginalareas of the human eye, away from the optical axis. These image distortionsimpair the visual acuity even in patients with normal vision (20/20 visualacuity) considerably.
Fig. 1.1. Daylight Vision
Fig. 1.2. Twilight Vision
These complex distortions can now be assessed with the newly developedwavefront technology (Fig. 1.3). The image quality in front of the human eyeis described by the green regular mesh of lines, the reduced image quality af-

1 Wavefront Technology and its Application to Ophthalmology 3
Fig. 1.3. Description of optical imaging system
ter transmission through the optical system of the human eye is exemplifiedby the distorted red mesh of lines. In recent years different wavefront sensorsbased on a number of principles have been developed, the most importantones being Tscherning-Ray-Tracing and Shack-Hartmann-Sensors. Recentlythe application of wavefront sensing for pre-operative evaluation of refractivesurgical procedures has been proposed. Adaptive optical closed loop systemscan be used to subjectively measure and compensate the higher order op-tical aberrations of the human eye to guide the surgeon in selection of theparameters of the procedure.
1.3 History
Starting in 1978, the principle of wavefront measurement and compensationwas adapted at the University of Heidelberg for ophthalmic applications. Thetechnique is based an Shack-Hartmann-Sensing, measuring the optical pathof light rays through the eye to detect all aberrations at all point in theoptical system of the human eye. Adaptive optical systems were developedwhich measure and compensate wave aberrations of the human eye withclosed loop control [1,2].
As early as 1982 [1] at the 6th Int. Conference on Pattern Recognition inMunich, Germany wavefront sensing and adaptive optical closed loop controlwas proposed for aberration free imaging and vision testing: “The systemessentially provides an elimination of optical eye aberrations which diminishthe fundus image quality. On the other hand by active focus control and/orwavefront sensing the aberrations of the human eye like astigmatism of thecornea and spherical aberration of the lens can be measured.”(Last paragraphin [1]). In another publication [2] the concept of achieving 20/10 visual acuityby adaptive optical visual stimulus generation was described: “In the appa-ratus of this invention the illuminating laser beam is generally widened to a

4 J.F. Bille
diameter of between 3mm and 4mm, in exceptional cases even still wider,and by compensation for all existing aberrations it is possible to focus thelaser beam on a spot of a minimal diameter between 2 and 3 micrometers onthe retina. This permits the resolution of more than 5000 image points perscan line, that is, it is possible for example to resolve and represent individualreceptors in the fovea. Since the use of optical image focussing under adap-tive control produces data on the wavefront of the imaging laser beam, theapparatus of this invention enables the refractive index profile within the eyeto be reconstructed, permitting for the first time an automatic determinationof the refraction at high accuracy.”(column 4 lines 1-16 from [2]).
At the same time an adaptive optical control system was devised and builtwhich was based on modal actuator control (Fig. 1.4). In a modal phase com-pensation, the wavefront aberration is expanded into orthonormal expansionsystem which was based on Zernicke Polynomials. In addition, the originalconcept included a Karhunen-Loeve-wave expansion, in order to account forpartial wavefront distortions with high spatial frequency content [3].
Fig. 1.4. Closed Loop adaptive-optical system with modal actuator (from [3]) con-trol
1.4 Principle of Aberration Measurement
In recent years, basically 3 types of aberration measurement devices have beendeveloped: The thinbeam-Raytracing-Aberrometer, the Tscherning-Aberro-meter, and the Shack-Hartmann-Method. In Fig. 1.5, the principle of opera-tion of the Shack-Hartmann-Wavefront-Sensor is demonstrated. On the left

1 Wavefront Technology and its Application to Ophthalmology 5
Fig. 1.5. (Left): Incident plane wave resulting in a square grid of spots. (Right):Distorted wavefront causes lateral displacement of spots
hand side the processing of an ideal plane wave is depicted. The incident planewave results in a square grid of spots in the focal plane of the micro lens array.On the right hand side, the imaging of a distorted wave is shown. The dis-torted wavefront causes lateral displacements of the spots on the CCD-array.From the spot pattern the shape of the incident wavefront can be recon-structed based on appropriate curve fitting algorithms. More than ten yearsago the first detailed study of the application of wavefront technology forthe assessment of the refractive properties of the human eye was performed.From the wavefront measurements Zernicke Coefficients were calculated andthe wavefronts emerging from the eyes tested were reconstructed. Fig. 1.6shows the equal level contour maps of a human eye [4–6]. On the left handside of Fig. 1.6 the overall wavefront is presented, whereas in the right handside only the higher orders, i.e. the 3rd- and 4th-order Zernicke Coefficientsare depicted. In this work, the phase error that can not be corrected by con-ventional spectacles was specified as the high order aberrations of the eye. In
Fig. 1.6. Equal level contour map of a human eye (from [6]). Overall wavefront(left hand side), higher orders (3rd- and 4th-order Zernikes, right hand side)

6 J.F. Bille
Fig. 1.7. Principle of WavescanTM measurements
Fig. 1.7 the principle of the measuring process of the WavescanTMinstrumentis shown. The ideal wavefront is represented as a regular grid of spots codedwith green color. The distorted wavefront is given by an irregular grid of spotscoded with red color, resp. blue color. In Fig. 1.8 the computer display of theWaveScanTM instrument is presented summarizing the measurement resultsfor the right (OD) and left (OS) of a human volunteer subject. In the upperpart of the display the AcuityMapTM’s for both eyes are depicted in a colorcoded form. In the lower part of the display (“Bille Aberration MapTM”) thehigher orders of the optical aberrations beyond sphere and cylinder are plot-ted demonstrating considerable wavefront deviations in the outer segments ofthe pupil, i.e. coma and spherical aberration respectively. In addition, opticalperformance indices like RMS or OAI are given.
1.5 Definitions of Optical Imaging Quality
For the description of the performance of an optical system there are severalparameters in use. Some of them are applied to the human eye as well. Ashort overview of some scales used in ophthalmology will be given in thissection.
Root Mean Square
The RMS of the wavefront is a very simple criterion. It is nothing but theintegrated root mean square of the differences between the wavefront surface

1 Wavefront Technology and its Application to Ophthalmology 7
Fig. 1.8. Computer display of WavescanTM-instrument
and the mean value of the surface. The complex phenomenon of aberration ispacked into a single number. This makes it so convenient in ophthalmology.The RMS can be calculated directly from the Zernike polynomials.
For the calculation of the RMS we refer to Zernike polynomials of secondorder minimum. The zero order is not measured at all. The first order givesinformation about the tilt only, which is connected to the position of the eye.It does not supply any information about the characteristics of the eye itself.The Zernike polynomials are orthogonal and the zero order term is set tozero. So the mean value of the wavefront surface is zero, too. The RMS isthus simply the mean squared value of the wavefront over the pupil.
RMS =
√
√
√
√
∫ r
0
∫ 2π
0W (ρ, θ)2ρdρdθ
∫ 1
0
∫ 2π
0ρdρdθ
=
√
1
π
∫ 1
0
∫ 2π
0
W (ρ, θ)2ρdρdθ (1.1)
In taking mean values of the Zernike polynomials the integral can be replacedby a sum of the weighted coefficients. For a real pupil size the integrationwill be from 0 to r.
RMS =
√
√
√
√
∫ r
0
∫ 2π
0W (ρ, θ)2ρ dρ dθ
∫ r
0
∫ 2π
0ρ dρ dθ
(1.2)
=
√
√
√
√
1
πr2
∫ r
0
∫ 2π
0
(
order∑
i=0
ciZi(ρ, θ)
)2
ρ dρ dθ (1.3)

8 J.F. Bille
=
√
√
√
√
1
πr2
order∑
i=0
c2i
∫ 2π
0
∫ 1
0
Z2i (ρ, θ)ρ dρ dθ (1.4)
=
√
√
√
√
1
πr2
order∑
i=0
c2iZ′2i (1.5)
with Z ′i = weighting coefficient for each Zernike. It depends from the radial
and angular order.
Z ′i =
1
(2− δl) ∗ (n+ 1)with i =
n(n+ 1)
2+
n− l
2+ 1 (1.6)
With 3.21 the RMS can be calculated simply as a root of the sum of coeffi-cients. This makes calculations with the RMS very easy.The Peak To Valley (PTV) is closely connected to the RMS. While the PTVdepends – heavily – on just two extreme values, the RMS is a kind of meanvalue received from the complete set of data points. This makes the RMSmuch more stable against deviations.
Optical Aberration Index
The Optical Aberration Index (OAI) is defined as
OAI = 1− e(−RMS) (1.7)
The OAI has values between zero and one. Zero stands for an optical systemthat is perfect and 1 for infinite aberrations. The OAI is very sensitive inthe typical range for higher order aberrations. It was introduced as an evensimpler scale for the optical quality of an eye.
Modulation Transfer Function
A typical target for testing the quality of an optical system consists of aseries of alternating black and white bars of equal width with a contrast of1. These targets are connected to a vision chart with Snellen E‘s, as used inophthalmology. The Modulation Transfer Function (MTF) gives the contrastof the image (as percentage of the contrast of the object) in dependence ofthe frequency. The contrast is defined by:
Contrast =Imax − Imin
Imax + Imin(1.8)
The MTF may be compared to the Aerial Image Modulation (AIM) curve.This curve shows the smallest amount of modulation a sensor like a CCD-camera or the retina is able to detect. The AIM is a function of the frequency

1 Wavefront Technology and its Application to Ophthalmology 9
used as well. As the MTF normally goes down with frequency increasing, theAIM increases with frequency. The point of intersection gives the resolution.For a diffraction limited optic the MTF can be calculated by
MTF(ν) =Mi
Mo
=2
π(Φ− cosΦ sinΦ) (1.9)
with
Φ = arccosλν
2NA
ν = frequencyincycles
mmNA = numericalaperture
λ = wavelength
Point Spread Function
The point response of an optic should still be a point. Even if the optic isperfect the response is a pattern - due to the diffraction. In a real systemthe aberrations widen the image up to a spot. The spot is represented by a2-dimensional distribution. This is described by the Point Spread Function(PSF).
If the aberrations are smaller than 0.25λ (Rayleigh criterion) the diffrac-tion pattern provides a good description of the PSF.
Up to about 2λ it is appropriate to consider the manner in which theaberration affects the diffraction pattern. For larger wavefront aberrationsillumination described by raytracing is sufficient for description.
Application of the Performance Indices in a Normal Human Eye
In Fig. 1.9, the different performance indexes are presented for a normal hu-man eye. In the upper part, a color-coded presentation of the wavefront isshown. The Root Mean Square (RMS) of 0.23µm results in an Optical Aber-ration Index (OAI) of 0.24. In the middle part, the Modulation TransferFunction (MT) is plotted, as well as the diffraction limited MTF for a 6mmpupil. In the lower part, the Point-Spread-Function (PSF) is graphically pre-sented.
1.6 Principle of Closed Loop Adaptive Optical Control
In Fig. 1.10, the principle of closed loop adaptive optical control is schemat-ically demonstrated. The wavefront of light which is distorted due to opti-cal aberrations of the optical system, e.g. the human eye, is measured by

10 J.F. Bille
Fig. 1.9. Different representations of the image quality of a human eye
a wavefront sensor. The reconstructed wavefront is dithered on a wavefrontcontroller, e.g. an active mirror in order to compensate for the optical aberra-tions. Thus, through an aberrating medium an aberration free optical imagecan be achieved.

1 Wavefront Technology and its Application to Ophthalmology 11
Fig. 1.10. Principle of closed loop adaptive optical control
Adaptive Optics in Astronomy
Wavefront technology and adaptive-optical closed loop control was originallydeveloped for astronomical applications. It was used to measure wavefrontdistortions that occurred when light travelling through the atmosphere en-tered an optical telescope. By applying adaptive optical closed loop controlsthe speckle patterns of the star images could be improved towards diffraction-limited performance. In Fig. 1.11, the principle of operation of an adaptiveoptical closed loop system on an optical telescope is demonstrated. In the leftpicture (a) the speckle pattern of an astronomical object, aberrated by theturbulent atmosphere is shown. In the right picture (b) the sharpened pictureafter engagement of the adaptive optical closed loop control demonstrating adouble star image at high spatial resolution is depicted. The measurementswhere performed at the Calar Alto Optical Telescope operated by the MaxPlanck Institute for Astronomy, Heidelberg [9].
History of Adaptive Optics at the University of Heidelberg
In Fig. 1.12 a number of active mirrors and wavefront sensors as developedand used in the Kirchhoff Institute of Physics, University of Heidelberg duringthe last 20 years are depicted. The first generation foil mirror was successfullyapplied for the real time compensation of aberrations of the human eye forhigh resolution imaging of the retina [8]. In this paper closed loop operationalresults of the second generation foil mirror [10] are reported. Recently a multi-segment microchip mirror was developed, exhibiting approximately 100,000mirror facets, each able to slightly shift the phase of a local component ofthe wavefront in order to compensate for the detected wavefront error. In thelower part of Fig. 1.12 two different realisations of Hartmann Shack wavefrontsensors are shown. On the left hand side a cylindrical lens array with CCDdetector is photographed which was applied for the first time to measure

12 J.F. Bille
Fig. 1.11. Adaptive Optics in Astronomy: (a) speckle pattern (b) sharpened pic-ture
the aberration of the human eye in real time [6]. On the right hand side acustom ASIC chip detector which is used in combination with a custom microlens array is shown [12]. The ASIC chip is divided into a matrix of clusters,consisting of photodetectors and signal processing circuitry. By analogoussignal processing in winner-takes-all-circuitry, the highest photocurrent isdetected and position is calculated. The data obtained are evaluated in realtime for reconstruction of the wavefront of the light.
Fig. 1.12. History of adaptive-optical elements

1 Wavefront Technology and its Application to Ophthalmology 13
Fig. 1.13. Pressure distribution for Zernike polynomials U 33 (left part) and U0
6 (rightpart) (from [7])
Performance of Foil Mirrors
Electrostatic foil mirrors as e.g. introduced at the University of Heidelberg[12] and the University of Delft [10] suffer from the cross talk of influence func-tions on neighboring sites. In order to accomplish the early work in aberrationfree imaging of the retina of the human eye (see e.g. [8]) a control systemfor determining optimal voltage settings for producing a desired foil mirrorsurface shape was developed [7]. Electrode pressures and voltages where cal-culated for Zernicke Polynomials up to degree n = 6 (see Fig. 1.13).
Two Zernicke polynomials where selected to illustrate the fitting proce-dure. They are
U33 = r3 cos 3Φ (1.10)
and
U06 = 20r6 − 30r4 + 12r2 − 1 (1.11)
computed surface displacements for Zernicke polynomials U 33 and U0
6 areshown in Fig. 1.13 [7]. The difference between the desired and computed sur-face displacements is caused by the limitations in spatial resolution of boththe finite number of electrodes and the finite number of surface-matchingpoints in the algorithm. In the mid-1980s at the University of Heidelberg forthe first time the compensation of aberrations of a human eye with an anadaptive-optical system was accomplished [8] using the method of configur-ing electrostatic membrane mirrors by least squares fitting with analyticallyderived influence functions, as described previously (see Fig. 1.14).
For an adaptive optical system with a foil mirror as an actuator the per-formance of closed loop operation was simulated. In Fig. 1.15 the result of acompensation of defocus based on the Gauss-Seidel algorithm is graphicallydemonstrated. The membrane mirror consists of a silicon nitride membranecoated with aluminum. It is deformed by electrostatic forces of 37 underlyingelectrodes, arranged in a hexagonal grid [10]. Since the realtime compensa-tion with a closed loop requires, compensation of accommodation, anotherapproach was chosen. A genetic algorithm was used to determine the manifoldof voltages that yielded the best compensation.

14 J.F. Bille
In Fig. 1.16 two examples of compensation of low order optical aberra-tion using the genetic algorithm are shown. In the upper part of Fig. 1.16the compensation of defocus is depicted. In the lower part of Fig. 1.16 thecompensation of astigmatism has been tried but with lesser success: thoughthe wavefront RMS is decreased to less than one half, the achieved residualRMS of 0.41µm is far away from diffraction limited imaging. Thus the per-formance of the foil mirror is not adequate for compensation of higher orderoptical aberrations of the human eye.
Comparison of Foil Mirrors and Microchip Mirror
Recently, an active matrix mirror was developed exhibiting an array of 200µm× 240µm mirrors (40µm× 40µm each). With this technique wavefronts canbe corrected up to twice the height of deflection, i.e. approximately one wave-length. By using the 2-π-phase wrapping method the range of the wavefrontdeformation to be corrected can be largely enhanced.
In a simulation, the foil mirror and the multi-micro-mirror-system werecompared for a compensation of astigmatism of one diopter (Fig. 1.17). Onthe left side of Fig. 1.17 the simulated vision chart blurred by an astigmatismof 1 diopter is shown. In the middle the vision after correction with a 37element membrane mirror is depicted. It is obvious that due to the limitedresolution a remaining astigmatism of 0.3 diopters yields considerable blurof the smaller Snellen-letters. On the right side of Fig. 1.17 the result ofa compensation with the multi-micro-mirror/micro-chip-mirror is presenteddemonstrating a complete compensation down to the 20/10 letter line.
1.7 CLAO/BILLE-Aberrometer
Historically, for specifying the optical quality of large telescopes, in 1920 Jo-hannes Hartmann introduced a new measuring method, called now the Hart-mann Test. In Fig. 1.18 a modern version of the Hartmann Test as applied
Fig. 1.14. Voltage distribution of foil mirror for astigmatism compensation on hu-man eye (from [8])

1 Wavefront Technology and its Application to Ophthalmology 15
Fig. 1.15. Gauss Seidel Algorithm
to measuring the aberrations of the human eye is schematically diagrammed.The Hartmann Screen is placed in front of a CCD array so that every imag-ing point can be associated with one aperture. As discussed in chapter 4the position of the image point encodes the local slope of the wavefront. In1971 Roland Shack introduced an advanced version of the Hartmann Sensorcalled the Hartmann Shack sensor (Fig. 1.19). The modification comprisesthe use of a lens array in the image plane followed by a photographic plateor nowadays a CCD camera in the focal plane of the lens array. The con-finement of the individual light race into focal spots on the CCD chip allowsfor increased signal to noise ratio and thus increased speed of the wavefrontmeasurement. Still the resolution of the measuring device is limited to thesize of a single lens in the lens array, typically around 0.5mm. Recently anew type of a wavefront measuring device has been introduced, the so calledClosed Loop Adaptive Optical Aberrometer (CLAO/Bille-Aberrometer, seeFig. 1.20). In the CLAO/BILLE Aberrometer the spatial resolution of thewavefront measurement is limited by the size of the individual mirrors of themicro chip mirror which is typically less than 0.05 mm, thus increasing the

16 J.F. Bille
Fig. 1.16. Results Genetic Algorithm
Fig. 1.17. Comparision of mirrors [16]
spatial resolution by a factor of one hundred over typical Hartmann Shacksensors. The lens array/CCD-camera detector is only used as a nulling-sensorfor achieving complete compensation of the measured wavefront. In addition,it delivers an initial estimate of the aberrated wavefront. As an alternative tothe Hartmann-Shack Sensor as a nulling-sensor a newly developed pyramidsensor is considered (see Fig. 1.21), The wavefront sensor consists of a lensrelay and an oscillating, pyramidal-shaped prism. The gain of the device isdriven by the amplitude of the oscillations, while the sampling is determinedby the focal length of the lens relay.

1 Wavefront Technology and its Application to Ophthalmology 17
Fig. 1.18. Hartmann test of the aberrations of the human eye
Fig. 1.19. Hartmann-Shack Wavefront sensor
Following the notations of Fig. 1.21, the slope of the wavefront can becalculated. The modulation amplitudes
∂W
∂x(p) = δΘx
(S1 + S4)− (S2 + S3)
S1 + S2 + S3 + S4(1.12)
∂W
∂y(p) = δΘy
S1 + S4)− (S2 + S3)
S1 + S2 + S3 + S4(1.13)
determine the optical gain. As an advantage over the Hartmann-Shack Sen-sor the pyramid wavefront sensor yields a higher sensitivity in closed loopapplication [15].

18 J.F. Bille
Fig. 1.20. CLAO/BILLE-Aberrometer
Fig. 1.21. Pyramid wavefront sensor
In Fig. 1.22 an experimental realisation of the closed loop adaptive opticalaberrometer is schematically shown [14]. There are four main parts in the op-tical path, two for the measurement itself and two for the accurate positioningof the eye. To prevent interferences between the parts, each part uses lightbeams with special wavelengths or polarisations optimized for the particularuse (Fig. 1.22, top). In order to measure ametropic eyes a spherocylindricalcompensator is incorporated (Fig. 1.22 bottom). A telescopic arrangement isused to compensate the measuring beam for defocus. Behind the second lensof the anterior telescope a cylinder compensation unit is introduced, consist-ing of two rotatable cylinder lenses with focal lengths identical in amount,but opposite in sign.

1 Wavefront Technology and its Application to Ophthalmology 19
eye
laser
active mirror
target
CCD
CCD
lens-array
precompensation:
sphere
precompen-
sation:
cylinderquarterwave-
plate
quarterwave-
plate
polarizing
beamsplitter-
cubes
dichroic
beamsplittercube
mirror
dichroic
beamsplitter
mirror
aperture
pupil-
plane
active
mirror-
plane HSSLensespinhole
defocus-
correction
Cylinder-
correction
Fig. 1.22. Setup of CLAO/BILLE-Aberrometer
1.8 Demonstration of CLAO/BILLE-Aberrometer
An active matrix mirror is used in the device (see Fig. 1.23). It is an array of200×240 micromirrors (40µm×40µm each). Each one of the mirrors can belowered up to 400 µm independently. The mirrors can only be lowered withoutthe facility of tilting. With this technique wavefronts can be corrected up tothe double height of deflection - more than one wavelength. By using the 2-π-phase wrapping method (Fig. 1.24) the range of the wavefront deformationsto be corrected can be enlarged by far. The 2-π method makes use of thephase properties of light. A sag of 2-π between two neighboring mirrors has

20 J.F. Bille
no effect on the direction of the light and can be subtracted without any effecton the wavefront. So the range of movement needed for the correction of anywavefront-deformation can be reduced to λ/2. In fact the use of the mirror islimited to light of one wavelength when using the 2-π-phase wrapping method[11].
Fig. 1.23. Setup of the microcho-mirror
Fig. 1.24. 2π-phase wrapping control of the micromirror
For an objective test of the active mirror a test device was constructed(Fig. 1.25). This device allows us to measure a phase-plate and look throughit into the instrument at the same time. By the camera at the test device weget an image of the target. For the measurements presented here, a targetwas used with 1
′
apex angle corresponding to a VA of 1.0.

1 Wavefront Technology and its Application to Ophthalmology 21
Fig. 1.25. Test device for the active mirror: Light entering from the left throughthe phase plate is divided by the dichroic beamsplitter cube. The aberrations getmeasured in the right arm. The bottom arm is used to record an image of the target
In Fig. 1.26 and Fig. 1.27 the correction of higher order wave aberrationsis demonstrated. In Fig. 1.26 on the right hand side, the uncompensated comamodelled into a waveplate is shown, resembling the aberration of a humaneye before therapeutic custom ablation correction. The peak to valley (PTV)difference amounts to 2µm, the RMS-error to 0.72µm. The patient achieveda best spectactle corrected visual acuity (BSCVA) of 20/40. On the left handside of Fig. 1.26 the appearance of the WavescanTM-tunnel-target is blurredcorrespondingly. In Fig. 1.27, the compensated wavefront and the target im-age are depicted. By closed loop adaptive optical control the RMS-error canbe reduced to 0.07µm, corresponding to one tenth of a wavelength of light.The WavescanTM-tunnel target image is sharpened accordingly. Indeed, thepatient’s vision was improved by a therapeutic custom ablation procedure tonearly perfect 20/12.5 performance.
1.9 Summary
It was shown, that the introduction of wavefront–technology into ophthalmol-ogy allows to determine all optical aberrations of the human eye, far beyondthe spherocylindrical refractive error. Based on WaveScanTM-technology thereproducibility and accuracy of the new technique was established in world-wide multicenter clinical studies. It was demonstrated that closed loop adap-tive optical control allows for improved spatial resolution of aberration mea-surements, increasing the resolution limit by two orders of magnitude over e.g.

22 J.F. Bille
Fig. 1.26. Waveplate simulating human eye with high coma. Left: defocused image,right: uncompensated wavefront
Fig. 1.27. Compensation of high coma aberration. Left: Focused image, right: com-pensated wavefront
Hartmann-Shack technologies. In addition, adaptive optical stimulus gener-ation can be used for preoperative simulation of refractive outcomes. Basedon highly integrated micro-optoelectronic devices a new diagnostic instru-ment was developed, the so-called CLAO/BILLE-Aberrometer. The safetyand efficiency of custom ablations based on WaveScanTM-measurements wasestablished in first controlled clinical studies.
References
1. J.F. Bille, K. Freischlad, G. Jahn, F. Merkle: Image restauration by adaptive-
optical phase compensation. Proceedings “6th International Conference on Pat-tern Recognition”, Munich, Germany, Oct. 19-22, 1982
2. J.F. Bille: Method and Apparatus for Forming an Image of the Ocular Fundus,U.S. Patent 4, 579, 430 (April 1, 1986)

1 Wavefront Technology and its Application to Ophthalmology 23
3. J.F. Bille, G. Jahn, M. Frieben: Modal control for wavefront reconstruc-
tion in adaptive optics, SPIE 332 Advanced Technology Optical Telescopes,269 (1982)
4. J.F. Bille, B. Grimm, J. Liang, K. Mueller: Imaging of the retina by scanninglaser tomography, New Methods in Microscopy and Low Light Imaging, SPIE1161, 417 (1989)
5. J. Liang: A new method to precisely measure the Wave Aberrations of the
Human Eye with a Hartmann-Shack Sensor. Dissertation, Ruprecht-Karls-Univeristt, Heidelberg 1991
6. J. Liang, B. Grimm, S. Goelz, J.F. Bille: Objective measurement of wave aber-rations of the human eye with the use of a Hartmann-Shack wavefront sensor,JOSA A, No.7, 1949 (1994)
7. E.S. Claflin and N. Baraket: Configuring on electrostatic membrane mirror by
least-squares fitting with analytically derived influence functions, JOSA A 3,1833 (1986)
8. A.W. Dreher, J.F. Bille, and R.N. Weinreb: Active optical depth improvementof the laser tomographic scanner, Applied Optics, 28, 804 (1989)
9. M. Kasper, D. Looze, S. Hippler, T. Herbst, A. Glindemann, T. Ott, A. Wirth:ALFA: Adaptive Optics Calar Alto Observatory-Optics, Control System, and
Performance, Experimental Astronomy 10, 49 (2000)10. G.V. Vdouin: Adaptive mirror micro machined in silicon PhD thesis, Univer-
sity of Delft, Netherlands, 199711. J.F. Bille: Method for Programming an Active Mirror to Mimic a Wavefront ,
U.S. Patent 6, 220, 707 B1 (April 24, 2001)12. D. Droste and J.F. Bille: An ASIC for Hartmann-Shack Wavefront Detection
IEEE Journal of Solid-State Circuits (2002)13. U. von Pape:Wavefront sensing in the human eye PhDDissertation, University
of Heidelberg, (2002)14. R. Ragazzoni: Pupil plane wavefront sensing with an oscillating prism J. Mod.
Opt., 43, 289 (1996)15. S. Wuhl: Diploma Thesis, University of Heidelberg, (2000)16. F. Muller: Dissertation, University of Heidelberg, (2001)

2 Optical Quality of the Human Eye:The Quest for Perfect Vision
J.F. Bille, J. Buchler Costa, and F. Muller
2.1 Introduction
The optical errors caused by the elements of the optical apparatus of the eye,as the cornea or the lens, strongly degrade the image on the retina.
The correction of the lower orders, as tilt, defocus and astigmatismus,through spectacles or contact lenses, is normally prescribed by the doctor.
With a pupil of circa 3mm , which is usual at normal daylight, the bestcompromise between the pupil size and the aberrations is achieved. If thepupil size is smaller, diffraction strongly limits the visual performance, whilefor bigger pupils the image transmission is heavily prejudiced by the aber-rations in the margins. In Fig. 2.1, point spread function (PSF) for differentpupil size are shown. The corresponding modulation transfer function (MTF)are demonstrated in Fig. 2.2.
Fig. 2.1. PSFs for diameter 3, 5 and 7 mm
2.2 The Quality of the Human Eye
Most people experience in daily life the limited quality of the eye, causedby the elements of the optical apparatus, as the cornea or the lens, which

2 Optical Quality of the Human Eye 25
Fig. 2.2. MTFs for diameter 3, 5 and 7 mm
strongly degrade the image on the retina. The correction of the lower orders,as tilt, defocus and astigmatismus, the simplest optical errors, is normallyprescribed by the doctor, through spectacles or contact lenses. But with apupil of circa 3mm, which is usual at normal daylight, the best compromisebetween the pupil size and the aberrations is achieved. If the pupil size issmaller, diffraction strongly limits the visual performance, while for biggerpupils the image transmission is heavily prejudiced by the aberrations in themargins, like the spherical aberration, for example. A natural measure of
Fig. 2.3. Visual acuity vs. pupil size at different illuminations [3]. The optimumvisual acuity is achieved for 2-3mm pupil diameter

26 J.F. Bille et al.
quality of the human eye is its ability to see fine detail, its visual acuity. It isthe spatial resolving capacity of the visual system. There are various ways tomeasure and specify visual acuity. Usually a proband has to read letters ofa specific size or has to determine the orientation of special test characters.The most prominent test characters used are Snellen letters (normally E) andLandolt Cs. Later we will use these kind of vision charts to simulate retinalimages under various conditions.
The visual acuity of a perfect eye is limited by diffraction and ultimatelyby the photoreceptor density of the eye. Thus the acuity of the eye shouldtheoretically improve with larger pupils until the size of the point spread func-tion, the intensity pattern of a transmitted luminous point (see next chapterfor mathematical definition), reaches the dimension of single rods. As shownin Fig. 2.3 this is not the case: as the pupil gets larger, visual acuity increasesuntil it reaches its optimum value. At larger pupils optical aberrations pre-vail and so the measured acuity diminishes. The measurement of wavefronterrors explains this findings. In Fig. 2.4 the reaction of the wavefront RootMean Square deviation (RMS) to a change in pupil diameter is shown fortwo sample eyes. The rms value increases steadily with larger pupil size. This
Fig. 2.4. Variation of wavefront rms with pupil size
does not contradict Fig. 2.3 because—in spite of this increase—the resolutionlimit due to diffraction declines.
At larger pupil sizes the Strehl ratio, normalized maximum of the pointspread function, assumes values of some percent and ceases to be a usefulmeasure of optical quality because the associated point spread function takesa complex shape with many singular maxima.
As one can see, the change is strongly dependent on the particular pro-band, as is the actual shape of the aberrations [5,9].Thus it is of no use to

2 Optical Quality of the Human Eye 27
apply a generic correction of high order aberrations but it is necessary tocorrect each patient individually.
2.3 Linear Systems
For the description of the optical quality of the human eye some mathematicalbackground is necessary. First we make the assumption that the eye is a lineartransmission media. Taking f as the incoming signal and g as the outgoingsignal, we can describe the effect of the system as a linear operator L
f(x, y) 7→ g(X,Y ) ⇒ g(X,Y ) = L{f(x, y)} (2.1)
This allows us to determine a system response function to a δ-signal, whichis called the Point Spread Function (PSF) of the system.
If we know the transmission function of a point source, we can decom-pose the incoming signal in many point sources and sum the correspondingoutgoing signals. Mathematically this is described by:
g(X,Y ) =
∫ ∞
−∞
∫ ∞
−∞
f(x, y) PSF(X − x, Y − y) dx dy (2.2)
or shorter: g = f ⊗ PSF, what is called a convolution.Another important parameter for the description of the optical quality
is the Optical Transfer Function (OTF), which is the Fourier Transform ofthe PSF. It contains the information about the effect of the system in thefrequency space. As example see Fig. 2.5 and Fig. 2.6
Fig. 2.5. PSFs for diameter 3, 5 and 7mm without aberrations
The Strehl ratio is defined as the ratio between maximum intensity of animage of a point source and maximum intensity of the same source imagedwith an ideal optical system.

28 J.F. Bille et al.
Fig. 2.6. Modulation Transfer Functions (modulus of the OTF) for diameter 3, 5and 7mm without aberrations
2.3.1 Optical Systems
Diffraction Limited Systems These systems transform incoming diver-gent spherical waves in outgoing convergent perfectly spherical waves. Theyconverge to an almost ideal point, which is the center of the airy-disk (seeFig. 2.7). The only limiting factor for the imaging quality is the diffractioncaused by the edges of the pupil. This causes the enlargement of the idealpoint to a broader circle.
To explain the possible optical resolution of an optical system it is nec-essary to skip to waveoptics. Geometrically a smaller pupil would alwaysgenerate a smaller point on the retina. However, below a certain aperturesize, the point gets wider, because of the scattering at the pupil edges, whatis well described by Fraunhofer diffraction. A circular pupil images a pointas a pattern of concentric bright and dark rings, as shown in Fig. 2.7. Thebright circular center is called the airy-disk, and its half angular dimensionis given by:
θ = 1.22λ
d, (2.3)
where d is the pupil diameter and λ is the wavelength of the light.This determines the maximum resolution of the eye, because two points
can only be distinguished if the sum of the intensities of both irradiatedsurfaces shows clearly two maxima. Using the Rayleigh criterion this happenswhen the maximum of one disk falls on the first minimum of the other pattern.The angular distance is then given by 2.3.According to this criterion the eye could, if it was a diffraction limited system,resolve approximately 47 seconds of arc with a pupil diameter of 3mm andwith light of wavelenght 555 nm, with a diameter of 4mm it should resolve35 seconds of arc.

2 Optical Quality of the Human Eye 29
1.22 /dl 3.24 /dl
2.24 /dl
airy-disk
Imax
x
Fig. 2.7. Intensity distribution of the diffraction pattern with a circular pupil. Theposition of the minima is given
Systems with Aberrations The waves that come out of this systems differclearly from a spherical wave and the cause are the optical aberrations. Theseare normally more or less regular differences that the real system or its opticalcomponents have from the ideal system. There is for example the existenceof different indices of refraction in the center and the edges of the pupil, whatis called spherical aberration.
The Photoreceptor Sampling of the Retina One of the factors that canlimit visual acuity is also the size and the density of the photoreceptors onthe retina. In the fovea the cone density is estimated to be 147.000 per squaremillimeter (Osterberg 1935) and the center to center spacing between 2 and3µm. We assume they are approximately hexagonal and packed as shown inFig. 2.8. Applying the Nyquist sampling theorem, the maximum frequency
Fig. 2.8. Photoreceptor sampling

30 J.F. Bille et al.
Fig. 2.9. Reduced eye from Listing
that can be clearly distinguished by this distribution is half of the reciprocalof the distance between the receptor rows. So this limit is
fN =(√
3S)−1
, (2.4)
where S is the center to center spacing. Using the model of the reduced eyefrom Listing (see Fig. 2.9), with S = 2.5µm we get fN = 69 cpd (cycles perdegree).
The detection of the position of the spacing in a Landolt C, for example,should be possible if the spacing has 0.4 to 0.5 minutes of arc (correspondingto Vision 2.3 or almost 20/8). Beyond this frequency aliasing in the detectionis expected [11].
Modulation Threshold The Modulation Threshold function (which is thereciprocal of the Contrast Sensitivity function) is defined as being the min-imum required contrast of a sinusoidal light signal for the eye to detect theillumination variance at every frequency. Normally it is measured by present-ing targets to patients at various contrast levels.
Optical systems are very well described by the Linear Systems Theory. Incase of coherent light the system is linear in the amplitude, in our case, withincoherent illumination, it is linear in the intensity. Then we have:
Ii(X,Y ) =
∫ ∞
−∞
∫ ∞
−∞
I0(x, y) PSF(X − x, Y − y) dx dy, (2.5)
where Ii is the image intensity and I0 is the object intensity (see 2.2 ). Tokeep it simple, we take the magnification factor as being 1.
The PSF washes out the image, since sharp lines or points are broadened,and the resolution diminishes.
In frequency space the OTF is used instead of the PSF. As intensities arereal non-negative quantities, the spectrum has its maximum, which is not 0,at frequency 0. Normally the spectra are normalised, the fourier transform

2 Optical Quality of the Human Eye 31
of the intensities are divided by the 0-frequency value. This value can beinterpreted as the underground, in case of black and white bars medium-grey. This allows us to interpret the OTF as the level of contrast of eachfrequency term, taking values from 0 to 1.
As the OTF is a complex function, it is possible to write it in exponentialform:
OTF = (MTF) ei(PTF). (2.6)
Contrast Measurements One very important skill of the eye is the capa-bility of recognizing patterns even if they have little contrast and are not wellilluminated. Contrast (M) is defined as
M =Imax − IminImax + Imin
. (2.7)
The contrast attenuation factor at every spatial frequency gives us the OTF, which describes the optical properties of the system. With the Hartmann-Shack Wavefront measurements we have an objective method to determinethis function.
Frequency is normally given in cpd. A sinusoidal black and white patternwith a frequency of 30 cpd corresponds to a resolution of 1 minute of arc orVision 20/20.
2.4 Representation of Aberrations
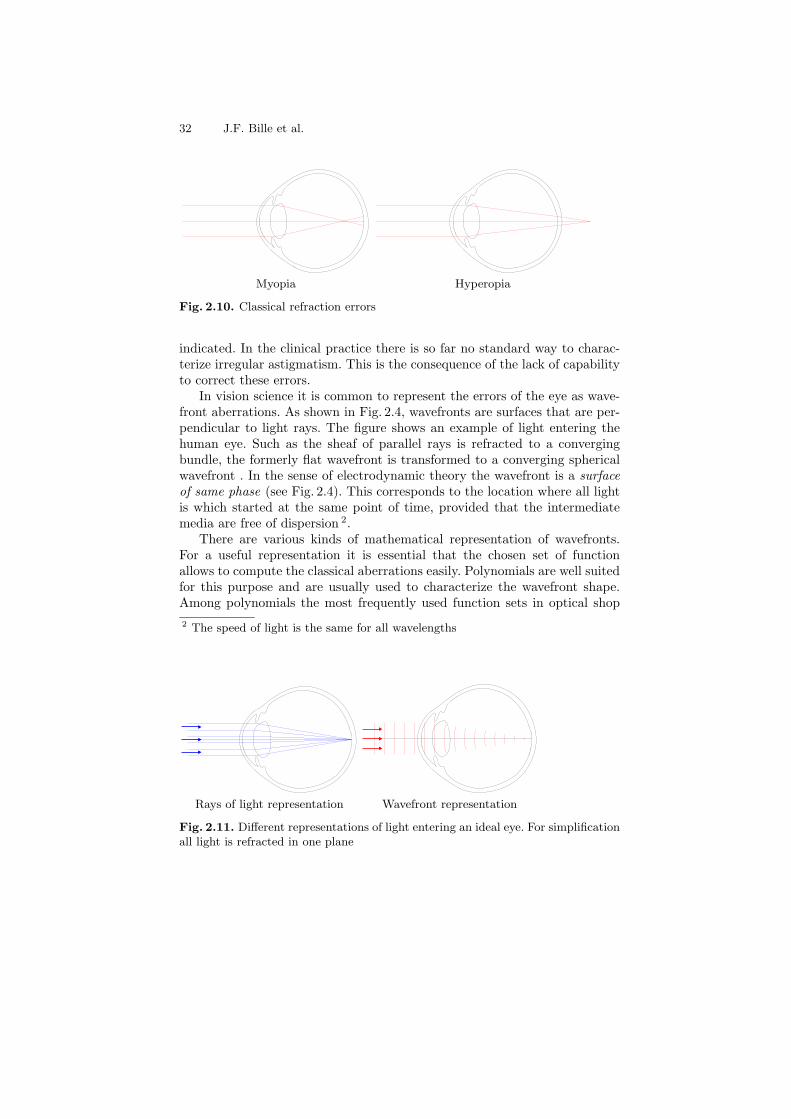
Classically, only two kinds of optical aberrations are corrected by the oculist:sphere and cylinder. Let’s first regard these refractive errors. If the eye hastoo much or too less optical power in relation to its length, one speaks ofmyopia respectively of hyperopia. Usually the eye is too long (myopia) or tooshort (hyperopia). The optical path of light rays entering the eye is picturedin Fig. 2.4. The third well known aberration is cylinder or astigmatism. Therethe power of the refracting system of the eye is higher in one meridian thanin the other. Thus the entering light is not focused to a point but to twoperpendicular lines in different depths 1. Higher order, that is more compli-cated aberrations are all summarized as irregular astigmatism. If this defectis strong it is corrected by a hard contact lens.
The classical aberrations are described as an error in focal power, in thecase of sphere the absolute error of power, in the case of astigmatism thedifference between the focal powers of the meridians. Consequently the unitdiopter is used. Almost always the power of the necessary correction lens is
1 Greek stigma (στ ιγµα) means point. Thus the term a-stigma-tism means: ab-sence of a focal point
32 J.F. Bille et al.
Myopia Hyperopia
Fig. 2.10. Classical refraction errors
indicated. In the clinical practice there is so far no standard way to charac-terize irregular astigmatism. This is the consequence of the lack of capabilityto correct these errors.
In vision science it is common to represent the errors of the eye as wave-front aberrations. As shown in Fig. 2.4, wavefronts are surfaces that are per-pendicular to light rays. The figure shows an example of light entering thehuman eye. Such as the sheaf of parallel rays is refracted to a convergingbundle, the formerly flat wavefront is transformed to a converging sphericalwavefront . In the sense of electrodynamic theory the wavefront is a surface
of same phase (see Fig. 2.4). This corresponds to the location where all lightis which started at the same point of time, provided that the intermediatemedia are free of dispersion 2.
There are various kinds of mathematical representation of wavefronts.For a useful representation it is essential that the chosen set of functionallows to compute the classical aberrations easily. Polynomials are well suitedfor this purpose and are usually used to characterize the wavefront shape.Among polynomials the most frequently used function sets in optical shop
2 The speed of light is the same for all wavelengths
Rays of light representation Wavefront representation
Fig. 2.11. Different representations of light entering an ideal eye. For simplificationall light is refracted in one plane

2 Optical Quality of the Human Eye 33
Fig. 2.12. Electromagnetic waves escaping a source of light. The points of samephase form a wavefront
Table 2.1. Zernike polynomials up to 4th radial order. Notation as recommendedin [8]
Term Polar representation Monomial representation Name
Z00 1 1 Constant
Z−11 ρ sin θ x Tilt in y
Z11 ρ cos θ y Tilt in x
Z−22 ρ2 sin 2θ 2xy Astigmatism ±45
Z02 2ρ2 − 1 2x2 + 2y2 − 1 Defocus
Z22 ρ2 cos 2θ y2 − x2 Astigmatism 0/90
Z−33 ρ3 sin 3θ 3xy2 − x3
Z−13 (3ρ3 − 2ρ) sin θ −2x+ 3xy2 + 3x3 Coma in x
Z13 (3ρ3 − 2ρ) cos θ −2y + 3x2y + 3y3 Coma in y
Z33 ρ3 cos 3θ y3 − 3x2y
Z−44 ρ4 sin 4θ 4y3x− 4x3y
Z−24 (4ρ4 − 3ρ2) sin 2θ −6xy + 8y3x+ 8x3y
Z04 6ρ4 − 6ρ2 + 1 1 − 6y2 − 6x2 + 6y4 + 12x2y2 + 6x4 3rd order spherical aberr.
Z24 (4ρ4 − 3ρ2) cos 2θ −3y2 + 3x2 + 4y4 − 4x4
Z44 ρ4 cos 4θ y4 − 6x2y2 + 4x4
testing include Seidel polynomials and Zernike polynomials [12,10]. LatelyZernike polynomials have found most attention in vision science [4,5,7]. Intable 2.1 the 14 Zernike polynomials of lowest order are given. As one cansee, Z0
2 corresponds to defocus whilst Z−22 and Z2
2 correspond to astigmatism.Other well known optical aberrations have their correspondence in Zernikepolynomials as well, e.g. Z12 represents 3rd order spherical aberration. Table2.2 shows pseudo-3D graphics of these functions.

34 J.F. Bille et al.
Table 2.2. Zernike polynomials up to 4th order
–1
–0.5
0
0.5
1
–1–0.8–0.4
00.20.40.60.81–1
–0.5
0
0.5
1
–1
–0.5
0
0.5
1
–1–0.8–0.4
00.20.40.60.81–1
–0.5
0
0.5
1
–1
–0.5
0
0.5
1
–1–0.8–0.4
00.20.40.60.81–1
–0.5
0
0.5
1
Z1 Tilt in x-direction Z2 Tilt in y-direction Z3 Astigmatism at 45
–1
–0.5
0
0.5
1
–1–0.8–0.4
00.20.40.60.81–1
–0.5
0
0.5
1
–1
–0.5
0
0.5
1
–1–0.8–0.4
00.20.40.60.81–1
–0.5
0
0.5
1
–1
–0.5
0
0.5
1
–1–0.8–0.4
00.20.40.60.81–1
–0.5
0
0.5
1
Z4 Defocus Z5 Astigmatism at 0 Z6
–1
–0.5
0
0.5
1
–1–0.8–0.4
00.20.40.60.81–1
–0.5
0
0.5
1
–1
–0.5
0
0.5
1
–1–0.8–0.4
00.20.40.60.81–1
–0.5
0
0.5
1
–1
–0.5
0
0.5
1
–1–0.8–0.4
00.20.40.60.81–1
–0.5
0
0.5
1
Z7 Coma in x Z8 Coma in y Z9
–1
–0.5
0
0.5
1
–1–0.8–0.4
00.20.40.60.81–1
–0.5
0
0.5
1
–1
–0.5
0
0.5
1
–1–0.8–0.4
00.20.40.60.81–1
–0.5
0
0.5
1
–1
–0.5
0
0.5
1
–1–0.8–0.4
00.20.40.60.81–0.4–0.2
00.20.40.60.8
1
Z10 Z11 Z12 Spherical aberration
–1
–0.5
0
0.5
1
–1–0.8–0.4
00.20.40.60.81–1
–0.5
0
0.5
1
–1
–0.5
0
0.5
1
–1–0.8–0.4
00.20.40.60.81–1
–0.5
0
0.5
1
–1
–0.5
0
0.5
1
–1–0.8–0.4
00.20.40.60.81–1
–0.5
0
0.5
1
Z13 Z14 · · · Z25 Example of 6th order
With the wavefront, the optical properties of the system in question areknown. For example the Strehl ratio can be determined. The peak to valleyvalue Γ of the wavefront is sufficient to estimate the minimum Strehl ratio.For a given Γ < λ the minimum Strehl ratio i is [2]:
i = 0.5(cos 2πΓλ
+ 1) (2.8)
An even better estimate of the Strehl ratio can be done using the wavefrontroot-mean-square deviation from the mean σ. It can be shown [6] that for

2 Optical Quality of the Human Eye 35
Fig. 2.13. Modulation transfer function based on measurements on two eyes. Pupil-diameter is in both cases 6mm
small aberrations the Strehl ratio is:
i ≈(
1− 2π2(
σλ
)2)2
(2.9)
Thus for small aberrations 3 the Strehl ratio depends only on the (root) meansquare of the wavefront, not on the specific shape of the particular aberration.As an example we present plots from typical MTFs measured on two eyes(Fig. 2.13) and a 3-dimensional representation of a PSF also from a patientseye (Fig. 2.14).
2.5 Simulations
The Snellen Es have one disadvantage: because of the strong grey ramp ofthe letter, its direction can still be estimated from when the single lines
3 not much larger than λ10
Fig. 2.14. Point spread function based on measurements on a patients eye. Pupil-diameter is 6mm

36 J.F. Bille et al.
Fig. 2.15. Construction of a Landolt C for testing 20/20 visual acuity
Fig. 2.16. Unaberrated Vision Chart

2 Optical Quality of the Human Eye 37
Fig. 2.17. Vision Chart for 0.5 diopters defocus (without Styles-Crawford effect)
are already blurred. This is the reason that we used Landolt charts in thesimulations of the following chapters.
We used a vision chart with Landolt rings as optotypes (see Fig. 2.5),where the width of the gap and the line is a fifth of the symbol size. For thelines corresponding to visual acuity of 0.5 to 1.0 the horizontal and verticalspacing between the symbols is twice the size of the optotypes and for thelines for testing visual acuity better than 1.0 the spacing is 15 arcminutes.Since our interest lays on the normal and supernormal acuity, our vision charthas its main focus on these chart lines (see Fig. 2.16).

38 J.F. Bille et al.
This vision chart has been convolved with different Point Spread Func-tions of predetermined aberrations or patient eyes, so that the outcome rep-resents the image of the chart as it is projected on the retina.
We then simulated the correction with different segmented active mirrors,where the submirror size, the gap-size and gap-reflectivity, an estimated sub-mirror curvature and some amplitude of noise in the submirror height couldbe accounted for. The used parameters correspond to the measured charac-teristics and the given specifications of the manufacturer. The first simulation(see Fig. 2.17) shows the effect of half a diopter of defocus on the quality ofthe image transmission through the optical apparatus of the eye.

2 Optical Quality of the Human Eye 39
Fig. 2.18. Vision Chart for 0.5 diopters defocus (with Styles-Crawford effect)
In Fig. 2.18 a simulation of the Styles-Crawford effect of the first kind onthe previous chart is shown. This effect has its origin in the waveguide natureof the photoreceptors, so that light passing through the center of the pupil isperceived brighter than light passing through the edges. It can be modeledas a filter, which is placed in front of the pupil with an exponential form:exp(−peR
2), where R is the distance from the center and pe is a coefficientbetween 0.1 and 0.2 (see [1] for details). Note that the image turned sharperand the phenomenon of contrast inversion occurs at smaller Vision Acuity.In the following simulations this effect was taken into account.

40 J.F. Bille et al.
Fig. 2.19. Vision Chart for a 20/10 eye (with Styles-Crawford effect)
Fig. 2.19 shows the vision chart as it is projected on the retina of a 20/10eye-patient, whose aberrations were previously determined.

2 Optical Quality of the Human Eye 41
Fig. 2.20. Vision Chart for a 20/10 eye (with Styles-Crawford effect) correctedwith a segmented active mirror. The mirror parameters were mirrorsize 37µ m,width of the arms 3µ m, noise in the stroke amplitude 30 nm and a PV of also30 nm per submirror
In Fig. 2.20 we can see the same eye but now after simulating a correc-tion with a segmented active mirror, using the measured characteristics andparameters specified by the manufacturer.

42 J.F. Bille et al.
Fig. 2.21. Vision Chart for a 20/20 eye (with Styles-Crawford effect)
The next chart, Fig. 2.21, shows the image for a 20/20 eye, an eye withnormal (100%) vision. We notice how degraded the projection on its retinais. It is important to keep in mind, that the neuronal processing of the imagecan correct for the double images, with the knowledge of the pattern to berecognised, and can still distinguish the position of the gap, until it is opticallyimpossible.

2 Optical Quality of the Human Eye 43
Fig. 2.22. Vision Chart for a strong aberrated eye (with Styles-Crawford effect)
In Fig. 2.22 we used the parameters of a patient with a strongly aberratedeye, which had been submited to refractive surgery. The eye was misalignedduring the procedure resulting in a dramatic degradation of the transmittedimage. In the next chart, Fig. 2.23, we see the correction of the aberrations ofthis eye, with the same mirror parameters as before in Fig. 2.20. The resultis a sharp image, allowing great increase in visual acuity.

44 J.F. Bille et al.
Fig. 2.23. Vision Chart for a strong comatic eye (with Styles-Crawford effect) aftercorrection with a segmented mirror (see legend from Fig. 2.20)
References
1. D. A. Atchison, A. Joblin, G. Smith Influence of Styles-Crawford effectapodization on spatial visual performance. J. Opt. Soc. Am A. 15, No.9, 2545(1998)
2. A. van den Bos Aberration and Strehl Ratio. J. Opt. Soc. Am A 17, No.2, 356(2000)
3. W. N. Charman Visual Optics and Instrumentation. Volume 1 of Vision and
Visual Dysfunction. first edition. (1991)4. J. Liang, B. Grimm, S. Goelz, J. Bille Objective measurements of the wave
aberrations of the human eye with a Hartman-Shack wavefront sensor. J. Opt.Soc. Am A 11, 1949 (1994)
5. J. Liang, D. R. Williams Aberrations and retinal image quality of the normalhuman eye. J. Opt. Soc. Am A 14, 2873 (1997)

2 Optical Quality of the Human Eye 45
6. A. Marechal Etude des effets combins de la diffraction et des aberrationsgomtriques sur limage dun point lumineux. Rev. Opt. Thorique Instrum. 26,257 (1947)
7. P. M. Prieto, F. Vargas-Martın, S. Goelz, P. Artal Analysis of the performanceof the Hartmann-Shack sensor in the human eye. J. Opt. Soc. Am A 17, No.8,1388 (1997)
8. L. N. Thibos, R. A. Applegate, J. T. Schwiegerling, R. Webb et al. Standardsfor Reporting the optical Aberrations of Eyes. in Vision Science and Its Ap-
plications. Opt. Soc. Am. Technical Digest. Opt. Soc. Am. 146–149 (2000)9. G. Walsh, W. N. Charman, H. C. Howland Objective technique for the deter-
mination of monochromatic aberrations of the human eye. J. Opt. Soc. Am.A 1, No.9, 987 (1984)
10. J. Y. Wang, D.E. Silva Wave-front interpretation with Zernike polynomials.Appl. Opt. 19, No.9, 1510 (1980)
11. D. R. Williams Aliasing in human foveal vision. Vision Res. 25, 195 (1985)12. F. Zernike Beugungstheorie des Schneidenverfahrens und seiner verbesserten
Form, der Phasenkontrastmethode. Physica. 94, 689 (1934)