Embed Size (px)
Citation preview
Big Data for Big Business?A Taxonomy of Data-driven Business Models used by Start-up FirmsPhilipp Max Hartmann, Mohamed Zaki, Niels Feldmann and Andy NeelyThis is a working paper
Why this paper might be of interest to Alliance Partners:
This paper reports a study which provides a series of implications that may be particularly helpful to companies already leveraging ‘big data’ for their businesses or planning to do so. The Data Driven Business Model (DDBM) framework represents a basis for the analysis and clustering of business models. For practitioners the dimensions and various features may provide guidance on possibilities to form a business model for their specific venture. The framework allows identification and assessment of available potential data sources that can be used in a new DDBM. It also provides comprehensive sets of potential key activities as well as revenue models.
The identified business model types can serve as both inspiration and blueprint for companies considering creating new data-driven business models. Although the focus of this paper was on business models in the start-up world, the key findings presumably also apply to established organisations to a large extent. The DDBM can potentially be used and tested by established organisations across different sectors in future research.
March 2014Find out more about the Cambridge Service Alliance:
Linkedin Group: Cambridge Service Alliance www.cambridgeservicealliance.org
The papers included in this series have been selected from a number of sources, in order to highlight the variety of service related research currently being undertaken within the Cambridge Service Alliance and more broadly within the University of Cambridge as a whole.
© Cambridge Service Alliance 2014
1
Big Data for Big Business? A Taxonomy of Data-driven Business Models used by Start-up Firms
Philipp Max Hartmann1, Mohamed Zaki2, Niels Feldmann1 and Andy Neely2
1Karlsruhe Institute of Technology, Karlsruhe, Germany, 2University of Cambridge, United Kingdom
The purpose of this paper is to propose a taxonomy of business models used by start-up firms that rely on data as a resource of major importance for their business – aka data-driven business models (DDBMs). Furthermore, it proposes a DDBM framework to systematically analyse and compare DDBMS in the start-up world. To develop the taxonomy of DDBM, business model descriptions of a random sample of 100 start-up firms were coded using a DDBM framework, comprising of six dimensions with in total 35 features, derived from literature. By a subsequent application of clustering algorithms to the coded descriptions different types of business model were identified. Case studies of four companies from the sample were conducted to validate the findings. The taxonomy derived from our research consists of six different types of start-up DDBM. These types are characterised by a subset of six of nine clustering variables from the DDBM framework. The paper helps not only future researchers to structure their work around data-driven business models but also companies to build new DDBMs. The proposed taxonomy will help companies to position their activities in the current landscape. This paper explores how start-up business models capture value from big data. A proposed taxonomy consisting of six types of start-up business model is developed. The paper also introduces the DDBM framework with which the business models can be studied and analysed.
1. Introduction The exponential growth of available and potentially valuable data compounded by the Internet, social media, cloud computing and mobile devices – often refered to as big data, has an embedded value potential that must be commercialised. Correspondingly, the quote ‘Data is the new oil’ (WEF, 2011; Rotella, 2012) became widespread and established the analogy to natural resources needing to be exploited and refined to guarantee growth and profit. Some studies estimate an increase of annually created, replicated and consumed data from around 1,200 exabytes in 2010 to 40,000 exabytes in 2020 (Gantz and Reinsel, 2012). In some industries, such as financial services, big data has spurred entirely new business models. For example, algorithmic trading now analyses massive amounts of market data on a minute-by-minute basis, identifying opportunities to capture value almost instantly – a process unheard of a decade ago. In the retail sector, big data expedites analysis of in-store purchasing behaviours in near real-time. With such quick insight into demand shifts, stores can adjust merchandise, stock levels, and prices to maximise sales (Hagen et al., 2013). The CEBR (2012) has speculated that the benefits of big data innovation opportunities are projected to contribute £24 billion to the UK economy between 2012 and 2017, while the increased prospects for small start-up creation are projected to be worth £42 billion. New jobs related to big data are estimated to reach 58,000 over the
2
same period. Consequently, the research council of UK Digital Economy (NEMODE, 2014) commissioned research exploring the role of big data today and in the future to enable new economic and business models. In terms of exploiting data as a resource, a recent study by Kart et al. (2011) involving 720 IT and business leaders ranks the issue of monetising data-related offers – capturing value – over questions of technical feasibility. Hence, building on Manyika et al. (2011) and Chesbrough and Rosenbloom (2002), business models supporting data-related ventures to capture value, subsequently called data-driven business models (DDBM), are needed. Notably, scholars have published surprisingly little on this topic. Hence, understanding what business models relying on data look like remains a research question. Criscuolo et al. (2012) state that new technologies and innovations are often first commercialised through start-up companies. Therefore, leveraging the advantage of starting from a blank page instead of being constrained by the existing business, these young companies create a rich variety of presumably purer business models. Hence, they provide a promising basis for the identification of a DDBM taxonomy. According to recent figures from venture capitalists, over 90 per cent of start-ups fail (Rao, 2013). However, start-ups with DDBM are still relatively young, and distinguishing successful from unsuccessful companies is not yet possible. Thus, this paper contributes to closing this literature gap and focuses on identifying the different types of data-driven business model in the start-up scene – paying attention to their commercialisation approach, but irrespective of their current financial success. As a starting-point for the study, a framework of dimensions and features, which are particularly insightful when assessing data-driven business models, is derived from existing business model research (e.g. Chesbrough and Rosenbloom, 2002; Osterwalder, 2004; Johnson et al., 2008). This framework is used to code a sample of over three hundred publicly available documents describing the business models of 100 start-ups taken from a leading portal for business angels and venture capitalists. Established clustering algorithms applied to the results of the coding process lead to six DDBM types characterised by distinct combinations of dimensions and features from the proposed framework. In a series of interviews with start-up representatives from the sampling the patterns are confirmed by comparing the algorithmically identified clusters with the competitive landscape sketched by the interviewees. The remainder of this paper is organised as follows. The next section provides an overview of the existing literature from business model to big data research. The concept of a data-driven business model is established, gaps in literature pointed out and research questions for this paper derived. Section three explains the overall research strategy, describes the development of the business model framework, including the dimensions required for the coding of the ‘start-up’ descriptions, and introduces the algorithms used for the subsequent clustering of the coding results. Next, the study’s results, as well as managerial implications, are presented and discussed. The final section concludes the paper, points out limitations, and suggests follow-on research. 2. Literature and research questions
2.1 Existing business model literature The existing literature around business models has evolved significantly during recent years and the concept is now used in the context of e-business, strategy, and innovation
3
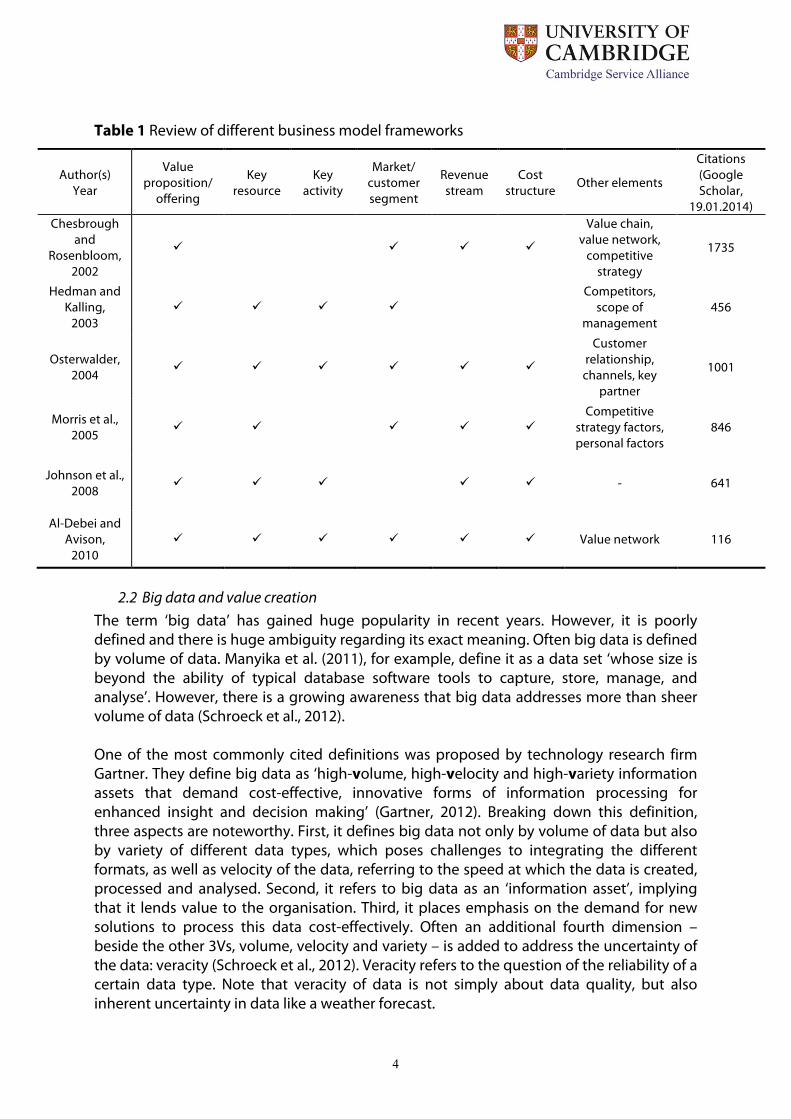
management (Zott et al., 2011). However, academic consensus on the definition, as well as the question of how to represent a business model, is still missing (Weill et al., 2011; Zott et al., 2011; Burkhart et al., 2011). Several authors have proposed different ways to represent a business model. Frequently, a component-based perspective is used to describe the business model (Burkhart et al., 2011). One of the first business model frameworks was provided by Chesbrough and Rosenbloom (2002). They describe the concept of a business model by the functions it fulfils. A business model articulates the value proposition of a company, ‘i.e. the value created for users by the offering based on the technology’. It further identifies a market segment, namely, ‘the users to whom the technology is useful and for what purpose, and specify the revenue generation mechanism(s) for the firm’. Another framework was proposed by Hedman and Kalling (2003), drawing on both strategy theory and related business model research. In particular, they integrated different components from strategy theory: ‘Customers and competitors (industry), the offering (generic strategy), activities and organisation (the value chain), the resource-base (resources) and the source of resources and production inputs (factor markets and sourcing), as well as the process by which a business model evolves.’ Based on these components, they propose a seven-component framework, consisting of (1) customers, (2) competitors, (3) offering, (4) activities and organisation, (5) resources, and (6) supply of factor and production inputs, as well as longitudinal process component (7) to ‘cover the dynamics of the business model over time and the cognitive and cultural constraints that managers have to cope with’. In their 2008 Harvard Business Review article, Johnson et al. (2008) proposed a business model framework consisting of four interlocking components: the customer value proposition comprises the important problem or need satisfied through an offering for the targeted customers; the profit formula defines how the company creates value for itself and consists of the revenue model, cost structure, margin model and resource velocity; key resources are those needed to deliver the value proposition. Possible key resources could be the technology, people, brand or partnerships. This does not include generic resources, which every company has but which do not create competitive advantage; and key processes, the necessary processes to profitably deliver the value proposition. In the start-up and corporate world, Osterwalder’s practitioner-oriented business model canvas (Osterwalder et al., 2010) – based on his business model ontology (Osterwalder, 2004) – is widely applied (Stuckenberg et al., 2011). Based on a review of existing business model literature, Osterwalder (2004) synthesised a business model framework consisting of nine building-blocks, namely, value proposition, key processes, key resources, key partners, customer relationships, channels, customer segment, revenue streams, cost structure. Furthermore, frequently cited business model frameworks were proposed by Morris et al. (2005) and more recently by Al-Debei and Avison (2010).
4
Table 1 Review of different business model frameworks
Author(s) Year
Value proposition/
offering
Key resource
Key activity
Market/ customer segment
Revenue stream
Cost structure Other elements
Citations (Google Scholar,
19.01.2014) Chesbrough
and Rosenbloom,
2002
ü
ü ü ü
Value chain, value network,
competitive strategy
1735
Hedman and Kalling,
2003 ü ü ü ü
Competitors, scope of
management 456
Osterwalder, 2004
ü ü ü ü ü ü
Customer relationship, channels, key
partner
1001
Morris et al., 2005
ü ü
ü ü ü Competitive
strategy factors, personal factors
846
Johnson et al., 2008
ü ü ü
ü ü - 641
Al-Debei and Avison,
2010 ü ü ü ü ü ü Value network 116
2.2 Big data and value creation
The term ‘big data’ has gained huge popularity in recent years. However, it is poorly defined and there is huge ambiguity regarding its exact meaning. Often big data is defined by volume of data. Manyika et al. (2011), for example, define it as a data set ‘whose size is beyond the ability of typical database software tools to capture, store, manage, and analyse’. However, there is a growing awareness that big data addresses more than sheer volume of data (Schroeck et al., 2012). One of the most commonly cited definitions was proposed by technology research firm Gartner. They define big data as ‘high-volume, high-velocity and high-variety information assets that demand cost-effective, innovative forms of information processing for enhanced insight and decision making’ (Gartner, 2012). Breaking down this definition, three aspects are noteworthy. First, it defines big data not only by volume of data but also by variety of different data types, which poses challenges to integrating the different formats, as well as velocity of the data, referring to the speed at which the data is created, processed and analysed. Second, it refers to big data as an ‘information asset’, implying that it lends value to the organisation. Third, it places emphasis on the demand for new solutions to process this data cost-effectively. Often an additional fourth dimension – beside the other 3Vs, volume, velocity and variety – is added to address the uncertainty of the data: veracity (Schroeck et al., 2012). Veracity refers to the question of the reliability of a certain data type. Note that veracity of data is not simply about data quality, but also inherent uncertainty in data like a weather forecast.

5
Even though this definition provides a useful characterisation of ‘big data’, it still lacks clarity as it is challenging to come up with explicit distinctions between ‘high’ and ‘low’ values for the respective dimensions. Nevertheless, when talking about big data, this research follows the definition given by Gartner, as stated above. However, by definition, data-driven business models are not necessarily limited to companies using data that fulfils the 3/4-V criteria. Collecting, storing and analysing (big) data is not an end in itself for companies – they are interested in creating actual business value. Empirical evidence seems to prove that companies relying more on data-driven decision-making are performing better in terms of productivity and profitability (McAfee and Brynjolfsson, 2012). Davenport (2006) lists several examples of companies drawing competitive advantage from the use of data and analytics, such as Wal-Mart, which uses analytics to optimise its supply chain or Progressive, which uses analytics to improve pricing models. However, most of these cases are rather anecdotal; a comprehensive answer to the question of ‘where’ and ‘how’ big data is creating value is still lacking in the academic literature. Several practitioner papers and White Papers addressing these questions can be found from consulting companies (e.g. Hagen et al., 2013; Manyika et al., 2011; Schroeck et al., 2012), and from vendors (Petter and Peppard, 2012; CEBR, 2012). Synthesising the main ideas of those papers, two fields regarding how big data creates value for companies can be distinguished. On the one hand, (big) data is used for the incremental improvement and optimisation of current business practices and services; for example, through the optimisation of existing processes, the customer relationship, the innovation process and the collaboration of employees. On the other hand, new products and business models can be innovated based on the use of data. Few academic papers describe or analyse business models relying on data. One noteworthy exception is a paper from Otto and Aier (2013) describing different business models in the business partner data domain. This comprises ‘organization data (e.g. company names, addresses, and identifiers, but also industry classification codes), contact data (e.g. telephone numbers and e-mail addresses of companies), and banking information’. They used a case study approach, investigating six different companies in the business partner domain. Their sample comprised four of the ‘most important providers’ as well as two start-up companies. The business model framework by Hedman and Kalling (2003) was chosen to systematically describe and analyse the different cases. Building upon the service-oriented paradigm, several authors propose Data-as-a-service and Analytics-as-a-service as new service types. However, most of these papers focus on technical or organisational aspects (Delen and Demirkan, 2013; Stipic and Bronzin, 2012). An exception is provided by Chen et al. (2011), who focused on the analytics ecosystem. They proposed only two new types of business model relying on data. First, Data-as-a-service: ‘New forms of data services that aggregate and provide accesses to a wide range of public and private data by partnering with data providers, aggregators, and clients’ offering a ‘rich set of data processing, management, and access services’; and, second, Analytics-as-a-service: services like ‘Business Intelligence reporting, text analytics, and advanced analytics such as predictive modelling, all made in composable forms to allow for direct consumption, integration and customizations’.
6
The aforementioned literature highlights a general gap concerning ‘if’ and ‘how’ big data actually creates value for companies. Most of the literature on this topic is not academic but written or commissioned by consultancies (e.g. Manyika et al., 2011; Hagen et al., 2013) and IT vendors (e.g. Schroeck et al., 2012; Petter and Peppard, 2012). Obviously it is in their best interests to showcase the value creation potential of data use. Only a few academic papers, such as Otto and Aier (2013) and Chen et al. (2011) are identified as researching new business models that rely on data as a key resource. Building on the motivation and literature overview outlined above, we aim to contribute to answering the overarching research question: What types of business model are present among companies relying on data as a resource of major importance for their business (key resource)? More specifically: • What does a framework look like that allows systematic analysis and comparison of
data-driven business models? • What clusters of companies with similar business models exist in the identified sample? Although the term ‘data-driven business model’ has not yet been defined in the scholarly literature the term is commonly used by practitioners (e.g. in several blog entries, cf. Svrluga 2012 or Diebold 2012). Furthermore, the term was used as a call for a research grant by the British Research Council’s ‘New Economic Models in the Digital Economy’ (NEMODE) initiative and can therefore be considered on the edge of the establishment in the research community. This paper contributes by providing a definition of a data-driven business model as a business model that relies on data as a key resource. This definition has three implications. First, a data-driven business model is not limited to companies conducting analytics, but also includes companies that are ‘merely’ aggregating or collecting data. Second, a company may sell not just data or information, but also any other product or service that relies on data as a key resource. An example is a company called kinsa, which sells thermometers for the iPhone and provides a service to constantly monitor the body temperature. Third, it is obvious that any company uses data in some way to conduct business – even a small restaurant relies on the contact details of its suppliers and uses a reservation book. However, the focus lies on companies that are using data as a key resource for their business model.
3. Research design
3.1 Methodology The objective of this paper is to build a taxonomy of business models relying on data as a key resource in the start-up world. A taxonomy is an empirically derived classification scheme used in various scientific disciplines (Hambrick, 1984). A numerical method for deriving taxonomies is cluster analysis, which was also used in the present paper (Everitt et al., 2011).
7
In order to systematically analyse and compare the different companies and their respective business models, this paper proposes a data-driven business model framework. The framework aims to provide a set of possible attributes for every business model dimension to comprehensively describe any DDBM. The data-driven business model framework in this research was developed in two steps. First, based on a systematic literature review of existing business model frameworks, the dimensions of a business model were identified. Second, for each of the identified dimensions, a collectively exhaustive set of features was identified using literature from related disciplines, for example, data warehousing, business intelligence, data mining, and cloud-based business models. The proposed framework resembles a morphological box, where each business model can be described using the provided features in the different dimensions. However, a business model can have more than one feature in each dimension; for example, a company can use different data sources or perform different activities. Qualitative data from publicly available sources on 100 start-up companies from a random sample was collected. This data was analysed using the developed framework. To identify types across the 100 business models a k-medoids clustering algorithm was used. The dimensions of the data-driven business model framework (DDBM) were derived from a systematic review of six of the most important existing business model frameworks, measured by the number of citations, as shown in Table 1 in Chapter 2.1. Based on this review, the DDBM framework consists of six dimensions common to most of the business model frameworks, namely, key resources, key activities, value proposition, customer segment, revenue model and cost structure. For each of these six dimensions, features were derived from literature to be able to exhaustively describe the DDBM. 1. Key resources: Companies need resources to make their products or services and to create value (Wernerfelt, 1984). From a strategic management perspective, a resource is ‘anything that could be thought of as strength or a weakness of a given firm’ (Wernerfelt, 1984). More detailed firm resources include, among other things, ‘all assets, capabilities, organizational processes, firm attributes, information, knowledge controlled by a firm’ (Barney 1991). By definition a DDBM has data as a key resource. This does not imply that data is the only key resource of the respective business model, as companies might need other key resources to enable their business model. Given the research question, the focus of the key resource was on what kind of data is used by the specific company. Even though there is no single comprehensive overview of data sources for data-driven business models, several papers in related fields provide – mostly non-comprehensive and non-structured – lists of potential data sources or data types. Singh and Singh (2010), for example, list possible sources for data warehousing; Han et al. (2011) list several potential sources for data mining. In the context of big data Schroeck et al. (2012) list the different data sources that are collected and analysed by companies with ‘active big data efforts’. In the context of Web mining – a term coined to describe the use of data mining techniques on the Web – three main types of data source are distinguished (Kosala and Blockeel, 2000): Web usage data like server logs, Web content that has to be crawled to be accessible, and Web structure data. A more systematic framework to structure the different data types and sources used for business intelligence was provided
8
by Negash (2004), who divides structured (e.g. from the ERP system) and semi-structured data (e.g. conversations, spreadsheets, videos) and further distinguishes between internal and external data sources. In the field of ‘big data’, Gartner identified five different types of data source used to ‘exploit big data’ in a company (Buytendijk et al., 2013): ‘Operational data comes from transaction systems, the monitoring of streaming data and sensor data; Dark data is data that you already own but don't use: emails, contracts, written reports and so forth; Commercial data may be structured or unstructured, and is purchased from industry organisations, social media providers and so on; Social data comes from Twitter, Facebook and other interfaces; Public data can have numerous formats and topics, such as economic data, socio-demographic data and even weather data.’ Consolidating the different sources, the following seven data sources were identified, which can be divided into internal and external data sources. Internal sources include data that already exists in, or is currently created through, existing IT systems but which is not used (e.g. ERP, CRM data), and data generated for the specific purpose, either through Web tracking or any other physical tracking device, sensor or crowdsourcing; and data that is created through contribution by a broad, distributed set of contributors using the Web and social collaboration techniques (Gartner, 2013). External data comprises acquired data, which is commercially available and can be purchased from data providers, social media companies, and so on; data that is provided by customers and/or business partners and not available to the general public; and freely available data, which is publicly available with no direct costs. Freely available data can be further subdivided into three categories: open data, which is released, by definition, by ‘open data’, is free, downloadable, machine-readable, and structured without prior processing (Lakomaa and Kallberg, 2013); social media data from websites like Twitter, Facebook or YouTube; and Web-crawled data, which is publicly available but not in a database format. Therefore, it has to be gathered by an automated WebCrawler. Examples are any full text documents like blog entries, discussions or websites. 2. Key activities: Each company performs different activities to produce and deliver its offering. In traditional product-centric business models, the key value-creating activities can be described using the value chain (Porter, 1985). However, as the value chain concept is primarily geared to the physical world and treats information as a supporting element, rather than a source of value itself (Rayport and Sviokla, 1995), it is of limited use in the context of data-driven business models. Once again, no comprehensive collection of key activities of DDBMs is available. However, lists of data-related activities exist in server-related fields. There are several different process models in the domain of data mining, describing the steps and activities to be followed in the knowledge-discovery process (Cios, 2007). One of the earliest and most cited models is that presented by Fayyad et al. (1996). Their model consists of nine steps, from identifying the goal of the knowledge-discovery process to finally acting on the generated knowledge. Their process includes five data-related key activities: selection of a data set or subset of data on which analytics are to be performed; pre-processing and cleaning the data, which includes, among others, the removal of noise and selection of strategies to handle missing values; data reduction or transformation to reduce the number of variables; data mining is the actual application of a specific data-

9
mining algorithm or method to identify data patterns; and interpretation of the mined patterns. This can also include visualisation of the identified patterns. Another, similar knowledge-discovery process is presented by Han et al. (2011), who list seven key activities. In the context of big data, LaValle et al. (2011) list several analytic techniques that create value for companies. Based on their case study of business models in the data economy, Otto and Aier (2013) identified several key activities performed by the examined companies, including retrieving data, data mining and distribution thereof. Analytics activities can be further subdivided into three main categories: descriptive, predictive and prescriptive analytics. Descriptive analytics includes business reporting and answers the question, ‘What happened and/or what is happening?’ Predictive analytics concerns the use of machine learning techniques and mathematical models to predict the future outcome given the existing data inputs. Prescriptive analytics seeks to determine the optimal decision given a complex set of objectives, requirements and constraints with the goal of improving business performance (Delen and Demirkan, 2013). To develop a complete image of the key activities, the different activities were structured along the steps of the ‘virtual value chain’ (Rayport and Sviokla, 1995): gathering, organising, selecting, synthesising, and distributing. To gather data, a company can either generate the data itself internally or obtain the data from any external source (data acquisition). The generation can be done in various ways, either manually by internal staff, automatically through the use of sensors and tracking tools (e.g. Web-tracking scripts) or using crowdsourcing tools. For further activities the data may be transformed, cleaned or processed or data from different sources is aggregated. Insight is generated through analytics, which can be subdivided into: descriptive analytics, analytics activities that explain the past; predictive analytics, which predict/forecast future outcome; and prescriptive analytics, which predict future outcome and suggest decisions. In the last step of the ‘virtual value chain’ the data or insight might be visually represented, the data distributed or access to the data or analytics results provided, for example, through an API. 3. Offering/value proposition: The central dimension of all synthesised business model frameworks is the offering, which is often part of the more comprehensive dimension value proposition (Chesbrough and Rosenbloom, 2002; Osterwalder, 2004; Johnson et al., 2008). A value proposition can be defined as the ‘expression of the experience that a customer will receive from a supplier’s measurably value-creating’ (Barnes et al., 2009). It therefore follows that the value proposition is the value created for customers through the offering. As it is difficult to formalise and categorise the perceived value by the customer for any industry, the offering is further regarded in the framework. Following the definition of Knowledge Discovery in Databases the offering of a company can be divided into two categories: data and information/knowledge (Fayyad et al., 1996). A company can offer raw data that is primarily ‘a set of facts’ without an attached meaning (Fayyad et al., 1996). When data has been interpreted it becomes information or knowledge. Typically the output of any analytics activity attaches meaning to data. A third offering has to be added that accounts for companies offering a non-virtual product or service. Summing up, the following three offerings are distinguished: raw data; information or knowledge, which is data with interpretation, for example, the output of analytics or visualisation; and non-data product/service, any non-virtual offering.
10
4. Customer segment: This dimension deals with the target of the offer. There are several ways to segment customers. However, the most generic classification was used, dividing target customers into businesses (B2B) and individual consumers (B2C) (Morris et al., 2005; Osterwalder, 2004). In many cases, companies could target both, businesses and individual consumers. 5. Revenue model: In order to survive long term, every company has to have at least one revenue stream. Several different revenue models can be distinguished using (Osterwalder, 2004; Osterwalder et al., 2010) classifications. Seven revenue streams are identified: asset sale, giving away the ownership rights of a good or service in exchange for money; lending/renting/leasing, temporarily granting someone the exclusive right to use an asset for a defined period of time; licensing, granting permission to use a protected intellectual property like a patent or copyright in exchange for a licensing fee; a usage fee is charged for the use of a particular service; a subscription fee is charged for the use of the service; a brokerage fee is charged for an intermediate service; or advertising. 6. Cost structure: In order to create and deliver value to customers, a firm incurs costs for labour, technology, purchased products, and so on. Regarding the use of data to create value, it is asked whether a firm has a specific cost advantage regarding the use of data. Typically, a company would have a specific cost advantage if the data used in its product or service were created independently of the specific offering. An example of a company with such a cost advantage would be a car manufacturer using data automatically created and stored by the car’s electronics. On the other hand, a company like Automatic – a start-up providing analytics for car owners – has to capture the data through a specific hardware device connected to the car. Another example would be Twitter, which could use its own data without additional costs to provide an analytical service, while companies like Gnip – a start-up company providing social media analytics – has to buy the respective data from Twitter. Putting together the aforementioned six dimensions and the respective features leads to a full data-driven business model framework (DDBM), as shown in Figure 1, which can be used to comprehensively describe the business model of the sample companies. For each dimension, at least one feature has to be selected; however, a company can have more than one feature for any dimension.

11
Figure 1 The data-driven business-model framework (DDBM)
3.2 Sample and data collection The sample was drawn from a database called AngelList (www.angellist.com), created in 2009 to simplify matchmaking between angel investors and start-ups. AngelList provides
Data-‐driv
en business m
odel
Data sources
Internal Exis6ng data
Self-‐generated data
Crowd-‐sourced
Tracked, generated & other
External
Acquired data
Customer provided
Free available
Open data
Social media data
Web crawled data
Key ac6vity
Data genera6on Crawling
Tracking & crowdsourcing
Data acquisi6on
Processing
Aggrega6on
Analy6cs
Descrip6ve
Predic6ve
Prescrip6ve Visualisa6on
Distribu6on
Offering
Data
Informa6on/knowledge
Non-‐data product/service
Target customer B2B
B2C
Revenue model
Asset sale
Lending/ren6ng/leasing
Licensing
Usage fee
Subscrip6on fee
Adver6sing
Specific cost advantage
12
companies with the possibility to create a profile on their website, which can be followed by investors, potential employees and other interested persons (Wollan, 2011). For the purpose of this research, the sample was limited to companies from the category ‘big data’ or ‘big data analytics’. As of 20 July 2013, 1,329 companies on AngelList were tagged accordingly.1 In order to avoid a systematic bias and to achieve a representative sample allowing for generalisation, the samples have to be selected randomly (Flyvbjerg, 2006). The list of companies was arranged in a randomised order using RANDOM.ORG, a service that generates randomness via atmospheric noise. Companies were drawn from this list to obtain the total number of 100 sample companies. Therefore, through random sampling from an external data source, researcher bias through the selective choice of samples can be avoided (Johnson 1997). In the next step, data from publicly available sources was collected on the business models of 100 randomly selected start-up companies. This paper followed the approach used by Amit and Zott (2001), who analysed 59 e-business companies using publicly available data sources to explore the theoretical foundation of value creation in e-business. These start-up companies have been analysed using the developed data-driven business model (DDBM) framework. The data on the sampled companies was gathered using secondary data from publicly available sources. It is generally sufficient to describe the particular business models as follows: ‘Gross elements of business models are often quite transparent’ (Teece, 2010). Furthermore, the use of secondary data from reliable sources helps to ensure descriptive validity (Tashakkori and Teddlie, 2002). The most important data sources were company websites, where generally information about the companies’ offerings, core technology, pricing models and target customers can be found. Additional data was collected from news sources, including start-up focused online journals like TechChrunch or VentureBeat, as well as traditional newspapers and magazines like The New York Times, The Wall Street Journal or TIME magazine, accessed via a Factiva search. In total, 303 different documents were collected in order to analyse the 100 different start-up business models, using on average more than three different sources for the coding of one business model.
3.3 Coding process The data was analysed using the developed DDBM. The documents were manually searched for statements indicating particular features of the framework and coded accordingly. Coding is the ‘process of attaching labels to a segment or a phrase that summarises and categorises this data’ (Lapan et al., 2012). The qualitative data analysis software Nvivo 10 was used for coding purposes. Each document was manually searched for relevant statements indicating a particular feature of the DDBM framework. The documents were coded by two independent coders. In order to ensure reliability of the coding, the different features of the framework were clearly defined prior to coding. However, some of the business model dimensions, being more ambiguous, required judgement and were therefore more prone to coding errors (Cooper, 1988). This was especially true for the dimension offering, as the decision about when a company is offering data or information is vague. However, the case studies showed for a small subset of the sample that the coding was widely correct, indicating reliability of the coding. 1 This is the number of unique companies tagged with any of these tags. As companies can have multiple tags, the sum of the number of companies in each category is higher but this includes duplicates.
13
After coders A and B performed the manual annotation process, all coders met to compare coding and to resolve disagreements; one of the paper authors (the judge), whose role was to moderate and generate agreement, chaired the meeting. This procedure is necessary when interpretation of textual data can cause disagreement between coders (Fastoso and Whitelock, 2010), and its utilisation is beneficial. After finishing the coding, each company was checked to see if all dimensions of the framework were sufficiently covered. If necessary additional data was collected. If no information for a particular dimension was found it was coded as such (e.g. for a relevant share of companies no information on the revenue model was available). The output of this process were binary feature vectors 𝑏𝑚! = 𝑓!,… , 𝑓!" , 𝑓! = 1 𝑜𝑟 0,∀ 𝑗 = {1,… 36} for all companies 𝑖 ∈ 1,… , 100 representing the respective business models, where 𝑓! = 1 indicates that a specific business model feature is present and 𝑓! = 0 that it is absent.
3.4 DDBM cluster analysis To identify the different clusters of data-driven business models in the context of start-ups, the researchers conducted cluster analysis. The aim of cluster analysis is to discover distribution patterns and to identify interesting correlations among data attributes (Han and Kamber, 2006). Clustering follows a four-stepped process (Ketchen and Shook, 1996; Mooi and Sarstedt, 2011)): selection of clustering variables, choice of clustering algorithm and similarity measure to be used, choice of number of clusters, and validation and interpretation of the clustering result. The first and essential question in the clustering process is which variables to choose in order to determine affiliation to a group. Only those variables should be selected that are believed to help determine the underlying clustering in the data, as adding irrelevant variables can ‘dramatically interfere with cluster recovery’ (Miligan, 1996). One important issue when selecting the number of variables is sample size. The selection of more variables requires an over-proportional increase in items to ensure validity of the result from a statistical perspective (Mooi and Sarstedt, 2011). In general it is recommended to have a sample size of at least 2m where m equals the number of clustering variables (Mooi and Sarstedt ,2011). Based on the sample size of the present research (n=100) and these criteria, a good number of variables is six (26 = 64) or seven (27 = 128). Often authors use factor analysis, usually a principal component prior to clustering to reduce the number of dimensions. However, unless theory suggests that objects and clusters are better represented through the factors, this should be avoided (Miligan, 1996). If in doubt, clustering the raw data directly is the superior alternative (Dolnicar and Grün, 2008). Clustering variables for the paper were selected using the DDBM framework. Based on frequency analysis of the different dimensions and features the clustering variables were reduced to ‘data source’ and ‘key activity’ as the most significant dimensions. For 36 per cent of the companies in the sample no information on the revenue model was available and for those where data was available, 83 per cent of the companies used either a subscription or usage-fee-based revenue model. Therefore, this dimension lacked discriminatory power and was not further regarded for clustering. The same applied to the dimension offering: in total, 94 per cent of the companies were classified to offer information or knowledge. As no specific cost advantage could be identified during coding, the dimension ‘cost structure’ was also further disregarded. Furthermore, the features were limited to the second level in the framework (e.g. no differentiation between the type of analytics) to reduce the number of variables.
14
Based on this pre-selection, the following nine variables were used for clustering: data source: acquired data; customer provided data; free available data; tracked and generated data; crowdsourced data key activity: aggregation; analytics; data acquisition; data generation. Based on the intended outcome of the cluster analysis – mutually exclusive sets of similar business models to identify distinctive types – a partitioning method was selected. In particular, the k-medoids clustering algorithm was used for clustering. The k-medoids algorithm groups n objects into k clusters by minimising the sum of dissimilarity between each object 𝑝 and its corresponding representative object 𝑜! (medoid) for all objects in cluster 𝐶! (Han et al., 2011):
min𝐸 = 𝑑𝑖𝑠𝑡(𝑝, 𝑜!)!∈!!
!
!!!
.
Unlike the k-mean algorithm, where clusters are represented by the mean value of the data points in the cluster, the representative object or medoid of the k-medoids algorithm is an actual data object, namely the most centrally located object within the cluster (Pham and Afify, 2007). The k-medoids algorithm was selected over the more common k-means algorithm because it provides a more meaningful solution, as the cluster representatives (medoids) are actually observed business models from the sample. Furthermore, the k-medoids algorithm is less sensitive to outliers (Han et al., 2011). One of the decisive questions when selecting a binary similarity measure is whether the fact that two business models both do not have a particular feature, is relevant to determining their similarity, namely, if negative matches d should be regarded (Everitt et al., 2011). For the present research it was assumed that the co-absence of features is relevant for the similarity of two business models; the fact that two companies are not performing analytics is indicative of their similarity. In particular, the Euclidean distance measure was used, which implicitly includes positive and negative matches by determining the distance only based on mismatches b and c (Choi et al., 2010):
𝑑𝑖𝑠𝑡 = 𝑥 − 𝑦 ! = 𝑥! − 𝑦! ! +⋯+ 𝑥! − 𝑦! ! = 𝑏 + 𝑐
One fundamental question when using a partitioning clustering method is to determine the number of clusters – the ‘k’ in k-medoids. Again, there is no right or wrong answer to this question as clustering is an unsupervised learning technique. In general, selecting the number of clusters is a trade-off between having a reasonably large number of clusters to reflect the specific differences in the data set and having significantly less clusters than data points, as this is the motivation for cluster analysis (Han et al., 2011). Several different approaches exist to determine the number of clusters and it is generally advisable to compare the results of different methods (Pham et al., 2005; Mooi and Sarstedt, 2011; Han et al., 2011):
Han et al. (2011) provide a rule of thumb to set the number of clusters to !!
with n being
the number of samples in the data set. Based on this criteria seven would be an appropriate number of clusters. Another option to determine the number of clusters is the so-called ‘elbow method’2 (Mooi and Sarstedt, 2011). Hierarchical clustering is conducted first and the number of clusters is 2 Different descriptions of this method exist (cf. Han et al., 2011; Ketchen and Shook 1996). However, the basic idea remains the same.
15
plotted against the agglomeration coefficient, the distance at which two cases or clusters are merged to form a new cluster. This plot is then searched for a distinctive break (‘elbow’). The idea behind this method is that a cluster solution should be selected in which an additional combination of two clusters occurs at a great distance – this is indicated in the plot by an ‘elbow’. Using this approach shows that there is no clear elbow signifying an appropriate number of clusters. However, the plot reveals several important points about the sample and the number of different clusters. First, there should be no more than 48 clusters in total, as clusters with zero distance are then split up. Furthermore, small ‘elbows’ can be identified indicating 7, 16 and 23 as favourable cluster numbers. Moreover, several statistical tests exist to determine the number of clusters (Pham et al., 2005). In the present research the silhouette coefficient was used (Rousseeuw, 1987). The silhouette determines for any given object i how well it is assigned to its cluster compared to the closest neighbouring cluster. Kaufman and Rousseeuw (1990) provide indications to interpret the silhouette coefficient. Accordingly, a silhouette coefficient above 0.71 indicates that a strong structure was found, between 0.51 and 0.7 that a reasonable structure was found, and between 0.25 and 0.5 that a weak structure was found. For all values below 0.25 it has to be assumed that no underlying cluster structure exists. However, these values are not theoretically defined but based on the experience of the authors. The silhouette coefficient reveals that there seems to be no strong natural clustering; however, it indicates that there should be at least six different clusters. Taking together the different numbers of clusters, resulting from the different methods, seven was selected as an appropriate number of clusters. Validating the clustering solution is an indispensable step of any clustering process to ensure that the clustering result is meaningful and useful (Ketchen and Shook, 1996). First, the reliability or stability of the clustering solution must be evaluated. Repeating the clustering with different clustering algorithms, in particular a hierarchical clustering method, proved the stability of the cluster solution, as objects were assigned to a similar cluster. The clustering solution was validated in two ways: on the one hand, the internal cluster quality was determined using the silhouette coefficient (Han et al., 2011); on the other hand, the significance of the clusters was reviewed through case studies. Based on the value of the silhouette coefficient, 0.335, the clustering can be considered weak, which is nonetheless typical for social science data and does not invalidate the clustering findings (Hambrick, 1984). The last step is interpretation of the clustering solution. This was done through a comparison of the different clusters, as well as a detailed analysis of the companies in the particular clusters. As a result of this analysis, six of the seven clusters proved to be meaningful. 4. Results and discussion
4.1 Data sample analysis Based on the coding of the 100 companies, some general characteristics can be observed. First, looking at the data source it is noteworthy that most of the companies use external data sources (73%), 16 per cent use internal and external data sources, while 11 per cent use only internal data sources, that is, data they create themselves. Furthermore, most of the companies in the sample conduct analytics as a key activity (76%); however, only a small number perform ‘advanced’ analytics, either predictive (22%) or prescriptive (6%).

16
The vast majority of all examined companies rely on a subscription (62% of all companies with information on the revenue model) or a usage fee-based revenue model (20%). However, for more than one-third of the analysed companies (36%), no information about the revenue model was available. This might be because the companies do not wish to reveal their revenue model or because many fledgling companies might not have implemented a way to monetise the business model. Overall, a noteworthy predominance of B2B business models within the examined companies can be observed. Over 80 per cent of the companies target business customers with their offerings (70% only B2B, and 13% both B2B and B2C). The vast majority of companies in the sample offer information or knowledge, which certainly relates to the selected sample: Web-based business models are predominant with start-ups on AngelList and therefore most of the offerings are also Web-based.
4.2 DDBM cluster results As a result of clustering, seven different clusters were identified, as shown in Table 2, characterised by their respective cluster medoids. The table lists the classification of the cluster medoids. This does not mean, however, that all companies in the particular cluster exactly match the respective business models. However, after analysing the seven different clusters by comparing companies in the respective cluster, only six (Types A–F) were further considered. It is important to note that, due to the relatively small sample size, all quantitative data on the percentage distribution of the different business model features is indicative but not statistically significant. The five companies in Cluster 3 did not show sufficient similarity and were therefore disregarded.
Table 2 DDBM cluster results and respective medoids
Cluster 1 2 3 4 5 6 7
Dat
a So
urce
Acquired data 0 0 1 0 0 0 0
Customer-provided data 0 1 1 0 0 1 1
Free available data 1 0 1 0 1 0 1
Crowd sourced 0 0 0 0 0 0 0
Tracked, generated & other 0 0 0 1 0 0 0
Key
Act
ivity
Aggregation 1 0 0 0 0 1 1
Analytics 0 1 1 1 1 0 1
Data acquisition 0 0 1 0 0 0 0
Data generation 0 0 0 1 0 0 1
Number of companies 17 28 5 16 14 6 14
Cluster Types A B - C D E F
This section presents some general statistics about the different dimensions (data source, key activity, revenue model, target customer, offering) of DDBMs from the 100 companies. When comparing the six different business model types by the data source on which they rely, four distinctive patterns are identifiable. Types ‘B’ and ‘E’ rely on data provided by customers and/or partners. Business models under types ‘A’ and ‘D’ rely on free available
17
data. Type ‘C’ relies on data generated through crowdsourcing or tracking. Type ‘F’ combines customer-provided and free available data sources. For example, 11 of 14 companies of Type F are using customer-provided data (=78.6%) and 13 are using free available data sources (=92.9%). Subsequently, 100 per cent signifies that all companies of this particular type are using this data source. Drilling down to the specific free available data sources used by the respective companies shows that those companies relying on free available data mostly use social media data. It is further noteworthy that more than half of the companies of Type F are obtaining their data through Web crawling. Looking at the key activities performed by the different types of company also reveals distinctive patterns. The business model types are mainly characterised by the three key activities ‘aggregation’, ‘analytics’ and ‘data generation’. Three distinctive patterns are identifiable for the two activities, ‘analytics’ and ‘aggregation’. Types ‘A’ and ‘E’ rely on aggregating data from different sources. Types ‘B’, ‘C’ and ‘D’ only conduct analytics without aggregation. Type ‘F’ conducts both aggregation and analytics. For the activity ‘data generation’ the picture is less unambiguous: while all companies of Type ‘F’ generate data, and this type is subsequently characterised by this activity, in addition a fraction of companies of other types perform this activity (Type F: 57%; Type D: 50%; Type A: 35%). The activity of distribution, which includes providing access via an application programming interface (known as API), correlates to a large extent with ‘aggregation’ and therefore further supports the characteristic of respective business model Types A and E: those companies aggregate data from external or internal sources and thus provide better or easier access to this data. As discussed above, most of the companies rely on a subscription or a usage-fee based revenue model. A small deviation is determinable for companies in Type ‘C’, who generate revenue from asset sales. This follows mainly from the sale of devices to generate the necessary data. It is further noteworthy that companies in Types B and E rely entirely on a subscription or usage-fee revenue model, which emphasises the ‘as-a-service’ characteristic of these business models. Slicing the data in a different way reveals that the selected revenue model depends more on the targeted customers than on business model type. While 98 per cent of all B2B business models use either a subscription or a usage fee-based revenue model, those companies targeting consumers use diverse ways to generate revenue: advertising (27%), asset sales (27%) and brokerage fees (18%). Overall, a predominance of B2B business models within the examined companies can be observed. Over 80 per cent of the companies target business customers with their offerings (70% only B2B, and 13% both B2B and B2C). However, the split varies between the different clusters. While the vast majority of companies of Types ‘B’, ‘D’ and ‘F’ target business customers, half of all companies of Type ‘C’ target consumers. The vast majority of companies in the sample offer information or knowledge. This certainly relates to the selected sample: Web-based business models are predominant with start-ups on AngelList and therefore most of the offerings are also Web-based. Some exceptions can be found in Types ‘A’ and ‘F’, where companies provide raw data; and in Types ‘C’ and ‘D’, where companies use data and analytics for an offering not related to data or information. However, based on the difficulties of differentiating the three
18
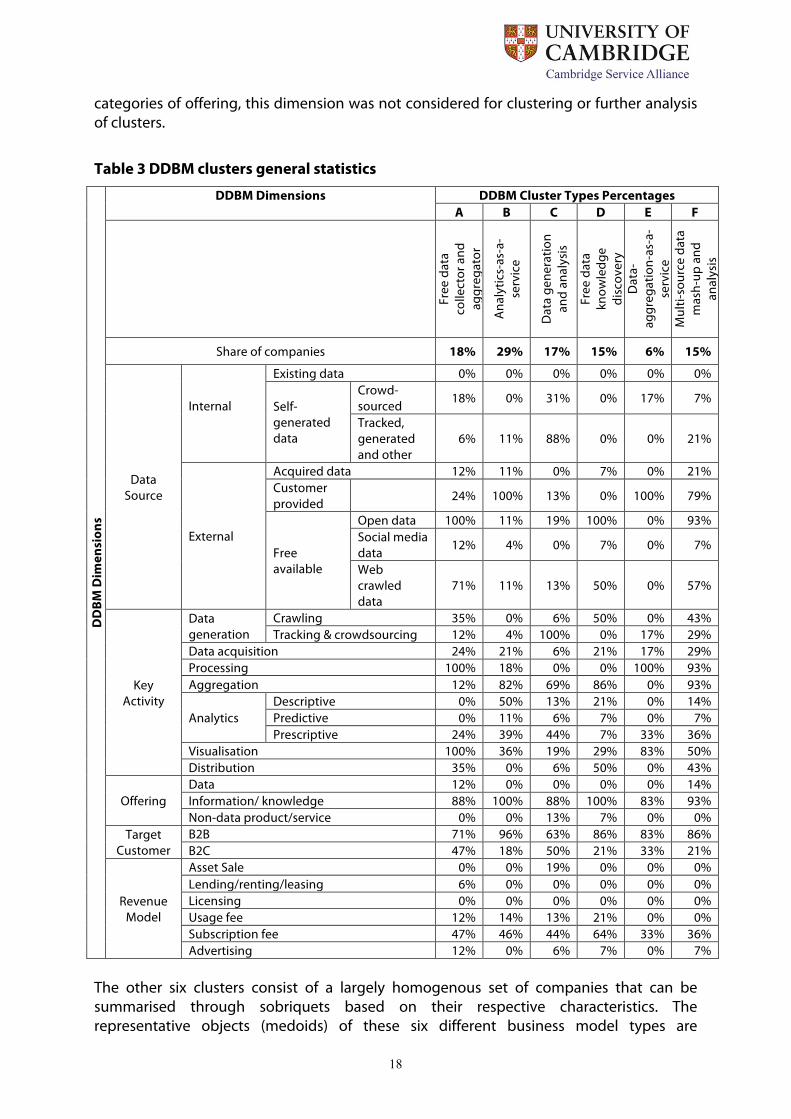
categories of offering, this dimension was not considered for clustering or further analysis of clusters.
Table 3 DDBM clusters general statistics
DD
BM D
imen
sion
s
DDBM Dimensions DDBM Cluster Types Percentages A B C D E F
Free
dat
a co
llect
or a
nd
aggr
egat
or
Anal
ytic
s-as
-a-
serv
ice
Dat
a ge
nera
tion
and
anal
ysis
Free
dat
a kn
owle
dge
disc
over
y D
ata-
aggr
egat
ion-
as-a
-se
rvic
e M
ulti-
sour
ce d
ata
mas
h-up
and
an
alys
is
Share of companies 18% 29% 17% 15% 6% 15%
Data Source
Internal
Existing data 0% 0% 0% 0% 0% 0%
Self-generated data
Crowd-sourced 18% 0% 31% 0% 17% 7%
Tracked, generated and other
6% 11% 88% 0% 0% 21%
External
Acquired data 12% 11% 0% 7% 0% 21% Customer provided 24% 100% 13% 0% 100% 79%
Free available
Open data 100% 11% 19% 100% 0% 93% Social media data 12% 4% 0% 7% 0% 7%
Web crawled data
71% 11% 13% 50% 0% 57%
Key Activity
Data generation
Crawling 35% 0% 6% 50% 0% 43% Tracking & crowdsourcing 12% 4% 100% 0% 17% 29%
Data acquisition 24% 21% 6% 21% 17% 29% Processing 100% 18% 0% 0% 100% 93% Aggregation 12% 82% 69% 86% 0% 93%
Analytics Descriptive 0% 50% 13% 21% 0% 14% Predictive 0% 11% 6% 7% 0% 7% Prescriptive 24% 39% 44% 7% 33% 36%
Visualisation 100% 36% 19% 29% 83% 50% Distribution 35% 0% 6% 50% 0% 43%
Offering Data 12% 0% 0% 0% 0% 14% Information/ knowledge 88% 100% 88% 100% 83% 93% Non-data product/service 0% 0% 13% 7% 0% 0%
Target Customer
B2B 71% 96% 63% 86% 83% 86% B2C 47% 18% 50% 21% 33% 21%
Revenue Model
Asset Sale 0% 0% 19% 0% 0% 0% Lending/renting/leasing 6% 0% 0% 0% 0% 0% Licensing 0% 0% 0% 0% 0% 0% Usage fee 12% 14% 13% 21% 0% 0% Subscription fee 47% 46% 44% 64% 33% 36% Advertising 12% 0% 6% 7% 0% 7%
The other six clusters consist of a largely homogenous set of companies that can be summarised through sobriquets based on their respective characteristics. The representative objects (medoids) of these six different business model types are
19
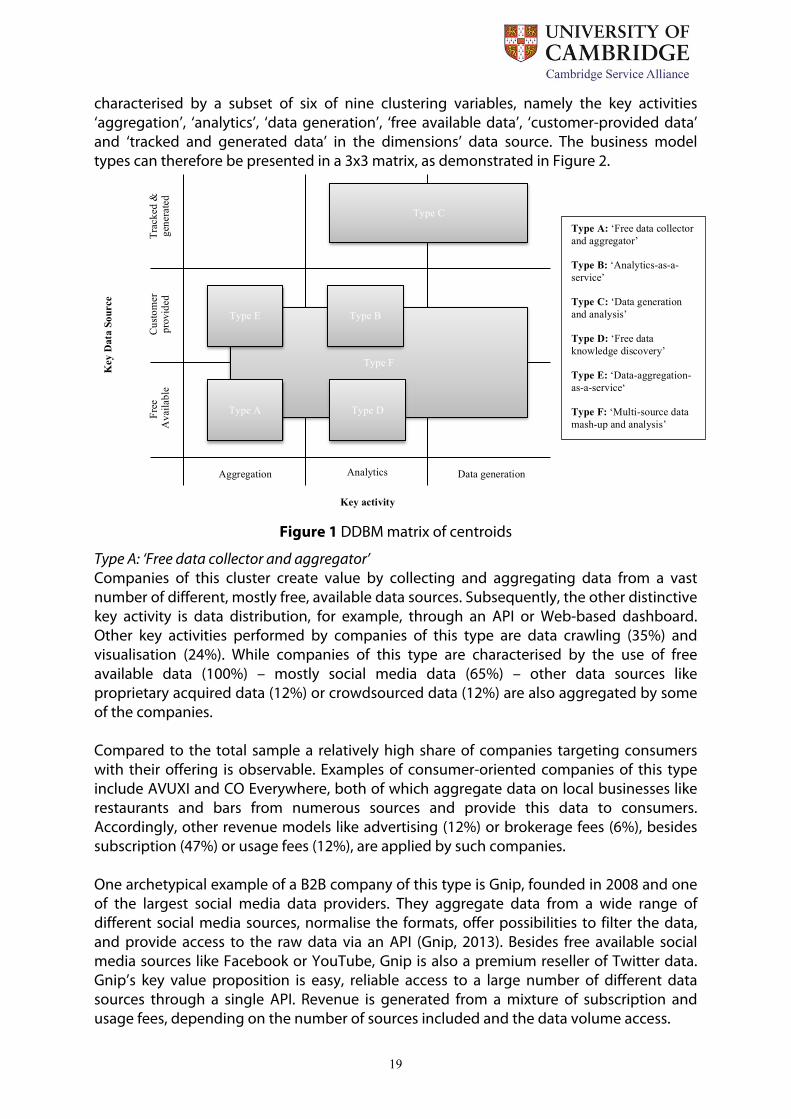
characterised by a subset of six of nine clustering variables, namely the key activities ‘aggregation’, ‘analytics’, ‘data generation’, ‘free available data’, ‘customer-provided data’ and ‘tracked and generated data’ in the dimensions’ data source. The business model types can therefore be presented in a 3x3 matrix, as demonstrated in Figure 2.
Figure 1 DDBM matrix of centroids
Type A: ‘Free data collector and aggregator’ Companies of this cluster create value by collecting and aggregating data from a vast number of different, mostly free, available data sources. Subsequently, the other distinctive key activity is data distribution, for example, through an API or Web-based dashboard. Other key activities performed by companies of this type are data crawling (35%) and visualisation (24%). While companies of this type are characterised by the use of free available data (100%) – mostly social media data (65%) – other data sources like proprietary acquired data (12%) or crowdsourced data (12%) are also aggregated by some of the companies. Compared to the total sample a relatively high share of companies targeting consumers with their offering is observable. Examples of consumer-oriented companies of this type include AVUXI and CO Everywhere, both of which aggregate data on local businesses like restaurants and bars from numerous sources and provide this data to consumers. Accordingly, other revenue models like advertising (12%) or brokerage fees (6%), besides subscription (47%) or usage fees (12%), are applied by such companies. One archetypical example of a B2B company of this type is Gnip, founded in 2008 and one of the largest social media data providers. They aggregate data from a wide range of different social media sources, normalise the formats, offer possibilities to filter the data, and provide access to the raw data via an API (Gnip, 2013). Besides free available social media sources like Facebook or YouTube, Gnip is also a premium reseller of Twitter data. Gnip’s key value proposition is easy, reliable access to a large number of different data sources through a single API. Revenue is generated from a mixture of subscription and usage fees, depending on the number of sources included and the data volume access.
Type F
Type A Type D
Type E Type B
Type C
Aggregation Analytics Data generation
Free
A
vaila
ble
Cus
tom
er
prov
ided
Tr
acke
d &
ge
nera
ted
Key activity
Key
Dat
a So
urce
Type A: ‘Free data collector and aggregator’ Type B: ‘Analytics-as-a-service’ Type C: ‘Data generation and analysis’ Type D: ‘Free data knowledge discovery’ Type E: ‘Data-aggregation-as-a-service‘ Type F: ‘Multi-source data mash-up and analysis’

20
Type B: ‘Analytics-as-a-service’ The second cluster comprises companies providing analytics as a service. These companies are characterised by conducting analytics (100%) on data provided by their customers (100%). Further noteworthy activities include data distribution (36%), mainly through providing access to the analytics results via an API and visualisation of the analytics results (36%). In addition to the data provided by customers, some companies in this cluster also include other data sources, mainly to improve the analytics. Sendify, for example, a company providing real-time inbound caller scoring, also joins external demographic data with inbound call data to improve the analysis. The scope of the different analytic services varies from fraud detection (e.g. Sift Science, BillGuard) over improving marketing activities (e.g. 7signal, Retention Science, Mineful), improving customer service and relationships (e.g. Preact, Sendify), increasing sales (e.g. Granify) to generic data analysis (e.g. Augify). Companies of this type primarily target business customers with their solution. Hence, the revenue model is predominantly based on subscription or usage fees. While most of the companies provide descriptive analytics, some companies also use more advanced predictive or prescriptive analytics techniques. Online shopping analytics company Granify, for example, tries to predict which customers are going to leave a Web shop without buying and automatically shows them a message or discount code to influence their purchase probability (Granify, 2013). Type C: ‘Data generation and analysis’ Companies in this cluster all share the common characteristic that they generate data themselves rather than relying on existing data. Subsequently, all companies in this cluster share the key activity ‘data generation’. Besides generating data, most of the companies also perform analytics on this data. Within the cluster, companies can be roughly subdivided into three groups: companies that generate data through crowdsourcing; Web analytics companies; and companies that generate data through smartphones or other physical sensors. An example of a company generating data through crowdsourcing is Swarmly, which provides a smartphone application where users can share their current location and provide details of their sentiments about the venue. Swarmly aggregates this data to provide a real-time map of popular venues like bars, restaurants or clubs (Swarmly, 2013). The second group comprises companies like GoSquared, Mixpanel or Spinnakr, which basically provide a Web analytics service. Therefore, they collect data through a tracking code embedded in their customers’ websites. The data is collected and analysed and reports or raw data are provided through a Web-based dashboard or other interfaces. The third group are companies that collect data through any physical device, including smartphone sensors. An example of such a company is Automatic, which sells a device that can be plugged into the car’s data port and submits data via Bluetooth to the driver’s smartphone. Automatic collects and analyses this data to provide feedback on driving style. Both B2C and B2B business models can be found in this cluster. As some companies in this cluster sell physical devices for data collection (e.g. Kinsa sells thermometers for the
21
iPhone, Automatic a small data logger for the car), some generate revenue from asset sales. Type D: ‘Free data knowledge discovery’ The companies in this cluster are characterised by the use of free available data and analytics performed on this data. Furthermore, as not all free data sources are available in a machine-readable format, some such companies crawl data from the Web (data generation 50%). An archetypical example of a ‘free data knowledge discovery’ company of this type is Gild, which provides a service for companies by helping them to recruit developers. To identify talented programmers, Gild automatically evaluates the code they publish on open source sites like GitHub or Google Code, as well as their contribution on Q&A websites like Stack Overflow. Based on this evaluation, a score is created that expresses the strength of a developer and allows hidden talents to be identified (Gild, 2013). Although the companies in this cluster are homogenous regarding key data sources and key activities, the specific offerings vary significantly: automated monitoring of review sites for hotels (Olery); recommendation of hotel deals based on monitoring and analysing of different booking websites (DealAngel); identifying relevant social media influencers (Traackr, PeerIndex). Subsequently, B2B and B2C business models can be found in this cluster. The type of analytics performed by these companies also varies. While most of the companies perform only descriptive analytics, some use more advanced analytics techniques. TrendSpottr, for example, seeks to identify emerging trends on real-time data streams like Twitter or Facebook before they reach mainstream awareness by using predictive analytics (trendspottr, 2013). Insightpool goes one step further by trying not only to identify potential customers on social media platforms, but also proactively engaging with those targets (insightpool, 2013). A variety of revenue models exists within the companies in this cluster. Besides the subscription or usage-fee-based models, those companies targeting consumers also rely on revenue from advertising or brokerage fees. For example, DealAngel provides its service free of charge for consumers and receives a commission from the booking websites if people actually book a hotel. Type E: ‘Data-aggregation-as-a-service‘ Companies in this cluster create value neither by analysing nor creating data but through aggregating data from multiple internal sources for their customers. This cluster can therefore be labelled ‘aggregation-as-a-service’. After aggregating the data, the companies provide the data through various interfaces (distribution: 83%) and/or visualise it (33%). The areas of application are focused mostly on aggregating customer data from different sources (e.g. Bluenose) or from individuals (e.g. Who@) within an organisation. Other companies focus on specific segments or problems. AlwaysPrepped, for example, helps teachers to monitor their students’ performance by aggregating data from multiple education programmes and websites. Similar to Type B (‘analytics-as-a-service’), the revenue models of such companies are primarily subscription-based and mainly business customers are targeted.
22
Type F: ‘Multi-source data mash-up and analysis’ Cluster F contains companies that aggregate data provided by their customers with other external, mostly free, available data sources, and perform analytics on this data. The offering of companies in this cluster is characterised by using other external data sources to enrich or benchmark customer data. A typical example of a business model of this type is Welovroi, a Web-based digital marketing monitoring and analysing tool that allows tracking of a large number of different metrics based on data provided by customers. However, Welovroi also integrates external data and allows benchmarking of the success of marketing campaigns. Other examples include FarmLogs, online farm management software that not only allows storage of their own data but also integrates external data such as weather and market price; and Next Big Sound, a music analytics tool that combines proprietary data with external data sources as count of views on YouTube or Likes on Facebook. Such business models mostly target business customers and accordingly revenue models are mostly subscription-based.
4.3 Validation To validate the DDBM framework, coding and the identified business model types, case interviews were conducted with four companies (Agile, Opensignal, GoSquared, MixRank) from the sample. The companies in the case studies were selected randomly from the overall sample, which ‘lends more validation strength’. We interviewed the CEOs of the four companies using a semi-structured interview. Questions covered the company’s value proposition, business model, core competitor, data sources, coding cross-checking, missing components in framework, most important component/competitive advantage, mapping of key activities and challenges, data ownership and cost structure. The case studies aim to confirm business models used by these companies and further explore the different business model types in case the secondary data were not sufficient to map the company’s business model accurately. AGILEci provides payment data analytics as a service for SME retailers and is therefore an example of a Type B business model. AGILE’s CEO confirmed the coding process and Type B represents the company’s business model. The CEO stated: ‘We take the complexity and hassle away from payment companies to develop a value added solution that they can charge their clients for.’ However, he emphasised the importance of distinguishing between vertical and horizontal service offering. AGILE focuses on vertical service offering (SME retail customers), while most of the large competing analytics providers such as IBM offer horizontal solutions for different industries. Regarding the key activities dimension, he confirmed that most activities are around descriptive plus predictive analytics, as have been classified, but they also conduct some aggregation and prescriptive analytics. He further stated: ‘We’re creating rules for companies based on the descriptive and predictive analytics in particular around recommendations. For example stop buying size 40” to a clothing retailer.’ In the data source dimension, AGILE currently does not use other data sources besides data obtained from its customers. However, the CEO said that they plan to consider external data: ‘There are plans to include weather data to compare patterns.’ The company revenue model is generated through a subscription model, based on data size and number of users.

23
GoSquared is a real-time Web analytics service that has been classified under Type C. Successfully, the CEO confirmed the business model and described it thus: ‘It is correct as we save customers a lot of time and a lot of effort in understanding and analysing their data and taking all that work away from them by doing it themselves.’ All dimensions have been mapped correctly, but it is worth mentioning that at the moment GoSquared performs descriptive analytics only, which is what we mapped. However, the CEO stated that ‘it is planning to move in the direction of predictive and prescriptive analytics’. Interestingly, GoSquared identified several challenges related to its key activities and data sources. It sees challenges concerning obtaining the required data. The CEO’s concerns ‘over Internet privacy are growing, legislation is increasingly restricting the possibilities of Web tracking’. Furthermore, he sees a growing challenge in terms of collecting data from the social media websites as providers are creating ‘walled gardens’, which could force the company to think of alternatives. OpenSignal is crowdsourcing data on network coverage through its mobile app, which has also been classified under the Type C business model. The CEO confirmed the business model and stated that their value proposition is as follows: ‘Through the use of crowdsourced data, OpenSignal can provide much closer insight into the true experience on the network than has been available through existing methodologies.’ All dimensions have been mapped correctly, but OpenSignal has some challenges regarding data sources. The CEO said: ‘To create valuable insight that it can sell to the network operators, it needs a large amount of data and a wide geographical coverage. To generate this data it is dependent on the consumers that have to download and regularly use the app.’ Therefore, OpenSignal wants to ensure that it provides an incentive to consumers to generate data even though they are not its primary customers. MixRank is a Web-based competitive intelligence tool for advertising, which is mapped to the Type D business model. The CEO stated the business mode as follows: ‘MixRank tracks millions of ads through crawling public[ly] available websites. This data is automatically analysed and categorised. Customer can get access to this data for a monthly subscription fee.’ Overall, the framework proved to be a suitable tool to map the business models of the case companies. All relevant features of the companies were covered to a large extent. However, the case interviews revealed that the value proposition of the different companies could not be represented precisely enough. This issue should be addressed if the framework is used for further research. Furthermore, the case studies showed that the data collected from publicly available sources was largely accurate. Additional information could only be collected on the revenue model, when no publicly available information was available (e.g. AGILE and OpenSignal). This further validates the approach to collecting data from publicly available sources. The clustering solution itself was verified through the case studies by letting the companies identify their key competitors, which should be in the same cluster. This was true for AGILE and GoSquared, confirming the clustering solution, while the competitors of the other two cases were mostly incumbents that were not included in the sample. However, it remains questionable whether it is possible to define a generic set of attributes that are applicable to all different data-driven business models and that allow extensive description of the companies’ value proposition. However, when the framework is applied to analysis of a specific industry, further specification of the value proposition might be feasible.
24
5. Managerial implications
The study provides a series of implications that may be particularly helpful to companies already leveraging ‘big data’ for their businesses or planning to do so. The DDBM framework, as depicted in Figure 1, represents a basis for the analysis and clustering of business models. For practitioners the dimensions and various features may provide guidance on possibilities to form a business model for their specific venture. The framework allows identification and assessment of available potential data sources that can be used in a new DDBM. Furthermore, it provides comprehensive sets of potential key activities as well as revenue models. Moreover, the identified business model types can serve as both inspiration and blueprint for companies considering creating new data-driven business models. The different types provide a systematic overview of the different ways to create DDBMs and the pattern can be translated to the specific company or industry. It also allows practitioners to position their own business in a competitive landscape and therefore provides the possibility to identify potential gaps in the market. In fact, regular updates of the study, combined with an increasing sample size, may in fact serve as a market research service. Although the focus of this paper was on business models in the start-up world, the key findings presumably also apply to established organisations to a large extent. However, certain key differences exist, which are both obstructive and also advantageous for established companies compared to start-up companies. On the one hand, start-up companies have the advantage that they can build their IT systems from scratch and do not face the challenge of legacy IT. On the other hand, however, established organisations can use a data source, which start-up companies do not have: data that they already own, incidentally created by existing business operations. The DDBM can potentially be used and tested by established organisations across different sectors in future research. 6. Conclusion This paper provides the first empirically derived taxonomy of data-driven business models (DDBMs) in the start-up world. Moreover, it presents a framework that allows analysis of DDBMs, which is also new to the academic world, and which may serve as a starting-point for further scholarly development. While the framework is deducted from the latest research on business model innovation and documented specificities of big data, the taxonomy results from the application of the framework to over 300 documents describing business models of start-ups leveraging data as the key resource of their business. The proposed DDBM framework, as well as the derived types of DDBM, is of potential benefit to practitioners working in the big data field. They allow them to position their business in a competitive landscape and therefore provide the possibility to identify potential gaps in the market. Moreover, the DDBM framework with its outlined dimensions and features can be used to – architecturally – create new business models for companies. This is particularly promising since only two of the five dimensions of the derived framework are currently used to shape business models. However, overall three types of limitation apply to the study and shall be addressed in future research: constraints
25
regarding (1) the diversity and (2) the sample size analysed, as well as (3) the application of a framework derived from literature. In terms of sample diversity, the study focuses on start-up companies taken only from the Business Angels’ and Venture Capitalists’ portal, AngelList. Retrieving companies from further portals might increase the diversity of the sample and therefore the variety of business models observed. Furthermore, the paper focused on start-ups only. Established companies incidentally creating and collecting data via their core business may as well lead to further types of business models. Regarding sample size, the coding approach relied on a significant amount of manual work, which restricted the number of cases that could be analysed. Consequently, the study was limited to 100 start-up companies, which did not allow testing of the study’s findings for external validity by using a split sample. Finally, the framework used for coding and clustering reduces the complexity of the companies to a limited number of binary features. While this supports the exploratory nature of the study it comes at the cost of potentially neglecting dimensions that are less prominently discussed in the literature. In terms of future research three levels of activities can be envisioned. On a more operational level, as indicated in the limitations, comprehending the overview on data-driven business models by increasing size and width of the sample or focusing on specific industries may lead to increasingly robust clusters. Longitudinal studies, in particular including (financial) performance indicators, may shed light on the dynamics and evolution of DDBMs. Finally, future work should also embrace a greater foresight perspective. So far, the study has identified clusters of currently existing data-driven business models. However, future business models are presumably not limited to these clusters. Hypothesising on successful future business models may hold valuable inspiration for research and practice.
References o Al-Debei, M. and Avison, D. (2010), “Developing a unified framework of the business
model concept”, European Journal of Information Systems, Vol. 19 No. 3, pp. 359–376. o Amit, R. and Zott, C (2001), “Value creation in E-business”, Strategic Management
Journal, Vol. 22, No. 6, pp. 493–520. o Barnes, C., Blake, H. and Pinder, D. (2009), Creating & delivering your value proposition.
Managing customer experience for profit, Kogan Page, London. o Barney, J. (1991), “Firm Resources and Sustained Competitive Advantage”, Journal of
Management, Vol. 17, No. 1, pp. 99–120. o Burkhart, T., Krumeich, J., Werth, D and Loos, P. (2011): “Analyzing the Business Model
Concept – A Comprehensive Classification of Literature” ICIS 2011 Proceedings. o Buytendijk, F., Kart, L., Laney, D., Jacobson, S., Lefebure, S. and Hetu, R. (2013), “Toolkit:
Big Data Business Opportunities From Over 100 Use Cases”, Gartner (G00252112). o CEBR (2012), “Data equity – Unlocking the value of big data”, Centre for Economics and
Business Research Ltd. o Chen, Y., Kreulen, J., Campbell, M. and Abrams, C. (2011), “Analytics Ecosystem
Transformation: A Force for Business Model Innovation”, in SRII Global Conference 2011, pp. 11–20.
26
o Chesbrough, H.; Rosenbloom, R. (2002), “The role of the business model in capturing value from innovation: Evidence from Xerox Corporation's technology spin-off companies”, Industrial and Corporate Change, Vol. 11, No. 3, pp. 529–555.
o Choi, S., Cha, S. H. and Tappert, C. (2010), “A Survey of Binary Similarity and Distance Measures”, Journal on Systemics, Cybernetics and Informatics, Vol. 8, No. 1, pp. 43–48
o Cios, K. J. (2007), Data mining. A knowledge discovery approach, Springer, New York. o Criscuolo, P., Nicolaou, N. and Salter, A.(2012), “The elixir (or burden) of youth?
Exploring differences in innovation between start-ups and established firms”, Research Policy, Vol. 41, No. 2, pp. 319–333.
o Davenport, T.H. (2006), “Competing on analytics”, Harvard Business Review, Vol. 84, No. 1, p. 98.
o Delen, D. and Demirkan, H. (2013), “Data, information and analytics as services”, Decision Support Systems, Vol. 55, No. 1, pp. 359–363.
o Diebold, S. (2012), “Know the difference between data-informed and versus data-driven”, available at http://stevendiebold.com/know-the-difference-between-data-informed-and-versus-data-driven/ (accessed 10/06/2013).
o Dolnicar, S., Grün, B. (2008), “Challenging ‘Factor–Cluster Segmentation’”. Journal of Travel Research, Vol. 47, No. 1, pp. 63–71.
o Everitt, B., Landau, S., Leese, M. (2011): Cluster analysis, Oxford University Press, London. o Fastoso, F. and Whitelock, J., (2010) “Regionalization vs Globalization in Advertising
Research: Insights from Five Decades of Academic Study”, Journal of International, Vol. 16, No. 1, pp 32-42.
o Fayyad, U., Piatetsky-Shapiro, G. and Smyth, P (1996), “From Data Mining to Knowledge Discovery in Databases”, AI Magazine, Vol. 17, pp. 37–54.
o Gantz, J. and Reinsel, D. (2012), “The digital universe in 2020: Big Data, Bigger Digital Shadows, and Biggest Growth in the Far East”, IDC.
o Gartner (2012), “IT Glossary – Big Data”, available at http://www.gartner.com/it-glossary/big-data/ (accessed 5/06/2013).
o Gartner (2013), “IT Glossary – Crowdsourcing”, available at http://www.gartner.com/it-glossary/crowdsourcing (accessed on 12/08/2013).
o Gild (2013), “Gild Source Features”, available at www.gild.com/gild-source-tech-recruiting/know-whos-good/ (accessed on 25/07/13).
o Gnip (2013), “Gnip – Product Overview”, available at www.gnip.com/product_overview/ (accessed on 25/07/13).
o Granify (2013), “Granify – home”, available at www.granify.com (accessed on 28/07/13). o Hagen, C., Khan, K., Ciobo, M., Miller, J., Wall, D., Evans, H., Yadava, A. (2013): “Big Data
and the Creative Destruction of Today's Business Models”, ATKearney. o Hambrick, D.C. (1984), “Taxonomic Approaches to Studying Strategy: Some Conceptual
and Methodological Issues”, Journal of Management, Vol. 10, No. 1, pp. 27–41. o Han, J. and Kamber, M. (2006), Data mining. Concepts and techniques, Elsevier; Morgan
Kaufmann, San Francisco, CA. o Han, J.; Kamber, M. andPei, J. (2011), Data Mining. Concepts and Techniques, Elsevier
Science, Burlington.
27
o Hedman, J. and Kalling, T. (2003): The business model concept: Theoretical underpinnings and empirical illustrations, European Journal of Information Systems, Vol. 12, No. 1, pp. 49–59.
o insightpool (2013), “Find Brand Champions to Drive Your Social Bottom Line”, available at www.insightpool.com/the-process/b2c/ (accessed on 13/08/2013).
o Johnson, M.W., Christensen, C. and Kagermann, H. (2008), “Reinventing your business model”, Harvard Business Review, Vol. 86, No. 12, pp. 57–68.
o Johnson, R. (1997), “Examining the validity structure of qualitative research”, Education, Vol. 118, p. 282.
o Kart, L., Heudecker, N. and Buytendijk, F. (2013), “Survey Analysis: Big Data Adoption in 2013 Shows Substance Behind the Hype”, Gartner.
o Kaufman, L. and Rousseeuw, P. J. (1990), Finding groups in data. An introduction to cluster analysis, Wiley-Interscience, Hoboken, NJ.
o Ketchen, D.J.; Shook, C.L. (1996), “The Application of Cluster Analysis in Strategic Management Research: An Analysis and Critique”, Strategic Management Journal, Vol. 17, No. 6, pp. 441–458.
o Kosala, R. and Blockeel, H. (2000), “Web Mining Research: A Survey”, SIGKDD Explor. Newsl., Vol. 2, No. 1, pp. 1–15.
o Lakomaa, E.; Kallberg, J. (2013), “Open Data as a Foundation for Innovation: The Enabling Effect of Free Public Sector Information for Entrepreneurs”, Access IEEE, Vol. 1, pp. 558–563.
o Lapan, S., Quartaroli, M. and Riemer, F. (2012), Qualitative research. An introduction to methods and designs, Jossey-Bass, San Francisco.
o LaValle, S, Lesser, E., Shockley, R., Hopkins, M.S. and Kruschwitz, N. (2011), “Big data, analytics and the path from insights to value”, MIT Sloan Management Review, Vol. 52, No. 2, pp. 21–32.
o Manyika, J., Chui, M., Brown, B., Bughin, J., Dobbs, R., Roxburgh, C. and Hung Byres, A. (2011): “Big data: The next frontier for innovation, competition, and productivity”, McKinsey Global Institute.
o McAfee, A., Brynjolfsson, E. (2012), “Big Data: The Management Revolution”, Harvard Business Review, Vol. 10.
o Miligan, G.W. (1996), “Clustering Validation: Results and Implications for Applied Analyses”, in Arabie, P., Hubert, L.J., de Soete, G. (Eds.), Clustering and classification, World Scientific, Singapore, pp. 341–376.
o Mooi, E. and Sarstedt, M. (2011), “Cluster Analysis”, in A Concise Guide to Market Research, Springer, Berlin Heidelberg, pp. 237–284.
o Morris, M., Schindehutte, M. and Allen, J. (2005): “The entrepreneur's business model: Toward a unified perspective”, Special Section: The Nonprofit Marketing Landscape, Vol. 58, No. 6, pp. 726–735.
o Negash, S. (2004), “Business Intelligence”, Communications of the Association for Information Systems, Vol. 13, pp. 177–195.
o Osterwalder, A. (2004), “The Business Model Ontology. A Proposition in Design Science Research”, these. Ecole des Hautes Etudes Commerciales de l’Université de Lausanne.
28
o Osterwalder, A., Pigneur, Y. and Clark, T. (2010), Business model generation. A handbook for visionaries, game changers, and challengers, Wiley, Hoboken, NJ.
o Otto, B. and Aier, S. (2013), “Business Models in the Data Economy: A Case Study from the Business Partner Data Domain”, Proceedings of the 11th International Conference on Wirtschaftsinformatik (WI 2013) in Leipzig, Vol. 1, pp. 475–489.
o Petter, J. and Peppard, J. (2012), “Harnessing the Growth Potential of Big Data. Why the CEO Must Take the Lead”, EMC.
o Pham, D. T.; Afify, A. A. (2007), “Clustering techniques and their applications in engineering” Proceedings of the Institution of Mechanical Engineers, Part C: Journal of Mechanical Engineering Science, Vol. 221, No. 11, pp. 1445–1459.
o Pham, D. T.; Dimov, S. S.; Nguyen, C. D. (2005), “Selection of K in K-means clustering”, In Proceedings of the Institution of Mechanical Engineers, Part C: Journal of Mechanical Engineering Science, Vol. 219, No. 1, pp. 103–119.
o Porter, M. (1985), Competitive advantage. Creating and sustaining superior performance. Collier Macmillan,New York, London.
o Rao, L. (2013), “Paul Graham: 37 Y Combinator Companies Have Valuations Of Or Sold For At Least $40M”, Techcrunch.com, 26 May, available at http://techcrunch.com/2013/05/26/paul-graham-37-y-combinator-companies-have-valuations-of-or-sold-for-at-least-40m/ (accessed 07/02/2014).
o Rayport, J. F. and Sviokla, J.J. (1995), “Exploiting the Virtual Value Chain”, Harvard Business Review, Vol. 73, No. 6, pp. 75–85.
o Romesburg, H.C. (2004), Cluster analysis for researchers, Lulu Press, North Carolina. o Rotella, P. (2012), “Is Data The New Oil?”, Forbes, 2 April, available at
http://www.forbes.com/sites/perryrotella/2012/04/02/is-data-the-new-oil/ (accessed at 07/02/2014).
o Rousseeuw, P.J. (1987), “Silhouettes: A graphical aid to the interpretation and validation of cluster analysis”, Journal of Computational and Applied Mathematics, Vol. 20, pp. 53–65.
o Rust, R.T. (2014), “The Service Revolution and the Transformation of Marketing Science”, Marketing Science, forthcoming.
o Schroeck, M., Shockley, R., Smart, J., Romero-Morales, D. and Tufano, Peter (2012), “Analytics: The real-world use of big data. How innovative enterprises extract value from uncertain data”, IBM Institute for Business Value, Saïd Business School at the University of Oxford.
o Singh, R. and Singh, K. (2010) “A Descriptive Classification of Causes of Data Quality Problems in Data Warehousing“, IJCSI International Journal of Computer Science, Vol. 7, No. 3, pp. 41–50.
o Stipic, A. and Bronzin, T. (2012), H”ow cloud computing is (not) changing the way we do BI”, Proceedings of the 35th International Convention MIPRO 2012, pp. 1574–1582.
o Stuckenberg, S., Fielt, E. and Loser, T. (2011) “The impact of software-as-a-service on business models of leading software vendors: Experiences from three exploratory case studies“, Proceedings of the 15th Pacific Asia Conference on Information Systems (PACIS 2011), Queensland University of Technology.

29
o Svrluga, B. (2012), “Data Data Blah Blah – It Ain’t That Easy”, available at http://bradsvrluga.com/2012/03/27/data-data-blah-blah/ (accessed 4/06/2013).
o Swarmly (2013), “Swarmly – about”, available at www.swarmly.co/about (accessed 12/08/13).
o Tashakkori, Abbas; Teddlie, Charles (2002): Handbook of mixed methods, SAGE, London. o Teece, David J. (2010), “Business Models, Business Strategy and Innovation”, Long
Range Planning, Vol.43, No. 2–3, pp. 172–194. o trendspottr (2013), “Trendspottr – About Us”, available at
www.trendspottr.com/aboutus.php (accessed at 14/08/13). o WEF (2011), “Personal Data: The Emergence of a New Asset Class”, The World Economic
Forum. Available at http://www.weforum.org/reports/personal-data-emergence-new-asset-class (accessed 18/02/2014).
o WEF (2012) “Big Data, Big Impact: New Possibilities for International Development”, The World Economic Forum, available at http://www.weforum.org/reports/big-data-big-impact-new-possibilities-international-development (accessed 18/02/2014).
o Weill, P., Malone, T.W. and Apel, T. G. (2011), “The business models investors prefer”, MIT Sloan Management Review, Vol. 52, No. 4, p. 17.
o Wernerfelt, B. (1984), “A resource-based view of the firm”, Strategic Management Journal, Vol. 5, No. 2, pp. 171–180.
o Wollan, M. (2011), “Matchmaking for Web Start-Ups and Investors”, The New York Times, 07 March, pp. B3.
o Zott, C., Amit, R. and Massa, L. (2011), “The Business Model: Recent Developments and Future Research”, Journal of Management, Vol. 37, No. 4, pp. 1019–1042.