Embed Size (px)
Citation preview

1-1 Feasibility Report
TCE.10339A-CV-3000-FR-30001 (R0)
Bhopal Smart City Development Corporation Limited
BHOPAL SMART CITY DEVELOPMENT CORPORATION LIMITED
PROJECT DEVELOPMENT AND MANAGEMENT CONSULTANT FOR AREA BASED DEVELOPMENT PROJECT FOR BHOPAL SMART CITY
Feasibility Report
December 2016
TATA CONSULTING ENGINEERS LIMITED
247 Park, Wing A, 4th Floor, LBS Marg,
Vikhroli (W), Mumbai - 400 057
TCE.10339A-CV-3000-FR-30001 (R0)

1-2 Feasibility Report
TCE.10339A-CV-3000-FR-30001 (R0)
Bhopal Smart City Development Corporation Limited
REVISION STATUS
Do.
No.
Revision
No Prepared By
Checked
By
Passed
By
Submitted
On Purpose
1. R0
TG/DT/AD/SP/NK/SM/
SU/UNP/AK/JS/SG/AS/KS/JB
MB/RP/DS
PD PRN 21/12/2016 Submission

1-3 Feasibility Report
TCE.10339A-CV-3000-FR-30001 (R0)
Bhopal Smart City Development Corporation Limited
Contents BHOPAL SMART CITY DEVELOPMENT CORPORATION LIMITED ........................................................ 1-1
Feasibility Report ................................................................................................................................ 1-1
TATA CONSULTING ENGINEERS LIMITED ............................................................................................ 1-1
Background .................................................................................................................................... 1-11 Vision and Objectives ..................................................................................................................... 1-11 Scope of Feasibility Report ............................................................................................................ 1-12 Population projection for designing the infrastructure ................................................................. 1-12 Source: Consultant’s estimateLIST OF INFRASTRUCTURE PROPOSED ........................................... 1-13 Infrastructure explored for the ABD area are given below ........................................................... 1-14 Project area delineation ................................................................................................................. 1-14
1 Chapter 1 UTILITY DUCT ............................................................................................................. 1-16
1.1 Introduction ....................................................................................................................... 1-16 1.2 Comparison of direct burial and duct (utility tunnel) ........................................................ 1-16 1.3 Advantages of duct (utility tunnel) .................................................................................... 1-18 1.4 Disadvantages of duct (utility tunnel) ................................................................................ 1-18 1.5 National and international examples (utility tunnel) ......................................................... 1-19 1.6 Proposed Primary utility duct for Bhopal ABD area........................................................... 1-20 1.7 Scope and estimated budget ............................................................................................. 1-20 1.8 Proposed Secondary Utility Duct for Bhopal ABD Area ..................................................... 1-21 1.9 Cost Estimate ..................................................................................................................... 1-21 1.10 Recommendation ............................................................................................................... 1-21
2 Chapter 2 POWER SUPLY ........................................................................................................... 2-22
2.1 Introduction ....................................................................................................................... 2-22 2.2 Power demand norms ........................................................................................................ 2-22 2.3 Power demand calculation ................................................................................................ 2-23 2.4 Power source identification ............................................................................................... 2-23
2.4.1 Immediate Power requirement ................................................................................. 2-23
2.4.2 Permanent power requirement ................................................................................. 2-24
2.5 Power purchase options for permanent Supply ................................................................ 2-25 2.5.1 Option-1 ..................................................................................................................... 2-26
2.5.2 Option-2: .................................................................................................................... 2-26
2.6 Space Planning ................................................................................................................... 2-26 2.7 Salient features of power system ...................................................................................... 2-26 2.8 Block Cost ........................................................................................................................... 2-27
3 Chapter 3 Traffic and Transport ................................................................................................. 3-28
3.1 Road network and external connectivity ........................................................................... 3-28 3.2 Reconnaissance Survey ...................................................................................................... 3-28 3.3 Observations – reconnaissance survey .............................................................................. 3-28 3.4 Field studies and engineering surveys ............................................................................... 3-31
3.4.1 Topographic survey .................................................................................................... 3-31
3.4.2 Traffic surveys: field work .......................................................................................... 3-32

1-4 Feasibility Report
TCE.10339A-CV-3000-FR-30001 (R0)
Bhopal Smart City Development Corporation Limited
3.4.3 Location for survey ..................................................................................................... 3-32
3.5 Design Basis for Roads ....................................................................................................... 3-33 3.5.1 Objective .................................................................................................................... 3-33
3.5.2 Design basis and code for design standards .............................................................. 3-33
3.5.3 Classification of road network ................................................................................... 3-34
3.5.4 Design Controls .......................................................................................................... 3-35
3.5.5 Terrain classification .................................................................................................. 3-35
3.5.6 Right of way (row) and road length: .......................................................................... 3-35
3.5.7 Design speed .............................................................................................................. 3-35
3.5.8 Camber/cross fall ....................................................................................................... 3-38
3.5.9 Intersection ................................................................................................................ 3-38
3.5.10 Turning Radius ........................................................................................................... 3-38
3.5.11 Size of corner Island ................................................................................................... 3-39
3.6 Utilities ............................................................................................................................... 3-39 3.7 Pavement design standards ............................................................................................... 3-39 3.8 Comparison of flexible pavement and concrete pavement .............................................. 3-40 3.9 Pavement composition for flexible pavement ................................................................... 3-41 3.10 Proposed road network ..................................................................................................... 3-42 3.11 Design HFL and FRL Requirement ........................................................................................ 3-1 3.12 Slope protection ................................................................................................................... 3-1 3.13 Benching ............................................................................................................................... 3-1 3.14 Traffic Control Devices ......................................................................................................... 3-1 3.15 Initial construction cost estimates ....................................................................................... 3-1
3.15.1 General ......................................................................................................................... 3-1
3.15.2 Methodology ................................................................................................................ 3-1
3.15.3 Estimation of Quantities and Cost ............................................................................... 3-1
3.16 Summary of Cost Estimate ................................................................................................... 3-3 4 Chapter 4 WATER SUPPLY ............................................................................................................ 4-4
4.1 Introduction ......................................................................................................................... 4-4 4.2 Water Demand ..................................................................................................................... 4-4 4.3 Fire Demand ......................................................................................................................... 4-5 4.4 Other Demands .................................................................................................................... 4-6 4.5 Water Mass Balance ............................................................................................................ 4-6 4.6 Potable water supply system: .............................................................................................. 4-6
4.6.1 Option- 1: Distribution with gravity system by providing new ESR ............................. 4-6
4.6.2 Advantages / Disadvantages : ...................................................................................... 4-7
4.6.3 Option- 2: Distribution with Pumping System ............................................................. 4-7
4.6.4 Advantages / Disadvantages : ...................................................................................... 4-7
4.6.5 Option- 3: Distribution System with Existing ESR ........................................................ 4-8
4.7 Assumptions: ........................................................................................................................ 4-9 4.7.1 Advantages / Disadvantages : ...................................................................................... 4-9

1-5 Feasibility Report
TCE.10339A-CV-3000-FR-30001 (R0)
Bhopal Smart City Development Corporation Limited
4.8 Recommendation: .............................................................................................................. 4-10 4.9 Design criteria .................................................................................................................... 4-10
4.9.1 Transmission system: ................................................................................................. 4-10
4.9.2 Distribution system: ................................................................................................... 4-10
4.9.3 Pipe diameter ............................................................................................................. 4-10
4.9.4 Excavation depth ........................................................................................................ 4-10
4.9.5 Residual pressure: ...................................................................................................... 4-10
4.9.6 ‘C’ VALUE: ................................................................................................................... 4-11
Table 4-5 C value ............................................................................................................................... 4-11
4.9.7 SOFTWARE: ................................................................................................................ 4-11
4.9.8 Frictional loss formula: ............................................................................................... 4-11
4.9.9 Bedding: ..................................................................................................................... 4-11
4.9.10 Pumping system design: ............................................................................................ 4-11
4.9.11 Service Reservoirs: ..................................................................................................... 4-12
4.9.12 Losses: ........................................................................................................................ 4-12
4.9.13 Bulk meters: ............................................................................................................... 4-12
4.9.14 UFW monitoring and reduction: ................................................................................ 4-12
4.9.15 Valves: ........................................................................................................................ 4-13
4.10 Pipe material ...................................................................................................................... 4-13 Table 4-6 Pipe material selection summary ...................................................................................... 4-14
4.11 Cost estimates: ................................................................................................................... 4-14 4.12 Population and water demand: ......................................................................................... 4-14
5 Chapter Water Treatment Plant .................................................................................................. 5-1
5.1 Introduction ......................................................................................................................... 5-1 5.2 INLET WATER TO POLISHING WATER TREATMENT PLANT: ................................................. 5-1
5.2.1 Quantity: ...................................................................................................................... 5-1
5.2.2 Quality: ......................................................................................................................... 5-1
5.2.3 Polishing water quality standards: ............................................................................... 5-1
5.2.4 TREATMENT PROCESS: ................................................................................................. 5-1
5.3 Process considerations: ....................................................................................................... 5-3 5.3.1 Aeration ....................................................................................................................... 5-3
5.3.2 Coagulation and Flocculation ....................................................................................... 5-3
5.3.3 PAC: .............................................................................................................................. 5-4
5.3.4 Filtration ....................................................................................................................... 5-4
5.3.5 Disinfection: ................................................................................................................. 5-6
5.4 SELECTION OF PROCESS: ...................................................................................................... 5-8 5.5 Details of selected process: ................................................................................................. 5-9

1-6 Feasibility Report
TCE.10339A-CV-3000-FR-30001 (R0)
Bhopal Smart City Development Corporation Limited
6 Chapter 6 Storm Water Drainage .............................................................................................. 6-10
6.1 Proposed master Plan ........................................................................................................ 6-10 7 Chapter 7 Sewer Network .......................................................................................................... 7-15
7.1 General ............................................................................................................................... 7-15 SMART features adopted ........................................................................................................... 7-15
DESIGN YEAR .............................................................................................................................. 7-15
Waste Water Generation ........................................................................................................... 7-15
Waste Water Collection System ................................................................................................ 7-16
Network Design .......................................................................................................................... 7-17
Design Formula .......................................................................................................................... 7-17
Peak Factors ............................................................................................................................... 7-18
Self Cleansing Velocities ............................................................................................................. 7-18
Design Capacity of Sewers ......................................................................................................... 7-18
Depth of Cover ........................................................................................................................... 7-19
Minimum Size of Sewers and Gradient ...................................................................................... 7-19
Pipe Material .............................................................................................................................. 7-19
Bedding for Sewers ........................................................................................................................ 7-21 Manholes ....................................................................................................................................... 7-21
Wastewater/Sewage Treatment Plant ...................................................................................... 7-24
Zero Discharge Concept ............................................................................................................. 7-25
8 Chapter 8 Sewage Treatment Plant ........................................................................................... 8-26
8.1 Introduction ....................................................................................................................... 8-26 8.2 Raw sewage: ...................................................................................................................... 8-26 8.3 Plant based technology with zero energy requirement for converting sewage into drinking water 8-41
8.3.1 APPROACH TO UTILISE SEWAGE WATER FOR DRINKING PURPOSE .......................... 8-41
8.1 Alternate technology for converting sewage into drinking water ..................................... 8-43 9 Chapter 9 Recycled Water ......................................................................................................... 9-44
9.1 Recycled Water / Dual Plumbing ....................................................................................... 9-44 9.2 Benefits .............................................................................................................................. 9-44 9.3 Environmental benefits ...................................................................................................... 9-45 9.4 Future of water recycling ................................................................................................... 9-46 9.5 Dual Plumbing System ....................................................................................................... 9-46 9.6 Proposed System ............................................................................................................... 9-46 9.7 Cost Estimate ..................................................................................................................... 9-47
10 Chapter 10 SSOLID WASTE MANAGMENT SYSTEM ............................................................. 10-48
10.1 Introduction: .................................................................................................................... 10-48 10.2 Solid waste management rules, guidelines and policies: ................................................ 10-48 10.3 Statutory requirements: .................................................................................................. 10-48 10.4 Major sources of solid waste generation:........................................................................ 10-49 10.5 Solid waste basis & classification ..................................................................................... 10-50

1-7 Feasibility Report
TCE.10339A-CV-3000-FR-30001 (R0)
Bhopal Smart City Development Corporation Limited
10.6 Solid waste basis & classification .................................................................................... 10-51 10.7 Solid waste management strategy: ................................................................................. 10-52 10.8 Solid waste management strategy................................................................................... 10-53
10.8.1 Option 1: Conventional Waste Management System ............................................. 10-54
10.8.2 Option 2: .................................................................................................................. 10-56
11 Chapter 11 INFORMATION AND COMMUNICATION TECHNOLOGY (ICT) ................................ 66
11.1 Introduction .......................................................................................................................... 66 11.2 Robust IT Connectivity with optical fibre network ............................................................... 67 11.3 Wi-Fi Connectivity along the major roads ............................................................................ 68 11.4 Intelligent Traffic management System ................................................................................ 68 11.5 Smart Parking System ........................................................................................................... 69 11.6 Energy efficient Street Lighting ............................................................................................. 69 11.7 Public Safety and Security ..................................................................................................... 70 11.8 Integrated Command and Control Centre ............................................................................ 70 11.9 Smart Metering and SCADA for Energy and Water Distribution .......................................... 70 11.10 Emergency Response System................................................................................................ 71 11.11 Geographical Information System ........................................................................................ 71 11.12 GPS Based VTS and Passenger Information System ............................................................. 71
12 Chapter 12 DISTRICT COOLING SYSTEM ................................................................................... 73
12.1 Introduction .......................................................................................................................... 73 12.2 Assumptions for sizing of the DCS Plant ............................................................................... 75 12.3 System Description ............................................................................................................... 75 12.4 System Components ............................................................................................................. 76 12.5 Other Services Required ....................................................................................................... 76 12.6 Advantages of DCS Plant - Service Provider Side .................................................................. 77 12.7 Disadvantages – Consumer Side ........................................................................................... 78 12.8 Cost Estimate ........................................................................................................................ 78
13 Chapter 13 FIRE FIGHTING SYSTEM .......................................................................................... 79
13.1 Introduction .......................................................................................................................... 79 13.2 Brief description of project: .................................................................................................. 79 13.3 Scope of work: ...................................................................................................................... 79 13.4 Design Basis ........................................................................................................................... 79 13.5 Design Standards .................................................................................................................. 80 13.6 Mandatory Arrangement ...................................................................................................... 81 13.7 Options considered ............................................................................................................... 85 13.8 Description of Option 1 ......................................................................................................... 85
13.8.1 Equipment Parameters ................................................................................................. 85
13.9 Conclusion and recommendation ......................................................................................... 86 14 Chapter 14 ................................................................................................................................. 87
14.1 The Estimated Cost of the Infrastructure Components are as given below : ....................... 87 List of Figures and Tables
List of Figures
1-1 Stark utility tunnel in Zurich, Switzerland .................................................................................... 1-19
1-2 Utility Tunnel in GIFT City Gandhinagar, India ............................................................................. 1-19
1-3 Tunnel in Prague is shared by pipes and cables .......................................................................... 1-19
1-4 A newly built tunnel in Haifa, Israel ............................................................................................. 1-19

1-8 Feasibility Report
TCE.10339A-CV-3000-FR-30001 (R0)
Bhopal Smart City Development Corporation Limited
1-5 Proposed Primary Duct for ABD Area Bhopal .............................................................................. 1-20
2-1 Temporary Power Distribution from Bhadvada .......................................................................... 2-24
2-2 Power Distribution Scheme ......................................................................................................... 2-25
Figure 3-1 Existing Road Hierarchy .................................................................................................... 3-29
Figure 3-2 Existing Junctions .............................................................................................................. 3-31
Figure 3-3 Location of Trafic Survey .................................................................................................. 3-32
Figure 3-4 Typical Road Cross section of 60 m ROW ........................................................................... 3-1
Figure 3-5 Typical Cross Section of 45 m ROW .................................................................................... 3-2
Figure 3-6 Typical Road Cross section of 30 m ROW ........................................................................... 3-3
Figure 3-7 Typical Road Cross section of 24 m ROW ........................................................................... 3-4
Figure 3-8 Typical Road Cross section of 18 m ROW ........................................................................... 3-5
Figure 3-9 1. Typical Road Cross section of 12 m ROW ................................................................ 3-6
Figure 3-10 Typical Road Cross section of 6 m RO ............................................................................... 3-7
Figure 4-1 Schematic of Water Supply System Option-1 ..................................................................... 4-6
Figure 4-2 Schematic of Water Supply System Option-2 ..................................................................... 4-7
Figure 4-3 Potable Water Distribution Zones ..................................................................................... 4-9
Figure 6-1: Master Plan ...................................................................................................................... 6-10
6-2 Digital Elevation Model of ABD Area ............................................................................................. 6-1
Figure 8-1 Typical Flow Diagram of Sewage Treatment Plant ........................................................... 8-32
Figure 8-2: Aeration Basin Extended Aeration................................................................................... 8-34
Figure 8-3: Schematic for Moving Bed Bioreactor ............................................................................. 8-35
Figure 8-4: Schematic for Sequential Batch Reactor ........................................................................ 8-36
Figure 8-5: Schematic for Membrane Bio-Reactor Process................................................................ 8-37
8-6 The NBS™ architecture and root zone cutaway. ......................................................................... 8-42
Figure 9-1 Recycled Water Supply Zone ............................................................................................ 9-47
Figure 10-1: Sources of Waste Generation ...................................................................................... 10-49
Figure 10-2 Sources of SW Production ............................................................................................ 10-49
Figure 10-3 Typical Solid Waste Classification ................................................................................. 10-51
10-4 Waste Management Strategy .................................................................................................. 10-53
Figure 10-5: Alternatives of Waste Collection in AWC System ........................................................ 10-56
Figure 10-6: AWCS Concept ............................................................................................................. 10-56
Figure 10-7: Separate Waste Collection Chutes in Buildings ........................................................... 10-57
Figure 11-1 ICT Options ......................................................................................................................... 67
Figure 12-1 Typical Sketch of District Cooling System .................................................................. 74
Figure 12-2 Schematic Diagram of DCS ................................................................................................. 77
Figure 12-3 DCS System ................................................................................................................ 78
Figure 12-4 DCS Cost Estimate .............................................................................................................. 78
Figure 13-1 Fire Ring Main with Hydrant at Individual Plot Level ........................................................ 82
Figure 13-2 Oblique Type Fire Hydrant ................................................................................................. 82
Figure 13-3 Sprinkler System ................................................................................................................ 83
Figure 13-4 Sprinkler System Proposed Inside the Building ................................................................. 83
Figure 13-5 Typical Piping Arrangement for hose pipe connection at floor level ................................ 84
List of Tables
Table 1-1-1: Population Projection .................................................................................................... 1-13

1-9 Feasibility Report
TCE.10339A-CV-3000-FR-30001 (R0)
Bhopal Smart City Development Corporation Limited
Table 1-1 Comparison of Duct and Trench ........................................................................................ 1-17
Table 2-1 Power Demand Norms adopted for ABD Area Bhopal ...................................................... 2-22
Table 2-2 Power Demand for Plot Nos. 21,22,23,70 & 71 ................................................................. 2-23
Table 2-3 Details of the 33/11kV Bhadbhada & Ram nagar substation .......................................... 2-23
Table 2-4 Space Requirements for Electrical Infrastructure .............................................................. 2-26
Table 3-1 Existing Project Area Road Details ..................................................................................... 3-30
Table 3-2 Specific Design Standards / Guidelines for different Road Elements ................................ 3-33
Table 3-3 Classification of urban roads ............................................................................................. 3-34
Table 3-4: Road Length in meters ..................................................................................................... 3-35
Table 3-5 : Applied Design standards................................................................................................. 3-36
Table 3-6 : Flexible Pavement Design Standards ............................................................................... 3-39
Table 3-7 Rigid Pavement Design Standards ..................................................................................... 3-40
Table 3-8 Comparison of Flexible Pavement and Concrete Pavement ............................................. 3-40
Table 3-9 Pavement composition for Flexible Pavement for Different ROW roads .......................... 3-41
Table 3-10 Pavement composition of Cycle Track ............................................................................. 3-42
Table 3-11 Pavement composition of Paver Block ............................................................................ 3-42
Table 3-12 Proposed Road Network .................................................................................................. 3-43
Table 3-13 List of Major Items of work ................................................................................................ 3-2
Table 3-14 Per Km Cost ........................................................................................................................ 3-3
Table 4-1 Water demand unit norms ................................................................................................... 4-4
Table 4-2 Phase-wise Water Demand-Potable .................................................................................... 4-5
Table 4-3 Phase-wise Water Demand-Recycled .................................................................................. 4-5
Table 4-4 Details of Existing ESR .......................................................................................................... 4-8
Table 4-5 C value ............................................................................................................................... 4-11
Table 4-6 Pipe material selection summary ...................................................................................... 4-14
Table 4-7 Block Cost .......................................................................................................................... 4-14
Table 4-8 Water demand calculation for Bhopal Smart City ............................................................... 4-1
Table 5-1 :CAPITAL COST, LAND AND POWER REQUIREMENT ............................................................ 5-8
Table 6-1: Land Use Distribution ........................................................................................................ 6-12
Table 8-1: Waste-water Generation from project site ..................................................................... 8-27
Table 8-2: Peak Factor Based on Population .................................................................................... 8-27
Table 8-3: Raw Sewage Characteristics ............................................................................................. 8-28
Table 8-4: CPHEEO Standards of Treated Sewage ............................................................................. 8-29
Table 8-5: Treated Sewage Standards ............................................................................................... 8-29
Table 8-6: Capital Cost, Land and Power Requirement ...................................................................... 8-38
Table 8-7NET PRESENT WORTH OF VARIOUS PROCESSES ................................................................. 8-40
Table 9-1 Suggested Recycling Treatment ......................................................................................... 9-45
Table 10-1 Basis for Solid Waste Generation ................................................................................... 10-50
Table 10-2 Quantity of Waste Generation ....................................................................................... 10-52
Table 10-3 Biological Treatment Options ........................................................................................ 10-55
Table 10-4: Area Development Calculation ..................................................................................... 10-60
Table 10-5: Standards for C & D Waste generation ......................................................................... 10-60
Table 10-6: Total C & D Waste generation within project boundary .............................................. 10-60
Table 10-7: Development within ABD area ..................................................................................... 10-60
Table 10-8: Block Cost Estimate for MSW processing plant & Transfer Station for Phase 1 .......... 10-61

1-10 Feasibility Report
TCE.10339A-CV-3000-FR-30001 (R0)
Bhopal Smart City Development Corporation Limited
Table 10-9: O&M Cost for Bio-Methanation Plant Phase 1 ............................................................. 10-61
Table 10-10: Costing for Bio Methanation Treatment Plant for Phase II ....................................... 10-62
Table 10-11: Costing for Bins for Biodegradable Waste .................................................................. 10-62
Table 10-12: Costing for Bins for Other Dry Waste ......................................................................... 10-62
Table 10-13: Costing for Roadside Bins ........................................................................................... 10-63
Table 10-14: Primary Collection & Transportation of Biodegradable Waste .................................. 10-63
Table 10-15: Primary Collection & Transportation of Other Waste ................................................ 10-63
Table 10-16: Secondary Transportation of Inert Waste .................................................................. 10-63
Table 10-17: Cost Estimate for Phase 1 with Option 1 .................................................................... 10-64
Table 10-18Cost Estimate for Phase 2 with Option 1 ...................................................................... 10-64
Table 10-19: AWC system Capital and O&M Cost ........................................................................... 10-65
Table 12-1 Product Mix ......................................................................................................................... 73
Table 12-2 DCS Capacity for Bhopal ABD Area ..................................................................................... 74
Table 12-3 Power and Water Requirement .......................................................................................... 75
Table 13-1 Comparison of Fire Fighting Options .................................................................................. 85
Table 13-2 Capacity of Fire Tank at Fire Station ................................................................................... 86
14-1 Estimated Budget.......................................................................................................................... 87
List of Annexure enclosed separately
1. Layout Drawing of ABD Area
2. Cable Routing in the ABD Area
3. Fire Station Space Drawing
4. Storm Water Network Drawing
5. Sewer network Drawing
6. Waste Water recycle Line Network
7. Water Supply Network Drawing (3 Options)
8. Water Quality Report
9. Hydraulic Design of Storm Drain
10. Hydraulic Design of Sewer Network
11. Hydraulic Design of Waste water Recycle Line
12. Hydraulic Design of Water Supply Network (3 options)

1-11 Feasibility Report
TCE.10339A-CV-3000-FR-30001 (R0)
Bhopal Smart City Development Corporation Limited
Executive Summary
Background
In 2015, in first round of GoI's Smart Cities Challenge competition, Bhopal was one of the 20 cities
selected, which would receive funding from the Ministry of Urban Development. Bhopal is the only
city that has opted for redevelopment model for its Area Based Development. TT Nagar area has
been selected by BSCDCL for the same. More than 90% of land in this area is owned by government
and it is planned to unlock the value of this underutilized government land in the heart of the city.
Bhopal’s Area Based Development (ABD) proposal is now for redevelopment of 367 acres of North
and South TT Nagar with Gammon development on one side and New Market area on the other. As
per SCP, the area based development would be a state of art smart city in the heart of the city of
Bhopal with all modern features in a sustainable manner and would generate more job
opportunities. The area shall be developed along two MRT axes on transit oriented development
(TOD) principles.
TATA Consulting Engineers Limited has been appointed as Project Development and Management
Consultant for providing consultancy services for preparation of smart city plan for TT Nagar
redevelopment and provide project development and management consultancy support.
After detailed study about the existing situation on the project site to form a base for further
planning and development, different ideas were discussed in brain storming sessions and
alternatives have been evolved. On the basis of the same we have earlier submitted the ABD Master
Plan Report and Baseline Report. These reports shared the Master Planning best practices and
design process along with Infrastructure Plan for ABD area in Bhopal city. The “Feasibility Report”,
our third deliverables under the proposed assignment discuses about the various alternatives
available for conceptualising infrastructure in the ABD Area.
Vision and Objectives
"To plan/design people centric district that will serve as a paradigm for Smart city development,
escalating quality of life through connected communities, advanced infrastructure, mobility and
ambience aiming to be high-density and high-rise where land is a precious resource."
Bhopal Smart City in TT Nagar has been envisioned as 24/7 activity based, thriving and energetic
place where people will live work and play. It will offer swift mobility through various modes of
public transport. This will give people great convenience to commute with reduce time and
convenient access to amenities and facilities achieved through land use coordination of carefully
balanced areas of residences, office, amenities and entertainment area focused on Education,
Research, Entrepreneurship and Tourism.
ABD Area is planned as Mixed Use Compact Development within the heart of Bhopal city which is
further part of the urban fabric of the city. It is strategically located between two primary arteries of
city (BRTS & proposed Metro) and embodies ToD (Transit Oriented Development) planning principles
to provide a compact, walkable and sustainable spatial morphology. This will lead to a ripple effect in

1-12 Feasibility Report
TCE.10339A-CV-3000-FR-30001 (R0)
Bhopal Smart City Development Corporation Limited
catalyzing the future economic and social development of adjacent areas near the project site and
make a benchmark for Bhopal to replicate in other parts of city. Therefore, state-of-the-art
connectivity, infrastructure and transportation access have been integrated into the design of the
city.
Feasibility Report reflects state of the art infrastructure which could be planned and implemented
integrating the planned program of smart city mission into the existing context of both the site
and the city. The ABD development in Bhopal is expected to become a contemporary smart city
model development in India, advancing the ideas of sustainability and ecology. The project
redevelops the area as high-quality, high density mixed use district of residential, commercial and
open space facilities that optimize land and real estate values.
Scope of Feasibility Report
Infrastructure is the backbone of any successful place for living and working. A properly functioning
Smart City is a direct consequence of meticulously planned and arduously maintained infrastructural
system. The chapter outlines the concept plan for various infrastructure components, viz. Water
supply, Sewerage system, Storm water drainage, Solid waste management, Power, Information and
communication technology, Gas utility for the Smart City.
Concept of Utility Duct has been introduced in the report which could become a successful model
for other cities to follow.
Project Identification: The projects are identified to kick start the development in the project
area which will be visible and enable to attract investment for development and growth in
central part of Bhopal.
Population projection for designing the infrastructure
The project is expected to infuse high and rapid population growth in the project area based on the
quality of life and infrastructure facilities proposed in the smart city. The projected population is
based on the principles of transit oriented development. The proposed residential density is 482
Persons Per Hectare (PPH) with the House Hold (HH) size of 5 in Bhopal. The overall density on 367
acres of land is proposed to be nearly 1,422 PPH. The Master Plan for ABD area would accommodate
70,000 residential population, floating population of 1,08,500 per day and support population for
floating population as 28,700 per day. The total population (including residential and floating) as
represented in Error! Reference source not found. is nearly 2,07,500 over a period of 20 years.
Population of 26,000 today is projected to grow to 60,000 in next 10 years, at a rate of 8.75%
annually due to infrastructure and smart city investments. After which the development will settle
down to a natural growth rate of 1.5% per year for 10 years and fill the capacity of 70,000 resident
population by 2036, of ABD area.

1-13 Feasibility Report
TCE.10339A-CV-3000-FR-30001 (R0)
Bhopal Smart City Development Corporation Limited
Table 1-1-1: Population Projection
Residential Population
BUA / Land Area (sqm)
Average Footfall (Floating) per day
% of Floating Support Population
Floating Support Population / day
Govt Housing 10,125
EWS Housing 4,502
LIG Housing 4,502
Slum Rehab 3,020
Commercial Housing 47,997
Total Residential 70,145
20% 14,029
Retail (malls)
77,778 10% 7,778
Offices
11,667 7.5% 875
Hospitality 140
422
140
Total Commercial 140
89,866
8,793
Schools, Health centers, Fire stations, Ward Offices, Police Stations, Utility Buildings etc
186,667 18,667 7.5% 1,400
Total PSP
186,667 18,667
1,400
Dashahara Ground (persons per event)
53,472 35,648 5% 1782.4
Stadium (pop per event)
20,000 5% 1000
Other recreational Gardens - Land Area
85,171
2% 1703
Total Recreational Gatherings 0
55,648
4486
Grand Total Population per day 70,285
108,533
28,708
TOTAL POPULATION 2,07,526
Source: Consultant’s estimate

1-14 Feasibility Report
TCE.10339A-CV-3000-FR-30001 (R0)
Bhopal Smart City Development Corporation Limited
Infrastructure explored for the ABD area are given below
1. Multiple Utility Duct
2. Water Supply Network
3. Power Supply
4. ICT
5. Water Treatment Plant with Pumping Station
6. Recycled Water Supply Network with Pumping Station
7. Sewerage Collection and Disposal Network
8. Sewage Treatment Plant
9. Road including road furniture and visual improvement
10. Cycle Track and Footpath
11. Storm Water Drain
12. Landscaping
13. Retaining Wall
14. District Cooling System
Project area delineation
We have already discussed Project Site Appreciation and Site Appraisal in the Baseline Report
submitted earlier. The Baseline Report also captures details of the existing infrastructure facilities in
the ABD Area. Hence the Feasibility Report will straightaway discuss the various options identified
for the infrastructure components. The 367 Acre of ABD area is given below for ready reference.

1-15 Feasibility Report
TCE.10339A-CV-3000-FR-30001 (R0)
Bhopal Smart City Development Corporation Limited
Broad Design Approach
TCE will design the Infrastructure facilities with the Benchmarks in background set up by the Ministry
of Urban Development, Government of India.

1-16 Feasibility Report
TCE.10339A-CV-3000-FR-30001 (R0)
Bhopal Smart City Development Corporation Limited
1 Chapter 1 UTILITY DUCT
1.1 Introduction
A utility tunnel, utility corridor, or utilidor is a passage built underground or above ground to carry
utility lines such as electricity, water supply pipes. Communications utilities like fiber optics, cable
television, and telephone cables are also sometimes carried. One may also be referred to as
a services tunnel, services trench, services vault, or cable vault. Smaller cable containment is often
referred to as a cable duct or underground conduit. Direct-buried cable is a major alternative to
ducts or tunnels.
Utility tunnels are common in very cold climates where direct burial below the frost line is not
feasible (such as in Alaska, where the frost line is often more than 18 ft (5.5 m) below the surface,
which is frozen year round). They are also built in places where the water table is too high to bury
water and sewer mains, and where utility poles would be too unsightly or pose a danger (like
in earthquake prone Tokyo). Tunnels are also built to avoid the disruption caused by recurring
construction, repair and upgrading of cables and pipes in direct burial trenches.
Utility tunnels are also often common on large industrial, institutional, or commercial sites, where
multiple large-scale services infrastructure (gas, water, power, heat, steam, compressed air,
telecommunications cable, etc.) are distributed around the site to multiple buildings, without
impeding vehicular or pedestrian traffic above ground. Due to the nature of these services, they may
require regular inspection, repair, maintenance, or replacement, and therefore accessible utility
tunnels are preferred instead of direct burying of the services in the ground.
Utility tunnels range in size from just large enough to accommodate the utility being carried, to very
large tunnels that can also accommodate human and even vehicular traffic.
1.2 Comparison of direct burial and duct (utility tunnel)
The advantages of utility tunnels are the reduction of maintenance manholes, one-time relocation,
and less excavation and repair, compared to separate cable ducts for each service. When they are
well mapped, they also allow rapid access to all utilities without having to dig access trenches or
resort to confused and often inaccurate utility maps.
One of the greatest advantages is public safety. Underground power lines, whether in common or
separate channels, prevent downed utility cables from blocking roads, thus
speeding emergency access after natural disasters such as earthquakes, hurricanes, and tsunamis.
The following table compares the features of utility networks in single purpose buried trenches vs.
the features of common ducts or tunnels:

1-17 Feasibility Report
TCE.10339A-CV-3000-FR-30001 (R0)
Bhopal Smart City Development Corporation Limited
Table 1-1 Comparison of Duct and Trench
Trench (direct burial) Duct (or utility tunnel)
Long-term collaboration has not always been a
high priority. Robust, precise location records for
older utility trenches were often not provided or
maintained, and older trench locations are often
unknown.
Ducts are often used where developing
authorities value the long-term benefits of utility
co-location. That focus on long-term
collaboration often includes greater emphasis on
making duct locations easily known.
Single-purpose trenches encourage a utility to
follow a single-minded route to shorten runs and
save initial installation costs for that particular
utility. But uncoordinated routing encourages
spatial chaos, using more space than if trenches
were highly parallel, and greatly increasing the
overall encumbrance on surrounding
development.
Ducts demand coordinated, highly collinear
routing, reducing the overall encumbrance on
surrounding development.
Access to a trenched network typically requires
locating the utility network, cutting open the
road or pavement surface, breaking open the
concrete platform and excavating a trench,
followed by reinstatement of the trench,
concrete platform and road surface afterwards.
(This is where most of the financial cost of
network renewals and maintenance is incurred.)
Road surfaces can be seriously damaged by
frequent trenching, requiring more frequent
resurfacing. In the process, pavement slabs are
often broken and badly aligned. UK roads are
subject to 5 million roadworks per year (mainly
for utility works).
Utility networks in ducts typically include
designed-in access points (like those now used by
British Telecom). Where ducts and access points
are installed, excavations are rare and recurring
maintenance costs are lower.
Maintenance of networks in trenches requires re-
digging and restoring the trench and any roadbed
above it. Road users suffer repeated delays from
roadworks, particularly in dense cities.
Roadworks for trench adjustments also require
large quantities of sand, aggregate, cement,
tarmac and marking paint.
Ducts allow maintenance through their access
points. Since access points mostly obviate new
roadway intrusions, traffic delays from duct-
related roadworks are greatly reduced. Not
disturbing roadways means network adjustments
require materials only inside the ducts.

1-18 Feasibility Report
TCE.10339A-CV-3000-FR-30001 (R0)
Bhopal Smart City Development Corporation Limited
Rural properties are often denied access to gas or
cable telecom because the cost of new trench
deployment cannot be economically
justified independently of other networks. Rural
networks for electricity and telecoms are often
above ground, with increased risk of disruption,
even though there are usually local underground
water and gas networks serving the same
properties.
Sharing the higher initial installation cost of ducts
across all services could make rural service more
economically feasible. Where ducts are
used, all networks are typically underground in
multi-purpose ducts. Redundant above-ground
electricity and telecom poles are usually
dismantled, increasing safety and reducing
natural disaster impacts.
Without common utility ducts, new types of
networks require new trenches or independent
ducts. Such expansions have already included
cable telephone and television networks.
Proposed local heat transfer systems and more
localised, reconfigured power generation
systems would also require new trenches.
Common utility ducts are designed to
accommodate anticipated new and evolving
networks.
The high thermal conductivity of soil would
require extreme insulation for heat transmission
through trenched networks.
The low thermal conductivity of air in ducts
allows heat transmission with less insulation and
cheaper standoffs.
1.3 Advantages of duct (utility tunnel)
Easier accessibility to utilities for maintenance and upgrading
Environmental impacts are minimized: such as traffic disruption
Location information is made more accessible
Utility ducts greatly reduce surface area occupied
An adequate airflow in ducts allows better heat transmission from electricity cables
than in direct trenched/buried situations
1.4 Disadvantages of duct (utility tunnel)
High initial construction cost as compared to traditional open excavation methods
The issue of compatibility between the utilities housed in the tunnel. A defect in one
system may adversely affect the other systems.
The concerns of people entering the tunnels to maintain one service when they are
not experienced in dealing with other types of services (and associated risks) of other
utilities

1-19 Feasibility Report
TCE.10339A-CV-3000-FR-30001 (R0)
Bhopal Smart City Development Corporation Limited
1.5 National and international examples (utility tunnel)
1-1 Stark utility tunnel in Zurich, Switzerland
1-2 Utility Tunnel in GIFT City Gandhinagar, India
1-3 Tunnel in Prague is shared by pipes and cables
1-4 A newly built tunnel in Haifa, Israel

1-20 Feasibility Report
TCE.10339A-CV-3000-FR-30001 (R0)
Bhopal Smart City Development Corporation Limited
1.6 Proposed Primary utility duct for Bhopal ABD area
1.7 Scope and estimated budget
The per Km cost of the proposed Primary Duct is Rs 16 Cr. The Duct will accommodate the following
utilities:
Water Supply Line
Recycle Water Line
Electrical Cables
ICT Cables
Automatic Solid Waste pipe
Excluded from the duct:
Storm Water drain
1-5 Proposed Primary Duct for ABD Area Bhopal

1-21 Feasibility Report
TCE.10339A-CV-3000-FR-30001 (R0)
Bhopal Smart City Development Corporation Limited
Excluded from the Duct are the following utilities:
Sewer Line (Directly buried)
Gas Line (Directly buried)
1.8 Proposed Secondary Utility Duct for Bhopal ABD Area
The per Km cost of the proposed Secondary Duct is Rs 7 Cr. It will run through all the secondary
ROWs .
1.9 Cost Estimate
Primary Duct for 3.6 Km on 45m and 60 m ROWs, the estimated cost is Rs 60 Cr
Secondary Duct for all other roads (On one side only), the estimated cost is Rs 100 Cr.
1.10 Recommendation
Given the area of 367 Area, we recommend buried utilities instead of going with the Duct owing to
high initial capital cost. Flexibility will be there in future to make changes based on the actual
development.

2-22 Feasibility Report
TCE.10339A-CV-3000-FR-30001 (R0)
Bhopal Smart City Development Corporation Limited
2 Chapter 2 POWER SUPLY
2.1 Introduction
The government of India Intended to transform Bhopal as one of the cities to be developed as smart
city. For this purpose Bhopal smart city Development Corporation Limited has been introduced to
plan design, implement, co-ordinate the smart city projects in Bhopal.
It’s an area based development proposal which includes redevelopment of 350 acres North and
south TT Nagar starting after New market in the north & extending till Mata Mandi chawk in south.
2.2 Power demand norms
Relevant norms for calculating the power demand for different product mixes inside project
boundary are being reproduced here as under which forms the basis for power demand calculations:
Table 2-1 Power Demand Norms adopted for ABD Area Bhopal
S.N. Product Mix Power
Demand norms
Basis for Norms Adopted
1 Residential MP Supply Code 2013 Load to be considered up to 500 sq. ft. of
BUA is 2 kW, For every additional 500 sq.
ft. or part thereof over 500 sq. ft. of BUA,
0.5 kW of load should be added
2 Commercial Power Distribution Companies
like Noida Power Corporation
Ltd (NPCL) and TCE experience
in the similar projects for
commercial and other PSP/
Institutional Loads
• Load Density for Lighting + Power
(Retail+ Mall) - 50 W/Sqm @ 0.4
utilization factor
• HVAC load - 30 W/Sqm @ 0.26
utilization factor
3 Public/ semi-
public
PSP-Load Density for Lighting + Power
(Retail+ Mall) - 45 W/Sqm @ 0.35 utilization
factor
Recreation-Load Density for Lighting +
Power (Retail+ Mall) - 45 W/Sqm @ 0.4
utilization factor
Utility-Load Density for Lighting + Power
(Retail+ Mall) - 20 W/Sqm @ 1.0 utilization
factor
4 Recreational
5 Utilities

2-23 Feasibility Report
TCE.10339A-CV-3000-FR-30001 (R0)
Bhopal Smart City Development Corporation Limited
2.3 Power demand calculation
Total power demand has been made for each product mix of the project area based on approved
land use, power demand norms & considering FSI’s. Estimated Power demand of the ABD area is 47
MVA – Phase I – 24 MVA and Phase II – 23 MVA.
2.4 Power source identification
2.4.1 Immediate Power requirement
The Power demand for New Buildings (21,22,23,70 & 71) will be approximately 2.3 MVA.
Table 2-2 Power Demand for Plot Nos. 21,22,23,70 & 71
PLOTS BUILT UP AREA
(SQMTR.)
POWER DEMAND IN
KVA
VOLTAGE LEVEL IN
kV
21 &22 31,685 380 33
23 33,930 407 33
70 1,01,625 1217 33
71 57,675 691 33
TOTAL 187898 2696 (2.7MVA)
Two nos. of 33/11kV existing substations are identified:
33/11kV RAM MANDIR S/S: 2 X 5 MVA transformer.
33/11kV BHADBHADA S/S (3 Nos 11 KV feeder under ABD area) - (2 X 8 MVA + 2 X 5 MVA)
transformer.
Table 2-3 Details of the 33/11kV Bhadbhada & Ram nagar substation
o S. N. o Incoming supply source o Name of 11kV
feeder o Maximum
loading (KVA) o Existing loading in
KVA
o 1 o 33/11KV BHADBHADA S/S o Jharneshwar o 2578 1714.68
o 2 o 33/11KV BHADBHADA S/S o Rangmahal o 4405 1047.86
o 3 o 33/11KV BHADBHADA S/S o Shastri Nagar o 5116 1428.9
o 4 o 33/11KV RAM MANDIR S/S o Center point o 2968 1333.64
o 5 o 33/11KV RAM MANDIR S/S o Anjali o 3318 1047.86
o 6 o 33/11KV RAM MANDIR S/S o New Market o 3086 1905.2

2-24 Feasibility Report
TCE.10339A-CV-3000-FR-30001 (R0)
Bhopal Smart City Development Corporation Limited
o 7 o 33/11KV RAM MANDIR S/S o PlatinumPlaza o 1775 571.56
o 8 o 33/11KV RAM MANDIR S/S o 74 Bungalow o 6401 1905.2
Total existing loading of 33/11kV Bhadbhada is 4191kVA. So, Power supply to new buildings can be
fed from the 33/11kV BHADBHADA substation through underground cables.
2-1 Temporary Power Distribution from Bhadvada
2.4.2 Permanent power requirement
According to existing power supply code prescribed by MP Electricity Regulatory Commission
following are the norms adopted for the selection of the power supply voltage level.
Upto 150kVA-415V LT Supply
Above 50kVA & up to 300kVA-11kV power Supply
Above 100kVA & up to 1000kVA-33kV power Supply
Above 5MVA & upto 50 MVA- 132 kV power supply
Above 40 MVA- 220 kV power supply
Since the ultimate maximum power demand of Bhopal smart city ABD is 47MVA, this power demand
can only be fed on Extra High voltage level as per MP Supply Code’2013. Hence, 220kV voltage level

2-25 Feasibility Report
TCE.10339A-CV-3000-FR-30001 (R0)
Bhopal Smart City Development Corporation Limited
has been adopted for catering to the ultimate power demand. 132kV voltage level is not considering
as 47MVA is borderline case.
POWER DISTRIBUTION SCHEME
220 kV BairagarhGrid Substation
220kV / 33kV GIS
& 33/11kV
Substation at
ABD
220 kV UG Cables
or overhead
transmission lines
11kV / 415V
CSS
11kV / 415V
CSS
33kV RMU 33kV RMU 33kV RMU
415V cable system to Feeder pillars
33kV UG Cable Rings
11kV UG cable Rings
33kV Loads
11kV RMU
11kV Loads
220 kV MuglaichapGrid Substation
2-2 Power Distribution Scheme
The power sources are identified as Bairagarh Grid Substation and Muglaichap Grid Substation to
feed proposed 220kV GIS Substation.
The Power supply for 220/33kV GIS Sub-station will be arranged from 220 Bairagarh Grid Substation
and Muglaichap Grid Substation by either underground laid EHV cables or over head transmission
lines. Estimated distance from each substation is 10-12kM. Estimated length of cable is 72kM of
220kV cable (Single core, Cu conductor, XLPE insulated).
The proposed 220/33kV GIS Sub-station and 33/11kV substation will be located at plot no. 13.
2.5 Power purchase options for permanent Supply
There are two possible options for distributing ultimate power inside ABD.
2-26 Feasibility Report
TCE.10339A-CV-3000-FR-30001 (R0)
Bhopal Smart City Development Corporation Limited
2.5.1 Option-1
In this option Client will provide the space for 220/33kV,33/11kV, 33/0.433kV & 11/0.433kV
substations and cable corridor to MPPKVVCL.MPPKVVCL will bring 220kV power supply from source
to 220/33kV EHV substation inside ABD, develop 220/33kV, 33/11kVsubstations inside ABD and then
distribute power till each 33kV, 11kV & LT metering points for ABD consumers. Operation &
maintenance of all the external as well as internal electrical infrastructure as described above will be
done by MPPKVVCL.
2.5.2 Option-2:
In this option Client will provide the space for 220/33kV substation to MPPKVVCL. MPPKVVCL will
bring the 220kV supply from source to 220/33kV EHV substation inside ABD and develop & maintain
the 220/33kV EHV substation. Further Client will develop 33/11kV substation and Power
distribution till each 33kV, 11kV & LT metering points for ABD consumers will be done by Client by
franchise license agreement with MPPKVVCL.
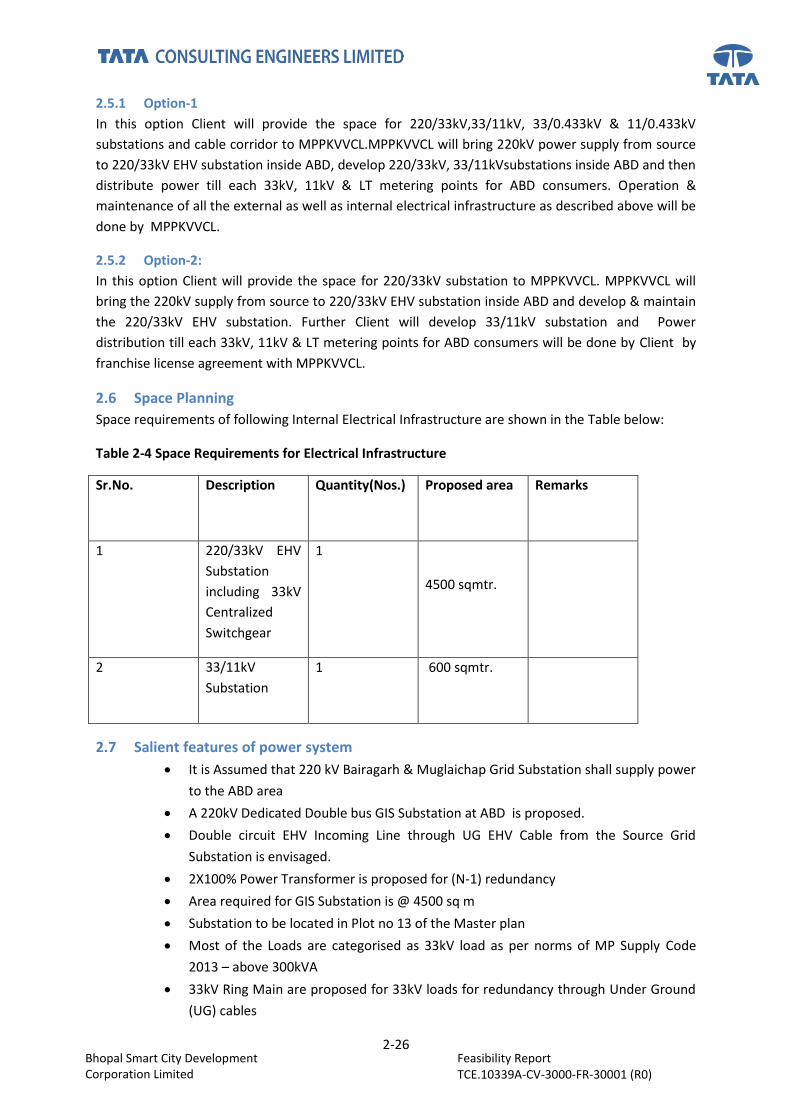
2.6 Space Planning
Space requirements of following Internal Electrical Infrastructure are shown in the Table below:
Table 2-4 Space Requirements for Electrical Infrastructure
Sr.No. Description Quantity(Nos.) Proposed area Remarks
1 220/33kV EHV
Substation
including 33kV
Centralized
Switchgear
1
4500 sqmtr.
2 33/11kV
Substation
1 600 sqmtr.
2.7 Salient features of power system
It is Assumed that 220 kV Bairagarh & Muglaichap Grid Substation shall supply power
to the ABD area
A 220kV Dedicated Double bus GIS Substation at ABD is proposed.
Double circuit EHV Incoming Line through UG EHV Cable from the Source Grid
Substation is envisaged.
2X100% Power Transformer is proposed for (N-1) redundancy
Area required for GIS Substation is @ 4500 sq m
Substation to be located in Plot no 13 of the Master plan
Most of the Loads are categorised as 33kV load as per norms of MP Supply Code
2013 – above 300kVA
33kV Ring Main are proposed for 33kV loads for redundancy through Under Ground
(UG) cables

2-27 Feasibility Report
TCE.10339A-CV-3000-FR-30001 (R0)
Bhopal Smart City Development Corporation Limited
11kV loads are derived with 33/11kV transformer located at the same substation and
11kV Ring Mains through UG cables
33kV and 11kV Ring Main Units (RMU) are considered for distribution
All EHV Switchgear shall be Indoor GIS while all HV switchgear shall be AIS Indoor
located
Compact Substations (CSS) are proposed for the 11/415 kV loads like street lights,
STP or WTP etc.
GIS Substation for Space optimization and low Total Cost of Ownership (TOC) over
30years
Synthetic Easter Oil filled Transformer for extended life
Smart Meter is envisaged for 100% Consumers
Advanced metering Infrastructure (AMI) for real time tracking
Self Healing Ring Mains for reduction in Outage time
LED Street light for better performance and energy saving
Smart Street light Control system based on PLC & GSM technology
Roof Top Solar generation plant for 10% power generation
2.8 Block Cost
The broad cost break up for the ABD electrical scope of works is
Supply, installation, testing and commissioning (SITC) of underground Transmission
line for 24km is 98 Cr.
SITC of the MRS building with above equipment and systems is 39 Cr.
SITC of the Distribution network and street lighting – 40Cr.
SITC of the substation automation and advanced metering infrastructure– 24Cr.
Civil cost of 220kV & 33kV Substation building– 13Cr.
Total cost is INR – 214Cr.
4.5 Cr. cost for new building power supply arrangement is also included in above
214Cr.

3-28 Feasibility Report
TCE.10339A-CV-3000-FR-30001 (R0)
Bhopal Smart City Development Corporation Limited
3 Chapter 3 Traffic and Transport
3.1 Road network and external connectivity
Bhopal, “The city of Lakes” is well connected to the rest of the country by all major modes of
transport, i.e. by road, rail and air. The city being located in the central part of India, has a wide
spread road and rail network considering its connectivity both North-South and East-West. National
Highway No.12 passes through Bhopal which connects it to Jabalpur in the East and Jaipur in the
West. National Highway 86 connects Bhopal to Sagar in the East to Dewas in the West. State
Highway 18 connects the city with Indore. There are good long distance bus services for cities like
Ahmedabad, Jodhpur, Kota, Nagpur, Jaipur, Shirdi, Pune, Akola, Amravati, Jalgaon, Vadodara, Surat,
Nashik from Bhopal as well as many services to nearby places within the state having number of
daily busses to Indore Ujjain, Gwalior, Jabalpur, Khajuraho, Sanchi, Pachmarhi, Vidisha and Berasia.
An interstate bus terminus is located near the Habibganj railway station, called the Kushabhau
Thakre Inter State Bus Terminal.
Bhopal is one of the Centrally and strategically rail connected cities in India which halts more than
200 daily trains. The main stations of Bhopal are the Bhopal Junction station located in old Bhopal as
well as Bhopal Habibganj station located in new Bhopal. Altogether the city has six railway stations
within its city limits.
Bhopal also has a primary international airport named “The Raja Bhoj International Airport” located
near the satellite suburb Bairagarh which serves as an international terminal for the whole of
Madhya Pradesh. The airport lies 15 km to the north of the city and is well connected to the core by
a four lane road named VIP Road.
3.2 Reconnaissance Survey
The detailed ground reconnaissance was undertaken on 18-07-2016 under guidance of Bhopal Smart
City Development Corporation Limited officials and collected relevant data. Identified project area
were visited to carry out ground reconnaissance survey. The data collected from the reconnaissance
surveys was used for planning and programming the detailed surveys and investigations. All field
studies are being undertaken on the basis of information derived from the reconnaissance surveys.
3.3 Observations – reconnaissance survey
The project area has two major Arterial roads passing through, which are the Bhadbhada Road on
the west and New Market Road on the east. These arterial roads are presently important roads
connecting the project area to all other parts of the city. The Bhadbhada Road connects the site on
one end to Old Bhopal, Old Vidhan Sabha, Bhopal Junction Railway Station and on the other end to
the Depot Chauraha and further to Shyamala Hills, Neelbad etc, whereas the New Market Road
connects the project area to Roshanpura Chauraha, M.P Nagar, Upper Lake, Lower Lake in the north
and to MANIT, Bittan Market, 10 No. market, Kolar in the south. Further there is a major Sub-
Arterial road marking the south boundary of the site, i.e. the Main Road 2 Connecting the site to
Shyamala Hills towards the west and to Habibganj Railway Station on the East and another arterial
road, the Main Road 1 touches touches the Project area on its North-Eastern end by merging into
the New Market Road which connects to Shivaji Nagar, M.P Nagar, Arera Hills etc. Encroachment by
vendors is observed on most of the major roads in the project area.

3-29 Feasibility Report
TCE.10339A-CV-3000-FR-30001 (R0)
Bhopal Smart City Development Corporation Limited
Figure 3-1 Existing Road Hierarchy
There are various Collector Roads emerging from the above listed Arterial and Sub-Arterial Roads
which serve the Project Area, i.e. South TT Nagar, North TT Nagar and Tulsi Nagar. Plot access and
connectivity is further provided by the other local roads on site. The road Hierarchy thus observed is
Arterial, Sub-Arterial, Collector and Local Streets which is shown in the map above. The details giving
Road Length, Carriage Way, no. of lanes etc. of roads in the project are shown in the Error!
Reference source not found.

3-30 Feasibility Report
TCE.10339A-CV-3000-FR-30001 (R0)
Bhopal Smart City Development Corporation Limited
Table 3-1 Existing Project Area Road Details
Source: City Development Plan, Bhopal/Field survey conducted by TCE
Table shows about 1.04 km stretch of Bhadbhada Road falls in the Project area which has a varying
carriage way of 11.5 m to 13 m. Major part of the road is 3 Lane Undivided but 200m before
Rangmahal Square it becomes 4 lane divided towards Roshanpura. The New Market Road has a
stretch of 1.08 km in the project area having a varying carriage way of 10.8m to 16m from Mata
Mandir Square to Roshanpura Square which is 4 Lane Divided. The Main Road 2 has about 1.05 km
stretch in the project area with a varying carriage way of 16m to 22m from east to west which is a 4
Lane Divided road. The road from Rangmahal Square to New Market Road is a major collector street
in the area which is 4 Lane Divided about 370m in length with 15m carriage way. The other collector
and Local Streets vary from 3m to 15m in carriage way with 1-2 Lane Undivided Roads.
There are various Junctions and intersections of prime importance in the Project Area, which area
Mata Mandir Chauraha, New Market Square, Jawahar Chowk and some in the vicinity of the project
area, i.e. Roshanpura Chauraha and Depot Chauraha. They have been classified in three categories
on the basis of the existing type of Junction. The Roshanpura Square has rotary as well as Traffic
Signal for junction traffic management. Rangmahal Square, New Market Square, Jawahar Chowk
junctions have Traffic signal, whereas Mata Mandir Chowk and Depot chauraha are junctions with
rotary. The other important intersections are either manned or unmanned junctions opening on the
arterial roads. Rest of the juctions are minor at grade junction between collector and local streets.
The junctions as mentioned above are marked in the Figure given below: .
S.No. Road Name Road
Length
within
Project
Area
(Km)
Carriage
Way
Width (m)
Type of
Road
No. of Lanes
1 Bhadbhada Road 1.04 11.5-13 Arterial 3 Lane Undivided
2 New Market Road 1.08 10.8 - 16 Arterial 4 Lane Divided
3 Main Road 2 1.05 16 -22 Sub-Arterial 4 Lane Divided
4 Rangmahal Square to
New Market Road via
TT Nagar Square
0.37 15 Collector
Street
4 Lane Divided
5 Other minor Roads - 15 - 3 Collector &
Local Street
1-2 Lane Undivided

3-31 Feasibility Report
TCE.10339A-CV-3000-FR-30001 (R0)
Bhopal Smart City Development Corporation Limited
3.4 Field studies and engineering surveys
3.4.1 Topographic survey
The project boundary was delineated with the help of BSCDCL before carrying out survey. Topo
sheets were collected from the Survey of India to identify GTS (Great Trignometrical Survey) levels
for transferring MSL (Mean Sea Level) to the project boundary. Total 9 DGPS (Differential Global
Positioning System) points for UTM (Universal Transverse Mercator) were marked, based on which
complete topographical survey was done. This detailed topographical survey was done for capturing
physical and topographical features including but not limited to - building footprints, floors, plot
boundaries, vacant lands, roads, street, drains, trees with size of girth etc. Field surveys were carried
Figure 3-2 Existing Junctions

3-32 Feasibility Report
TCE.10339A-CV-3000-FR-30001 (R0)
Bhopal Smart City Development Corporation Limited
out to mark the plot ownership, land use and building use. Temporary Bench Mark (TBM) was
established within the project area with respect to nearest GTS benchmark. All the roads and lanes
were mapped within site boundary with road type, width and elevation. The survey was extended to
100 m along the road, from project boundary at each junction. Ground elevation contours were
established at an interval of 0.5 m.
3.4.2 Traffic surveys: field work
Information about traffic is indispensable for any project since it would form the basis for the design
of the pavement, fixing the number of traffic lanes, design of inter-sections and economic appraisal
of the project etc. Traffic survey required to be conducted in connection with the preparation of
road project are as under:
The following traffic surveys have been conducted on the project area
Classified Traffic Volume Count (TVC)at three locations (7days 24 hours)
Origin and Destination (OD) at the three locations (1 day 24 hours)
Turning Movement Survey (TMC) at Five Junctions (1 day 24 hours)
Fuel sales data
Parking Survey on street (1 day 24 hours)
Parking Survey off street (1 day 24 hours)
3.4.3 Location for survey
Location selected for Traffic count is as shown below:
Figure 3-3 Location of Trafic Survey
Traffic survey is under progress and analysis of traffic survey will be submitted separately.

3-33 Feasibility Report
TCE.10339A-CV-3000-FR-30001 (R0)
Bhopal Smart City Development Corporation Limited
3.5 Design Basis for Roads
3.5.1 Objective
The formulation of the design standards is required in order to avoid any inconsistency in design for
different category of roads and from one section to the other as well. Design standards will provide
desired level of service and safety.
This present section will give the details of the existing road network to the proposed site, internal
road network with typical Right of way (ROW’s), details for location of utilities, design methodology
to be followed for geometric design of roads and flexible pavement thickness design.
3.5.2 Design basis and code for design standards
The objective of functional design is to arrange the physical elements of the project roads so as to
suit in providing an inherent safety and increasing traffic capacity taking into account at the same
time, the Vehicle Operating Cost and time savings. The criteria of safety are often incomplete and
the design standards have to be an acceptable compromise.
For the study of this stretch the approach for Geometric design will be to set out design standards
based on relevant IRC guidelines.
For this project, the standards given by the IRC codes will generally be followed viz as listed in Error!
Reference source not found. given below;
Table 3-2 Specific Design Standards / Guidelines for different Road Elements
Road Elements Design Standards used for
Name of Code Description
Ground Improvement HRB - SR No. 14, 1994
State of the Art report: High Embankment on soft ground, Part B - Ground Improvement.
Embankment Fill HRB - SR No. 3, 1999 State of the Art Report: Compaction of earthworks and sub grades.
Pavement Design IRC:37-2012 Tentative Guidelines for the Design of Flexible Pavements.
IRC:58-2015 Guidelines for the design of plain jointed rigid pavements for highways.
Inter locking paver
blocks
IRC:SP:63-2004 Guide lines for the use of Interlocking Concrete Block Pavement
Surface Dressing IRC:110-2005 Standard Specifications and Code of Practice for Design and Construction of Surface dressing
Road Markings IRC:35 -2015 Code of Practice for Road Markings (with paints) (First Revision).

3-34 Feasibility Report
TCE.10339A-CV-3000-FR-30001 (R0)
Bhopal Smart City Development Corporation Limited
Road Signs IRC:67 -2012 Guidelines for Pedestrian Facilities.
Landscaping IRC:SP21-2009 Guidelines on Landscaping and Tree plantation.
Pedestrian Facilities IRC:103-2014 Guidelines for Pedestrian Facilities.
Cycle Tracks IRC:11-2015 Recommended Practice for the design and layout of Cycle tracks.
Safety Features IRC:SP44-1996 Highway Safety Code.
Traffic Lights IRC:93-1985 Guidelines on Design and Installation of Road Traffic Signals.
Junction / Medians IRC:SP41-1994 Guidelines on Design of At Intersections in Rural and Urban Areas.
Structures IRC:112-2011 Code of Practice for Road Bridges.
High Embankments IRC:75-2015 Guidelines for the design of High Embankments.
Erosion Control IRC:56-2011 Recommended practice for Treatment of Embankment and Road side slopes for Erosion control. (First Revision)
Slope Stability HRB: Sl.No:1 - 2000 State of the Art Report: Lime Stabilisation.
Kerb and Separator IRC:86-1983 Geometric Design Standards for Urban Roads in Plains.
3.5.3 Classification of road network
Following are the Classification of road network as per Master Plan:
Table 3-3 Classification of urban roads
ROW in m
Classification of Urban roads
60 Arterial Road
45 Sub Arterial Road
30 Collector Street
24
18 Local Street
12
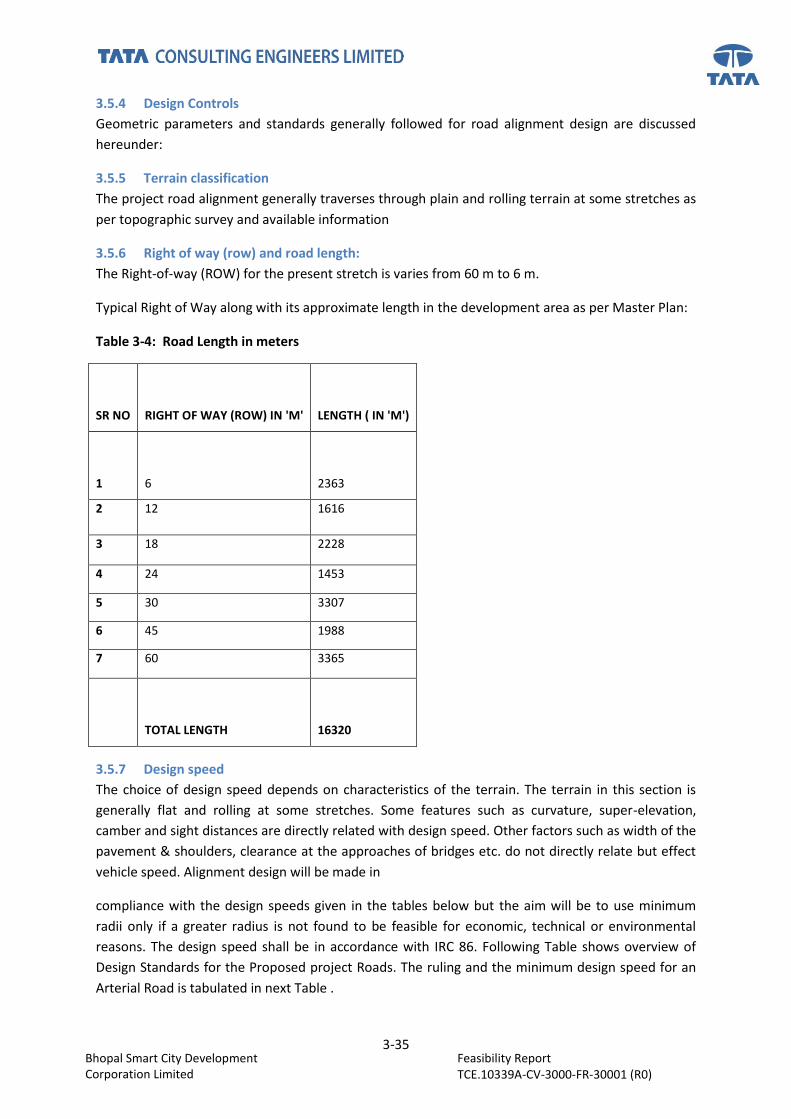
3-35 Feasibility Report
TCE.10339A-CV-3000-FR-30001 (R0)
Bhopal Smart City Development Corporation Limited
3.5.4 Design Controls
Geometric parameters and standards generally followed for road alignment design are discussed
hereunder:
3.5.5 Terrain classification
The project road alignment generally traverses through plain and rolling terrain at some stretches as
per topographic survey and available information
3.5.6 Right of way (row) and road length:
The Right-of-way (ROW) for the present stretch is varies from 60 m to 6 m.
Typical Right of Way along with its approximate length in the development area as per Master Plan:
Table 3-4: Road Length in meters
SR NO
RIGHT OF WAY (ROW) IN 'M'
LENGTH ( IN 'M')
1
6
2363
2 12 1616
3 18 2228
4 24 1453
5 30 3307
6 45 1988
7 60 3365
TOTAL LENGTH
16320
3.5.7 Design speed
The choice of design speed depends on characteristics of the terrain. The terrain in this section is
generally flat and rolling at some stretches. Some features such as curvature, super-elevation,
camber and sight distances are directly related with design speed. Other factors such as width of the
pavement & shoulders, clearance at the approaches of bridges etc. do not directly relate but effect
vehicle speed. Alignment design will be made in
compliance with the design speeds given in the tables below but the aim will be to use minimum
radii only if a greater radius is not found to be feasible for economic, technical or environmental
reasons. The design speed shall be in accordance with IRC 86. Following Table shows overview of
Design Standards for the Proposed project Roads. The ruling and the minimum design speed for an
Arterial Road is tabulated in next Table .

3-36 Feasibility Report
TCE.10339A-CV-3000-FR-30001 (R0)
Bhopal Smart City Development Corporation Limited
Table 3-5 : Applied Design standards
Sr.No. Particulars Ref Code Unit IRC Adopted Value for Bhopal Smart City
Value
1 Design speed IRC:73 -
1980 &
IRC:86-
1983
Km/hr 80/60 80/60 for Arterial Road
60/50 for Sub arterial road
50/40 for collector street
30 for Local Street
2 Cross fall
(i) Carriageway % 2.0-2.5 2.5
(ii) Paved
shoulder
% 2.5-3.0 2.5
(iii) Unpaved % 3.0-4.0 3
3 Gradient : As per IRC 86: Urban roads generally
have intersections at frequent
intervals. In view of this, as a general
rule, a gradient of 4 percent should
be considered the maximum for
urban roads. On roads carrying
predominantly slow moving traffic,
however the gradient should
desirably not exceed 2 percent. At
intersections, the road should be as
near as level as possible.
As the urban roads are generally
kerbed, it would be desirable to
ensure a minimum gradient as
indicated below for facilitating
longitudinal drainage.
2% Maximum gradient and
0.5 % minimum gradient is
adopted for flat terrain.
For hilly terrain 7% is
adopted.
Design
elements
Recommended
minimum

3-37 Feasibility Report
TCE.10339A-CV-3000-FR-30001 (R0)
Bhopal Smart City Development Corporation Limited
Sr.No. Particulars Ref Code Unit IRC Adopted Value for Bhopal Smart City
gradients
Desirable
minimu
m (%)
Desir
able
mini
mum
(%)
Kerbed
Pavements
0.5 0.3
Side
ditches(lines)
0.5 0.2
4 Max. Super
Elevation
% 4% 4%
5 Coefficient of
Lateral Friction
0.15 (Max.) 0.15 (Max.)
6 Minimum
length of
vertical curve
m 50 50
7 Minimum
Horizontal
curve radius
for different
design speeds
m Design
speed in
km/hr
Radius in
m as per
IRC
Design Speed
in Km/hr
Radius in
m as per
IRC
80 265 80 265
60 150 60 150
50 105 50 105
30 40 30 40
8 Stopping sight
distance
M 120/80 120/80
9 Minimum
Transition
length
M 90/80 90/80

3-38 Feasibility Report
TCE.10339A-CV-3000-FR-30001 (R0)
Bhopal Smart City Development Corporation Limited
Width of Carriageway
Sr no. ROW For MCW Median width
Cycle Track Green Belt Footpath
1 60 m 11m MCW with 7.5m Service Road both side
3m 2.5m both side
1.5m both side
6m both side
2 45 m 10.4m both side 1.2 m 2.75 m both side
1.5m both side
7.25m both side
3 30 m 7m both side 1.2 m 2.5 m both side
2.5m both side
2.4m both side
4 24 m 5.5m both side - 2.5 m both side
- 4.0m both side
5 18 m 5.5 m Carriageway - - 1.0m both side
2.5 m both side
6 12 m 5.5 m Carriageway - - - 2.25 m both side
7 6 m (NMT) - - 3m - 3m
3.5.8 Camber/cross fall
Camber or Cross slope is the slope provided to the road surface in the transverse direction to drain
off the rain water from the road surface. Drainage and quick disposal of water from the pavement
surface by providing cross slope is considered important because of two reasons. First reason is to
prevent the entry of surface water into the sub grade soil through pavement and second one is to
remove the rain water from the pavement surface quickly as possible and to allow the pavement to
get dry soon after the rain to avoid the slippery surface as the skid resistance of the pavement
surface gets considerably decreased under wet condition.
The cross fall on straight sections of the road carriageway, cycle tracks and paved portion of the
median shall be 2.5% for bituminous surface and 2.0% for cement concrete surface.
The crossfall for granular Shoulder on straight portion shall be 0.5% steeper than the slope of the
pavement and paved shoulder subject to a minimum of 3.0%. On super elevated section the earthen
portion of the shoulder on the outer side of the curve would be provided with reverse camber of
0.5% so that the earth does not drain on the carriageway.
3.5.9 Intersection
Intersection design shall be as per As per IRC SP: 41-1994, ‘Guidelines for the Design of At-Grade
Intersections in Rural and Urban areas’.
3.5.10 Turning Radius
As per IRC SP 41, the turning radius is based on the type of vehicle i.e. for Passenger car, turning
radius is 7.3m whereas for large semi-truck trailer (WB-18m), it is 18.2m.
Standards of Channelizing Islands:

3-39 Feasibility Report
TCE.10339A-CV-3000-FR-30001 (R0)
Bhopal Smart City Development Corporation Limited
3.5.11 Size of corner Island
The area of island shall be at least 4.5 sqm in urban areas. Accordingly triangular islands should not
be less than 3.5m and preferably 4.5m on a side after rounding of curves. It should be offset from
normal vehicle path by 0.3m to 0.6m.
Centre or divisional islands:
It should be offset by about 1.5m to 3m from edge of main carriage way.
It should not be less than 1.2m wide and 6.0m length. In special cases width can be reduced to 0.6m.
Gap in Central Island of junctions:
To permit easy right turning of large vehicles, the gap in central reserve of junction should be
extended to at least 3m beyond the assumed extension of kerb line of minor road and shape should
be determined by 12 to 15m radius.
Typical Junction drawings will be submitted separately.
3.6 Utilities
The proposed utilities will be placed below the central medians and as well as under the footpaths,
landscape belt corridor depending on the space requirement for each utility, if required then under
road portion (Carriageway and Cycle Track). This methodology will reduce the requirement of
additional ROW (right of way) to accommodate the services.
3.7 Pavement design standards
The choice for the type of pavement shall be governed by the type of traffic, availability of materials
and parent ground conditions.
The Error! Reference source not found. below indicates the design standards to be followed for
flexible pavement and Table indicates the design standards to be followed for rigid pavement.
Table 3-6 : Flexible Pavement Design Standards
S.No. Item Standards
Main carriageway - Flexible Pavement Design
1 Design Methodology IRC 37:2012 for new construction & IRC-81for overlays
2 Design Life 20 years
3 Design Traffic Number of million standard axle (msa) repetitions in
Design life
4 Soil CBR of subgrade Corresponding to soaked laboratory CBR value
Paved Shoulders
5 Cycle Track Cycle Track shall have same thickness and composition as
main carriageway.(Mounted kerb or continuous yellow
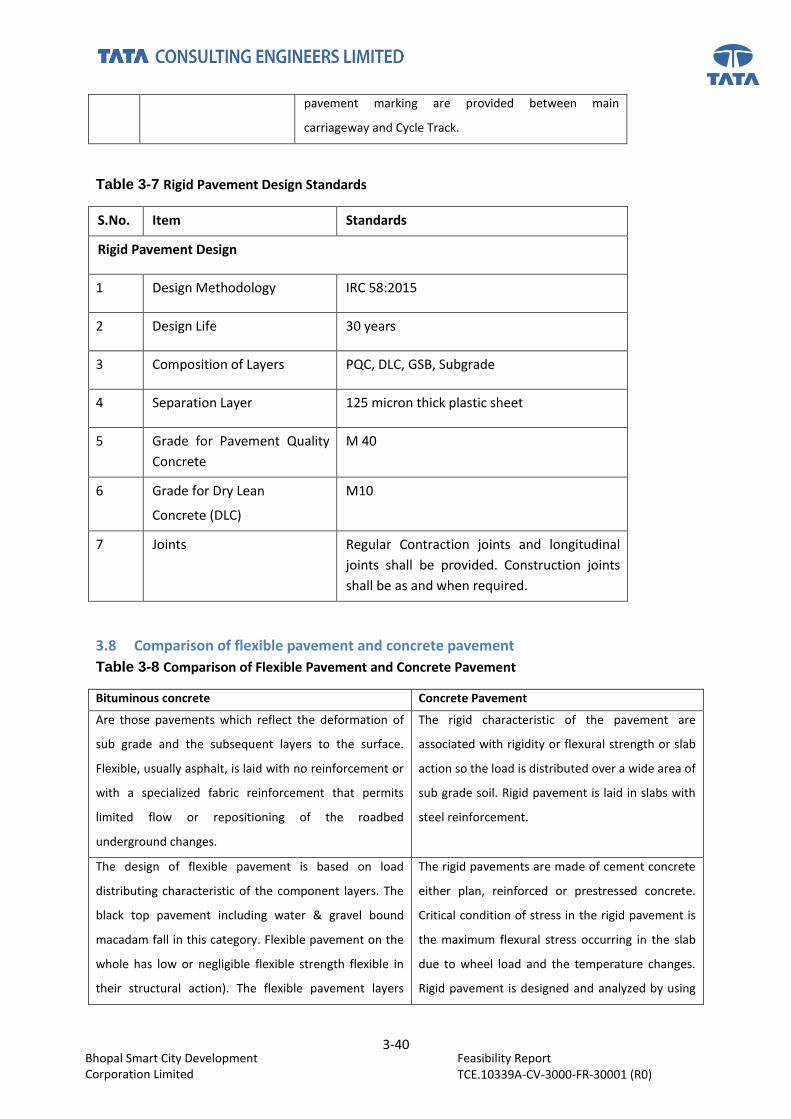
3-40 Feasibility Report
TCE.10339A-CV-3000-FR-30001 (R0)
Bhopal Smart City Development Corporation Limited
pavement marking are provided between main
carriageway and Cycle Track.
Table 3-7 Rigid Pavement Design Standards
S.No. Item Standards
Rigid Pavement Design
1 Design Methodology IRC 58:2015
2 Design Life 30 years
3 Composition of Layers PQC, DLC, GSB, Subgrade
4 Separation Layer 125 micron thick plastic sheet
5 Grade for Pavement Quality
Concrete
M 40
6 Grade for Dry Lean
Concrete (DLC)
M10
7 Joints Regular Contraction joints and longitudinal
joints shall be provided. Construction joints
shall be as and when required.
3.8 Comparison of flexible pavement and concrete pavement
Table 3-8 Comparison of Flexible Pavement and Concrete Pavement
Bituminous concrete Concrete Pavement
Are those pavements which reflect the deformation of
sub grade and the subsequent layers to the surface.
Flexible, usually asphalt, is laid with no reinforcement or
with a specialized fabric reinforcement that permits
limited flow or repositioning of the roadbed
underground changes.
The rigid characteristic of the pavement are
associated with rigidity or flexural strength or slab
action so the load is distributed over a wide area of
sub grade soil. Rigid pavement is laid in slabs with
steel reinforcement.
The design of flexible pavement is based on load
distributing characteristic of the component layers. The
black top pavement including water & gravel bound
macadam fall in this category. Flexible pavement on the
whole has low or negligible flexible strength flexible in
their structural action). The flexible pavement layers
The rigid pavements are made of cement concrete
either plan, reinforced or prestressed concrete.
Critical condition of stress in the rigid pavement is
the maximum flexural stress occurring in the slab
due to wheel load and the temperature changes.
Rigid pavement is designed and analyzed by using

3-41 Feasibility Report
TCE.10339A-CV-3000-FR-30001 (R0)
Bhopal Smart City Development Corporation Limited
transmit the vertical or compressive stresses to the
lower layers by grain transfer through contact points of
granular structure.
the elastic theory.
initial construction cost low Rigid lasts much, much longer i.e 30+ years
compared to 5-10 years of flexible pavements.
Life span is less as compare to Concrete Pavement(High
Maintenance Cost)
In the long run it is about half the cost to install
and maintain. Rigid pavement has the ability to
bridge small imperfections in the sub grade.
High maintenance/repairing cost Less Maintenance cost and Continuous Flow.
High efficiency in terms of functionality
Surfacing cannot be laid directly on the sub grade but a
sub base is needed
Surfacing can be directly laid on the sub grade
Road can be used for traffic within 24 hours Road cannot be used until 14 days of curing
Damaged by Oils and Certain Chemicals No Damage by Oils and Greases
Riding surface is good Better Riding surface
The noise generation is less The noise generation is less
Pavement drainage is good Pavement drainage is good
Considering above factors, it has been decided to propose Flexible Pavement for each class of road.
3.9 Pavement composition for flexible pavement
The flexible pavement for new construction has been designed for a period of 20 years and CBR of
5% has been considered. As per IRC: 37-2012 the pavement crust composition are as presented
below:
Table 3-9 Pavement composition for Flexible Pavement for Different ROW roads
Road Classification 60m
ROW
45 m
ROW
30 m
ROW
18 m
ROW
12 m
ROW
6m ROW
Design Traffic in terms of msa 100 msa 20 msa
Flexible pavement composition of MCW in mm
BC(mm) 50 40
DBM(mm) 115 60
WMM(mm) 250 250
GSB(mm) 200 200
Subgrade (mm) (8% CBR) 500 500
1115 1050

3-42 Feasibility Report
TCE.10339A-CV-3000-FR-30001 (R0)
Bhopal Smart City Development Corporation Limited
However, after initial construction, the pavement may need to be maintained by 50mm thick BC in
every 5 years in addition to routine maintenance.
Table 3-10 Pavement composition of Cycle Track
Cycle Track Pavement Composition
Design Traffic in terms of 2msa Thickness
SDBC(mm) 20
DBM(mm) 50
WMM(mm) 225
GSB(mm) 150
Subgrade (mm) (8% CBR) 500
Table 3-11 Pavement composition of Paver Block
Pavement composition for Footpath
Paver Block 60
Sand Bedding 40
WMM 225
GSB 150
Subgrade(8%CBR) 500
3.10 Proposed road network
Proposed road network is shown in the below map

3-43 Feasibility Report
TCE.10339A-CV-3000-FR-30001 (R0)
Bhopal Smart City Development Corporation Limited
Table 3-12 Proposed Road Network

3-1 Feasibility Report
TCE.10339A-CV-3000-FR-30001 (R0)
Bhopal Smart City Development Corporation Limited
Figure 3-4 Typical Road Cross section of 60 m ROW

3-2 Feasibility Report
TCE.10339A-CV-3000-FR-30001 (R0)
Bhopal Smart City Development Corporation Limited
Figure 3-5 Typical Cross Section of 45 m ROW

3-3 Feasibility Report
TCE.10339A-CV-3000-FR-30001 (R0)
Bhopal Smart City Development Corporation Limited
Figure 3-6 Typical Road Cross section of 30 m ROW

3-4 Feasibility Report
TCE.10339A-CV-3000-FR-30001 (R0)
Bhopal Smart City Development Corporation Limited
Figure 3-7 Typical Road Cross section of 24 m ROW

3-5 Feasibility Report
TCE.10339A-CV-3000-FR-30001 (R0)
Bhopal Smart City Development Corporation Limited
Figure 3-8 Typical Road Cross section of 18 m ROW

3-6 Feasibility Report
TCE.10339A-CV-3000-FR-30001 (R0)
Bhopal Smart City Development Corporation Limited
Figure 3-9 1. Typical Road Cross section of 12 m ROW

3-7 Feasibility Report
TCE.10339A-CV-3000-FR-30001 (R0)
Bhopal Smart City Development Corporation Limited
Figure 3-10 Typical Road Cross section of 6 m RO

3-8 Feasibility Report
TCE.10339A-CV-3000-FR-30001 (R0)
Bhopal Smart City Development Corporation Limited

3-1 Feasibility Report
TCE.10339A-CV-3000-FR-30001 (R0)
Bhopal Smart City Development Corporation Limited
3.11 Design HFL and FRL Requirement
As per Cl. 11.2 of IRC:37-2012, “ Guidelines for the Design of Flexible Pavement”, the bottom of sub
grade shall be atleast 0.6m to 1.0m above the water table / high flood level for the proper
functioning of the pavement structure.
However, we are awaiting for the HFL data. As HFL is required to satisfy the above criteria while
finalizing the vertical profile of the project roads.
3.12 Slope protection
Side slope and earthen shoulder shall be protected against erosion by providing vegetation cover,
kerb channel, chute, stone/concrete block pitching or any other suitable protection measures
depending upon height of embankment and susceptibility of soil to erosion. Rock fill embankment
will be provided in Project stretch where rock is available in huge quantity.
For embankments higher than 6.0m, the design of the embankments shall be done in accordance
with IRC-75 “Guidelines for the design of High Embankments”.
However, the project road is generally on small embankment.
3.13 Benching
As per clause 305.4.2 of MORTH specifications, where an embankment / sub grade is to be placed
against sloping ground, the latter shall be appropriately benched or ploughed/scarified as required
in Clause 305.4.1 before placing the embankment/sub
grade material. Extra earthwork involved in benching or due to ploughing/ scarifying etc. shall be
considered incidental to the work.
3.14 Traffic Control Devices
The road markings and road signs are to be provided as per relevant IRC codes and Manual of
Specifications. The lane markings and object markings are in accordance with Clause – 803 of
“MORT&H”. The road markings are in accordance with IRC: 35 – 2015 and the median kerb and kerb
separator painting is in accordance with Clause 803.3 of “MORT&H”. The road signs are in
accordance with IRC 67 and the text for signboards is as per IRC 30.
3.15 Initial construction cost estimates
3.15.1 General
The primary project cost has been proposed considering the various items of worked associated with
identified improvements so as to assess for evaluating visibility of the project.
3.15.2 Methodology
All broad work items have been identified. The Unit rate of different work items has been derived on
the basis of available schedules of rates of MP-PWD 2016 for roads. Quantities of different work
have been worked out considering the typical cross section, proposed improvements road
alignment.
3.15.3 Estimation of Quantities and Cost
The quantities of following major items of work were considered for cost estimation.

3-2 Feasibility Report
TCE.10339A-CV-3000-FR-30001 (R0)
Bhopal Smart City Development Corporation Limited
Table 3-13 List of Major Items of work
Sr No Item Unit
1 Clearing & grubbing Ha
2 Sub Grade & ES Construction Cum
3 Granular Sub base Cum
4 Base Cum
5 Median Cum
6 Primer Coat Sqm
7 Tack Coat 1 Sqm
8 Dense Graded Bituminous Macadam Cum
9 Tack Coat 2 Sqm
10 Bituminous concrete cum
11 Construction Dry lean Concrete cum
12 Construction of Plain Jointed Cement concrete pavement cum
13 Concrete Paver Blocks sqm
14 Construction of Cement concrete kerb Rmt
15 Road Marking with Glass beads Sqm
16 Retro- refectorised stop signboards Nos.
17 Retro- reflectorised hazard marker boards Nos.
18 Retro- reflectorised facility signboards Nos.
19 Retro- reflectorised cautionary signboards Nos.
20 Retro- reflectorised mandatory signboards Nos.
21 Metal beam crash barrier Rmt.
22 Guard railing Rmt.
23 Planting of Trees Nos.
24 Street Lights Nos.
25 Miscellaneous cost is added as 30% of Total cost
Details of Road furniture included in Cost estimates are:

3-3 Feasibility Report
TCE.10339A-CV-3000-FR-30001 (R0)
Bhopal Smart City Development Corporation Limited
Curb stone (Along Footpath and median)
Road marking with glass beads
Sign boards (Stop, Cautionary, Mandatory, Hazard, Facility information @ 2 per km)
Guard rail (On footpath towards road edge)
Metal beam crash barrier (only for 45m ROW Ring Road)
Miscellaneous cost is added to account for item cost not included in the BOQ such as Costing of
street lighting, landscaping, and Utility relocation (if required)
No of trees and street lights have been calculated without the cost factor attached to it.
Based on Typical cross section sample BOQ and Cost Estimate is prepared and further converted to
per Km cost. Details pertaining to Typical Cross section and BOQ are given in Appendix.
Per km cost for various Road classification.
Table 3-14 Per Km Cost
Sr. No Type of Road Rate ( per Km.)
1 60 m RoW Road 14.133
2 45 m RoW Road 9.895
3 30 m RoW Road 5.875
4 24 m RoW Road 5.552
5 18 M RoW Road 3.485
6 12 M RoW Road 2.681
7 6 (NMT) 1.221
Total Length 16320
3.16 Summary of Cost Estimate
Sr. No Type of Road Length Of Road
(.Km)
Rate ( per Km.) Cost (Cr.)
1 60 m RoW Road 3.365 14.133 47.558
2 45 m RoW Road 1.988 9.895 19.672
3 30 m RoW Road 3.307 5.875 19.427
4 24 m RoW Road 1.453 5.552 8.066
5 18 M RoW Road 2.228 3.485 7.765
6 12 M RoW Road 1.616 2.681 4.332
7 6 (NMT) 2.363 1.221 2.886
Total Length 16.320 Total Cost 109.708

4-4 Feasibility Report
TCE.10339A-CV-3000-FR-30001 (R0)
Bhopal Smart City Development Corporation Limited
4 Chapter 4 WATER SUPPLY
4.1 Introduction
Provision of safe, adequate water is a basic necessity for the healthy living of a community.Water
demand will be estimated based on the projected population, agreed unit demand norms along with
water requirements for Industrial use, irrigation use etc, On the basis of the total water demand
estimated, requirement of treated water, transmission main system (from MBR to ESR’s),
distribution system, storage requirements including service reservoirs and pumping station
capacities will be assessed.
4.2 Water Demand
Water demand will be estimated based on the unit demand norms along with the projected
population for various phases of development as per smart city master plan; total water demand will
be computed for both potable and recycled uses separately for various types of users such as
domestic, commercial, institutional and industrial areas as depicted in table 4.1 below. Summary of
phase wise demands for potable water demands are listed in the table below.
Table 4-1 Water demand unit norms
Category CPHEEO Norms (lpcd) Total
(lpcd)
Remarks
Potable Recycled
Residential 105 45 150 CPHEEO Manual
and NBC
manual Commercial 20 25 45 CPHEEO Manual
and NBC manual Floating population 5 10 15 NBC norms

4-5 Feasibility Report
TCE.10339A-CV-3000-FR-30001 (R0)
Bhopal Smart City Development Corporation Limited
Table 4-2 Phase-wise Water Demand-Potable
Sr. No. Phase Residential
(MLD)
Commercial
(MLD)
Floating
(MLD)
1 1A 2.638 0.942 0.05
2 1B 1.676 0.355 0.02
3 2A 1.728 0.49 0.04
4 2B 1.337 0.383 0.03
TOTAL 7.38 2.171 0.14
Table 4-3 Phase-wise Water Demand-Recycled
Sr. No. Phase Residential
(MLD)
Commercial
(MLD)
Floating
(MLD)
1 1A 1.13 1.18 0.10
2 1B 0.72 0.44 0.05
3 2A 0.74 0.61 0.08
4 2B 0.57 0.48 0.06
TOTAL 3.16 2.71 0.28
4.3 Fire Demand
Water supply requirements for fire fighting will depend on various factors like type of construction,
nature of occupancy, type and quantity of material handled and stored etc. the essential
requirements for any source of water for fire fighting shall be
Ready available of supply at all times
Easily approachable and workable by normal fire appliances
Water supply pipeline located within workable distances
The fire risk in any town/city is seldom uniform throughout and it may vary widely in different areas.
It may be the lowest in well laid out predominantly residential locality, with small shopping centres
and increasing in thickly populated congested areas, commercial Centres, ware houses and industrial
complexes.

4-6 Feasibility Report
TCE.10339A-CV-3000-FR-30001 (R0)
Bhopal Smart City Development Corporation Limited
The overall requirements may, therefore, needs to be worked out on population basis. Hence, Fire
demand in cum/day will be computed as 100*P^0.5, where P is Population in thousands. The fire
demand for the entire site comes out to be 0.84 MLD.
4.4 Other Demands
Excess recycled water if any can be utilized to meet the other demands such as road washing,
flushing of sewers, emergency fire fighting, replenishment of natural ponds within project area,
HVAC etc.
4.5 Water Mass Balance
The water balance diagram is prepared with zero discharge concepts. All wastewater generated
from domestic and commercial consumers will be treated appropriately to the required standards in
the Waste water treatment plants (up to tertiary treatment level) located inside smart city area. The
treated wastewater will be used for irrigation of land and gardens, parks and agricultural fields, and
industrial uses; hence, the treated waste water will be reused 100% for recycle purpose. The treated
wastewater will be used for flushing purpose. During monsoon season the treated water
requirement for irrigation purpose is less compared to non monsoon season, the excess tertiary
treated wastewater will be collected in collection tank and the overflow from the collection tank will
be safely discharged into nearby water body.
4.6 Potable water supply system:
There are three options studied to finalise the potable water supply system –
4.6.1 Option- 1: Distribution with gravity system by providing new ESR
In this option of water supply system, polishing treatment unit and 2 ESR’s of 1.75 ML with 12m of
staging height is placed in same campus at plot 44. Polishing treatment plan is provided with 1ML (2
hrs approximately) of Clear water reservoir, which will pump water to the ESR. Capacity of ESR is
considered as 8 hrs.
Figure 4-1 Schematic of Water Supply System Option-1
Polishing Treatment Plant
CWR
Capacity 1 ML
(2 hrs)
ESR - 1
Capacity 1.75 ML
Distribution System
ESR - 2
Capacity 1.75 ML
Distribution System
Plot No.44

4-7 Feasibility Report
TCE.10339A-CV-3000-FR-30001 (R0)
Bhopal Smart City Development Corporation Limited
4.6.2 Advantages / Disadvantages :
Sr. No. Advantages Disadvantages
1 Good water reliability within the site.
Water availability is upto 4.5 ML i.e.
approximately 10 hrs of daily demand.
Provision of elevated storage reservoir
increases the capital cost.
2 Pumping machinaries required are for
lesser capacities compared to pumping
distribution system.
As pumping is needed to be done for
average flow (From polishing treatment
unit to ESR).
3 Lesser operational and maintainance
cost compared to pumping distribution
system.
4 Criticality on the pumping machinaries is
less. As good amount of water will be
always stored in ESR.
4.6.3 Option- 2: Distribution with Pumping System
In this option of water supply system, polishing treatment unit is provided with clear water reservoir
at plot 44. Capacity of clear water reservoir is provided as 3.5 ML, considering 8 hrs of daily demand.
Water distribution is made by pumping the water through the pumping station provided at same
location.
Figure 4-2 Schematic of Water Supply System Option-2
4.6.4 Advantages / Disadvantages :
Sr. No. Advantages Disadvantages
1 Good water reliability within the site. Water Criticality of the pumping units are more.
Polishing Treatment Plant
CWR + Pumping Station
Capacity 3.5 ML
(8 hrs)
Distribution System
Plot No.44

4-8 Feasibility Report
TCE.10339A-CV-3000-FR-30001 (R0)
Bhopal Smart City Development Corporation Limited
availability is upto 3.5 ML i.e. approximately
8 hrs of daily demand.
2 Provision of ground storage reservoir
increases the capital cost. But capital cost is
less compared to option-1.
Pumping machinaries required are for higher
capacities compared to gravity distribution
system.
As pumping is needed to be done for peak flow
(From polishing treatment unit to distribution
network).
3 Higher operational and maintainance cost
compared to gravity distribution system.
4.6.5 Option- 3: Distribution System with Existing ESR
In this option of water supply system, distribution system is designed by considering 3 existing ESR.
The ESR’s considered are Jawahar Chowk, TT Nagar and Shastri Nagar. All these 3 ESR are newly
constructed under JNNURM Scheme and yet to be commissioned. The details of ESR are provided in
the table below:
Table 4-4 Details of Existing ESR
ESR Capacity of ESR
(ML)
Staging Height
(m)
Jawahar Chowk 0.9 18
Shastri Nagar 1.87 12
TT Nagar ESR 0.5 18
3.27
The required capacity of ESR is considered as 8 hrs of daily demand for the zone. As per the
proposed zoning and analysis it is observed that capacity of Jawahar Chowk and TT Nagar ESR is less
for the proposed zoning. Jawahar Chowk and TT Nagar zonal water storage capacity need to be
augmented by 0.25ML and 0.5ML respectively by adding extra ESR of deficit capacity at the same
location.

4-9 Feasibility Report
TCE.10339A-CV-3000-FR-30001 (R0)
Bhopal Smart City Development Corporation Limited
Figure 4-3 Potable Water Distribution Zones
4.7 Assumptions:
Due to insufficiency of data following assumptions are made, while working out the alternative -
Capacity of ESR is worked out assuming that there will be no water supplied to the external
area. If there is any external command area to be served, capacity needed to augmented in
addition to the above mentioned figures.
It is assumed that transmission network supplying water to these ESR’s is sufficient to carry
water demand for the smart city area.
4.7.1 Advantages / Disadvantages :
Sr. No. Advantages Disadvantages
1 Good water reliability within the site.
Water availability is upto 4.
External command area is not considered
while calculating capacity due to
insufficient data.
2 Capital cost is less as compared to
Option-1 and option-2. As existing ESR is
utilized with some agumentation in
Jawahar Chowk and TT Nagar ESR zones.
It is assumed that transmission network is
sufficient to take demand of smart city
area.
3 Pipe Sizes are smaller compared to both
options, as entire demand getting split
into three zones.
Jawahar Chowk and TT Nagar ESR zones
require augumentation of storage
capacity. Space allocation to be made for

4-10 Feasibility Report
TCE.10339A-CV-3000-FR-30001 (R0)
Bhopal Smart City Development Corporation Limited
dificit capacity ESR at the same location.
4 At few demand nodes pressure observed is
less than 7m.
5 This option of water supply is pretty much
dependant on the demand of external
area.
4.8 Recommendation:
After study of best possible alternatives, TCE recommends to have option-1 potable water supply
system with provision of Elevated storage reservoir.
Capital cost incur to have option-1 is higher with respect to other two options. But the water
availability and operation and maintenance cost is on lower side. So it is recommended to have
option-1.
4.9 Design criteria
4.9.1 Transmission system:
Transmission system is designed with consideration of 22 hours/day for ultimate demand up to
service reservoirs. A minimum residual pressure of 2.0m will be considered over the full supply level
of the service reservoir. The minimum design velocity is 0.60m/s and the maximum is 2.5m/s will be
maintained. A peak factor of 1.1 will be considered for transmission system design
4.9.2 Distribution system:
Local distribution network downstream of the service reservoir will be considered as a looped
network on the road layout. The system will be planned to supply water from the service reservoir to
the individual parcel by gravity on 24 x 7 basis. It is suggested to have separate underground tanks
within each Land parcel which will take care of local hourly fluctuations (inside each plot area- to be
developed by individual land developer). However Peak factor of 1.5 is be considered for distribution
system design.
4.9.3 Pipe diameter
It is planned to use 90mm dia pipe as the minimum pipe diameter required for distribution (at the
dead ends) and 110mm dia pipe in the Loop networks for both potable and Recycled water
pipelines.
4.9.4 Excavation depth
All water supply pipes will be generally laid below ground with the clear cover of 1m above the
crown of the pipes.
4.9.5 Residual pressure:
The system will be designed for a minimum residual pressure of 12m as per CPHEEO Manual (for
double storey building) above ferrule point (for potable and Recycled supply) at the nodes of
distribution system (at the individual land parcel point).

4-11 Feasibility Report
TCE.10339A-CV-3000-FR-30001 (R0)
Bhopal Smart City Development Corporation Limited
4.9.6 ‘C’ VALUE:
This will be purely on the basis of the pipe material selected. For MS pipes a value of 130 is
considered and for Plastic pipe such as HDPE a value of 140 will be considered.
Table 4-5 C value
Sl. No. Pipe Material New Pipes
1 Ductile Iron pipes 140
2 Plastic pipes (HDPE) 145
4.9.7 SOFTWARE:
Water Gems V8i software will be used for modelling of the network. Water-GEMS is a
comprehensive and easy to use water distribution modelling application software having Graphic
user interfaces. Water-GEMS can be used with ArcGIS, AutoCAD, and Micro-Station, or as a stand-
alone application. Water Gems is widely used in India and Overseas for water supply transmission
and distribution design and analysis, Hence the same software has been used for DMICDC- TP-2W
designs also.
4.9.8 Frictional loss formula:
Based on prior experience, it is proposed to use Hazen William’s equation for the network analysis.
Hazen William’s Equation:
Q= 1.292x10(-5) x C x D2.63 x (Hf/L) 0.54
Where ,
Q= Flow (cum/hr)
D= Diameter of pipe (mm)
Hf = Head loss (m)
L= length of pipe (m)
C= Hazen William’s constant.
4.9.9 Bedding:
Fine sand or screened excavation material type of bedding will be provided depending on the depth
of pipe line, backfill pressure & type of pipe. The depth of bedding will be about 15 cm for pipe
diameters up to 400mm and 20cm for pipes greater than 400mm dia. Sand encasements all round
the pipes up to the pipe crown level will be suggested to avoid corrosiveness of the soil for metallic
pipes only. Granular bedding have been suggested for HDPE pipes.
4.9.10 Pumping system design:
The pumps will be designed for 22 hours of pump operation. The civil works will be of RCC, pump
machinery selection will be with standby arrangement (1W+1S); for single pump in operation and
2W+1S for multiple pumps in operation. Installation of pumps will also be as per the phasing
development plan. Additional pumps will be added as per the phasing plan.

4-12 Feasibility Report
TCE.10339A-CV-3000-FR-30001 (R0)
Bhopal Smart City Development Corporation Limited
4.9.11 Service Reservoirs:
Service Reservoirs will be provided depending on the ground profile, frictional losses in pipes and
residual pressure required at the consumer end. The structural design of the Service Reservoir
considered will be as per the requirements and geotechnical investigations. The staging height of the
reservoirs is generally kept to suit the minimum residual pressure required at the consumer points.
Capacity of service reservoirs can be considered as one third of daily demand i.e. 8hrs of average
hourly flow. One third of the fire-fighting requirements will be considered as the fire storage
requirements in the service reservoirs (in Potable reservoirs only) as per CPHEEO manual.
4.9.12 Losses:
10% of the losses will be considered in the distribution networks design as UFW losses as per the
CPHEEO manual.
4.9.13 Bulk meters:
Bulk meters will be suggested in all the Inlet and outlets of the service reservoirs, out lets of the
pumping stations to aid as monitoring devices for UFW calculations. All consumer connection shall
also be metered and volumetric billing needs to be generated on monthly basis. This will ensure that
lower consumption is encouraged along with accountability in consumption.
4.9.14 UFW monitoring and reduction:
Unaccounted For Water (UFW) is the difference between the total amount of water entering the
distribution system and the total amount consumed (billed). This can be monitored by dividing the
Distribution zones into number of isolated area i.e. DMA (District Metering Areas). Each DMA area
would be having a well defined boundary with DMA meters (bulk flow meters) along with the
individual consumer meters at the consumer point; valves will be provided on both upstream and
downstream of the DMA meter for easy maintenance. Boundary valves are planned on the boundary
of each DMA areas where pipes are interlinked. These boundary valves will generally be kept in
closed position and are operated only during emergency. These DMA’s shall be further divided into
sub zones with valve for monitoring and reduction of UFW. This helps in isolating a part of the area
during repairing of leaks or carrying out maintenance, without interrupting the total supply to the
DMA. On an average 250 to 500 connections will be made as one DMA.
Leakage needs to be evaluated from flow measurements taken at DMA flow meters location when
demand in the DMA is at minimum. This will generally be between the hours of 01.00 and 04.00 AM
i.e. Minimum Night Flow (MNF). From this Minimum Night Flow (MNF), deductions shall be made for
metered consumption by large water users during the evaluation period and legitimate use by the
remaining consumers by making allowance for toilet flushing, etc termed as Net Night Flow (NNF).
Where it is not possible to supply and pressurize the DMA sufficiently then the mobile tanker and
pump approach can be implemented to progressively locate and repair leaks on isolated lengths of
the distribution pipelines.
This process of identifying the leak and plugging the leaks shall be carried out as a routine operation
until the desired UFW level is achieved (i.e. Less than 10%).

4-13 Feasibility Report
TCE.10339A-CV-3000-FR-30001 (R0)
Bhopal Smart City Development Corporation Limited
4.9.15 Valves:
For operation and maintenance of transmission and distribution system minimum numbers of valves
are necessary. Ideally in a continuous supply system every branch should have a valve to enable
isolation of line in stretches.
The transmission and distribution mains will be provided with the following appurtenances and
specials as per the following criteria.
The mains are provided with sluice valves for isolation of different loop networks. The size of
the valve is same as pipe diameter.
All the valves are enclosed in valve chambers with manhole cover.
At bends and gaps, suitable specials are provided. The use of specials will be kept to the
minimum possible.
Pressure reducing valves will be provided to reduce the pressure difference between the
locations of the same zones to maximum of 3-5m.
Concrete thrust block will be provided at the bend of the pipes to avoid movement of pipe
line as per the requirements.
Air valves / Isolation valves will be suggested at the summit location and at every 1km
interval on the rising main / feeder mains as per the terrain requirements.
4.10 Pipe material
Pipes represent a large proportion of the capital investments of the water supply network. The pipe
materials have to be judiciously selected not only from the point of view of durability; overall
installation and maintenance cost of the pipeline should also be considered to ensure that the
function and performance of the pipeline is assured throughout the design life.
Selection of pipe material will be based on the following considerations, Initial carrying capacity of
pipe and its reduction with use i.e.
Hazen William's coefficient C.
Ability of pipe to resist internal pressure and external loads.
Life and durability of pipe.
Existing soil, hydrological and climatic conditions ( salinity and water table level)
Ease in transportation, handling and laying.
Economy and availability of pipes and specials.
Availability of skilled manpower in construction and commissioning of pipelines.
Ease in operations and maintenance.
The following pipes can be used for transmission and distribution network i.e. HDPE, DI, PVC, GI and
MS pipes. Also, the following pipe materials are generally available in the market, widely used in the

4-14 Feasibility Report
TCE.10339A-CV-3000-FR-30001 (R0)
Bhopal Smart City Development Corporation Limited
water industry and hence analysed separately for transmission and distribution system. The detailed
pipe material selection aspects have been provided as
4.10.1.1 Recommendations on pipe material selection:
The following pipe materials have been recommended for use in the proposed project
Table 4-6 Pipe material selection summary
Sr. No. Preferable Size Preferable Class
1 Up to 315mm HDPE-100-PN6
2 Above 350mm Dia DI-K7 pipes
4.11 Cost estimates:
Block cost for potable water supply and recycled water supply is tabulated below -
Table 4-7 Block Cost Sr.
No.
Options/Alternatives Block Cost
(In Cr.)
1 Option-1: Distribution with gravity system by providing new ESR 7.50
2 Option- 2: Distribution with Pumping System 6.50
3 Option- 3: Distribution System with Existing ESR 5.25
4.12 Population and water demand:
As per the Master Plan water demand estimations has been carried out based on the unit water
demand norms provided in the earlier sections. The details of the same along with the summary are
provided in the table below.

4-1 Feasibility Report
TCE.10339A-CV-3000-FR-30001 (R0)
Bhopal Smart City Development Corporation Limited

4-1 Feasibility Report
TCE.10339A-CV-3000-FR-30001 (R0)
Bhopal Smart City Development Corporation Limited
Table 4-8 Water demand calculation for Bhopal Smart City
Plot No. Phase Resident
Population
Commercial
Population
Floating
Population
Residential Demand
(MLD)
Commercial Demand
(MLD)
Floating Demand
(MLD)
Total Potable
Demand
(MLD)
Total Non Potable
Demand
(MLD)
Potable Recycle Potable Recycle Potable Recycle
1 2A 1056 4278 628 0.111 0.048 0.086 0.107 0.003 0.006 0.200 0.221
2 2A 1067 4324 635 0.112 0.048 0.086 0.108 0.003 0.006 0.202 0.223
3 2A 1079 4369 642 0.113 0.049 0.087 0.109 0.003 0.006 0.204 0.225
4 2A 1053 4265 627 0.111 0.047 0.085 0.107 0.003 0.006 0.199 0.220
5 2B 959 976 287 0.101 0.043 0.020 0.024 0.001 0.003 0.122 0.116
6 2B 0 1045 78 0.000 0.000 0.021 0.026 0.000 0.001 0.021 0.076
7 2B 1143 0 229 0.120 0.051 0.000 0.000 0.001 0.002 0.121 0.097
8 2A 1157 1178 346 0.122 0.052 0.024 0.029 0.002 0.003 0.147 0.127
9 2A 0 0 259 0.000 0.000 0.000 0.000 0.001 0.003 0.001 0.058
10 2B 0 1564 117 0.000 0.000 0.031 0.039 0.001 0.001 0.032 0.087
11 2B 1142 0 228 0.120 0.051 0.000 0.000 0.001 0.002 0.121 0.097
12 2B 1281 1303 383 0.134 0.058 0.026 0.033 0.002 0.004 0.162 0.136
13 2A 0 2000 150 0.000 0.000 0.040 0.050 0.001 0.002 0.041 0.138
14 2A 2236 0 447 0.235 0.101 0.000 0.000 0.002 0.004 0.237 0.175
15 2A 1612 0 322 0.169 0.073 0.000 0.000 0.002 0.003 0.171 0.130
16 2A 1922 0 384 0.202 0.087 0.000 0.000 0.002 0.004 0.204 0.165
17 2A 861 0 172 0.090 0.039 0.000 0.000 0.001 0.002 0.091 0.076
18 2A 0 0 495 0.000 0.000 0.000 0.000 0.002 0.005 0.002 0.090
19 2A 0 2338 175 0.000 0.000 0.047 0.058 0.001 0.002 0.048 0.123
20 2A 0 0 1287 0.000 0.000 0.000 0.000 0.006 0.013 0.006 0.229
21 1A 606 0 121 0.064 0.027 0.000 0.000 0.001 0.001 0.064 0.051

4-2 Feasibility Report
TCE.10339A-CV-3000-FR-30001 (R0)
Bhopal Smart City Development Corporation Limited
Plot No. Phase Resident
Population
Commercial
Population
Floating
Population
Residential Demand
(MLD)
Commercial Demand
(MLD)
Floating Demand
(MLD)
Total Potable
Demand
(MLD)
Total Non Potable
Demand
(MLD)
22 1A 609 0 122 0.064 0.027 0.000 0.000 0.001 0.001 0.065 0.051
23 1A 1218 0 244 0.128 0.055 0.000 0.000 0.001 0.002 0.129 0.099
24 1A 889 905 266 0.093 0.040 0.018 0.023 0.001 0.003 0.113 0.091
25 2B 1219 1240 365 0.128 0.055 0.025 0.031 0.002 0.004 0.155 0.124
26 2B 0 1646 123 0.000 0.000 0.033 0.041 0.001 0.001 0.034 0.085
27 2B 0 0 184 0.000 0.000 0.000 0.000 0.001 0.002 0.001 0.042
28 2B 0 0 387 0.000 0.000 0.000 0.000 0.002 0.004 0.002 0.085
29 2B 0 0 1000 0.000 0.000 0.000 0.000 0.005 0.010 0.005 0.419
30 2B 687 2783 409 0.072 0.031 0.056 0.070 0.002 0.004 0.130 0.142
31 2B 715 2895 425 0.075 0.032 0.058 0.072 0.002 0.004 0.135 0.148
32 1B 354 1432 210 0.037 0.016 0.029 0.036 0.001 0.002 0.067 0.074
33 1A 28 18136 1774 0.003 0.001 0.363 0.453 0.009 0.018 0.375 0.637
34 1A 1575 1603 471 0.165 0.071 0.032 0.040 0.002 0.005 0.200 0.170
35 2A 1370 0 274 0.144 0.062 0.000 0.000 0.001 0.003 0.145 0.116
36 2A 1317 0 263 0.138 0.059 0.000 0.000 0.001 0.003 0.140 0.112
37 2A 1726 1757 517 0.181 0.078 0.035 0.044 0.003 0.005 0.219 0.175
38 2B 1206 1227 361 0.127 0.054 0.025 0.031 0.002 0.004 0.153 0.128
39 2B 1004 0 201 0.105 0.045 0.000 0.000 0.001 0.002 0.106 0.091
40 2B 0 1030 77 0.000 0.000 0.021 0.026 0.000 0.001 0.021 0.080
41 1A 1106 1125 331 0.116 0.050 0.022 0.028 0.002 0.003 0.140 0.122
42 2B 1670 1699 500 0.175 0.075 0.034 0.042 0.002 0.005 0.212 0.182
43 2B 1714 1744 513 0.180 0.077 0.035 0.044 0.003 0.005 0.217 0.187
44 1A 0 1644 123 0.000 0.000 0.033 0.041 0.001 0.001 0.034 0.120
45 1A 1590 1618 476 0.167 0.072 0.032 0.040 0.002 0.005 0.202 0.172

4-3 Feasibility Report
TCE.10339A-CV-3000-FR-30001 (R0)
Bhopal Smart City Development Corporation Limited
Plot No. Phase Resident
Population
Commercial
Population
Floating
Population
Residential Demand
(MLD)
Commercial Demand
(MLD)
Floating Demand
(MLD)
Total Potable
Demand
(MLD)
Total Non Potable
Demand
(MLD)
46 1B 1327 0 265 0.139 0.060 0.000 0.000 0.001 0.003 0.141 0.117
47 1B 0 2214 166 0.000 0.000 0.044 0.055 0.001 0.002 0.045 0.120
48 1B 0 0 0 0.000 0.000 0.000 0.000 0.000 0.000 0.000 0.067
49 1B 0 3601 270 0.000 0.000 0.072 0.090 0.001 0.003 0.073 0.193
50 1A 1370 1394 410 0.144 0.062 0.028 0.035 0.002 0.004 0.174 0.147
51 1A 1256 1278 376 0.132 0.057 0.026 0.032 0.002 0.004 0.159 0.135
52 1A 1316 0 263 0.138 0.059 0.000 0.000 0.001 0.003 0.139 0.101
53 1A 0 0 209 0.000 0.000 0.000 0.000 0.001 0.002 0.001 0.048
54 1A 958 0 192 0.101 0.043 0.000 0.000 0.001 0.002 0.102 0.087
55 1A 1314 0 263 0.138 0.059 0.000 0.000 0.001 0.003 0.139 0.101
56 1A 0 0 235 0.000 0.000 0.000 0.000 0.001 0.002 0.001 0.053
57 1A 1803 1835 540 0.189 0.081 0.037 0.046 0.003 0.005 0.229 0.195
58 1A 1923 1957 576 0.202 0.087 0.039 0.049 0.003 0.006 0.244 0.200
59 1A 1064 1083 318 0.112 0.048 0.022 0.027 0.002 0.003 0.135 0.112
60 1A 1132 1152 339 0.119 0.051 0.023 0.029 0.002 0.003 0.144 0.123
61 1A 1256 1278 376 0.132 0.057 0.026 0.032 0.002 0.004 0.159 0.137
62 1B 2067 2103 618 0.217 0.093 0.042 0.053 0.003 0.006 0.262 0.196
63 1B 1387 5617 825 0.146 0.062 0.112 0.140 0.004 0.008 0.262 0.255
64 1A 0 1585 119 0.000 0.000 0.032 0.040 0.001 0.001 0.032 2.573
65 1A 1250 5064 744 0.131 0.056 0.101 0.127 0.004 0.007 0.236 0.231
66 1A 837 3392 498 0.088 0.038 0.068 0.085 0.002 0.005 0.158 0.169
67 1A 2027 2062 607 0.213 0.091 0.041 0.052 0.003 0.006 0.257 0.205
68 1B 1113 0 223 0.117 0.050 0.000 0.000 0.001 0.002 0.118 0.105
69 1B 0 0 75 0.000 0.000 0.000 0.000 0.000 0.001 0.000 0.019

4-4 Feasibility Report
TCE.10339A-CV-3000-FR-30001 (R0)
Bhopal Smart City Development Corporation Limited
Plot No. Phase Resident
Population
Commercial
Population
Floating
Population
Residential Demand
(MLD)
Commercial Demand
(MLD)
Floating Demand
(MLD)
Total Potable
Demand
(MLD)
Total Non Potable
Demand
(MLD)
70 1B 5342 0 1068 0.561 0.240 0.000 0.000 0.005 0.011 0.566 0.432
71 1B 1626 0 325 0.171 0.073 0.000 0.000 0.002 0.003 0.172 0.145
72 1B 0 0 0 0.000 0.000 0.000 0.000 0.000 0.000 0.000 0.003
73 1B 0 0 0 0.000 0.000 0.000 0.000 0.000 0.000 0.000 0.003
74 1B 0 0 0 0.000 0.000 0.000 0.000 0.000 0.000 0.000 0.003
75 1B 0 0 0 0.000 0.000 0.000 0.000 0.000 0.000 0.000 0.003
76 1B 0 0 0 0.000 0.000 0.000 0.000 0.000 0.000 0.000 0.003
77 1B 0 0 0 0.000 0.000 0.000 0.000 0.000 0.000 0.000 0.003
78 1B 0 0 0 0.000 0.000 0.000 0.000 0.000 0.000 0.000 0.003
79 1B 0 0 0 0.000 0.000 0.000 0.000 0.000 0.000 0.000 0.003
80 1B 2749 2797 823 0.289 0.124 0.056 0.070 0.004 0.008 0.349 0.269
TOTAL 70285 108533 28353 7.38 3.16 2.17 2.71 0.14 0.28 9.69 13.07

5-1 Feasibility Report
TCE.10339A-CV-3000-FR-30001 (R0)
Bhopal Smart City Development Corporation Limited
5 Chapter Water Treatment Plant
5.1 Introduction
Bhopal has been selected as one of the first twenty Indian cities to be developed as a smart
city under GoI's Smart City Project. Bhopal is the only city that has opted for redevelopment model
for its Area Based Development (ABD). TT Nagar area has been selected by BSCDCL for the same.
ABD Area is planned as Mixed Use Compact Development within the heart of Bhopal city which is
further part of the urban fabric of the city. More than 90% of land in this area is owned by
government and it is planned to unlock the value of this underutilized government land in the heart
of the city. The redevelopment area is of 360 acres of North and South TT Nagar with Gamon
development on one side and New Market area on the other. At present, for North TT area is
supplied by Upper Lake & South TT area from WTP at Kolar Reservoir. The Kolar Reservoir will serve
as a dedicated source for the entire project area. The capacity of the dam is 265 MCM. The present
water supply to city from Kolar Water treatment plant is 155 MLD. This will continue to serve as the
source for the ABD area. The proposed water demand for the ABD area is 11.00 MLD. But as per the
proposed ABD development, only Kolar will serve as source for Bhopal Smart City. About 40 Km line
is coming from the WTP at Kolar Reservoir and WTP is older so to ensure supply of good quality of
water Polishing treatment plant will be provided.
5.2 INLET WATER TO POLISHING WATER TREATMENT PLANT:
5.2.1 Quantity:
BSCDCL will supply 11 MLD of treated water from Kolar treatment plant.
5.2.2 Quality:
A typical treated water quality at Kolar WTP is enclosed with the Report. The long-
term results of treated water quality will reveal the likely variation in the results of
various parameters which will exceed the acceptable standards.
5.2.3 Polishing water quality standards:
The polished water quality of high standard expected shall be based on CPHEEO and
WHO Norms (whichever is stringent) The polishing water treatment plant will
achieve targeted turbidity of 0.2 NTU at 95% percentile (max 0.5 NTU) for effective
UV treatment in view of high quality water requirement.
5.2.4 TREATMENT PROCESS:
5.2.4.1 BASIC PARAMETERS:
The following aspects will be considered:
a) Inlet and outlet water quality
b) Area available (compact plant).

5-2 Feasibility Report
TCE.10339A-CV-3000-FR-30001 (R0)
Bhopal Smart City Development Corporation Limited
c) Capable of producing specified water quality
d) Aesthetically good
e) Health and safety aspects
f) Modular construction
g) Automatic operation of plant with PLC.
h) Least life cycle cost i.e. capital and O & M cost
5.2.4.2 GENERAL REQUIREMENTS:
It is necessary to monitor the inlet water quality at the TT Nagar area itself apart
from flow measurement. For these purpose parameters such as turbidity, pH, and
residual chlorine will be monitored on continuous basis; where as other parameters
will be tested at desired intervals. The Laboratory will be established within the plant
premises for routine tests to be conducted for efficient operation of the plant. The
treated water supplied by Kolar WTP at TT Nagar area will have residual head of
about 30-40 m, which will be utilized, to the extent possible for the polishing
treatment plant. Suitable bypass arrangement will be provided to bypass the
polishing treatment plant and convey treated water supplied to the sump for further
transfer to distribution system. This arrangement will provide flexibility in operation
particularly during shutdown of polishing treatment plant, if required.
The backwash water from polishing water treatment plant will be conveyed to
nearby sewer for further treatment and disposal.
The plant will be fully automated with PLC and SCADA system and constructed in
suitable modules as per the selected option.
5.2.4.3 HEALTH AND SAFETY REQUIREMENTS:
The health and safety risk assessment should cover all relevant hazards, which can
be reasonably foreseen with the aim being to identify the significant risks. It should
include hazards during construction and commissioning. It should also consider
hazards whilst the plant is in service. The risk management should therefore guide
the judgement of designer as to the most appropriate action to be taken through

5-3 Feasibility Report
TCE.10339A-CV-3000-FR-30001 (R0)
Bhopal Smart City Development Corporation Limited
consideration of the magnitude of the calculated risk factor. If risk is high, action
must be taken regardless of cost.
Considering the high risk associated with the handling of Chlorine cylinders for
disinfection in the prime area, NaOCl will be used for disinfection. Safety norms and
protection devices need to be used during operation and maintenance of the plant.
5.3 Process considerations:
The unit processes for polishing water treatment are as follows:
Aeration
Coagulation and Flocculation
Filtration
Membrane Treatment such as Micro / Ultra Filtration
Disinfection (UV/ NaOCl)
Based on the quality of polished water requirement, polishing of treated water will involve
following processes.
These processes will be evaluated based on net present worth analysis (NPW):
Aeration + Coagulation and Flocculation + Gravity filtration + UV + Chlorination with
NaOCl
Aeration + Coagulation + Micro filtration + UV + Chlorination with NaOCl
Aeration + Coagulation + Ultra filtration + Chlorination with NaOCl
5.3.1 Aeration
Aeration will be provided to remove odour, Iron and Manganese, which marginally
exceeds the acceptable limits. Oxygen from air gets transferred to water, which will
oxidize Iron and Manganese and to some extent of organic matter.
Since adequate head is available at the inlet Cascade type of aerator is proposed. Also this
will give aesthetic appearance to the plant.
5.3.2 Coagulation and Flocculation
The Water Quality analysis report indicates that the concentration of heavy metals
such as Iron, Manganese and Copper in the treated water is slightly more than the
CPHEEO acceptable standards. Polyaluminiumchloride (PAC) will be dozed as a

5-4 Feasibility Report
TCE.10339A-CV-3000-FR-30001 (R0)
Bhopal Smart City Development Corporation Limited
coagulant, which will form microflocs and also help in chemical precipitation of these
heavy metals. Agglomeration of microflocs takes place in Flocculator. Agglomeration
helps to build large size and dense flocs, which are effectively removed in filtration.
5.3.3 PAC:
PAC is a kind of inorganic macromolecule flocculant used for all types of water
treatments - drinking water, industrial wastewater, and urban wastewater.
Through the hydroxyl ion bridging function and the polyvalent anion polymeric function, it
produces large molecular and high electricity inorganic macromolecule. It adapts a wide pH
range of 5.0~ 9.0 and the best is between 6.5-7.6.
The Molecular Formula for Polyaluminiumchloride is: [Al2 (OH) nCl6-n x H2O] m Where, (1< n <
5, m > 10).
5.3.3.1 Advantages:
i. A lower dosage is required.
ii. It has shorter flocculation time.
iii. Less sludge is generated.
iv. It reduces number of back washing steps.
v. It gives higher quality of the treated water.
5.3.4 Filtration
Since water supplied is already filtered and some parameters exceeding the
acceptable limit, it is proposed to treat this water by direct filtration. Thus
sedimentation unit is deleted from the flow sheet.
Filtration is physical, chemical and (sometimes) biological process that removes
suspended impurities from water when it passes through porous media. The
filtration can be classified into:
a) Gravity Filtration
b) Membrane Filtration
5.3.4.1 Rapid Sand Gravity Filter:
The rapid sand gravity filter comprises of a bed of sand serving as a single medium granular matrix
supported on gravel overlying an under drainage system. When water containing suspended matter
is applied to the top of filter bed, suspended and colloidal solids are left behind in the granular
medium matrix. Accumulation of suspended particles in the pores and on the surface of filter
medium leads to build up of head loss as pore volume is reduced and greater resistance is offered to
the flow of water simultaneously with the build up of head loss to a predetermined terminal value.

5-5 Feasibility Report
TCE.10339A-CV-3000-FR-30001 (R0)
Bhopal Smart City Development Corporation Limited
The SS removal efficiency of successive layers of filter media is reduced as solids accumulate in the
pore space and reach an ultimate value of solids concentration as defined by operating conditions.
The backwash shall be given when the head loss reaches a predetermined value.
Advantages:
Rate of filtration is relatively higher
Turbidity less than 0.2 NTU can be achieved.
Disadvantages:
Pretreatment is required to avoid clogging of filter.
Requires more area.
5.3.4.2 Membrane Filtration:
The membrane serves as selective barrier that will allow the passage of certain constituents and will
retain other constituents found in the liquid. The separation of particles in the MF and UF is
accomplished primarily by straining (sieving).
5.3.4.3 Advantages of Micro / Ultra filtration:
Can reduce the amount of treatment chemicals
Smaller space requirements (footprint)
Reduced labour requirements; can be automated easily
Removes protozoan cysts, oocysts and helminthes ova; may also remove limited amounts of
bacteria and viruses
5.3.4.4 Disadvantages of Micro / Ultra filtration:
Uses more electricity; high-pressure systems can be energy-intensive
Requires residuals handling and disposal of concentrate
Scale formation can be a serious problem. Scale-forming potential difficult to predict without
field testing
Flux rate (the rate of feed water flow through the membrane) gradually declines over time.
Recovery rates could be about 80 – 95 %.
Requires replacement of membranes about every 5 years.
In view of residual head available at the inlet, it is proposed to use low pressure Micro/ Ultra
filtration with coagulation – pretreatment. No pumping is required prior to membranes. The suction
pumps on downstream side of membranes are part and parcel of LPM system.

5-6 Feasibility Report
TCE.10339A-CV-3000-FR-30001 (R0)
Bhopal Smart City Development Corporation Limited
5.3.5 Disinfection:
5.3.5.1 Ultraviolet (UV) Disinfection:
UV is an excellent disinfectant. Special mercury lamps have been developed that emit UV rays over
thin films of water. The efficiency of UV radiation depends on the
Depth of penetration
Time of contact
Turbidity or suspended solids that may reduce the effective depth of penetration.
UV disinfection is provided after filtration for destruction of virus and bacteria, which may escape
through filtration process.
It is necessary to provide sand / membrane filtration prior to UV treatment.
UV is germicidal in the wavelength range of 250 to 270 nm. The radiation penetrates the cell wall of
the organism and is absorbed by cellular materials, which either prevents replication or causes the
death of the cell. Because the only UV radiation effective in destroying the organism is that which
reaches it, the water must be relatively free of turbidity. Since the distance over which UV light is
effective is very limited, the most effective disinfection occurs when a thin film of the water to be
treated is exposed to the radiation.
E-Coli kill of 99.99 and 99% can be achieved by ultraviolet rays of 3000 and 1500 nw-sec/cm2
respectively.
The transmitivity at 254 nm is expected to be minimum 60%. An automatic wipe system for UV bulbs
is essential. This may be supplemented by an acid washing system when iron, manganese and
phosphorous are present.
The UV system design varies with type of bulb (medium or low pressure; medium, low, or high
intensity), the type of contact chamber configuration (horizontal or vertical), or the sleeve material
separating the bulb from the liquid (quartz or teflon) used.
Low-pressure system consists of multiple banks of lamps in multiple channels for large works
considering one unit taken out of service for maintenance.
The control system shall ensure that the operation of UV plant is fully automatic.
Critical requirements for smooth running of UV plant are:
Power supply and standby arrangement
Flow monitoring
Transitivity monitoring
Intensity monitoring
Data management and storage

5-7 Feasibility Report
TCE.10339A-CV-3000-FR-30001 (R0)
Bhopal Smart City Development Corporation Limited
Level Control
Compressed air system / hydraulic system for UV lamp cleaning
Advantages:
Exposure time is short
No foreign matter is introduced and hence no taste and odour produced
Better quality of water can be achieved by removal of virus and bacteria.
Disadvantages:
In the field, there is no easy method to assess the treatment efficiency
For large flows the treatment becomes complex and expensive.
It provides no residual protection against contamination
5.3.5.2 Chlorination:
Chlorine is a powerful oxidizing agent and has been used as an effective disinfectant in water
treatment for a century. Chlorine may be added to water as a gas (Cl2) or as a liquid in the form of
sodium hypochlorite, respectively. When added to water, hypochlorite forms hypochlorous acid
(HOCl) and Sodium hydroxide. The resulting pH increase promotes the formation of the anion, OCl-,
which is a free form of chlorine. The difference between the chlorine residual in the water after
some time interval (free and combined chlorine) and the initial dose of chlorine is referred to as
chlorine demand. The chlorine dose for water after filtration and UV disinfection will be about 1
mg/l so as to get residual disinfecting effect in the distribution system until water is received by the
consumers.
The product of the contact time and disinfectant residual concentration (Ct) is often used as a
parameter for design of the system. The contact basin should be baffled to ensure that short-
circuiting does not occur.
Use of simple liquid sodium hypochlorite feeders is more reliable. These systems employ aspirator or
suction feeders that can be part of the pressurization of the water, causing both the pump and the
feeder to require inspection and calibration.
Advantages:
Residual chlorine takes care of further contamination in distribution system, if any.
Economical for large flows
Disadvantages:
The chlorine solution is corrosive, hence safety measures are required.
Evaluation of process:

5-8 Feasibility Report
TCE.10339A-CV-3000-FR-30001 (R0)
Bhopal Smart City Development Corporation Limited
The preliminary design and cost estimate of various alternative processes are analyzed on
broad basis for 11 MLD to evaluate following:
Capital cost
Operation and maintenance cost
Land required
Power required
Three alternative processes are considered for polishing water treatment plant to produce high
quality water.
The capital cost, land and power requirement for those three processes are depicted in Table III-1
Table 5-1 :CAPITAL COST, LAND AND POWER REQUIREMENT
PROCESSES
Gravity Filters + UV+
NaOCl (Alt-1)
Micro Filtration
+UV + NaOCl (Alt-
2)
Ultra Filtration +
NaOCl (Alt-3)
Capital Cost:
-Civil 70.00 52.00 52.00
- Mech & Elect. 265.00 777.00 696.00
Total capital Cost 333.70 828.34 746.83
O & M cost 28.00 49.00 37.00
Land (Ha) 0.4510 0.342 0.336
Power (kWh/day) 405.17 930.23 685.3
Total Cost Including O & M 363.00 878.00 785.00
All costs are in Rs Lakhs.
The capital cost and O & M cost of alternative- 1 is the lowest (Rs 363 lacs) and (Rs 28 Lacs)
respectively. The land required for alternative- 1 is highest whereas power required is the
lowest as compared to alternatives 2 and 3.
5.4 SELECTION OF PROCESS:
It is observed that the Total Cost of Alt- 1 (Gravity Filters + UV + NaOCl) is the lowest. Total Cost of
Alt- 2 (Micro filtration +UV+NaOCl) is the highest amongst three alternatives. The Total Cost of Alt-3
(Ultra filtration + NaOCl) is marginally higher than Alt- 1. The ultra filtration plant will be quite
compact and can produce excellent treated water quality such that further UV treatment will not be
required. Disinfection by NaOCl will be adequate treatment after Ultra filtration. There will be large
extent of land required for storage reservoir near the polishing treatment plant. The gravity filters
are already provided for treatment of raw water and providing the same type of filters again for

5-9 Feasibility Report
TCE.10339A-CV-3000-FR-30001 (R0)
Bhopal Smart City Development Corporation Limited
polishing of water may appear to be an odd proposition. In view of above, Ultra filtration process is
selected for further evaluation of various options.
5.5 Details of selected process:
The selected process (Ultra filtration + NaOCl) for polishing water treatment plant will consist of:
Cascade Aerator
Flash mixer with PAC dosing system
Ultra filtration (Low pressure type)
Disinfection by NaOCl
The cost break up of Civil, Mechanical and Electrical equipment for 11 MLD module is given below
The break up of operation and maintenance cost for 11 MLD module includes cost of:
Power
Chemical
Manpower
Spares and maintenance
The total capacity of polishing water treatment plant with Ultra filtration will be 11 MLD which is
proposed to be constructed at site in Plot no. 44. The estimated cost of this plant is:
The land and power required for this plant will be:
Civil : Rs 52 Lacs
Electrical &
Mechanical
: Rs 696 Lacs
Land : 0.336 Ha
Power : 785 kWh/day

6-10 Feasibility Report
TCE.10339A-CV-3000-FR-30001 (R0)
Bhopal Smart City Development Corporation Limited
6 Chapter 6 Storm Water Drainage
6.1 Proposed master Plan
The Master Plan evolution has been a continuous process of discussions and consultation with
BSCDCL for Bhopal ABD area. The ABD area is being developed as High Density Mixed-Use
Development along the three transit zones within the site boundary.
The majority of site area is taken up by knowledge, IT, sports, tourism, cultural and residential sector
which forms the core of this project. Commercial, Residential and Open space uses collectively
account for another one-third of the site area. The Commercial area consists of Retail, financial
Institutions, Convention Centre, Galleries, Offices, Hotel and Other Entertainment. The Residential
land use consists of High-rise residences, Affordable Housing, Government Housing and EWS
housing. Open spaces are provided for leisure, recreation and wellbeing as a regular pockets with a
comprehensive walking and cycling network. They also provide wider area to serve the sustainable
utility provisions such as, swales, sewerage wells and other resource efficient applications.
Connecting parks and garden is the foremost feature of the master plan. The pedestrian entry at the
frontage and vehicular access from the back side of the plot is another element achieved in the
design. Compact design and high density dictate the development pattern for the project area.
Figure 6-1: Master Plan

6-11 Feasibility Report
TCE.10339A-CV-3000-FR-30001 (R0)
Bhopal Smart City Development Corporation Limited
LANDUSE PATTERN
The total site area of 367 acres includes major spines like Bhadbhada and New Market road who’s
proposed ROW in CDP is 60m wide. These roads are not considered as part of development area for
ABD. The total developable area is 340 acres (1374473 sqm).
The total plot-able area is 56% of the total land area where ground coverage shall not be more than
40%. The multipurpose open space is 20% with Utilities and roads as 24%. Amongst the plot-able
land area, 23% of the land is under mixed residential use and 14% is for commercial mixed use giving
an opportunity to locate facilities in close proximity of the residents and create an environment for
24X7 usages.
Residential
Residential Mixed Use
Commercial
Commercial Mixed Use
PSP
Multipurpose Open space
Utility
Roads
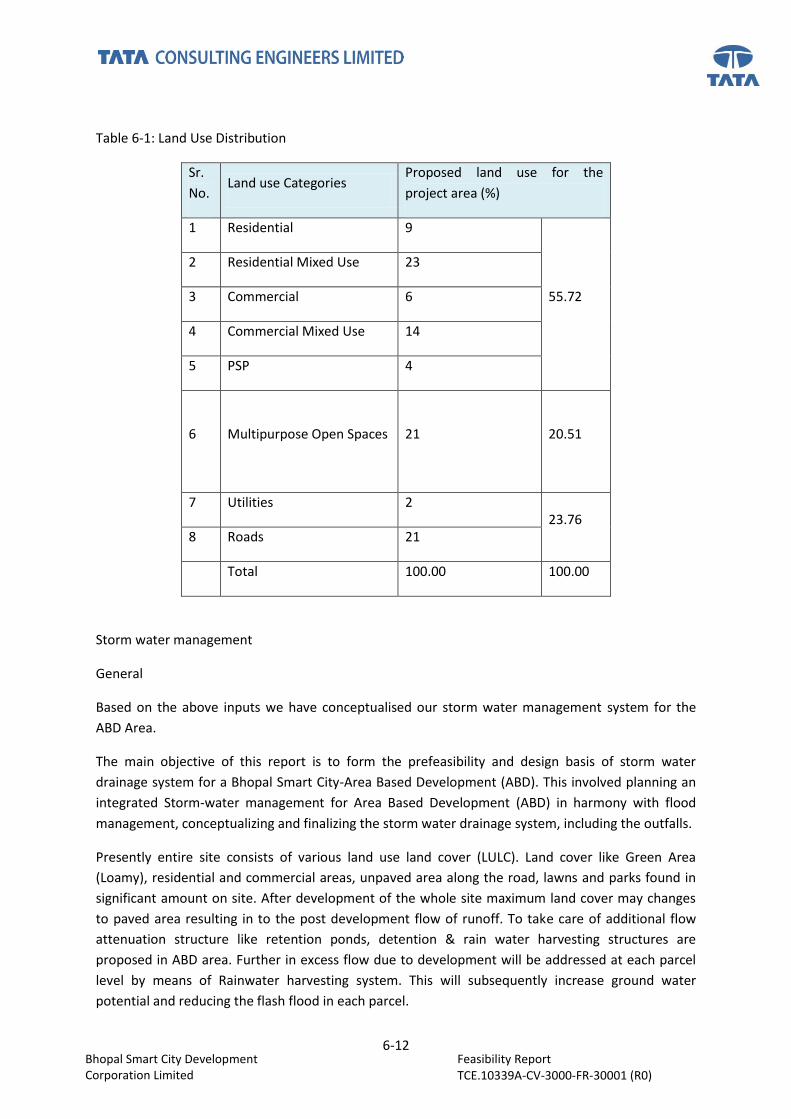
6-12 Feasibility Report
TCE.10339A-CV-3000-FR-30001 (R0)
Bhopal Smart City Development Corporation Limited
Table 6-1: Land Use Distribution
Sr.
No. Land use Categories
Proposed land use for the
project area (%)
1 Residential 9
55.72
2 Residential Mixed Use 23
3 Commercial 6
4 Commercial Mixed Use 14
5 PSP 4
6 Multipurpose Open Spaces
21
20.51
7 Utilities 2 23.76
8 Roads 21
Total 100.00 100.00
Storm water management
General
Based on the above inputs we have conceptualised our storm water management system for the
ABD Area.
The main objective of this report is to form the prefeasibility and design basis of storm water
drainage system for a Bhopal Smart City-Area Based Development (ABD). This involved planning an
integrated Storm-water management for Area Based Development (ABD) in harmony with flood
management, conceptualizing and finalizing the storm water drainage system, including the outfalls.
Presently entire site consists of various land use land cover (LULC). Land cover like Green Area
(Loamy), residential and commercial areas, unpaved area along the road, lawns and parks found in
significant amount on site. After development of the whole site maximum land cover may changes
to paved area resulting in to the post development flow of runoff. To take care of additional flow
attenuation structure like retention ponds, detention & rain water harvesting structures are
proposed in ABD area. Further in excess flow due to development will be addressed at each parcel
level by means of Rainwater harvesting system. This will subsequently increase ground water
potential and reducing the flash flood in each parcel.

6-13 Feasibility Report
TCE.10339A-CV-3000-FR-30001 (R0)
Bhopal Smart City Development Corporation Limited
Bhopal Smart City – ABD project area is of 148.67 Ha consisting of North TT nagar and South TT
Nagar areas. The project area is located at a higher elevation of RL 540m and is sloping on all sides. It
is observed from Figure No.1-1, the level difference was about 35m; there are two existing nallah
that runs along North West boundary and South boundary respectively namely Banganga nallah and
Panchsheel nallah. The northern part of the project area is sloping towards Banganga Nala. The rest
of the slopes towards the Bada Nala / Panchsheel Naala (refer Figure No.1-2). The flood level or High
Tide level or low tide level of this nallah will govern the disposal mechanism.
Figure 1-1: Land Form Analysis

6-14 Feasibility Report
TCE.10339A-CV-3000-FR-30001 (R0)
Bhopal Smart City Development Corporation Limited
Topography
Area around the Model school is located at higher elevation of RL 541.96 within the project
boundary. The area above the Badbadha road is sloping towards the North-west direction. The
ground elevation varies from 541.96m to 518.00 m (near Palash residency).The area below the
model school is sloping toward the south-west Direction. The ground elevation varies from 541.96m
to 517.00 m. The area towards the right of New Market road is sloping towards south east direction.
The Digital Elevation Model of the terrain of project area is shown in Error! Reference source not
found.
Rainfall
The annual normal rainfall of the region is 1146 mm. The maximum rainfall occurs during the
monsoon period i.e. from June to September. August is the wettest month having the normal rainfall
of 363 mm followed by July with a normal rainfall of about 354.10mm.
Figure 1-2: Surrounding drainage Features of project area and Runoff Flow Direction

6-1 Feasibility Report Bhopal Smart City Development
Corporation Limited
6-2 Digital Elevation Model of ABD Area
Catchment Area
The Total Catchment area that contributes is about 405 acres, of which 30 acres of external
catchment is flowing towards the project area. This includes area between Rangmahal chowk and
Roshanpura Square till Banganga.
The project area contributes to two main drains
Banganga Catchment
Bada Nala/ Panchsheel Catchment
Banganga Catchment:-
Banganga catchment covers an area of 3.19 sq km; the natural drain starts form Gomanthika campus
near Depot intersection and crosses through low lying areas of TT Nagar before out falling into lower
Lake. The Banganga generally crosses through low lying areas and Banganga slum. Low lying area

6-2 Feasibility Report Bhopal Smart City Development
Corporation Limited
adjacent to the drain used to get flooded during monsoon. About 42 ha of project area contributes
to this catchment
Bada Nala/ Panchsheel drain:
Bada Nala Catchment starts from TT Nagar South near P&T intersection and crosses though gitanjali
complex, aradhna nagar, panchsheel nagar and other residential area befor outfalling into Shahpura
Lake. It is unlined up to U/S of culvert near P&T bus stop.
Both the Primary drains lies outside the project area. The alignment of primary drains lying outside
the project boundary is shown in Figure 1-4.
Figure 1-4: Drainage pattern in ABD Area
hydraulic / hydrologic design criteria
The frequency of storm for which the system is to be designed depends on the importance of the
area to be drained. Commercial and industrial areas have to be designed critically so that they are
subjected to less frequent flooding. It is necessary to provide sufficient capacity to prevent frequent

6-3 Feasibility Report Bhopal Smart City Development
Corporation Limited
flooding of the drainage area. The Manual on Sewerage and Sewage treatment by CPHEEO and IRC
SP: 50-1999 recommend a return period of once in 2 year for designing the urban drainage system.
Well planned urban drainage particularly for township in brown field is somewhat new in India.
Hence it was decided that the design stormwater management of the ABD area is done by
considering 5 year return period and 88.22mm/hr rainfall intensity than that provided in CPHEEO
and IRC practices.
computation of rainfall intensity
It has been observed that shorter the duration of critical rainfall, greater would be the expected
average intensity during that period. The critical duration of rainfall is the one which produces
maximum runoff. This duration is equal to the time of concentration, since shorter period do not
allow the whole area to contribute, and longer duration will give smaller average rainfall intensity.
The annual normal rainfall of the region is 1146 mm. The entire storm water drainage system has
been designed for a return period of 5 years with 5 minutes minimum time of concentration
restricting to a maximum velocity of 3.0m/s. For generation of IDF curves, Past 26 years rainfall data
received from BMC.
IDF curve attached below gives variation of intensity (mm/hr) for different return periods ranging
from Twice in one year to ones in 5 years for various durations of rainfall.
Figure 1-5: Duration - Frequency Curve for Bhopal City
Table 1-1 Rainfall intensity mm/hr against the duration in min

6-4 Feasibility Report Bhopal Smart City Development
Corporation Limited
TIME OF CONCENTRATION
Time of Concentration is the time required for the rain water to flow over the ground surface from
the extreme point of the drainage basin and reach the point under consideration. Time of
concentration (tc) is equal to inlet time (t) plus the time of flow in the drainage pipe (tf). The inlet
time is dependent on the distance of the farthest point in the drainage basin to the inlet manhole,
the shape, characteristics and topography of the basin.
The Kirpich's equation is used for calculating time of concentration for each length of drain design
which is stated as follows:
tc = time of concentration in minutes
S = Slope from critical point to drain level
L = Distance of critical point to drain along the water course in m
Tc generally vary from 5 to 30 minutes. In highly developed sections, the inlet time may be as low as
3 minutes (as per IRC: SP: 13). For the project area, the time of concentration of 10-30 min is used
for different sub - catchments based on the calculations done considering the surface overflow time
and travel time in plot drain. Following are the generalized tc (time of concentration) for various
sizes of sub-catchments:

6-5 Feasibility Report Bhopal Smart City Development
Corporation Limited
Table 1-2: Tc for variable sub-catchment i.e. plot sizes
Sr. No. Sub – Catchment Area
(ha)
Tc (Time of Concentration in
mins)
1 < 1 7
2 1-3 15
3 3-4.5 20
4 >4.5 25
estimation of storm runoff
The rational formula for relationship between peak runoff and rainfall is given below:
Q= k * C *I *A
Is a simple steady state water balance equation. If, for, a catchment of A square kilometres, the
intensity is I mm/hr, the l volumetric intensity is. A*I*1000 cubic meter per hour, or 0.28*A*I cubic
meter per second. With a runoff coefficient of C, the runoff will be
Q=0.28*C*I*A
Whereas Q is in cubic meter per second.
Runoff coefficient “C”, in CIA is the portion of the precipitation that makes its way to the drain, in
storms. Its value depends on a large number of factors such as permeability of the surface, type of
ground cover, the type of soils (curve number), the depth of the soil, , the topography, the geology,
the antecedent conditions indicating the wetness of the soil structure from the earlier events, and
duration of storm.
For the design and planning of the storm water disposal arrangements, reasonably wet antecedent
conditions are assumed. If full data of soils is not available, standardized values are assumed. The
weighted runoff coefficient for the project site is estimated based on standard texts and literature,
and is shown in
Table 1-3:"C" values are used for various land use
Land use Type C Value
Watertight pavement Surface (concrete or
bitumen), steep bare rock
0.90
Green Area(Loamy) 0.30
Green Area(Sandy) 0.20
Unpaved Area along roads 0.30
Lawns and parks 0.15
Flat Built-up area with about 60 percent area
impervious
0.55

6-6 Feasibility Report Bhopal Smart City Development
Corporation Limited
Moderately steep built-up area with about 70
percent area impervious
0.80
(Source: C value for each land use as per Table-4.4 IRC: SP50-1999)
HYDRAULIC DESIGN OF drain sections:
Design formula
Manning’s formula would be employed for design of gravity system
Where,
Qf - Flow rate when pipe flows full; in m3/s
Vf - Velocity of the flow, in m/s
A - Cross sectional area of pipe in m2
N - Manning’s roughness coefficient when pipe is full.
R - Hydraulic radius in m = A / P; (P is Wetted Perimeter)
S - Slope of Hydraulic gradient
All the drains are designed 85% full.
Manning's n value for various materials is used as per CPHEEO Manual as shown in below
Table 1-4: Average Manning's coefficient roughness for various materials
Type of surface Manning’s ‘n’
Cement concrete pipes
a) Good Condition 0.013
b) Fair Condition 0.015
Brick pitched drain 0.017
Plastered brick surface 0.015
Plastered brick surface with neat cement finish 0.013
Dry rubble masonry 0.033
Dressed ashler surface 0.015

6-7 Feasibility Report Bhopal Smart City Development
Corporation Limited
Dry stone pitching 0.020
Kutcha drain 0.025
Earth
a) in ordinary condition 0.025
b) with stones and weeds 0.030
c) in poor condition 0.035
(Source: IRC: SP: 50 Table-4.3 and CPHEEO, 2013 Table 3.11)
The values highlighted in above table are used in the present study.
MINIMUM AND MAXIMUM VELOCITIES
While deciding the drain sections it is also required to keep in view the velocity in the drain. Drains
are designed to achieve a minimum self-cleaning velocity of 0.60 m/sec as per CPHEEO at the design
flow and a limiting maximum velocity up to 3.0 m/sec as per standard engineering practice.
MINIMUM FREE BOARD
With reference to clause 4.9.3 of IRC -SP 50(b), free board adopted for drain varies from 100 mm to
300mm based on the bottom width of drain.
Table 1-5: Free Board Criteria for Storm water drainage
Sr.No. Drain Width (M) Free Board (M)
1 < 0.3 0.1
2 0.3 to 0.9 0.15
3 0.9 to 1.5 0.3
4 > 1.5 Depends on discharge
(Source: IRC : SP-50-1999)
DESIGN SOFTWARE
Hydraulic design of storm water drain is modelled by using computer modelling software Bentley
Systems Storm CAD V8i. The storm water drains are provided on both the sides of the road to collect
the discharge from plots and road surface.
Steps for Developing Storm Water Network Model
The following steps will be followed to carry out the design storm water network,
The storm water network model for project area will be developed and analysed using Bentley’s
Storm-CAD -V8i program.
The contour map for the above mentioned area will be brought into Storm-CAD background and
drainage network of minor and major catchments shall be carried out.

6-8 Feasibility Report Bhopal Smart City Development
Corporation Limited
Data inputs for catchment areas, runoff coefficients, time of concentration, IDF curves, shape, size
and material of drains, topographic model etc, will be provided.
Hydraulic design and analysis of entire storm water network done for 5 year return period
considering rainfall intensity more than 88 mm/hr
Design Criteria for Storm Water Drain
Surface drains are considered as far as possible. Hume pipes/ Box culverts will be considered at
some locations like road crossing / adverse slope etc.
Surface drains will be covered. Boundary catchment drains may be uncovered.
Rectangular section shall be provided for surface drains.
Minimum size of internal drains will be 300 mm X 300 mm.
Proposed Storm Water Drainage System
Management of storm water within the site is planned as far as possible along the natural
topography pattern. Only essential changes to the existing drainage are proposed.
The trunk mains are planned along the main road which is designed to cater the storm runoff from
the catchment area. The trunk main will be integrated with the existing storm water drains located
outside the project boundary. The project area is divided in to 2 catchments. The major trunk drains
are routed to discharge into the two zones, having their outfall in Banganga Naala and Panchsheel
Nala. The details are provided in Error! Reference source not found..
Table 1-6: Catchment details
Zone I Zone II
Catchment Area 55.12 Ha 93.5 Ha
Outfall Location Banganga Nala Panchsheel Nala
The parabolic profile is considered to be the best for hydraulic flow, but its actual construction and
maintenance is difficult. The Triangular drain is not very popular in urban areas as its de-silting is
difficult. Covered surface drains (box drains) are suggested based on the below study. Culverts will
be required at locations like road crossings/adverse slope etc. The comparison for the selection of
drains is given below:
Table 1-7: Box Drain and Pipe drain Comparison
Parameter Option 1 Option 2 Option 3
Drain Shape Box Section: This is
widely accepted and
practiced in India.
Circular Section: This is
generally proposed for
small developments like
resorts etc. where there is
The combination of Box and
Circular shape is used to
optimize the cost & effective
solution

6-9 Feasibility Report Bhopal Smart City Development
Corporation Limited
no restriction in outfall
conditions
Depth of Drain &
Outfall Level
Invert level of drain
initially is less as
compared to circular
section.
Invert level of pipe drain
is deeper due to
minimum required cover
of 1.0.
Invert level of drain is
relatively less as compared
to box section.
Inlet Arrangement Inlet gratings can be
provided as a part drain.
Separate inlet chambers
& pipe connection to
manhole has to be
provided.
The combination of Inlet
gratings and inlet chamber
can be provided as a part
drain based on drain
sections.
Operation &
Maintenance Cost
Moderate High Relatively Less
Ease of Construction Difficult for smaller
sections
Easy Moderate
From the above table a combination of pipe drains and box drains will be ideal for the design of
storm drainage system.
RCC Rectangular box drains are proposed for the primary and secondary surface drains. The
minimum size of drains will be 300 x 300 mm. Drain with M.S/DI grating and suitable precast/cast in-
situ cover with frames on top of drains will be provided. However circular pipes of RCC can be used
for the sizes less than 1000 mm due to the advantage of easy and speedy construction of smaller
pipes. The circular pipes will be considered only for the road crossing and outfall locations
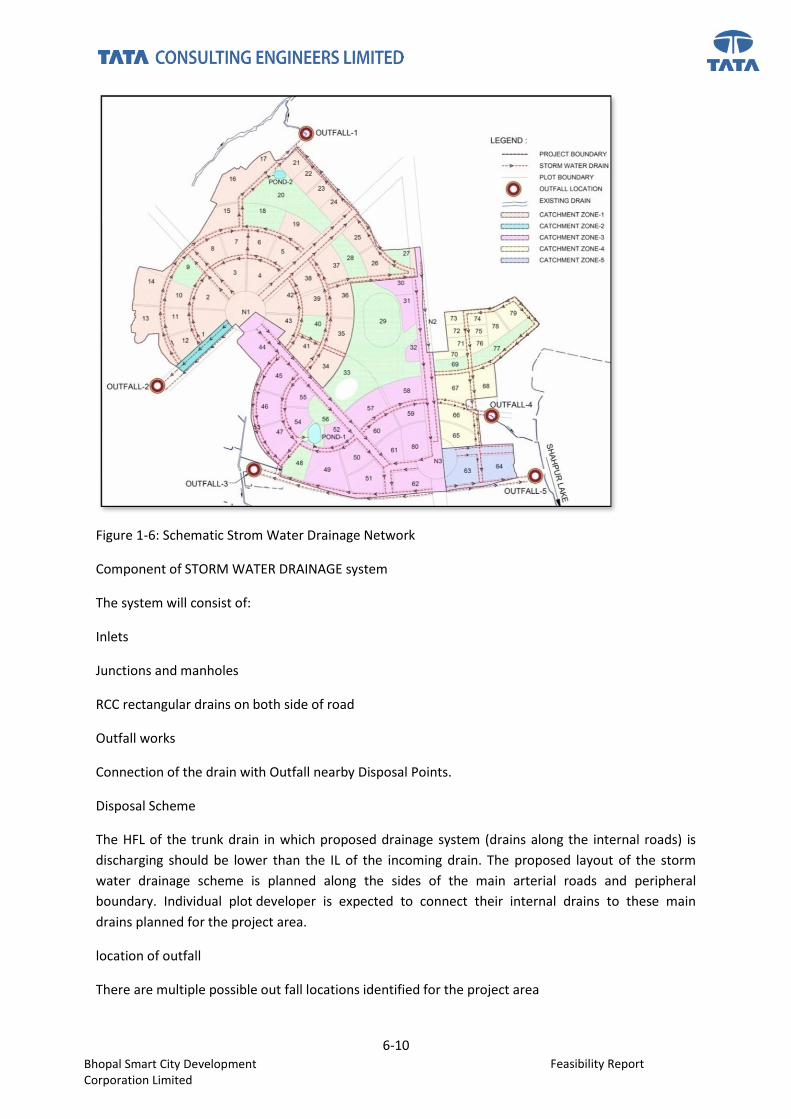
6-10 Feasibility Report Bhopal Smart City Development
Corporation Limited
Figure 1-6: Schematic Strom Water Drainage Network
Component of STORM WATER DRAINAGE system
The system will consist of:
Inlets
Junctions and manholes
RCC rectangular drains on both side of road
Outfall works
Connection of the drain with Outfall nearby Disposal Points.
Disposal Scheme
The HFL of the trunk drain in which proposed drainage system (drains along the internal roads) is
discharging should be lower than the IL of the incoming drain. The proposed layout of the storm
water drainage scheme is planned along the sides of the main arterial roads and peripheral
boundary. Individual plot developer is expected to connect their internal drains to these main
drains planned for the project area.
location of outfall
There are multiple possible out fall locations identified for the project area

6-11 Feasibility Report Bhopal Smart City Development
Corporation Limited
Outfall-1: Discharge of storm water into Banganga nallah flowing towards lower lake along the
northeast site boundary.
Outfall-2: Discharge of storm water into the existing stormwater drain, Bada nallah Culvert which is
ultimately disposed to Panchsheel nallah flowing along southwest site boundary.
Outfall-3, 4 and 5: Discharge of storm water into Panchsheel nallah flowing towards Shahapura Lake
along the Southeast site boundary.
Outfall O1, O2 and O3/ O4/ O5 are Outfalls carrying 32%, 8% and 60% (refer table below for flow
contributing to each outfall) runoff respectively from entire site from primary drain from ABD area. it
was assumed that there is some flood risk that nallah capacity would be exceeded during flood
events causing backflow from the nallah. To prevent back water flow non return valve arrangement
is recommended at the point of discharge into the nallah.
Table 1-8: Outfall and flow from outfall
Sr. No.
Free
Outfall
No.
Flow
Cum/sec. % Flow
1 O1 7.228 32.14873
2 O2 1.807 8.037184
3 O3 2.873 12.77854
4 O4 2.446 10.87933
5 O5 8.129 36.15621
RAIN WATER HARVESTING SYSTEM
The development of 148.67 Ha of ABD area will turns into integrated urban place which results in to
an inevitable rise in site impermeability. Storm events will result in increased overland runoff for the
same catchment area and lag time to peak flooding will significantly decrease. The natural annual
recharge to existing aquifers on site will also reduce substantially.
Rainwater harvesting is a technology used to collect, convey and store rain water for later use from
relatively clean surfaces such as a roof, land surface or rock catchment. The water is generally stored
in a rainwater tank or directed to recharge groundwater. Rainwater infiltration is another aspect of
rainwater harvesting playing an important role in storm water management and in the
replenishment of the groundwater.
The practice of collecting rainwater from rainfall events can be classified into two broad categories:
roof-based and land-based. Roof- based rainwater harvesting refers to collecting rainwater runoff
from roof surfaces which usually provides a much cleaner source of water that can be also used as
non-potable used after suitable treatment. Land-based rainwater harvesting occurs when runoff
from land surfaces and road surfaces is collected in furrow dikes, ponds, tanks and reservoirs.

6-12 Feasibility Report Bhopal Smart City Development
Corporation Limited
RAIN WTER HARVESTING DESIGN CONSIDERATIONS
Rainwater Harvesting, which implies conservation of rainwater is a tradition-renewed scientific
technology applied to augment the groundwater both quantitatively and qualitatively. Three most
important components, which need to be evaluated for designing the rainwater harvesting
structure, are:
Hydrogeology of the area including nature and extent of aquifer, soil cover, topography, depth
to water levels and chemical quality of ground water.
Area contributing for runoff i.e. how much area and land use pattern, whether industrial, residential
or green belts and general built up pattern of the area.
Hydro-meteorological characters like rainfall duration, general pattern and intensity of rainfall.
METHODS OF RAINWATER HARVESTING
Rooftop Rainwater Harvesting
Water harvesting is the deliberate collection and storage of rainwater that runs off on natural or
manmade catchment areas. Catchment includes rooftops, compounds, rocky surface or hill slopes or
artificially prepared impervious/ semi-pervious land surface. The amount of water harvested
depends on the frequency and intensity of rainfall, catchment characteristics, water demand and
runoff intensity and how quickly or how easy it is for the water to infiltrate through the subsoil and
percolate down to recharge the aquifers. Moreover, in urban areas, adequate space for surface
storage is not available, water levels are deep enough to accommodate additional rainwater to
recharge the aquifers, rooftop and runoff rainwater harvesting is ideal solution to solve the water
supply problems.
Storage Tanks
For harvesting the roof top rainwater, the storage tanks may be used. These tanks may be
constructed on the surface as well as under-ground by utilizing local material. The size of tank
depends upon availability of runoff and water demand. Stored water either may be used for Non
potable purpose like flushing, gardening & washing or for potable purpose with treatment.
Trenches
These are constructed when the permeable strata is available at shallow depths. Trench may be 0.5
to 1 m. wide, 1 to 1.5 m. deep and 10 to 20 m. long depending upon availability of water. These are
back filled with filter materials.
Land-based or Storm water harvesting method
Catch basin with Infiltration Pit: the area having impermeable zones prior to water table, like clays,
solid rocks etc. and having relatively clean catchment (Fig. 1-5)
In this type of areas, the rainwater harvesting system will have recharge shaft via storage tanks and
filtration tanks reaching 10 to 15 meters above water level. The design is self- explanatory as per Fig.

6-13 Feasibility Report Bhopal Smart City Development
Corporation Limited
1-5. Here, water is diverted to ground water reservoir through recharge shaft via filtration media
crossing the impermeable zone.
Figure 1-7: Typical Plan of Catch Basin with Infiltration Pit - Recharge of stormwater drain from Road
Figure 1-8: Typical Section of Catch Basin with Infiltration Pit- Recharge of stormwater drain from
Road
DETAILS OF PROPOSED RECHARGE STRUCTURES

6-14 Feasibility Report Bhopal Smart City Development
Corporation Limited
Most basic data required contains Survey data for site and adjoining nallah. Hydro geological
condition, availability of rainfall, ground water table throughout the year, area available to collect
storm water and storm water drainage system were considered for making proper design of
artificial recharge structures. The following system will be proposed for recharging the runoff:
a. Storm Water Collection/percolation tank/Pond
b. Catch basin With Infiltration Pit: the area having impermeable zones prior to water table, like
clays, solid rocks etc. and having relatively clean catchment
MAINTENANCE AND WATER CONSERVATION
The periodic removal of the material deposited on the surface, by scraping once a year before the
start of monsoon period.
Precaution should be taken to avoid domestic waste water entering in to the recharge
structures. (Avoid contaminating the rainwater harvesting structures with sewers and garbage)
hence periodic maintenance of sewer network should also be carried out.
Recharge tube wells shall be developed periodically by compressor/hand bailers to avoid clogging of
the slots. (Pump for few hours with various discharges).
RECOMMENDATION
Storm water conveyance drainage is thoroughly considered while selecting suitable location and
design to recharge structures within the township area.
Proper In-let and Out-let should be developed in the recharging structure / tank to allow the storm
water enters into the system and get out of it as over flow.
The Recharge bore hole should be constructed up to a depth of 20m below ground level, or depend
up on the water level of the area it may be increased to maintain the slotted pipes within the water
level to avoid any air infiltration in to the aquifer.
The storm water drainage system should be constructed in such a manner to avoid the entrance of
sewage water in to it. (Separate system to carry sewage and rainwater pipes can help this)
Periodic cleaning of the SW drainage system required to sustain the system. (cleaning the drainage
system manually)
Water quality test for ground water before and after construction (post monsoon) should be carried
out to find out the impact of recharge on quality of ground water. To identify the impact of recharge
on ground water regime it is essential to check the quality of ground water before and after
construction of the structures. This is a universal standard operating technique.

7-15 Feasibility Report Bhopal Smart City Development
Corporation Limited
7 Chapter 7 Sewer Network
7.1 General
The waste water networks are designed to collect & convey the waste water generated from
project area to the treatment plant and safe disposal of treated water. The waste water
networks are planned and designed to achieve its intended objective throughout its lifetime
without any risk to public health, public safety & environment. The wastewater system would
be designed for the expected wastewater flow based on the water demands for various land
parcels. The design flow would be based on the saturated population of the project town. The
waste water networks have to be designed for future 30 years; but suitable phasing will be
done according to the development of ABD area.
Sewer networks are designed to collect & convey the sewage generated in project area from
the township to its treatment and reuse.
The objective for properly designed sewer networks is to
Achieve self cleansing velocity to avoid settling
Effective ventilation
Avoidance of surcharging
To minimize the infiltration
Structurally safe
SMART features adopted
100 % Connections and Coverage
Optimised Design
Energy efficient Pumps and Motors if required
100% reclamation and reuse
Advanced Tertiary Treatment
DESIGN YEAR
The base year for design of water supply system of ABD area is considered as Year 2017 with
design period of 30yrs. Considering the same base year of Yr 2017, the sewerage system of ABD
area have design year of Yr 2047 i.e. for a span of 30 yrs as per Part A of CPHEEO manual on
Sewerage & Sewage Treatment, Nov 2013.
Waste Water Generation
Wastewater flow has been computed based on potable water supply to consumer (@ 80%) and
non-potable for flushing purpose (@ 100%). Per capita water supply rate considered for

7-16 Feasibility Report Bhopal Smart City Development
Corporation Limited
residential, institutional and for floating population is as per CPHEEO manual. Sewage
generation rate is calculated for various type of population in the area. Infiltration will be
considered as per CPHEEO manual i.e. 5000 l/Km/d as per Part A of CPHEEO Manual, Nov 2013,
restricting the max flow to 10% of the waste water generated within the ULB area. Peak factors
will be considered based on contributory population to arrive at peak flow per CPHEEO manual,
2013. Summary of Waste Water generated in the ABD area provided in Error! Reference source
not found..
Table 1-1: Waste water Generation Table
Sr. No. Raw Sewage Generated to STP 1 at Plot No 64 (MLD)
Raw Sewage Generated to STP 2 at Plot No 17 (MLD)
1 7 4.2
Waste Water Collection System
The criteria as stipulated in CPHEEO manual on Sewerage and Sewage Treatment and other
relevant standards will be used for the Sewerage System design. Design for sewerage
components will include designs for sewage collection system including pipelines, manholes,
associated Civil, Mechanical, Electrical and Instrumentation equipment, etc.
Two system of waste water collection have been studied- Vacuum Sewerage System and
Separate/ Gravity System. The vacuum sewerage system is more advanced and sophisticated
technology of waste water collection but it requires high capital cost. Further, it requires skilled
manpower & machinery for maintenance of sewer network. Separate sewer system
(conventional system) is suitable for both high and low density developments. Also,
conventional system is a cost-effective system. Hence, considering the site conditions and the
cost implications, separate system is the suitable option for the sewerage system for ABD area.
The terrain is suitable for conveyance of waste water by means of gravity. Gravity sewer system
will be designed up to restriction by excessive depth of cutting or by the existing topography.
An entirely new sewage system based on zero discharge concepts have been planned to the
project area and will focus on recycling of water. Now under the proposed scheme the entire
project area is divided into two sewerage zones. The sewerage will be collected by providing
new sewer network and will convey waste water to the new STP proposed near Mata Mandir

7-17 Feasibility Report Bhopal Smart City Development
Corporation Limited
and near existing Dushera Maidan. The Schematic network of proposed sewerage network
alignment is shown in Error! Reference source not found.
Figure 1-1: Schematic Sewerage Network System
Network Design
Sewer GEMS software has been used for preparation of Sewerage network hydraulic modeling
and further analysis. Zone wise networks will be analyzed as per design criteria presented in
the sections below.
Design Formula
Manning’s formula would be employed for design of gravity sewers
Vf = 1/N x R2/3 x S1/2
Qf = Vf x A
Where, Qf - Flow rate when pipe flows full in cumecs

7-18 Feasibility Report Bhopal Smart City Development
Corporation Limited
Vf - Velocity of the flow, in m/s
A - Cross sectional area of pipe
N - Manning’s roughness coefficient when pipe is full.
R - Hydraulic radius in m = A / P; (P is Wetted Perimeter)
S - Slope of Hydraulic gradient
Peak Factors
For the design of the Sewerage System, the peak factors with respect to contributing population
for domestic sewage, as per CPHEEO Manual on Sewerage and Sewage Treatment are furnished
in Table 2
Table 2- Peak Factor Based on Population
Contributing Population Peak factor
Up to 20,000 3
>20,000 up to 50,000 2.5
>50,000 up to 7,50,000 2.25
Above 7,50,000 2
If population of certain zones is less than 10000, Babbitt’s Equation is normally used for
calculation of peak factor. In case of contributing population are in between 500 to 10,000
Babbitt’s equation can be used to calculate peak factor.
Babbitt’s Equation:
Peak Factor = 5/[(Population/1000)^(1/5)]
So as per Babbitt’s equation, variable peak factor for population of 500 to 5000 will be
considered for design of sewerage collection network.
Self Cleansing Velocities
To ensure that deposition of suspended solids does not take place, self-cleansing velocities will
be considered in the design of sewers. Minimum velocity of 0.6 m/s at peak flow (initial stage)
and 0.8 m/s at ultimate peak flows (final stage at full occupancy) with exceptions of upstream
sewers and maximum velocity of 2.5 m/s is considered for design.
Design Capacity of Sewers

7-19 Feasibility Report Bhopal Smart City Development
Corporation Limited
Sewers are designed partially full to carry estimated peak flows generated in the design year.
This is to ensure proper ventilation and to prevent septic condition of sewage. For hydraulic
design of sewers, it is ensured that depth of flow in the sewers (d) does not exceed 0.8 times
the pipe diameter (D) i.e., d/D<=0.8.
Depth of Cover
As per CPHEEO standards minimum cover of 1 m is provided for protection of sewers from
external loads. In ABD area it is proposed to lay a separate corridor with less vehicular traffic for
laying sewerage network. When sewerage network is planned along house connection to the
manholes of main sewer and to provide protection to sewers from external loads, the normal
practice is to provide a minimum depth of cover of 1.0 meter over the top of pipe. But as ABD
site is little bit undulating we have proposed to keep minimum cover of 0.75 m at few places so
as to avoid the greater depth of the sewer network. In case if sewer having cover of 0.75 m is
crossing road a concrete encasement has to be provided.
Minimum Size of Sewers and Gradient
The gravity sewers shall be of minimum 180mm dia. The gradient adopted for the sewers is
generally in line with the recommendations given in the CPHEEO manual. The minimum
gradient of sewer would be generally as per design requirement to fulfil the velocity criteria.
Pipe Material
For Gravity Sewers factors which will be considered in the selection of pipe materials are
Applicable IS codes.
Availability of pipe in required sizes, lengths.
Ease of handling and installation.
Physical strength.
Any special bedding requirements.
Flow characteristics or friction coefficient.
Joint water-tightness and ease of installation.
Resistance to acids, alkalis, high temperature or corrosive wastes, and corrosive soils.
Ease in Repairs and maintenance.
Basic cost economics.
The pipe materials most often used for gravity sewers are High Density Poly Ethylene (HDPE),
Glass Reinforced Plastic (GRP), Reinforced Concrete (RCC) and Ductile Iron (DI). Major
characteristics of various pipe materials considered for sewers are tabulated as follows

7-20 Feasibility Report Bhopal Smart City Development
Corporation Limited
Table 3- Pipe Material Comparison
Parameter Pipe Material
HDPE DI GRP RCC
Sizes 63 -1000 80-1000 200-3000 80-2600
Lengths (m) 05-Oct 2.75-6 06-Dec 2-2.5
Weight Light Medium Light Heavy
Flexibility Maximum Medium Medium Rigid
Impact Strength
Very Good Very Good Good Medium
Corrosion Resistance
Very Good Very Good Normally Good but prone to attack by soils with Sulphates
Corrosion Resistance
Jointing Method
Butt welded joint, flanged joint, insert joint
Spigot and socket, with rubber ring gasket
S/S or Collar joints S/S or Collar joints
Special bedding requirements
Fine sand or screened excavated material
Granular material compacted to specific Proctor density
Granular material compacted to specific Proctor density
Granular, concrete cradle or full encasement
Laying speed Fast Medium Fast Slow
Pipe performance experience
Good with reputed contractors
Good with reputed contractors
Good with reputed manufacturers
Good with reputed manufacturers
Basic cost economics
Costlier than RCC but cheaper than GRP upto 355 mm & costlier than GRP above 355 mm dia.
Costlier than other material
Costlier than RCC Cheaper than GRP, DI and HDPE
Recommendation
The cost of RCC pipes is the lowest followed by DI, GRP and HDPE. The RCC pipes are rigid pipes
and have excellent load carrying capacity with suitable bedding. The HDPE and GRP pipes are
flexible pipes and require stringent quality control for bedding and backfilling. The length of RCC
pipes is relatively short (2 m to 2.5 m), which will require more number of joints affecting the
speed of execution. On other hand HDPE and GRP pipes are available of longer lengths (6 m to 9
m) which will have less number of joints resulting in relatively quick execution of pipeline and
less infiltration. The N-values of HDPE and GRP are better than RCC pipes providing better
carrying capacity of pipes for the same diameter and gradient.

7-21 Feasibility Report Bhopal Smart City Development
Corporation Limited
However, considering the above aspects, HDPE Class pipe material is considered of for
sewerage network.
Bedding for Sewers
The type of bedding (Granular Bedding, Plain Cement Concrete, and Reinforced Cement
Concrete) depends on the weight of soil above the pipe based on width of trench, depth at
which the sewer pipe is laid and the class of superimposed load considered based on the traffic
condition. The typical bedding details are given in Figure
Figure 1-2: Typical Bedding Details for Gravity Sewers
Manholes
The ordinary circular manholes of brick masonry are proposed at all the junctions, change of
diameters, and change in pipe gradients and on straight run of sewer at 30m interval for all
diameters. The spacing and sizes of manholes adopted is in line with the recommendations of
CPHEEO Manual for Sewerage and Sewage treatment. In general to facilitate the house
connections and cleaning and maintenance the manhole spacing is kept at 30 m. Drop
manholes are proposed where the difference between invert level of lateral / branch sewer and
maximum water level (at design peak flows) of main sewer is more than 600mm. The clear
opening at the top in case of ordinary manholes is kept as 560 mm. The internal diameters of
manholes for varying depths will be as follows.
For depths above 1.20m and up to 1.65m : 900mm diameter
For depths above 1.66m and up to 2.30m : 1200mm diameter

7-22 Feasibility Report Bhopal Smart City Development
Corporation Limited
For depths above 2.31m and up to 6.00m : 1500mm diameter
MATERIAL OF CONSTRUCTION FOR MANHOLES
Manholes often used to be of material as brick masonry and RCC. Nowadays, precast Poly
Ethylene (PE) manholes and precast RCC manholes are also being used in some locations. The
technical and financial comparison of sewer manhole material is mentioned in Table 4 and
Table 5 for further reference.
Table 4 Technical comparison of sewer manholes
Sr. No.
Parameters
Sewer Manhole Material
Cast-in-situ Brick masonry manhole
Cast-in-situ RCC manhole
Precast PE manhole with RCC ring
Precast RCC manhole
1 Shapes Circular, Rectangular
Circular, Rectangular
Circular Circular
2 Sizes & depth
0.9 to 2m dia circular upto 8m depth, 0.9x0.9m to 1.5x1.5m rectangular upto 8m depth
0.9 to 2m dia circular upto 9m depth, 1.5x1.5m to 1.8x1.8m rectangular upto 9m depth
1m dia circular upto 6m depth
1.0m, 1.2m & 1.5m dia circular upto 3m depth
3 Prevention against floatation
Increasing wall thk & base slab thk
Increasing wall thk & base slab thk
Good with FOS= 1.4
Can be designed as per requirement
4 Type of joint of Pipe with MH
Placing pipe joint outside the manhole as close as possible. Pipe build inside the wall of manhole flush with internal periphery protected with arch of masonry.
Placing pipe joint outside the manhole as close as possible. Pipe build inside the wall of manhole flush with internal periphery protected with arch of masonry.
Adapter with RCC or stoneware pipe,
No specific requirement
5 Suitability / Application
Normally used. based on Easy availability of bricks locally.
Can be used for soil with high GWT, deeper manholes
Can be used upto 2m depth for 1m dia. Can be used in congested / busy lanes.
Can be used in congested / busy lanes.
6 Maintenance High Low Low Low

7-23 Feasibility Report Bhopal Smart City Development
Corporation Limited
Sr. No.
Parameters
Sewer Manhole Material
Cast-in-situ Brick masonry manhole
Cast-in-situ RCC manhole
Precast PE manhole with RCC ring
Precast RCC manhole
required
7 Life 30 yrs 50 yrs 50 yrs 50 yrs
8 Leakage- Infiltration / Exfiltration
Susceptible Less susceptible Less susceptible
Less susceptible
9
Soil specific requirement (with high chloride / sulphate content)
Requires Portland slag cement or OPC with slag /sulphate resistant cement for cement mortar, Epoxy coating can be used.
Requires Portland slag cement or OPC with slag /sulphate resistant cement for cement mortar, Epoxy coating can be used.
Requires Portland slag cement or OPC with slag /sulphate resistant cement for cement mortar, Epoxy coating can be used.
Requires Portland slag cement or OPC with slag /sulphate resistant cement for cement mortar, Epoxy coating can be used.
10
Time required for construction / installation for manhole
Time consuming Time consuming Quick Quick
11 Finishing Depend on construction
Depend on construction
Good Good
12 Basic cost economics
Cheapest
Costlier than Brick masonry manholes, PE manholes & Precast RCC manholes
Costlier than Brick masonry manhole & Precast RCC manholes, cheaper than RCC manholes
Costlier than brick masonry manholes but cheaper than RCC manholes & PE manholes
The cost comparison of types of sewer manholes is mentioned in Table 7
Table 7 Cost comparison of sewer manholes
Size of sewer manhole (up to 2m depth)
Typical Values
Brick Cast-in-situ RCC
PE Precast RCC
Rate(Rs/manh Rate(Rs/manh Rate(Rs/manh Rate(Rs/manh

7-24 Feasibility Report Bhopal Smart City Development
Corporation Limited
ole) ole) ole) ole)
900 / 1000 mm dia circular OR 1000x1000mm rectangular
23,000 73,000 53,000 24,000
Note: The cost will vary for size of manhole and depth of network.
Conclusion & Recommendation
Manholes have been compared based on technical and cost parameters. Brick manholes are
cheaper. It is proposed to construct all manholes in brick masonry with manhole frame and
cover of Steel Fiber Reinforced Concrete (SFRC) capable of withstanding heavy-duty loads (HD-
20 for side lanes), (HD-35 for main roads) conforming to IS: 12592-2002.
Wastewater/Sewage Treatment Plant
The ABD area is to be developed mainly as hub of both commercial and residential land use and
hence the sewage generation will be of domestic municipal nature.
Municipal sewage generally contains high BOD, suspended solids, COD, faecal coli-forms and
pathogens with respect to disposal norms of receiving water body or to ground.
Considering various governing factors, the most suitable technology would be recommended.
The total waste water generated is 11.2 MLD. Hence 12 MLD STP has been proposed. There are
at two locations which are identified for sewerage treatment plant in Bhopal ABD area based on
the existing terrain and limiting the maximum depth of cutting to 6m. 12 MLD STP are split up in
two locations having 7.0 and 4.2 MLD capacity respectively. Location of STP Shown in Figure 1-3
Accordingly, Two STP has been suggested based on the techno- economical analysis.
The STP would have a recycled water sump which will supply water for non-potable uses. Dual
piping system has been proposed for the ABD area. For using recycled water distribution system
online booster pumping has been suggested. Necessary RWPS (Recycled water pumping
station) has been suggested in the STP location accordingly.

7-25 Feasibility Report Bhopal Smart City Development
Corporation Limited
Figure 1-3: Location of proposed STP/Pumping stations
Zero Discharge Concept
The concept of Zero Discharge is:
By reusing treated waste water for non-potable water demand, Optimum utilization
of natural water resources can be ensured;
Reuse of treated waste water ensures efficient utilization of available water based on
the water Quality requirements.
With an increase in demand of natural resources it is essential to target Zero
Discharge system for any upcoming infrastructure development.
In view of above, the proposed township has been suggested to meet its non-potable
water demand (e.g. Landscaping, Horticulture, Flushing and makeup water for HVAC
etc.) by recycling the treated waste water, hence reducing the raw water demand
from source and making the water supply scheme more sustainable. For this
purposed Tertiary Treatment will be provided to the secondary treated wastewater
to achieve required quality of reclaimed water to be recycled.

8-26 Feasibility Report Bhopal Smart City Development
Corporation Limited
8 Chapter 8 Sewage Treatment Plant
8.1 Introduction
Bhopal has been selected as one of the first twenty Indian cities to be developed as a smart
city under GoI's Smart City Project. Bhopal is the only city that has opted for redevelopment
model for its Area Based Development(ABD). TT Nagar area has been selected by BSCDCL for
the same. ABD Area is planned as Mixed Use Compact Development within the heart of
Bhopal city which is further part of the urban fabric of the city. More than 90% of land in this
area is owned by government and it is planned to unlock the value of this underutilized
government land in the heart of the city. The redevelopment area is of 360 acres of North
and South TT Nagar with Gamon development on one side and New Market area on the
other. Sewage treatment is the predominantly integral part of the Public Health
Infrastructure in the project. Sewerage treatment system for project area is envisaged with
state of the art technology for treatment, reuse and disposal of sewage.
8.2 Raw sewage:
1.1 GENERAL:
The development area is of mixed use and consisting of residential, commercial,
institutional, governmental offices, hospitals and recreational areas. Sewage Treatment
Plant will be designed to remove the contaminants from sewage generated from the above
areas as per the norms specified by guidelines and produce treated sewage for recycling. In
line with sustainable infrastructure plan, 100% sewage is proposed to be treated to required
standards and recycled. Sewage treatment plants are proposed in modules as necessary as
per the development of the site. The recycled water can be reused for various purposes like
flushing, make up water for HVAC system, pond water top-up, gardening & irrigation of
lawn, shrubs etc. Excess of recycled water after utilising for various above mention purposes
it will be discharge into pond or discharged into nearby nallah. The proposed treatment
plant sites are at plot no. 64 and 17.

8-27 Feasibility Report Bhopal Smart City Development
Corporation Limited
1.2 QUANTITY:
The total estimated population for the proposed project site area is 2,07,171, out of this
residential population is 70,285, commercial population is 1,08,533 and floating population
is 28,353.
Per capita water demand rates as per CPHEEO Water Supply Manual, Nov 1999 were
finalized for residential and other types of population in proposed project site. Per capita
water demand is break-up into potable water & non-potable (recycle) water requirement.
Similarly, per capita sewage flow is break-up as per source of generation i.e. generated from
potable or from recycle water use.
Table 8-1: Waste-water Generation from project site
S. No. Basis for Waste-water Generation % Basis
1 Sewage Generation from potable water 80%
2 Sewage Generation from flushing water 100%
3 % of TSE recyclable from sewage generated 95%
For the design of the Sewerage Treatment Plant, the peak factors with respect to
contributing population for domestic sewage, as per CPHEEO Manual on Sewerage and
Sewage Treatment are furnished in Table 1-2.
Table 8-2: Peak Factor Based on Population
Contributing Population Peak factor
Upto 20,000 3.00
>20,000 upto 50,000 2.50
>50,000 upto 7,50,000 2.25
Above 7,50,000 2.00
(Source: Manual on Sewerage and Sewage Treatment-Nov, 2013 by CPHEEO)

8-28 Feasibility Report Bhopal Smart City Development
Corporation Limited
So as per the above given table Peak factor will be applied to the proposed sewerage
treatment plants.
Based on the above mentioned parameters the total waste-water expected to be generated
in the project site is estimated to be 15 MLD.
1.3 RAW SEWAGE QUALITY:
Understanding of the nature of physical, chemical and biological characteristics of sewage is
essential in planning, design and operation of treatment and disposal facilities and in the
engineering management of environmental quality. The raw sewage characteristics are
referred from Table 5.4 of CPHEEO Manual, 2013. The typical expected influent
characteristics of raw domestic sewage are given in Table 1-3.
Table 8-3: Raw Sewage Characteristics
Sr. No. Parameters Concentration Values
(Expected)
Concentration
Values (CPHEEO)
1 pH 6.5 - 8.5 -
2 BOD5 @ 20C, mg/L 250 – 300 250
3 COD , mg/L 425 – 600 425
4 Total suspended solids, mg/L 300 – 400 375
5 Oil and grease, mg/L 10 – 20 -
6 Total kjeldahl Nitrogen (as N), mg/L 50 – 60 45
7 Total Phosphorus, mg/L 8 – 10 7.1
8 Feacal Coliforms MPN/100 ml 10^6
to10^8 -
1.4 EFFLUENT STANDARDS:
It is proposed that the sewage which is generated is to be treated to such standards that it
can be used for various purposes like flushing, make up water for HVAC system, pond water
top-up, gardening & irrigation of lawn, shrubs etc. From the point of view of better
environment, it is contemplated that the residential project will have treatment system
which treats the entire sewage to 10mg/l (BOD and TSS) standards. The effluent standards of
treated sewage as per latest CPHEEO manual are mentioned in Table No. 8-4.

8-29 Feasibility Report Bhopal Smart City Development
Corporation Limited
Table 8-4: CPHEEO Standards of Treated Sewage
Type of Reuse All types of landscape irrigation, vehicle washing, toilet flushing, use in fire
protection systems and commercial air conditioners and other uses with
similar access or exposure to the water
Treatment Secondary, Filtration, Disinfection
pH 6.5 - 8.3
BOD (mg/L) ≤ 10
COD (mg/L) ≤ 50
TSS (mg/L) ND
Turbidity (NTU) ≤ 2
Fecal Coli/100mL ND
Residual Chlorine
(mg/L)
≤ 1
The reclaimed water should not contain measurable levels of viable pathogens.
Reclaimed water should be clear and odourless.
Higher chlorine residual and/ or a longer contact time may be necessary to assure that
viruses and parasites are inactivated or destroyed.
Chlorine residual of 0.3-0.5 mg/l or greater in the distribution system is recommended
to reduce odours, slime and bacterial re-growth.
Ref : CPHEEO guidelines for treated water reuse.
Reclaimed water from tertiary treatment of STP is proposed to be stored in treated water
tank near STP. This treated/ recycled water is proposed to be supplied for flushing, make up
water for HVAC system, pond top up, gardening & irrigation of lawns, shrubs etc. Hence,
expected standard will be as given in Table No. 1-5.
Table 8-5: Treated Sewage Standards

8-30 Feasibility Report Bhopal Smart City Development
Corporation Limited
Parameters After secondary treatment After tertiary treatment
BOD5 (mg/L) <20 <10
COD (mg/L) <100 <50
TSS (mg/L) <30 ND
Total Nitrogen (mg/L) <10 <10
Total Phosphorous (mg/L) <2 <1
pH 6.5 – 8.5 6.5 – 8.5
Turbidity (NTU) <10 <2
Residual chlorine <1 0.3 – 0.5
Fecal Coliform, (MPN/100ml) < 230 ND
2.0 TREATMENT PROCESS:
2.1 BASIC PARAMETERS:
The area available for the plant is limited and its cost is relatively high in Bhopal and hence
this aspect is considered in selection of suitable process. Also it is expected certain variation
in wastewater quantity and quality which will be considered for process selection/ flow
sheet.
The treatment process basically will be Aerobic process. The following aspects will be
considered:
c) Population projection and wastewater generation.
d) Influent and effluent characteristics (considering further treatment for recycling, if
required).
e) Area available (compact plant).
f) Capable of absorbing hydraulic and organic shock loads.
g) Aesthetically acceptable
h) Capable of producing specified effluent standards
i) Health and safety aspects.
j) Modular construction.
k) Automatic operation of plant with PLC.
l) Least life cycle cost i.e. capital and O & M cost

8-31 Feasibility Report Bhopal Smart City Development
Corporation Limited
2.2 GENERAL REQUIREMENTS:
Power supply arrangement to each STP needs to be finalized with respect to overall power
supply system to ABD. It is understood that reliable power supply will be available for STP(s)
and in case of power failure DG sets will be there to avoid uninterrupted operation of Plant.
Necessary other facilities such as water supply, internal roads and storm water drains,
compound wall, gates and landscaping etc. will be considered.
The wastewater treatment plant will be the state of the art technology with automatic
operation and control with PLC and SCADA system. The instrumentation for the
measurement of parameters such as flow, dissolved oxygen, temperature, pressures etc will
be provided. Also the laboratory will be established within the plant premises for routine
tests to be conducted for efficient operation of the plant. Training to Client staff is one of the
important aspects, which should be considered while inviting tenders for treatment plants
on turnkey basis. The treatment plant should be constructed in modules in view of flow
development and flexibility in O&M.
2.3 PROCESS CONSIDERATIONS:
In general for treatment of domestic sewage the process involves:
Preliminary Treatment (Screening and Grit Removal)
Secondary Treatment (Aerobic Biological Treatment)
Sludge treatment (thickener and centrifuge)

8-32 Feasibility Report Bhopal Smart City Development
Corporation Limited
Figure 8-1 Typical Flow Diagram of Sewage Treatment Plant
The treatment process such as conventional activated sludge process, Trickling filters are not
considered since these processes require primary sludge handling and its digestion. Thus
primary settling tank and anaerobic digester are additional units and hence capital cost,
O&M cost and land requirement are more for these processes.
The aerated lagoons, waste stabilization ponds are not considered due to large magnitude of
land requirement apart from likely nuisance of odour and mosquito problems.
The following alternative processes are considered which will be evaluated based on present
worth analysis:

8-33 Feasibility Report Bhopal Smart City Development
Corporation Limited
a) Extended Aeration (EA)
b) Moving Bed Bio-Reactor (MBBR)
c) Sequential Batch reactor (SBR)
d) Membrane Bio Reactor (MBR)
Since the sludge is aerobically digested in above process it can be thickened / dewatered by
mechanical means for further use as manure or sanitary landfill. Thus anaerobic digester can
be eliminated.
2.3.1 EXTENDED AERATION (EA)
The extended aeration process is similar to the conventional plug – flow process except that
it operates in the endogenous respiration phase of the growth curve, which requires a low
organic loading and long aeration time. Because of the long SRTs (20 to 30 d) and HRT is 12 -
18 hr; aeration equipment design is controlled by mixing needs and oxygen demand. The
process is simpler by eliminating primary settling tank and anaerobic digester. Generally,
secondary clarifiers are designed at lower hydraulic loading rates than conventional
activated sludge clarifiers for better settlement of sludge.
Advantages of EA:
i. High quality effluent is possible
ii. Relatively less complicated design and operation
iii. Capable of treating shock loads
iv. Well stabilised sludge; low biosolids production
Disadvantages of EA:
i. Aeration requires high energy
ii. Relatively large aeration tanks

8-34 Feasibility Report Bhopal Smart City Development
Corporation Limited
Figure 8-2: Aeration Basin Extended Aeration
2.3.2 MOVING BED BIOREACTOR (MBBR):
The MBBR is an aerobic attached growth process which uses cylindrical shaped polyethylene
carrier elements for biological growth. The moving media increases the contact time
between the micro organisms and the organics. Since the media has high porosity it provides
large surface area for micro organisms to attach and grow. MBBR does not require any
return activated sludge flow or backwashing. It has excellent characteristics for BOD/COD
removal and nitrification/ denitrification for all types of wastewater. It is compact and
requires comparatively lesser space than the conventional system. The schematic diagram of
MBBR process is given in Fig.1-2.

8-35 Feasibility Report Bhopal Smart City Development
Corporation Limited
Figure 8-3: Schematic for Moving Bed Bioreactor
Advantages of MBBR:
i. Provides very long SRTs.
ii. High quality effluent is produced with low SS and COD.
iii. The Plant is Compacted
Disadvantages of MBBR:
i. Separate secondary settling tank required with sludge removal facility
ii. The process is sensitive
2.3.3 SEQUENTIAL BATCH REACTOR (SBR)
The SBR is a fill and draw type of reactor system involving a single complete – mix
reactor in which all steps of the activated sludge process occur. For sewage
treatment with continuous flow, at least 2 basins are used so that one basin is in the
fill mode while the other goes through react, solids settling, and effluent withdrawal.
An SBR goes through a number of cycles per day; a typical cycle may consist of 1.5
hr. fill and aeration, 0.75 hr. settle, and 0.75 hr. for withdrawal of supernatant. MLSS
remains in the reactor during all cycles, thereby eliminating the need for separate

8-36 Feasibility Report Bhopal Smart City Development
Corporation Limited
secondary sedimentation tanks. Decanting of supernatant is accomplished by
decanter mechanism. The HRT for SBRs generally range from 15 to 20 hr. based on
influent flow rate and tank volume used. Aeration may be accomplished by jet
aerators or coarse bubble diffusers. Separate mixing provides operating flexibility
and is useful during the fill period for anoxic operation. Sludge wasting occurs
normally during aeration period. The complete operation is PLC controlled.
Figure 8-4: Schematic for Sequential Batch Reactor Advantages of SBR:
i. Process is simplified; final clarifiers and return activated sludge pumping are not
required.
ii. Compact facility
iii. Operation is flexible; nutrient removal can be accomplished by operational changes

8-37 Feasibility Report Bhopal Smart City Development
Corporation Limited
iv. Can be operated as a selector process to minimize sludge bulking potential.
v. Quiescent settling enhances solids separation (low effluent SS)
Disadvantages of SBR:
i. High Peak flows can disrupt operation unless accounted for in design.
ii. Higher maintenance skills required for monitoring device and automation
2.3.4 MEMBRANE BIO REACTOR (MBR)
The process consists of a suspended growth biological reactor integrated with an ultra
filtration membrane system. Essentially, the ultra- filtration system replaces the solids
separation function of secondary clarifiers and sand filtration. Ultra filtration membranes
are immersed in and aeration tank, in direct contact with mixed liquor. Through the use of a
permeate pump, a vacuum is applied to a header connected to the membranes. The vacuum
draws the treated water through the hollow fiber membranes. Intermittent airflow is
introduced to the bottom of the membrane module, producing turbulence that scours the
external surface of the hollow fibres. The scouring action transfers rejected solids away from
the membrane surface. MBR process is typically operated at MLSS concentration in the
range of 6,000 to 10,000 mg/l. There is no need of secondary clarifiers or polishing filters.
Figure 8-5: Schematic for Membrane Bio-Reactor Process
Advantages of MBR:
i. High quality nitrified effluent
ii. Compact plant.
iii. Plant expansion is simple

8-38 Feasibility Report Bhopal Smart City Development
Corporation Limited
iv. Capable of absorbing hydraulic and organic shock loads.
v. No secondary clarifier required.
Disadvantages of MBR:
i. Capital cost is high
ii. O & M cost is high (limited life of membranes)
iii. Extensive piping and valves required.
iv. Higher maintenance skill required for monitoring device and automation.
3.0 EVALUATION OF PROCESSES:
Sewage Treatment Plant with Pumping Station is considered for evaluation.
Preliminary design and cost estimates of various alternative processes are analyzed
on broad basis for Total 16 MLD module to evaluate following:
i. Capital cost
ii. Operation and maintenance cost.
iii. Land required.
iv. Power required
The above details are depicted in Table 1- 6.
Table 8-6: Capital Cost, Land and Power Requirement
PROCESSES
EA MBBR SBR MBR
Capital Cost:
Civil 1,584.00 896.00 1,080.00 1,584.00
Mech. & Elect. 1,056.00 1,344.00 1,320.00 3,696.00
O & M cost per
annum 159.12 179.18 146.65 532.50
Land (Ha) 1.76 0.88 0.88 0.72
Power (kWh/day) 3,000.00 3,579.20 2,459.20 4,840.00
All costs are in Rs Lakhs

8-39 Feasibility Report Bhopal Smart City Development
Corporation Limited
3.1 CAPITAL COST:
The capital cost includes the cost of civil structure, electro- mechanical equipment,
instrumentation and control. The lowest capital cost is for MBBR (Rs 2306.00
Lakhs) whereas the highest being for MBR (Rs 5334.00 Lakhs).
3.2 OPERATION AND MAINTENANCE COST:
The operation and maintenance (O& M) cost includes:
i. Power cost
ii. Chemical cost.
iii. Man power cost.
iv. Spares and maintenance
The O & M cost for SBR is minimum (Rs 146.65 Lakhs) and the maximum for MBR
(Rs 532.50 Lakhs)
3.3 LAND REQUIRED:
The land required includes area for terminal SPS, STP units including ancillary
facilities such as administrative building, laboratory, internal roads and storm
water drains, landscaping etc.
The area required for MBR is minimum (0.72 Ha) and the maximum is for EA (1.76
Ha)
3.4 POWER REQUIRED:
The power required includes power requirement for terminal SPS, operation of
various units of STP and for general purposes such as administrative and
laboratory buildings, street lighting etc.
The power requirement for SBR is minimum (2459.20 KW/day) whereas it is
maximum for MBR (4840.00 KW/day)
The present worth analysis is carried out for various processes mentioned above for
arriving at the life cycle cost for each process. For this analysis inflation rate
considered is 8 % and discounting factor at interest rates considered @ 9 to check
the sensitivity of the present worth analysis. Since land requirement for various
processes are different, the analysis is also done considering land cost. The

8-40 Feasibility Report Bhopal Smart City Development
Corporation Limited
replacement of various components of the plant is considered in NPW analysis
based on their expected life. The summary of present worth analysis is given in
Table 1-7.
Table 8-7NET PRESENT WORTH OF VARIOUS PROCESSES
PROCESS
DISCOUNT RATE
(%)
EA MBBR SBR MBR
9 4,931.08 4,734.46 4,449.53 12,556.51
All figures are in Rs Lakhs except discount rate
SELECTION OF PROCESS:
It is observed that the Net Present worth (NPW) of SBR is the lowest at the discounting rates
of 9. The next lowest NPW is for MBBR, which is marginally higher than SBR. Hence it is
recommended that SBR process be considered while inviting tenders. The SBR is a proven
technology and hence considered for adoption in view of above evaluation. MBR process will
produce high quality effluent; however it’s NPW is the highest.
4.0 DETAILS OF SELECTED PROCESS:
The selected process (SBR) for sewage treatment plant will consist of:
Inlet chamber
Fine screen
Grit chamber
SBR Basin
Disinfection by chlorination
Chlorine contact tank
Sludge thickener
Centrifuge
Sludge drying beds (emergency)

8-41 Feasibility Report Bhopal Smart City Development
Corporation Limited
8.3 Plant based technology with zero energy requirement for converting sewage into
drinking water
8.3.1 APPROACH TO UTILISE SEWAGE WATER FOR DRINKING PURPOSE
India is facing a water crisis in nearly every large city. Water resources are spoiled or disappearing
from the formerly great river basins and aquifers that have sustained the cities until now. The
problem is two-fold: one- there is no recharge of clean water, instead the rivers and aquifers are
receiving sewage. Second, the clean water resources that do exist are being withdrawn to capacity
and beyond. Municipal water suppliers are becoming more and more desperate and engaging in
expensive, complicated long distance projects to ensure adequate water supply and to deposit the
sewage ever further from the city’s core.
In the background, the National Government has set her Intended Nationally Determined
Contributions at the Paris Convention 2015 to a 30% reduction in CO2 emissions. This goal will only
be achieved by moving to sustainable technology that does not need an external energy source.
Until now, the common model of sewage treatment and recycling has led to failure at every level in
Indian cities and to an out of control energy footprint. It is not sustainable in the simplest sense of
the word. The conventional STP’s do not survive or work in India.
The new approach is the “Smart City”, one where the lessons of the past teach us how to achieve
balance between the urban zones and the ecologic margins.
This balance is what the plant based technology1 offers sustainable holistic solutions to air water and
soil pollution with no energy cost and with minimal maintenance schedules.
The NBS™ technology (One of the option for plant based technology) is a natural ecosystem
engineered by AYALA’s experts, architecturally designed to integrate with the landscape and social
environment. Construction relies on local materials and labor.
The NBS™ contains several distinct ecosystems- a saturated lower zone, active root zone and aerial
vegetative zone. The hydraulic and engineering conditions are targeted per case in order to achieve
gravity flow through the active subsurface root zone where a wealth of natural processes reliably
and efficiently treat, buffer and revive the traversing water (Fig. 1).
1 The note has been prepared after discussing with Technology Provider from Israel - NBS™ technology AYALA

8-42 Feasibility Report Bhopal Smart City Development
Corporation Limited
8-6 The NBS™ architecture and root zone cutaway.
The generated excellent quality water would be used to recharge bore wells via an infiltration lake or
field that will also serve as an ornamental/recreational landscape.
The recharged bore wells would be used to supply drinking water. This infiltration step has been
proven to be a significant factor for residents to overcome the psychological barrier to reusing
purified sewage. Moreover it supplies an extra filtration step, while promoting healthy hydrological
conditions onsite. Estimated cost is given below.
o STP Capacity o Total Area o Estimated Cost of
implementation
o STP 1: 12 MLD o 18 Acre (each module= 6
Acre)
o 24 Crore INR
o STP 2: 6 MLD o 9 Acre (each module= 3
Acre)
o 18 Crore INR

8-43 Feasibility Report Bhopal Smart City Development
Corporation Limited
8.1 Alternate technology for converting sewage into drinking water
The system proposed is two times UF-UV with mixing sewage and water in between in order to do
away with the acceptability/unacceptability of the people for sewage as drinking water. We are
working out the detail scheme and cost for this system and should submit the same in the DPR.
Raw
Sewage Secondary
Treatment with
Sequential Bio
Reactor Ultra filtration
Disinfection
with UV
ARTIFICIAL POND WITH
MIXING RATIO OF 1:4 Water
to Sewage
Ultra filtration Disinfection
with UV Drinking
Water
GAC

9-44 Feasibility Report Bhopal Smart City Development
Corporation Limited
Common Uses for Recycle Water Agriculture landscape public parks golf course irrigation cooling water for power
plants and oil refineries processing water for mills,
plants toilet flushing dust control, construction activities concrete mixing artificial lakes
9 Chapter 9 Recycled Water
9.1 Recycled Water / Dual Plumbing
Water, food and energy securities are emerging as increasingly important and vital issues for India
and the world. Most of the river basins in India and elsewhere are closing or closed and experiencing
moderate to severe water shortages, brought on by the simultaneous effects of agricultural growth,
industrialization and urbanization. Current and future fresh water demand could be met by
enhancing water use efficiency and demand management. Thus recycle water(treated
wastewater/low quality water is emerging as potential source for demand management after
essential treatment2.
While recycling is a term generally applied to aluminum cans, glass bottles, and newspapers, water
can be recycled as well. Water recycling is reusing treated wastewater for beneficial purposes such
as agricultural and landscape irrigation, industrial processes, toilet flushing, and replenishing a
ground water basin (referred to as ground water recharge). Water recycling offers resource and
financial savings. Wastewater treatment can be tailored to meet the water quality requirements of a
planned reuse. Recycled water for landscape irrigation requires less treatment than recycled water
for drinking water.
9.2 Benefits
Recycled water can satisfy most water demands, as long as
it is adequately treated to ensure water quality appropriate
for the use. The Treatment and Uses chart shows types of
treatment processes and suggested uses at each level of
treatment. In uses where there is a greater chance of
human exposure to the water, more treatment is required.
As for any water source that is not properly treated, health
problems could arise from drinking or being exposed to
recycled water if it contains disease-causing organisms or
other contaminants.
Recycled water is most commonly used for nonpotable (not for drinking) purposes, such as
agriculture, landscape, public parks, and golf course irrigation. Other nonpotable applications
include cooling water for power plants and oil refineries, industrial process water for such facilities
as paper mills and carpet dyers, toilet flushing, dust control, construction activities, concrete mixing,
and artificial lakes.
Although most water recycling projects have been developed to meet nonpotable water demands, a
number of projects use recycled water indirectly for potable purposes. These projects include
recharging ground water aquifers and augmenting surface water reservoirs with recycled water. In
ground water recharge projects, recycled water can be spread or injected into ground water aquifers
to augment ground water supplies
2 Wastewater production, treatment and use in India R Kaur1 , SP Wani2 , AK Singh3 and K Lal1

9-45 Feasibility Report Bhopal Smart City Development
Corporation Limited
9.3 Environmental benefits
In addition to providing a dependable, locally-controlled water supply, water recycling provides
tremendous environmental benefits. By providing an additional source of water, water recycling can
help us find ways to decrease the diversion of water from sensitive ecosystems. Other benefits
include decreasing wastewater discharges and reducing and preventing pollution. Recycled water
can also be used to create or enhance wetlands and riparian habitats. Some of the key benefits are
given below:
Water Recycling Can Decrease Diversion of Freshwater from Sensitive Ecosystems
Water Recycling Decreases Discharge to Sensitive Water Bodies
Recycled Water May Be Used to Create or Enhance Wetlands and Riparian (Stream) Habitats.
Water Recycling Can Reduce and Prevent Pollution
Recycling Water Can Save Energy
Table 9-1 Suggested Recycling Treatment
Suggested Water Recycling Treatment and Uses3
Increasing Levels of Treatment;
Increasing Acceptable Levels of Human Exposure
Primary
Treatment:
Sedimentation
Secondary Treatment:
Biological Oxidation,
Disinfection
Tertiary / Advanced
Treatment:
Chemical Coagulation,
Filtration, Disinfection
No uses Recommended at
this level Surface irrigation
of orchards and
vineyards
Non-food crop
irrigation
Restricted
landscape
impoundments
Groundwater
recharge of non
potable aquifer**
Wetlands, wildlife
habitat, stream
augmentation**
Industrial cooling processes**
Landscape
and golf
course
irrigation
Toilet
flushing
Vehicle
washing
Food crop
irrigation
Unrestricted recreational
impoundment
Indirect potable reuse:
Groundwater recharge of
potable aquifer and
surface water reservoir
augmentation**
* Suggested uses are based on Guidelines for Water Reuse, developed by U.S. EPA.
** Recommended level of treatment is site-specific.
3 EPA United States Environment Protection Agency

9-46 Feasibility Report Bhopal Smart City Development
Corporation Limited
9.4 Future of water recycling
Water recycling has proven to be effective and successful in creating a new and reliable water supply
without compromising public health. Nonpotable reuse is a widely accepted practice that will
continue to grow. Advances in wastewater treatment technology and health studies of indirect
potable reuse have led many to predict that planned indirect potable reuse will soon become more
common. Recycling waste and gray4 water requires far less energy than treating salt water using a
desalination system.
While water recycling is a sustainable approach and can be cost-effective in the long term, the
treatment of wastewater for reuse and the installation of distribution systems at centralized facilities
can be initially expensive compared to such water supply alternatives as imported water, ground
water, or the use of gray water onsite from homes. Institutional barriers, as well as varying agency
priorities and public misperception, can make it difficult to implement water recycling projects.
Finally, early in the planning process, agencies must reach out to the public to address any concerns
and to keep the public informed and involved in the planning process.
As water energy demands and environmental needs grow, water recycling will play a greater role in
our overall water supply. By working together to overcome obstacles, water recycling, along with
water conservation and efficiency, can help us to sustainably manage our vital water resources.
Communities and businesses are working together to meet water resource needs locally in ways that
expand resources, support the environment, and strengthen the economy.
9.5 Dual Plumbing System
Dual Plumbing System is to be adopted in the building design in order to cater for flushing with
recycled water. Dual piping is a system of plumbing installations used to supply
both potable and reclaimed water to a home or business. Under this system, two completely
separate water piping systems are used to deliver water to the user. This system prevents mixing of
the two water supplies, which is undesirable, since reclaimed water is usually not intended for
human consumption.
9.6 Proposed System
For recycle or non-potable water supply system, entire site is devided into two zones. Tertiary water
treatment units are provided at both the STP’s which are located at plot no. 64 and 17.
Water will be pumped from recycled water tank provided at through the STP location. The pump
capacity is kept as 8hrs storage i.e one third of daily demand. Zoning diagram of recycle water
distribution system is shown below.
4 Please note – We have not considered Gray Water separately in the current project. Going by the
population and quantum of wastewater, we are treating all under one category, that is sewage water.

9-47 Feasibility Report Bhopal Smart City Development
Corporation Limited
Figure 9-1 Recycled Water Supply Zone
9.7 Cost Estimate
Sr.No. LENGTH IN METER OF PE-100 PN-6 (HDPE Pipes) RMT
1 110 11536
2 160 7917
3 200 0
4 250 401
5 315 903
Total Running meters of pipeline require 20757
The total estimate of the recycled water including pumping station is Rs 6 Cr.

10-48 Feasibility Report Bhopal Smart City Development
Corporation Limited
10 Chapter 10 SSOLID WASTE MANAGMENT SYSTEM
10.1 Introduction:
A waste is viewed as a discarded material, which has no consumer value to the person abandoning
it. According to World Health Organization (WHO), the term 'solid waste' is applied to unwanted and
discarded materials from houses, street sweepings, commercial and agricultural operations arising
out of mass activities.
Solid waste management is one of the basic urban services. The objective of solid waste
management system is to manage waste generation, storage, collection, transportation, treatment
and disposal of solid waste in a manner that is in accordance with the applicable statutory norms i.e.
Solid Waste Management (SWM) Rules 2016 and the best principles of public health, economics,
engineering, aesthetics, and other environmental considerations. This section imparts the most
feasible options for development of sustainable SWM within ABD Area.
10.2 Solid waste management rules, guidelines and policies:
The Municipal Solid Waste Management (MSWM) is mainly governed by the SWM Rules 2016 and
CPHEEO guidelines. The right to live in a healthy environment is also a basic human right. At present,
the solid waste management practices are to comply with the following sets of regulations:
Environment protection Act (Umbrella act), 1986.
Air (Prevention and control of pollution) Act 1981- amended in 1987,
Environment (Protection) Rules 1986- amended in 2003.
Solid Waste Management Rules 2016
Plastic Waste Management Rules 2016
Batteries (Management and handling) Rules 2001
Amendment to the Recycled Plastic Manufacturing and Usage Rules 2003, 1999, S. O.705 (E)
Bio-Medical Waste (Management and Handling) Rules 2016
Hazardous Wastes (Management, Handling and Trans boundary Movements) Rules 2016
E-waste (Management) Rules 20165.
Construction and Demolition Waste Rules 2016.
10.3 Statutory requirements:
In India, under the provisions of Air and Water Act, for running or establishing any industry or
process and discharging effluent/ emitting pollutants into any water resource or on land/ air and
polluting thereby the environmental water/ air is required to obtain Consent to Establish (CtE) and
Consent to Operate (CtO) from the concerned Pollution Control Board. The Madhya Pradesh
Pollution Control Board (MPCB) shall be the governing agency to release the consents. The
prerequisite documents to be considered for the processing plant are as follows,
5 Implemented from 01 October 2016

10-49 Feasibility Report Bhopal Smart City Development
Corporation Limited
License for manufacturing and trading of compost & Treatment Plant operation.
Pollution control boards NOC for manufacturing and trading of refuse derived fuel
DIC (District Industries Centre) registration.
NOC from PCB (Pollution Control Board).
NOC from Labor Commissioner
DISCOM
Apart from the above said compliances, there are other statutory compliances to be considered
before the start of any SWM project which shall be discussed in later reports.
10.4 Major sources of solid waste generation:
Municipal solid waste includes different sources of generation such as residential, commercial,
institutional and parks & logistics areas. Municipal Solid Waste (MSW) is heterogeneous in nature
and consists of a number of different materials derived from various types of activities. The major
sources of waste generation are shown in Figure 1. The waste is mainly a mixture of vegetable and
organic matter like grass, inert matters, such as glass, stones, ashes and recyclable waste like metal,
plastics, papers, wood etc. According to the percentage of the ingredient, it would be highly
combustible or combustible, biodegradable or inert.
Figure 10-1: Sources of Waste Generation
Figure 10-2 Sources of SW Production

10-50 Feasibility Report Bhopal Smart City Development
Corporation Limited
10.5 Solid waste basis & classification
As per the CPHEEO6 Draft SWM Manual 2014, NEERI7 studies in 1996 had suggested the per capita
waste generation. The waste generation as per the population is provided in table. The basis for
solid waste generation is provided in Table 1.
Table 10-1 Basis for Solid Waste Generation
S. No. Type of Use Waste (kgpc/d)
I Residential
1 Residents 0.4
2 Floating (Visitors) 0.25
II Commercial
1 Hotels (per bed) 0.2
2 Retail 0.2
III Social Amenities
1 University 0.2
2 School 0.2
3 Civic Amenities 0.2
IV Landscape (kg/qms/day) 0.0037
V Sludge production at STP (kg/ MLD) 400
The above norms are considered for the waste quantification study of ABD area.
The basis for "municipal" solid waste classification into bio-degradable, recyclable and inert wastes is
considered as per CPHEEO Draft SWM Manual 2014. Typical municipal waste classification for
residential and commercial land-uses is represented by given Figure. The Bio-medical generated
within project boundary will be separately handled by the current agencies as per Bio-Medical Waste
(Management & Handling) Rules, 2016
6 Central Public Health Environmental Engineering Organization
7 National Environmental Engineering Research Institute
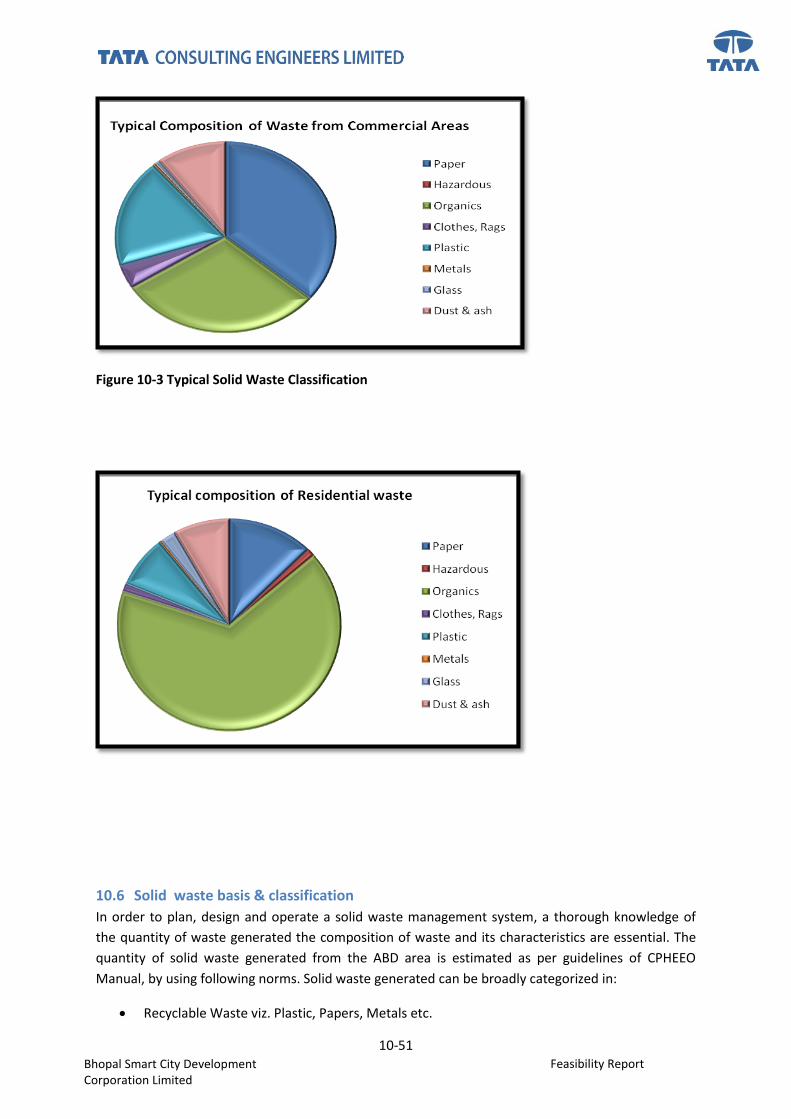
10-51 Feasibility Report Bhopal Smart City Development
Corporation Limited
Figure 10-3 Typical Solid Waste Classification
10.6 Solid waste basis & classification
In order to plan, design and operate a solid waste management system, a thorough knowledge of
the quantity of waste generated the composition of waste and its characteristics are essential. The
quantity of solid waste generated from the ABD area is estimated as per guidelines of CPHEEO
Manual, by using following norms. Solid waste generated can be broadly categorized in:
Recyclable Waste viz. Plastic, Papers, Metals etc.
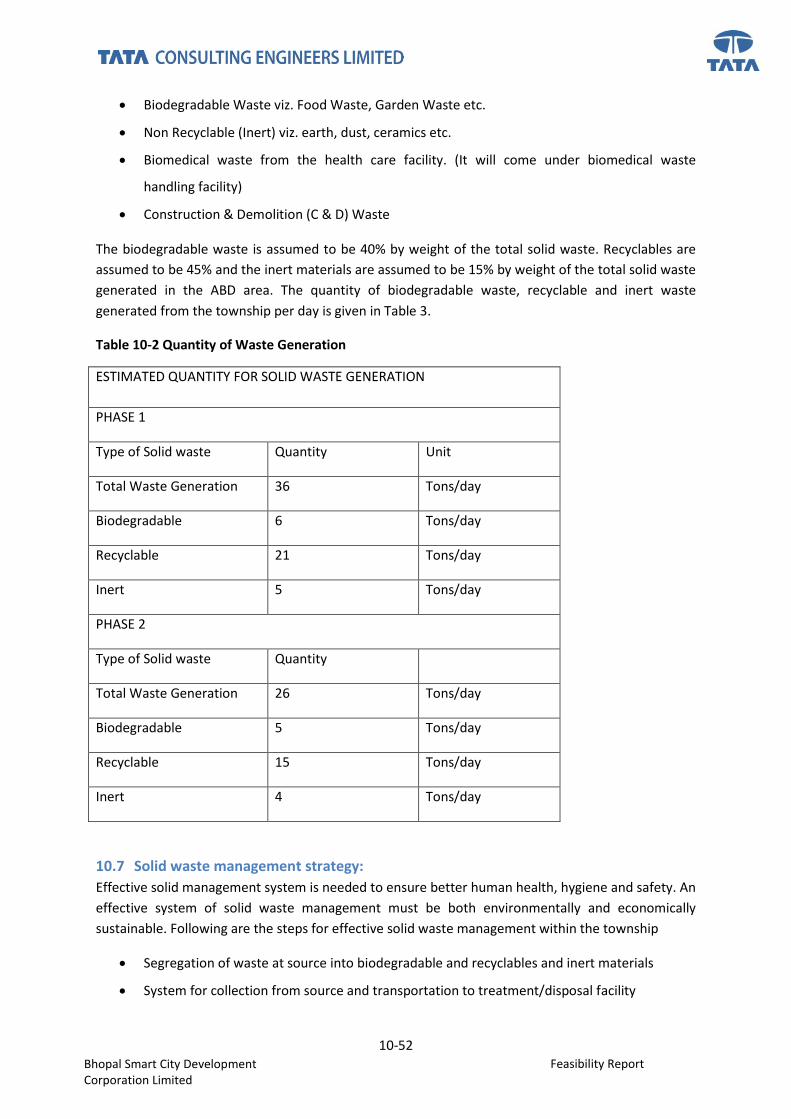
10-52 Feasibility Report Bhopal Smart City Development
Corporation Limited
Biodegradable Waste viz. Food Waste, Garden Waste etc.
Non Recyclable (Inert) viz. earth, dust, ceramics etc.
Biomedical waste from the health care facility. (It will come under biomedical waste
handling facility)
Construction & Demolition (C & D) Waste
The biodegradable waste is assumed to be 40% by weight of the total solid waste. Recyclables are
assumed to be 45% and the inert materials are assumed to be 15% by weight of the total solid waste
generated in the ABD area. The quantity of biodegradable waste, recyclable and inert waste
generated from the township per day is given in Table 3.
Table 10-2 Quantity of Waste Generation
ESTIMATED QUANTITY FOR SOLID WASTE GENERATION
PHASE 1
Type of Solid waste Quantity Unit
Total Waste Generation 36 Tons/day
Biodegradable 6 Tons/day
Recyclable 21 Tons/day
Inert 5 Tons/day
PHASE 2
Type of Solid waste Quantity
Total Waste Generation 26 Tons/day
Biodegradable 5 Tons/day
Recyclable 15 Tons/day
Inert 4 Tons/day
10.7 Solid waste management strategy:
Effective solid management system is needed to ensure better human health, hygiene and safety. An
effective system of solid waste management must be both environmentally and economically
sustainable. Following are the steps for effective solid waste management within the township
Segregation of waste at source into biodegradable and recyclables and inert materials
System for collection from source and transportation to treatment/disposal facility

10-53 Feasibility Report Bhopal Smart City Development
Corporation Limited
Road sweeping
Treatment of biodegradable waste for recovery
Recycling
Land filling of the non recyclables and inert materials.
In line with best practices, SWM Rules 2016, MoUD Smart City guidelines and Govt. of India goals
outlined in NUSP 2008 advisories it is recommended that primary segregation of atleast dry and wet
solid waste be mandated. Segregation in plastic, paper etc will also be encouraged. Segregation of
waste will be proposed at source in order to provide suitable treatment process and attain
sustainable SWM approach.
10.8 Solid waste management strategy
The Table 2 accounts the various population and areas within project boundary (Residential,
Floating, Open spaces and Roads) which can overall contribute to the waste generation till 2026. For
the collection aspects, the waste generation phase wise and its further bifurcation for effective
treatment & disposal is proposed in the SWM plan.
10-4 Waste Management Strategy
A common SWM strategy is shown in Figure 3 based on which there are two approaches/ options for
managing the waste generated within the ABD area. The methodology of both the options is as
follows,

10-54 Feasibility Report Bhopal Smart City Development
Corporation Limited
10.8.1 Option 1: Conventional Waste Management System
10.8.1.1 Source Segregation:
Primary segregation of waste at source (within plots) is proposed. The segregated waste shall be
collected as dry and wet waste in bins. The biodegradable waste shall be treated in house within the
residential complexes or in group of plots. Thus the waste transportation cost shall be reduced and
the byproduct generated shall be used or sold by these complexes.
Construction and demolition wastes or debris shall be separately collected and processed. E- Waste
generated shall be handled as per the E Waste Management Rule 2016. Necessary storage area shall
be provided in each plot. It will be ensured by the facility management that no E- Waste will enter
common waste stream. The amount of E- Waste collected will be recorded and the same shall be
handled to only E- Waste recyclers.
Cleaning of roads, streets, lanes, surface drains and public places at regular intervals shall be done to
void unhygienic condition at common places. Use of containerized tricycles, handcarts and suitable
motorized or non motorized devices are suggested for collection of waste. This collection system
shall need to be in synchronization with the secondary collection process.
10.8.1.2 Secondary Collection:
The dry waste collected & stored in the secondary collection bins will be transferred to the Refuse
Compactors. This waste shall be further carried to the transfer station, where secondary segregation
of dry waste (inert, combustible & dry waste) will be performed. The wet waste generated
throughout the ABD area shall be either treated within the plot or can be further collected by the
dedicated Refuse Compactor for wet waste.
10.8.1.3 Transfer Station:
The dry waste shall be further undergoing secondary segregation. The recyclable waste collected
shall be sold to recyclable vendors. The inert waste shall be send to the SLF. The transfer station will
also have the facilities such as vehicles parking & washing area, secondary waste segregation,
temporary storage of dry waste, administrative office, weigh bridge and green belt.
10.8.1.4 Treatment:
It is proposed that most of the biodegradable waste shall be treated within the project boundary
area and only inert and dry waste shall be further taken for treatment & disposal. Plots with
unavailability of area for small composting plant within its premises shall be provided with
decentralized system of waste treatment having Bio-Methanation Plant for both Phases can be
proposed. This facility shall be provided in utility areas in the master plan. This waste generated may
also be linked up with the present waste treatment facility for Bhopal City.
Decentralized solid waste treatment is recommended and shall be arranged in such a way that it will
accommodate such treatment facility. Various technologies are available for the treatment of
biodegradable waste such as Composting, Vermi-Composting or Bio-Methanation. A comparison of
these technologies is given in table below,

10-55 Feasibility Report Bhopal Smart City Development
Corporation Limited
Table 10-3 Biological Treatment Options
Sr.
No
Vermi-Composting Composting Bio-Methanation
1 Overall clean technology if
designed constructed and
operated properly. Otherwise,
there may be instances of
dust, odour, leachate
generation litter nuisance
(especially process rejects)
and lack of aesthetic
environment, which can be
mitigated with proper
Environmental Management
Plan (EMP)
Overall clean technology if
designed constructed and
operated properly. Otherwise,
there may be instances of dust,
odour, leachate generation
litter nuisance (especially
process rejects) and lack of
aesthetic environment, which
can be mitigated with proper
Environmental Management
Plan (EMP)
Clean technology. Few instances
of odour, and litter nuisance
observed
2 Medium capital investment Relatively lower capital
investment
Capital cost significantly higher
than other two.
3 Seasonal application of
vermicompost (that is in the
post monsoon season and pre
monsoon season) necessitates
the requirement of area for
storage of compost
Compost can be used as
manure.
Biogas generated or the power
generated from biogas has always
demand in the market
4 Seasonal fluctuations in the
cycle time
No seasonal fluctuations in the
cycle time
The operation is independent of
seasons, as long as the conditions
inside the digester are
maintained and the continuous
feed to digester.
5 In the perception of NGOs and
the public, composting is an
acceptable technology if the
compost plant is properly
maintained
composting is an acceptable
technology if the compost plant
is properly maintained
Bio-Methanation is better
accepted by the public, as the
digesters are completely enclosed
and therefore perceived to be
clean.
6 The quantity of process
remnants generated is 25–
40%
The quantity of process
remnants generated is 10 – 15%
The quantity of process remnants
generated is 20 – 30%

10-56 Feasibility Report Bhopal Smart City Development
Corporation Limited
10.8.1.5 Inert:
The inert waste generated after the secondary waste segregation shall be send to the centralized
Sanitary Land fill Facility (SLF) of Bhopal City. The city sends the waste at the Bhanpur which is about
three decade old and 90 % filled to its capacity. The area covered under Bhanpur Dump site is 57.8
Acres. Due to the increase in rate of waste generation, a need for creating a scientific Landfill site
was felt. A new Landfill site is identified at Adampur Chawni which needs to be tapped in a methodic
manner for catering to the inert waste generated within Bhopal City.
10.8.2 Option 2:
10.8.2.1 Source Segregation:
An Automated Waste Collection (AWC) System is proposed within the ABD area. Separate chutes for
individual buildings and Outdoor Disposal Inlet (ODI) for wet & dry waste shall collect the waste in a
segregated manner. Different waste categories are emptied separately in the respective inlets and
then transported through the same pipe network. Then the diverter valve automatically directs the
waste to the respective container at the collection station. The collected waste is compressed at an
average rate of 5:1 to 3:1 depending on waste category before being moved into the container for
disposal. Alternatively using the same inlet and container a time based disposal strategy is
implemented by the resident’s i.e. organic during the day and inorganic at evening.
The air used for transporting the waste passes through sound dampers and odour filters before
being released into the atmosphere.
Figure 10-5: Alternatives of Waste Collection in AWC System
Figure 10-6: AWCS Concept

10-57 Feasibility Report Bhopal Smart City Development
Corporation Limited
This system can be designed as per the requirement and level of waste segregation. Presently a wet
& dry system of waste collection is considered.
Figure 10-7: Separate Waste Collection Chutes in Buildings
The AWC system of waste collection & disposal strategy is as follows:
Residents deposit waste through the inlets on individual floors into the garbage chute located
centrally in the core of the buildings or dedicated locations in the podium for the retail and
restaurant outlets
The garbage chutes from residential towers, office towers, hotels and retail are connected to
temporary storage sections in the grade or basement levels.
The storage sections are connected by discharge valves to the main transport pipe network.

10-58 Feasibility Report Bhopal Smart City Development
Corporation Limited
Outdoor inlets with discharge valves cater to the townhouses along the main pipe net route and
collect waste disposed by residents, retailers and facility management personnel.
Outdoor inlets on the branch lines have a sectioning valve and air inlet valve at the consecutive ends
of the pipe lines which get activated during the cycle of operation.
Waste is emptied from temporary storage units based on a time based cycle and load levels
whichever is first.
Negative pressure is created in the horizontal transport pipe by activating the air valves which draw
in air from the atmosphere ( car park / basement / open area).
Discharge valves at the storage section open and discharge garbage into main transport pipe. These
discharge inlets and pipe net form branches to a main trunk and are 500mm dia Mild steel.
Garbage transported in pipes from the inlets into the collection station under vacuum.
Garbage goes through a waste separator which separates garbage from air and further falls into a
compactor depending upon type into a storage container.
Air is released into atmosphere after being treated through a series of deodorizers, silencers and
filters.
Compacted garbage in the containers once filled is transferred on garbage trucks or a centralized
Transfer station to be transported to the treatment plant and landfill as per the quality.
All the segregated bio-degradable waste collected is further transported to centralized or
decentralized treatment facilities depending on options of treatments to be considered. As
mentioned above, the all the segregated waste collected from pipe will be transported to centralized
transfer station which shall have further segregation of dry waste. This facility shall also be having
temporary storage facility of recyclable waste from where the recycling vendors shall collect. The
AWC system shall not collect hazardous waste, bio-medical or E- waste from the collection bins/
chutes. A strategy for separate system of these waste collections is discussed in the following
sections.
Selection of Technology for Treatment:
The decision to implement any particular technology needs to be based on its techno-economic
viability, sustainability, and environmental implications, keeping in view the local conditions and the
available physical and financial resources. The key factors considered in selection of technology are:
The nature, origin and quality of the waste
Availability of outlets for the energy produced
Market for the compost/anaerobic digestion sludge
Energy prices/buyback tariff for energy purchase

10-59 Feasibility Report Bhopal Smart City Development
Corporation Limited
Cost of alternatives, land price and capital and labour cost
Operational & Maintenance cost, energy generation, payback period and tipping fees
Capabilities and experience of the technology provider
Based on assessment of various options available, Organic Waste Converter (OWC) system is
suggested as suitable technology for the treatment of biodegradable waste at plot level of ABD area
as it is considered to be a cleaner technology as well as space requirement is quite low.
For the AWC system of waste collection, it is suggested that the bio degradable waste collected at
the transfer station will be further transported to the Bio-Methanation Plant. The electricity
generated from the plant shall be used for street lighting. The manure generated will be either
utilized for the gardens or parks of the city or sold. Both the technologies shall reduce the waste
transportation cost considerably as are directly taken to the treatment facility.
Organic Waste Converter:
An “Organic waste Converter” (OWC) converts the Organic Waste into odour free homogenized
coarse powder in 15 to 20 minutes. The output from OWC facilitates accelerated composting in less
than 2 weeks of curing period.
The Segregated Organic Waste is bio-mechanically treated in the OWC machine. It homogenizes
organic waste with appropriate bio-culture and organic media. The coarse wastes such as garden
pruning, bones etc are shredded prior to feeding into OWC machine. The output from OWC machine
is raw compost having uniform coloured and soil structured coarse powder, free of bad odour. The
leachate is controlled during homogenization process in OWC. The OWC operates in batch cycle of
about 15-20 minutes. The waste treated in OWC machine accelerates the composting cycle. The raw
compost can be converted into rich matured compost using compost multi-rake curing system in
about 10 to 15 days.
The matured compost can be utilized for in-house gardening, landscaping or for green initiatives
such as eco-housing, eco-township, eco-hotels etc or as part of Corporate Social Responsibility such
as social forestry, waste land rejuvenation, Bio-Energy plantation etc.
BIO MEDICAL WASTE MANAGEMENT
The Bio Medical Waste (BMW) generated within the ABD area shall be regulated at source and
collected in different bags as per BMW Rules 2016. BMW wastes shall be collected from the
hospitals / Nursing Home within project boundary and transported in close vehicles to Private all
India Nursing Home Association (Bhopal Incinerators Ltd. Govindpura) which is currently handling
the BMW Waste. This facility is privatized and is proposed to be used for any BMW waste generated
in future. The Plant is installed at Govindpura Industrial area Bhopal.
CONSTRUCTION & DEMOLITION WASTE

10-60 Feasibility Report Bhopal Smart City Development
Corporation Limited
The construction and demolition waste generated in Bhopal on account of the Smart City Works in
the TT Nagar is given in Table 1 shows the area details. Out of the total area of 360.4 acres, about
19.1% i.e. 68.87 acres retained that majorly consists of educational and religious areas. So, the actual
area for demolition is around 291.54 acres. The demolition area is reconstructed and hence both
construction and demolition waste generation is plenty.
Table 10-4: Area Development Calculation
Sr. No. Description Area (Sq. mts) Area (Acres) Area (%)
1 Total Area 1,458,501.78 360.40 100%
2 Area to be Retained 278,688.34 68.87 19.1%
3 Area to be demolished 1,179,813.44 291.54 80.89%
According to Technology Information, Forecasting and Assessment Council (TIFAC), the C&D waste
generated from demolition work is 300 to 500 kg/m2 and from construction work is 40 to 60 kg/m2.
The assumptions of C&D waste generation considered for quantification is given in Table 5.
Table 10-5: Standards for C & D Waste generation
Sr. No. Waste Quantity
1 Demolition Waste 400 kg/sq.m
2 Construction Waste 50 kg/sq.m
The total area to be demolished is around 1,179,813 m2 and assuming that construction work will be
taking place on all the demolished area, hence total area to be demolished and constructed is
2,359,627 m2. Total C&D waste generated is given in Table 6.
Table 10-6: Total C & D Waste generation within project boundary
Sr. No Entity Unit Value
1 Demolition Area m2 1,179,813
2 Demolition Waste tonnes 471,925
3 Construction Area m2 1,179,813
4 Construction Waste tonnes 58,991
5 Total C&D waste tonnes 530,916
The three phases are considered at an interval of 10 years from the current year. Following are the
assumptions of development within project boundary as given in Table 7.
Table 10-7: Development within ABD area
Sr. No Phase Interval Development (%)
1 Phase I (2026) 10 75

10-61 Feasibility Report Bhopal Smart City Development
Corporation Limited
2 Phase II (2036) 20 25
The C&D Waste generated within the Phase 1 is 398187 Tons throughout 10 years, thus contributing
to 110 Tons/ Day. Phase II shall be generating 132729 Tons throughout 10 years with 36.86 Tons/
Day.
Construction and demolition activity leads to generation of sand, gravel, concrete, stone, bricks,
wood, metal, glass, plastic, paper etc. There is a great concern about C&D waste management due to
ever increasing quantum and shortage of dumping sites. C&D waste is bulky and heavy and is mostly
unsuitable for disposal by incineration or composting. Re-utilization or recycling is an important
strategy for management of such waste.
E-Waste:
The E waste generated shall be collected and disposed as per the Guidelines for Environmentally
Sound Management of E Waste, by MoEF&CC and CPCB. It is proposed that E-waste collection
drives within the city shall be taken monthly basis within the project boundary for collecting such
waste. The collected waste shall be taken to authorize recycling agencies for recycling.
BLOCK COST ESTIMATES:
MSW Plant
The Block Cost Estimate (BOQ) for the proposed MSW Processing Plant is as follows,
Table 10-8: Block Cost Estimate for MSW processing plant & Transfer Station for Phase 1
SR.NO. DESCRIPTION COST (Rs.) in Lakhs
1 Transfer Station 175
2 Organic Waste Converter 9
3 Fabricated Bio Methanation Plants Lump sum
(7T/day)
338
The major overhauling of the project will be done at the end of every 5 year. The cost of the
overhauling is about 20% of the total project cost. The cost for Bio Methanation is given as follows,
Table 10-9: O&M Cost for Bio-Methanation Plant Phase 1
DESCRIPTION COST (Rs. IN LAKHS)
Major Overhauling After Every 5 Years (20% Of Total Cost) For Bio
Methanation
59

10-62 Feasibility Report Bhopal Smart City Development
Corporation Limited
Life of the Fabricated Bio Methanation Plant is considered 15 years. Replacement of the plant shall be proposed
after 15 years by Conducting Audit Of The Project
O&M Cost of Bio Methanation 14
Following are the assumption taken into consideration,
The above cost are tentative and as per the current rates. Price escalation will be added as per the
year accounted in phase wise manner.
Change of major Machineries/ Instruments proposed at the end of 15 years.
For the phase II, the capacity of Bio-Methanation plant shall needs to be augmented and thus plant
with 5 MT capacities will be proposed.
For Phase 2, the costing for Bio-Methanation Plant is as follows,
Table 10-10: Costing for Bio Methanation Treatment Plant for Phase II
SR.NO. DESCRIPTION COST (Rs.) in Lakhs
1 Fabricated Bio Methanation Plants Lump sum
(5T/day)
164
2 O&M cost for 5 MT/day plant 15
The above Phase 2 cost is included with the escalation till the Phase 2 is initiated.
Bins
Total number of bins for Combustible and Recyclable waste in Phase wise manner along with its
block cost for the waste bins to be provided with the two locations is as follows,
Table 10-11: Costing for Bins for Biodegradable Waste
Phase Quantity Unit Rate Total Cost (lakhs)
1 52 3000 2
2 42 3450 5
Table 10-12: Costing for Bins for Other Dry Waste

10-63 Feasibility Report Bhopal Smart City Development
Corporation Limited
Phase Quantity Unit Rate Total Cost (lakhs)
1 178 3000 1
2 128 3450 4
Table 10-13: Costing for Roadside Bins
Phase Quantity Unit Rate Total Cost (lakhs)
1 120 7145 9
2 104 8217 9
Vehicles cost:
The vehicle cost for the transportation of the Biodegradable and Other waste in Phase wise is given
in the below table,
Table 10-14: Primary Collection & Transportation of Biodegradable Waste
Phase Vehicle Capacity (cu.m) Quantity Unit Rate (lakhs) Total Cost (lakhs)
1 10 2 15 30
2 10 2 20 40
Table 10-15: Primary Collection & Transportation of Other Waste
Phase Vehicle Capacity (cu.m) Quantity Unit Rate (lakhs) Total Cost (lakhs)
1 15 1 30 30
2 10 1 20 20
For Phase 1, the current price for vehicles is considered. For Phase 2, the price escalation as per the
start of Phase 2 is estimated.
As discussed in the above sections, separate vehicles for collection and transportation of waste in to
wet & dry are proposed. The O & M cost for the vehicles for Biodegradable waste are given below.
Table 10-16: Secondary Transportation of Inert Waste
Phase Vehicle Capacity (cu.m) Quantity Unit Rate (lakhs) Total Cost (lakhs)
1 8 1 10 10
2 8 1 13 13

10-64 Feasibility Report Bhopal Smart City Development
Corporation Limited
The summary of the Phase wise costing is as follows,
Table 10-17: Cost Estimate for Phase 1 with Option 1
SR.NO. DESCRIPTION COST (Rs.) IN LAKHS
TREATMENT OPTIONS
1 TRANSFER STATION 175
2 VEHICLE COST 70
3 BIO METHANATION PLANT 338
4 O&M COST OF BIO METHANATION 15
5 O&M COST PRIMARY TRANSPORTATION TILL TRANSFER
STATION PER MONTH
2
6 O&M FOR TS
(WATER,ELECTRICITY,MANPOWER,MACHINERY)
0.92
7 BINS 16
TOTAL 616
Table 10-18Cost Estimate for Phase 2 with Option 1
SR.NO. DESCRIPTION COST (Rs.) IN LAKHS
TREATMENT OPTIONS
1 VEHICLE COST 72
2 BIO METHANATION PLANT 164
3 O&M COST OF BIO METHANATION 15
4 O&M COST PRIMARY TRANSPORTATION TILL TRANSFER
STATION PER MONTH
2
5 O AND M FOR TS
(WATER,ELECTRICITY,MANPOWER,MACHINERY)
1
6 BINS 14
TOTAL 267
Automated Waste Collection System:

10-65 Feasibility Report Bhopal Smart City Development
Corporation Limited
For the Automated Waste Collection system the tentative costing based on the primary study is as
follows,
Table 10-19: AWC system Capital and O&M Cost
Cost (in Lakhs) Phase 1 Phase 2
Lump Sum 3000 3450
O&M Cost (per
year)
11 12
Cost of Excavation of tunnel and Transfer station building shall be additional.

66 Bhopal Smart City Development
Corporation Limited Feasibility Report
11 Chapter 11 INFORMATION AND COMMUNICATION TECHNOLOGY (ICT)
11.1 Introduction
When considering the implementation of a smart ICT plan for a city, the first step for any
policymaker is to foster the development of a rich environment of broadband networks that support
digital applications, ensuring that these networks are available throughout the city and to all citizens.
This plan for easy access to broadband should include a broadband infrastructure that combines
cable, optical fibre, and wireless networks. This will offer maximum connectivity and bandwidth to
citizens and organisations located in the city. The latest broadband service is fibre-optic, which is the
fastest Internet connection available. Expanding this service across the city is an essential part of any
smart city agenda. With these fibre-optic cables connectivity increases in critical areas around the
city such as universities, business centers, technical and research institutes, government offices and
emergency response units. These fibre optic networks are fundamental in acting as a backbone for
ensuring high-speed access to the Internet. Additionally, they facilitate the installation of sensors,
which are key to the development of intelligent solutions for the city. They also ensure access to any
electronic public services that the city plans to offer its constituents.
The long term goal of setting up such an infrastructure is to facilitate, once broadband access is
widespread enough, an open broadband network that the entire city population, i.e. organizations,
companies, municipalities and individuals can use. This widespread availability of fast Internet
speeds has often been shown to lead to the development of innovative approaches to particular
social challenges and to the establishment of new businesses and business models. In addition to the
wired broadband networks that are necessary for smart cities, wireless broadband is becoming ever
more in demand, especially with the explosive popularity of mobile applications, smart phones, the
increased connectivity of smart devices, the Internet of Things (IoT), as well as the drop in costs of
sensors and radio frequency identification (RFID) technology. Cities can use broadband wireless
networks to enable a wide range of smart city applications that enhance safety and security,
improve efficiency of municipal services and promote a better quality of life for residents and
visitors. This mobile infrastructure has already become an essential element for smart cities.
The second step for smart city planners to consider when implementing a smart ICT plan for a city is
to ensure that the physical space and infrastructures of the city are enriched with embedded
systems, smart devices, sensors, and actuators, offering real-time data management, alerts, and
information processing for the city administration.
The presence of these devices combined with wireless connectivity throughout a city facilitates a
richer and more complex digital space within the city, which in turn can increase the collective
embedded intelligence of a city. This collective embedded intelligence allows relevant stakeholders
of the city to be informed about the city's physical environment and facilitates the deployment of
advanced services like spatial intelligence. It also paves the way for developing other innovative
ecosystems that help to link the city with its people and visitors through technology.
For Bhopal ABD-area following Smart initiatives are considered:
Robust IT Connectivity with optical fiber network

67 Bhopal Smart City Development
Corporation Limited Feasibility Report
Wi-Fi Connectivity along the major roads
Intelligent Traffic management System
Smart Parking System
Energy efficient Street Lighting
Public Safety and Security
Integrated Command and Control Centre
Smart Metering and SCADA for Energy and Water Distribution
Emergency Response System
Geographical Information System
GPS Based VTS and Passenger Information System
E-Governance and Online services (G2B & G2C)
11.2 Robust IT Connectivity with optical fibre network
To provide the robust connectivity for internet and telephone the optical fiber network needs to be
laid down. Internet and Telephone services will be provided by the Internet Service Providers (ISP)
and Telecom Service Providers (TSP). Outside Plant optical fiber passive infrastructure shall be
planned for:
Telecom duct along both sides of major roads and internal roads.
Figure 11-1 ICT Options

68 Bhopal Smart City Development
Corporation Limited Feasibility Report
Manholes on telecom duct for pulling, Splicing and providing connections to plot owners
Point of Presence and Street Cabinet for ISP/TSPs
The ISPs/TSPs will lay down their own high speed robust fiber network in the provided duct.
Proper guidelines are to be provided to the Developer or the Building owner for providing
the Manhole connection and Telecom Infrastructure space provision inside the plot area.
Telecom infrastructure is referred to the infrastructure that will be used for Telecom Service
Provider (TSP/ISP) to offer the service inside the development area. The manhole and all
infrastructures toward ISP Central Office are under ISP responsibility. The infrastructure
beyond the manhole toward the property is under Property Developer responsibility.
11.3 Wi-Fi Connectivity along the major roads
This service offers Wi-Fi hot spots in the public areas, along the road of ABD area. These hot spots
allow citizens and visitors to access information, e-governance, content, video-on-demand library
and could potentially allow for internet along the roads and hot-spots in public places on fixed Smart
Poles.
Wi-Fi access is an interesting alternative to cellular networks, as it is a widespread wireless
technology, provides high data rates and has a low deployment cost. Cellular broadband networks
are facing the problems of traffic congestion and network capacity.
11.4 Intelligent Traffic management System
The Integrated Traffic Management System (ITMS) will consist of the hardware and software
necessary to monitor and control traffic and improve the safety and quality of traffic flow by
preventing or relieving congestion. The primary functions of the system are to provide:
Efficient movement of traffic on the roadways.
Early detection of traffic incidents that cause slowdowns and/or blockages using video based
incident detection.
Motorist alerts to incidents by means of variable message signs (VMS), highway advisory
radio (HAR), and AM/FM Override.
Systematic lane control for shifting, or redirecting, traffic through the roadways by means of
lane use signals (LUS) and VMS.
Continuous monitoring and logging of traffic conditions using Intelligent Traffic Signaling
System, Video Surveillance, GPS Based VTS, Toll Tag Transponders and Dedicated Short
Range Communications (DSRC) devices.
Communications with emergency services such as fire, police, and first aid.
Visual traffic monitoring by means of a closed circuit television system (CCTV) and
Emergency Response System (ERS).

69 Bhopal Smart City Development
Corporation Limited Feasibility Report
Improved uniformity and stability of traffic flow, thereby preventing the onset of congestion.
Diversion of freeway traffic to alternate routes to maximize roadway through-put and
utilization of total freeway capacity.
The principal benefits of the ITMS are enhanced motorist safety, reduced incident response and
clearance time, and efficient use of available roadway capacity. The ITSCS allows response
procedures and strategies to be developed in advance to deal safely with various traffic operations
and environmental conditions that will occur. Some of these conditions are reoccurring such as peak
hour traffic congestion; some are non-reoccurring, such as accidents. Continuous monitoring of
traffic and environmental conditions allows significant changes to be identified and the appropriate
pre-planned response (i.e. strategy) to be initiated in a timely manner to reduce the severity of the
traffic congestion and help mitigate the impact to motorists.
11.5 Smart Parking System
This service directs the vehicles entering the ABD-Area to the designated parking facility. The service
indicates, through digital signage, the way to reach the car park, and displays useful information
such as number of available spaces. Increased security for the car park can be enabled by having
automatic registration of the license plate number of the cars entering and exiting the parking area.
The car park access system could be integrated with Integrated CCC’s smart card (for residents and
business users) and the temporary access cards (for visitors).
Wireless Outdoor Parking Guidance System provides cost-effective solution, which detects presence
of vehicle by analyzing the change in magnetic field sensors installed underground or proximity
sensors in each parking slot to identify if the slot is occupied or vacant, and reports to the local car
park access control system. This information leads motorists to the nearest available parking space
through multiple display boards / space indicators. Also this information is made available through
smart mobile app.
11.6 Energy efficient Street Lighting
Intelligent street lighting systems adapt lamp brightness to the prevailing conditions and ensure that
the streets are illuminated only as brightly as current traffic volumes require and do not operate only
on time (Day/Night) based switching. Each group of street lights can be controlled by the central
system or a street cabinet, enabling optimal energy usage through basic on/off switching or
dimming.The ON/OFF Control configuration includes:
Segment gateway
Bank relay to centrally control street lights
Optional Meter for measuring consumption
Smart Lights central management software
Street lights are one of the most important public assets. Management of Street lights is one
of the key components of any Smart City program. Smart Street Light control and
management System forms network of streetlights using IoT enabled devices and advanced
wireless communication technologies. Apart from automated management of streetlights

70 Bhopal Smart City Development
Corporation Limited Feasibility Report
from anywhere in the world, it helps reduce expensive electricity costs, CO2 emission, patrol
man power required for streetlight maintenance and provides automated asset
management. Use of technologies enabling lights to be automatically turned ON/OFF or
even dimmed at set time so r under set conditions. It helps optima land efficient use of
electrical energy resulting in significant energy savings. Moreover, the power usage and
consumption patterns can be measured and logged and failures can be quickly identified at
individual lamp level.
11.7 Public Safety and Security
The service consists of deploying IP based video cameras on the road junctions, Entry points, streets,
Public Places, common areas of government and institutional buildings, and other key areas
throughout ABD Area and integration to the cameras installed in the other part of the city.
The primary means of detecting and verifying incidents and monitoring the roadway network, will be
the closed circuit television (CCTV) system. The system will include remotely controlled colour PTZ
cameras (pan, tilt, zoom - PTZ) with pan and tilt movement capability and zoom lenses wherever
there are large open/ public spaces along the roads or in front of the buildings and fixed cameras for
continuous roadways. These cameras will be located at strategic intervals throughout the roadway
system. The cameras will have night vision capabilities to capture video for 24X7 of the defined
areas. Special high resolution cameras with ANPR (Automatic Number Plate Recognition) will cover
the traffic signal junctions.
11.8 Integrated Command and Control Centre
The Integrated City Command & Control Center (CCC) is the heart of the ICT backbone where the
overall monitoring and control of major functions of the data / communication network resides. All
the monitoring and control system are integrated at the single place at CCC. Whereas the actual
control of the various systems / subsystems will be done through their respective control centre /
personnel in coordination with the other systems. This will provide proper understanding of the
situation and provide faster response time.
The required data for monitoring these system / sub-system operations will be received by the
relevant operators handling the respective functions in the CCC.
11.9 Smart Metering and SCADA for Energy and Water Distribution
A smart meter is an electronic device that records consumption of utilities like electric
energy, water or gas in intervals of an hour or less and communicates that information at
least daily back to the utility for monitoring and billing purpose. Smart meters enable two-
way communication between the meter and the central management system. Unlike home
energy monitors, smart meters can gather data for remote reporting.

71 Bhopal Smart City Development
Corporation Limited Feasibility Report
Smart Meter collects the data of consumption of the utilities and transmit the consumption
reading to the data concentrator by means of wired or wireless transmission. Wired
transmission of metered data from Smart meter to data concentrator will be over twisted
pair cable on RS 485 of Wireless on RF (preferably Zig bee). Transfer of the data from the
data concentrator to the central Management Servers will be by GPRS or TCP/IP
communication over Ethernet.
11.10 Emergency Response System
During a disaster or emergency, a smart city must maintain operations required to address time-
sensitive, disaster-specific issues. No plan can anticipate or include procedures to address all the
human, operational and regulatory issues. Essential business transactions must function, addressing
needs assessment, communication, volunteer outreach and coordination, grant applications, and
community assistance under rapidly changing circumstances.
There is an applied case of the technology to reinforce the disaster prevention that is one of the
roles of the ICT in smart sustainable cities. During a disaster or emergency situation, it is sometimes
very difficult to get an accurate real time assessment of the situation on the ground. There is a lot
of data which needs to be obtained, analyzed and shared among many different agencies,
organizations and individuals. Technology especially ICT has the ability and potential to address and
solve some of these issues by providing the appropriate (relevant) information from various sources.
ICT can aggregate, create, integrate information, and search the heterogeneous and multi-domain
data and deliver a comprehensive set of information, appropriate for each end user. A smart city’s
disaster resilience solutions should cover observation systems, information gathering capabilities,
data analysis and decision making aids. These components matched with an intelligent and
interoperable warning system will enable cities to respond effectively to natural disasters. This
depends on the municipality’s use of ICT infrastructure to efficiently receive data, process, analyse
and re-distribute, and mobilize various city services.
11.11 Geographical Information System
Geographical information system (GIS) is widely used to optimize maintenance schedules and daily
fleet movements. Typical implementations can result in a savings of 10 to 30 percent in operational
expenses through reduction in fuel use and staff time, improved customer service, and more
efficient scheduling. GIS helped the City of Woodland refine its fleet scheduling, saving fuel and
labor. GIS is the go-to technology for making better decisions about location. Common examples
include real estate site selection, route/corridor selection, evacuation planning, conservation,
natural resource extraction, etc. Making correct decisions about location is critical to the success of
an organization.
This GIS-based disaster decision support system helps Taiwan plan for and respond to typhoons.
11.12 GPS Based VTS and Passenger Information System
This service allows the identification and tracking of vehicles of public transport (example: BRTS –
Bus Rapid Transit System). The Automated Vehicle Location System (AVLS) shall primarily use GPS

72 Bhopal Smart City Development
Corporation Limited Feasibility Report
devices mounted on the vehicle as primary source of data for tracking purposes. The AVLS shall also
facilitate Central Computing System (CCS) to enable Passenger Information System to act as a source
of information to be displayed on the public display screens and voice based information. The AVLS
shall essentially comprise of following components:
Bus Mounted GPS based driver console
Onboard Passenger Information System
GIS Based Fleet Monitoring and Control System
The Passenger Information System shall consist of following units which shall offer
customers schedule and real-time information regarding operations of the Bus Service:
Display Screen on Bus Stations
Display Screen on Bus
Voice announcement system on Bus
Web Portal for Bus Schedule & ETA

73 Bhopal Smart City Development
Corporation Limited Feasibility Report
12 Chapter 12 DISTRICT COOLING SYSTEM
12.1 Introduction
In 2015, in first round of GoI's Smart Cities Challenge competition, Bhopal was one of the 20 cities
selected, which would receive funding from the Ministry of Urban Development. Bhopal is the only
city that has opted for redevelopment model for its Area Based Development. TT Nagar area has
been selected by BSCDCL for the same. More than 90% of land in this area is owned by government
and it is planned to unlock the value of this underutilized government land in the heart of the city.
Bhopal’s Area Based Development (ABD) proposal under the Smart Cities Mission includes
redevelopment of 360 acres of government owned land parcel at TT Nagar situated between New
Market and M P Nagar. Detailed demand assessment study, based on primary and secondary data
was carried out. Based on the demand assessment study, following real estate developments can be
absorbed in the micro market
Residential: ~ 10,000 units
Office Space: 1 million sq ft
Retail Space: 2 million sq ft
Hospitality: 200 rooms
Apart from the above area, some social infrastructure in form of school, recreational park
depending upon land availability can also be developed. The table below elaborates the proposed
product mix of the development over 10 years period.
Table 12-1 Product Mix
Real Estate Component
No. Of Units
Avg. Size of Unit
Total Residential
Commercial Housing
5,732
1,800.00
10,317,600 Government Housing
1,835
1,050.00
1,926,750 Affordable
Housing
1,000
650.00
650,000 EWS 717 290.00 207,930
LIG 717 430.00 308,310
Total
Residential
10,001
13,410,590 Office Space 1,000,000
Hospitality 2 100 rooms 200,000
Retail 2,000,000
Total Area 16,610,590

74 Bhopal Smart City Development
Corporation Limited Feasibility Report
This development includes mixed development of Residential, Commercial and Social
establishments. It is anticipated that all the commercial areas will be provided with air conditioning
facility. To make this facility efficient and sustainable option of District Cooling System is considered.
Very large reservoir of chilled water is generated within DCS plant and same is distributed to
individual building/establishments through distribution network spread across the project site.DCS
plant for total project will be of modular type and shall be enhanced along with development of
commercial buildings within the project timeline. DCS plant shall be located in Plot no 44 and 64.
Table 12-2 DCS Capacity for Bhopal ABD Area
Description Plots cater
By dcs
Total bua Dcs capacity Area in sqm
DCS – 1 AT PLOT
NO 64
57,58,59,60,61,
62,63,65,66,80
443830 M² 11500 TR 4500
DCS – 2 AT PLOT
NO 44
1,2,3,4,42,43 253424 M² 6500 TR 2500
Total dcs for both the locations 697254 M² 18000 TR 7000
Figure 12-1 Typical Sketch of District Cooling System

75 Bhopal Smart City Development
Corporation Limited Feasibility Report
Table 12-3 Power and Water Requirement
Sr no Description Dcs capacity Hvac electrical load Water
requirement Plant
side
Consumer side
1 DCS - 1 11500 TR 11.5 MW 2.9 MW 1280 KLD
2 DCS - 2 6500 TR 6.5 MW 1.6 MW 720 KLD
12.2 Assumptions for sizing of the DCS Plant
Air-conditioning Building Load :
o 315 BUA Sqft./TR for Commercial Buildings.
Chilled Water temperature difference (Outlet minus Inlet) of 7 Deg. C.
Air-conditioning Load Diversity:
o Entire DCS Plant is sized with 75 % or 0.75
Operational hours : 12
Design Average Velocity through Chilled water pipes: 2.5 m/sec.
Single Chilled water piping will be sized to carry 20 % additional flow capacity at its design
velocity
Makeup Water Requirement for Cooling Tower 1.3 % of the Circulating Chiller Condenser
Water. The above requirement shall be met through Treated STP water.
Power Requirement
o DCS power load – 1.0 kW/ TR.
o Building Air-Conditioning power load - 0.25 kW/ TR.
12.3 System Description
District cooling system consists of cold water being distributed from one main plant, via a network of
pipes, to a multi-block area of offices, commercial centers and public buildings. The cold water is
pumped through the district cooling piping network to individual customer. Each building has its
own energy transfer system (ETS) to further distribute cooling energy to individual spaces. Once it
has completed its cycle, the same water is fed back to the plant and cooled again.
The Thermal Storage System shall be used as a part of the DCS to take advantage of difference in
tariff rate of electricity during day time and night time. Chillers will be kept running night time and
chilled water generated during this period shall be stored in Thermal Storage Tank. This arrangement
not only helps individual chiller to run with maximum efficiency due to low ambient temperature
during night time but also contributes to less power consumption by each chiller. During the peak
day time chilled water stored in this tank shall be utilized for air conditioning purpose, during this

76 Bhopal Smart City Development
Corporation Limited Feasibility Report
period chillers will be kept off. Number of hours chilled water consumption from the tank will be
depending upon Thermal Storage Tank capacity. Total requirement of each area describe above shall
be provided by DCS using combination of Chilling plant and Thermal storage system.
12.4 System Components
There are three important segments in which DCS is divided. Each segment has specific design
requirements, specific set of equipments, specific requirements of installation and maintenance
features. Each segment is having unique importance therefore success of DCS is depending upon
correctness of design and smooth interfacing of each segment with each other. A DCS consists of
three primary components:
12.4.1.1 The Central Plants
The Central Plants will comprise of Water-cooled Centrifugal Chillers, Primary Constant and
Secondary Variable Chilled water pumps, Condenser Water pumps, Cooling towers, Pressurized
tank/ Air Separator with booster pumps, Insulated Thermal Energy Storage (TES) tank, TES Variable
Chilled water pumps, Over-head Makeup Water Tank, Side-stream water filtration Unit, MCC Panel
etc.
12.4.1.2 The Distribution Network
The Distribution Network will comprise of Main Supply and Return Insulated Chilled water piping
with accessories, Energy transfer stations for each building. Primary constant and secondary variable
pumping philosophy is adopted to meet the variable demand.
12.4.1.3 The Consumer System
The Consumer System will comprise of Tertiary chilled water variable Pumps, Supply and Return
Chilled water piping with accessories, Air Handling Units/ Fan Coil Units, Pressure breakers etc.
12.5 Other Services Required
District Cooling System will be functioning and operating as per desired conditions only if the
following associated services are taken consideration while designing and maintained throughout
the life of the system.
Civil & Structural Elements such as foundations for the Chillers and water pumps, basins for
the cooling towers, pedestals for Chilled Water piping etc.
Electrical system – Uninterrupted Electrical supply to the Equipments of the Plants.
Fire-fighting system for the Transformers and the plant buildings.
Plumbing system - Uninterrupted makeup water supply to the plant
SCADA/ PLC Automation – Smooth operation and interfacing of various equipment
Access Roads for safe movement of the equipment up to the plant.

77 Bhopal Smart City Development
Corporation Limited Feasibility Report
Figure 12-2 Schematic Diagram of DCS
12.6 Advantages of DCS Plant - Service Provider Side
Reduced capital cost, operating cost and maintenance cost since DCS is design with 70 – 80%
diversity based on project size. For this project we have used 75% diversity.
Capital cost investment, required for creating DCS is one time investment. Also this plant is
modular type can be enhanced as per phase wise development
Reduced operation cost since network based controls permit DCS plant to respond to actual
loads at each point of use, adjusting both flow and chilled water temperature to optimize
the operating efficiency of the overall system at all times.
Longer revenue returns, since life of DCS system is around 40 – 50 years.
DCS has high reliability since all major components of central plant is designed in n+1
configuration.

78 Bhopal Smart City Development
Corporation Limited Feasibility Report
12.7 Disadvantages – Consumer Side
Reduced cost since Capacity and Quantity of high side equipment i.e. Chillers, Cooling Towers,
Pumps, etc since it is part of DCS central plant (scope of service provider).
Cost of MCC panel and WTP is saved which otherwise is required to satisfy electricity and water
demand of DCS.
Effective utilization of available space since no space allocation required for the high side
equipment.
Operation and maintenance cost of central plant is reduced.
12.8 Cost Estimate
For the entire Bhopal city having a capacity of 18,000 TR total estimated cost budget would be
around 245.0 crores considering 5% escalation over a period of 20 years. Refer Table below for the
phase wise breakup of the total DCS cost. As the project will be carried out over a period of 15 to 20
years, BSCDCL to frequently assess the estimate considering the impact of price escalation.
Figure 12-4 DCS Cost Estimate
SR NO DESCRIPTION DCS CAPACITY COST BUDGET
1 DCS - 1 11500 TR 155 Cr
2 DCS - 2 6500 TR 90 Cr
3 TOTAL DCS 18000 TR 245 Cr
Figure 12-3 DCS System

79 Bhopal Smart City Development
Corporation Limited Feasibility Report
13 Chapter 13 FIRE FIGHTING SYSTEM
13.1 Introduction
In 2015, in first round of GoI's Smart Cities Challenge competition, Bhopal was one of the 20 cities
selected, which would receive funding from the Ministry of Urban Development. Bhopal is the only
city that has opted for redevelopment model for its Area Based Development. TT Nagar area has
been selected by BSCDCL for the same. More than 90% of land in this area is owned by government
and it is planned to unlock the value of this underutilized government land in the heart of the city.
13.2 Brief description of project:
Bhopal’s Area Based Development (ABD) proposal under the Smart Cities Mission includes
redevelopment of 360 acres of government owned land parcel at TT Nagar situated between New
Market and M P Nagar. Based on the demand assessment study, following real estate developments
can be absorbed in the micro market
o Residential: ~ 10,000 units
o Office Space: 1 million sq ft
o Retail Space: 2 million sq ft
o Hospitality: 200 rooms
Apart from the above area, some social infrastructure in form of school, recreational park depending
upon land availability can also be developed.
13.3 Scope of work:
The document covers the design parameters of the fire protection system. Input data comprise of
the following:
o Architectural drawings
o Bhopal Survey Drawing with master plan with proposed road level
o Layouts of Water Supply System -
13.4 Design Basis
All provisions for the fire-fighting shall be as per the provisions of the local fire authorities and as per
relevant I.S. codes viz. National Building Code Part IV. The Classification of the building is Apartment
Houses having height more than 15 meter in height falls under Moderate hazard category.
The design basis towards recommending appropriate fire prevention measures include a review of:
o Statutory norms
o Codal (local and international) recommendations
o Best practices
o Cost
o Ease of installation considering available infrastructure and facilities.

80 Bhopal Smart City Development
Corporation Limited Feasibility Report
The statutory bodies presently are accepting any appropriate fire detection/fighting measure
complying with local / international codes.
13.5 Design Standards
All provisions for the fire-fighting shall be as per the provisions of the local fire authorities and as per
relevant I.S. codes viz. National Building Code Part IV. The Classification of the building is Apartment
Houses having height more than 15 meter in height falls under Moderate hazard category.
The following standard has been followed for the planning and design of Fire protection system:
o NBC-2005- Fire and life safety (Part 4, Section 1).
o Local by-law.
o Indian Standards.
o IS:1239 (Part 1) : 2004. Steel Tubes, Tubular and Other Wrought. Steel Fittings
o IS 1239 (Part 2) : 2011. Steel tubes, Tubular and other steel. Fittings
o IS 3589: 2001 Steel Pipes for Water and Sewage (168.3 to 2 540 mm Outsides
diameter
o 780:1984 (R1995) Specification For Sluice Valves
o IS 5312-(1) 2004 Swing Check Type Reflux (Non-Return]. Valves
o IS:3624-1987 Specification for pressure and vacuum gauges. (second revision)
o IS:1520 :1980. Horizontal Centrifugal Pumps
o IS:9079(2002): Electric Monoset Pumps
o IS:325(1996): Three-phase induction motors
o IS:12469(1988): Specification for Pumps for Fire Fighting
o IS:15683 (2006): Portable fire extinguishers
o IS 884 (1985): Specification for First-Aid Hose-Reel
o IS 5290: 1993 Landing Valves--Specification (Third Revision)
o IS 13039: 2014: External Hydrant Systems
o IS 908· 1975. Specification for fire hydrant, stand post type. (Second Revision).
o IS 10221: 2008: Coating And Wrapping Of Underground Mild Steel Pipelines External
Hydrant Systems
o IS 6070: Code of Practice for Selection, Operation and Maintenance of Trailer Fire
Pumps, Portable Pumps, Water Tenders and Motor Fire Engines
o IS 9668 : 1990 Provision and Maintenance of water supplies for fire fighting — code
of practice
Following bodies/ institutes/ organizations are commonly referred for fire fighting system design:

81 Bhopal Smart City Development
Corporation Limited Feasibility Report
o National Building Code (NBC) of India: This is recommendatory code acceptable to
most municipalities in India.
o National Fire Protection Association (NFPA), USA: By far the most widely referred
international code on fire safety. It is a popular reference code even in India. The
municipal authorities normally tend to follow NBC but are open to accept
recommendations of TAC or NFPA for specific references.
o Recommendations given by Standing Fire Advisory Council (SFAC)
o Manual on Water Supply and Treatment by CPHEEO
13.6 Mandatory Arrangement
Please note that each plot in the ABD Area has to install their individual Fire Fighting System which
includes the following:
o An underground tank to hold water for fir fighting (UGT Fire)
o Pump sets to pump the Water to the following three locations :
o To the Fir fighting Ring Main aligned around the periphery of the Plot. The Ring Main
will have fire hydrants attached to it. Please refer Figure 1 below.
o Fire line inside the building with hose pipe connected at each floor level.
o To Network of the sprinkler system inside the building

82 Bhopal Smart City Development
Corporation Limited Feasibility Report
Figure 13-1 Fire Ring Main with Hydrant at Individual Plot Level
Figure 13-2 Oblique Type Fire Hydrant
The Hydrant will be connected with the Fir Ring Main to
be proposed within the Plot Area

83 Bhopal Smart City Development
Corporation Limited Feasibility Report
Figure 13-3 Sprinkler System
Figure 13-4 Sprinkler System Proposed Inside the Building
The pump system will be placed at the basement of the building from which water will be pumped
to the sprinkler network installed throughout the building

84 Bhopal Smart City Development
Corporation Limited Feasibility Report
Figure 13-5 Typical Piping Arrangement for hose pipe connection at floor level

85 Bhopal Smart City Development
Corporation Limited Feasibility Report
13.7 Options considered
The options considered below are in addition to the mandatory arrangements proposed in clause no
13.6
Table 13-1 Comparison of Fire Fighting Options
Option I Option II Fire station (Plot No – 45) Fire Station + Fire Hydrants connected with the
Water Supply Line along the 60m ROWs (Two Numbers) and 45m ROWs The fire hydrants will be connected at 300 m interval for the purpose of filling up the Fire Tender during fire events
Estimated cost - Rs 8.23 Crore8 Estimated cost – Rs 8.23 Cr + Rs 0.5 Cr for multiple Hydrants along the key ROWs
13.8 Description of Option 1
Fire Water Demand is calculated based on estimated population and it is 0.9MLD. It is desirable that
one third of the fire fighting requirement form a part of service storage which has been estimated as
0.3ML. Provision of storage will be considered in ESR or GSR based on Water Supply Option selected.
One no’s of fire stations are planned as per the master plan. Fire station is planned at plot no 45. The
total residential population of the city is about 75,000 and for this purpose normally one fire station
would be adequate with two fire tenders, which need to be located at the centre of the project area.
One number fire station building is proposed as per guidelines given in SFAC for requirement of fire
station building at plot no 45. The fire station is equipped with:
Fire Tender: 2 numbers ( 1W + 1S)
Adequate water storage for filling fire tender with pumping arrangement
Training facilities for fire fighting personnel
Personal protective equipments
Water supply to fire station comprise of pumps, pipes, fittings and valves to fill the elevated tank
located at fire station. Fire station comprises of submersible pumps, pipes, fittings and valves to fill
three fire- Tenders/Bowser at fire station. Storage of fire water at fire station is proposed as per
IS-9668. This quantity is considered adequate for 2hrs supply to fill fire tenders/ browser.
13.8.1 Equipment Parameters
The Equipment parameters for proposed systems are mentioned as under:
Submersible pumps for Filling Fire Tender
8 Please note the cost given is for Fire Station only. It does not include the cost of Mandatory
arrangements as discussed in clause 13.6

86 Bhopal Smart City Development
Corporation Limited Feasibility Report
Typical two no’s of submersible pumps (1W+1S) of 25cum/hr capacity and 15m head are
proposed to fill the fire tender at fire station.
Fire Tenders
Two (1W+1S) no’s of Fire Tenders of water 12000litrs water capacity are proposed at fire
station building in plot no 45.
Selected fire water tank capacity for proposed system is tabulated as under
Table 13-2 Capacity of Fire Tank at Fire Station
Fire water Storage at Fire station building
Demand
Cum/hr
108
(As per IS : 9668)
Water storage (120 minutes) 220 Cu.m
13.9 Conclusion and recommendation
1. For the development envisaged in individual plots, internal and external hydrants are
expected individual plot to be provided by the developer for their buildings as per the
relevant authority norms. A broad overview of the same has been provided in this chapter in
Clause No 13.6.
2. We suggest Option 1 (Cost Rs 8.23 Cr) as fire protection system for the city since each
individual building has its own fire protection system and nearby hydrants can cater water
requirement of fire water in case of road accident.
3. One no’s of Fire stations with two fire tenders and 220Cum fire water storage , necessary
safety equipments and structure are proposed. In the event of fire take place at common
areas fire tenders will be sufficient for protecting the same, hence separate requirement of
fire hydrant system is not required along the major ROWs.
It is recommended that scheme proposed is discussed with approving authorities before
implementation

87 Bhopal Smart City Development
Corporation Limited Feasibility Report
14 Chapter 14
14.1 The Estimated Cost of the Infrastructure Components are as given below :
14-1 Estimated Budget
Sr.No. Infrastructure Components Cost in Rs Cr
1 Utility Duct Primary 60.00 2 Utility Duct Secondary 100.00 3 Road (14.3 Km) 110.00 4 Power Supply 214.00 5 Solid Waste Management 64.50 6 ICT 87.00 7 Water Supply (20 Km) 10.00 8 Water Treatment Plant 7.80 9 Storm Water (31 Km) including RWH 52.16 10 Sewerage system (11.5 Km) 8.00 11 Sewage Treatment Plant 21.00 12 Recycled Water Network including
pumping station 6.00
13 District Cooling System 245.00 14 Fir Fighting 8.23 15 Sub Total in Rs Cr 993.69 16 Site Grading Costing is in progress 17 Retaining Wall Costing is in progress 18 Landscaping Costing is in progress

88 Bhopal Smart City Development
Corporation Limited Feasibility Report