Embed Size (px)
Citation preview

Best Practices:Performance Estimation
Trudy ForsythManaging Director
Thanks to Neil Kelley WAT, and Paul Gipe

Review the power in the wind
Understand the basic challenges of harvesting this random resource◦ Wind moves around buildings/tress/obstacle - turbulence◦ Higher wind speeds are found above the ground – shear◦ Wind speed distributions
Performance Estimation Approaches◦ Use existing tools and maps – MN wind resource map (30m) SWT labels – Annual Energy Production at 5 m/s Method of Bins
◦ Hire Site Assessor for a site assessment report ◦ Measure the Wind Resource
Overview
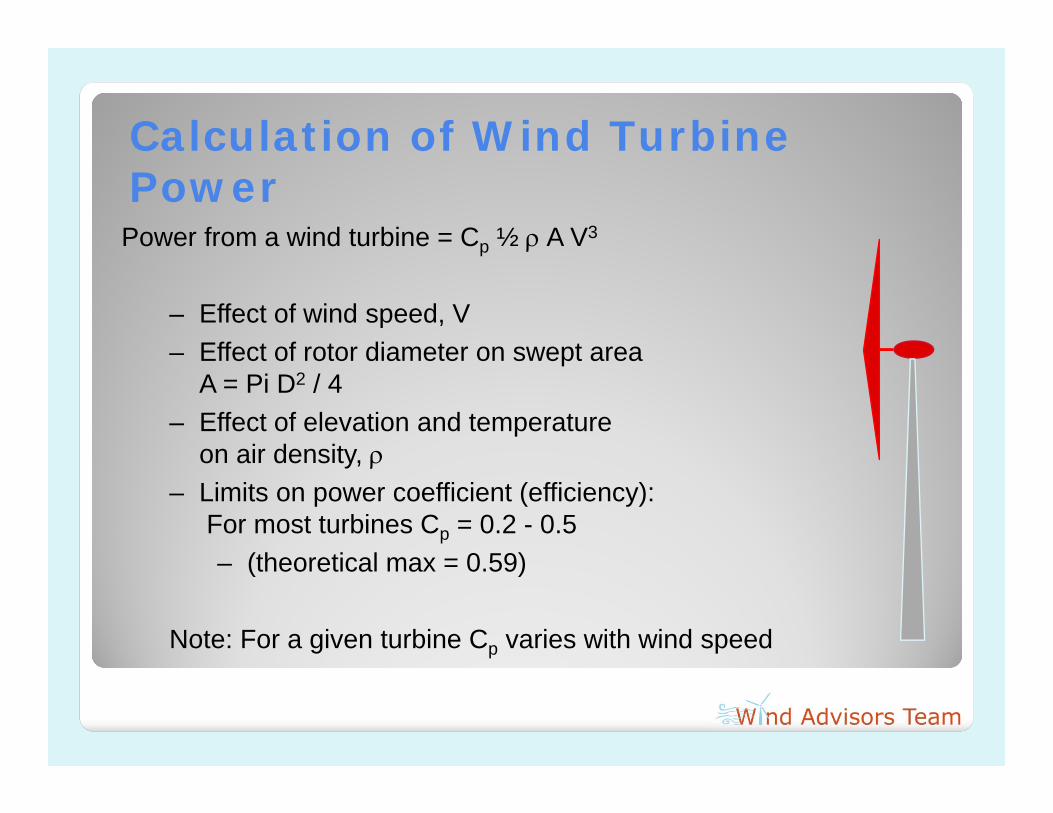
Calculation of Wind Turbine Power
Power from a wind turbine = Cp ½ A V3
– Effect of wind speed, V– Effect of rotor diameter on swept area
A = Pi D2 / 4– Effect of elevation and temperature
on air density, – Limits on power coefficient (efficiency):
For most turbines Cp = 0.2 - 0.5 – (theoretical max = 0.59)
Note: For a given turbine Cp varies with wind speed

Turbulent flow characteristics reduce the performance of wind turbines
Flow interaction between multiple structures and
trees(local-scale, 100-1000 m)
Flow interaction between two
structures and a tree(micro-scale, 10-100 m)
Oke, T.R. 2006: Towards better scientific communication in urban climate. Theoretical and Applied Climatology 84, 179-190.

Wind Speed Increases with Height
Small increases in wind speed result in large increases in power [2 x V = 8 x P]
Tall towers often needed for clearance above obstacles (turbulence)
May require a variance or a special use permit, but its worth the trouble
Credit: Paul Gipe

Wind Speed DistributionWeibull Distributions
0.250
0.200
Prop
ortio
n of
Tim
e
0.150
0.100
0.050
0.0000 2 4 6 8 10 12
Wind Speed Bin (m/s)
AWS = 5.0 m/s AWS = 5.0 m/sk = 2.0 k = 3.0PD = 146 watts/m^2 PD 108 watts/m^2
14 16 18 20
AWS = 6.0 m/sk = 2.0PD = 253 watts/m^2

Performance Estimation Approaches
Existing tools and maps◦ Look up wind maps, get certification documents
with annual energy production◦ Utilize existing tools using the “method of bins”◦ Apply a knock-down factor if in a cluttered
environment 15%? - tall tower, with few wind obstacles 25%? – lower towers and areas of obstacles
Site Assessor ◦ Develop a report for consumer based on a site visit
that provides specific guidance on turbine options (tower heights), incentive funding and other information
Wind Measurements◦ Variety of equipment that can be purchased – some
Increasing costs, time to implement & performance certainty
as low as couple of thousand dollars

Minnesota wind
resource map @ 30m

Consumer Label◦ Single-number ratings
Certificate◦ Available online to
confirm validity
Summary Report◦ Summary of testing◦ Power curve◦ Annual energy curve◦ Tabulated Data
SWCC Certification Reports

• Multiply the Power Curve by the Frequency of Occurrence on a Bin by Bin Basis
• Annual Energy Production = addition of AEP at each wind speed
PowerCurve Frequency of
Occurrence(Rayleigh Distribution, annual average = 5 m/s)
Annual Energy Production
Estimation of Annual Energy Production

Started in Wisconsin – co-funded by Focus on Energy program
Training available NREL producing a document on Site
Assessment Guidelines – currently in review Consumers need information to make a
purchase decision and the site assessor reports bring the whole package◦ Specific turbine location◦ Comparison of different products on different
towers◦ Information on incentives and other policies
Small Wind Site Assessor

Rayleigh Distribution of Wind Speed
Credit: Paul Gipe