Embed Size (px)
Citation preview
1999 / 2000
Bergman & Beving
A N N U A L R E P O R T A P R I L 1 , 1 9 9 9 – M A R C H 3 1 , 2 0 0 0

Important Events 1999/2000 . . . . . . . . . . . . . . . . . . . . . .1
The Group in Figures during Three Years . . . .1
Ten-Year Diagram . . . . . . . . . . . . . . . . . . . . . . . . . . . . . . . . . . . . . . .1
Statement of the President . . . . . . . . . . . . . . . . . . . . . . . . .2
The Bergman & Beving Group in Brief. . . . . . . . .5
The Bergman & Beving Share . . . . . . . . . . . . . . . . . . . . .6
The Bergman & Beving Group during five years . . . . . . . . . . . . . . . . . . . . . . . . . . . . . . . . . . . . . . . . . . .8
Presentation of the Bergman & Beving Group. .10
Value-adding Tech Provider. . . . . . . . . . . . . . . . . . . . . . .10
Bergman & Beving in the 2000’s . . . . . . . . . . . . . . .12
E-commerce. . . . . . . . . . . . . . . . . . . . . . . . . . . . . . . . . . . . . . . . . . . . .13
Idea & Soul . . . . . . . . . . . . . . . . . . . . . . . . . . . . . . . . . . . . . . . . . . . . . . .15
Environment and Quality . . . . . . . . . . . . . . . . . . . . . . . . . . .18
Business areas:
Bergman & Beving Electronics . . . . . . . . . . . . . . . . . .20
Bergman & Beving Industry. . . . . . . . . . . . . . . . . . . . . . .24
Bergman & Beving Tool . . . . . . . . . . . . . . . . . . . . . . . . . . . .28
Bergman & Beving MediTech . . . . . . . . . . . . . . . . . . . .32
Lagercrantz Group. . . . . . . . . . . . . . . . . . . . . . . . . . . . . . . . . . . .36
Annual Accounts:
Administration Report . . . . . . . . . . . . . . . . . . . . . . . . . . . . . . .38
Quarterly Data . . . . . . . . . . . . . . . . . . . . . . . . . . . . . . . . . . . . . . . . . .42
Consolidated Statement of Income . . . . . . . . . . .43
Consolidated Balance Sheet . . . . . . . . . . . . . . . . . . . . .44
Consolidated Statement of Cash Flow . . . . . .45
Parent Company Statement of Income . . . . .46
Parent Company Statement of Cash Flow. . .46
Parent Company Balance Sheet . . . . . . . . . . . . . . .47
Comments to the Financial Statements. . . . .48
Notes. . . . . . . . . . . . . . . . . . . . . . . . . . . . . . . . . . . . . . . . . . . . . . . . . . . . . . . .50
Proposed Allocation of Earnings . . . . . . . . . . . . . . .60
Auditors’ Report . . . . . . . . . . . . . . . . . . . . . . . . . . . . . . . . . . . . . . .61
Other information:
Board of Directors. . . . . . . . . . . . . . . . . . . . . . . . . . . . . . . . . . . . .62
Group Management. . . . . . . . . . . . . . . . . . . . . . . . . . . . . . . . . .63
Welcome to the Annual General Meeting!. .64
Financial Information . . . . . . . . . . . . . . . . . . . . . . . . . . . . . . . . . . III
Addresses . . . . . . . . . . . . . . . . . . . . . . . . . . . . . . . . . . . . . . . . . . . . . . . . . IV
This document is in all respects a translationof ther Swedish original Annual Report.
Contents
1
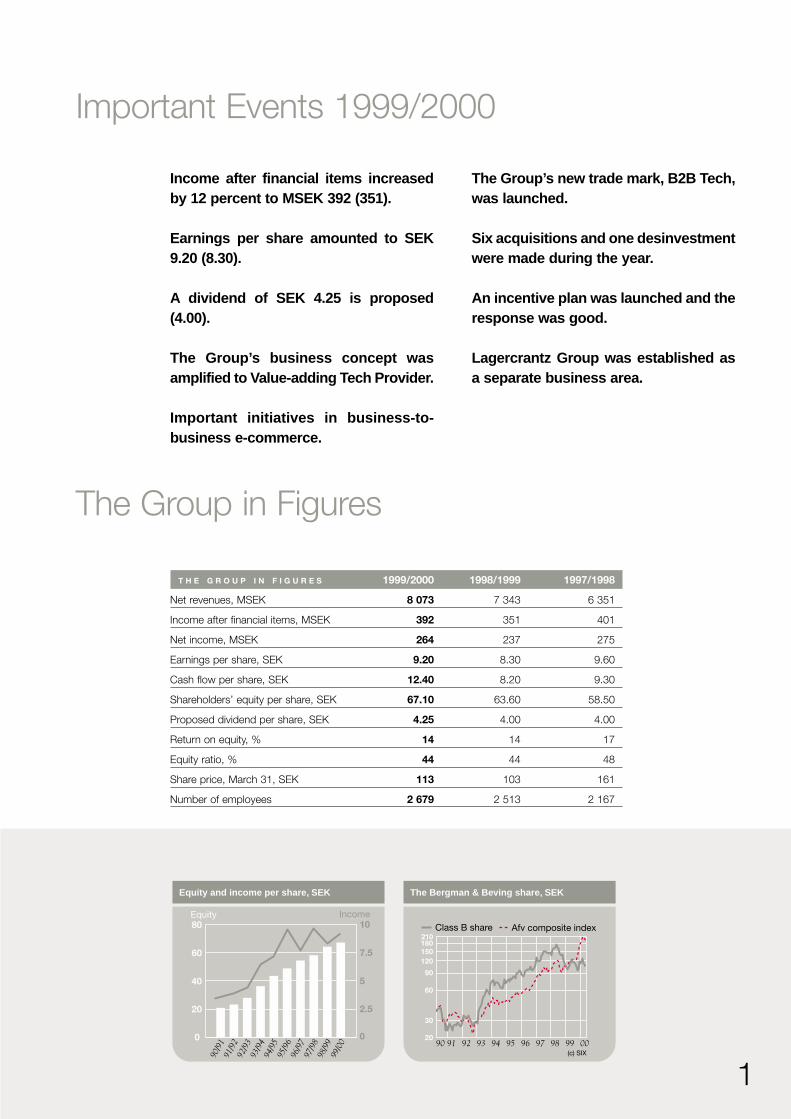
Important Events 1999/2000
Income after financial items increasedby 12 percent to MSEK 392 (351).
Earnings per share amounted to SEK9.20 (8.30).
A dividend of SEK 4.25 is proposed(4.00).
The Group’s business concept wasamplified to Value-adding Tech Provider.
Important initiatives in business-to-business e-commerce.
The Group’s new trade mark, B2B Tech,was launched.
Six acquisitions and one desinvestmentwere made during the year.
An incentive plan was launched and theresponse was good.
Lagercrantz Group was established asa separate business area.
The Group in Figures
T H E G R O U P I N F I G U R E S 1999/2000 1998/1999 1997/1998
Net revenues, MSEK 8 073 7 343 6 351
Income after financial items, MSEK 392 351 401
Net income, MSEK 264 237 275
Earnings per share, SEK 9.20 8.30 9.60
Cash flow per share, SEK 12.40 8.20 9.30
Shareholders’ equity per share, SEK 67.10 63.60 58.50
Proposed dividend per share, SEK 4.25 4.00 4.00
Return on equity, % 14 14 17
Equity ratio, % 44 44 48
Share price, March 31, SEK 113 103 161
Number of employees 2 679 2 513 2 167
Equity and income per share, SEK
0
20
40
60
80Equity Income
0
2.5
5
7.5
10
90/9
191
/92
92/9
393
/94
94/9
595
/96
96/9
797
/98
98/9
999
/00
The Bergman & Beving share, SEK
30
60
90
120 150
180 210
90 91 92 93 94 95 96 97 98 99 00
Class B share Afv composite index
20
(c) SIX
2
Statement of the President
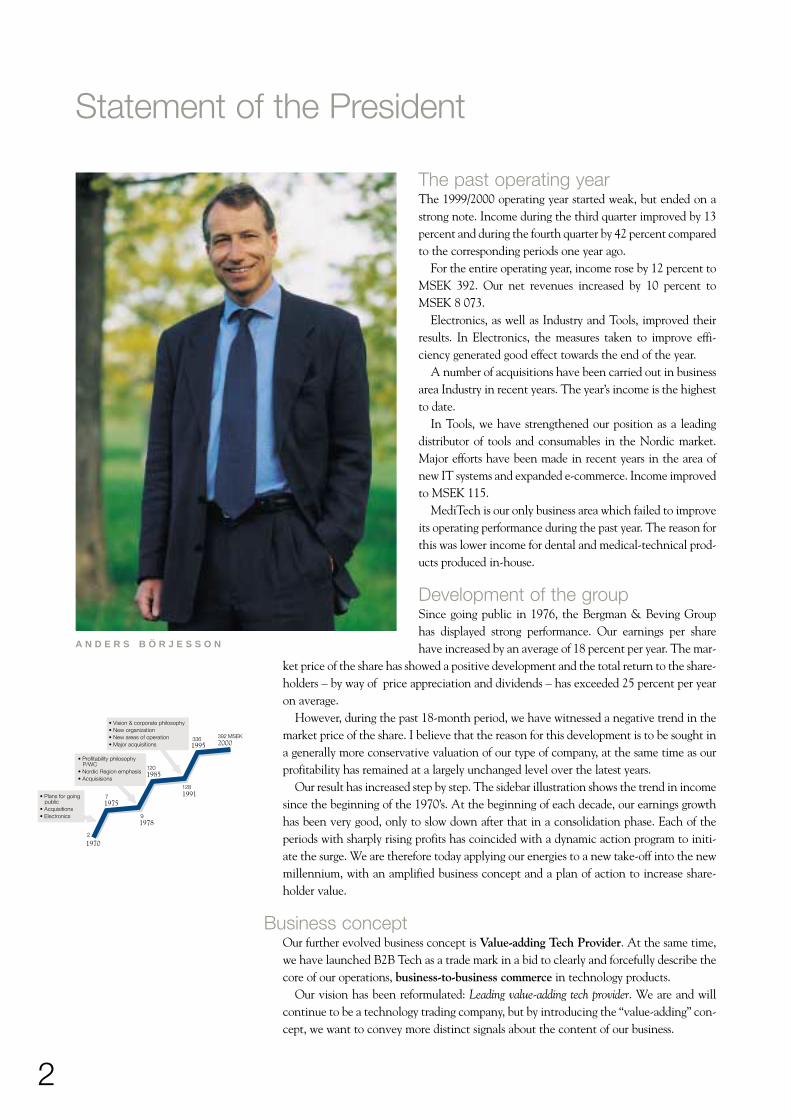
The past operating yearThe 1999/2000 operating year started weak, but ended on astrong note. Income during the third quarter improved by 13percent and during the fourth quarter by 42 percent comparedto the corresponding periods one year ago.
For the entire operating year, income rose by 12 percent toMSEK 392. Our net revenues increased by 10 percent toMSEK 8 073.
Electronics, as well as Industry and Tools, improved theirresults. In Electronics, the measures taken to improve effi-ciency generated good effect towards the end of the year.
A number of acquisitions have been carried out in businessarea Industry in recent years. The year’s income is the highestto date.
In Tools, we have strengthened our position as a leadingdistributor of tools and consumables in the Nordic market.Major efforts have been made in recent years in the area ofnew IT systems and expanded e-commerce. Income improvedto MSEK 115.
MediTech is our only business area which failed to improveits operating performance during the past year. The reason forthis was lower income for dental and medical-technical prod-ucts produced in-house.
Development of the groupSince going public in 1976, the Bergman & Beving Grouphas displayed strong performance. Our earnings per sharehave increased by an average of 18 percent per year. The mar-
ket price of the share has showed a positive development and the total return to the share-holders – by way of price appreciation and dividends – has exceeded 25 percent per yearon average.
However, during the past 18-month period, we have witnessed a negative trend in themarket price of the share. I believe that the reason for this development is to be sought ina generally more conservative valuation of our type of company, at the same time as ourprofitability has remained at a largely unchanged level over the latest years.
Our result has increased step by step. The sidebar illustration shows the trend in incomesince the beginning of the 1970’s. At the beginning of each decade, our earnings growthhas been very good, only to slow down after that in a consolidation phase. Each of theperiods with sharply rising profits has coincided with a dynamic action program to initi-ate the surge. We are therefore today applying our energies to a new take-off into the newmillennium, with an amplified business concept and a plan of action to increase share-holder value.
Business conceptOur further evolved business concept is Value-adding Tech Provider. At the same time,we have launched B2B Tech as a trade mark in a bid to clearly and forcefully describe thecore of our operations, business-to-business commerce in technology products.
Our vision has been reformulated: Leading value-adding tech provider. We are and willcontinue to be a technology trading company, but by introducing the “value-adding” con-cept, we want to convey more distinct signals about the content of our business.
1970
1975
1978
1985
1991
1995 2000
2
7
9
120
128
336 392 MSEK
• Plans for going public• Acquisitions• Electronics
• Profitability philosophy P/WC• Nordic Region emphasis• Acquisisions
• Vision & corporate philosophy• New organization• New areas of operation• Major acquisitions
A N D E R S B Ö R J E S S O N
3
Examples of added value in our business are customer-adapted solutions, in-design com-petence, efficient logistics and just-in-time deliveries, together with product knowledge,education and training, support and service. In the future we will also be launching moreproprietary brand names, and complement the trading with lighter production.
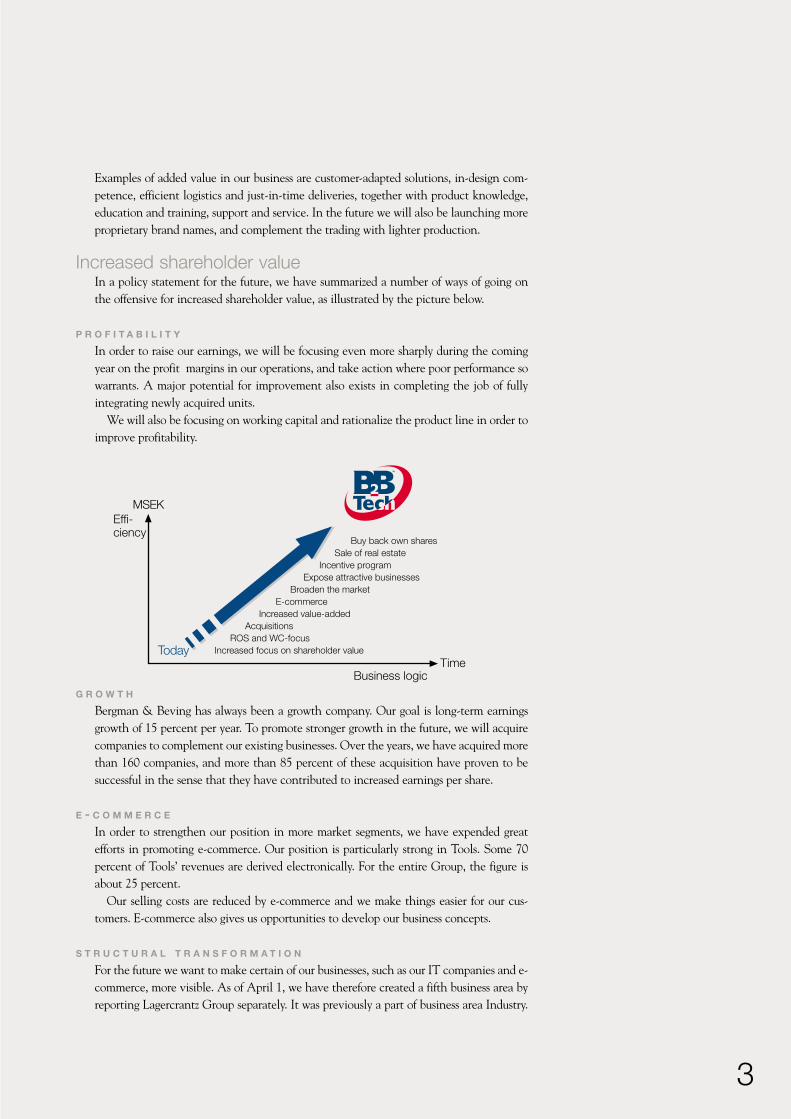
Increased shareholder valueIn a policy statement for the future, we have summarized a number of ways of going onthe offensive for increased shareholder value, as illustrated by the picture below.
P R O F I T A B I L I T Y
In order to raise our earnings, we will be focusing even more sharply during the comingyear on the profit margins in our operations, and take action where poor performance sowarrants. A major potential for improvement also exists in completing the job of fullyintegrating newly acquired units.
We will also be focusing on working capital and rationalize the product line in order toimprove profitability.
G R O W T H
Bergman & Beving has always been a growth company. Our goal is long-term earningsgrowth of 15 percent per year. To promote stronger growth in the future, we will acquirecompanies to complement our existing businesses. Over the years, we have acquired morethan 160 companies, and more than 85 percent of these acquisition have proven to besuccessful in the sense that they have contributed to increased earnings per share.
E - C O M M E R C E
In order to strengthen our position in more market segments, we have expended greatefforts in promoting e-commerce. Our position is particularly strong in Tools. Some 70percent of Tools’ revenues are derived electronically. For the entire Group, the figure isabout 25 percent.
Our selling costs are reduced by e-commerce and we make things easier for our cus-tomers. E-commerce also gives us opportunities to develop our business concepts.
S T R U C T U R A L T R A N S F O R M A T I O N
For the future we want to make certain of our businesses, such as our IT companies and e-commerce, more visible. As of April 1, we have therefore created a fifth business area byreporting Lagercrantz Group separately. It was previously a part of business area Industry.
Broaden the market
Business logicTime
MSEK
Today
Effi-ciency
Expose attractive businessesIncentive program
Sale of real estateBuy back own shares
E-commerceIncreased value-added
Acquisitions
Increased focus on shareholder valueROS and WC-focus
4
The vision of Lagercrantz Group is to be the leading knowledge company in digital communi-cation. The operations of Lagercrantz are described in greater detail on pages 36–37 of thisannual report.
Among other structural measures we are planning is the sale of our centrally locatedproperties, thereby freeing up capital.
We are also planning a buy-back of our own shares. We have a very strong financialposition and a large pool of unrestricted capital, which together with our positive cashflow makes it interesting to repurchase our own shares at attractive price levels.
E M P L O Y E E D E V E L O P M E N T
A key issue for our future development is our ability to recruit and develop employees.During the past year we expended much energy on an internal management developmentproject. Our internal Business School has been complemented with a new seminar inmanagement training.
During May 2000 we distributed our internally produced book, The Book About Idea andSoul in Bergman & Beving, to all employees.
In December 1999, an incentive program was launched for the benefit of Bergman &Beving employees. Approximately 50 percent of the Group’s Swedish employees sub-scribed for convertible debenture, and among the Group’s managers, a large majoritysigned up for an option program. These programs increase the interest of our employeesfor our earnings performance and the price performance of our share.
The futureGiven our amplified business concept and the new action programs for increased share-holder value, I regard the opportunities for a positive development of the Bergman &Beving Group as very positive. We have a sound business concept and skilled and mo-tivated employees.
Our earnings performance during the past year improved gradually and the outlook forour year 2000/2001 is good.
Anders Börjesson
5
The Bergman & Beving Group in Brief
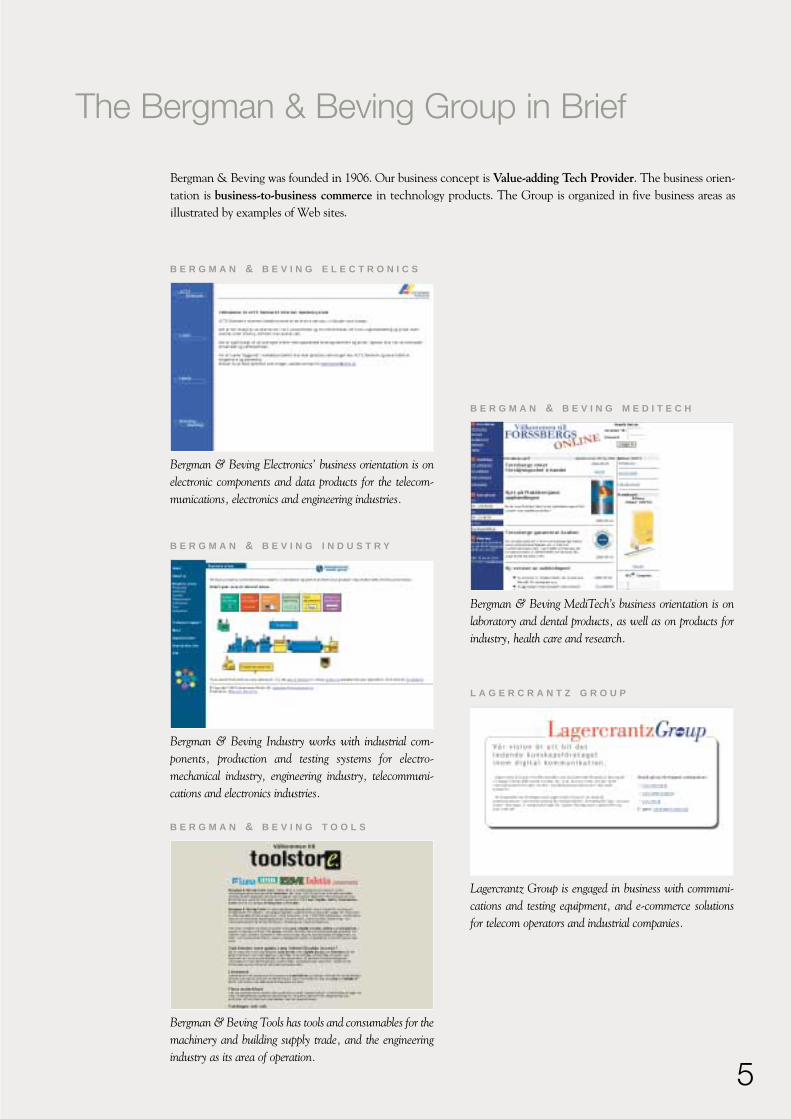
Bergman & Beving was founded in 1906. Our business concept is Value-adding Tech Provider. The business orien-tation is business-to-business commerce in technology products. The Group is organized in five business areas asillustrated by examples of Web sites.
B E R G M A N & B E V I N G E L E C T R O N I C S
Bergman & Beving Electronics’ business orientation is onelectronic components and data products for the telecom-munications, electronics and engineering industries.
B E R G M A N & B E V I N G I N D U S T R Y
Bergman & Beving Industry works with industrial com-ponents, production and testing systems for electro-mechanical industry, engineering industry, telecommuni-cations and electronics industries.
B E R G M A N & B E V I N G T O O L S
L A G E R C R A N T Z G R O U P
Bergman & Beving Tools has tools and consumables for themachinery and building supply trade, and the engineeringindustry as its area of operation.
B E R G M A N & B E V I N G M E D I T E C H
Bergman & Beving MediTech’s business orientation is onlaboratory and dental products, as well as on products forindustry, health care and research.
Lagercrantz Group is engaged in business with communi-cations and testing equipment, and e-commerce solutionsfor telecom operators and industrial companies.
6
The Bergman & Beving Share
M A R K E T L I S T I N G
The Class B share of Bergman & Beving has been publicly traded since 1976 and was list-ed on the A-list of the OM Stockholm Stock Exchange in 1984. The trading lot is 200shares.
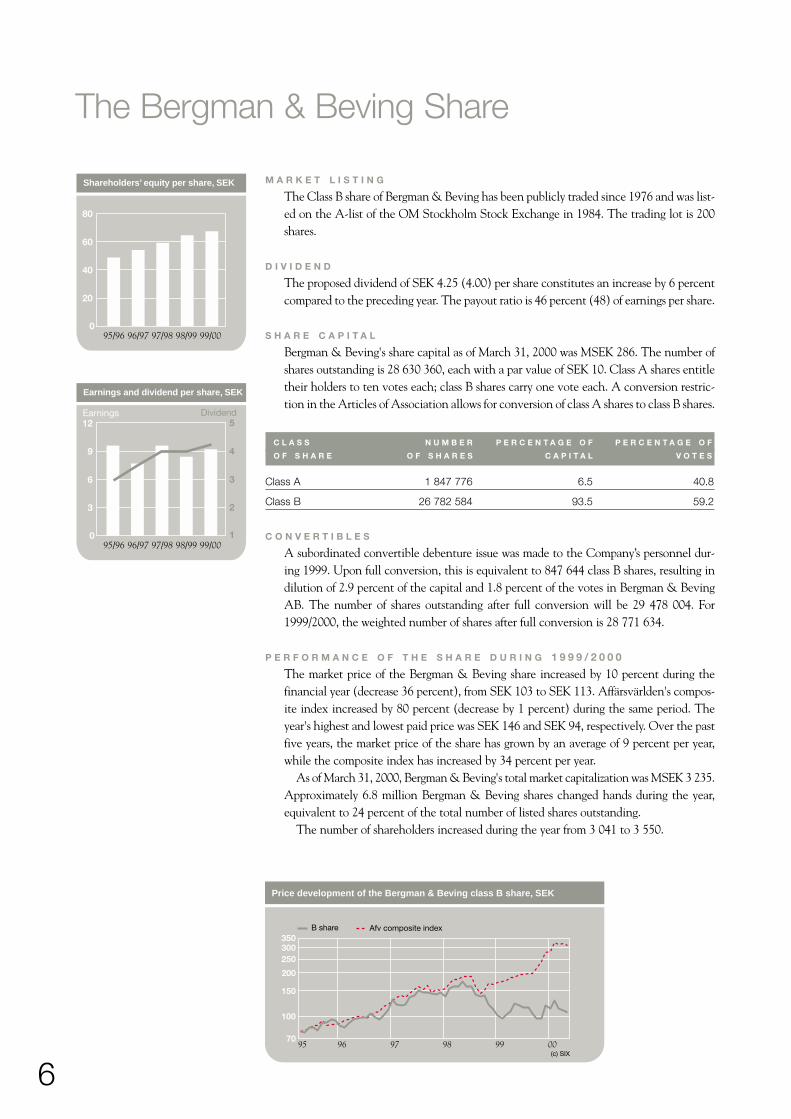
D I V I D E N D
The proposed dividend of SEK 4.25 (4.00) per share constitutes an increase by 6 percentcompared to the preceding year. The payout ratio is 46 percent (48) of earnings per share.
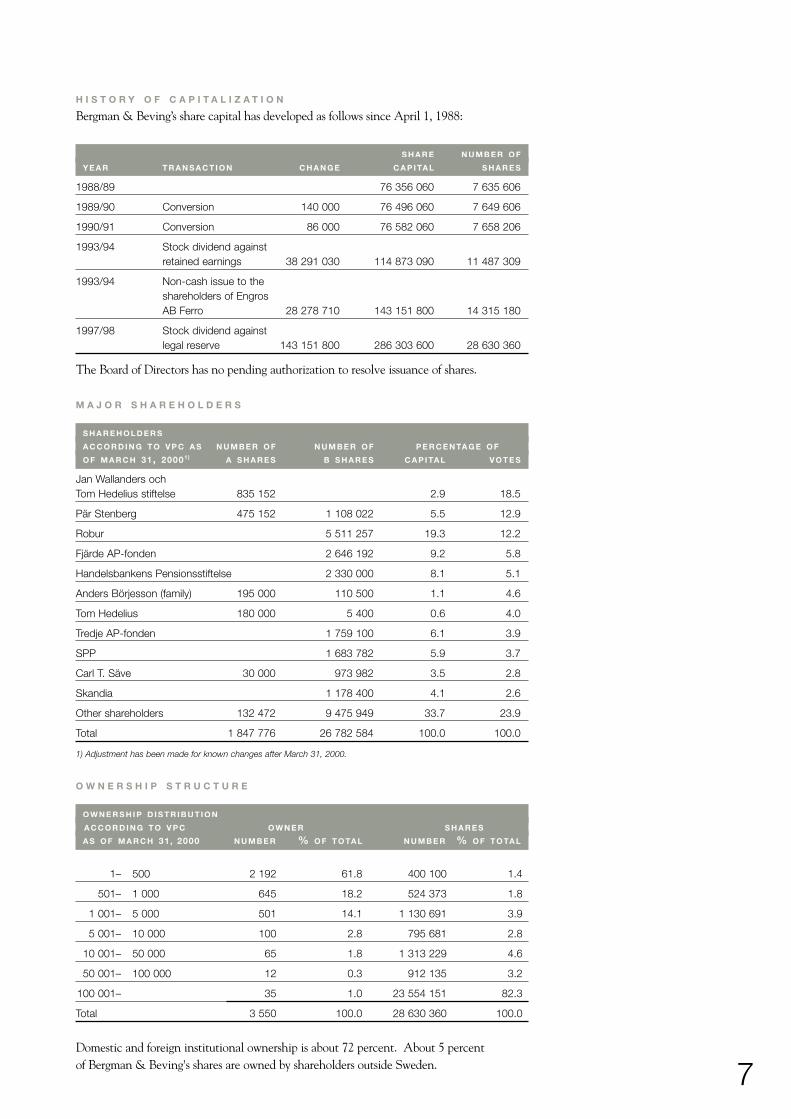
S H A R E C A P I T A L
Bergman & Beving's share capital as of March 31, 2000 was MSEK 286. The number ofshares outstanding is 28 630 360, each with a par value of SEK 10. Class A shares entitletheir holders to ten votes each; class B shares carry one vote each. A conversion restric-tion in the Articles of Association allows for conversion of class A shares to class B shares.
C L A S S N U M B E R P E R C E N T A G E O F P E R C E N T A G E O F
O F S H A R E O F S H A R E S C A P I T A L V O T E S
Class A 1 847 776 6.5 40.8
Class B 26 782 584 93.5 59.2
C O N V E R T I B L E S
A subordinated convertible debenture issue was made to the Company’s personnel dur-ing 1999. Upon full conversion, this is equivalent to 847 644 class B shares, resulting indilution of 2.9 percent of the capital and 1.8 percent of the votes in Bergman & BevingAB. The number of shares outstanding after full conversion will be 29 478 004. For1999/2000, the weighted number of shares after full conversion is 28 771 634.
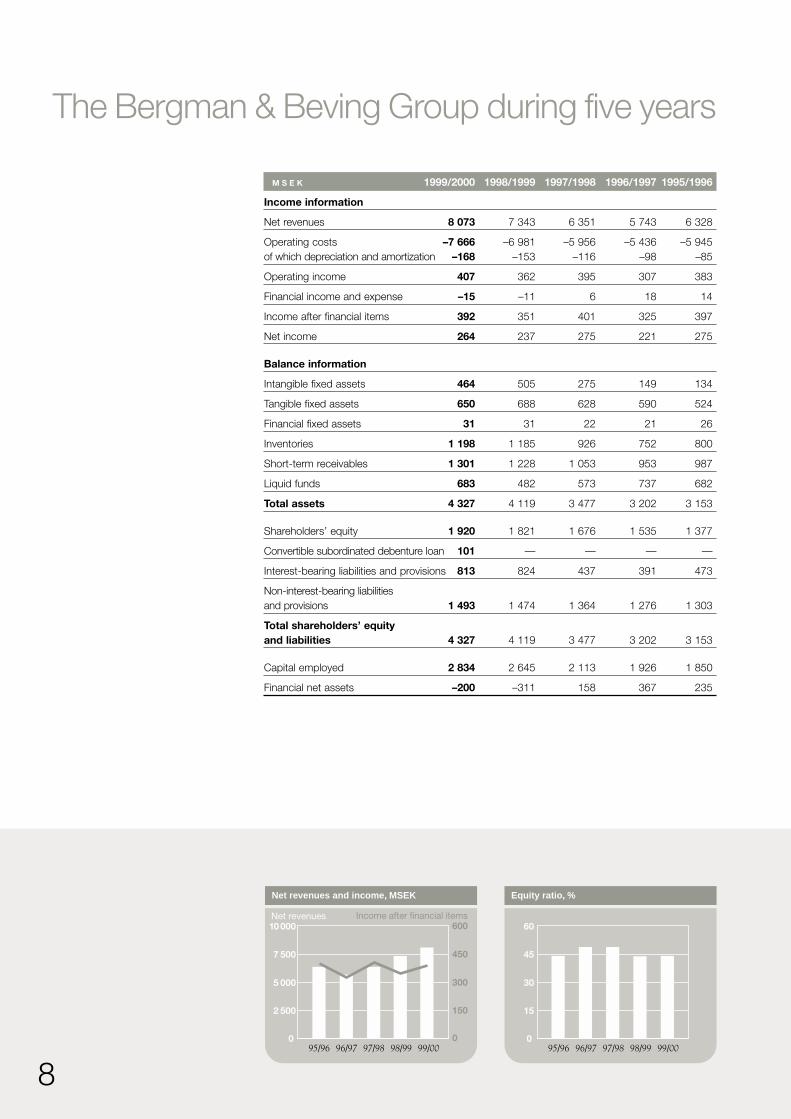
P E R F O R M A N C E O F T H E S H A R E D U R I N G 1 9 9 9 / 2 0 0 0
The market price of the Bergman & Beving share increased by 10 percent during thefinancial year (decrease 36 percent), from SEK 103 to SEK 113. Affärsvärlden's compos-ite index increased by 80 percent (decrease by 1 percent) during the same period. Theyear's highest and lowest paid price was SEK 146 and SEK 94, respectively. Over the pastfive years, the market price of the share has grown by an average of 9 percent per year,while the composite index has increased by 34 percent per year.
As of March 31, 2000, Bergman & Beving's total market capitalization was MSEK 3 235.Approximately 6.8 million Bergman & Beving shares changed hands during the year,equivalent to 24 percent of the total number of listed shares outstanding.
The number of shareholders increased during the year from 3 041 to 3 550.
Shareholders’ equity per share, SEK
0
20
40
60
80
95/96 96/97 97/98 98/99 99/00
Earnings and dividend per share, SEK
0
3
6
9
12Earnings Dividend
95/96 96/97 97/98 98/99 99/001
2
3
4
5
Price development of the Bergman & Beving class B share, SEK
100
150
200
250 300
350
95 96 97 98 99 0070
B share Afv composite index
(c) SIX
7
H I S T O R Y O F C A P I T A L I Z A T I O N
Bergman & Beving’s share capital has developed as follows since April 1, 1988:
S H A R E N U M B E R O F
Y E A R T R A N S A C T I O N C H A N G E C A P I TA L S H A R E S
1988/89 76 356 060 7 635 606
1989/90 Conversion 140 000 76 496 060 7 649 606
1990/91 Conversion 86 000 76 582 060 7 658 206
1993/94 Stock dividend againstretained earnings 38 291 030 114 873 090 11 487 309
1993/94 Non-cash issue to theshareholders of EngrosAB Ferro 28 278 710 143 151 800 14 315 180
1997/98 Stock dividend againstlegal reserve 143 151 800 286 303 600 28 630 360
The Board of Directors has no pending authorization to resolve issuance of shares.
M A J O R S H A R E H O L D E R S
S H A R E H O L D E R S
A C C O R D I N G T O V P C A S N U M B E R O F N U M B E R O F P E R C E N TA G E O F
O F M A R C H 31, 20001) A S H A R E S B S H A R E S C A P I TA L V O T E S
Jan Wallanders ochTom Hedelius stiftelse 835 152 2.9 18.5
Pär Stenberg 475 152 1 108 022 5.5 12.9
Robur 5 511 257 19.3 12.2
Fjärde AP-fonden 2 646 192 9.2 5.8
Handelsbankens Pensionsstiftelse 2 330 000 8.1 5.1
Anders Börjesson (family) 195 000 110 500 1.1 4.6
Tom Hedelius 180 000 5 400 0.6 4.0
Tredje AP-fonden 1 759 100 6.1 3.9
SPP 1 683 782 5.9 3.7
Carl T. Säve 30 000 973 982 3.5 2.8
Skandia 1 178 400 4.1 2.6
Other shareholders 132 472 9 475 949 33.7 23.9
Total 1 847 776 26 782 584 100.0 100.0
1) Adjustment has been made for known changes after March 31, 2000.
O W N E R S H I P S T R U C T U R E
O W N E R S H I P D I S T R I B U T I O N
A C C O R D I N G T O V P C O W N E R S H A R E S
A S O F M A R C H 31, 2000 N U M B E R % O F T O TA L N U M B E R % O F T O TA L
1– 500 2 192 61.8 400 100 1.4
501– 1 000 645 18.2 524 373 1.8
1 001– 5 000 501 14.1 1 130 691 3.9
5 001– 10 000 100 2.8 795 681 2.8
10 001– 50 000 65 1.8 1 313 229 4.6
50 001– 100 000 12 0.3 912 135 3.2
100 001– 35 1.0 23 554 151 82.3
Total 3 550 100.0 28 630 360 100.0
Domestic and foreign institutional ownership is about 72 percent. About 5 percentof Bergman & Beving's shares are owned by shareholders outside Sweden.
8
The Bergman & Beving Group during five years
M S E K 1999/2000 1998/1999 1997/1998 1996/1997 1995/1996
Income information
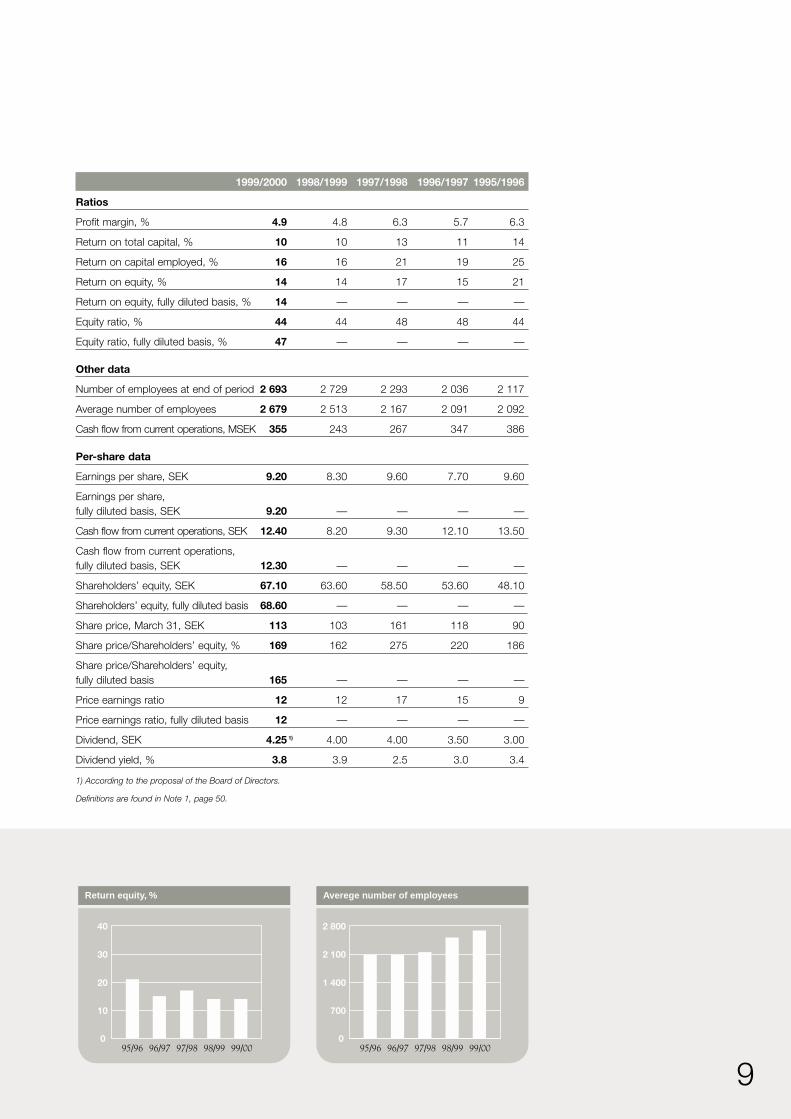
Net revenues 8 073 7 343 6 351 5 743 6 328
Operating costs –7 666 –6 981 –5 956 –5 436 –5 945of which depreciation and amortization –168 –153 –116 –98 –85
Operating income 407 362 395 307 383
Financial income and expense –15 –11 6 18 14
Income after financial items 392 351 401 325 397
Net income 264 237 275 221 275
Balance information
Intangible fixed assets 464 505 275 149 134
Tangible fixed assets 650 688 628 590 524
Financial fixed assets 31 31 22 21 26
Inventories 1 198 1 185 926 752 800
Short-term receivables 1 301 1 228 1 053 953 987
Liquid funds 683 482 573 737 682
Total assets 4 327 4 119 3 477 3 202 3 153
Shareholders’ equity 1 920 1 821 1 676 1 535 1 377
Convertible subordinated debenture loan 101 — — — —
Interest-bearing liabilities and provisions 813 824 437 391 473
Non-interest-bearing liabilities and provisions 1 493 1 474 1 364 1 276 1 303
Total shareholders’ equity and liabilities 4 327 4 119 3 477 3 202 3 153
Capital employed 2 834 2 645 2 113 1 926 1 850
Financial net assets –200 –311 158 367 235
Net revenues and income, MSEK
0
2 500
5 000
7 500
10 000Net revenues Income after financial items
0
150
300
450
600
95/96 96/97 97/98 98/99 99/00
Equity ratio, %
0
15
30
45
60
95/96 96/97 97/98 98/99 99/00
9
1999/2000 1998/1999 1997/1998 1996/1997 1995/1996
Ratios
Profit margin, % 4.9 4.8 6.3 5.7 6.3
Return on total capital, % 10 10 13 11 14
Return on capital employed, % 16 16 21 19 25
Return on equity, % 14 14 17 15 21
Return on equity, fully diluted basis, % 14 — — — —
Equity ratio, % 44 44 48 48 44
Equity ratio, fully diluted basis, % 47 — — — —
Other data
Number of employees at end of period 2 693 2 729 2 293 2 036 2 117
Average number of employees 2 679 2 513 2 167 2 091 2 092
Cash flow from current operations, MSEK 355 243 267 347 386
Per-share data
Earnings per share, SEK 9.20 8.30 9.60 7.70 9.60
Earnings per share, fully diluted basis, SEK 9.20 — — — —
Cash flow from current operations, SEK 12.40 8.20 9.30 12.10 13.50
Cash flow from current operations,fully diluted basis, SEK 12.30 — — — —
Shareholders’ equity, SEK 67.10 63.60 58.50 53.60 48.10
Shareholders’ equity, fully diluted basis 68.60 — — — —
Share price, March 31, SEK 113 103 161 118 90
Share price/Shareholders’ equity, % 169 162 275 220 186
Share price/Shareholders’ equity, fully diluted basis 165 — — — —
Price earnings ratio 12 12 17 15 9
Price earnings ratio, fully diluted basis 12 — — — —
Dividend, SEK 4.25 1) 4.00 4.00 3.50 3.00
Dividend yield, % 3.8 3.9 2.5 3.0 3.4
1) According to the proposal of the Board of Directors.
Definitions are found in Note 1, page 50.
Return equity, %
0
10
20
30
40
98/99 99/0095/96 96/97 97/98
Averege number of employees
0
700
1 400
2 100
2 800
95/96 96/97 97/98 98/99 99/00
10
Presentation of the Bergman & Beving Group
Bergman & Beving’s business concept is Value-adding Tech Provider. Operations werestarted in 1906 with imports of technically advanced products to Sweden. Today, the mainthrust of the business is on business-to-business commerce in technology products.
Important product areas are electronic components, electro-mechanical and mechan-ical components, and niche data products. Production and testing systems for the elec-tronics industry, tools and consumables for manufacturing industries and the constructionsector, and industrial fastening elements, medical-technical products and IT solutions fordigital communication are other product areas.
The Group conducts the bulk of its business in Sweden, Denmark, Finland, Norway,Poland and the Baltic States. With the amplified business concept, which is describedbelow, the business volume outside the Nordic Area will grow.
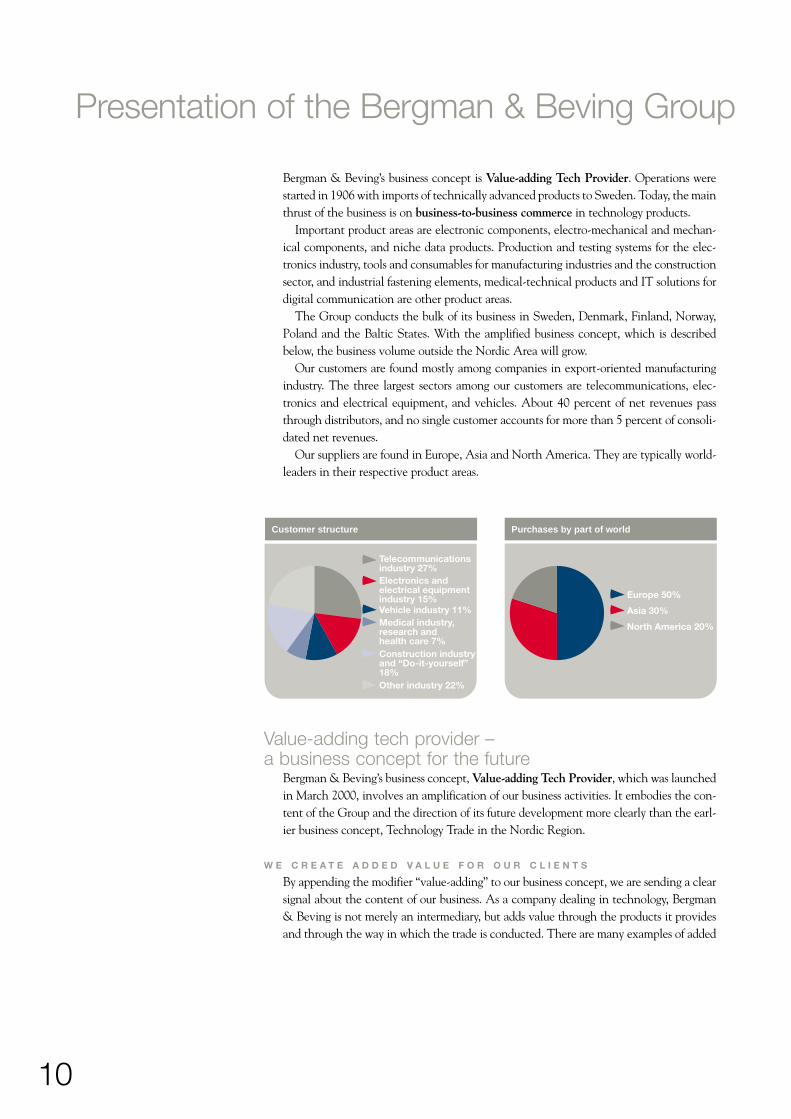
Our customers are found mostly among companies in export-oriented manufacturingindustry. The three largest sectors among our customers are telecommunications, elec-tronics and electrical equipment, and vehicles. About 40 percent of net revenues passthrough distributors, and no single customer accounts for more than 5 percent of consoli-dated net revenues.
Our suppliers are found in Europe, Asia and North America. They are typically world-leaders in their respective product areas.
Europe 50%
Asia 30%
North America 20%
Purchases by part of world
Telecommunicationsindustry 27%Electronics andelectrical equipmentindustry 15%
Medical industry,research andhealth care 7%Construction industryand “Do-it-yourself”18%Other industry 22%
Vehicle industry 11%
Customer structure
Value-adding tech provider – a business concept for the future
Bergman & Beving’s business concept, Value-adding Tech Provider, which was launchedin March 2000, involves an amplification of our business activities. It embodies the con-tent of the Group and the direction of its future development more clearly than the earl-ier business concept, Technology Trade in the Nordic Region.
W E C R E A T E A D D E D V A L U E F O R O U R C L I E N T S
By appending the modifier “value-adding” to our business concept, we are sending a clearsignal about the content of our business. As a company dealing in technology, Bergman& Beving is not merely an intermediary, but adds value through the products it providesand through the way in which the trade is conducted. There are many examples of added
11
value. The products of different suppliers are combined in solutions and concepts, prod-ucts are customized for customers, and deep product competence is provided in specifictechnology areas.
Proprietary products and brand names are also developed within the Group, and addedvalue is made available in the form of services. Other examples are efficient logistics andjust-in-time deliveries. In a number of selected niches, Bergman & Beving has in-houseproduction. This enables the Group to make unique customer offers, obtain improvedmargins and attain a higher rate of growth.
I N T E R N A T I O N A L I Z A T I O N O F O P E R A T I O N S
Historically, Bergman & Beving’s operations have been based in the Nordic Region.Internationalization is now more manifest and several units now have operations outsidethe Nordic Region. Establishment of operations outside the Nordic Region has so far beenmostly in Poland and the Baltic States, but several companies in the Group have conceptsso strong that customers have wanted help in establishing businesses in other parts of theworld.
With new technology, deregulated world trade and a single European currency,distances will shrink even more. This opens opportunities for us to expand with ourexpertise in trading and trading entrepreneurship as a base. Our prominent position inseveral markets in e-commerce opens tremendous opportunities.
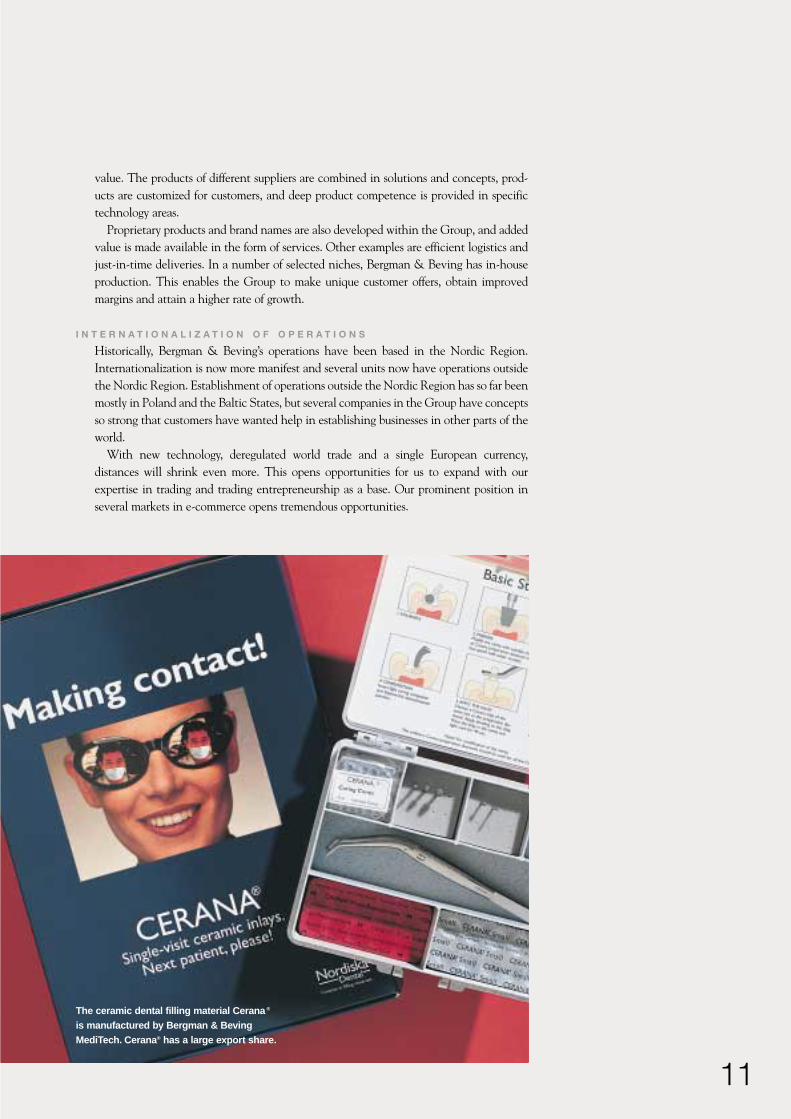
The ceramic dental filling material Cerana ®
is manufactured by Bergman & BevingMediTech. Cerana® has a large export share.
12
B 2 B T E C H – O U R N E W G R O U P - W I D E T R A D E M A R K
B2B Tech was launched as a trade mark for the Group at the same time as the new busi-ness concept. The theory behind B2B Tech is to clearly and effectively describe the coreof our business: business-to-business commerce in technology products. B2B is also a nat-ural way of building on B&B, which is used in everyday speech for Bergman & Beving.Tech stands for engineering, technology and technology products, which has been the orien-tation of the business right from the start in 1906.
B2B Tech AB, the corporation, and b2btech.se, the domain name, were registered dur-ing the year.
Bergman & Beving in the 2000’sHistorically, Bergman & Beving has had a very good development. Since going public in1976, earnings per share have risen by an average of 18 percent per year, which is betterthan our internal goal of 15 percent per year. The return to the shareholders, measured asshare price appreciation and dividends, has exceeded an average of 25 percent annuallyover the same period.
But the Group’s development has been step by step. Earnings growth has been strongduring certain periods, while other periods have borne the stamp of stagnation and recov-ery. What has distinguished each period of growth is that it has begun with a high level ofactivity in the form of broader orientation and concrete, active measures.
In the beginning of the 21st Century, it is time again for active measures to increaseearnings growth. The amplification of our business concept and vision, and the new B2BTech trade mark, are elements hereof, but an action program for increased shareholdervalue has also been initiated. That program can be summarized in three main points:
1 . I N C R E A S E D P R O F I T A B I L I T Y
Bergman & Beving has always had a focus on profit as its hallmark. Priority 1 of the actionprogram is therefore to increase profitability by even sharper focus on net margin andworking capital tied up. Important concrete measures include the completion of integra-tion processes now under way in acquired units. Clearer benchmarking and ranking of theGroup’s 100 companies is also in progress. Active measures in low-performing units, thosewith net margins below 3 percent, are given priority.
13
2 . D E V E L O P I N G T H E B U S I N E S S C O N C E P T S
Taking advantage of opportunities offered by the amplified business concept, e-commerceand the new economy also means that the business concepts of individual profit centershave to be developed. A very important part hereof is to build new market positions withnew technology and e-commerce. Increased value is added through customer-adaptedsolutions, concepts, services, own products and brand names, as well as lighter production.To this comes the geographical expansion.
Acquisitions will also in the future be of importance to the Group’s growth and devel-opment of business concepts. Since the end of the 1960’s, we have acquired more than160 companies. More than 85 percent of these acquisitions have proven to be successfulin the sense that they have contributed to increased earnings per share.
3 . S T R U C T U R A L M E A S U R E S
Our ambition is to develop the Group’s structure through various measures. The decisionto make Lagercrantz Group a separate business area is taken to make businesses that thestock market value in a special way more visible. The possibilities are also explored of con-centrating the business to core operations by selling a number of centrally located prop-erties, especially in the Stockholm Region. Such a sale would free up about MSEK 275,with a capital gain of MSEK 175 before taxes. To improve the Group’s capital structure,return on equity and earnings per share, the Board of Directors has decided to propose tothe Annual General Meeting a plan to repurchase own shares.
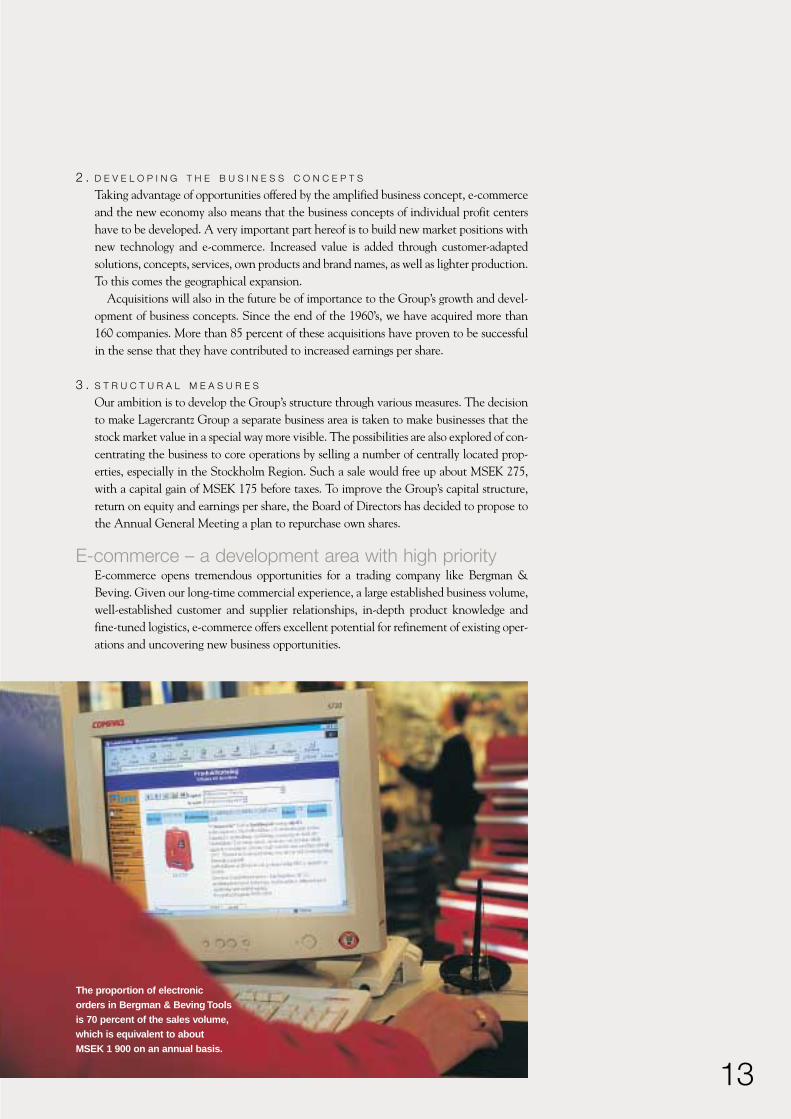
E-commerce – a development area with high priorityE-commerce opens tremendous opportunities for a trading company like Bergman &Beving. Given our long-time commercial experience, a large established business volume,well-established customer and supplier relationships, in-depth product knowledge andfine-tuned logistics, e-commerce offers excellent potential for refinement of existing oper-ations and uncovering new business opportunities.
The proportion of electronicorders in Bergman & Beving Toolsis 70 percent of the sales volume,which is equivalent to aboutMSEK 1 900 on an annual basis.
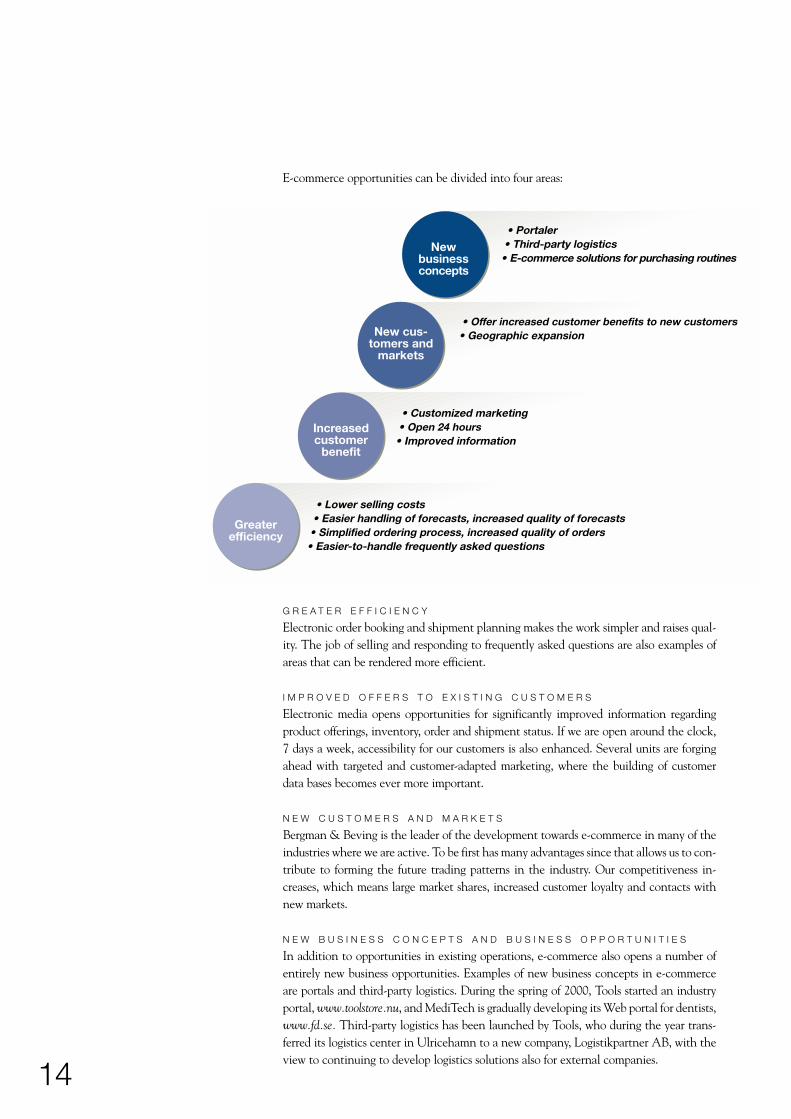
E-commerce opportunities can be divided into four areas:
G R E A T E R E F F I C I E N C Y
Electronic order booking and shipment planning makes the work simpler and raises qual-ity. The job of selling and responding to frequently asked questions are also examples ofareas that can be rendered more efficient.
I M P R O V E D O F F E R S T O E X I S T I N G C U S T O M E R S
Electronic media opens opportunities for significantly improved information regardingproduct offerings, inventory, order and shipment status. If we are open around the clock,7 days a week, accessibility for our customers is also enhanced. Several units are forgingahead with targeted and customer-adapted marketing, where the building of customerdata bases becomes ever more important.
N E W C U S T O M E R S A N D M A R K E T S
Bergman & Beving is the leader of the development towards e-commerce in many of theindustries where we are active. To be first has many advantages since that allows us to con-tribute to forming the future trading patterns in the industry. Our competitiveness in-creases, which means large market shares, increased customer loyalty and contacts withnew markets.
N E W B U S I N E S S C O N C E P T S A N D B U S I N E S S O P P O R T U N I T I E S
In addition to opportunities in existing operations, e-commerce also opens a number ofentirely new business opportunities. Examples of new business concepts in e-commerceare portals and third-party logistics. During the spring of 2000, Tools started an industryportal, www.toolstore.nu, and MediTech is gradually developing its Web portal for dentists,www.fd.se. Third-party logistics has been launched by Tools, who during the year trans-ferred its logistics center in Ulricehamn to a new company, Logistikpartner AB, with theview to continuing to develop logistics solutions also for external companies.
14
Newbusinessconcepts
• Portaler• Third-party logistics• E-commerce solutions for purchasing routines
New cus-tomers and
markets
• Offer increased customer benefits to new customers• Geographic expansion
• Customized marketing• Open 24 hours• Improved information
Increasedcustomer
benefit
• Lower selling costs• Easier handling of forecasts, increased quality of forecasts• Simplified ordering process, increased quality of orders• Easier-to-handle frequently asked questions
Greaterefficiency
15
E - C O M M E R C E I N I T I A T I V E S I N O U R B U S I N E S S A R E A S
All business areas are actively engaged in several e-commerce initiatives involving thebuilding of IT solutions, organizational changes and the introduction of new procedures.About 25 percent of all orders are currently placed electronically with the Group’s com-panies, and that figure is growing gradually. Examples of these initiatives are describedunder each respective business area, pages 20–37:
Idea & SoulIdea & Soul in Bergman & Beving are the building blocks that form the foundation forour entire organization. The idea is our vision, our signpost, Leading Value-adding TechProvider. The soul is our corporate philosophy, what binds us together, our very core.Bergman & Beving’s corporate philosophy embodies all experience on our attitudes toeach other. Our corporate philosophy can be summarized in five key words:
S I M P L I C I T Y • E F F I C I E N C Y • W I L L I N G N E S S T O C H A N G E
A C C O U N T A B I L I T Y • F R E E D O M
Simplicity is an all-embracing concept. We always try to work in a simple way, with as little paper, and as few reports and meetings as possible. Our work is concentrated to ourcustomers, with customer benefit as the guiding-star.
Efficiency is to do the right things and to do things right. What are we putting our timeinto? Spending time on finding those activities that give the most is an important prior-ity for us to be successful.
Bergman & Beving’s business is conducted in 100 companies. We work according tothe concept “small-scale operations on a large scale”. This allows us to modify the organ-ization to accommodate the requirements of a forever changing world around us.
The Bergman & Beving Group is built around accountability and freedom, the twofinal words of our corporate philosophy. Accountability and freedom go together. Withoutone, the other is impossible. Accountability and freedom will only work in a decentralizedorganization. Bergman & Beving’s organization is decentralized and decisions are made asclose to the customer as possible.
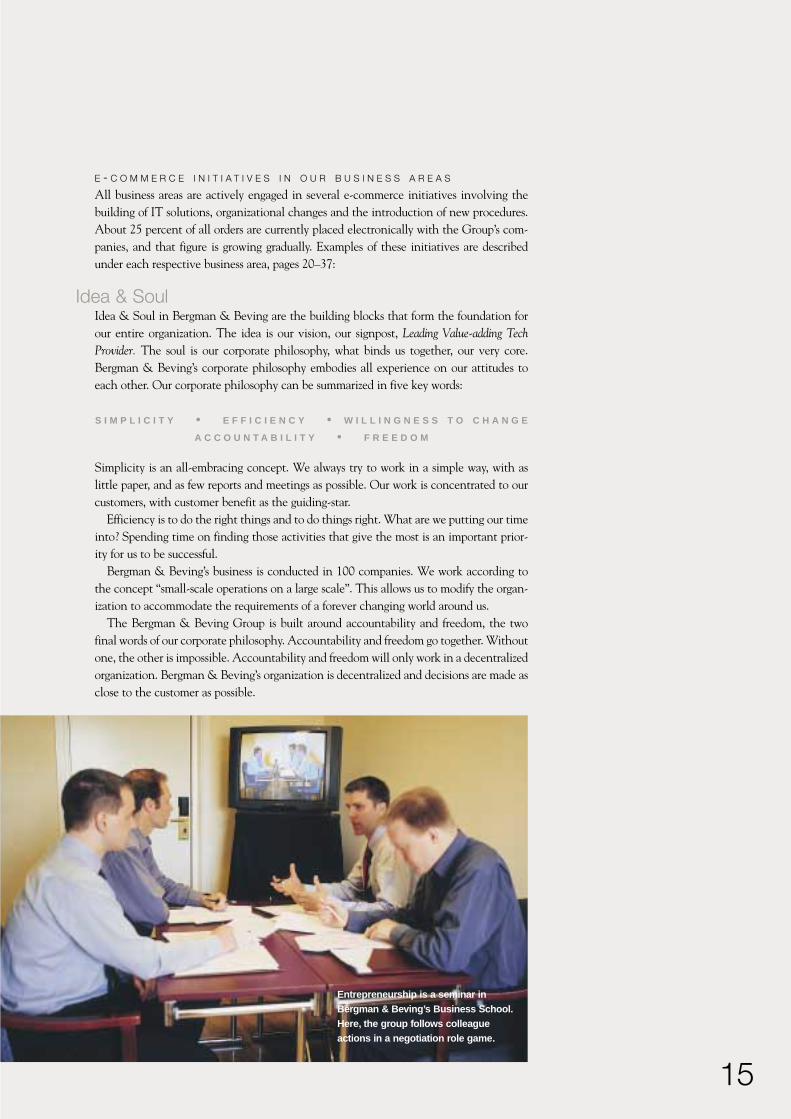
Entrepreneurship is a seminar inBergman & Beving’s Business School.Here, the group follows colleagueactions in a negotiation role game.
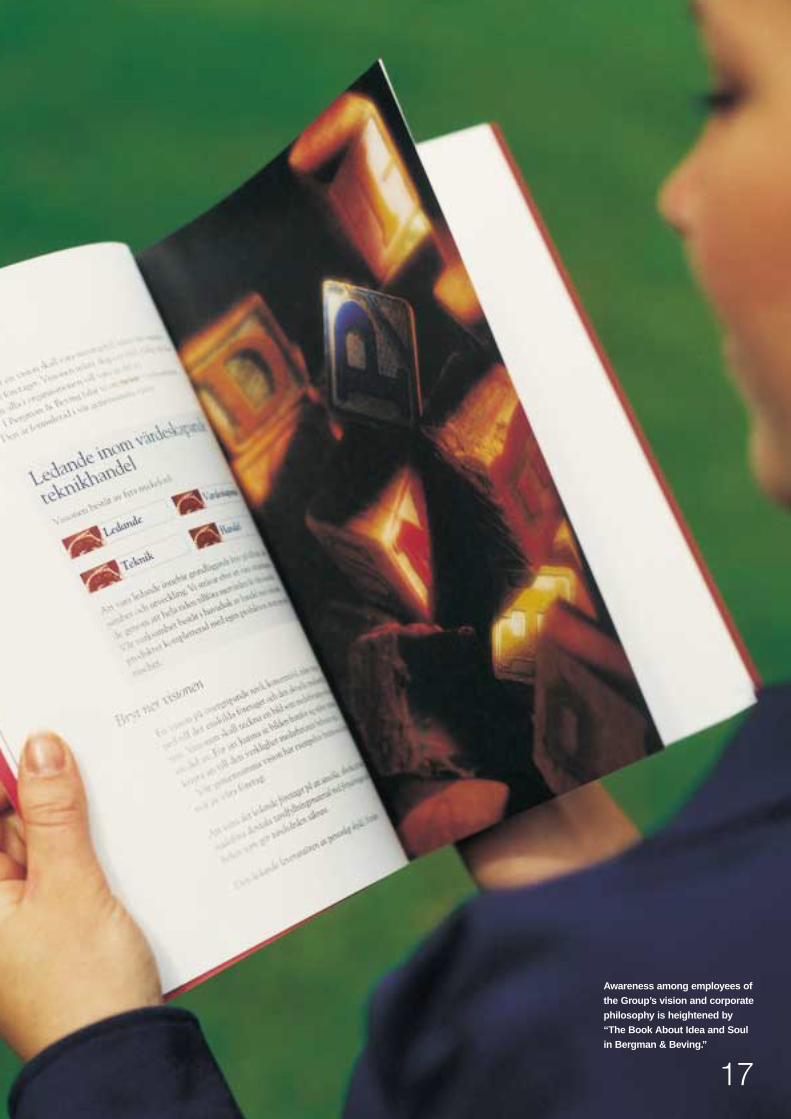
Beginning in 1995, a large number of seminars have been held in the Group aboutBergman & Beving’s vision and corporate philosophy. In a bid to further deepen andbroaden skills among our employees, a book has been produced: “The Book About Idea andSoul in Bergman & Beving.” This book contains many tools that may be used by theemployees in their day-to-day jobs and it should be seen as a practical manual, with thepower to lead to concrete action.
The book will be used as a basis for the continued training and education efforts in theBergman & Beving Group. Seminars will be started during the second half of 2000.
16
RecruitmentTraining
& Education
Developmentopportunities
for theindividual
IncentivesStrong leaders
andgood business-
men
Bergman & Beving’s valuessurrounding leadership
Coaching
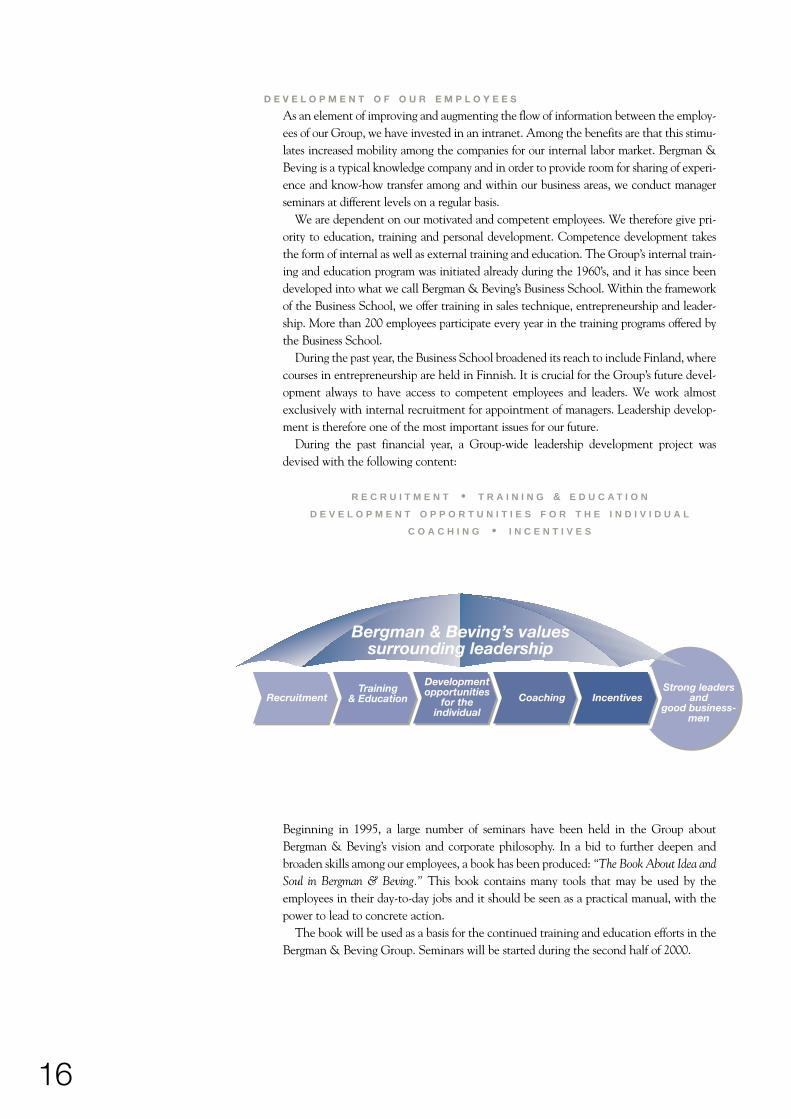
D E V E L O P M E N T O F O U R E M P L O Y E E S
As an element of improving and augmenting the flow of information between the employ-ees of our Group, we have invested in an intranet. Among the benefits are that this stimu-lates increased mobility among the companies for our internal labor market. Bergman &Beving is a typical knowledge company and in order to provide room for sharing of experi-ence and know-how transfer among and within our business areas, we conduct managerseminars at different levels on a regular basis.
We are dependent on our motivated and competent employees. We therefore give pri-ority to education, training and personal development. Competence development takesthe form of internal as well as external training and education. The Group’s internal train-ing and education program was initiated already during the 1960’s, and it has since beendeveloped into what we call Bergman & Beving’s Business School. Within the frameworkof the Business School, we offer training in sales technique, entrepreneurship and leader-ship. More than 200 employees participate every year in the training programs offered bythe Business School.
During the past year, the Business School broadened its reach to include Finland, wherecourses in entrepreneurship are held in Finnish. It is crucial for the Group’s future devel-opment always to have access to competent employees and leaders. We work almostexclusively with internal recruitment for appointment of managers. Leadership develop-ment is therefore one of the most important issues for our future.
During the past financial year, a Group-wide leadership development project wasdevised with the following content:
R E C R U I T M E N T • T R A I N I N G & E D U C A T I O N
D E V E L O P M E N T O P P O R T U N I T I E S F O R T H E I N D I V I D U A L
C O A C H I N G • I N C E N T I V E S
17
Awareness among employees ofthe Group’s vision and corporatephilosophy is heightened by“The Book About Idea and Soulin Bergman & Beving.”
18
Environment and qualityE N V I R O N M E N T
Environmental issues are becoming increasingly important for customers, suppliers,employees and financial players. In the Bergman & Beving Group, environmental issuesare an integral part of the business, aimed at achieving a sustainable development, whichmeans that our natural resources are not used in such a way as to jeopardize the living con-ditions of future generations. Our part in accomplishing this takes the form of continuousendeavors to reduce the environmental impact of our business. Due to the growing envir-onmental requirements of customers, environmental work has become an increasinglyimportant competitive factor.
E N V I R O N M E N T A L W O R K
Responsibility for the environmental work is decentralized in the Bergman & BevingGroup. Each profit center is responsible for organizing and conducting the environmen-tal work in an efficient manner based on the specific operating premises for each company.The basis for Bergman & Beving’s environmental work is established in a all-embracingGroup policy, which is the foundation for the different companies in the Group.
For the purpose of coordinating environmental matters at Group level, an environ-mental council has been formed to work with policy issues, competence development andsharing experience. The environmental council also passes on information on environ-mental issues to the Group’s companies. A survey was made during the year to determine
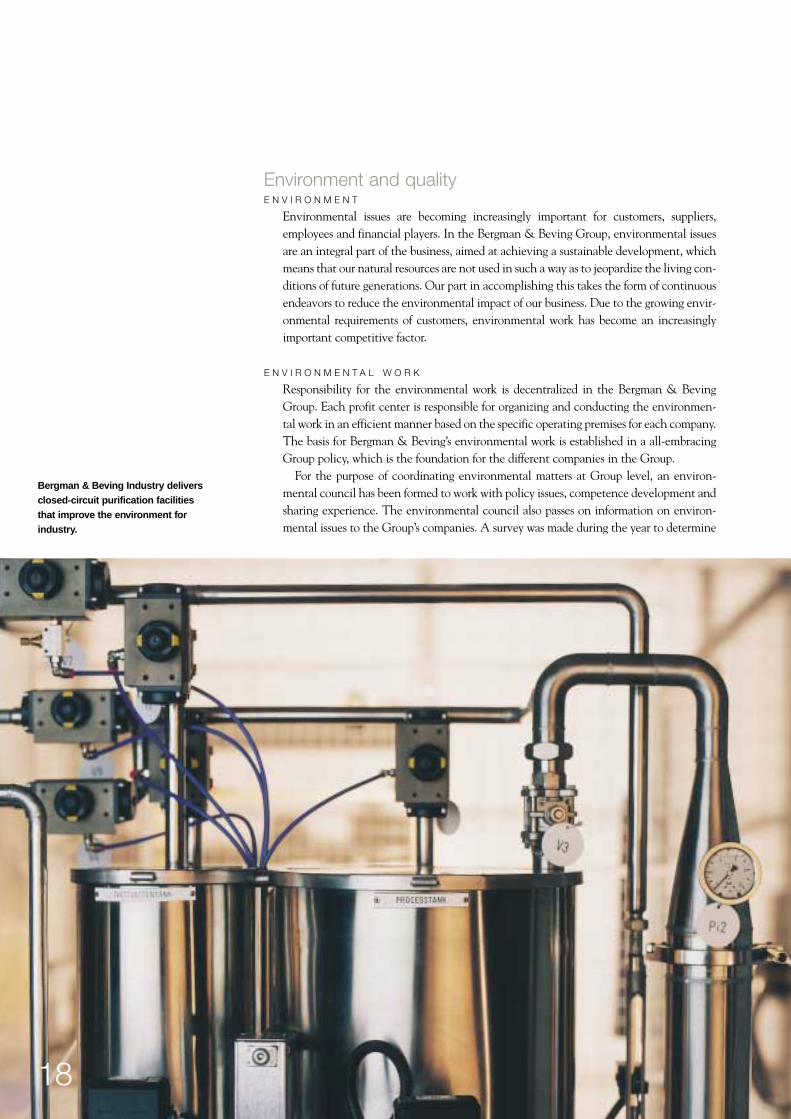
Bergman & Beving Industry deliversclosed-circuit purification facilitiesthat improve the environment forindustry.
19
the environmental status of each of the Group’s companies. Environmental managementsystems according to ISO 14001 are being introduced, or are planned to be introducedwithin three years, in more than half of the Group’s Swedish companies. Bevinggruppenis an example of an environmentally certified division. Training of the personnel is animportant element of the environmental work. In some of the companies, all employeeshave undergone training in the environmental area.
E N V I R O N M E N T A L I M P A C T
Most of Bergman & Beving’s operations consist of dealing in and distribution of products,and the remainder consists of light manufacturing. The Group’s environmental impact ismainly attributable to transportation and packaging material, and in the form of inputgoods for producing companies.
An important part of environmental work in commerce and distribution is cooperationwith manufacturers aimed at decreasing the environmental impact during the entire pro-duction process. Choosing environmentally friendly packaging solutions, and distributingthe products in a resource-efficient manner is also of great importance.
Most of the companies in the Group under obligation to report on their activities aremanufacturing units, which also include activities requiring a permit to operate. None ofthe Group’s companies are involved in any litigation or disputes relating to environmen-tal issues.
E N V I R O N M E N T A L P O L I C Y
The environmental policy of the Bergman & Beving Group expresses a willingnessto assume our share of the responsibility to improve the environment and contributeto a durably sustainable development. Thinking in terms of recycling and conserva-tion of natural resources shall be an important part of the Group’s business activity.The environmental work shall be conducted within the framework of our businessconcept and shall be well integrated in day-to-day operations. Through a high levelof competence on the part of our employees, and by continuously developing ourknowledge about the environmental impact of what we do, we are in a position totake an overall view of environmental issues. Environmental measures will be imple-mented to the greatest extent technically possible, economically reasonable andenvironmentally justified. The responsibility for day-to-day environmental work lieswith each individual company in the Group.
Q U A L I T Y
Quality issues have always been an important part of the way Bergman & Beving doesbusiness, and are important as competitive tools for several of our companies. Customerdemands on us as suppliers are constantly mounting. We are expected to offer products,knowledge and service to satisfy customer quality requirements in every area.
In order to meet these increased customer demands, we have made great efforts to intro-duce quality management systems according to ISO 9000 in a large number of the Group’scompanies. Our quality work is an ongoing process and is conducted in our own organi-zation, as well as together with our customers and suppliers. All members of our staff par-ticipate in this effort to improve quality at all levels of our organization.
Electronics
20
B E R G M A N & B E V I N G
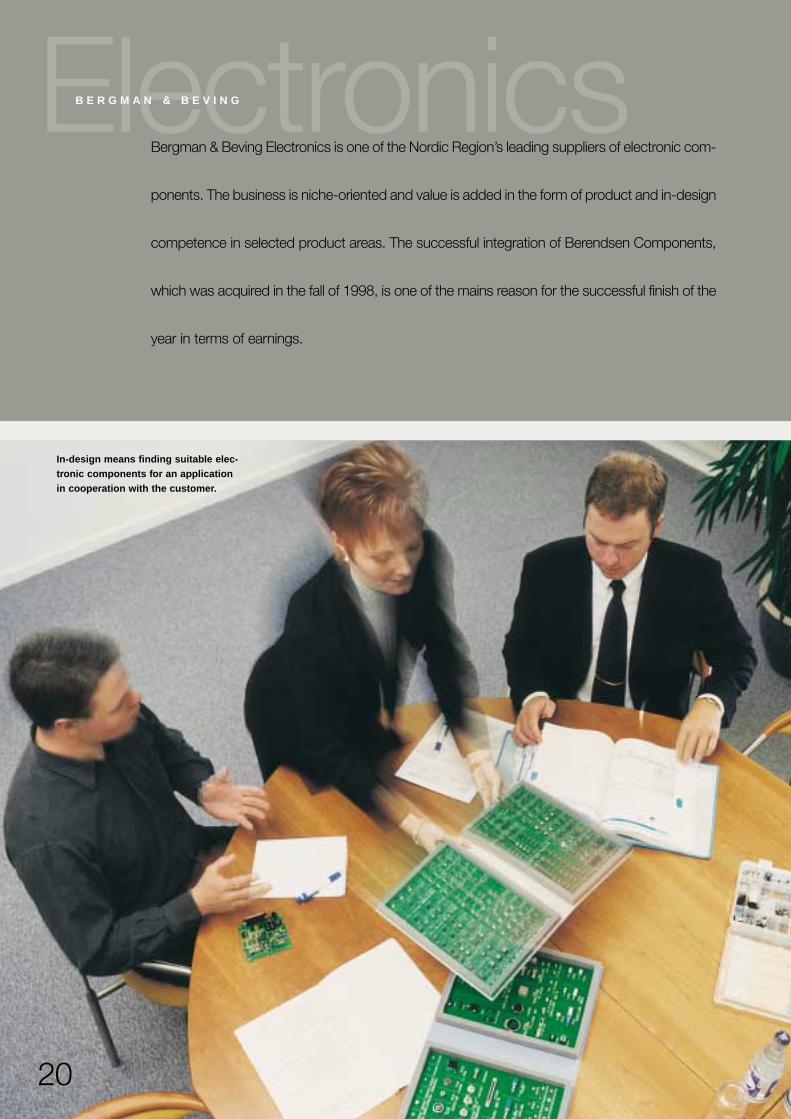
Bergman & Beving Electronics is one of the Nordic Region’s leading suppliers of electronic com-
ponents. The business is niche-oriented and value is added in the form of product and in-design
competence in selected product areas. The successful integration of Berendsen Components,
which was acquired in the fall of 1998, is one of the mains reason for the successful finish of the
year in terms of earnings.
In-design means finding suitable elec-tronic components for an applicationin cooperation with the customer.
21
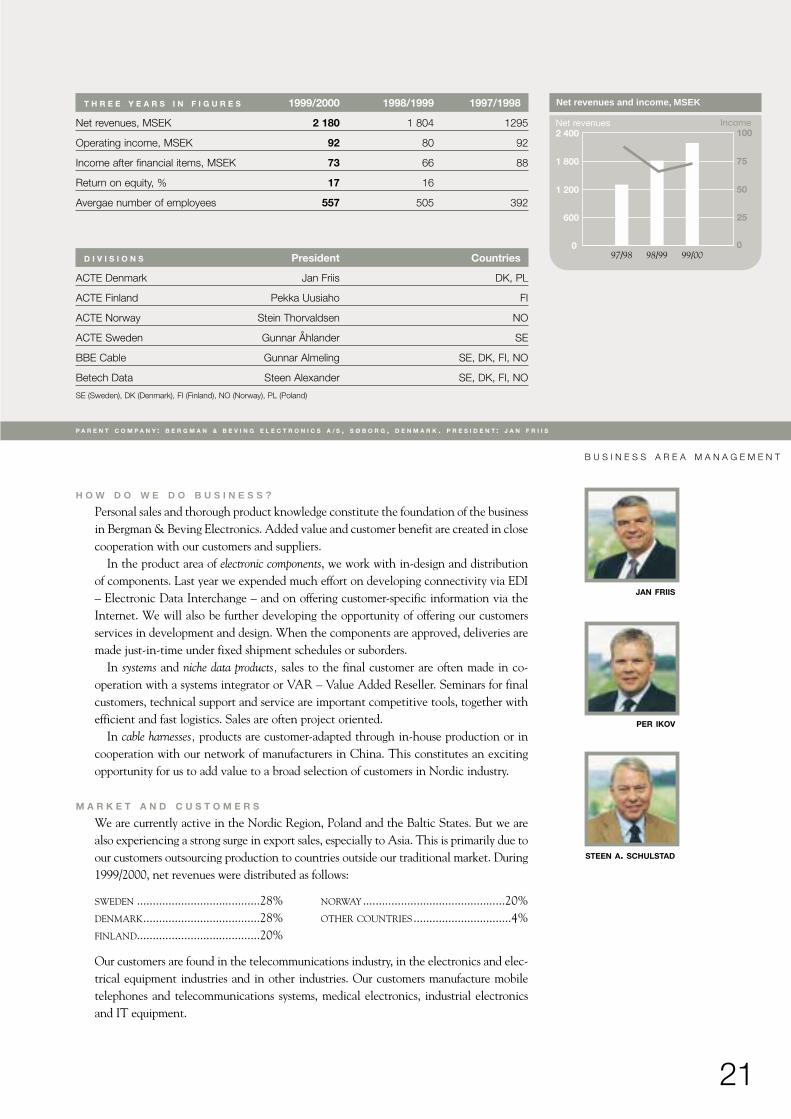
T H R E E Y E A R S I N F I G U R E S 1999/2000 1998/1999 1997/1998
Net revenues, MSEK 2 180 1 804 1295
Operating income, MSEK 92 80 92
Income after financial items, MSEK 73 66 88
Return on equity, % 17 16
Avergae number of employees 557 505 392
D I V I S I O N S President Countries
ACTE Denmark Jan Friis DK, PL
ACTE Finland Pekka Uusiaho FI
ACTE Norway Stein Thorvaldsen NO
ACTE Sweden Gunnar Åhlander SE
BBE Cable Gunnar Almeling SE, DK, FI, NO
Betech Data Steen Alexander SE, DK, FI, NO
SE (Sweden), DK (Denmark), FI (Finland), NO (Norway), PL (Poland)
Net revenues and income, MSEK
0
600
1 200
1 800
2 400Net revenues Income
0
25
50
75
100
97/98 98/99 99/00
P A R E N T C O M P A N Y : B E R G M A N & B E V I N G E L E C T R O N I C S A / S , S Ø B O R G , D E N M A R K . P R E S I D E N T : J A N F R I I S
JAN FRIIS
PER IKOV
STEEN A. SCHULSTAD
H O W D O W E D O B U S I N E S S ?
Personal sales and thorough product knowledge constitute the foundation of the businessin Bergman & Beving Electronics. Added value and customer benefit are created in closecooperation with our customers and suppliers.
In the product area of electronic components, we work with in-design and distributionof components. Last year we expended much effort on developing connectivity via EDI– Electronic Data Interchange – and on offering customer-specific information via theInternet. We will also be further developing the opportunity of offering our customersservices in development and design. When the components are approved, deliveries aremade just-in-time under fixed shipment schedules or suborders.
In systems and niche data products, sales to the final customer are often made in co-operation with a systems integrator or VAR – Value Added Reseller. Seminars for finalcustomers, technical support and service are important competitive tools, together withefficient and fast logistics. Sales are often project oriented.
In cable harnesses, products are customer-adapted through in-house production or incooperation with our network of manufacturers in China. This constitutes an excitingopportunity for us to add value to a broad selection of customers in Nordic industry.
M A R K E T A N D C U S T O M E R S
We are currently active in the Nordic Region, Poland and the Baltic States. But we arealso experiencing a strong surge in export sales, especially to Asia. This is primarily due toour customers outsourcing production to countries outside our traditional market. During1999/2000, net revenues were distributed as follows:
SWEDEN .......................................28% NORWAY .............................................20%DENMARK.....................................28% OTHER COUNTRIES...............................4%FINLAND.......................................20%
Our customers are found in the telecommunications industry, in the electronics and elec-trical equipment industries and in other industries. Our customers manufacture mobiletelephones and telecommunications systems, medical electronics, industrial electronicsand IT equipment.
B U S I N E S S A R E A M A N A G E M E N T
22
P R O D U C T S A N D S U P P L I E R S
Our component program consists of a broad array of active, passive and electro-mechan-ical components and displays. In several cases, the products are customized. Our systemsproducts consist mainly of special printers and displays, keyboards and barcode equipment.The data products are of a niche character in data communication and graphics. A broadarray of cable harnesses are manufactured at company-owned facilities.
Our suppliers are located in North America, Asia and Europe. They are in generalworld leaders in their respective specialized areas. Cooperation with suppliers is of a long-term nature and has usually continued for decades. We contribute added value throughcustomization, application support, technical support and service.
C O M P E T I T O R S
Our competitors in the component area consist of international distributors with sub-sidiaries in the Nordic Region, such as Arrow, Avnet and Memec, as well as larger andsmaller local distributors.
Competition in the systems area comes primarily from major manufacturers with theirown sales companies in the Nordic Region. Competition in the data area is primarilyfound among international trading companies with their own local sales companies, andlocal distributors representing foreign manufacturers.
A C Q U I S I T I O N S A N D D I V E S T I T U R E S
During the fall of 1999, Iwanejko Electronics in Poland was acquired as a part of theexpansion of our component market. Net annual revenues are about MSEK 25.
In a bid to sharpen the focus in the data area, the broad distribution business in Viborg,Denmark, Unit Data Distribution, with annual sales of MSEK 115, was sold as of February 1, 2000.
T H R E A T S A N D O P P O R T U N I T I E S
The greatest threat to our business is that Nordic manufacturing industry continues tomove its production to locations outside the Nordic Region. The presence of additionalinternational competitors in the Nordic region increases pricing pressures in the market.The global consolidation among manufacturers of niche products, where dominating U.S.companies buy up smaller niche-oriented manufacturers, can affect our supplier pipeline.
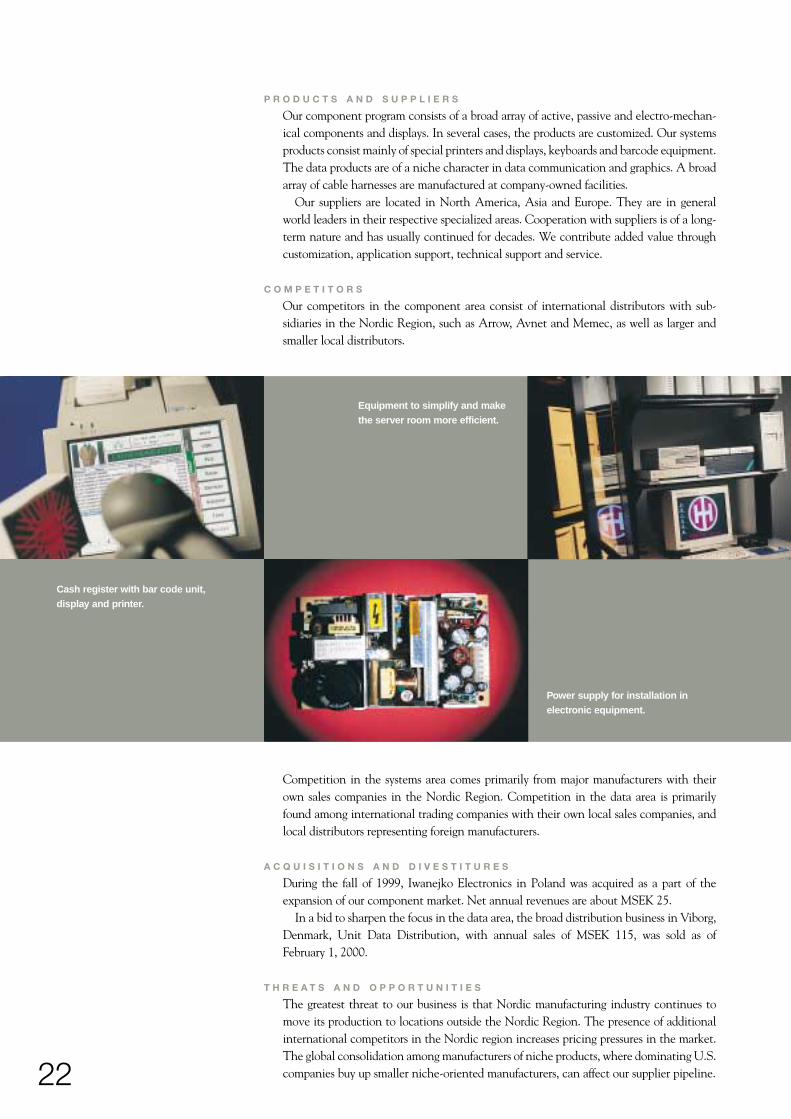
Equipment to simplify and makethe server room more efficient.
Cash register with bar code unit,display and printer.
Power supply for installation inelectronic equipment.
23
Our strong and well established market position, and a strong network of internationalmanufacturers of world-leading products, give us new business opportunities as new cus-tomer needs arise. Our deep core competence in business-to-business commerce, com-bined with an even sharper focus on added value and customer benefit, give us a solid basefor broadening our business in selected niches. The rapid evolution of our e-commercecreates new opportunities.
O R G A N I Z A T I O N
Bergman & Beving Electronics consists of three divisions – component and systems oper-ations in ACTE, niche data products in Betech Data and cable harness operations in BBECable.
Conversion into independent subsidiary companies of the systems activities withinACTE in Sweden and Denmark, and the same with respect to certain activities in BetechData, will be effected during 2000/2001. With these actions, further opportunities forgrowth and dynamism are created.
1 9 9 9 / 2 0 0 0
Net revenues increased by 21 percent to MSEK 2 180 (1 804). Most of the increase isrelated to acquisitions. Income after financial items increased by 11 percent to MSEK 73(66). This result is indicative of very robust performance during the latter part of the year.
Market demand for components and cable, which account for a major portion of thebusiness area’s volume, is currently very good. Net sales of components increased by 50percent during the fourth quarter of the financial year.
For data products, which account for the remainder of the business area’s volume, anegative result for the first two quarters was turned into a positive result during the thirdand fourth quarters. The strategy for the future is to focus even more sharply on provid-ing customers with products and solutions with added value in selected niches.
The expansion in e-commerce continues. EDI solutions to integrate forecasting, orderbookings and invoicing are important initiatives in the contacts with existing major cus-tomers. The proportion of orders received via EDI in component operations increasedfrom 5 percent to 20 percent during the year. See also the Administration Report, pages38–41.
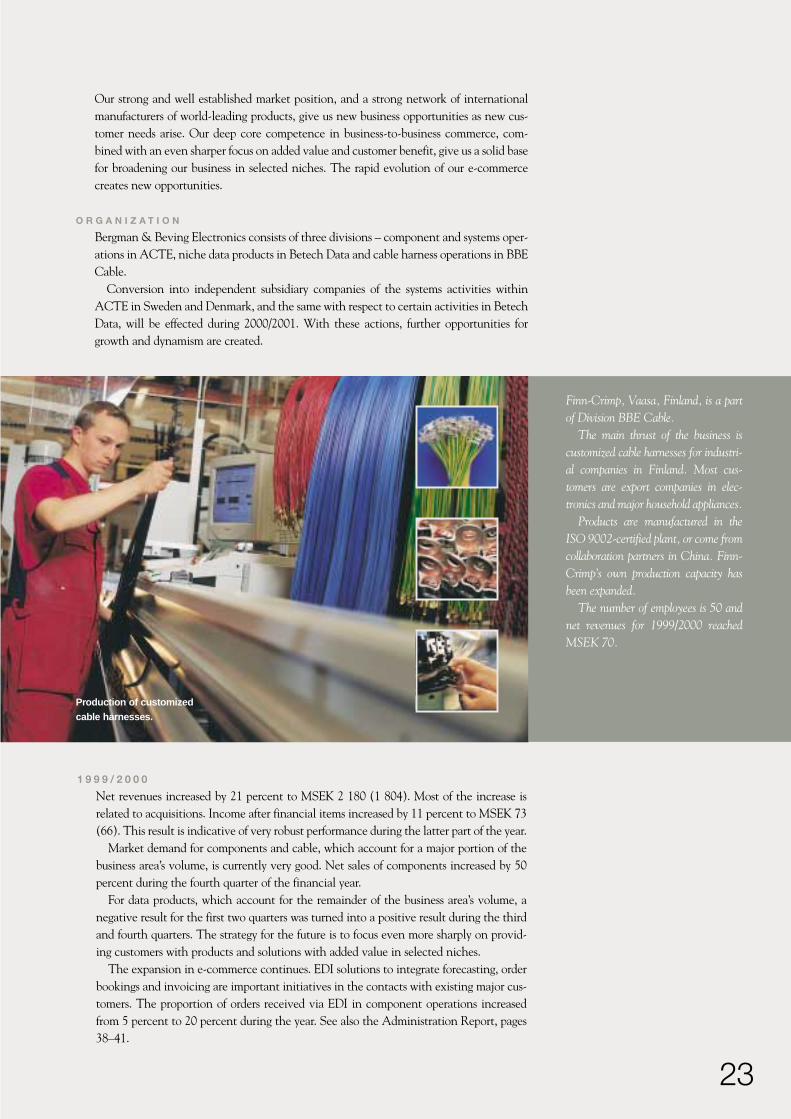
Finn-Crimp, Vaasa, Finland, is a partof Division BBE Cable.
The main thrust of the business iscustomized cable harnesses for industri-al companies in Finland. Most cus-tomers are export companies in elec-tronics and major household appliances.
Products are manufactured in theISO 9002-certified plant, or come fromcollaboration partners in China. Finn-Crimp’s own production capacity hasbeen expanded.
The number of employees is 50 andnet revenues for 1999/2000 reachedMSEK 70.
Production of customizedcable harnesses.
Industry
24
B E R G M A N & B E V I N G
The business in Bergman & Beving Industry is decidedly niche-oriented with leading positions
in several product areas. The creation of added value is extensive. Products are to a large extent
customized and services are added. In recent years, Bergman & Beving Industry has posted
good earnings performance and the result for 1999/2000 was the highest to date.
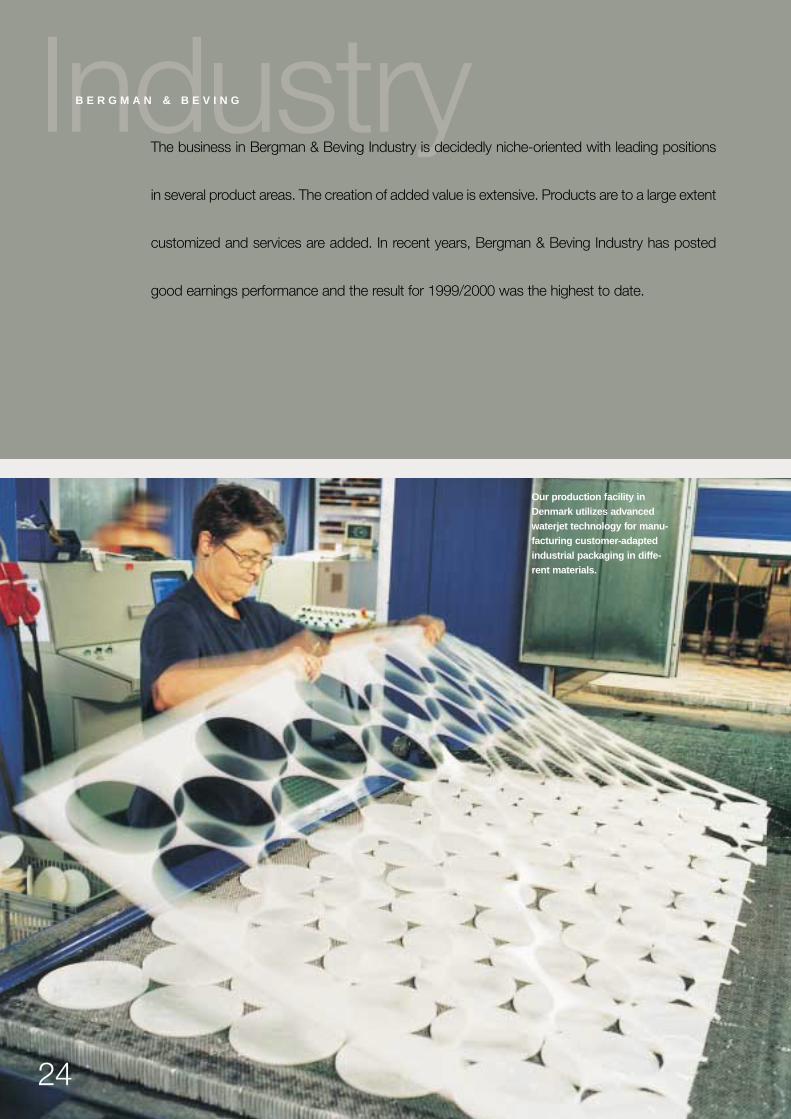
Our production facility inDenmark utilizes advancedwaterjet technology for manu-facturing customer-adaptedindustrial packaging in diffe-rent materials.
25
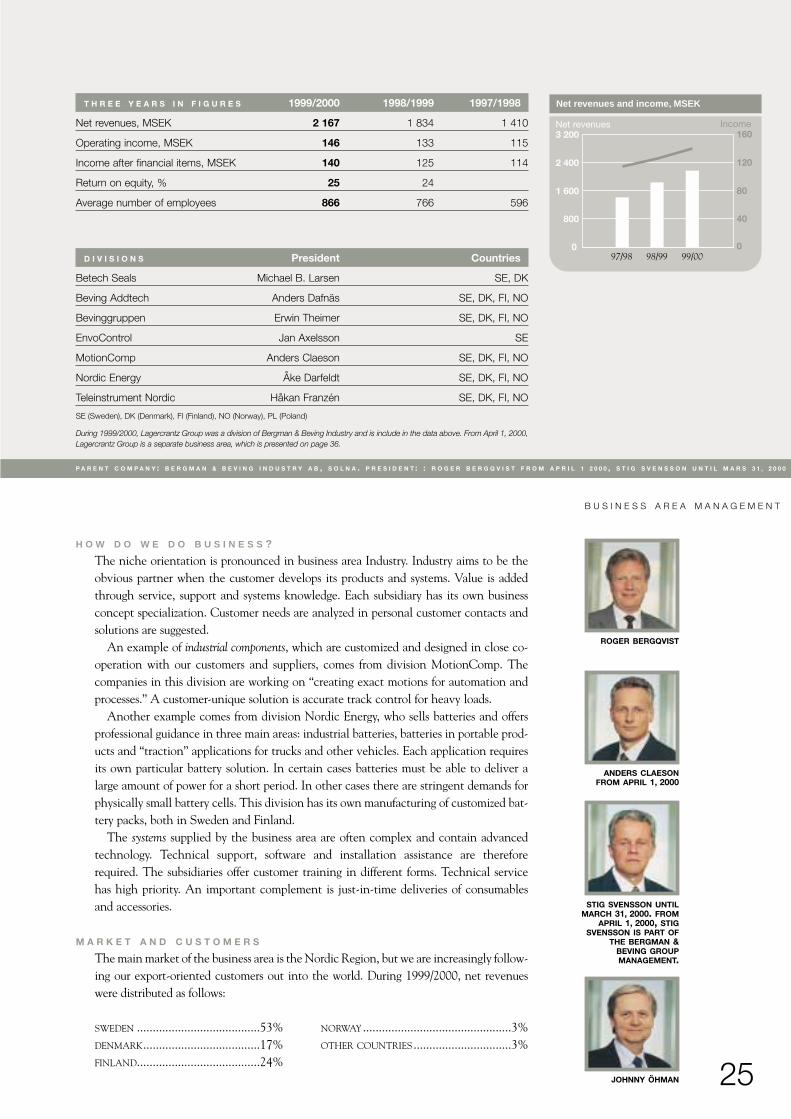
T H R E E Y E A R S I N F I G U R E S 1999/2000 1998/1999 1997/1998
Net revenues, MSEK 2 167 1 834 1 410
Operating income, MSEK 146 133 115
Income after financial items, MSEK 140 125 114
Return on equity, % 25 24
Average number of employees 866 766 596
D I V I S I O N S President Countries
Betech Seals Michael B. Larsen SE, DK
Beving Addtech Anders Dafnäs SE, DK, FI, NO
Bevinggruppen Erwin Theimer SE, DK, FI, NO
EnvoControl Jan Axelsson SE
MotionComp Anders Claeson SE, DK, FI, NO
Nordic Energy Åke Darfeldt SE, DK, FI, NO
Teleinstrument Nordic Håkan Franzén SE, DK, FI, NO
SE (Sweden), DK (Denmark), FI (Finland), NO (Norway), PL (Poland)
During 1999/2000, Lagercrantz Group was a division of Bergman & Beving Industry and is include in the data above. From April 1, 2000,Lagercrantz Group is a separate business area, which is presented on page 36.
Net revenues and income, MSEK
0
800
1 600
2 400
3 200Net revenues Income
0
40
80
120
160
97/98 98/99 99/00
B U S I N E S S A R E A M A N A G E M E N T
P A R E N T C O M P A N Y : B E R G M A N & B E V I N G I N D U S T R Y A B , S O L N A . P R E S I D E N T : : R O G E R B E R G Q V I S T F R O M A P R I L 1 2 0 0 0 , S T I G S V E N S S O N U N T I L M A R S 3 1 , 2 0 0 0
ROGER BERGQVIST
ANDERS CLAESONFROM APRIL 1, 2000
JOHNNY ÖHMAN
H O W D O W E D O B U S I N E S S ?
The niche orientation is pronounced in business area Industry. Industry aims to be theobvious partner when the customer develops its products and systems. Value is addedthrough service, support and systems knowledge. Each subsidiary has its own businessconcept specialization. Customer needs are analyzed in personal customer contacts andsolutions are suggested.
An example of industrial components, which are customized and designed in close co-operation with our customers and suppliers, comes from division MotionComp. Thecompanies in this division are working on “creating exact motions for automation andprocesses.” A customer-unique solution is accurate track control for heavy loads.
Another example comes from division Nordic Energy, who sells batteries and offersprofessional guidance in three main areas: industrial batteries, batteries in portable prod-ucts and “traction” applications for trucks and other vehicles. Each application requiresits own particular battery solution. In certain cases batteries must be able to deliver alarge amount of power for a short period. In other cases there are stringent demands forphysically small battery cells. This division has its own manufacturing of customized bat-tery packs, both in Sweden and Finland.
The systems supplied by the business area are often complex and contain advancedtechnology. Technical support, software and installation assistance are thereforerequired. The subsidiaries offer customer training in different forms. Technical servicehas high priority. An important complement is just-in-time deliveries of consumablesand accessories.
M A R K E T A N D C U S T O M E R S
The main market of the business area is the Nordic Region, but we are increasingly follow-ing our export-oriented customers out into the world. During 1999/2000, net revenueswere distributed as follows:
SWEDEN .......................................53% NORWAY ...............................................3%DENMARK.....................................17% OTHER COUNTRIES...............................3%FINLAND.......................................24%
STIG SVENSSON UNTILMARCH 31, 2000. FROM
APRIL 1, 2000, STIGSVENSSON IS PART OF
THE BERGMAN &BEVING GROUPMANAGEMENT.
26
The dominating customers are found in the vehicle industry, the telecommunicationsindustry and the electronics and engineering industries. The customers are manufacturersof cars and trucks, mobile telephones and telecommunications systems, industrial electron-ics, machinery and automation equipment. Most of the customers are Nordic manufactu-rers with large export shares.
P R O D U C T S A N D S U P P L I E R S
The industrial components are components in mechanics, electro-mechanics, automationand power supply. Industrial gaskets, laser-cut parts and battery packs are manufactured byBergman & Beving Industry.
Systems include production, testing and measuring systems. A majority of the systemsare used by the electric, electronics and telecommunications industries and by mechan-ical industry.
Suppliers are located in Europe, Asia and North America. They are normally worldleaders in their respective niches. Cooperation with suppliers is of a very long-term nature.The Group’s oldest supplier relationship commenced already in 1906.
C O M P E T I T O R S
The various subsidiaries encounter competition from local trading companies, who repre-sent non-Nordic manufacturers. One competitor in the Nordic Region that resemblesIndustry is OEM International.
A C Q U I S I T I O N S
Industry acquired four companies during 1999/2000 with aggregate sales of MSEK 70.U.N. Hydraulik AB commands a strong position in the industrial hydraulics market inSweden. The two Finnish companies, Oy Movetec Ab and Movergon Oy are specializedin components for customer-unique solutions in the area of linear movement. Possessionwas taken on April 1, 2000 of K.M.C. Ytbehandling AB, who develops and sells systemsfor industrial cleaning.
T H R E A T S A N D O P P O R T U N I T I E S
One threat to our business is if Nordic manufacturing industry loses its competitivenessand cuts back production on the Nordic Region.
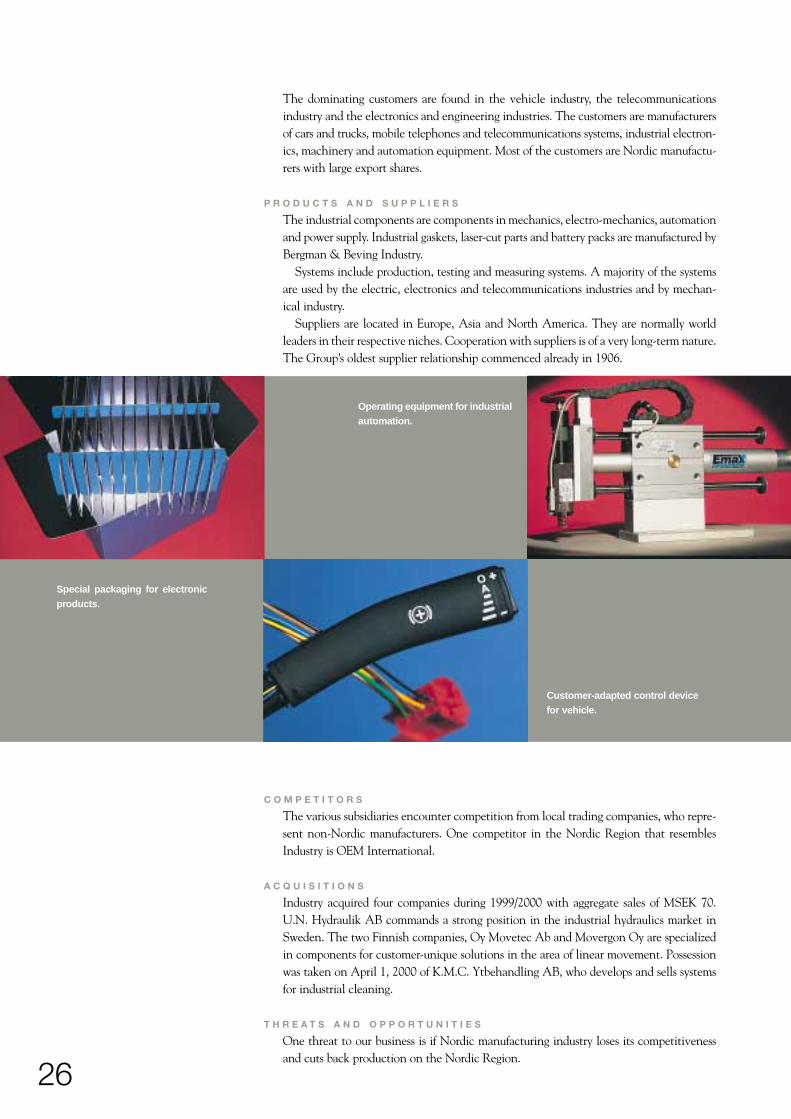
Operating equipment for industrialautomation.
Special packaging for electronicproducts.
Customer-adapted control devicefor vehicle.
27
Given our niche orientation, we possess wide application knowledge and are able tocontribute unique added values that are in demand by the customer. Here lies the great-est opportunities for the future. We will continue to grow with our successful customers,particularly in the export industry.
Extensive experience in making acquisitions means continued good opportunities forcomplementing our operations with new business concepts.
O R G A N I Z A T I O N
Bergman & Beving Industry consists of seven divisions with a total of 40 operating com-panies. A new division, EnvoControl, was formed as of April 1, 2000. This division en-gages in systems sales in metal cutting, mechanical surface treatment and surface cleaningwhere the waste is optimized and handled at the source.
As of April 1, 2000, Karlemarks Försäljnings AB and SkærTeknik A/S, with sales ofcutting tools, were transferred from Bergman & Beving Tools to Bergman & BevingIndustry. Annual revenues amount to MSEK 50.
1 9 9 9 / 2 0 0 0
Net revenues increased by 18 percent to MSEK 2 167 (1 834) and income grew by 12percent to MSEK 140 (125). This result means that business area Industry closed the yearwith very strong performance and an increase in income of 26 percent, to MSEK 44 (35).
Business area Industry saw a more broadly based upturn than before. Industry’s willing-ness to invest is on the rise and only heavy investment goods for the vehicle industry andmechanical industry is still lagging. The positive development for businesses in thetelecommunications sector continues.
Sales of industrial components, which showed weakness during the early part of theyear, are now developing well. The three divisions, Betech Seals, with gaskets and seals,MotionComp and Beving Addtech, with mechanical and electro-mechanical compon-ents, and an aggregate annual volume of about MSEK 1 000, posted an all time high interms of income for the fourth quarter of the financial year. See also the AdministrationReport, pages 38–41.
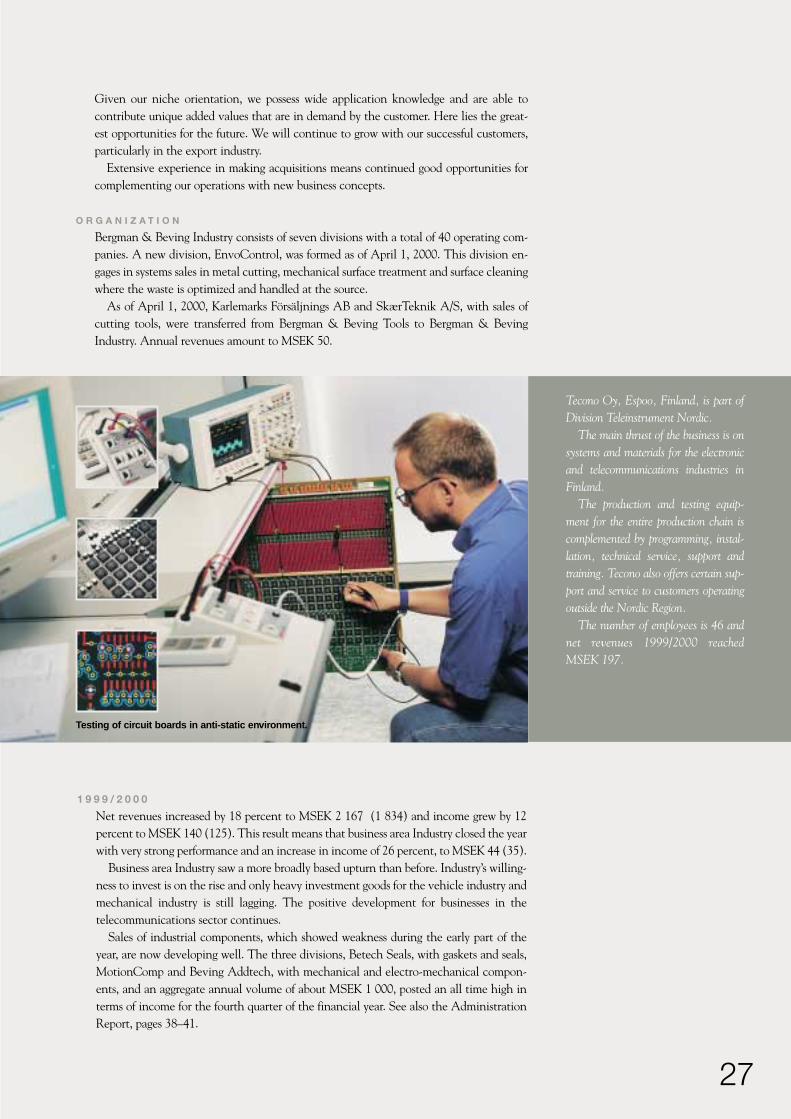
Tecono Oy, Espoo, Finland, is part ofDivision Teleinstrument Nordic.
The main thrust of the business is onsystems and materials for the electronicand telecommunications industries inFinland.
The production and testing equip-ment for the entire production chain iscomplemented by programming, instal-lation, technical service, support andtraining. Tecono also offers certain sup-port and service to customers operatingoutside the Nordic Region.
The number of employees is 46 andnet revenues 1999/2000 reachedMSEK 197.
Testing of circuit boards in anti-static environment.
ToolsB E R G M A N & B E V I N G
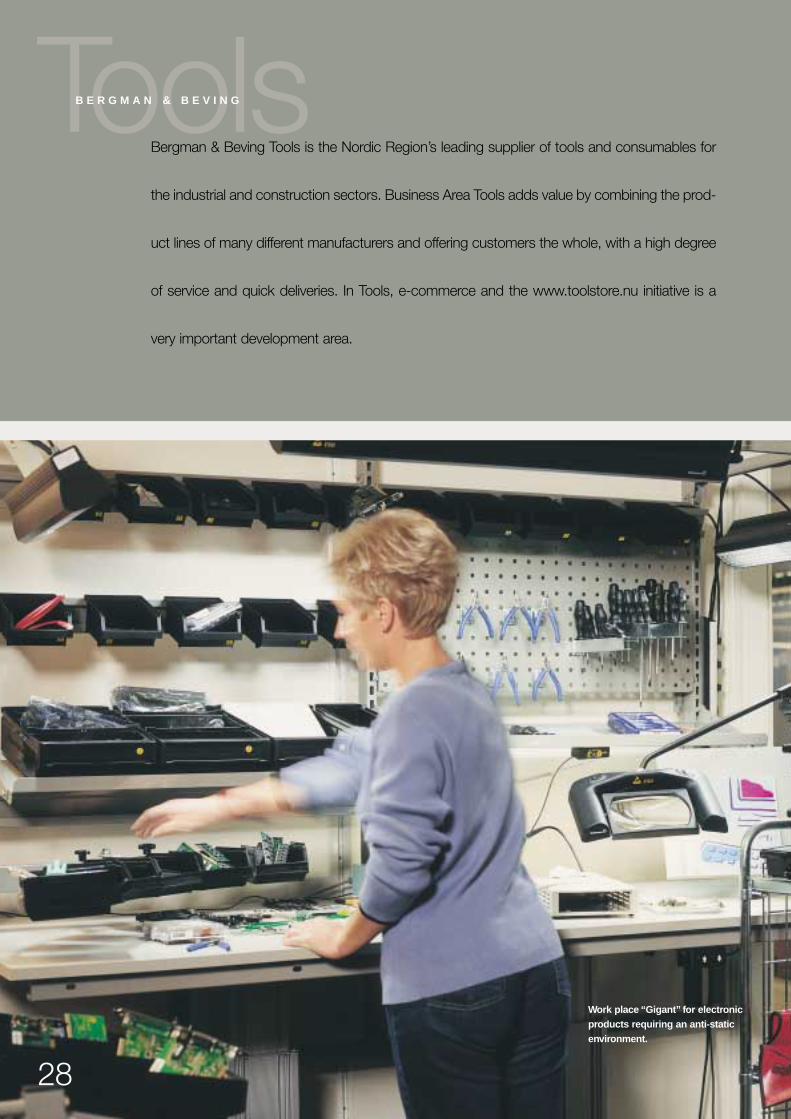
Bergman & Beving Tools is the Nordic Region’s leading supplier of tools and consumables for
the industrial and construction sectors. Business Area Tools adds value by combining the prod-
uct lines of many different manufacturers and offering customers the whole, with a high degree
of service and quick deliveries. In Tools, e-commerce and the www.toolstore.nu initiative is a
very important development area.
28
Work place “Gigant” for electronicproducts requiring an anti-staticenvironment.
29
KENNET GÖRANSSON
H O W D O W E D O B U S I N E S S ?
Bergman & Beving Tools offers a wide range of tools, consumables, fastening elementsand personal protection equipment.
The business concept is to offer these products in an efficient manner to end custom-ers in cooperation with local partners. Our local partners, or distributors, are found in thehardware, building and machinery trade. End customers are in the engineering industry,in construction and administration. Industrial fastening elements and other special prod-ucts are sold directly to industrial customers, where an important customer group is thevehicle industry.
Bergman & Beving Tools established an industry portal during the year, www.toolstore.nu. This initiative gives our partners an opportunity to ensure efficientcommerce in real time in business-to-business dealing with end customers. The industryportal will make geographical expansion more rapid.
The ability to be a supplier with a broad range of products, and good availability andsales-fulfillment in all of Scandinavia is a decisive competitive parameter. Added valuescontributed by Tools are product knowledge, procurement and quality assurance of100 000 different products from about 1 500 suppliers.
Suppliers are global companies, with well established and well-known brand names, andalso manufacturers who supply us with quality products sold under our own brand names.
For the distributor to choose Tools, the IT system with current product information,prompt delivery and competitive prices is very important. Together with the distributor,Tools offers the end customer local proximity and service, as well as specialist productknowledge and cost-effective bulk deliveries directly to end customers.
Tools fulfills the stringent requirements placed on IT and logistics systems. The com-panies in the business area handle 2 500 orders per day, divided over 23 000 order lines,which with a service rate of 95 percent reach the customers within 24 hours. Significantresources are expended on assuring that our information and logistics systems will meetthe requirements placed upon them.
M A R K E T A N D C U S T O M E R S
The Nordic Countries are our main market. Business is being built in Poland and Estonia.Certain business is also conducted in Germany. During 1999/2000, net revenues were dis-tributed as follows:SWEDEN .......................................71% NORWAY .............................................14%DENMARK.......................................1% OTHER COUNTRIES...............................9%FINLAND.........................................5%
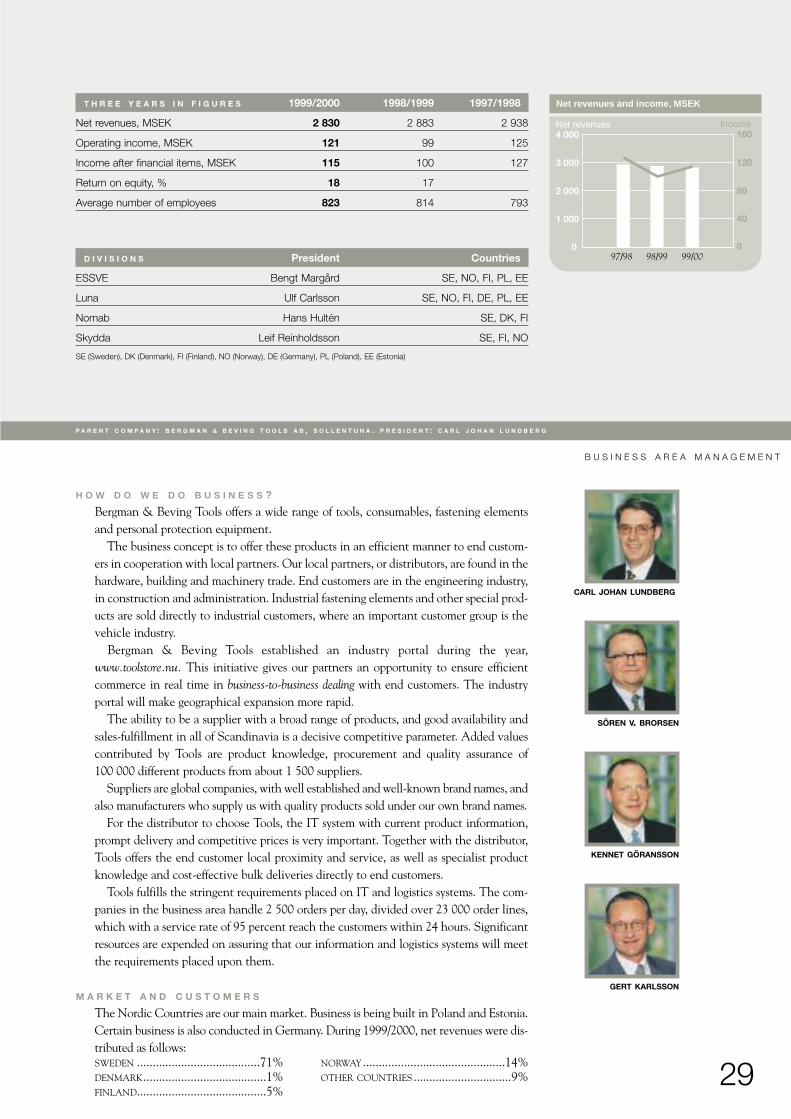
D I V I S I O N S President Countries
ESSVE Bengt Margård SE, NO, FI, PL, EE
Luna Ulf Carlsson SE, NO, FI, DE, PL, EE
Nomab Hans Hultén SE, DK, FI
Skydda Leif Reinholdsson SE, FI, NO
GERT KARLSSON
SÖREN V. BRORSEN
CARL JOHAN LUNDBERG
SE (Sweden), DK (Denmark), FI (Finland), NO (Norway), DE (Germany), PL (Poland), EE (Estonia)
P A R E N T C O M P A N Y : B E R G M A N & B E V I N G T O O L S A B , S O L L E N T U N A . P R E S I D E N T : C A R L J O H A N L U N D B E R G
T H R E E Y E A R S I N F I G U R E S 1999/2000 1998/1999 1997/1998
Net revenues, MSEK 2 830 2 883 2 938
Operating income, MSEK 121 99 125
Income after financial items, MSEK 115 100 127
Return on equity, % 18 17
Average number of employees 823 814 793
B U S I N E S S A R E A M A N A G E M E N T
Net revenues and income, MSEK
0
1 000
2 000
3 000
4 000Net revenues Income
0
40
80
120
160
97/98 98/99 99/00
30
C O M P E T I T O R S
The market structure is complex and distinguished by increased integration at the retaillevel, with different constellations among wholesalers and retailers. Among competitorsin Sweden are HDF-Paulsson, Thomée, Finnveden and Hilti.
O R G A N I Z A T I O N
Bergman & Beving Tools was organized during the year in eight profit centers: Luna,Grunda, Essve, Skydda, Consumenta, Arbetsplats, Jaktia and Nomab. The purpose was tocreate a number of focused units to work together in the industry portal, www.toolstore.nu.In addition, there is Logistikpartner, who develops and implements IT and logistics solu-tions, internally or as a third-party provider to external customers.
For all operations under www.toolstore.nu, there is a common IT platform and a centralwarehouse in Sweden that offers service throughout the Nordic Region.
Effective as of April 1, 2000, Karlemarks Försäljnings AB and SkærTeknik A/S withsales of cutting tools, have been transferred to Bergman & Beving Industry. Annual salesamount to MSEK 50.
E - C O M M E R C E
Tools has extensive experience in electronic commerce and is a leader in the area inScandinavia. Seventy percent of the business area’s order volume is captured electron-ically. This is equivalent to MSEK 1 900 on an annual basis. The new business-to-business Web site, www.toolstore.nu, enables customers all over Scandinavia to get information about and buy 100 000 different products for delivery within 24 hours.
The system, which is online, offers the customers to place orders and to view order anddelivery information, product data, environmental information and get customized train-ing. The Internet, in combination with our since many years fine-tuned logistics function,strategically located in the southern part of Sweden, means that Tools is able to offer itscustomers in the entire Nordic Region, Poland and the Baltic States a very competitivealternative.
Initially, the portal contains products from Luna, Essve, Skydda, Jaktia andConsumenta. The goal is to offer other industry-related products and services soon.
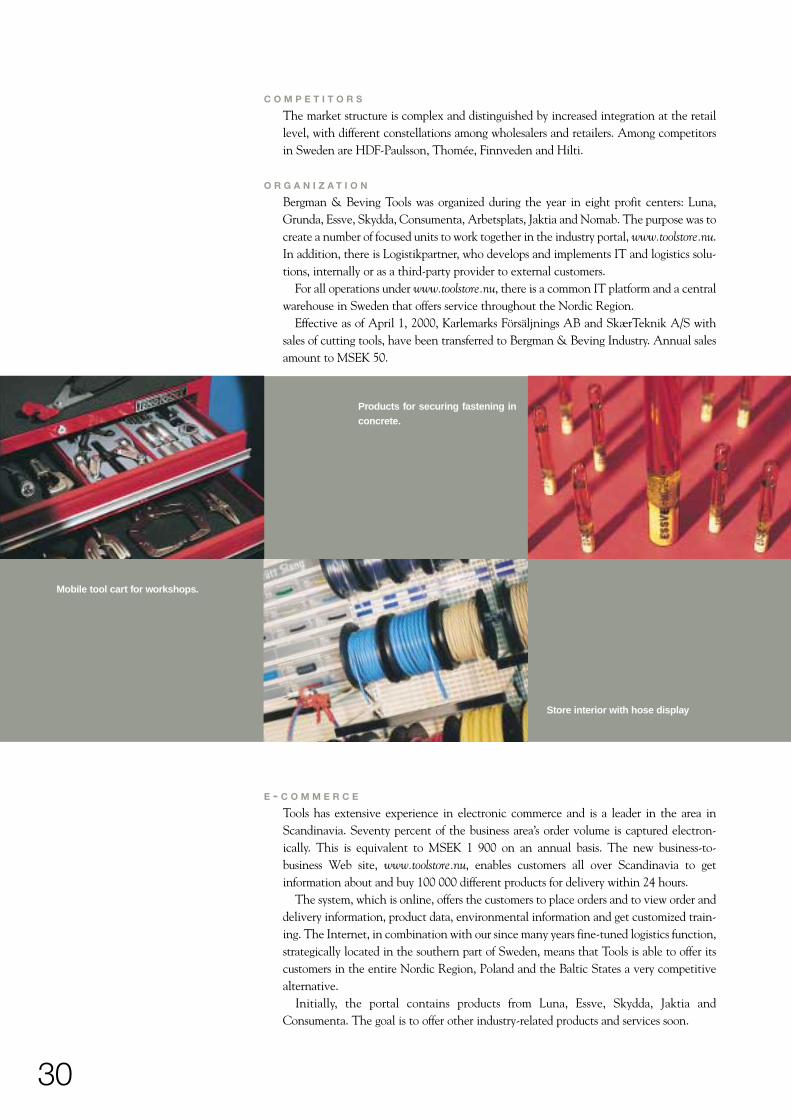
Products for securing fastening inconcrete.
Mobile tool cart for workshops.
Store interior with hose display
31
1 9 9 9 / 2 0 0 0
Net revenues amounted to MSEK 2 830 (2 883). Income after financial items increasedby 15 percent to MSEK 115 (100). Tools finished the financial year with a strong quar-terly result, MSEK 28 as compared with a weak fourth quarter one year ago (12 MSEK).
The market position in Sweden and Finland continues to be stable, with growingdemand, especially from the construction sector. The market in Norway was stable duringthe year in the construction sector, while manufacturing posted a slowing trend.
Luna’s result for the full year was a slight improvement after a very strong showing during the latter part of the year.
Essve continues to show a good development and posted good earnings growth despitehigher purchasing costs as a consequence of the strong Japanese yen. The Skydda divisioncontinued its positive development and strengthened its positions in the Swedish,Norwegian and Finnish markets. See also the Administration Report, pages 38–41.
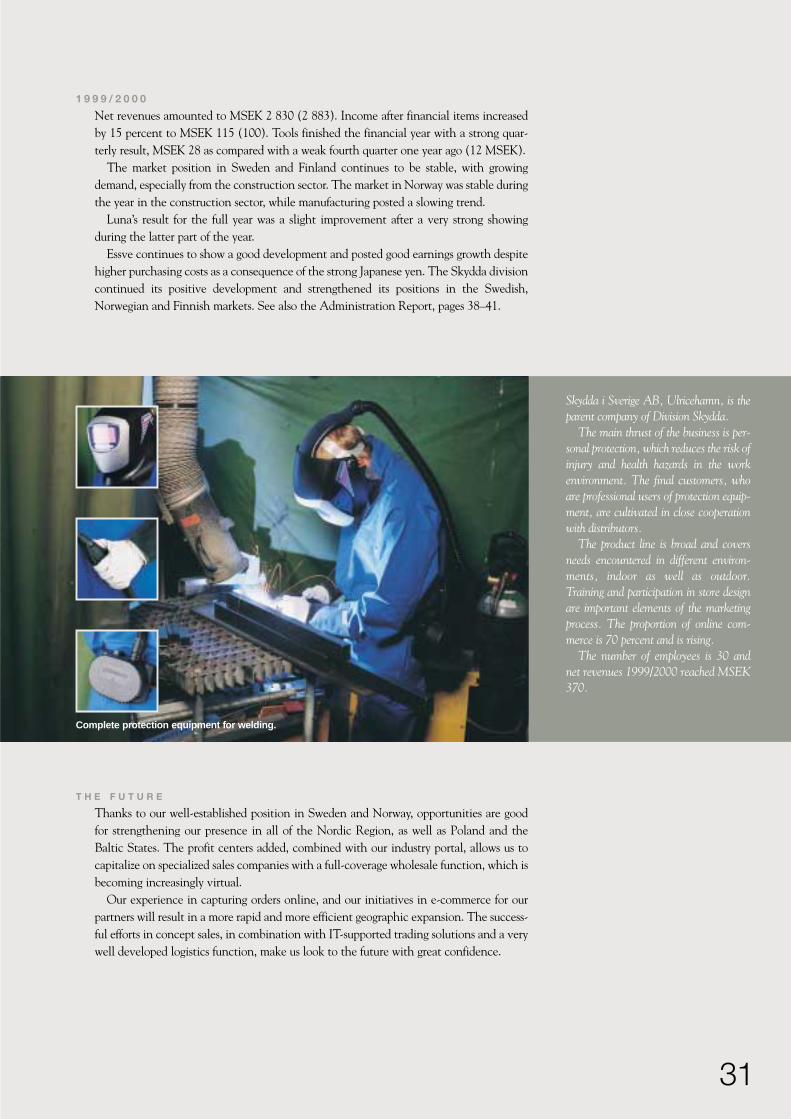
Skydda i Sverige AB, Ulricehamn, is theparent company of Division Skydda.
The main thrust of the business is per-sonal protection, which reduces the risk ofinjury and health hazards in the workenvironment. The final customers, whoare professional users of protection equip-ment, are cultivated in close cooperationwith distributors.
The product line is broad and coversneeds encountered in different environ-ments, indoor as well as outdoor.Training and participation in store designare important elements of the marketingprocess. The proportion of online com-merce is 70 percent and is rising.
The number of employees is 30 andnet revenues 1999/2000 reached MSEK370.
T H E F U T U R E
Thanks to our well-established position in Sweden and Norway, opportunities are goodfor strengthening our presence in all of the Nordic Region, as well as Poland and theBaltic States. The profit centers added, combined with our industry portal, allows us tocapitalize on specialized sales companies with a full-coverage wholesale function, which isbecoming increasingly virtual.
Our experience in capturing orders online, and our initiatives in e-commerce for ourpartners will result in a more rapid and more efficient geographic expansion. The success-ful efforts in concept sales, in combination with IT-supported trading solutions and a verywell developed logistics function, make us look to the future with great confidence.
Complete protection equipment for welding.
MediTechB E R G M A N & B E V I N G
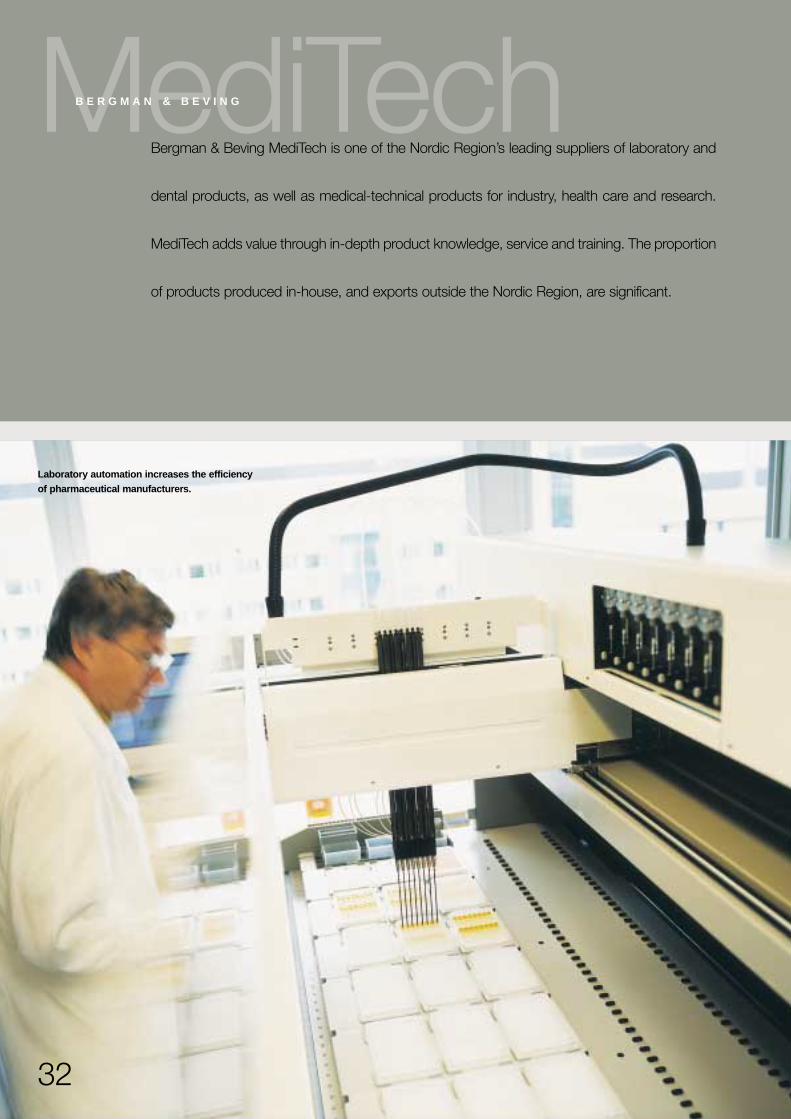
Bergman & Beving MediTech is one of the Nordic Region’s leading suppliers of laboratory and
dental products, as well as medical-technical products for industry, health care and research.
MediTech adds value through in-depth product knowledge, service and training. The proportion
of products produced in-house, and exports outside the Nordic Region, are significant.
32
Laboratory automation increases the efficiencyof pharmaceutical manufacturers.
33
SE (Sweden), DK (Denmark), FI (Finland), NO (Norway)
P A R E N T C O M P A N Y : B E R G M A N & B E V I N G M E D I T E C H A B , S T O C K H O L M . P R E S I D E N T : G Ö R A N H A G S T E N
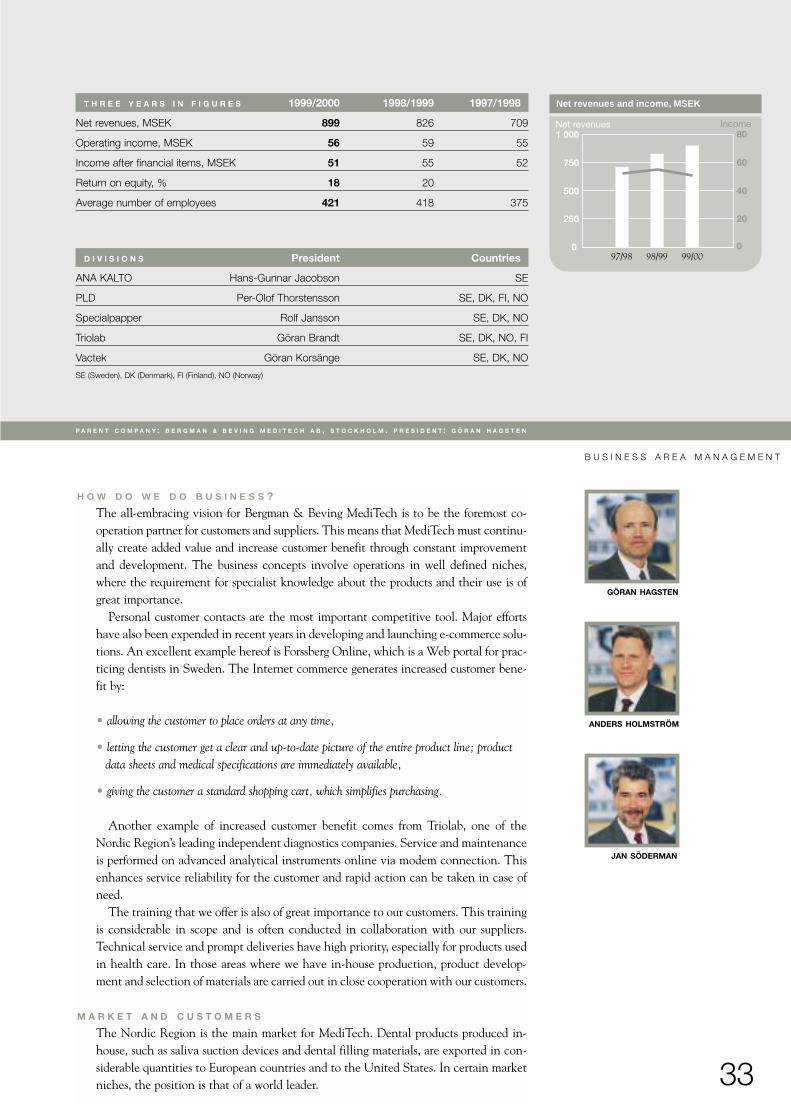
T H R E E Y E A R S I N F I G U R E S 1999/2000 1998/1999 1997/1998
Net revenues, MSEK 899 826 709
Operating income, MSEK 56 59 55
Income after financial items, MSEK 51 55 52
Return on equity, % 18 20
Average number of employees 421 418 375
GÖRAN HAGSTEN
ANDERS HOLMSTRÖM
JAN SÖDERMAN
Net revenues and income, MSEK
0
250
500
750
1 000Net revenues Income
0
20
40
60
80
97/98 98/99 99/00D I V I S I O N S President Countries
ANA KALTO Hans-Gunnar Jacobson SE
PLD Per-Olof Thorstensson SE, DK, FI, NO
Specialpapper Rolf Jansson SE, DK, NO
Triolab Göran Brandt SE, DK, NO, FI
Vactek Göran Korsänge SE, DK, NO
H O W D O W E D O B U S I N E S S ?
The all-embracing vision for Bergman & Beving MediTech is to be the foremost co-operation partner for customers and suppliers. This means that MediTech must continu-ally create added value and increase customer benefit through constant improvementand development. The business concepts involve operations in well defined niches,where the requirement for specialist knowledge about the products and their use is ofgreat importance.
Personal customer contacts are the most important competitive tool. Major effortshave also been expended in recent years in developing and launching e-commerce solu-tions. An excellent example hereof is Forssberg Online, which is a Web portal for prac-ticing dentists in Sweden. The Internet commerce generates increased customer bene-fit by:
• allowing the customer to place orders at any time,
• letting the customer get a clear and up-to-date picture of the entire product line; productdata sheets and medical specifications are immediately available,
• giving the customer a standard shopping cart, which simplifies purchasing.
Another example of increased customer benefit comes from Triolab, one of theNordic Region’s leading independent diagnostics companies. Service and maintenanceis performed on advanced analytical instruments online via modem connection. Thisenhances service reliability for the customer and rapid action can be taken in case ofneed.
The training that we offer is also of great importance to our customers. This trainingis considerable in scope and is often conducted in collaboration with our suppliers.Technical service and prompt deliveries have high priority, especially for products usedin health care. In those areas where we have in-house production, product develop-ment and selection of materials are carried out in close cooperation with our customers.
M A R K E T A N D C U S T O M E R S
The Nordic Region is the main market for MediTech. Dental products produced in-house, such as saliva suction devices and dental filling materials, are exported in con-siderable quantities to European countries and to the United States. In certain marketniches, the position is that of a world leader.
B U S I N E S S A R E A M A N A G E M E N T
34
duction facility in Ängelholm with unique capability of producing in a cleanroom environ-ment. Precious metals, soft magnetic materials and special paper are other product groups.
MediTech’s suppliers are located in Europe, North America and Asia and are typicallyworld leaders in their respective niches. MediTech has cooperated with some suppliers formore than 50 years. About 30 percent of sales are products produced in-house.
C O M P E T I T O R S
Most competitors are trading companies representing foreign manufacturers. Competingproducts generally come from the same countries as our products. Merck Kebo Lab is acompetitor in the laboratory area and Lifco is a competitor in the dental area. Competitorsfor products manufactured in-house are mostly found in the United States and Europe.
A C Q U I S I T I O N S
In the beginning of 2000, MediTech acquired Mikro Kemi AB, a contract laboratory forchemical analysis for the pharmaceutical industry and the chemical industry in the NordicRegion. This acquisition demonstrates that future product offerings increasingly willinclude different types of services, which increases the value added for our customers.
During 1999/2000, net revenues were distributed as follows:SWEDEN . . . . . . . . . . . . . . . . . . . . . . . . . . . . . . . . . . . . 54% NORWAY . . . . . . . . . . . . . . . . . . . . . . . . . . . . . . . . . . . . . . . . . 17%DENMARK . . . . . . . . . . . . . . . . . . . . . . . . . . . . . . . . . 14% OTHER COUNTRIES . . . . . . . . . . . . . . . . . . . . . . . . . . 10%FINLAND . . . . . . . . . . . . . . . . . . . . . . . . . . . . . . . . . . . . . 5%
Customers are found in the pharmaceutical industry, in the medical-technical industryand in chemical industry. Dental companies, hospitals and universities are other import-ant customer categories.
P R O D U C T S A N D S U P P L I E R S
A considerable portion of the product line consists of diagnostic equipment for blood gas,microbiology and clinical chemistry. Another important product area is advanced analysisinstruments and automation equipment for laboratories. These product areas are comple-mented by accessories and consumables for medical and chemical use. Dental products andmedical products, such as catheters and medical tubing, are manufactured at a modern pro-
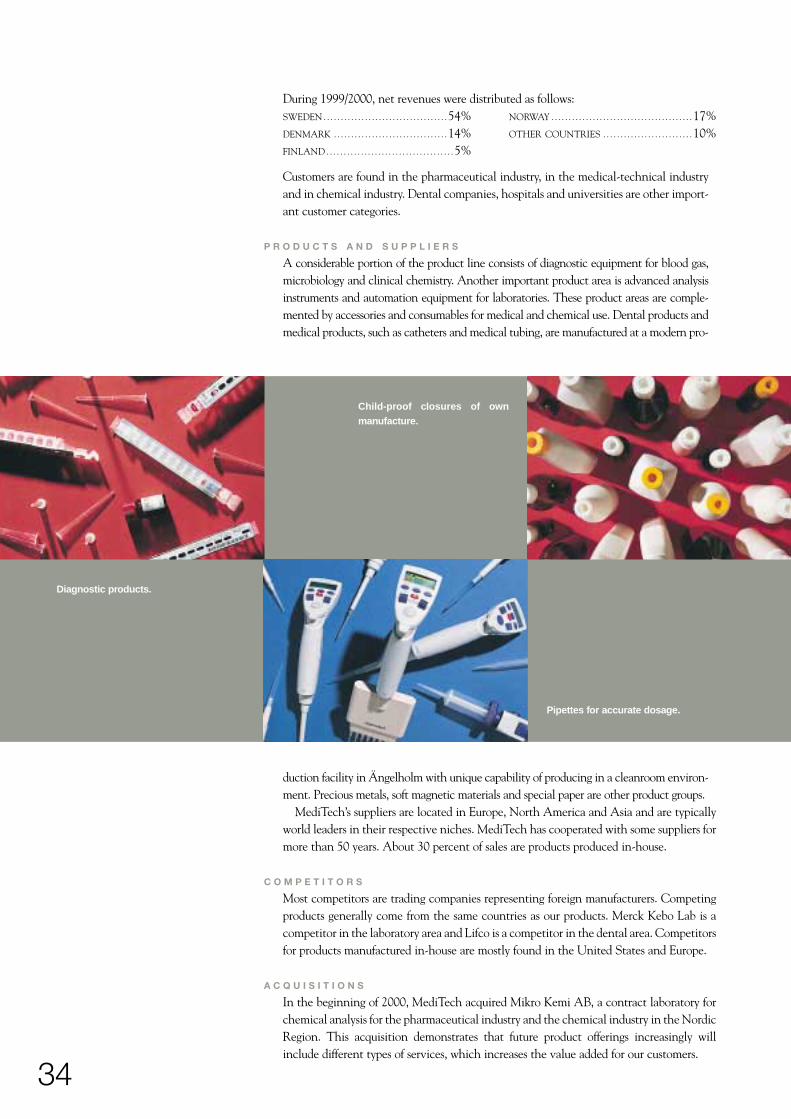
Child-proof closures of ownmanufacture.
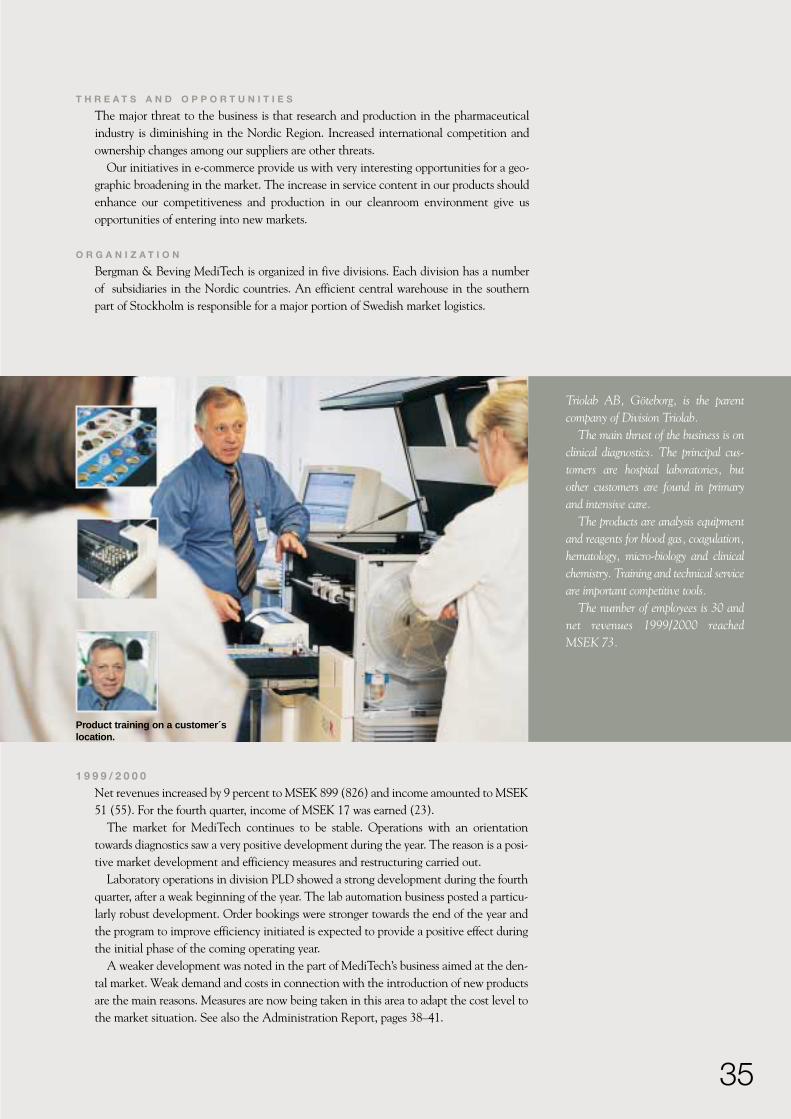
Diagnostic products.
Pipettes for accurate dosage.
35
T H R E A T S A N D O P P O R T U N I T I E S
The major threat to the business is that research and production in the pharmaceuticalindustry is diminishing in the Nordic Region. Increased international competition andownership changes among our suppliers are other threats.
Our initiatives in e-commerce provide us with very interesting opportunities for a geo-graphic broadening in the market. The increase in service content in our products shouldenhance our competitiveness and production in our cleanroom environment give usopportunities of entering into new markets.
O R G A N I Z A T I O N
Bergman & Beving MediTech is organized in five divisions. Each division has a numberof subsidiaries in the Nordic countries. An efficient central warehouse in the southernpart of Stockholm is responsible for a major portion of Swedish market logistics.
1 9 9 9 / 2 0 0 0
Net revenues increased by 9 percent to MSEK 899 (826) and income amounted to MSEK51 (55). For the fourth quarter, income of MSEK 17 was earned (23).
The market for MediTech continues to be stable. Operations with an orientationtowards diagnostics saw a very positive development during the year. The reason is a posi-tive market development and efficiency measures and restructuring carried out.
Laboratory operations in division PLD showed a strong development during the fourthquarter, after a weak beginning of the year. The lab automation business posted a particu-larly robust development. Order bookings were stronger towards the end of the year andthe program to improve efficiency initiated is expected to provide a positive effect duringthe initial phase of the coming operating year.
A weaker development was noted in the part of MediTech’s business aimed at the den-tal market. Weak demand and costs in connection with the introduction of new productsare the main reasons. Measures are now being taken in this area to adapt the cost level tothe market situation. See also the Administration Report, pages 38–41.
Triolab AB, Göteborg, is the parentcompany of Division Triolab.
The main thrust of the business is onclinical diagnostics. The principal cus-tomers are hospital laboratories, butother customers are found in primaryand intensive care.
The products are analysis equipmentand reagents for blood gas, coagulation,hematology, micro-biology and clinicalchemistry. Training and technical serviceare important competitive tools.
The number of employees is 30 andnet revenues 1999/2000 reachedMSEK 73.
Product training on a customer´slocation.
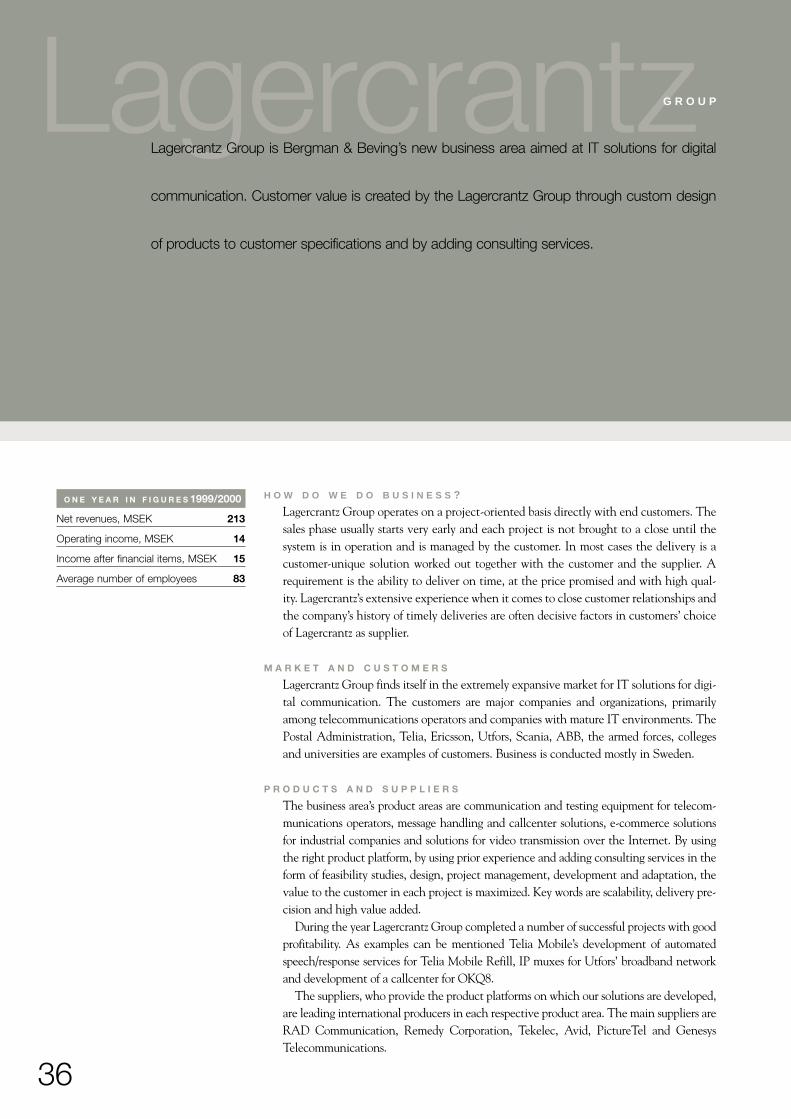
Lagercrantz
36
H O W D O W E D O B U S I N E S S ?
Lagercrantz Group operates on a project-oriented basis directly with end customers. Thesales phase usually starts very early and each project is not brought to a close until thesystem is in operation and is managed by the customer. In most cases the delivery is acustomer-unique solution worked out together with the customer and the supplier. Arequirement is the ability to deliver on time, at the price promised and with high qual-ity. Lagercrantz’s extensive experience when it comes to close customer relationships andthe company’s history of timely deliveries are often decisive factors in customers’ choiceof Lagercrantz as supplier.
M A R K E T A N D C U S T O M E R S
Lagercrantz Group finds itself in the extremely expansive market for IT solutions for digi-tal communication. The customers are major companies and organizations, primarilyamong telecommunications operators and companies with mature IT environments. ThePostal Administration, Telia, Ericsson, Utfors, Scania, ABB, the armed forces, collegesand universities are examples of customers. Business is conducted mostly in Sweden.
P R O D U C T S A N D S U P P L I E R S
The business area’s product areas are communication and testing equipment for telecom-munications operators, message handling and callcenter solutions, e-commerce solutionsfor industrial companies and solutions for video transmission over the Internet. By usingthe right product platform, by using prior experience and adding consulting services in theform of feasibility studies, design, project management, development and adaptation, thevalue to the customer in each project is maximized. Key words are scalability, delivery pre-cision and high value added.
During the year Lagercrantz Group completed a number of successful projects with goodprofitability. As examples can be mentioned Telia Mobile’s development of automatedspeech/response services for Telia Mobile Refill, IP muxes for Utfors’ broadband networkand development of a callcenter for OKQ8.
The suppliers, who provide the product platforms on which our solutions are developed,are leading international producers in each respective product area. The main suppliers areRAD Communication, Remedy Corporation, Tekelec, Avid, PictureTel and GenesysTelecommunications.
O N E Y E A R I N F I G U R E S 1999/2000
Net revenues, MSEK 213
Operating income, MSEK 14
Income after financial items, MSEK 15
Average number of employees 83
G R O U P
Lagercrantz Group is Bergman & Beving’s new business area aimed at IT solutions for digital
communication. Customer value is created by the Lagercrantz Group through custom design
of products to customer specifications and by adding consulting services.
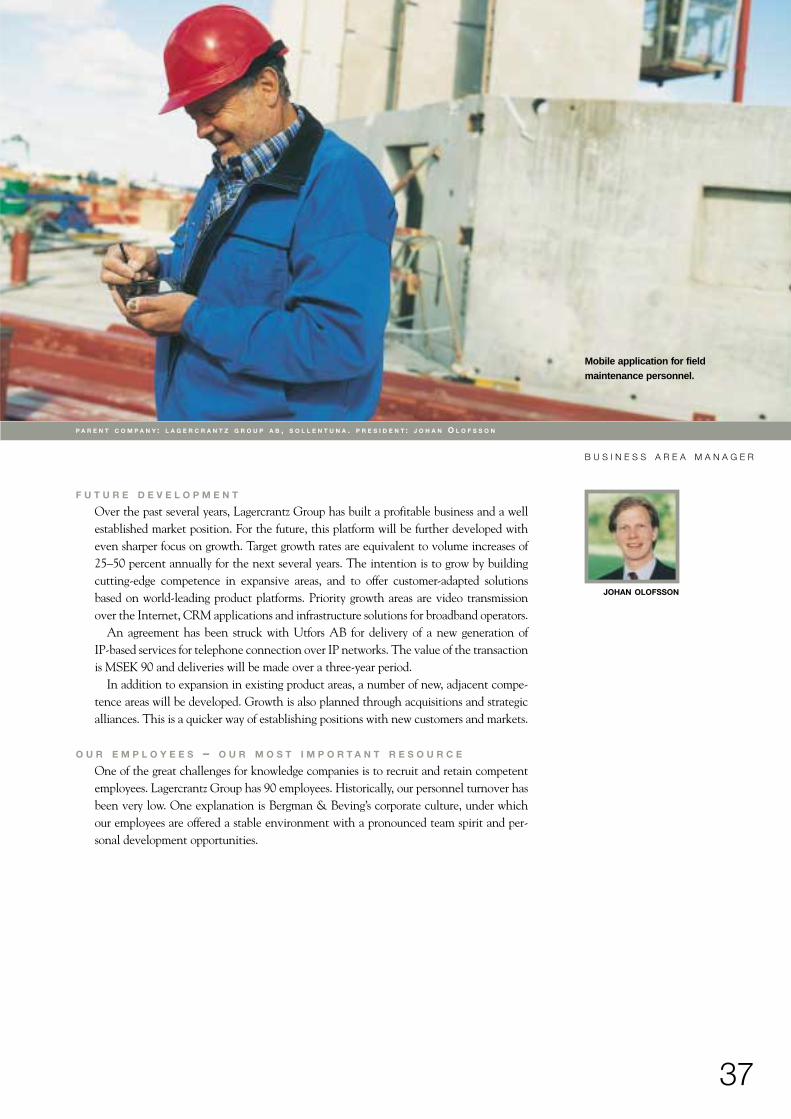
37
P A R E N T C O M P A N Y : L A G E R C R A N T Z G R O U P A B , S O L L E N T U N A . P R E S I D E N T : J O H A N O L O F S S O N
JOHAN OLOFSSON
F U T U R E D E V E L O P M E N T
Over the past several years, Lagercrantz Group has built a profitable business and a wellestablished market position. For the future, this platform will be further developed witheven sharper focus on growth. Target growth rates are equivalent to volume increases of25–50 percent annually for the next several years. The intention is to grow by buildingcutting-edge competence in expansive areas, and to offer customer-adapted solutionsbased on world-leading product platforms. Priority growth areas are video transmissionover the Internet, CRM applications and infrastructure solutions for broadband operators.
An agreement has been struck with Utfors AB for delivery of a new generation of IP-based services for telephone connection over IP networks. The value of the transactionis MSEK 90 and deliveries will be made over a three-year period.
In addition to expansion in existing product areas, a number of new, adjacent compe-tence areas will be developed. Growth is also planned through acquisitions and strategicalliances. This is a quicker way of establishing positions with new customers and markets.
O U R E M P L O Y E E S – O U R M O S T I M P O R T A N T R E S O U R C E
One of the great challenges for knowledge companies is to recruit and retain competentemployees. Lagercrantz Group has 90 employees. Historically, our personnel turnover hasbeen very low. One explanation is Bergman & Beving’s corporate culture, under whichour employees are offered a stable environment with a pronounced team spirit and per-sonal development opportunities.
B U S I N E S S A R E A M A N A G E R
Mobile application for fieldmaintenance personnel.
38Ann
ual A
cco
unts
Administration ReportApril 1, 1999 – March 31, 2000
N E T R E V E N U E S A N D I N C O M E
Net revenues increased by 10 percent to MSEK 8 073 (7 343). Income after financialitems increased by 12 percent to MSEK 392 (351).
The market situation for the Group’s core businesses improved gradually during theyear. The fourth quarter was distinguished by strong order bookings and sales. The bestperformance was posted by businesses with an electronic and telecommunications orien-tation, but the situation during the fourth quarter was also bolstered for businesses withan orientation towards the engineering industry and vehicle manufacture.
Four of five business areas report improved earnings performance. For the fourth quar-ter, consolidated income was MSEK 126, which is 42 percent higher than for the corre-sponding year-ago quarter. The main reasons for the earnings improvement are theimproved market situation and positive impact of action programs and restructuring. Theintegration of Berendsen Components, acquired as of November 1, 1998, is now com-plete.
Income for the financial year is equivalent to earnings per share of SEK 9.20, as com-pared with SEK 8.30 for the 1998/1999 financial year.
B U S I N E S S A R E A S
E L E C T R O N I C S
Net revenues increased by 21 percent to MSEK 2 180 (1 804). Most of the increase isrelated to acquisitions. Income after financial items increased by 11 percent to MSEK 73(66). This result is indicative of very robust performance during the latter part of the year,with the fourth quarter coming in at an all time high, with a result of MSEK 36 (18). Thisresult includes a capital gain of MSEK 3 related to the sale of a property in Copenhagen.
Market demand for components and cable, which account for a major portion of thebusiness area’s volume, is currently very good. Net sales of components increased by 50percent during the fourth quarter of the financial year. For several types of components,there is actually state of shortage, which reduces pricing pressures, but which may alsolead to delivery difficulties in the longer term.
For data products, which account for the remainder of the business area’s volume, anegative result for the first two quarters was turned into a positive result during the thirdand fourth quarters. Operations have undergone major restructuring and personnel cut-backs, especially in Denmark and Norway (Oslo). The strategy for the future is to focuseven more sharply on providing customers with products and solutions with added valuein selected niches.
The integration of Berendsen Components, which was acquired as of November 1,1998, was completed during the fourth quarter of the financial year. The restructuringreserve of MSEK 50 set aside in conjunction with the acquisition, has been utilized in itsentirety, with MSEK 10 million thereof spent during the fourth quarter of the financialyear.
The expansion in e-commerce continues. EDI solutions to integrate forecasting, orderbookings and invoicing are important initiatives in the contacts with existing major cus-tomers. The proportion of orders received via EDI in component operations increasedfrom 5 percent to 20 percent during the year. Marketing efforts aimed at new customersand markets are also in progress via the Internet.
I N D U S T R Y
Net revenues increased by 18 percent to MSEK 2 167 (1 834) and income grew by 12 per-cent to MSEK 140 (125). This result means that business area Industry also closed the yearwith very strong performance and an increase in income of 26 percent, to MSEK 44 (35).Business area Industry saw a more broadly based upturn than before. Industry’s willingnessto invest is on the rise, and only heavy investment goods for the vehicle industry andmechanical industry is still lagging. The positive development for businesses in thetelecommunications sector continues.
Sales of industrial components, which showed weakness during the early part of the year,are now developing well. The three divisions, Betech Seals, with gaskets and seals,
39
Annual A
ccounts
MotionComp and Beving Addtech, with mechanical and electro-mechanical compon-ents, and an aggregate annual volume of about MSEK 1 000, posted an all time high interms of income for the fourth quarter of the financial year.
Business area Industry formed a new division during the fourth quarter, EnvoControl,involved in environmental technology and industrial cleaning. The division initially con-sists of companies JA Teknik AB, Karlemark Försäljnings AB and Skær Teknik A/S inDenmark, where the second and third units were transferred from business area Tools as ofApril 1, 2000. This division also includes K.M.C. Ytbehandling AB, which was acquiredas of April 1, 2000. The annual volume for EnvoControl is estimated to reach MSEK 120.
Data for Lagercrantz Group, which from April 1, 2000 constitutes a separate business area, areincluded in business area Industry, but are also reported separately under the heading LagercrantzGroup.
T O O L S
Net revenues amounted to MSEK 2 830 (2 883). Income after financial items increasedby 15 percent to MSEK 115 (100). Tools finished the financial year with a strong quar-terly result, MSEK 28 as compared with a weak fourth quarter one year ago (12 MSEK).
The market position in Sweden and Finland continues to be stable, with growingdemand, especially from the construction sector. The market in Norway was stable duringthe year in the construction sector, while manufacturing posted a slowing trend.
Luna’s result for the full year was a slight improvement after a very strong showing dur-ing the latter part of the year. As of April 1, 2000, former divisions Work Place andSupplies, with annual sales of about MSEK 700, have been converted to individual sub-sidiaries under the names Gigant and Grunda. The objective is to create pure productcompanies with clear profit center responsibility.
Essve continues to show a good development and posted good earnings growth despitehigher purchasing costs as a consequence of the strong Japanese yen. The Skydda divisioncontinued its positive development and strengthened its positions in the Swedish,Norwegian and Finnish markets.
In the spring of 2000, Tools is launching its industry portal, www.toolstore.nu, aimed atthe industrial and construction sector. Tools is today the Nordic Area’s leading player ine-commerce business-to-business for tools and consumables for the industrial and buildingsupplies trade. The proportion of electronic orders, which is continuing to increase, isabout 70 percent of the business area’s sales volume, which today amounts to over MSEK1 900 on an annual basis.
Internet portal www.toolstore.nu is based on already established business volumes anda fine-tuned logistics apparatus, which makes it possible for customers all overScandinavia to find information about, and buy, 100 000 different products for deliverywithin 24 hours. From inception, the portal contains products from Group companiesLuna, Skydda, Essve, Consumenta and Jaktia, but soon several other industry-relatedproducts and services will also be available.
M E D I T E C H
Net revenues increased by 9 percent to MSEK 899 (826) and income amounted to MSEK51 (55). For the fourth quarter, income of MSEK 17 was earned (23).
The market for MediTech continues to be stable. Operations with an orientationtowards diagnostics saw a very positive development during the year. The reason is a posi-tive market development and efficiency measures and restructuring carried out.
Laboratory operations in division PLD showed s strong development during the fourthquarter, after a weak beginning of the year. The lab automation business posted a particu-larly robust development. Order bookings were stronger towards the end of the year andthe program to improve efficiency initiated is expected to provide a positive effect duringthe initial phase of the coming operating year. A weaker development was noted in thepart of MediTech’s business aimed at the dental market. Weak demand and costs in con-nection with the introduction of new products are the main reasons. Measures are nowbeing taken in this area to adapt the cost level to the market situation.
40Ann
ual A
cco
unts
E-commerce initiatives in MediTech continue. MediTech’s portal, www.fd.se, aimed at thetarget group of dentists, is being gradually developed and the number of customers is grow-ing. A similar initiative will be launched this fall, www.labora.se, aimed at laboratories,primarily in the university and health care sectors, food industry and chemical industry.
L A G E R C R A N T Z G R O U P
Lagercrantz Group is positioned in the expansive market for digital communication. Thebusiness area has strong positions, particularly in three niches: knowledge and solutions forcapacity maximization in digital networks, image and video transmission over the Internetand call-center solutions. The vision for Lagercrantz Group is to establish itself as a leading knowledge company in digital communication. In the future, several otherexpanding niches will be developed. Customers are larger companies and organizations,with emphasis on telecom operators with mature IT environments. The PostalAdministration, Telia, Ericsson, Utfors, Scania, ABB, the armed forces, colleges and uni-versities are examples of customers.
Net revenues for the financial year amounted to MSEK 212, with income after financialitems of MSEK 15. The number of employees is 90.
During the fourth quarter, Lagercrantz concluded contracts with Utfors worth MSEK 90over three years to supply a customer-adapted solution for telephony over the broadbandnetwork.
P R O F I T A B I L I T Y, F I N A N C I A L P O S I T I O N A N D C A P I T A L E X P E N D I T U R E S
The return on capital employed for the financial year was 16 percent and the return onequity was 14 percent. The corresponding figures for the prior financial year were 16 per-cent and 14 percent, respectively.
Cash flow from current operations amounted to MSEK 355 (243) for the financial year.The Group’s net financial liabilities amounted to MSEK 200 (311).
The equity ratio at the end of the period was 44 percent, which is unchanged from thebeginning of the financial year. Shareholders’ equity per share was SEK 67.10 as comparedwith SEK 63.60 at the beginning of the financial year. Computed based on the total num-ber of shares outstanding after full conversion, the equity ratio and shareholders’ equityper share would be 47 percent and SEK 68.60 per share, respectively.
While awaiting clear application rules, the receivable from SPP in the amount ofMSEK 85 is not included in the financial statements as of March 31, 2000.
Investments in tangible fixed assets, in addition to that which has been added throughacquisitions and divestitures, amounted to MSEK 79 (104). Capital expenditures for cor-porate acquisitions amounted to MSEK 24 (487).
A C Q U I S I T I O N S A N D D I V E S T I T U R E S
During the 1999/2000 financial year, Bergman & Beving acquired six businesses with totalannual sales of MSEK 105. Electronics acquired Iwanejko Electronics, thereby establish-ing itself in Poland. Industry made four acquisitions, U.N. Hydraulik, Oy Movetec Ab,Movergon Oy and K.M.C. Ytbehandling AB, with an aggregate annual volume of MSEK70. MediTech made one acquisition, Mikro Kemi AB.
Electronics sold its data business in Viborg, Denmark, during the year. This unit hadannual sales of MSEK 115.
R E S T R U C T U R I N G
Effective as of April 1, 2000, Lagercrantz Group constitutes the Group’s fifth business area.The Business in Lagercrantz Group was previously a part of business area Industry.Lagercrantz Group is concentrated on IT solutions for digital communication. The reasonfor establishing Lagercrantz Group as a separate business area is to make the business morevisible and to put an even sharper focus on growth.
In a bid to concentrate the business, and reduce the amount of capital tied up in theGroup, the Board of Directors had already before decided to offer for sale a number of cen-trally located properties, especially in the Stockholm region. During the fourth quarter ofthe financial year, one property in Copenhagen was sold for MSEK 20, which gives rise toa capital gain of MSEK 3.
41
Annual A
ccounts
R E P U R C H A S E O F S H A R E S
For the purpose of improving the Group’s return on equity and earnings per share, theBoard of Directors has resolved to propose to the regularly scheduled annual general meet-ing of shareholders to repurchase the Company’s own shares. The proposal includes a man-date for the Board of Directors to repurchase up to 10 percent of the shares outstanding,and the mandate is proposed to remain in effect until the next following regularly sched-uled annual general meeting of shareholders in 2001.
Purchases may be made over the stock exchange as well as in the form of an offer to allshareholders. The mandate of the Board of Directors is also suggested to include the optionof using repurchased shares as payment in connection with acquisitions, or to sell repur-chased shares in ways other than over the stock exchange to finance acquisitions.
I N C E N T I V E P R O G R A M
For the purpose of further motivating and stimulating the Group’s employees to increasedefforts, an incentive program was introduced during the year. The program consists of sub-ordinated, convertible debentures and options.
An extra general meeting of the shareholders held November 18, 1999 resolved to issuea subordinated debenture loan convertible into class B shares. The term of the loan isJanuary 28, 2000 to October 30, 2004. Conversion may be requested from July 1, 2002until September 15, 2004. The subordinated convertible debenture program was sub-scribed for by over 900 employees in Sweden, Denmark, Finland and Norway. About 50percent of the employees in Sweden signed up for the issue. The subordinated convertibledebenture loan is in the amount of MSEK 101. Upon full conversion, the number of sharesoutstanding increases by 847 644 class B shares, which is equivalent to dilution of 2.9 per-cent of the capital and 1.8 percent of the votes in Bergman & Beving AB. The conversionprice is SEK 119.
November 18, 1999, Bergman & Beving’s Board of Directors decided to offer about 150members of senior management to acquire synthetic options. Subscription to the programmeant that 654 500 options were issued to members of senior management in the Group.The program’s remaining 220 500 options may be issued to persons who are hired to seniorpositions in the future. The term of the program is January 13, 2000 to January 13, 2003and the strike price is SEK 119.30. The option program’s effect on earnings in the event ofan increase in market price of the share will be limited since the program has been largelyhedged. The payment date for both parts of the incentive program was during January2000.
E N V I R O N M E N T A L I M P A C T
The Group conducts operations requiring a permit, or operations with a reporting require-ment, in three Swedish subsidiaries. None of the Group’s companies are involved in anyenvironmentally related dispute.
E M P L O Y E E S
At the end of the period, the number of employees in the Group was 2 693, which can becompared to 2 729 at the beginning of the period. The number of employees increased by15 as a consequence of acquisitions and divestitures. The average number of employeesduring the year was 2 679 (2 513).
T H E N E W M I L L E N N I U M
The transition to year 2000 occurred without incident in operations.
P A R E N T C O M P A N Y
The Parent Company’s net revenues amounted to MSEK 24 (23), and income beforeappropriations and taxes was MSEK 354 (214). This result includes dividends and groupcontributions from subsidiaries in an amount of MSEK 341 (204).
W O R K O F T H E B O A R D O F D I R E C T O R S
During the 1999/2000 financial year, the Board of Directors held five regularly scheduledmeetings and one statutory meeting. The regularly scheduled Board of Directors meetingheld August 25, 1999 adopted the rules of procedure for the Board of Directors. These rulesof procedure also contain instructions for the President and Chief Executive Officer.
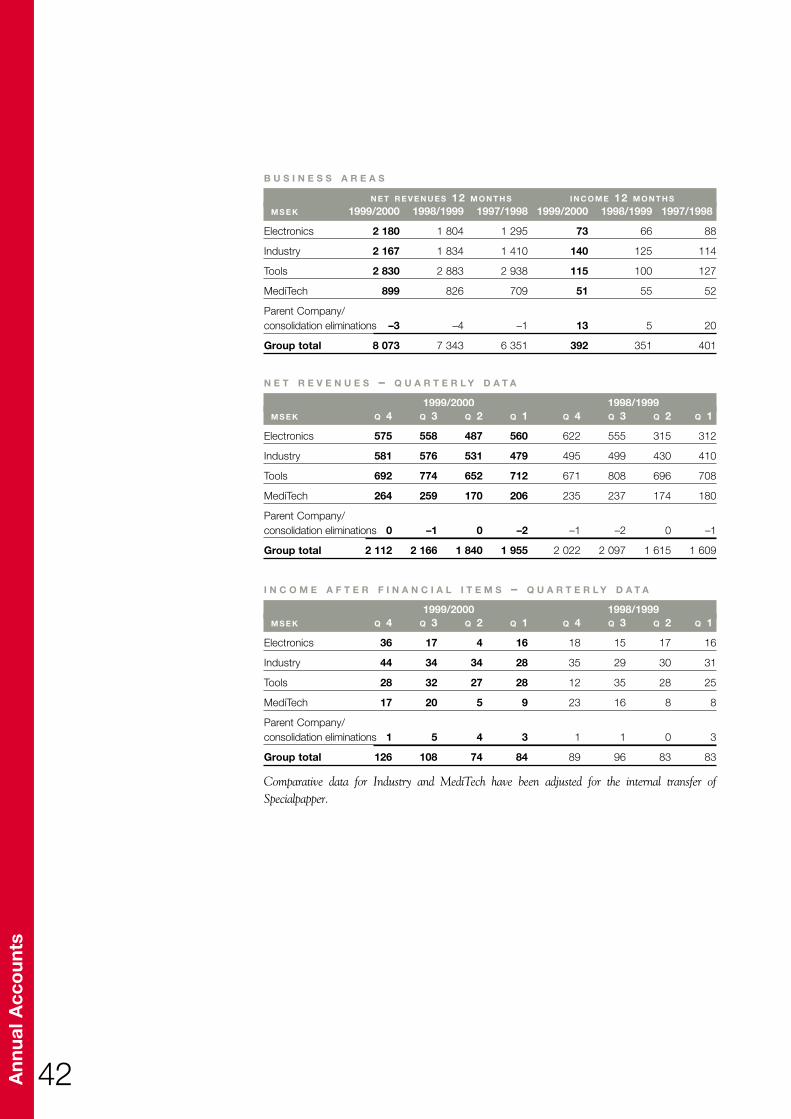
42Ann
ual A
cco
unts
I N C O M E A F T E R F I N A N C I A L I T E M S – Q U A R T E R L Y D A T A
1999/2000 1998/1999M S E K Q 4 Q 3 Q 2 Q 1 Q 4 Q 3 Q 2 Q 1
Electronics 36 17 4 16 18 15 17 16
Industry 44 34 34 28 35 29 30 31
Tools 28 32 27 28 12 35 28 25
MediTech 17 20 5 9 23 16 8 8
Parent Company/consolidation eliminations 1 5 4 3 1 1 0 3
Group total 126 108 74 84 89 96 83 83
Comparative data for Industry and MediTech have been adjusted for the internal transfer ofSpecialpapper.
B U S I N E S S A R E A S
N E T R E V E N U E S 12 M O N T H S I N C O M E 12 M O N T H S
M S E K 1999/2000 1998/1999 1997/1998 1999/2000 1998/1999 1997/1998
Electronics 2 180 1 804 1 295 73 66 88
Industry 2 167 1 834 1 410 140 125 114
Tools 2 830 2 883 2 938 115 100 127
MediTech 899 826 709 51 55 52
Parent Company/consolidation eliminations –3 –4 –1 13 5 20
Group total 8 073 7 343 6 351 392 351 401
N E T R E V E N U E S – Q U A R T E R L Y D A T A
1999/2000 1998/1999M S E K Q 4 Q 3 Q 2 Q 1 Q 4 Q 3 Q 2 Q 1
Electronics 575 558 487 560 622 555 315 312
Industry 581 576 531 479 495 499 430 410
Tools 692 774 652 712 671 808 696 708
MediTech 264 259 170 206 235 237 174 180
Parent Company/consolidation eliminations 0 –1 0 –2 –1 –2 0 –1
Group total 2 112 2 166 1 840 1 955 2 022 2 097 1 615 1 609
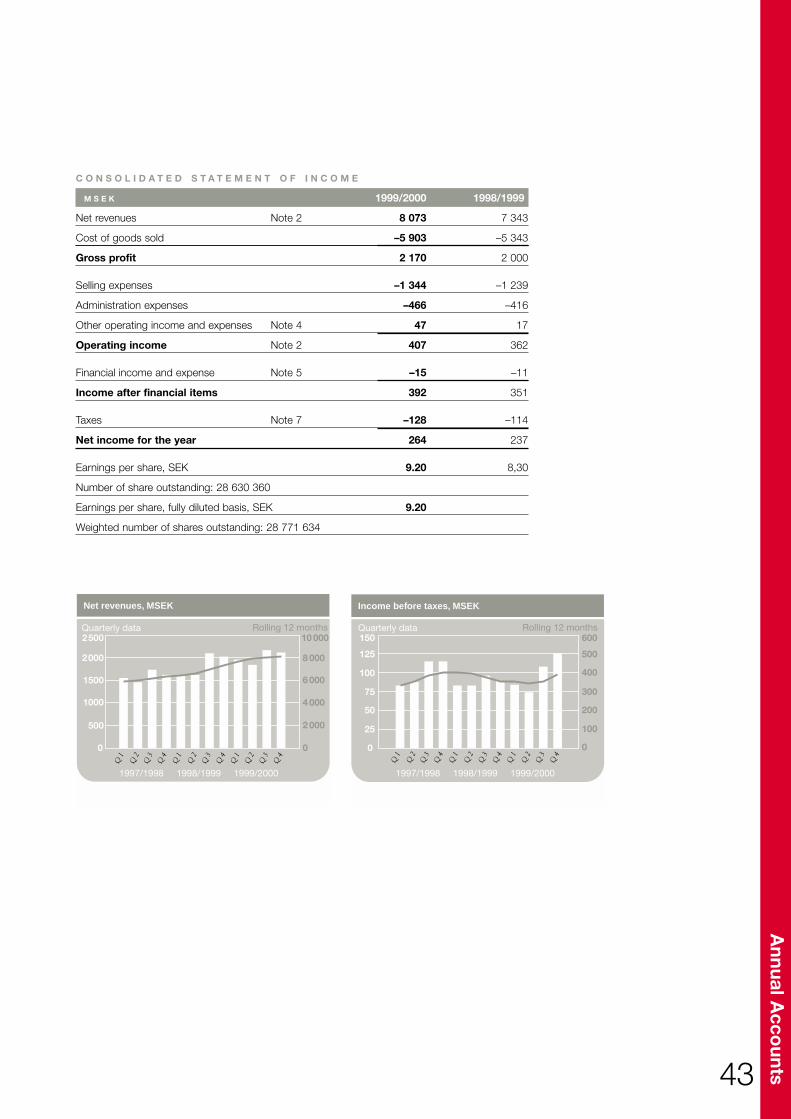
C O N S O L I D A T E D S T A T E M E N T O F I N C O M E
M S E K 1999/2000 1998/1999
Net revenues Note 2 8 073 7 343
Cost of goods sold –5 903 –5 343
Gross profit 2 170 2 000
Selling expenses –1 344 –1 239
Administration expenses –466 –416
Other operating income and expenses Note 4 47 17
Operating income Note 2 407 362
Financial income and expense Note 5 –15 –11
Income after financial items 392 351
Taxes Note 7 –128 –114
Net income for the year 264 237
Earnings per share, SEK 9.20 8,30
Number of share outstanding: 28 630 360
Earnings per share, fully diluted basis, SEK 9.20
Weighted number of shares outstanding: 28 771 634
43
Annual A
ccounts
Net revenues, MSEK
0
500
1000
1500
2500Quarterly data Rolling 12 months
0
4 000
6 000
8 000
10 000
Q 1
Q 2
Q 3
Q 4
Q 1
Q 2
Q 3
Q 4
Q 1
Q 2
Q 3
Q 4
1997/1998 1998/1999 1999/2000
2000
2 000
Income before taxes, MSEK
0
25
50
100
150Quarterly data Rolling 12 months
0
200
300
500
600
Q 1
Q 2
Q 3
Q 4
Q 1
Q 2
Q 3
Q 4
Q 1
Q 2
Q 3
Q 4
1997/1998 1998/1999 1999/2000
125
75
100
400
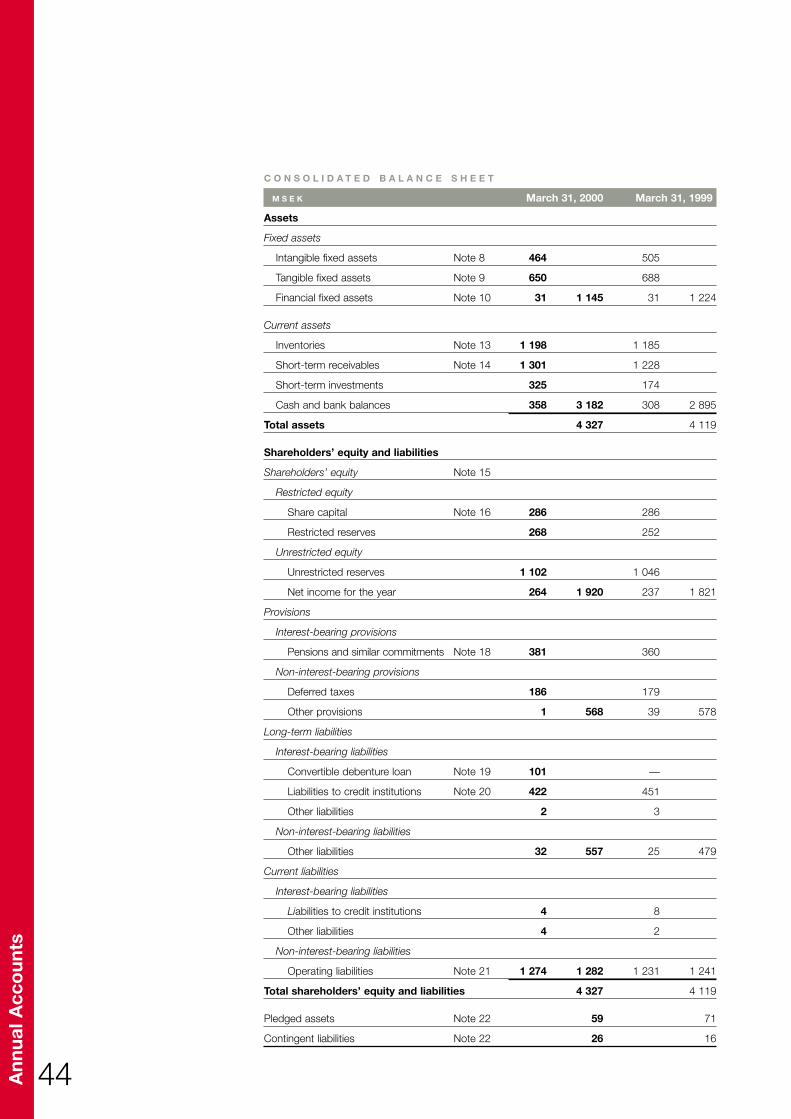
44Ann
ual A
cco
unts
C O N S O L I D A T E D B A L A N C E S H E E T
M S E K March 31, 2000 March 31, 1999
Assets
Fixed assets
Intangible fixed assets Note 8 464 505
Tangible fixed assets Note 9 650 688
Financial fixed assets Note 10 31 1 145 31 1 224
Current assets
Inventories Note 13 1 198 1 185
Short-term receivables Note 14 1 301 1 228
Short-term investments 325 174
Cash and bank balances 358 3 182 308 2 895
Total assets 4 327 4 119
Shareholders’ equity and liabilities
Shareholders’ equity Note 15
Restricted equity
Share capital Note 16 286 286
Restricted reserves 268 252
Unrestricted equity
Unrestricted reserves 1 102 1 046
Net income for the year 264 1 920 237 1 821
Provisions
Interest-bearing provisions
Pensions and similar commitments Note 18 381 360
Non-interest-bearing provisions
Deferred taxes 186 179
Other provisions 1 568 39 578
Long-term liabilities
Interest-bearing liabilities
Convertible debenture loan Note 19 101 —
Liabilities to credit institutions Note 20 422 451
Other liabilities 2 3
Non-interest-bearing liabilities
Other liabilities 32 557 25 479
Current liabilities
Interest-bearing liabilities
Liabilities to credit institutions 4 8
Other liabilities 4 2
Non-interest-bearing liabilities
Operating liabilities Note 21 1 274 1 282 1 231 1 241
Total shareholders’ equity and liabilities 4 327 4 119
Pledged assets Note 22 59 71
Contingent liabilities Note 22 26 16
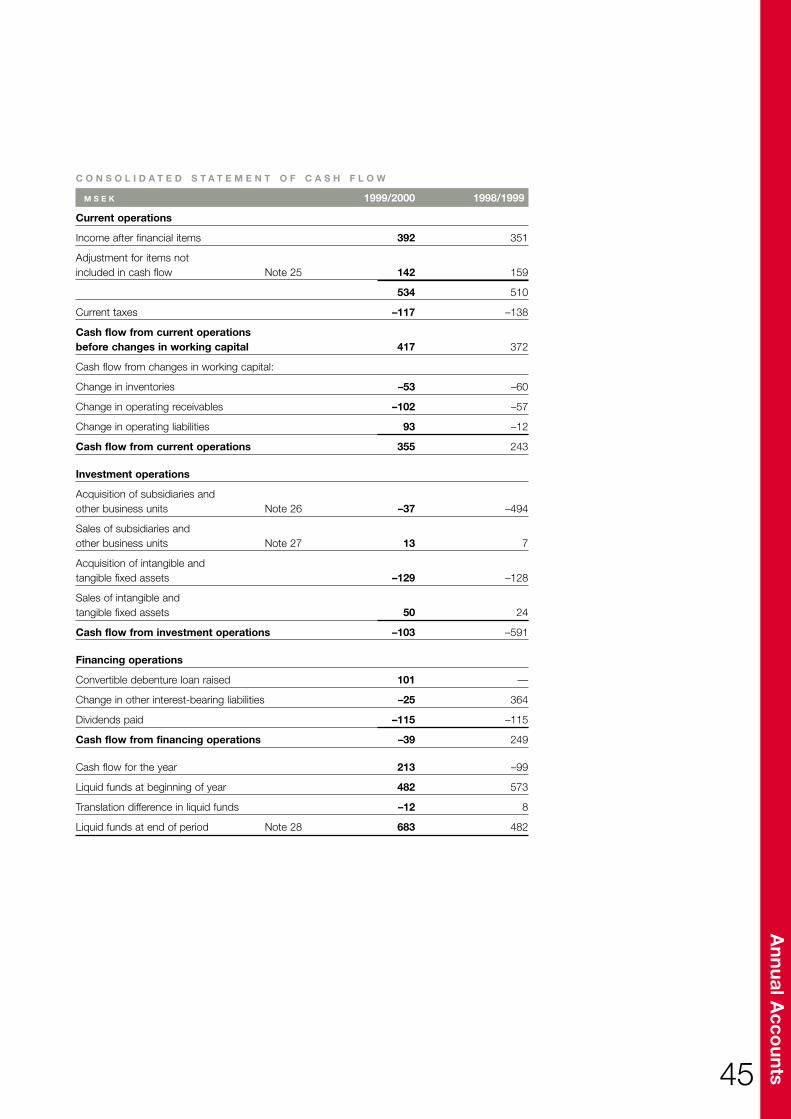
45
Annual A
ccounts
C O N S O L I D A T E D S T A T E M E N T O F C A S H F L O W
M S E K 1999/2000 1998/1999
Current operations
Income after financial items 392 351
Adjustment for items not included in cash flow Note 25 142 159
534 510
Current taxes –117 –138
Cash flow from current operationsbefore changes in working capital 417 372
Cash flow from changes in working capital:
Change in inventories –53 –60
Change in operating receivables –102 –57
Change in operating liabilities 93 –12
Cash flow from current operations 355 243
Investment operations
Acquisition of subsidiaries and other business units Note 26 –37 –494
Sales of subsidiaries and other business units Note 27 13 7
Acquisition of intangible and tangible fixed assets –129 –128
Sales of intangible and tangible fixed assets 50 24
Cash flow from investment operations –103 –591
Financing operations
Convertible debenture loan raised 101 —
Change in other interest-bearing liabilities –25 364
Dividends paid –115 –115
Cash flow from financing operations –39 249
Cash flow for the year 213 –99
Liquid funds at beginning of year 482 573
Translation difference in liquid funds –12 8
Liquid funds at end of period Note 28 683 482
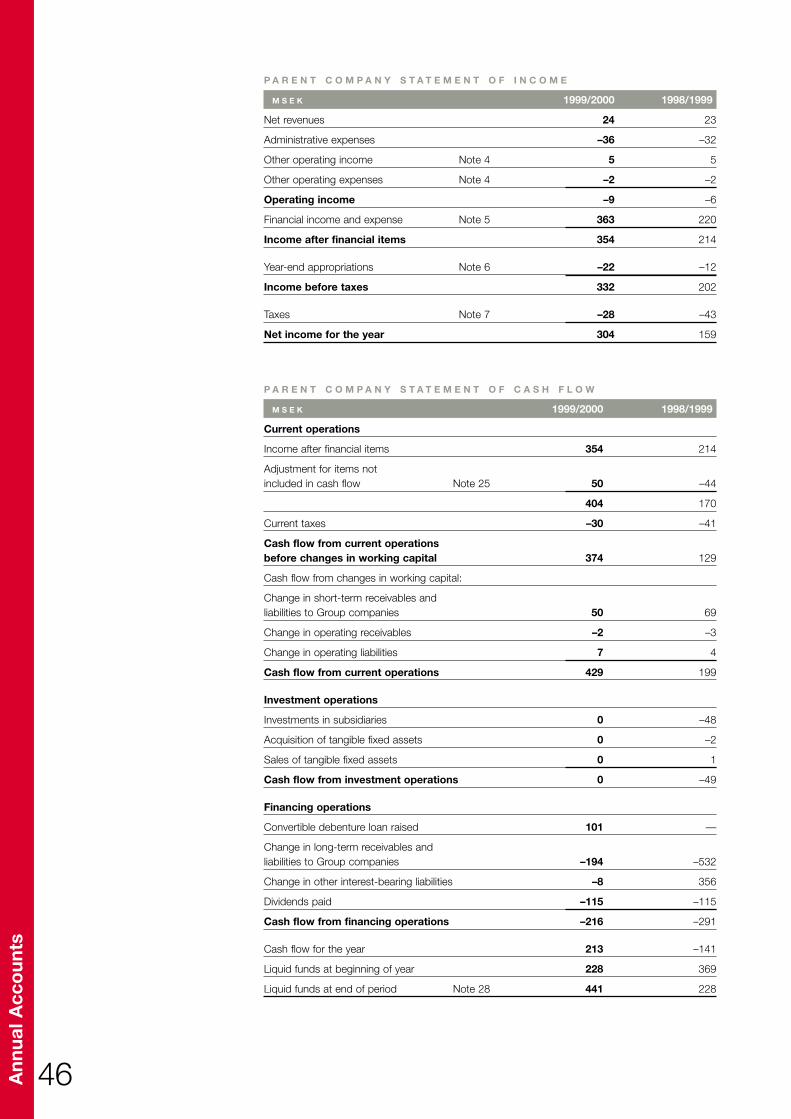
46Ann
ual A
cco
unts
P A R E N T C O M P A N Y S T A T E M E N T O F I N C O M E
M S E K 1999/2000 1998/1999
Net revenues 24 23
Administrative expenses –36 –32
Other operating income Note 4 5 5
Other operating expenses Note 4 –2 –2
Operating income –9 –6
Financial income and expense Note 5 363 220
Income after financial items 354 214
Year-end appropriations Note 6 –22 –12
Income before taxes 332 202
Taxes Note 7 –28 –43
Net income for the year 304 159
P A R E N T C O M P A N Y S T A T E M E N T O F C A S H F L O W
M S E K 1999/2000 1998/1999
Current operations
Income after financial items 354 214
Adjustment for items not included in cash flow Note 25 50 –44
404 170
Current taxes –30 –41
Cash flow from current operationsbefore changes in working capital 374 129
Cash flow from changes in working capital:
Change in short-term receivables and liabilities to Group companies 50 69
Change in operating receivables –2 –3
Change in operating liabilities 7 4
Cash flow from current operations 429 199
Investment operations
Investments in subsidiaries 0 –48
Acquisition of tangible fixed assets 0 –2
Sales of tangible fixed assets 0 1
Cash flow from investment operations 0 –49
Financing operations
Convertible debenture loan raised 101 —
Change in long-term receivables and liabilities to Group companies –194 –532
Change in other interest-bearing liabilities –8 356
Dividends paid –115 –115
Cash flow from financing operations –216 –291
Cash flow for the year 213 –141
Liquid funds at beginning of year 228 369
Liquid funds at end of period Note 28 441 228
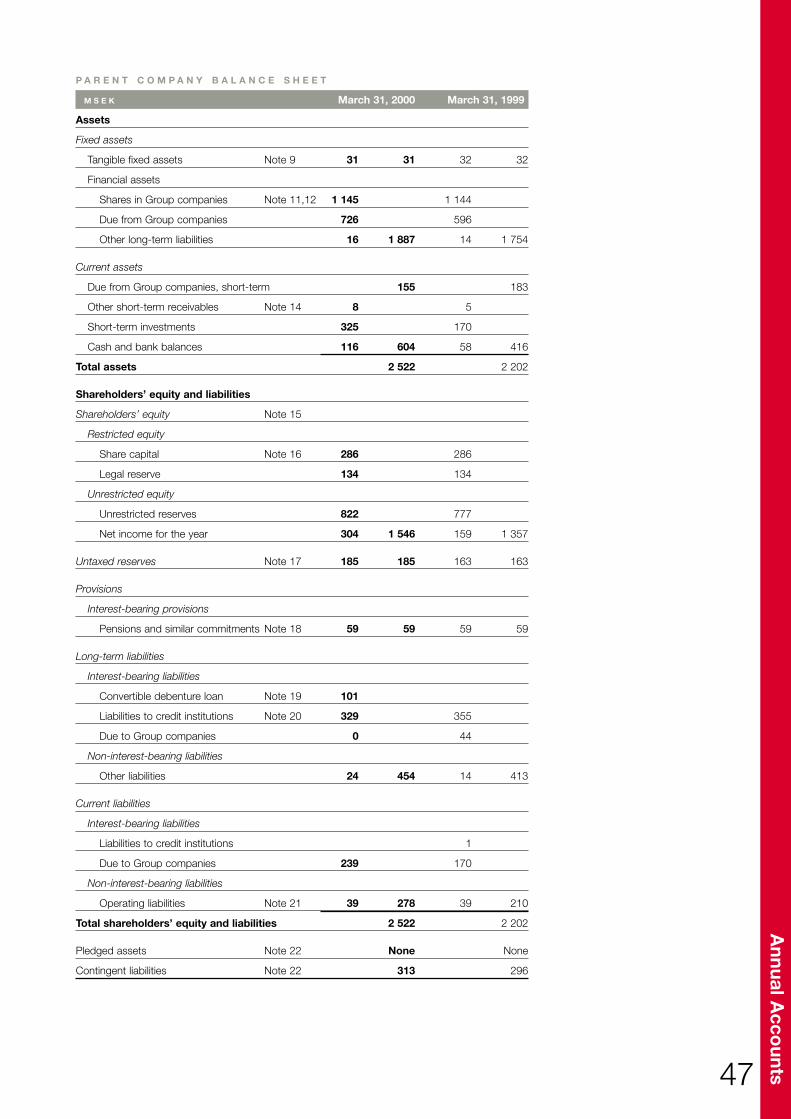
47
Annual A
ccounts
P A R E N T C O M P A N Y B A L A N C E S H E E T
M S E K March 31, 2000 March 31, 1999
Assets
Fixed assets
Tangible fixed assets Note 9 31 31 32 32
Financial assets
Shares in Group companies Note 11,12 1 145 1 144
Due from Group companies 726 596
Other long-term liabilities 16 1 887 14 1 754
Current assets
Due from Group companies, short-term 155 183
Other short-term receivables Note 14 8 5
Short-term investments 325 170
Cash and bank balances 116 604 58 416
Total assets 2 522 2 202
Shareholders’ equity and liabilities
Shareholders’ equity Note 15
Restricted equity
Share capital Note 16 286 286
Legal reserve 134 134
Unrestricted equity
Unrestricted reserves 822 777
Net income for the year 304 1 546 159 1 357
Untaxed reserves Note 17 185 185 163 163
Provisions
Interest-bearing provisions
Pensions and similar commitments Note 18 59 59 59 59
Long-term liabilities
Interest-bearing liabilities
Convertible debenture loan Note 19 101
Liabilities to credit institutions Note 20 329 355
Due to Group companies 0 44
Non-interest-bearing liabilities
Other liabilities 24 454 14 413
Current liabilities
Interest-bearing liabilities
Liabilities to credit institutions 1
Due to Group companies 239 170
Non-interest-bearing liabilities
Operating liabilities Note 21 39 278 39 210
Total shareholders’ equity and liabilities 2 522 2 202
Pledged assets Note 22 None None
Contingent liabilities Note 22 313 296
48Ann
ual A
cco
unts
Comments to the Financial Statements
A C C O U N T I N G P R I N C I P L E S
The Bergman & Beving Group follows the recommendations of the Swedish FinancialAccounting Standards Council.
C O N S O L I D A T E D A C C O U N T I N G
The consolidated financial statements include the Parent Company and all companies inwhich the Parent Company, directly or indirectly, owns more than 50 percent of the vot-ing rights.
The consolidated financial statements have been prepared in accordance with the rec-ommendation of the Swedish Financial Accounting Standards Council on consolidatedaccounting, and with application of the purchase method of accounting. The use of thismethod means that the assets and liabilities of acquired subsidiaries are reported at mar-ket value in accordance with a concurrent acquisition analysis. If the cost of the shares ina subsidiary exceeds the estimated market value of the company's net assets according tothe acquisition analysis, the difference is carried as goodwill in the consolidated balancesheet. Consolidated equity includes the Parent Company's equity and the portion of equi-ty in subsidiaries earned after the time of acquisition.
Companies acquired during the year are included in the consolidated income state-ment with value from the time after the acquisition.
Companies sold during the year are included for the period they have been part of theGroup.
Y E A R - E N D A P P R O P R I A T I O N S A N D U N T A X E D R E S E R V E S
The consolidated income statement and the consolidated balance sheet are reportedwithout year-end appropriations and untaxed reserves.
The year-end appropriations in individual companies have been allocated in such away that the tax portion is included in the Group's tax expense, whereas the remainingportion is included in consolidated net income.
Untaxed reserves have been allocated in such a way that the deferred tax liability isreported as a part of long-term liabilities, whereas the remaining portion is reportedamong restricted reserves.
The deferred tax liability has been estimated individually for each company, as a ruleusing the applicable local tax rate for the following year. If the rate of tax is changed, thedifference in tax liability is reported as a part of the year's tax expense.
G O O D W I L L
Acquiring profitable companies often leads to a situation where the cost of an acquisitionexceeds visible book value. This means that goodwill arises. Goodwill is capitalized andthen amortized over its estimated economic life. In the normal case, goodwill is amortizedover 5 or 10 years. In the case of particularly significant acquisitions, an economic life of20 years may be warranted. The cost of goodwill with respect to the acquisition ofBerendsen will be amortized over 20 years. That period of amortization is warranted dueto the strategic importance of the acquisition and expected coordination gains with exist-ing operations.
If deemed required, a provision is set aside in the form of a restructuring reserve in con-nection with the acquisition analysis for future costs for personnel reductions and re-organization (a so-called restructuring reserve.)
T R A N S L A T I O N O F F O R E I G N S U B S I D I A R I E S
In preparing the consolidated financial statements, foreign subsidiaries are convertedaccording to the current rate method. This means that assets and liabilities are converted
49
Annual A
ccounts
using the year-end rate of exchange, and all items in the income statement are convertedusing the average rate of exchange for the year. Translation differences are carried direct-ly to shareholders' equity without affecting the year's result.
R E C E I V A B L E S A N D L I A B I L I T I E S I N F O R E I G N C U R R E N C Y
Receivables and liabilities in foreign currencies are valued at the rate of exchange pre-vailing at year-end. Translation differences on operating receivables and operating liabil-ities are included in the operating result, while differences relating to financial receivablesand liabilities are reported among financial items. To the extent receivables and liabilitiesin foreign currencies have been hedged, they are translated at the forward rate.
F O R E I G N E X C H A N G E R A T E D I F F E R E N C E S
Foreign exchange rate differences attributable to loans in foreign currency allocated as ahedge of net assets of subsidiaries are reported, after deduction of taxes, directly againstshareholders’ equity, where the corresponding translation difference is also reported.
Foreign exchange rate differences on long-term loans to foreign subsidiaries, which areregarded as an additional investment in the subsidiaries, are accounted for in a similarmanner.
D E P R E C I A T I O N A N D A M O R T I Z A T I O N
Depreciation of tangible assets and amortization of intangible assets are based on theacquisition cost of the relative assets and their estimated economic life. The followingeconomic life spans are applied:
Machinery and equipment 3–5 yearsBuildings 15–100 yearsLand improvements 20 yearsAgency rights and goodwill 5–20 years
I N V E N T O R I E S
Inventories are valued at the lower of cost and market, and the first-in-first-out principleis applied. The risk of obsolescence has been taken into account. The cost of semi-manu-factured goods and finished goods manufactured in-house consists of direct manufacturingcosts, plus a reasonable mark-up for indirect manufacturing costs.
D E F E R R E D T A X E S
Deferred taxes are computed based on the difference between values reported in theGroup and residual values for tax purposes. The calculation is performed without dis-counting and the current tax rate in each respective country is applied. The value of taxloss carryforwards is taken into account to the extent it is deemed more than likely thatthey will result in lower tax payments in the future.
L E A S I N G
Significant financial leasing contracts are reported in the consolidated balance sheet asfixed assets and liabilities, respectively, and in the income statement the leasing cost issplit into operating cost (depreciation) and interest. Other leasing commitments arereported in accordance with the rules for operating leases, which means no reporting inthe balance sheet and the entire cost being treated as operating expense. At present thereare no substantial financial leasing contracts.
Bergman & BevingElectronics A/S
Telefonvej 8 • DK-2860 Søborg • Denmark
Telephone +45-39 57 74 30 • Fax +45-39 57 74 35 • [email protected]
Bergman & BevingIndustry AB
P.O. Box 508 • Parkvägen 2A, 15th floor • SE-169 29 Solna • Sweden
Telephone +46-8-470 49 00 • Fax +46-8-470 49 01 • [email protected]
Bergman & BevingTools AB
P.O. Box 770 • Sidensvansvägen 10 • SE-191 27 Sollentuna • Sweden
Telephone +46-8-623 61 90 • Fax +46-8-623 17 08 • [email protected]
Bergman & BevingMediTech AB
P.O. Box 3176 • Holländargatan 21 A • SE-103 63 Stockholm • Sweden
Telephone +46-8-402 17 50 • Fax +46-8-10 36 00 • [email protected]
Lagercrantz Group AB
P.O. Box 981 • Kung Hans väg 3 • SE-191 29 Sollentuna • Sweden
Telephone +46-8-626 40 00 • Fax +46-8-754 77 59 • [email protected]
Bergman & Beving AB (publ) • P.O. Box 10024 • Karlavägen 76 • SE-100 55 Stockholm • Sweden
Telephone +46-8-660 10 30 • Fax +46-8-660 58 70 • [email protected] • www.bb.se
SE 5560348590