Embed Size (px)
DESCRIPTION
Benzi 2010
Citation preview
7/18/2019 Benzi 2010
http://slidepdf.com/reader/full/benzi-2010 1/17
INVESTIGATION OF HEAT AND MASS TRANSFER INA LID-DRIVEN CAVITY UNDER NONEQUILIBRIUMFLOW CONDITIONS
Benzi John, Xiao-Jun Gu, and David R. EmersonComputational Science and Engineering Department, STFC Daresbury
Laboratory, Warrington, United Kingdom
Gaseous flow and heat transfer in a lid-driven cavity under nonequilibrium flow conditions
is investigated using the direct simulation Monte Carlo method, from the slip to the
free-molecular regime. The emphasis is on understanding thermal flow features. The impact
of the lid velocity and various degrees of rarefaction on the shear stress and heat flux rates
are analyzed. The role of expansion cooling and viscous dissipation on the heat transfer
mechanism is investigated. Complex heat flow phenomena, such as counter-gradient heat
transfer, are revealed by the simulations which the conventional Navier-Stokes-Fourier
equations are not able to capture, even in the slip-flow regime.
1. INTRODUCTION
Fluid flow at the micro- and nanoscale has received considerable attention dueto the advent of miniaturization and advances in fabrication technology. A basicunderstanding of the nature of flow in these devices is considered essential for anefficient design. It is well known that the Navier-Stokes-Fourier (NSF) equationscannot accurately describe gaseous flow under rarefied conditions [1, 2], especiallyin the transition regime and beyond. The degree of rarefaction can be describedby the Knudsen number (Kn), which relates the mean free path of the gas to acharacteristic length scale of a device and is commonly used to understand the dif-ferent flow regimes that micro-electro-mechanical Systems (MEMS) will encounter.
Unlike high-altitude and vacuum devices, where the low density conditions lead to amean free path of the order of meters (and correspondingly high Kn), these rarefac-tion effects are present under standard atmospheric (STP) conditions. The mean freepath of air at STP is about 100 nm, and the rarefied flow conditions that occur inMEMS are generally caused by the extremely small geometric dimensions involved.
Various macroscopic modeling techniques have been developed over the years[3–5] with a view to capturing nonequilibrium flows accurately, especially in the tran-sition regime (Kn> 0.1). This includes the various well-known slip-based models, the
Received 22 April 2010; accepted 6 September 2010.
The authors would like to thank the Engineering and Physical Sciences Research Council (EPSRC)
for their support of Collaborative Computational Project 12 (CCP12).
Address correspondence to Benzi John, Computational Science and Engineering Department,
STFC Daresbury Laboratory, Warrington WA4 4AD, United Kingdom. E-mail: [email protected]
Numerical Heat Transfer, Part B , 58: 287–303, 2010
Copyright # Taylor & Francis Group, LLCISSN: 1040-7790 print=1521-0626 online
DOI: 10.1080/10407790.2010.528737
287
7/18/2019 Benzi 2010
http://slidepdf.com/reader/full/benzi-2010 2/17
method of moments, and the Burnett equations. The NSF equations, modified withvarious velocity-slip and temperature-jump boundary conditions, are able to capturecertain flow features in the slip regime (0.001Kn 0.1). Another modelingapproach is the method of moments, which was originally developed by Grad [4]as a 13-moment equation model and was used initially for modeling hypersonicflows. Significant progress has been made with regard to the method of moments
in modeling nonequilibrium flow in microgeometries [6–9]. Recent studies show thatthe method is able to capture several well-known nonequilibrium phenomena, suchas the bimodal temperature profile in force-driven Poiseuille flow, nongradient heatflux in Couette flow, and the Knudsen minimum. Although other high-order models,such as the Burnett equations, can provide improved solutions in the transitionregion, they have also been shown to have severe limitations [10, 11].
An important motivation for developing alternative modeling strategies is com-putational efficiency and, while the foregoing methods can provide good approxima-tions, they have only been tested and validated against relatively simple problemssuch as Couette, Poiseuille, and Rayleigh flows or for cases involving comparatively
small flow and temperature gradients. In addition, it is unlikely that these approacheswill be able to provide accurate solutions in the upper transition regime (Kn 1),especially in complex geometries. The direct simulation Monte Carlo (DSMC)method is an excellent alternative approach, and the method has been widelyemployed for modeling gaseous flows under nonequilibrium flow conditions. TheDSMC method, originally developed by Bird [12], is a physical model which is basedon the discrete molecular nature of the system, essentially capturing the physics of adilute gas governed by the Boltzmann equation. Applications of the DSMC methodrange from simulation of hypersonic flow problems in the upper atmosphere, such asreentry vehicles, orbital vehicles, etc., to simulation of low-speed gas flows in devices
at the micro- and nanoscale. The method is able to predict flow and heat transferaspects in all flow regimes accurately and is therefore considered to be the mostreliable approach for rarefied gas simulations. However, for an accurate simulation,
NOMENCLATURE
d particle diameter, m
Kn Knudsen number (¼k=L)L characteristic length of device, mm particle mass, kg
Ma Mach number ð¼ U w= ffiffiffiffiffiffiffiffiffifficRT
p ÞP pressure, N=m2
P 0 reference pressure, N=m2
qx heat flux in the x direction,
W=m2
q0 reference heat flux, W=m2
R specific gas constant, J=kg K
Re Reynolds number (¼qU wL=m)s distance along the cavity walls, mT gas temperature, KT w wall temperature, KT 0 reference temperature, K
u velocity of gas in the x direction, m=s
U w wall velocity, m=sv velocity of gas in the y direction, m=sV mp most probable molecular velocity
ð¼ ffiffiffiffiffiffiffiffiffiffi2RT
p Þ, m=sc specific heat ratio
k mean free path, mm dynamic viscosity, N s=m2
q density, kg=m3
rxy shear stress, N=m2
Subscripts
x, y coordinates x and y
0 reference value
w wall quantitymp most probable value
288 B. JOHN ET AL.
7/18/2019 Benzi 2010
http://slidepdf.com/reader/full/benzi-2010 3/17
there are constraints with regard to the cell size, time step, and number of particles percell that need to be strictly adhered to, which makes the DSMC method inherentlycomputationally intensive in nature. Additionally, statistical noise is relatively highat low flow speeds, a typical situation for MEMS. In such instances, the number of particles and the sampling period needed to minimize the statistical noise is high.The DSMC method can be readily parallelized, and high-fidelity solutions can beachieved with the aid of parallelization techniques, as adopted in the current study.
Studies of the driven cavity problem have generally been limited to continuumflows [13, 14], wherein the problem is often considered to be a benchmark problemfor validation. In the present work, however, the DSMC method is used to investi-gate rarefied flow and heat transfer characteristics of a driven microcavity. Theclassical shear-driven (Couette) and pressure-driven (Poiseuille) rarefied flows havebeen studied extensively [15–19] in the literature. In addition, the effects of rarefac-tion and compressibility on flows in two-dimensional microchannels have been inves-tigated by Sun and Faghri [20]. Gaseous flow and heat transfer in square cavityenclosures that represent vacuum-packaged MEMS devices have been studied byLiu et al. [21] and Cai [22], and the driven cavity problem was also examined withthe aid of the lattice Boltzmann method by Nie et al. [23]. Rarefaction effects wererecently investigated by Naris and Valougeorgis [24], who used a linearizedBhatnagar-Gross-Krook (BGK) kinetic equation to investigate the flow aspects of a driven cavity over the whole Knudsen number range. More recently, Mizzi et al.[25] showed comparisons between the NSF equations and the DSMC method forthe driven cavity problem in the slip-flow regime. However, heat transfer character-istics were not considered and are in paucity in the literature. Heat transfer under
rarefied flow conditions could depend on a combination of various flow factors suchas thermal creep, viscous dissipation, compressibility, etc., which conventional flowmodels cannot reliably predict. Accurate simulations of nonequilibrium heat transfercan give critical information to designers toward understanding the thermal charac-teristics and in determining the cooling strategies of micro- and nanodevices. In thepresent work, rarefied gaseous flow in a lid-driven microcavity is investigated usingthe DSMC method for a wide range of flow speeds and Knudsen number. In parti-cular, the focus has been on understanding heat transfer in the cavity under variousnonequilibrium flow conditions.
2. DSMC SIMULATION METHOD
DSMC is a particle method based on kinetic theory for the simulation of dilutegases. A detailed explanation of the steps involved in the DSMC method can befound in Bird [12]. The evolution of molecules is determined by tracking their posi-tions and velocities. Starting from a set of initial conditions, the flow develops in aphysically realistic manner by evaluating the collisions between the particles andinteractions of the particles with solid bodies and inflow=outflow boundaries. In con-trast to molecular dynamics (MD), the exact trajectory of each particle is not calcu-lated in DSMC; instead, a stochastic algorithm is used to evaluate the collision
probabilities and scattering distributions based on kinetic theory. As the time stepin DSMC simulations is much smaller than the mean collision time, collisionsbetween particles can be decoupled from the positional changes of the particle for
NONEQUILIBRIUM HEAT AND MASS TRANSFER 289

7/18/2019 Benzi 2010
http://slidepdf.com/reader/full/benzi-2010 4/17
each time step; i.e., the particles are moved as if they do not interact and collision isconsidered only after all the particles have moved during the time step.
All the simulations in the present study are performed with a validated parallelDSMC code originally developed for understanding microflow in a head-disk inter-face (HDI) gap [26–28]. In addition to the early validation for the HDI case, the codehas also been independently validated against simulated data from other DSMCcodes for planar Couette flow [8] and force-driven Poiseuille flow [19]. For all theflow calculations, the gaseous medium is assumed to consist of monatomic moleculescorresponding to that of argon, with mass m¼ 6.63 1026 kg. The variable hardsphere (VHS) collision model [12] has been used with a reference particle diameterof d ¼ 4.17 1010 m. The VHS model has been employed because it can reproduceaccurately the variation of viscosity with temperature by treating the cross section of the molecules as a function of the relative translational energy. The particle–wallinteractions are assumed to be inelastic and follow the diffuse reflection model withfull thermal accommodation. The general guidelines that need to be followed for anaccurate DSMC simulation are that the linear cell dimension, Dx, be less than themean free path, and that the time step be less than the mean collision time whileat the same time having about 20–30 particles per cell, as found in Bird [12]. Theerror in transport coefficients as a function of cell size and time step has been rigor-ously derived by Alexander et al. [29] and Hadjiconstantinou [30]. The statisticalerror associated with the number of particles per cell and the sampling period in par-ticle simulations has been characterized by Hadjiconstantinou et al. [31]. In thepresent work, all the guidelines have been rigorously followed to ensure the accuracyof the computed flow results. The cell size used in the present study is, at most, 0.3
times the mean free path, and in most cases is much smaller than that. The time stepfor all the DSMC simulations is taken to be five times smaller than Dx=V mp, whereDx is the smallest cell dimension and V mp is the most probable molecular velocity. Tominimize statistical noise, about 200 particles per cell have been employed in thepresent work. The flow variables are computed as moments, which are derived asaverages during the sampling phase once the system attains a steady state. In thepresent study, sampling is carried out over a period of 3 million time steps afterthe system has reached a steady state.
3. RESULTS AND DISCUSSION
The configuration of the square driven cavity, of size L, is shown in Figure 1.The notations A, B, C, and D shown in the figure denote the four corners of thecavity. The top lid moves with a fixed tangential velocity U w in the positive x direc-tion, and the other walls are stationary. The wall temperature is set to the referencetemperature, i.e., T w¼T 0¼ 273 K. Any variation in Knudsen number is achieved bychanging the density conditions in the cavity, i.e., the reference pressure P 0, at whichthe simulation is carried out, differs for each Kn. The mean free path k is defined asin Eq. (1),
k ¼ m
P 0
ffiffiffiffiffiffiffiffiffiffiffiffipRT 0
2
r ð1Þ
290 B. JOHN ET AL.

7/18/2019 Benzi 2010
http://slidepdf.com/reader/full/benzi-2010 5/17
where m is the viscosity of the gas based on the reference temperature. Computationshave been carried out over a range of lid velocities and various degrees of non-equilibrium flow conditions quantified by the Knudsen number. The impact of lidvelocity and Knudsen number on the flow and, in particular, on the heat transfercharacteristics in the cavity are investigated.
3.1. Impact of Lid Velocity on Flow and Heat Transfer
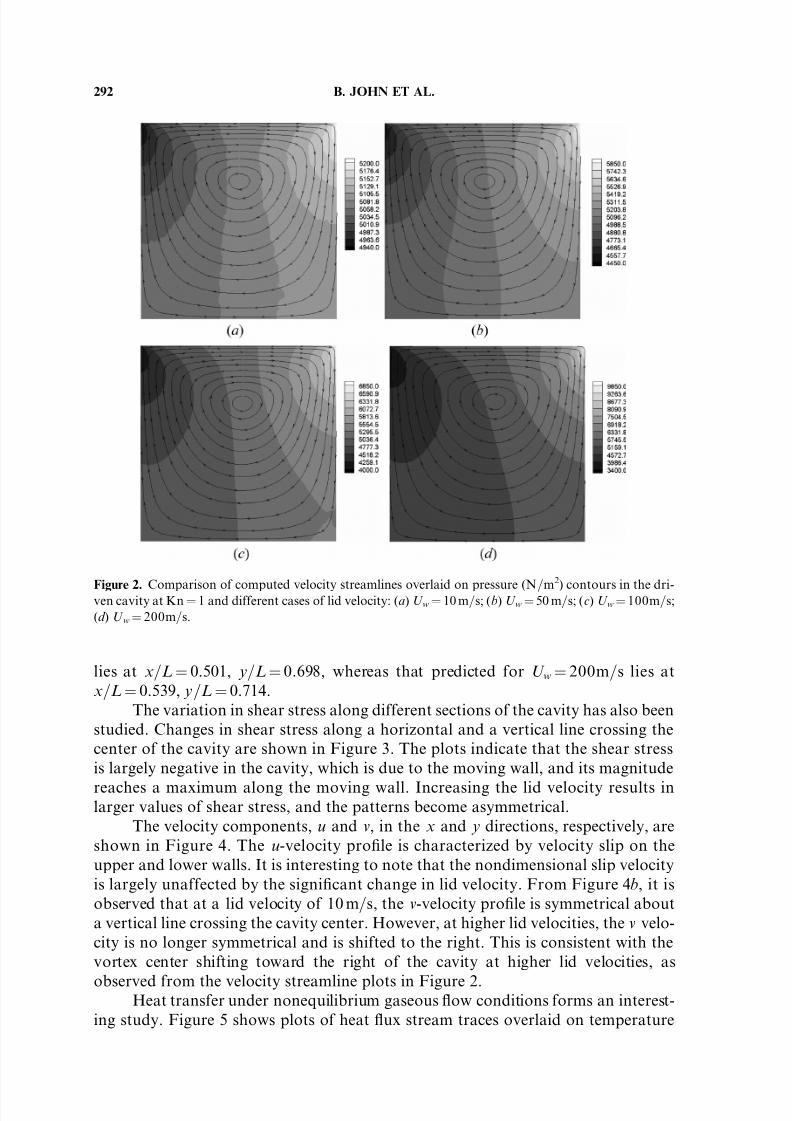
To assess the flow and heat transfer in the cavity we have considered four dif-ferent lid velocities, i.e., U w¼ 10, 50, 100, and 200 m=s. These correspond to Machnumbers of 0.032, 0.16, 0.32, and 0.64, and to Reynolds numbers of about 1, 5,10, and 20, respectively. The Knudsen number is kept fixed for all the cases in thispart of the study, i.e., Kn ¼ 1. Figure 2 shows the computed velocity streamlinessuperimposed on pressure contours in the cavity for the different cases considered.From the contours, it is observed that a significant drop in pressure is seen toward
the top left corner of the cavity, whereas a significant rise in pressure is observedtoward the top right corner of the cavity. This can be attributed to the expansionof gas at the top left corner as it is driven by the moving lid, whereas it is compressedat the opposite end. At 10 m=s, significant variation in pressure is observed only atthe top corners of the cavity, while in the larger portion of the domain the pressureessentially remains constant. With an increase in lid velocity, the pressure contours inthe cavity are no longer symmetrical and significant variations in pressure areobserved throughout the cavity. The drop and rise in pressure observed at the topcorners of the cavity for the higher-velocity cases are more pronounced. A compari-son of the computed velocity streamlines for the different cases considered in Figure 2
indicates that the streamlines become asymmetrical with increasing lid velocity. As thelid velocity increases, the vortex center is shifted toward the right and also slightlyupward toward the moving wall. The vortex center computed for U w¼ 10 m=s
Figure 1. Configuration of driven cavity flow problem.
NONEQUILIBRIUM HEAT AND MASS TRANSFER 291
7/18/2019 Benzi 2010
http://slidepdf.com/reader/full/benzi-2010 6/17
lies at x=L¼ 0.501, y=L¼ 0.698, whereas that predicted for U w¼ 200m=s lies atx=L¼ 0.539, y=L¼ 0.714.
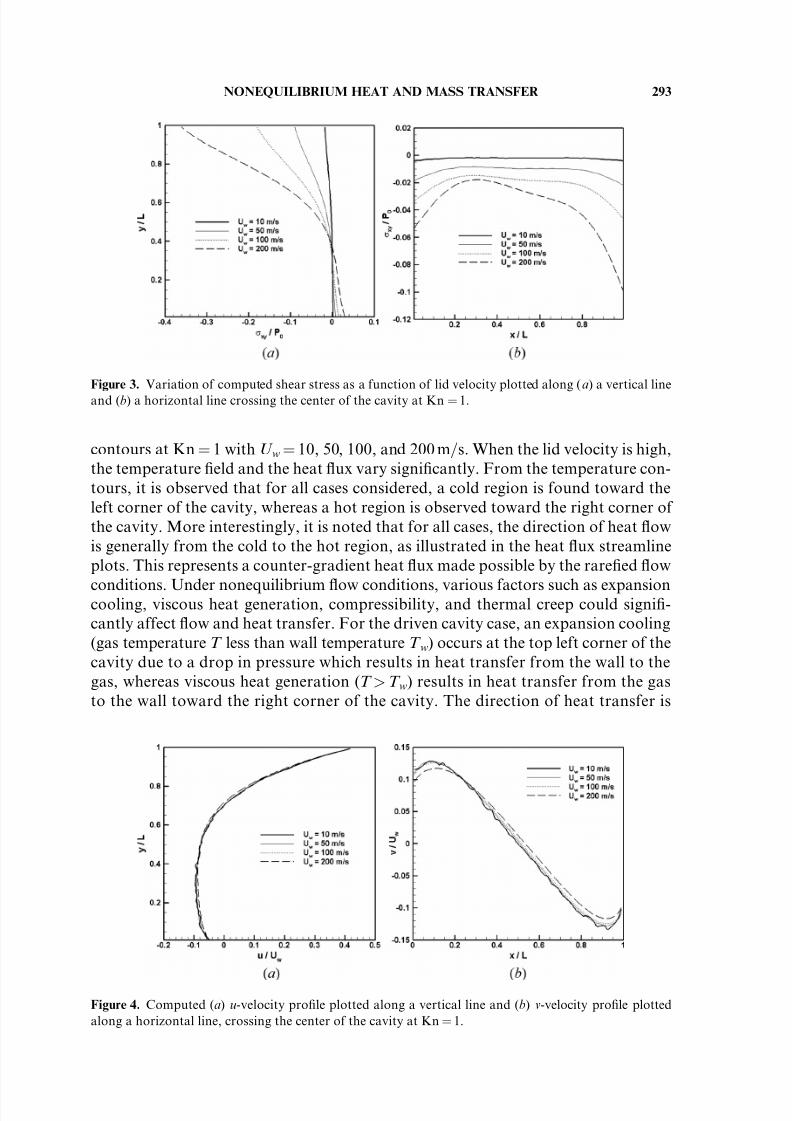
The variation in shear stress along different sections of the cavity has also beenstudied. Changes in shear stress along a horizontal and a vertical line crossing thecenter of the cavity are shown in Figure 3. The plots indicate that the shear stressis largely negative in the cavity, which is due to the moving wall, and its magnitude
reaches a maximum along the moving wall. Increasing the lid velocity results inlarger values of shear stress, and the patterns become asymmetrical.
The velocity components, u and v, in the x and y directions, respectively, areshown in Figure 4. The u-velocity profile is characterized by velocity slip on theupper and lower walls. It is interesting to note that the nondimensional slip velocityis largely unaffected by the significant change in lid velocity. From Figure 4b, it isobserved that at a lid velocity of 10 m=s, the v-velocity profile is symmetrical abouta vertical line crossing the cavity center. However, at higher lid velocities, the v velo-city is no longer symmetrical and is shifted to the right. This is consistent with thevortex center shifting toward the right of the cavity at higher lid velocities, as
observed from the velocity streamline plots in Figure 2.Heat transfer under nonequilibrium gaseous flow conditions forms an interest-
ing study. Figure 5 shows plots of heat flux stream traces overlaid on temperature
Figure 2. Comparison of computed velocity streamlines overlaid on pressure (N=m2
) contours in the dri-ven cavity at Kn¼ 1 and different cases of lid velocity: (a) U w¼ 10 m=s; (b) U w¼ 50 m=s; (c) U w¼ 100m=s;(d ) U w¼ 200m=s.
292 B. JOHN ET AL.
7/18/2019 Benzi 2010
http://slidepdf.com/reader/full/benzi-2010 7/17
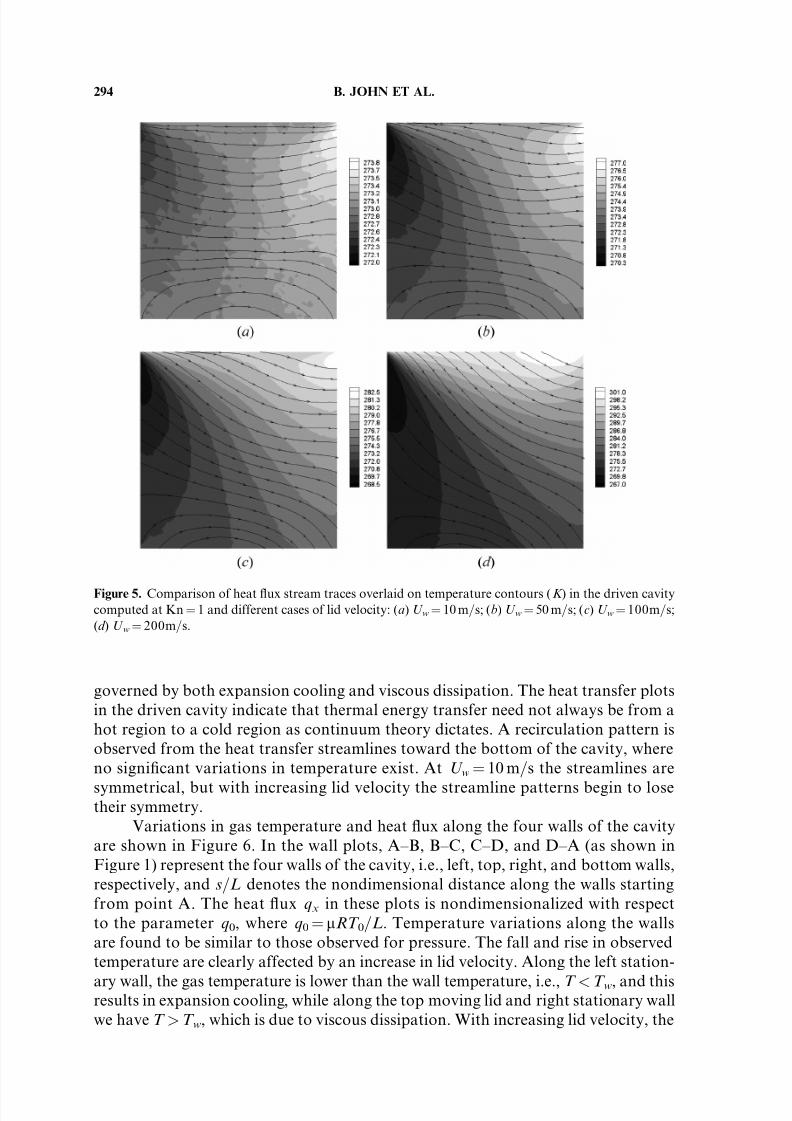
contours at Kn¼ 1 with U w¼ 10, 50, 100, and 200 m=s. When the lid velocity is high,the temperature field and the heat flux vary significantly. From the temperature con-tours, it is observed that for all cases considered, a cold region is found toward theleft corner of the cavity, whereas a hot region is observed toward the right corner of the cavity. More interestingly, it is noted that for all cases, the direction of heat flowis generally from the cold to the hot region, as illustrated in the heat flux streamlineplots. This represents a counter-gradient heat flux made possible by the rarefied flow
conditions. Under nonequilibrium flow conditions, various factors such as expansioncooling, viscous heat generation, compressibility, and thermal creep could signifi-cantly affect flow and heat transfer. For the driven cavity case, an expansion cooling(gas temperature T less than wall temperature T w) occurs at the top left corner of thecavity due to a drop in pressure which results in heat transfer from the wall to thegas, whereas viscous heat generation (T >T w) results in heat transfer from the gasto the wall toward the right corner of the cavity. The direction of heat transfer is
Figure 4. Computed (a) u-velocity profile plotted along a vertical line and (b) v-velocity profile plotted
along a horizontal line, crossing the center of the cavity at Kn¼ 1.
Figure 3. Variation of computed shear stress as a function of lid velocity plotted along (a) a vertical lineand (b) a horizontal line crossing the center of the cavity at Kn ¼ 1.
NONEQUILIBRIUM HEAT AND MASS TRANSFER 293
7/18/2019 Benzi 2010
http://slidepdf.com/reader/full/benzi-2010 8/17
governed by both expansion cooling and viscous dissipation. The heat transfer plotsin the driven cavity indicate that thermal energy transfer need not always be from ahot region to a cold region as continuum theory dictates. A recirculation pattern isobserved from the heat transfer streamlines toward the bottom of the cavity, whereno significant variations in temperature exist. At U w
¼10 m=s the streamlines are
symmetrical, but with increasing lid velocity the streamline patterns begin to losetheir symmetry.
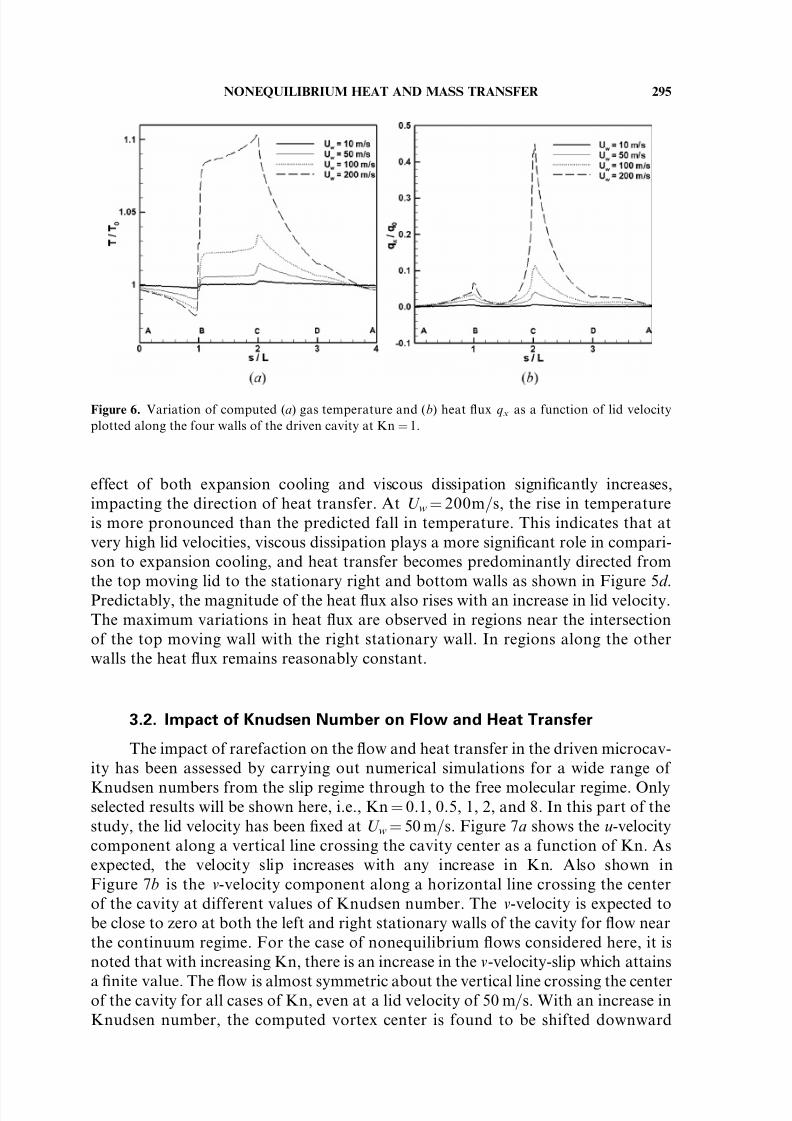
Variations in gas temperature and heat flux along the four walls of the cavityare shown in Figure 6. In the wall plots, A–B, B–C, C–D, and D–A (as shown inFigure 1) represent the four walls of the cavity, i.e., left, top, right, and bottom walls,respectively, and s=L denotes the nondimensional distance along the walls startingfrom point A. The heat flux qx in these plots is nondimensionalized with respectto the parameter q0, where q0¼ mRT 0=L. Temperature variations along the wallsare found to be similar to those observed for pressure. The fall and rise in observedtemperature are clearly affected by an increase in lid velocity. Along the left station-
ary wall, the gas temperature is lower than the wall temperature, i.e., T <T w, and thisresults in expansion cooling, while along the top moving lid and right stationary wallwe have T >T w, which is due to viscous dissipation. With increasing lid velocity, the
Figure 5. Comparison of heat flux stream traces overlaid on temperature contours ( K ) in the driven cavitycomputed at Kn¼ 1 and different cases of lid velocity: (a) U w¼ 10 m=s; (b) U w¼ 50 m=s; (c) U w¼ 100m=s;(d ) U w¼ 200m=s.
294 B. JOHN ET AL.
7/18/2019 Benzi 2010
http://slidepdf.com/reader/full/benzi-2010 9/17
effect of both expansion cooling and viscous dissipation significantly increases,impacting the direction of heat transfer. At U w¼ 200m=s, the rise in temperatureis more pronounced than the predicted fall in temperature. This indicates that atvery high lid velocities, viscous dissipation plays a more significant role in compari-son to expansion cooling, and heat transfer becomes predominantly directed from
the top moving lid to the stationary right and bottom walls as shown in Figure 5d .Predictably, the magnitude of the heat flux also rises with an increase in lid velocity.The maximum variations in heat flux are observed in regions near the intersectionof the top moving wall with the right stationary wall. In regions along the otherwalls the heat flux remains reasonably constant.
3.2. Impact of Knudsen Number on Flow and Heat Transfer
The impact of rarefaction on the flow and heat transfer in the driven microcav-ity has been assessed by carrying out numerical simulations for a wide range of
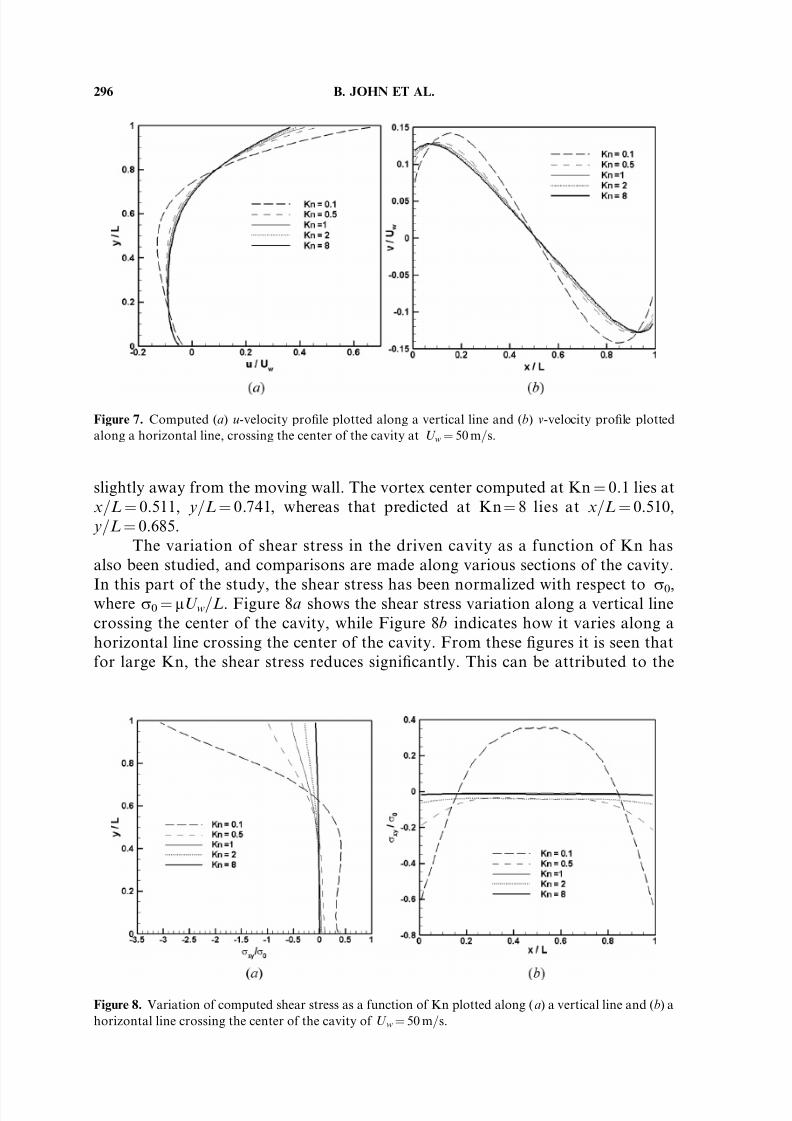
Knudsen numbers from the slip regime through to the free molecular regime. Onlyselected results will be shown here, i.e., Kn¼ 0.1, 0.5, 1, 2, and 8. In this part of thestudy, the lid velocity has been fixed at U w¼ 50 m=s. Figure 7a shows the u-velocitycomponent along a vertical line crossing the cavity center as a function of Kn. Asexpected, the velocity slip increases with any increase in Kn. Also shown inFigure 7b is the v-velocity component along a horizontal line crossing the centerof the cavity at different values of Knudsen number. The v-velocity is expected tobe close to zero at both the left and right stationary walls of the cavity for flow nearthe continuum regime. For the case of nonequilibrium flows considered here, it isnoted that with increasing Kn, there is an increase in the v-velocity-slip which attains
a finite value. The flow is almost symmetric about the vertical line crossing the centerof the cavity for all cases of Kn, even at a lid velocity of 50 m=s. With an increase inKnudsen number, the computed vortex center is found to be shifted downward
Figure 6. Variation of computed (a) gas temperature and (b) heat flux qx as a function of lid velocity
plotted along the four walls of the driven cavity at Kn ¼ 1.
NONEQUILIBRIUM HEAT AND MASS TRANSFER 295
7/18/2019 Benzi 2010
http://slidepdf.com/reader/full/benzi-2010 10/17
slightly away from the moving wall. The vortex center computed at Kn ¼ 0.1 lies atx=L¼ 0.511, y=L¼ 0.741, whereas that predicted at Kn¼ 8 lies at x=L¼ 0.510, y=L¼ 0.685.
The variation of shear stress in the driven cavity as a function of Kn hasalso been studied, and comparisons are made along various sections of the cavity.
In this part of the study, the shear stress has been normalized with respect to r0,where r0¼ mU w=L. Figure 8a shows the shear stress variation along a vertical linecrossing the center of the cavity, while Figure 8b indicates how it varies along ahorizontal line crossing the center of the cavity. From these figures it is seen thatfor large Kn, the shear stress reduces significantly. This can be attributed to the
Figure 7. Computed (a) u-velocity profile plotted along a vertical line and (b) v-velocity profile plottedalong a horizontal line, crossing the center of the cavity at U w¼ 50 m=s.
Figure 8. Variation of computed shear stress as a function of Kn plotted along (a) a vertical line and (b) a
horizontal line crossing the center of the cavity of U w¼ 50 m=s.
296 B. JOHN ET AL.
7/18/2019 Benzi 2010
http://slidepdf.com/reader/full/benzi-2010 11/17
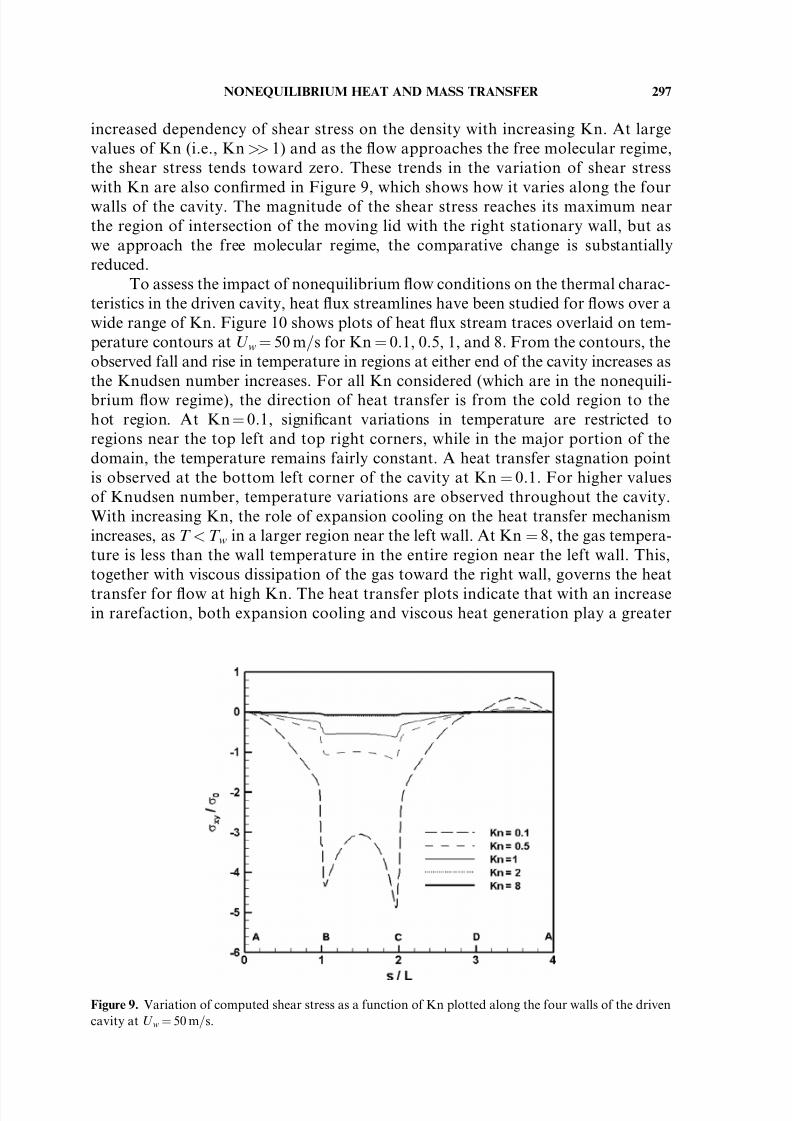
increased dependency of shear stress on the density with increasing Kn. At largevalues of Kn (i.e., Kn>> 1) and as the flow approaches the free molecular regime,the shear stress tends toward zero. These trends in the variation of shear stresswith Kn are also confirmed in Figure 9, which shows how it varies along the fourwalls of the cavity. The magnitude of the shear stress reaches its maximum nearthe region of intersection of the moving lid with the right stationary wall, but aswe approach the free molecular regime, the comparative change is substantiallyreduced.
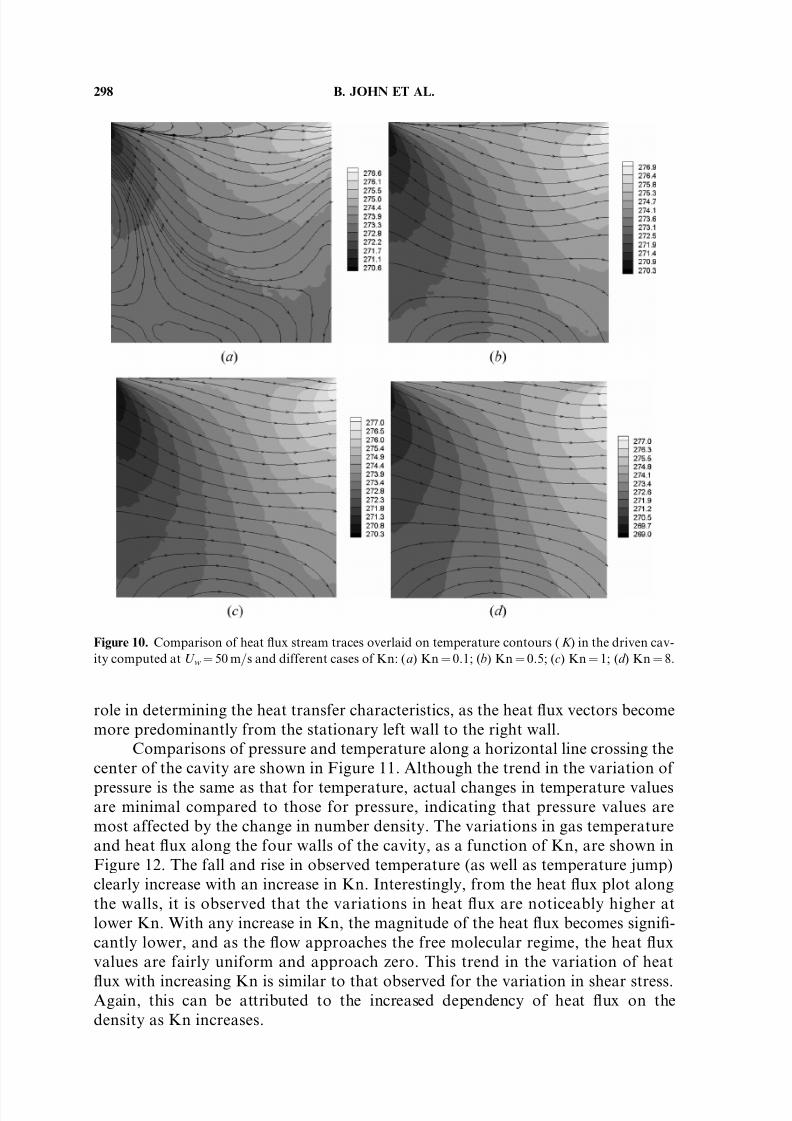
To assess the impact of nonequilibrium flow conditions on the thermal charac-teristics in the driven cavity, heat flux streamlines have been studied for flows over awide range of Kn. Figure 10 shows plots of heat flux stream traces overlaid on tem-perature contours at U w¼ 50 m=s for Kn¼ 0.1, 0.5, 1, and 8. From the contours, theobserved fall and rise in temperature in regions at either end of the cavity increases asthe Knudsen number increases. For all Kn considered (which are in the nonequili-brium flow regime), the direction of heat transfer is from the cold region to thehot region. At Kn¼ 0.1, significant variations in temperature are restricted toregions near the top left and top right corners, while in the major portion of thedomain, the temperature remains fairly constant. A heat transfer stagnation pointis observed at the bottom left corner of the cavity at Kn ¼ 0.1. For higher valuesof Knudsen number, temperature variations are observed throughout the cavity.With increasing Kn, the role of expansion cooling on the heat transfer mechanismincreases, as T <T w in a larger region near the left wall. At Kn ¼ 8, the gas tempera-ture is less than the wall temperature in the entire region near the left wall. This,together with viscous dissipation of the gas toward the right wall, governs the heat
transfer for flow at high Kn. The heat transfer plots indicate that with an increasein rarefaction, both expansion cooling and viscous heat generation play a greater
Figure 9. Variation of computed shear stress as a function of Kn plotted along the four walls of the driven
cavity at U w¼ 50 m=s.
NONEQUILIBRIUM HEAT AND MASS TRANSFER 297
7/18/2019 Benzi 2010
http://slidepdf.com/reader/full/benzi-2010 12/17
role in determining the heat transfer characteristics, as the heat flux vectors becomemore predominantly from the stationary left wall to the right wall.
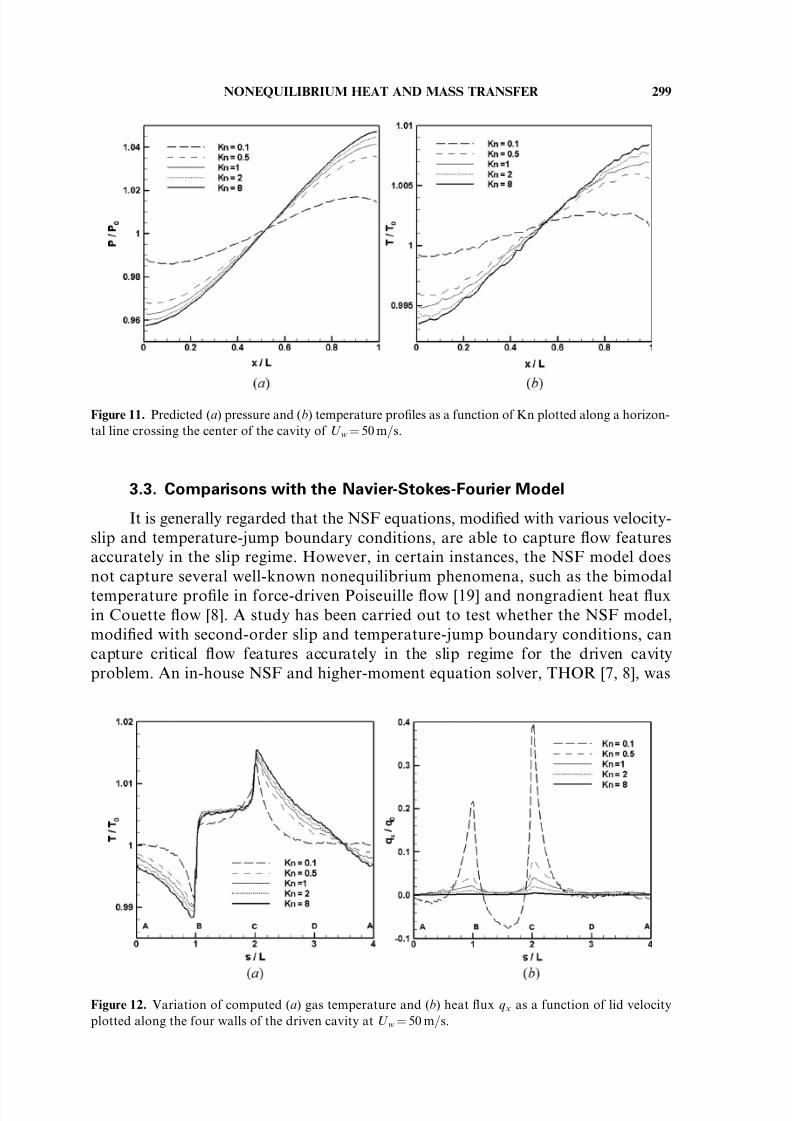
Comparisons of pressure and temperature along a horizontal line crossing thecenter of the cavity are shown in Figure 11. Although the trend in the variation of
pressure is the same as that for temperature, actual changes in temperature valuesare minimal compared to those for pressure, indicating that pressure values aremost affected by the change in number density. The variations in gas temperatureand heat flux along the four walls of the cavity, as a function of Kn, are shown inFigure 12. The fall and rise in observed temperature (as well as temperature jump)clearly increase with an increase in Kn. Interestingly, from the heat flux plot alongthe walls, it is observed that the variations in heat flux are noticeably higher atlower Kn. With any increase in Kn, the magnitude of the heat flux becomes signifi-cantly lower, and as the flow approaches the free molecular regime, the heat fluxvalues are fairly uniform and approach zero. This trend in the variation of heat
flux with increasing Kn is similar to that observed for the variation in shear stress.Again, this can be attributed to the increased dependency of heat flux on thedensity as Kn increases.
Figure 10. Comparison of heat flux stream traces overlaid on temperature contours ( K ) in the driven cav-
ity computed at U w¼ 50 m=s and different cases of Kn: (a) Kn¼0.1; (b) Kn¼ 0.5; (c) Kn¼ 1; (d ) Kn¼ 8.
298 B. JOHN ET AL.
7/18/2019 Benzi 2010
http://slidepdf.com/reader/full/benzi-2010 13/17
3.3. Comparisons with the Navier-Stokes-Fourier Model
It is generally regarded that the NSF equations, modified with various velocity-slip and temperature-jump boundary conditions, are able to capture flow featuresaccurately in the slip regime. However, in certain instances, the NSF model doesnot capture several well-known nonequilibrium phenomena, such as the bimodaltemperature profile in force-driven Poiseuille flow [19] and nongradient heat fluxin Couette flow [8]. A study has been carried out to test whether the NSF model,modified with second-order slip and temperature-jump boundary conditions, cancapture critical flow features accurately in the slip regime for the driven cavityproblem. An in-house NSF and higher-moment equation solver, THOR [7, 8], was
Figure 11. Predicted (a) pressure and (b) temperature profiles as a function of Kn plotted along a horizon-tal line crossing the center of the cavity of U w¼ 50 m=s.
Figure 12. Variation of computed (a) gas temperature and (b) heat flux qx as a function of lid velocity
plotted along the four walls of the driven cavity at U w¼ 50 m=s.
NONEQUILIBRIUM HEAT AND MASS TRANSFER 299
7/18/2019 Benzi 2010
http://slidepdf.com/reader/full/benzi-2010 14/17
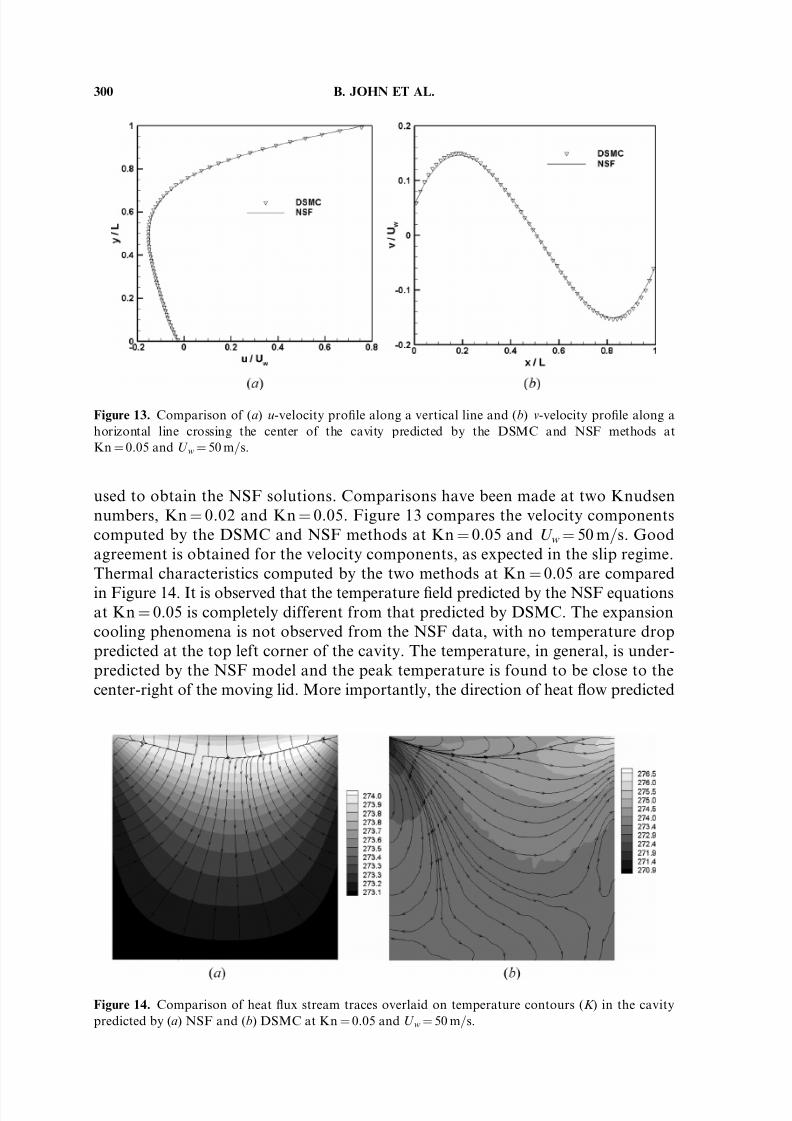
used to obtain the NSF solutions. Comparisons have been made at two Knudsennumbers, Kn¼ 0.02 and Kn¼ 0.05. Figure 13 compares the velocity componentscomputed by the DSMC and NSF methods at Kn ¼ 0.05 and U w¼ 50 m=s. Goodagreement is obtained for the velocity components, as expected in the slip regime.Thermal characteristics computed by the two methods at Kn
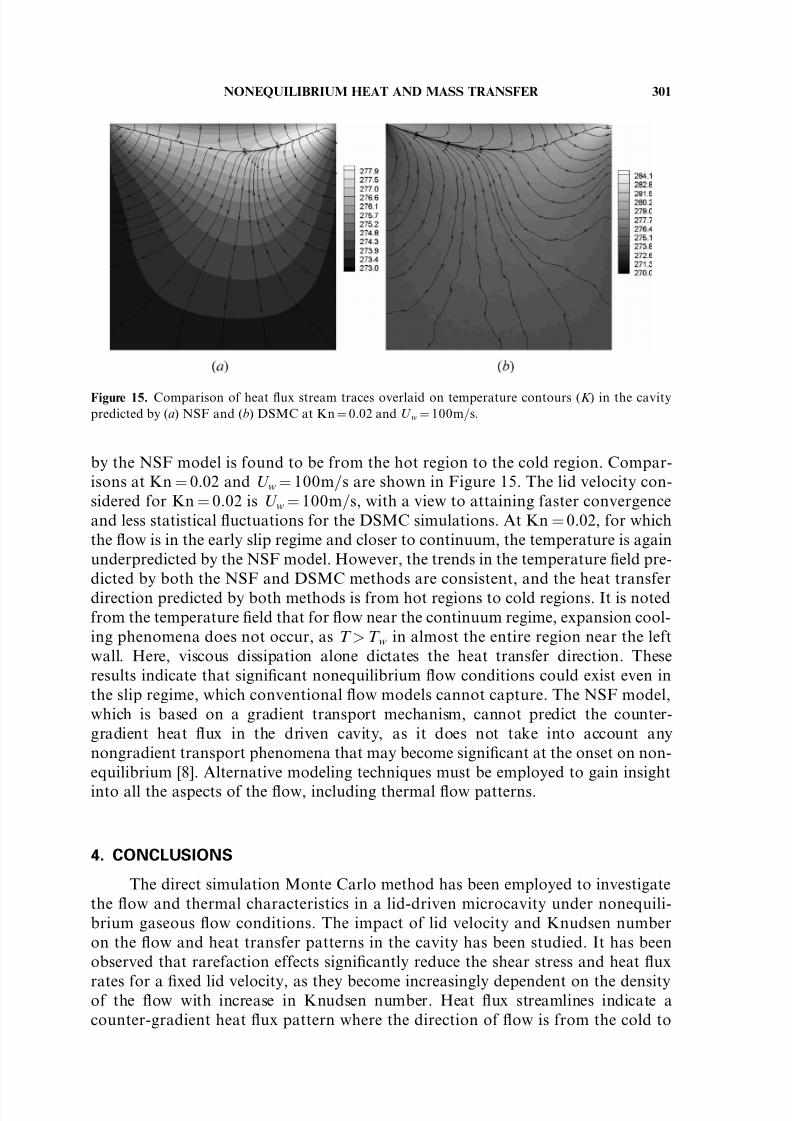
¼0.05 are compared
in Figure 14. It is observed that the temperature field predicted by the NSF equationsat Kn¼ 0.05 is completely different from that predicted by DSMC. The expansioncooling phenomena is not observed from the NSF data, with no temperature droppredicted at the top left corner of the cavity. The temperature, in general, is under-predicted by the NSF model and the peak temperature is found to be close to thecenter-right of the moving lid. More importantly, the direction of heat flow predicted
Figure 13. Comparison of (a) u-velocity profile along a vertical line and (b) v-velocity profile along a
horizontal line crossing the center of the cavity predicted by the DSMC and NSF methods atKn¼0.05 and U w¼ 50 m=s.
Figure 14. Comparison of heat flux stream traces overlaid on temperature contours (K ) in the cavity
predicted by (a) NSF and (b) DSMC at Kn¼ 0.05 and U w¼ 50 m=s.
300 B. JOHN ET AL.
7/18/2019 Benzi 2010
http://slidepdf.com/reader/full/benzi-2010 15/17
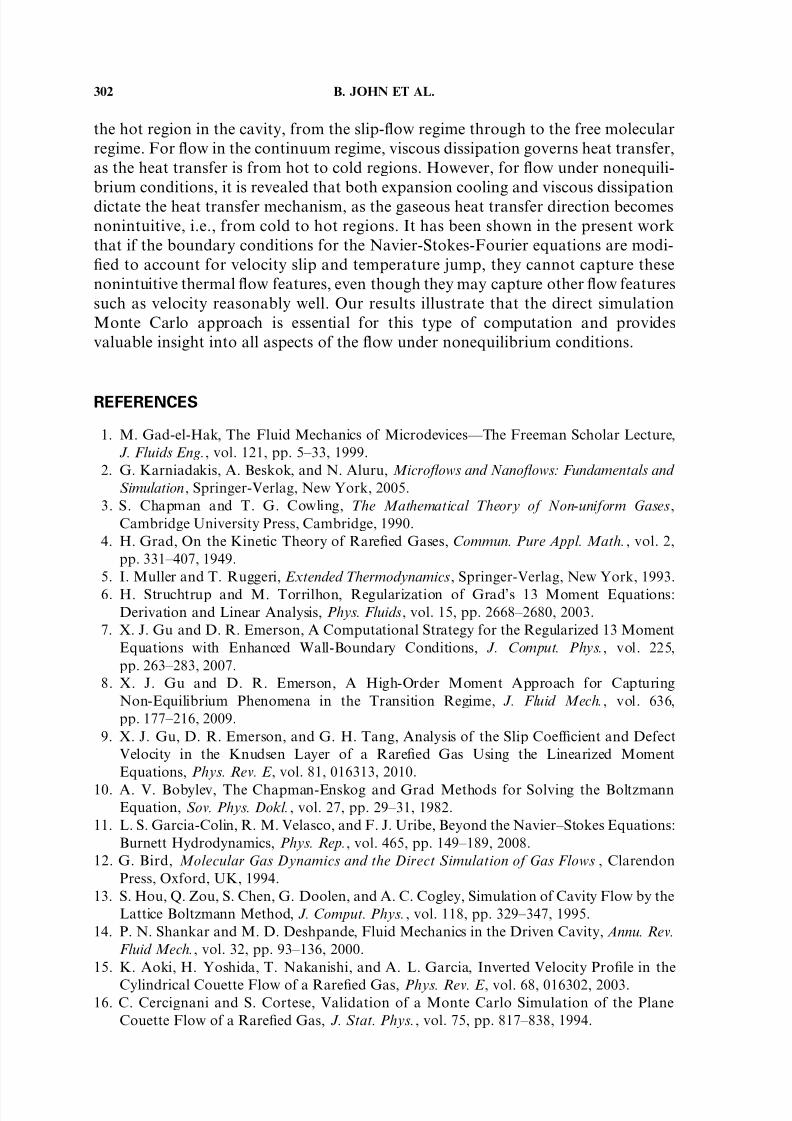
by the NSF model is found to be from the hot region to the cold region. Compar-isons at Kn¼ 0.02 and U w¼ 100m=s are shown in Figure 15. The lid velocity con-sidered for Kn¼ 0.02 is U w¼ 100m=s, with a view to attaining faster convergenceand less statistical fluctuations for the DSMC simulations. At Kn¼ 0.02, for whichthe flow is in the early slip regime and closer to continuum, the temperature is againunderpredicted by the NSF model. However, the trends in the temperature field pre-dicted by both the NSF and DSMC methods are consistent, and the heat transferdirection predicted by both methods is from hot regions to cold regions. It is notedfrom the temperature field that for flow near the continuum regime, expansion cool-ing phenomena does not occur, as T >T w in almost the entire region near the leftwall. Here, viscous dissipation alone dictates the heat transfer direction. Theseresults indicate that significant nonequilibrium flow conditions could exist even inthe slip regime, which conventional flow models cannot capture. The NSF model,which is based on a gradient transport mechanism, cannot predict the counter-gradient heat flux in the driven cavity, as it does not take into account anynongradient transport phenomena that may become significant at the onset on non-equilibrium [8]. Alternative modeling techniques must be employed to gain insight
into all the aspects of the flow, including thermal flow patterns.
4. CONCLUSIONS
The direct simulation Monte Carlo method has been employed to investigatethe flow and thermal characteristics in a lid-driven microcavity under nonequili-brium gaseous flow conditions. The impact of lid velocity and Knudsen numberon the flow and heat transfer patterns in the cavity has been studied. It has beenobserved that rarefaction effects significantly reduce the shear stress and heat flux
rates for a fixed lid velocity, as they become increasingly dependent on the densityof the flow with increase in Knudsen number. Heat flux streamlines indicate acounter-gradient heat flux pattern where the direction of flow is from the cold to
Figure 15. Comparison of heat flux stream traces overlaid on temperature contours (K ) in the cavitypredicted by (a) NSF and (b) DSMC at Kn¼ 0.02 and U w¼ 100m=s.
NONEQUILIBRIUM HEAT AND MASS TRANSFER 301
7/18/2019 Benzi 2010
http://slidepdf.com/reader/full/benzi-2010 16/17
the hot region in the cavity, from the slip-flow regime through to the free molecularregime. For flow in the continuum regime, viscous dissipation governs heat transfer,as the heat transfer is from hot to cold regions. However, for flow under nonequili-brium conditions, it is revealed that both expansion cooling and viscous dissipationdictate the heat transfer mechanism, as the gaseous heat transfer direction becomesnonintuitive, i.e., from cold to hot regions. It has been shown in the present workthat if the boundary conditions for the Navier-Stokes-Fourier equations are modi-fied to account for velocity slip and temperature jump, they cannot capture thesenonintuitive thermal flow features, even though they may capture other flow featuressuch as velocity reasonably well. Our results illustrate that the direct simulationMonte Carlo approach is essential for this type of computation and providesvaluable insight into all aspects of the flow under nonequilibrium conditions.
REFERENCES
1. M. Gad-el-Hak, The Fluid Mechanics of Microdevices—The Freeman Scholar Lecture,J. Fluids Eng., vol. 121, pp. 5–33, 1999.
2. G. Karniadakis, A. Beskok, and N. Aluru, Microflows and Nanoflows: Fundamentals and
Simulation, Springer-Verlag, New York, 2005.
3. S. Chapman and T. G. Cowling, The Mathematical Theory of Non-uniform Gases,
Cambridge University Press, Cambridge, 1990.
4. H. Grad, On the Kinetic Theory of Rarefied Gases, Commun. Pure Appl. Math., vol. 2,
pp. 331–407, 1949.
5. I. Muller and T. Ruggeri, Extended Thermodynamics, Springer-Verlag, New York, 1993.
6. H. Struchtrup and M. Torrilhon, Regularization of Grad’s 13 Moment Equations:Derivation and Linear Analysis, Phys. Fluids, vol. 15, pp. 2668–2680, 2003.
7. X. J. Gu and D. R. Emerson, A Computational Strategy for the Regularized 13 MomentEquations with Enhanced Wall-Boundary Conditions, J. Comput. Phys., vol. 225,
pp. 263–283, 2007.
8. X. J. Gu and D. R. Emerson, A High-Order Moment Approach for CapturingNon-Equilibrium Phenomena in the Transition Regime, J. Fluid Mech., vol. 636,
pp. 177–216, 2009.
9. X. J. Gu, D. R. Emerson, and G. H. Tang, Analysis of the Slip Coefficient and DefectVelocity in the Knudsen Layer of a Rarefied Gas Using the Linearized MomentEquations, Phys. Rev. E , vol. 81, 016313, 2010.
10. A. V. Bobylev, The Chapman-Enskog and Grad Methods for Solving the BoltzmannEquation, Sov. Phys. Dokl., vol. 27, pp. 29–31, 1982.
11. L. S. Garcia-Colin, R. M. Velasco, and F. J. Uribe, Beyond the Navier–Stokes Equations:Burnett Hydrodynamics, Phys. Rep., vol. 465, pp. 149–189, 2008.
12. G. Bird, Molecular Gas Dynamics and the Direct Simulation of Gas Flows , Clarendon
Press, Oxford, UK, 1994.
13. S. Hou, Q. Zou, S. Chen, G. Doolen, and A. C. Cogley, Simulation of Cavity Flow by theLattice Boltzmann Method, J. Comput. Phys., vol. 118, pp. 329–347, 1995.
14. P. N. Shankar and M. D. Deshpande, Fluid Mechanics in the Driven Cavity, Annu. Rev.
Fluid Mech., vol. 32, pp. 93–136, 2000.
15. K. Aoki, H. Yoshida, T. Nakanishi, and A. L. Garcia, Inverted Velocity Profile in the
Cylindrical Couette Flow of a Rarefied Gas, Phys. Rev. E , vol. 68, 016302, 2003.16. C. Cercignani and S. Cortese, Validation of a Monte Carlo Simulation of the Plane
Couette Flow of a Rarefied Gas, J. Stat. Phys., vol. 75, pp. 817–838, 1994.
302 B. JOHN ET AL.
7/18/2019 Benzi 2010
http://slidepdf.com/reader/full/benzi-2010 17/17
17. D. R. Emerson, X. J. Gu, S. K. Stefanov, S. Yuhong, and R. W. Barber, NonplanarOscillatory Shear Flow: From the Continuum to the Free-Molecular Flow, Phys. Fluids,
vol. 19, 107105, 2007.
18. J. H. Park, S. W. Baek, S. J. Kang, and M. J. Yu, Analysis of Thermal Slip in Oscillating
Rarefied Flow Using DSMC, Numer. Heat Transfer A, vol. 42, pp. 647–659, 2002.19. M. M. Mansour, F. Baras, and A. L. Garcia, On the Validity of Hydrodynamics in Plane
Poiseuille Flow, Physica A, vol. 240, pp. 255–267, 1997.
20. H. Sun and M. Faghri, Effects of Rarefaction and Compressibility of Gaseous Flow inMicrochannel Using DSMC, Numer. Heat Transfer A, vol. 38, pp. 153–168, 2000.
21. H. Liu, M. Wang, J. Wang, G. Zhang, H. Liao, R. Huang, and X. Zhang, Monte CarloSimulations of Gas Flow and Heat Transfer in Vacuum Packaged MEMS Devices, Appl.
Thermal Eng., vol. 27, pp. 323–329, 2007.
22. C. Cai, Heat Transfer in Vacuum Packaged Microelectromechanical System Devices,Phys. Fluids, vol. 20, 017103, 2008.
23. X. Nie, G. D. Doolen, and S. Chen, Lattice Boltzmann Simulations of Fluid Flows in
MEMS, J. Stat. Phys., vol. 112, pp. 279–289, 2002.24. S. Naris, and D. Valougeorgis, The Driven Cavity Flow over the Whole Range of the
Knudsen Number, Phys. Fluids, vol. 17, 097106, 2005.
25. S. Mizzi, D. R. Emerson, S. K. Stefanov, R. W. Barber, and J. M. Reese, Effects of Rarefaction on Cavity Flow in the Slip Regime, J. Comput. Theor. Nanosci., vol. 4,
pp. 817–822, 2007.
26. B. John and M. Damodaran, Computation of Head-Disk Interface Gap Micro FlowfieldsUsing DSMC and Continuum-Atomistic Hybrid Methods, Int. J. Numer. Meth. Fluids,
vol. 61, pp. 1273–1298, 2009.
27. B. John and M. Damodaran, Parallel Three Dimensional Direct Simulation Monte Carlofor Simulating Micro Flows, Lect. Notes Comput. Sci. Eng., vol. 67, pp. 91–98, 2009.
28. B. John and M. Damodaran, Hybrid Continuum–Direct Simulation Monte Carlo andParticle-Laden Flow Modeling in the Head-Disk Interface Gap, IEEE Trans. Magn.,
vol. 45, pp. 4929–4932, 2009.
29. F. J. Alexander, A. L. Garcia, and B. Alder, Cell Size Dependence of Transport Coeffi-cients in Stochastic Particle Algorithms, Phys. Fluids, vol. 10, pp. 1540–1542, 1998.
30. N. G. Hadjiconstantinou, Analysis of Discretization in the Direct Simulation MonteCarlo, Phys. Fluids, vol. 12, pp. 2634–2638, 2000.
31. N. G. Hadjiconstantinou, A. L. Garcia, M. Z. Bazant, and G. He, Statistical Errorin Particle Simulations of Hydrodynamic Phenomena, J. Comput. Phys., vol. 187,
pp. 274–297, 2003.
NONEQUILIBRIUM HEAT AND MASS TRANSFER 303