Embed Size (px)
Citation preview

1
Benchmarks for Reading Performance in the Philippines Results of the benchmarking workshop held on August 27, 2014
INTRODUCTION
On August 27, 2014, USAID’s Education Data for Decision Making (EdData II) project and Basa Filipinas Project (Basa) jointly supported a workshop to use the results from early grade reading assessments (EGRAs) conducted in the Philippines to develop benchmarks for reading performance in the first years of elementary education. The Philippine Department of Education (DepEd) assigned staff from the office of the Undersecretary for Programs and Projects, the Bureau of Elementary Education, and six regions to attend this workshop. The regions that participated included Region I, Region IV-A, the National Capital Region (NCR), Region VI, Region VII, and the Autonomous Region of Muslim Mindanao (ARMM). A total of 49 participants spent the day examining data from the EGRA surveys conducted in 2013 and 2014 and used those data to propose benchmarks for reading performance in grades 1 through 3 for Filipino and English and for four regional mother tongues: Ilokano, Hiligaynon, Sinubuanong Binisaya (Cebuano), and Maguindanaoan.
Data were made available from the national EGRA survey conducted in February 2013.1 That study assessed the Filipino and English reading skills of a sample of grade 3 students drawn from six geographic areas so as to show results at the subnational and national levels. The relevant data for the purposes of the benchmarking workshop
1 The 2013 EGRA report can be found on the EdData II
website: https://www.eddataglobal.org/countries/index.cfm?fuseaction=pubDetail&ID=513
were the national averages for performance in Filipino and English (since benchmarks in these two languages would be for performance across the whole country). In addition, data from the 2014 EGRA survey of reading performance in four mother tongues were presented for use in the workshop.2 The 2014 survey evaluated student reading achievement in Ilokano (in Region I), Hiligaynon (in Region VI), Cebuano (in Region VII) and Maguindanaoan (in ARMM). Data on student performance in each language were analyzed and worked with separately so as to develop language-specific benchmarks.
The approach to benchmarking followed a methodology developed and used by EdData II in several other countries. At the heart of this method is the goal of having children learn to read well enough and early enough to be able to apply their reading skill in school and as lifelong learners. Therefore, the emphasis is not just on the mechanics of reading, but on developing the ability to read with understanding. To read with comprehension, children need to recognize familiar words with automaticity and decode unfamiliar ones with minimal effort, group words quickly to gain meaning from sections of text, and move effortlessly enough through text to retain what they have read. These skills are captured in the assessments of students’ oral reading fluency (ORF). And the relationship between fluency and comprehension is well established. In fact, based on the data from the 2014 survey in the Philippines, oral reading fluency explains between 65 and 70 percent of the variation in comprehension for all four languages. The approach for setting benchmarks therefore looks closely at the data for each language to identify the specific levels of reading fluency (particular to each language) that
2 The 2014 EGRA report can be found at:
https://www.eddataglobal.org/countries/index.cfm?fuseaction=pubDetail&ID=626

2
correspond to students being more fully able to comprehend what they read. The types of data used and the process employed by the workshop participants are discussed further in the next section of this report.
One final introductory comment: At the end of the workshop, the participants were keenly interested in discussing how the results of their work—proposed benchmarks for reading comprehension and oral reading fluency—could be used in some official capacity by DepEd. Participants were particularly concerned about being able to engage a broader cross-section of stakeholders in their respective regions in understanding the benchmarks and then building consensus around them so that the benchmarks could be incorporated into regional strategies and plans for improving learning outcomes. At the same time, they recognized the need to present their recommended benchmarks to the central leadership within the Department of Education. Therefore, the group proposed a process for carrying forward the work on benchmarks that included the following sequence of next steps:
Document the results of the workshop (i.e., the writing of this report);
Share the report with the regional teams, which would engage the leadership in each region to validate the results produced in the workshop;
Once validated by the regions, transmit the documentation of the workshop results to the Bureau of Elementary Education, which will consolidate the regional benchmarking recommendations for submission to the Undersecretary for Programs and Projects;
The Office of the Undersecretary for Programs and Projects will make additional inputs and/or comments as deemed necessary prior to submitting the proposed benchmarks to Secretary of Education for approval;
Have the benchmarks for reading performance in Filipino, English, Ilokano, Hiligaynon, Cebu-ano, and Maguindanaoan officially finalized, approved, and issued as a DepEd order.
In the context of wishing to respect and support the above process, the present report was prepared. The methods and data used at the workshop are presented next so that as the results are communicated, others can see how the
benchmarks were developed. Following the methods section are recommendations for reading performance benchmarks from each of the groups (i.e., for each of the languages), including comments from the EdData II team regarding the proposed benchmarks. Then readers will find the specific timeline for next steps as proposed by the workshop participants. The conclusion of the report discusses some issues worth further consideration.
THE BENCHARMARKING METHODOLOGY AND PROCESS
As stated above, the workshop was held on August 27, 2014, and included 49 participants. Among them were 5 to 7 participants from each of the regions, 5 people from the DepEd central office, 5 people from the Basa Filipinas project, and 2 from EdData II.3 EdData II and Basa collaborated on a presentation that reviewed the data from the 2013 and 2014 surveys and that mapped out the process for developing benchmarks. Almost all the participants in the benchmarking workshop had also attended the policy dialogue held on July 23, 2014, during which the results of the 2014 EGRA study of four mother tongues were presented and discussed in detail. Therefore, only a quick overview/review of those findings was necessary. Following that presentation and questions and answers related to both the available data and the proposed methodology, the step-by-step process was laid out for each group to follow. The participants were organized into six working groups according to regional/language affiliation, so that:
Participants from Region I worked on benchmarks for reading in Ilokano
Participants from Region IV-A worked on benchmarks for reading in Filipino
Participants from Region VI worked on benchmarks for reading in Hiligaynon
Participants from Region VII worked on benchmarks for reading in Sinubuanong Binisaya
Participants from NCR worked on benchmarks for reading in English
Participants from ARMM worked on benchmarks for reading in Maguindanaoan
The process of setting the benchmarks was recognized to be in part analytical and in part
3 A full list of participants and their affiliations is included
in Annex A to this report.
3
common sense. Participants had to combine information from the reading assessments with their knowledge of what is possible in Philippine classrooms, bearing in mind in particular the current difficulties administrators, teachers, and students face in implementing the new mother-tongue based multilingual education (MTB-MLE) curriculum. The objectives of MTB-MLE regarding acquisition of literacy in mother tongue, Filipino, and English were another important piece of information that participants took into account. In fact, those curricular objectives served as important starting points for determining when students should be reading with comprehension in each language. MTB-MLE stipulates the following expectations. Students should:
Read and write in mother tongue by the end of grade 1 and continue literacy development through grade 3.
Begin reading Filipino in the latter part of grade 1, be reading and writing in Filipino in grade 2, and continue their literacy development in grade 3.
Begin reading English in the second semester of grade 2 and be reading and writing in English in grade 3.
Each group was charged with developing benchmarks for reading comprehension and oral reading fluency for the relevant grades for the language on which they were working. Therefore, workshop participants aimed to establish benchmarks for reading fluency and comprehension for mother tongues for grades 1 through 3, for Filipino for grades 2 and 3, and for English for grades 2 and 3.
In addition to the curriculum objectives defined by MTB-MLE, data from the EGRA surveys were the most important input to each group’s work. For each language, participants were given a graphic summary of the relationship between oral reading fluency and comprehension. Box-and-whisker plots were used to show the ranges of reading fluencies associated with different levels of comprehension. The levels of comprehension were defined by the number of questions students answered correctly (from 0 through 5). In addition, tables summarizing the quartile distributions were provided. The data in the tables corresponded to the 25th, 50th, and 75th percentiles of the oral reading fluency ranges for each level of comprehension. The box-and-whisker plots and accompanying table for Cebuano are included as an example in Annex B to this
document. In addition, each group was given cumulative distribution tables for comprehension and oral reading fluency for grades 1 and 2 for mother tongues and for grade 3 for Filipino and English. These tables showed the percentage of students reaching or exceeding different levels of performance, so that when considering different levels for a benchmark, each group could take into account the percentage of students presently meeting those levels (and thus weigh how ambitious the benchmark would be).
Each working group was charged with defining the following for reading comprehension (defined as the percentage of correct responses students should attain) and for oral reading fluency (defined as the number of words of grade-level text a child should read correctly per minute):
A long-range goal
A benchmark (which might or might not be different from the long-range goal)
The percentage of students who would meet the benchmark by the end of school year (SY) 2015–2016
The percentage of students who would score zero by the end of SY 2015–2016
Groups working on benchmarks for mother tongues began working on grade 2, then worked backward from grade 2 to set benchmarks for grade 1, and worked forward from grade 2 to set benchmarks for grade 3. For the mother tongues, the 2014 survey provided data for grades 1 and 2. For grade 3 benchmarks, the working groups had to assume an additional year of “growth” in student performance. For Filipino and English, the groups began working on grade 3, and then worked backward to set benchmarks for grade 2. In this case, the 2013 survey provided data on grade 3 performance, so groups had to “subtract” from the grade 3 benchmarks to obtain what they assumed to be what one year less of reading skill development would equate to.
THE BENCHMARKING RESULTS
The results of each group’s work are presented in the tables included in this section of the report. The information is organized to show the four outputs defined by each group, for each relevant grade, for the two key indicators: reading comprehension and oral reading fluency. The outputs include the long-range goal, the nearer-term benchmark (assuming a target date of the end of the 2015–2016 school

4
year), the percentage of students who would be meeting that benchmark, and the percentage of students who would score zero at the end of 2015–2016. The tables also include the levels of performance as measured by either the 2013 or 2014 EGRA survey (in the shaded rows). These existing data are presented to allow comparison of the projected benchmarks to current levels of performance as one means to judge how ambitious or conservative the groups were being in setting their targets.
In the cases where the groups did provide justification for their work, the table of benchmarks is followed by a short summary of what that group presented as its rationale for the chosen benchmarks. The reflections, comments, and recommendations regarding the benchmarks are summarized and presented as well.
The group from Region I that set benchmarks for Ilokano reading (Table 1) felt they were being ambitious. They justified benchmarks that far exceeded the existing levels of performance in both grade 1 and 2 based on the confidence they placed in both current and future efforts aimed at improving early grade reading. They cited several existing reading programs (Basa Filipinas, Tan-Yan-Kee, Beginning Reading, Reading Readiness, and Bright Minds Read, to name a few) and existing strategies for teacher training and development of instructional materials, as well as future efforts aimed at creating strong advocacy for Ilokano literacy, sound monitoring and evaluation of student outcomes, and provision of technical assistance to schools on improved reading instruction.
In comparing the proposed comprehension benchmarks to the results from 2014, it is clear that the benchmarks for comprehension, proposed at 60% for grade 1 and 80% for grade 2, are considerably higher than the average performances of students in the preceding school year (average percent correct of 17% in grade 1 and 45% in grade 2). Also, the projected percentages of students meeting the benchmark by the end of SY 2015–2016 represent an impressive improvement over the current share of students able to achieve 60% and 80% comprehension in grades 1 and 2.
Table 1. Proposed benchmarks for Ilokano
Regarding the benchmarks for oral reading fluency, the levels proposed for grades 1 and 2, while also above the averages from 2014, were less ambitious. One way to evaluate the ORF benchmarks is to compare what is proposed to what the existing data show, using the range of reading fluency scores that correspond to the benchmark levels of comprehension. For grade 1, most students who achieved 60% comprehension had ORF scores between 32 and 37 correct words per minute (cwpm). The group proposed a benchmark below that range. For grade 2, 80% comprehension corresponds to ORF of from 35 to 46 cwpm. The proposed benchmark is in fact right at the median of the scores of students who had 80% comprehension in the past school year.
The group also chose to be ambitious in projecting reductions in zero scores for comprehension, cutting the present levels of zero scores by more than half in each grade. They also proposed a significant reduction in zero scores for reading fluency in grade 1, but less so in grade 2. They did foresee complete elimination of zero scores and more or less 100% achievement of benchmarks by grade 3.
A final comment regarding the proposed Ilokano benchmarks and targets concerns the grade-to-grade progression inherent in the group’s output. The group foresaw a rise in the comprehension standard from 60% to 80% from grade 1 to grade 2, and then maintenance of that level of performance as the standard for grade 3. This seems reasonable. Full comprehension (100% correct) is of course desirable, but the difference between 4 out of 5 correct compared to 5 out of 5 correct implies a level of precision that the EGRA instrument probably does not provide. Regarding
Ilokano Grade 1 Grade 2 Grade 3
Comp.
(% cor.)
ORF
(cwpm)
Comp.
(% cor.)
ORF
(cwpm)
Comp.
(% cor.)
ORF
(cwpm)
Average – 2014 data 17% 15 45% 30
Long-range goal 80% 40 80% 50 80% 60
Benchmark – end of 2015-16 60% 30 80% 40 80% 50
% Meeting Benchmark – 2014 data 16% 21% 29% 35%
% Meeting Benchmark – by end of 2015-16 75% 72% 86% 86% 97% 100%
% Scoring Zero – 2014 data 65% 33% 29% 13%
% Scoring Zero – by end of 2015-16 28% 20% 14% 10% 0% 0%
Note that cwpm stands for correct words per minute.

5
ORF, the group essentially assumed a grade-to-grade improvement of 10 cwpm, which is at the lower end of what EGRA studies in many countries have revealed. In fact, the 2014 data from Region I showed a difference of 15 cwpm between the grade 1 and grade 2 average reading fluencies.
The Region VI group chose not to set Hiligaynon benchmarks for grade 3 (Table 2), and the issue of whether benchmarks for mother tongue are needed and would be used beyond grade 2 is one that DepEd should consider (discussed further in the conclusion to this report). They also expressed that they were being cautious in setting their targets, as the levels of performance revealed by the 2014 EGRA were much lower than they would have expected.
Table 2. Proposed benchmarks for Hiligaynon
A couple of things stand out in this group’s output. Regarding grade 1, the benchmark of only 40% comprehension is something worth reconsidering, as it would mean that children were able to answer only 2 out of 5 questions correctly. The long-range goal may be more appropriate as a benchmark. And the level of oral reading fluency proposed is below the range of scores that corresponded to even that low level of comprehension (2014 data showed ORF from 25 to 42 cwpm as the middle 50% of the distribution of scores associated with 40% comprehension). Additionally, the proposed percentage of students meeting the 40% comprehension level is just below the percentage that did so in the past school year. If the choice is to set the benchmark lower (i.e., at 40% comprehension as done here, instead of 60% or 80%), then it would be recommended to be more ambitious regarding the proportion of students who would be able to meet that benchmark.
For grade 2, the Region VI group set higher expectations for both comprehension and ORF, and the proposed level of reading fluency did fall within the range of scores that corresponded with 60% comprehension in the 2014 data. But here also, the group’s proposed long-range goal may be a better benchmark. Again, the proposed percentage of students meeting the comprehension benchmark is below the demonstrated existing level of performance, and for fluency does not project very strong improvement.
For zero scores, this group was less ambitious than all the others in projecting targets for reducing the percentage of students at the bottom of the distribution, especially in grade 1.
The group from Region VII, like their colleagues from Region VI, chose to set lower comprehension benchmarks for Cebuano in both grades 1 and 2 – 40% and 60% respectively (Table 3). They did set the long-range goal of 80% comprehension in those grades, and 100% comprehension in grade 3, which would be more reflective of students being able to fully comprehend what they read.
Table 3. Proposed benchmarks for Cebuano
The justification offered for setting a lower standard for comprehension was the concern the group had for the percentage of students scoring zero on this skill. Also, the group cited the diversity of versions of Sinugbuanong Binisaya spoken across the region as another concern that tempered their ambition. And, while they were optimistic about the impact that a program like Basa Filipinas can have in their region, they were concerned that it was intervening in only 3 of their 19 divisions.
In setting the targets for the percentages of students meeting the proposed benchmarks by the
Hiligaynon Grade 1 Grade 2 Grade 3
Comp.
(% cor.)
ORF
(cwpm)
Comp.
(% cor.)
ORF
(cwpm)
Comp.
(% cor.)
ORF
(cwpm)
Average – 2014 data 15% 13 42% 32
Long-range goal 60% 25 80% 50
Benchmark – end of 2015-16 40% 20 62% 45
% Meeting Benchmark – 2014 data 24% 31% 44% 34%
% Meeting Benchmark – by end of 2015-16 25% 50% 30% 50%
% Scoring Zero – 2014 data 64% 44% 31% 22%
% Scoring Zero – by end of 2015-16 40% 25% 15% 10%
Note that cwpm stands for correct words per minute.
Cebuano Grade 1 Grade 2 Grade 3
Comp.
(% cor.)
ORF
(cwpm)
Comp.
(% cor.)
ORF
(cwpm)
Comp.
(% cor.)
ORF
(cwpm)
Average – 2014 data 26% 21 53% 41 na na
Long-range goal 80% 45 80% 50 100% 55
Benchmark – end of 2015-16 40% 32 60% 42 80% 55
% Meeting Benchmark – 2014 data 38% 33% 54% 54% na na
% Meeting Benchmark – by end of 2015-16 20% 40% 25% 50% 30% 50%
% Scoring Zero – 2014 data 49% 22% 19% 8% na na
% Scoring Zero – by end of 2015-16 25% 15% 15% 5% 10% 5%
Note that cwpm stands for correct words per minute.

6
end of the 2015–2016 school year, this group proposed some targets below the levels shown in the data from the past school year. For this group, and probably for Region VI as well, it would appear that the low targets resulted from a misreading of the distribution tables for comprehension. Therefore it is suggested that those values be revisited, taking into account the correct 2014 values shown in the tables included in this report. It is suggested that all groups consider the trade-off between a lower benchmark and a higher percentage projected to meet the benchmark, versus a higher benchmark with a somewhat lower percentage projected to meet it.
The proposed benchmark for ORF for grade 3 also appears low, when one considers the grade-to-grade progression they imply. From grade 1 to grade 2, average performance in 2014 improved by 20 cwpm. This group proposed benchmarks that reflect a 10 cwpm increase from grade 1 to grade 2 (and only a 5 cwpm difference in the long-range goals), and a 13 cwpm increase from grade 2 to grade 3 (a difference of only 5 cwpm again in the long-range goals). Future discussion and revision to these benchmarks may wish to consider a more ambitious rate of improvement resulting from each additional year of instruction. A similar issue is present when looking at the projected targets for the percentages of students meeting the benchmarks in grade 3. Little improvement is assumed in these targets for either comprehension or fluency, and zero scores are projected to reduce only slightly for comprehension, and to remain unchanged for ORF. The group was concerned that improvement would face many challenges, given in particular the diversity of dialects of the language spoken across the region. A strategy to specifically address that challenge might enable the group to set benchmarks and targets that would be more ambitious.
The team from ARMM proposed Maguindinaoan benchmarks for grade 1 (Table 4) that are ambitious when compared to the levels of performance reflected in the data from 2014. The levels of comprehension and fluency would be well above the existing averages, and the percentages of students meeting the proposed benchmarks represent substantial gains over existing performance, as do the proposed reductions in zero scores (reducing zeros on comprehension by more than half and on fluency by more than two thirds). The group justified its ambition based on several strategies they propose: establishing
programs specifically targeted to reducing nonreaders, conducting intensive trainings for teachers focused on mother tongue reading, and providing coaching and mentoring for teachers and instructional supervision all focused on MTB-MLE implementation.
Table 4. Proposed benchmarks for Maguin-dinaoan
The ARMM team’s output for grade 2 was less ambitious. The grade 2 benchmark they proposed for comprehension was, in fact, lower than what they proposed for grade 1, and the author wonders if this was due to a transcription error. Regarding the target proportion of students meeting the benchmark of 60% comprehension, the group proposed the same values as for grade 1, which actually is below the percentage of students who obtained that comprehension score on the 2014 EGRA. For fluency, the group’s proposed target of 40 cwpm is within the range of scores associated with 60% comprehension. The long-range ORF goal would be more aligned with even higher levels of comprehension (100%). The group proposed to double the percentage of students reaching 40 cwpm by the end of SY 2015–2016 and proposed continued, dramatic reductions in zero scores for both comprehension and ORF.
The relevant data available for benchmarking in Filipino (Table 5) were only for grade 3, so the group from Region IV-A that worked on these benchmarks started by setting standards for that grade. The proposed benchmark, and especially the long-range goal, is above the average level of reading comprehension achieved by students in 2013. This is especially the case when the benchmark for ORF is compared to the data from 2013.
Maguindinaoan Grade 1 Grade 2 Grade 3
Comp.
(% cor.)
ORF
(cwpm)
Comp.
(% cor.)
ORF
(cwpm)
Comp.
(% cor.)
ORF
(cwpm)
Average – 2014 data 8% 7 27% 21
Long-range goal 80% 50 80% 60
Benchmark – end of 2015-16 70% 35 60% 40
% Meeting Benchmark – 2014 data 6% 4% 27% 22%
% Meeting Benchmark – by end of 2015-16 25% 50% 25% 50%
% Scoring Zero – 2014 data 82% 66% 50% 38%
% Scoring Zero – by end of 2015-16 40% 20% 25% 15%
Note that cwpm stands for correct words per minute.

7
Filipino Grade 1 Grade 2 Grade 3
Comp.
(% cor.)
ORF
(cwpm)
Comp.
(% cor.)
ORF
(cwpm)
Comp.
(% cor.)
ORF
(cwpm)
Average – 2013 data 73% 68
Long-range goal 80% 75 100% 90
Benchmark – end of 2015-16 65% 60 75% 80
% Meeting Benchmark – 2013 data 70% 37%
% Meeting Benchmark – by end of 2015-16 75% 65% 75% 80%
% Scoring Zero – 2013 data 6% 1%
% Scoring Zero – by end of 2015-16 10% 10% 0% 0%
Note that cwpm stands for correct words per minute.
Table 5. Proposed benchmarks for Filipino
Even though the cohort tested in grade 3 in that year were students who had had three years of instruction in Filipino, this group felt that current grade 1 students—who would have had only two years of Filipino instruction when they reached grade 3—could still demonstrate improved performance. The groups reasoned that by the end of the 2015–2016 school year, schools, teachers, and students would have more experience with MTB-MLE and the transition to Filipino, and teachers would have the tools and activities they needed to provide effective instruction. The group also wanted to establish a strong standard that would reflect outstanding performance, and they were confident that teachers could have effective strategies, for example, for addressing the needs of the few students at the bottom of the distribution (zero scores).
However, the benchmark proposed for reading comprehension in grade 3—at 75%—is not appreciably higher than the average obtained by students in 2013. One could argue that MTB-MLE reduces the amount of instruction in Filipino to allow for instruction in mother tongue, and that therefore grade 3 students will have had less time learning to read in Filipino, and will have had to weather a transition from their first to a second language (L1 to L2). Similarly, for the target percentage meeting the benchmark, the group proposed a value only slightly higher than what was achieved in 2013. This was not the case for the benchmark and target for ORF, however. Here the group proposed a benchmark that exceeded the average from 2013, and projected a much greater percentage of students able to meet the higher standard. Again, the reasoning here may be that for fluency, skills will transfer easily from mother tongue to Filipino, as the mechanics of reading in most Philippine languages are very similar.
However, for comprehension, the transition from L1 to L2 is more difficult, as children need to build up sufficient working knowledge of Filipino as a second language to be able to more fully comprehend what they read (and do so with only 2 years of instruction in that language).
The group did propose eliminating zero scores in grade 3, and indicated an expectation that 10% of students might struggle to make the transition into Filipino in grade 2, and hence score at the bottom of the distribution for both comprehension and fluency. The proposed benchmarks for grade 2—at 65% comprehension and 60 cwpm—seem reasonable given all the issues mentioned above. And a progression from 60 to 80 cwpm from grade 2 to grade 3 implies that performance will increase dramatically as students gain more practice in Filipino.
The team from NCR that worked on setting benchmarks and targets for English (Table 6) recognized the challenge the system now faces in trying to build sufficient facility in English for students to be able to read with comprehension by grade 3. Given how low reading comprehension was in English in 2013, when students would have been receiving English instruction starting in grade 1, the group was concerned about how
Table 6. Proposed benchmarks for English
realistic their benchmarks were in the context of MTB-MLE, and English being learned starting only in grade 2. Even so, the group proposed benchmarks that exceeded the grade 3 levels of performance achieved in 2013. For comprehension in particular, the benchmark of 60% is almost double what the average percent correct was in 2013. Perhaps that is why the group envisioned only 40% of students being able to meet that benchmark by the end of SY 2015–2016. For
English Grade 1 Grade 2 Grade 3
Comp.
(% cor.)
ORF
(cwpm)
Comp.
(% cor.)
ORF
(cwpm)
Comp.
(% cor.)
ORF
(cwpm)
Average – 2013 data 32% 67
Long-range goal 60% 60 80% 75
Benchmark – end of 2015-16 40% 40 60% 70
% Meeting Benchmark – 2013 data 40% 49%
% Meeting Benchmark – by end of 2015-16 30% 30% 40% 60%
% Scoring Zero – 2013 data 37% 1%
% Scoring Zero – by end of 2015-16 30% 30% 15% 1%
Note that cwpm stands for correct words per minute.
8
comprehension, the NCR team also projected a significant reduction in zero scores in grade 3, targeting having less than half the proportion of students scoring zero as did so in 2013.
In working backward to set standards for grade 2, the group proposed a benchmark of only 40% comprehension and only 40 cwpm for fluency. This latter value actually falls well below the range of fluency scores that were associated with 40% comprehension in 2013 (from 61 to 92 cwpm). Students being able to better comprehend what they are reading, even at lower levels of fluency, may be obtainable if the level of text students are asked to read in grade 2 is considerably lower than what they were asked to read in grade 3 in 2013. Note that one could even ask, given how late English instruction is slated to begin under MTB-MLE, whether it makes sense to have English benchmarks for grade 2.
NEXT STEPS
As mentioned in the introduction to this report, the participants took time at the end of the workshop to discuss the process which they thought could best ensure that the proposed benchmarks would receive the appropriate reviews, both in the regions and by DepEd central, prior to be being put forward as official policy. In particular, representatives of DepEd central offices and of each of the regions all agreed on the importance of establishing a clear timeline and process for carrying forward the benchmarks being proposed at the workshop.
The participants took into account several issues when outlining such a process. First, the group agreed that a finalized set of recommended benchmarks should be put before the Executive Committee of DepEd before the end of October 2014. This was suggested so that there would be ample time to consider the proposed standards before they would be released late in the 2014 calendar year. Additionally, the regional groups all wanted to solicit feedback and broker the buy-in of their colleagues back in their respective regions. Finally, the writing of this report afforded an opportunity to provide some initial feedback, purely from a technical standpoint, hoping to ensure that all aspects of the data were considered by the teams during the very busy workshop.
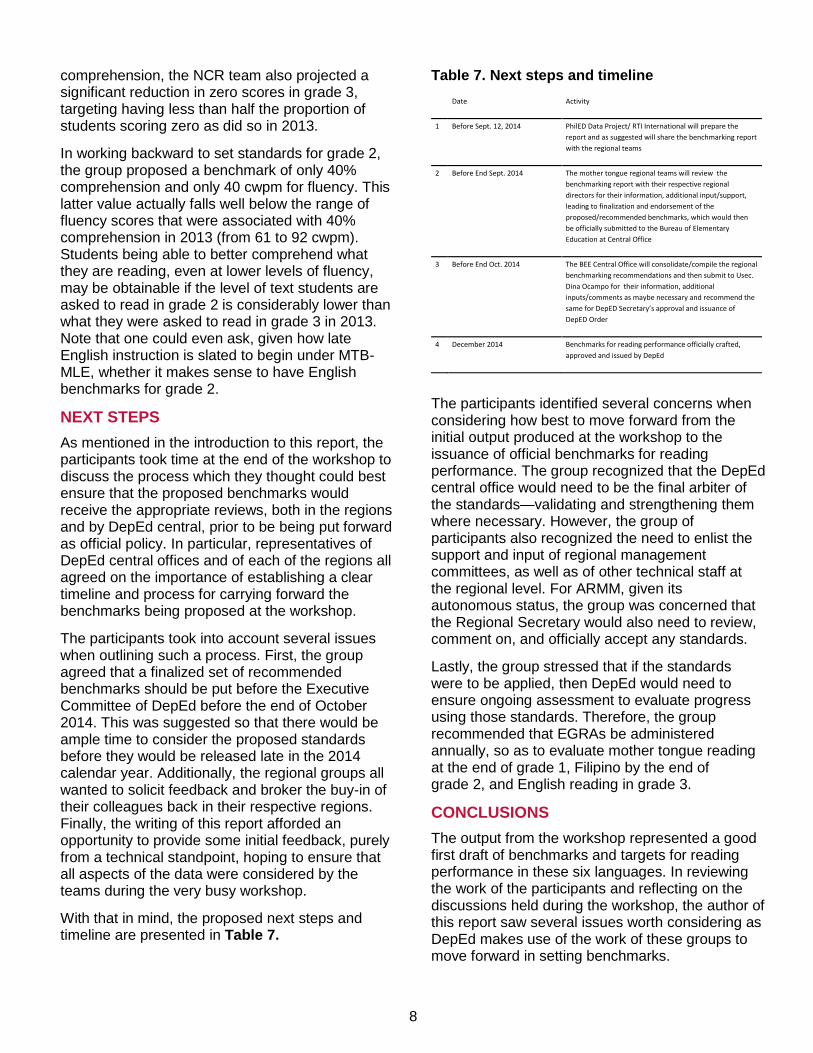
With that in mind, the proposed next steps and timeline are presented in Table 7.
Table 7. Next steps and timeline
The participants identified several concerns when considering how best to move forward from the initial output produced at the workshop to the issuance of official benchmarks for reading performance. The group recognized that the DepEd central office would need to be the final arbiter of the standards—validating and strengthening them where necessary. However, the group of participants also recognized the need to enlist the support and input of regional management committees, as well as of other technical staff at the regional level. For ARMM, given its autonomous status, the group was concerned that the Regional Secretary would also need to review, comment on, and officially accept any standards.
Lastly, the group stressed that if the standards were to be applied, then DepEd would need to ensure ongoing assessment to evaluate progress using those standards. Therefore, the group recommended that EGRAs be administered annually, so as to evaluate mother tongue reading at the end of grade 1, Filipino by the end of grade 2, and English reading in grade 3.
CONCLUSIONS
The output from the workshop represented a good first draft of benchmarks and targets for reading performance in these six languages. In reviewing the work of the participants and reflecting on the discussions held during the workshop, the author of this report saw several issues worth considering as DepEd makes use of the work of these groups to move forward in setting benchmarks.
Date Activity
1 Before Sept. 12, 2014 PhilED Data Project/ RTI International will prepare the
report and as suggested will share the benchmarking report
with the regional teams
2 Before End Sept. 2014 The mother tongue regional teams will review the
benchmarking report with their respective regional
directors for their information, additional input/support,
leading to finalization and endorsement of the
proposed/recommended benchmarks, which would then
be officially submitted to the Bureau of Elementary
Education at Central Office
3 Before End Oct. 2014 The BEE Central Office will consolidate/compile the regional
benchmarking recommendations and then submit to Usec.
Dina Ocampo for their information, additional
inputs/comments as maybe necessary and recommend the
same for DepED Secretary’s approval and issuance of
DepED Order
4 December 2014 Benchmarks for reading performance officially crafted,
approved and issued by DepEd

9
First, one needs to consider which benchmarks are needed for which grades. From the start, a parsimonious approach to benchmarking was pursued. For example, since oral reading fluency represents a higher-order skill that encompasses the other important reading skills students are developing, it was assumed that a benchmark in fluency would indicate whether students were also building skills in other areas, such as phonemic awareness, decoding, familiar word recognition, and reading accuracy. Therefore it was not necessary to have benchmarks for these other skill areas.4 Furthermore, because comprehension and fluency are strongly correlated, it is worth asking whether benchmarks are needed for both. At the workshop, comprehension benchmarks were used to identify the ranges of reading fluency that corresponded to the desired level of understanding. While one could argue that having a fluency benchmark therefore would also “indicate” a level of comprehension, this author recommends strongly that comprehension continue to be measured and monitored separately, to make sure that children are not just becoming mechanical readers.
Continuing to take a parsimonious approach, it is worth asking in which grades benchmarks should be set for the different languages. Here, what is important to consider is how best to monitor whether the MTB-MLE expectations for literacy acquisition in all three languages are being met. Clearly, benchmarks are needed to monitor the development of reading in mother tongues in grades 1 and 2. For Filipino, benchmarks are needed to monitor whether literacy skills are being transferred from mother tongue in grade 2. And it could be argued that they are also needed for grade 3 to ensure that students are consolidating their skills in a language that will continue to be used as a medium of instruction in upper elementary grades and beyond. For English, the issue is whether benchmarks (and hence monitoring of progress) are needed at all in grade 2. Benchmarks for English obviously are needed for grade 3.
4 Of course, not having benchmarks for those skills does
not mean that teachers have no interest in assessing whether their students are developing all the skills needed to be good readers. The important distinction to make is between benchmarks that could be used for monitoring system progress—which is what this work aimed at—versus those teachers would use to evaluate individual student or class progress in building reading skills.
Another issue that arises when considering setting benchmarks and targets for how many children will meet them is how to manage the trade-off between these two standards. One can choose to set a high benchmark; but then it is necessary to be realistic about the percentage of students who would be able to achieve that level of performance. For example, the group from Region I set a benchmark for Ilokano grade 2 oral reading fluency of 40 cwpm. This was higher than the 2014 average, so may be considered reasonable in terms of expectations for improvement. However, the group then proposed that 86% of grade 2 students be able to meet or exceed that benchmark in 2 years. That stands in contrast to only 35% of students having been able to read at 40 cwpm in the past school year. If one wishes to maintain a relatively high standard, then further discussions could focus on whether it is reasonable to assume that teachers could more than double the percentage of their students able to meet that benchmark.5
The opposite approach would be to set the benchmark lower, while being ambitious about how many students would be able to meet or exceed it. This may be valid in some circumstances, but when considering whether to take this approach, it is important to bear in mind that the benchmark should represent at least a minimally acceptable level of performance. In fact, some would argue that the benchmark should represent the desired level of high performance.
Lastly, an issue that came up during the workshop concerned the level of text that students were expected to be reading at benchmark levels. This is of concern for two reasons. First, when setting benchmarks, it is recommended that the level of text for which the benchmark is set be well-defined. Are grade 1 benchmarks based on reading grade 1 level material, grade 2 based on reading grade 2 level material, etc.? Second, DepEd therefore needs to produce and reinforce standards for what constitutes grade-appropriate text in each language. Participants evinced a fear that unless there are clear standards for grade-level text, schools could evaluate student performance using reading material that is below what should be read in a given grade (e.g., testing grade 3 students on grade 2 material).
5 Note, the Ilokano example is used here simply to
illustrate the point about the trade-off between the benchmark and the target percentage meeting it. It does not imply that the author is recommending a particular benchmark or target for Ilokano reading.

10
With appropriate review and additional input and analysis, it is hoped that these initial benchmarks can be honed and finalized as foreseen in the process laid out in the previous section. How DepEd can conduct such work for the other mother tongues currently being used both as media of instruction and as languages of literacy remains an open question.
CONTACT INFORMATION
For additional information on the progress of Philippines benchmarks for early grade reading:
Joseph DeStefano, RTI International [email protected]

11
Annex A: List of Workshop Participants
DepEd Central Office Participants 1. Ms. Anne Choi Exec. Assistant (K to 3), Usec. for Programs and Projects 2. Dr. Marilette R. Almayda Director III, Bureau of Elementary Education (BEE) 3. Mr. Efren Dela Cruz Education Program Supervisor 2 (EPS 2), National Education
Testing and Research Center (NETRC) 4. Dr. Rosalina J. Villaneza Focal Person, MTB-MLE Program, BEE 5. Ms. Jocelyn S. Tuguinayo Senior Education Program Specialist, BEE Region I Participants (EGRA Ilocano) 6. Dr. Vivian Pagatpatan Chief, Elementary Education 7. Dr. Dinah Bonao Regional EGRA Coordinator DepEd-Region I 8. Dr. Alma Ruby C. Torio Schools Division Superintendent, Pangasinan 9. Elsa M. Calado Education Regional Supervisor 10. Ms. Pearl P. Quinto EGRA Assessor/Principal Region VI Participants (EGRA Hiligaynon) 11. Dr. Novelyn M. Vilchez Chief, Curriculum Learning Management Division (CLMD) 12. Dr. Dominica T. Parcia EPS, Bureau Elementary Education / CLMD 13. Ms. Janalyn B. Navarro EPS I, Bacolod City Region VI 14. Mr. Nerio Benito E. Eseo EGRA Regional Coordinator, Region VI 15. Ms. Dymphna Leizel G. Jocson EGRA Assessor, DepEd-Region VI Region VII Participants (EGRA Sinugbuanong Binisaya) 16. Dr. Maria Jesusa Despojo Regional EPS 17. Dr. Luz C. Jandayan Officer in Charge (OIC)-Chief, Curriculum & Learning
Management Division 18. Ms. Nena V. Minoza EGRA Regional Coordinator, Region VII 19. Pamela Rodimeo Education Program Supervisor, Cebu Province 20. Dr. Wilfreda D. Bongalos Schools Division Superintendent, Bohol Province 21. Ms. Leilani Cabrera Ed. Program Supervisor, Negros Oriental Division 22. Ms. Jocelyn M. Conta EGRA Assessor, DepEd-Region VII ARMM Participants (EGRA Maguindanaon) 23. Ms. Hasim P. Pinayongan EPS I, Maguindanao 24. Ms. Saada Tubing EGRA Regional Coordinator, ARMM 25. Ms. Wilma Grace P. Rivero Principal, Maguindanao 26. Ms. Salamat T. Abedin EPS I – DepEd ARMM 27. Ma. Cristina T. Delos Santos EPS I, DepEd ARMM 28. Ms. Armela Bansil EGRA Assessor, DepEd-ARMM 29. Ms. Rowena Kamaarudin EGRA Assessor, DepEd-ARMM National Capital Region (EGRA English) 30. Ms. Arlene B. Maniquis Education Program Supervisor-Muntinlupa 31. Jeanette Job Coroza Regional Coordinator 32. Ms. Rosella M. Esteban Master Teacher II 33. Mrs. Nerissa R. Lomeda Principal

12
Region IV-A Calabarzon (EGRA Filipino) 34. Dr. Erick M. Jabijan Chief, CLMD, Region IV-A 35. Ms. Agnes Rolle EGRA Regional Coordinator 36. Dr. Lualhati O. Cadavedo City Schools Superintendent/OIC – Imus City 37. Ms. Andrea M. Abrencillo Education Program Supervisor 38. Ms. Lourdes M. Tan Principal III, Guinyangan District, Division of Quezon 39. Ms. Carina P. Jamilano Principal I, Plaridel District, Division of Quezon Basa Pilipinas 40. Mr. Marcial Salvatierra Chief of Party, Basa Pilipinas, Education Development Centre,
Inc. (EDC) 41. Ms. Karen Cassidy International Project Associate, EDC 42. Ms. Nancy Clark-Chiarelli International Technical Advisor, EDC 43. Dr. Felicitas Pado Senior Consultant/Basa Pilipinas 44. Ilya Son Deputy Chief of Party USAID Philippines 45. Mr. Mirshariff C. Tillah Program Management Specialist, Office of Education RTI International 46. Mr. Joseph DeStefano Senior Technical Advisor 47. Mr. Rufino Jamilano In-Country Tasks Coordinator, PhilED Data Project 48. Ms. Rosa Rapanan Accountant, Science, Technology, Research and Innovation
for Development (STRIDE) Program 49. Mr. Julie Mar M. Mendoza Staff, STRIDE Program

13
Annex B: Example of Box-and-Whisker Plots and Accompanying Data Tables (Cebuano)
Grade 1 Grade 2
#
Correct
25th
percentile
50th
percentile
(median)
75th
percentile Count
25th
percentile
50th
percentile
(median)
75th
percentile Count
Zero 0 0 6 189 0 3 13 78
1 21 26 29 57 20 28 38 36
2 27 32 36 59 25 35 45 70
3 35 39 45 40 36 40 51 67
4 43 51 57 25 47 54 64 84
5 57 61 67 22 55 65 75 80