Embed Size (px)
Citation preview
UNITED STATES SECURITIES AND EXCHANGE COMMISSION
Washington, D.C. 20549
FORM 10-K (Mark One)
[X] Annual Report Pursuant to Section 13 or 15(d) of the Securities Exchange Act of 1934 For the fiscal year ended December 31, 2018
or
[ ] Transition Report Pursuant to Section 13 or 15(d) of the Securities Exchange Act of 1934 For the transition period from to
Commission File Number 1-10560
BENCHMARK ELECTRONICS, INC. (Exact name of registrant as specified in its charter)
Texas 74-2211011
(State or other jurisdiction of (I.R.S. Employer incorporation or organization) Identification Number)
56 South Rockford Drive
Tempe, Arizona 85281 (623) 300-7000
(Address, including zip code, and telephone number, including area code, of principal executive offices) Securities registered pursuant to Section 12(b) of the Act:
Title of each class Name of each exchange on which registeredCommon Stock, par value $0.10 per share New York Stock Exchange, Inc.
Securities registered pursuant to Section 12(g) of the Act: None Indicate by check mark if the registrant is a well-known seasoned issuer, as defined in Rule 405 of the Securities Act. Yes [] No [ ] Indicate by check mark if the registrant is not required to file reports pursuant to Section 13 or Section 15(d) of the Act. Yes [ ] No [] Indicate by check mark whether the registrant (1) has filed all reports required to be filed by Section 13 or 15(d) of the
Securities Exchange Act of 1934 during the preceding 12 months (or for such shorter period that the registrant was required to file such reports), and (2) has been subject to such filing requirements for the past 90 days. Yes [] No [ ]
Indicate by check mark whether the registrant has submitted electronically every Interactive Data File required to be submitted
pursuant to Rule 405 of Regulation S-T during the preceding 12 months (or for such shorter periods that the registrant was
required to submit such files). Yes [] No [ ] Indicate by check mark if disclosure of delinquent filers pursuant to Item 405 of Regulation S-K is not contained herein, and
will not be contained, to the best of registrant’s knowledge, in definitive proxy or information statements incorporated by
reference in Part III of this Form 10-K or any amendment to this Form 10-K. [] Indicate by check mark whether the registrant is a large accelerated filer, an accelerated filer, a non-accelerated filer, a smaller
reporting company, or an emerging growth company. See the definitions of “large accelerated filer,” “accelerated filer,” “smaller reporting company,” and "emerging growth company" in Rule 12b-2 of the Exchange Act.
Large accelerated filer [] Accelerated filer [ ] Non-accelerated filer [ ] Smaller reporting company [ ] Emerging growth company [ ] If an emerging growth company, indicate by check mark if the registrant has elected not to use the extended transition period
for complying with any new or revised financial accounting standards provided pursuant to Section 13(a) of the Exchange Act.[ ] Indicate by check mark whether the registrant is a shell company (as defined in Rule 12b–2 of the Act). Yes [ ] No [] As of June 30, 2018, the number of outstanding common shares was 47,333,641. As of such date, the aggregate market value
of the common shares held by non-affiliates, based on the closing price of the common shares on the New York Stock Exchange on such date, was approximately $1.4 billion.
As of February 27, 2019, there were 40,654,965 common shares of Benchmark Electronics, Inc., par value $0.10 per share, outstanding.
Documents Incorporated by Reference: Portions of the Company’s Proxy Statement for the 2019 Annual Shareholders Meeting are incorporated herein by reference
(Part III, Items 10-14).

TABLE OF CONTENTS
Page
PART I Item 1. Business . . . . . . . . . . . . . . . . . . . . . . . . . . . . . . . . . . . . . . . . . . . . . . . . . . . . . . 1Item 1A. Risk Factors . . . . . . . . . . . . . . . . . . . . . . . . . . . . . . . . . . . . . . . . . . . . . . . . . . . . 12
Item 1B. Unresolved Staff Comments . . . . . . . . . . . . . . . . . . . . . . . . . . . . . . . . . . . . . . . . 26
Item 2. Properties . . . . . . . . . . . . . . . . . . . . . . . . . . . . . . . . . . . . . . . . . . . . . . . . . . . . . 26
Item 3. Legal Proceedings . . . . . . . . . . . . . . . . . . . . . . . . . . . . . . . . . . . . . . . . . . . . . . . 26
Item 4. Mine Safety Disclosures . . . . . . . . . . . . . . . . . . . . . . . . . . . . . . . . . . . . . . . . . . . 27
PART II
Item 5. Market for Registrant’s Common Equity, Related Shareholder Matters and Issuer Purchases of Equity Securities . . . . . . . . . . . . . 27Item 6. Selected Financial Data . . . . . . . . . . . . . . . . . . . . . . . . . . . . . . . . . . . . . . . . . . . . 30Item 7. Management’s Discussion and Analysis of Financial Condition and Results of Operations . . . . . . . . . . . . . . . . . . . . . . . . . . . . . . . . . . . . . . . . . . 31Item 7A. Quantitative and Qualitative Disclosures about Market Risk . . . . . . . . . . . . . . . . . 41Item 8. Financial Statements and Supplementary Data . . . . . . . . . . . . . . . . . . . . . . . . . . . 42Item 9. Changes in and Disagreements with Accountants on Accounting and Financial Disclosure . . . . . . . . . . . . . . . . . . . . . . . . . . . . . . . . . . . . . . . . . . . 81Item 9A. Controls and Procedures . . . . . . . . . . . . . . . . . . . . . . . . . . . . . . . . . . . . . . . . . . . 81Item 9B. Other Information . . . . . . . . . . . . . . . . . . . . . . . . . . . . . . . . . . . . . . . . . . . . . . . . 82
PART III Item 10. Directors, Executive Officers and Corporate Governance . . . . . . . . . . . . . . . . . . . 82Item 11. Executive Compensation . . . . . . . . . . . . . . . . . . . . . . . . . . . . . . . . . . . . . . . . . . . 82Item 12. Security Ownership of Certain Beneficial Owners and Management and Related Shareholder Matters . . . . . . . . . . . . . . . . . . . . . . . . . . . . . . . . . . . . . 82Item 13. Certain Relationships and Related Transactions, and Director Independence . . . . . . 82Item 14. Principal Accounting Fees and Services . . . . . . . . . . . . . . . . . . . . . . . . . . . . . . . . 83
PART IV Item 15. Exhibits, Financial Statement Schedules. . . . . . . . . . . . . . . . . . . . . . . . . . . . . . . . 83Item 16. Form 10-K Summary . . . . . . . . . . . . . . . . . . . . . . . . . . . . . . . . . . . . . . . . . . . . . 83SIGNATURES . . . . . . . . . . . . . . . . . . . . . . . . . . . . . . . . . . . . . . . . . . . . . . . . . . . . . . . . . . . . . 87

1
PART I Item 1. Business. This Annual Report on Form 10-K (Report) contains forward-looking statements within the meaning of Section 27A of the Securities Act of 1933, as amended and Section 21E of the Securities Exchange Act of 1934, as amended (Exchange Act). These forward-looking statements are identified as any statement that does not relate strictly to historical or current facts and may include words such as “anticipate,” “believe,” “intend,” “plan,” “projection,” “forecast,” “strategy,” “position,” “continue,” “estimate,” “expect,” “may,” “will,” or the negative or other variations thereof. In particular, statements, express or implied, concerning future operating results or the ability to generate sales, income or cash flow are forward-looking statements. Undue reliance should not be placed on any forward-looking statements. Forward-looking statements are not guarantees of performance. They involve risks, uncertainties and assumptions that are beyond our ability to control or predict, including those discussed under Item 1A of this Report. Should one or more of these risks or uncertainties materialize, or should underlying assumptions prove incorrect, actual outcomes, including the future results of our operations, may vary materially from those indicated. The Company’s fiscal year ends on December 31. Consequently, references to 2018 relate to the calendar year ended December 31, 2018; references to 2017 relate to the calendar year ended December 31, 2017, etc.
General Benchmark Electronics, Inc. (Benchmark) is a Texas corporation that began operations in 1979 and is today a worldwide provider of innovative product design, engineering services, technology solutions and advanced manufacturing services (both electronic manufacturing services (EMS) and precision technology manufacturing machining services). In this Report, references to Benchmark, the Company or use of the words “we”, “our” and “us” include Benchmark’s subsidiaries unless otherwise noted. From initial product concept to volume production, including direct order fulfillment and aftermarket services, Benchmark has been providing integrated services and solutions to original equipment manufacturers (OEMs) since 1979. Today, Benchmark proudly serves the following industries: aerospace and defense (A&D), medical technologies, complex industrials, test and instrumentation, next-generation telecommunications and high-end computing. Our customer engagement focuses on three principal areas:
• Engineering Services, which include design for manufacturability, manufacturing process and test development, concurrent and sustaining engineering, turnkey product design and regulatory services. Our engineering services may be for systems, sub-systems, printed circuit boards and assemblies, and components. We provide these services across all the industries we serve, but focus primarily in regulated industries such as medical, complex industrials, aerospace and defense, and next-generation telecommunications.
• Technology Solutions, which involve developing a library of building blocks or reference designs primarily in
defense solutions, surveillance systems, radio frequency and high-speed design, and front-end managed connectivity data collection systems. We often merge these technology solutions with engineering services in order to support manufacturing services. Our reference designs can be utilized across a variety of industries but we have significant capabilities in the aerospace and defense and next generation telecommunication markets. We have also developed stronger capabilities in radio frequency (RF) and high speed design for both components and substrates. The need to reduce Size, Weight, and Power (SWaP) to accommodate high frequency electronics communications is important to customers in the aerospace and defense, medical, and next generation telecommunications markets.
2
• Manufacturing Services, which include printed circuit board assemblies (PCBAs) using both traditional surface mount technologies (SMT) and microelectronics, subsystem assembly, box build and systems integration. Systems integration often involves building a finished assembly that includes PCBAs, complex subsystem assemblies, mechatronics, displays, optics, and other components. These final products may be configured to order and delivered directly to the end-customer across all the industries we serve. Manufacturing services also includes precision technology manufacturing comprised of precision machining, advanced metal joining, assembly and functional testing primarily for customers in the test & instrumentation market (which includes semiconductor capital equipment) as well as the medical and aerospace and defense markets.
Our core strength lies in our ability to provide concept-to-production solutions in support of our customers. Our global manufacturing presence increases our ability to respond to our customers’ needs by providing accelerated time-to-market and time-to-volume production of high-quality products – especially for complex products with lower volume and higher mix in regulated markets. These capabilities enable us to build strong strategic relationships with our customers and to become an integral part of their business. We believe our primary competitive advantages are our engineering services (including product design), technology solutions, and manufacturing services (including electronics and precision technology capabilities) provided by highly skilled personnel. We continue to invest in our business to expand our skills and service offerings from direct customer inputs. We have a closed-loop feedback system in place to respond to customer ideas to enhance our future flexible design and manufacturing solutions in support of the full life cycle of their products. These solutions provide accelerated time-to-market, faster time-to-volume production, and reduced product development costs. Working closely with our customers and responding promptly to their needs, we become an integral part of their process to bring products to market faster and more economically. In addition, we believe that a strong focus on human capital through the talent we hire and retain is critical to maintaining our competitiveness. We are driving a customer-centric organization with a high degree of accountability and ownership to develop processes necessary to exceed customer expectations and deliver financial performance aligned to our goals. Through our employee feedback process, we solicit and act upon information to improve our company and better support our customers and business processes in the future. We have taken steps to attract the best leaders and are accelerating our efforts to mentor and develop key leaders for the future.
Our Industry Outsourcing engineering and manufacturing services enables OEMs to concentrate on their core strengths, such as research and development, branding, and marketing and sales. In an outsourcing model, OEMs also benefit from improved efficiencies and reduced production costs, reduced fixed capital investment requirements, improved inventory management, and access to global engineering and manufacturing. OEMs continue to turn to outsourcing to reduce time-to-market and time-to-volume production through utilization of their service providers’ product design and engineering services, technology solutions and manufacturing services. Outsourcing rates fluctuate periodically, and not all industries we serve are experiencing high outsourcing growth rates. The traditional markets of computing and telecommunications have used the outsourcing model for a number of years and have a lower outsourcing growth potential than the under-penetrated medical, complex industrials, aerospace and defense, and test & instrumentation markets, which we identify as our higher-value markets. The higher-value markets typically provide the opportunity for higher profitability than the traditional markets and in some cases provide the potential for stable growth. The higher-value markets also align well with Benchmark’s expertise in more complex and highly regulated products, and we believe we are well-positioned to capitalize on increased outsourcing in these markets.
3
Our Strategy Our goal is to be the solutions provider of choice to leading OEMs that we believe offer the greatest potential for profitable growth. To meet this goal, we have implemented the following strategies:
Focus on More Complex Products for Customers. EMS providers serve a wide range of OEMs in different industries, such as consumer electronics, internet-focused businesses and information technology equipment. The product scope ranges from easy-to-assemble, low-cost, high-volume products targeted for the consumer market to complicated, state-of-the-art, mission-critical products. Higher volume manufacturing customers in the more traditional markets of computing and telecommunications often compete on price with short product life cycles and require less value-add from EMS providers. Lower-volume manufacturing customers in the aerospace and defense, medical, and test & instrumentation markets are often in highly regulated industries where they are increasingly outsourcing higher value-added services to their EMS providers to meet stringent regulatory and time-to-market requirements. In the traditional markets, we focus on customers with more complex requirements such as high-performance computing and next generation telecommunications including 5G enabling devices and products; in the higher-value markets where outsourcing growth rates are increasing and product life cycles are longer, we focus on customers where there is a strong match between our capabilities and their needs. We have a long-term goal of generating over 75% of our sales from higher-value market customers, which should further expand our margins.
Lead with Engineering Solutions and Leverage Advanced Technology. In addition to strength in
manufacturing complex high-density PCBAs, complex mechanical systems, and full systems integration, we offer customers specialized and tailored advanced design solutions, including technology building blocks and engineering services. We provide this engineering expertise through our design capabilities in our design centers in the Americas, Europe and Asia. Leading with engineering is important to our strategy to increase sales to customers in our targeted higher-value markets where products require high quality and extremely reliable performance and low product failure rates. Through leveraging our advanced technology and engineering solutions, customers can focus on core branding and marketing initiatives while we focus on bringing their products to market faster and more efficiently.
Maintain and Develop Close, Long-Term Relationships with Customers. Our strategy is focused on
establishing long-term relationships with leading OEMs in expanding industries by becoming an integral part of their concept-to-production and full product life cycle requirements. To accomplish this, we rely on our global and local program and general management teams to respond with speed and flexibility to frequently changing customer design specifications and production requirements. We focus on caring for our customers and ensuring that their needs are consistently met and exceeded.
Deliver Complete High- and Low-Volume Manufacturing Solutions Globally. OEMs increasingly require
a wide range of specialized design engineering and manufacturing services from EMS providers in order to reduce costs and accelerate their time-to-market and time-to-volume production. Building on our integrated engineering and manufacturing capabilities, we offer services from initial product design and test to final product assembly and distribution to OEM customers. Our precision machining and complex mechanical manufacturing, along with our systems integration assembly and direct order fulfillment services, allow our customers the potential to reduce product cost and risk of product obsolescence by reducing their total work-in-process and finished goods inventory. These services are available at many of our manufacturing locations and allow us to offer customers the flexibility to move quickly from design and initial product introduction to production and distribution. We offer our customers the opportunity to combine the benefits of low-cost manufacturing (for the portions of their products or systems that can benefit from the use of these geographic areas) with the benefits and capabilities of our higher complexity support in Asia, Europe and the Americas.

4
Continue to Seek Cost Savings and Operational Excellence. We seek to optimize our network of facilities to provide cost-efficient services for our customers. We have a global culture of continuous improvement, sharing best practices and implementing lean principles. We will continue to drive lean and operational excellence initiatives with common global processes that allow us to optimize our cost structure and capacity. In support of our financial goals, we will continue a strong focus on cash conversion.
Pursue Strategic Acquisitions. Our capabilities have continued to grow through acquisitions and we will continue to selectively seek close-to-core bolt-on acquisitions which expand our technical capabilities. We have enhanced our capabilities through acquisitions:
In June 2013, we acquired Suntron Corporation (the Suntron Acquisition) to better serve customers in the aerospace and defense markets and expand our capabilities in Mexico.
In October 2013, we acquired the full-service EMS segment of CTS Corporation (the CTS Acquisition). The CTS Acquisition expanded our portfolio of customers in non-traditional and highly regulated markets and strengthened the depth and scope of our new product express capabilities on the West Coast.
In November 2015, we acquired Secure Communication Systems, Inc. and its subsidiaries (collectively, Secure Technology or Secure) (the Secure Acquisition), a leading provider of customized high-performance electronics, sub-systems, and component solutions for mission critical applications in highly regulated industrial, aerospace and defense markets.
In addition to expanding our global footprint, these acquisitions have enhanced our business in the following ways:
improved customer growth opportunities; developed strategic relationships; broadened service and solution offerings; provided vertical solutions; diversified our market sectors; and added experienced management teams.
Capital Allocation. We will also continue to operate with a balanced approach to capital deployment with
ROIC as the key determinant for prioritizing returns of free cash flow to our shareholders. Future investments may include organic growth through targeted investments, close-to-core acquisitions with strong technical capabilities, and a balance between managing our level of outstanding debt and returning capital to shareholders.
Services We Provide Through the Benchmark network, we offer a wide range of design, engineering, automation, test, manufacturing and fulfillment solutions that support our customers’ products from initial concept and design through prototyping, design validation, testing, ramp-to-volume production, worldwide distribution and aftermarket support. With our balanced footprint, we have the ability to serve global and regional customers. We support all of our service offerings with supply chain management systems, superior quality program management and sophisticated information technology systems. Our comprehensive service offerings enable us to provide a complete solution for our customers’ outsourcing requirements. All of our services are supported through a strong quality management system designed to globally provide the process discipline to reliably deliver high quality services, solutions and products to our customers. Engineering Services and Technology Solutions: Our approach is to coordinate and integrate our concept, design, prototype and other engineering capabilities in support of our customers’ go-to-market and product life cycle requirements. These services strengthen our relationships with our manufacturing customers and help attract new customers that require specialized design and

5
engineering services. Early engagement with engineering-led solutions is key to our strategy of focusing on products with greater complexity in our targeted markets.
New Product Design, Prototype, Testing and Related Engineering Services. We offer a full spectrum of new product design, automation, test development, prototype and related engineering for projects contracted by our customers who pay for and own the resulting designs in our contract design services business. We employ a proven seven-step process for concept-to-production in our design services model that enables a shorter product development cycle and gives our customers a competitive advantage in time-to-market and time-to-profit. Our multi-disciplined engineering teams provide expertise in a number of core competencies critical to serving OEMs in our target markets, including award-winning industrial design, mechanical and electrical hardware, firmware, software and systems integration and support. We create specifications, designs and quick-turn prototypes, and validate and ramp our customers’ products into volume manufacturing.
Custom Testing and Automation Equipment Design and Build Services. We provide our customers a
comprehensive range of custom automated test equipment, functional test equipment, process automation and replication solutions. We have expertise in tooling, testers, equipment control, systems planning, automation, floor control, systems integration, replication and programming. Our custom functional test equipment, process automation and replication solutions are available to our customers as part of our full-service product design and manufacturing solutions package or on a stand-alone basis for products designed elsewhere. We also provide custom test equipment and automation system solutions to OEMs, which pay for and own the designs. Our ability to provide these solutions allows us to capitalize on OEMs’ increasing needs for custom manufacturing solutions and provides an additional opportunity for us to introduce these customers to our comprehensive engineering and manufacturing services.
Technology Solutions. We are investing in building blocks and solutions such as secure defense turnkey design and reference platforms in avionics, ground vehicle electronics, munitions, and soldier platforms that require ruggedization for harsh environments and secure communications. We are developing advanced camera integration technology, high-frequency filters and a data collection network that integrates sensors, radios, gateways for data analytics.
Manufacturing Services (Electronics Manufacturing and Testing Services): As OEMs seek to provide greater functionality in smaller products, they increasingly require sophisticated manufacturing technologies and processes. Our investment in advanced manufacturing equipment and process development, as well as our experience in innovative packaging and interconnect technologies, enable us to offer a variety of advanced manufacturing solutions. These packaging and interconnect technologies include:
Printed Circuit Board Assembly (PCBA) & Test. We offer our customers expertise in a wide variety of traditional and advanced manufacturing technologies. Our technical expertise supports complex, printed circuit board assembly and test solutions, assembly of subsystems, circuitry and functionality testing of printed assemblies, environmental and stress testing and component reliability testing.
We provide our customers with a comprehensive set of PCBA manufacturing technologies and solutions, which include:
Surface mount technology - Fine Pitch Ball Grid Array - Land Grid Array - Quad Flat No-Leads - Package on Package - 01005 Discrete Components
Pin in Hole Technology; Pin in Paste Technology;
6
Hybrid RoHS soldering processes; Flip Chip; Chip On Board and Wire Bonding; In-Circuit Test; Microelectronics; Board Level Functional Testing; and Vibration, ESS, HASS and HALT.
We also provide specialized solutions in support of our customers’ components, products and systems, which include:
Conformal Coating; Ultrasonic Welding; Automation Solutions; Complex Final Assembly; Fluidics Assembly; Splicing and Connectorization for Optical Applications; Hybrid Optical/Electrical Printed Circuit Board Assembly and Testing; and Sub-Micron Alignment of Optical Sub-Assemblies.
Component Engineering Services. We provide support to our customers to understand the evolving
international environmental laws and regulations on content, packaging, labeling and similar issues concerning the environmental impact of their products including: “RoHS” (EU Directive 2011/65/EC on Restriction of certain Hazardous Substances); “WEEE” (EU Directive 2002/96/EC on Waste Electrical and Electronic Equipment); “REACH” (EC Regulation No 1907/2006 on Registration, Evaluation and Authorization of Chemicals); EU Member States’ Implementation of the foregoing; and the People’s Republic of China (PRC) Measures for Administration of the Pollution Control of Electronic Information Products of 2006. Manufacturing sites in the Americas, Asia and Europe regions are experienced with both water soluble and no-clean processes.
Systems Assembly & Test. We offer a full spectrum of subsystem and system integration services. These
include assembly, configuration and testing for all industries we service. We design, develop and build product-specific manufacturing processes utilizing manual, mechanized or fully automated lines to meet our customers’ product volume and quality requirements. We work with our customers to develop product-specific test strategies. Our test capabilities include manufacturing defect analysis, in-circuit tests to check the circuitry of the board and functional tests to confirm that the board or assembly operates in accordance with its final design and manufacturing specifications. We either custom design test equipment and software ourselves or use test equipment and software provided by our customers. We also offer our own internally designed functional test solutions for cost-effective and flexible test solutions, and provide environmental stress tests of assemblies of boards or systems. We also provide product life cycle testing services, such as ongoing reliability testing where units are continuously cycled for extended testing while monitoring for early-life failures.
Failure Analysis. We offer an array of analytical solutions and expertise to help our customers address their
most challenging engineering and business issues. This includes focused techniques for failure mode, failure mechanism, and root cause determination. Specialized analytical skill sets associated with electrical, mechanical, and metallurgical disciplines are used in conjunction with a vast array of equipment such as ion chromatography, x-ray florescence, and scanning electron microscopy. Our state-of-the-art lab facilities provide customers with detailed reporting and support in an unbiased, timely and cost-effective manner. Mastering emerging technologies, coupled with an understanding of potential failure mechanisms, positions us to exceed customer expectations and maintain our technological diversity.
7
Mechanical Manufacturing Services (Precision Machining and Complex Vertically Integrated Assemblies): In addition to traditional EMS, we offer complex precision machining including full electromechanical assembly and testing services.
Precision Technologies Group. We provide vertically integrated precision machining and complex
electromechanical assemblies. The processes supporting these include: Complex Small / Medium / Large Precision Machining; Multi-Axis Robotic Grinding for demanding applications such as turbine blades and scientific
instruments; Complex Clean Room Assembly and Functional Test; Major Electromechanical Assemblies; and Sheet metal and paint;
Large precision and industrial frames; and Advanced metal joining including vacuum chamber welding, electron beam laser and brazing.
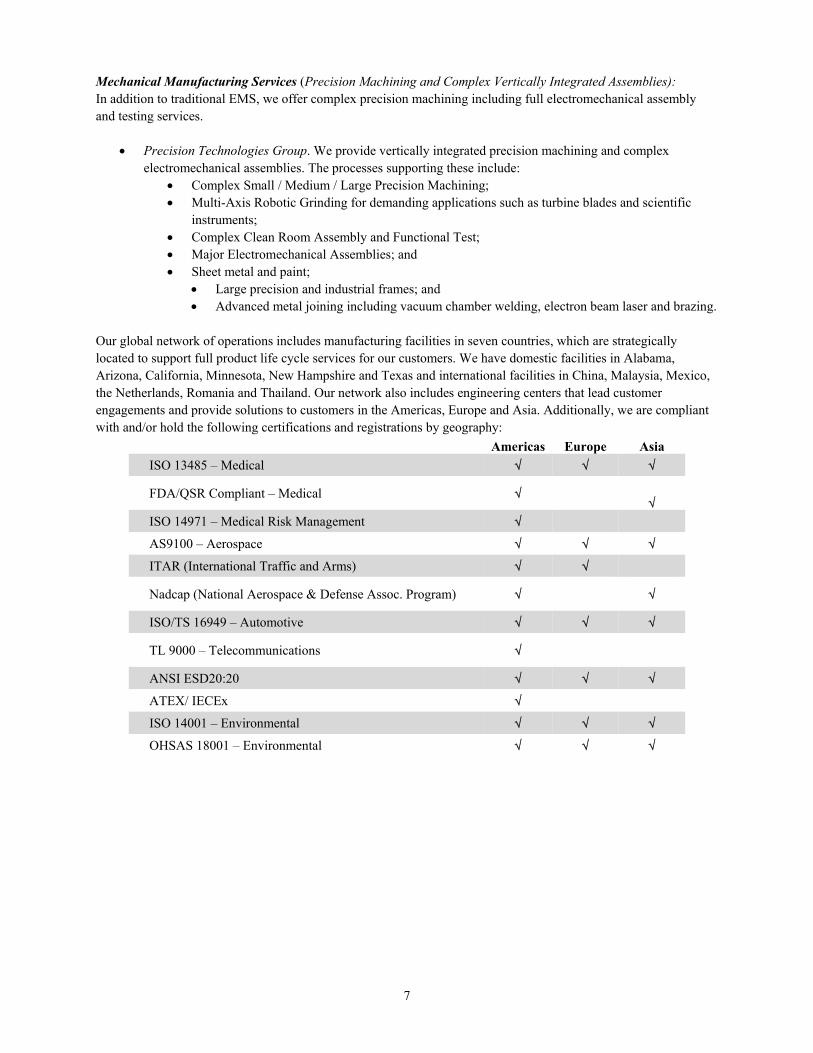
Our global network of operations includes manufacturing facilities in seven countries, which are strategically located to support full product life cycle services for our customers. We have domestic facilities in Alabama, Arizona, California, Minnesota, New Hampshire and Texas and international facilities in China, Malaysia, Mexico, the Netherlands, Romania and Thailand. Our network also includes engineering centers that lead customer engagements and provide solutions to customers in the Americas, Europe and Asia. Additionally, we are compliant with and/or hold the following certifications and registrations by geography:
Americas Europe Asia
ISO 13485 – Medical
FDA/QSR Compliant – Medical
ISO 14971 – Medical Risk Management AS9100 – Aerospace
ITAR (International Traffic and Arms)
Nadcap (National Aerospace & Defense Assoc. Program)
ISO/TS 16949 – Automotive
TL 9000 – Telecommunications
ANSI ESD20:20
ATEX/ IECEx ISO 14001 – Environmental
OHSAS 18001 – Environmental
8
Supply Chain, Order Fulfillment, and Aftermarket Support Services: Our customers often face challenges in designing supply chains, demand planning, procuring materials and managing their inventories efficiently due to fluctuations in their customer demand, product design changes, short product life cycles and component price fluctuations.
We employ enterprise resource planning (ERP) systems and lean manufacturing principles to manage procurement and manufacturing processes in an efficient and cost-effective manner so that, where possible, components arrive on a just-in-time, as-and-when-needed basis. Because we are a significant purchaser of electronic components and other raw materials, we are able to capitalize on the economies of scale associated with our relationships with suppliers to negotiate price discounts, obtain components and other raw materials that are in short supply, and return excess components. Our agility and expertise in supply chain management and our relationships with suppliers across the supply chain enable us to help reduce our customers’ cost of goods sold and inventory exposure.
In support of our engineering services, technology solutions and manufacturing services, we offer our customers a wide array of capabilities from early supply chain design, to order fulfillment, to aftermarket services.
Value-Added Support Systems. We support our engineering, manufacturing, distribution and aftermarket
support services with an efficient supply chain management system and a superior quality management program. Our value-added support services are primarily implemented and managed through a web-based information technology system that enables us to collaborate with our customers throughout all stages of the engineering, manufacturing and order-fulfillment processes.
Supply Chain Management. We offer full end-to-end supply chain design, inventory-management and
volume-procurement capabilities to provide assurance of supply, optimized cost, and reduce total cycle time. Our materials strategy focuses on leveraging our procurement volume Company-wide while providing local execution for maximum flexibility. We employ a full complement of electronic data interchange transactions with our suppliers to coordinate forecasts, orders, reschedules, and inventory and component lead times. Our enterprise resource planning systems provide product and production information to our supply chain management, engineering change management and floor control systems. Our information systems include a proprietary module that controls serialization, production and quality data for all of our facilities around the world using state-of-the-art statistical process control techniques for continuous process improvements. To enhance our ability to rapidly respond to changes in our customers’ requirements by effectively managing changes in our supply chain, we utilize web-based interfaces and real-time supply chain management software products, which allow for scaling operations to meet customer needs, shifting capacity in response to product demand fluctuations, reducing materials costs and effectively distributing products to our customers or their end-customers.
Direct Order Fulfillment. We provide direct order fulfillment for some of our OEM customers. Direct order
fulfillment involves receiving customer orders, configuring products to quickly fill the orders and delivering the products either to the OEM, a distribution channel or directly to the end customer. We manage our direct order fulfillment processes using a core set of common systems and processes that receive order information from the customer and provide comprehensive supply chain management, including procurement and production planning. These systems and processes enable us to process orders for multiple system configurations and varying production quantities, including single units. Our direct order fulfillment services include build-to-order (BTO) and configure-to-order (CTO) capabilities. BTO involves building a complete system in real-time to a highly customized configuration ordered by the OEM’s end customer. CTO involves configuring systems to an end customer’s specifications at the time the product is ordered. The end customer typically places this order by choosing from a variety of possible system configurations and options. We are capable of meeting a 2- to 24-hour turnaround time for BTO and CTO. We support our direct order fulfillment services with logistics that include delivery of parts and assemblies to the final assembly site, distribution and shipment of finished systems, and processing of customer returns.

9
Aftermarket Non-Warranty Services. We provide our customers a range of aftermarket non-warranty
services, including repair, replacement, refurbishment, remanufacturing, exchange, systems upgrade and spare part manufacturing throughout a product’s life cycle. These services are tracked and supported by specific information technology systems that can be tailored to meet our customers’ individual requirements.
Marketing and Customers We market our services and solutions primarily through a direct sales force organized by market sector. In addition, our engineering, operational, and executive management teams are an integral part of our sales and marketing approach. We generally enter into supply arrangements with our customers. These arrangements generally govern the conduct of our business with customers relating to, among other things, the design and manufacturing of products that in some cases were previously produced by the customer. The arrangements also generally identify the specific products to be designed and manufactured, quality and production requirements, product pricing and materials management. There can be no assurance that these arrangements will remain in effect or be renewed, but we focus intently on customer care in an effort to anticipate and meet the current and future needs of our customers. Our key customer accounts are supported by dedicated teams directly responsible for account management. These teams coordinate activities across the Benchmark global network to effectively satisfy customer requirements and have direct access to leadership and executive management to quickly address customer concerns. Local program managers and customer account teams further support the global teams and are linked by a comprehensive communications and information management infrastructure. In addition, our executive management is heavily involved in customer relations and devotes significant attention to broadening existing and developing new customer relationships. The following table sets forth the percentages of our sales by sector for 2018, 2017 and 2016.
Higher-Value Markets 2018 2017 2016
Industrials . . . . . . . . . . . . . . . . . . . . . . . . . . . . . . . . . . . . 19 % 20 % 23 %
A&D . . . . . . . . . . . . . . . . . . . . . . . . . . . . . . . . . . . . . . . 16 16 16
Medical . . . . . . . . . . . . . . . . . . . . . . . . . . . . . . . . . . . . . . 15 15 15
Test & Instrumentation . . . . . . . . . . . . . . . . . . . . . . . . . . . 14 14 11
64 % 65 % 65 % Traditional Markets 2018 2017 2016
Computing . . . . . . . . . . . . . . . . . . . . . . . . . . . . . . . . . . . 23 % 22 % 19 %
Telecommunications . . . . . . . . . . . . . . . . . . . . . . . . . . . . 13 13 16 36 % 35 % 35 % 100 % 100 % 100 %
A substantial percentage of our sales are made to a small number of customers, and the loss of a major customer, if not replaced, would adversely affect us. Sales to our ten largest customers represented 44%, 46% and 43% of our sales in 2018, 2017 and 2016, respectively. In 2018, sales to International Business Machines Corporation represented 13% of our sales. In 2017, sales to International Business Machines Corporation and Applied Materials, Inc. represented 12% and 10%, respectively, of our sales. In 2016, no single customer represented 10% or more of our sales. For additional information, see “Risk Factors—The loss of a major customer would adversely affect us” in Item 1A of this Report and “2018 Highlights” in Item 7 of this Report.
10
Seasonality Seasonality in our business has historically been driven by customer and product mix, particularly the industries that our customers serve. Although we have historically experienced higher sales during the fourth quarter, this pattern does not repeat itself every year. In addition, we typically experience our lowest sales volume in the first quarter of each year.
Suppliers We maintain a network of suppliers of components and other materials used in our operations. We procure components when a purchase order or forecast is received from a customer and occasionally utilize components or other materials for which a supplier is the single source of supply. If any of these single-source suppliers were unable to provide these materials, a shortage of components could temporarily interrupt our operations and lower our profits until an alternate component could be identified and qualified for use. For additional information, see “Risk Factors—Shortages or price increases of components specified by our customers would delay shipments and adversely affect our profitability” in Item 1A of this Report. Although we occasionally experience component shortages and longer lead times for various components, we have generally been able to reduce the impact of component shortages by working with customers to reschedule deliveries and with suppliers to provide the needed components using just-in-time inventory programs, or by purchasing components at slightly higher prices from distributors rather than directly from manufacturers. In addition, by developing long-term relationships with suppliers, we have been better able to minimize the effects of component shortages compared to manufacturers without such relationships. The goal of these procedures is to reduce our inventory risk.
Backlog We had sales backlog of approximately $2.1 billion at December 31, 2018, as compared to the 2017 year-end backlog of $2.0 billion. Backlog consists of purchase orders received, and other forecast requirements under customer contracts which can be subject to change. Although we expect to fill substantially all of our year-end backlog during 2019, we do not currently have long-term agreements with all of our customers, and customer orders can be canceled, changed or delayed. The timely replacement of canceled, changed or delayed orders with orders from new customers cannot be assured, nor can there be any assurance that any of our current customers will continue to utilize our services. Because of these factors, our backlog is not a meaningful indicator of future financial results.
Competition The services we provide are available from many independent sources as well as from the in-house manufacturing capabilities of current and potential customers. Our competitors include Celestica Inc., Flex Ltd., Hon Hai Precision Industry Co., Ltd., Jabil Circuit, Inc., Plexus Corp and Sanmina Corporation, some of whom have greater financial, manufacturing or marketing resources than we do. We believe that the principal competitive factors in our targeted markets are engineering solutions capabilities, product quality, flexibility, cost and timeliness in responding to design and schedule changes, reliability in meeting product delivery schedules, pricing, technological sophistication and geographic location. In addition, original design manufacturers (ODMs) that provide design and manufacturing services to OEMs have significantly increased their share of outsourced manufacturing services provided to OEMs in traditional markets, such as computing and telecommunication. Competition from ODMs may increase if our business in these markets grows or if ODMs expand further into or beyond these markets.
11
Sustainability Benchmark is committed to being “sustainable”. Being sustainable describes our long-term approach to social, economic and environmental goals to contribute to a more sustained world consistent with our business objectives. Our sustainability priorities include:
upholding the principle of human rights and observing fair labor practices within our organization and our supply chain;
protecting the environment by conserving energy and natural resources and avoiding pollution through appropriate management technology and practices;
ensuring ethical organizational governance; and observing fair, transparent and accountable operating practices.
All Benchmark manufacturing facilities are either currently certified or undergoing certification to ISO 14001. Benchmark endorsed the Electronics Industry Citizenship Coalition Code of Conduct and flows specific requirements to our supply chain through our contracts, Supplier Assurance Manual and Supplier Code of Conduct.
Governmental Regulation Our operations, and the operations of businesses that we acquire, are subject to foreign, federal, state and local regulatory requirements relating to security clearance, trade compliance, anticorruption, environmental, waste management, and health and safety matters. We seek to operate in compliance with all applicable requirements. Significant costs and liabilities may arise from these requirements or from new, modified or more stringent requirements, which could affect our earnings and competitive position. In addition, our past, current and future operations, and those of businesses we acquire, may give rise to claims of exposure by employees or the public or to other claims or liabilities relating to environmental, waste management or health and safety concerns. We periodically generate and temporarily handle limited amounts of materials that are considered hazardous waste under applicable law. We contract for the off-site disposal of these materials and have implemented a waste management program to address related regulatory issues. For additional information, see “Risk Factors—Compliance or the failure to comply with environmental regulations could cause us significant expense” in Item 1A of this Report.
Employees As of December 31, 2018, we employed approximately 10,500 people, approximately 370 of whom were engaged in design and development engineering. None of our domestic employees are represented by a labor union. In certain international locations, our employees are represented by labor unions and by works councils. Some European countries also often have mandatory legal provisions regarding terms of employment, severance compensation and other conditions of employment that are more restrictive than U.S. laws. We have never experienced a strike or similar work stoppage, and we believe that our employee and labor relations are good.
Segments and International Operations We have manufacturing facilities in the Americas, Asia and Europe to serve our customers. Benchmark is operated and managed geographically, and management evaluates performance and allocates resources on a geographic basis. We currently operate outside the United States in China, Malaysia, Mexico, the Netherlands, Romania and Thailand. During 2018, 2017 and 2016, 45%, 47% and 45%, respectively, of our sales were from our international operations. See Note 10 and Note 15 of Notes to Consolidated Financial Statements in Item 8 of this Report for segment and geographical information.

12
Available Information Our website may be viewed at http://www.bench.com. Reference to our website is for informational purposes only and the information contained therein is not incorporated by reference into this annual report. We make available free of charge through our internet website our filings with the Securities and Exchange Commission (SEC), including our annual reports on Form 10-K, quarterly reports on Form 10-Q, current reports on Form 8-K, and amendments to those reports filed or furnished pursuant to Section 13(a) or 15(d) of the Exchange Act as soon as reasonably practicable after electronically filing such material with, or furnishing it to, the SEC. All reports we file with the SEC are also available free of charge via EDGAR through the SEC’s website at http://www.sec.gov. Item 1A. Risk Factors.
The following risk factors should be read carefully when reviewing the Company’s business, the forward-looking statements contained in this Report, and the other statements the Company or its representatives make from time to time. Any of the following factors could materially and adversely affect the Company’s business, operating results, financial condition and the actual results of the matters addressed by the forward-looking statements. We are exposed to general economic and market conditions that could have a material adverse impact on our business, operating results and financial condition. Uncertainty over the erosion of global consumer confidence, geopolitical issues, the availability and cost of credit, concerns about volatile energy costs, declining asset values, inflation, rising unemployment, and the stability and solvency of financial institutions, financial markets, businesses, and sovereign nations has slowed global economic growth and resulted in recessions in many countries, including in the United States, Europe and certain countries in Asia over the past several years. The economic recovery of recent years is fragile, and recessionary conditions may return. Any of these potential negative economic conditions may reduce demand for our customers’ products and adversely affect our sales. Consequently, our past operating results, earnings and cash flows may not be indicative of our future operating results, earnings and cash flows. In addition to our customers or potential customers reducing or delaying orders, a number of other negative effects on our business could materialize, including the insolvency of key suppliers, which could result in production delays, shorter payment terms from suppliers due to reduced availability of credit default insurance in the market, the inability of customers to obtain credit, and the insolvency of one or more customers. Any of these effects could impact our ability to effectively manage inventory levels and collect receivables, increase our need for cash, and decrease our net revenue and profitability. In cases where the evidence suggests a customer may not be able to satisfy its obligation to us, we establish reserves in an amount we determine appropriate for the perceived risk. There can be no assurance that our reserves will be adequate. If the financial condition of our customers were to deteriorate, resulting in an impairment of their ability to make payments, additional receivable and inventory reserves may be required and restructuring charges may be incurred. Shortages or price increases of components specified by our customers would delay shipments and adversely affect our profitability. Substantially all of our sales are derived from manufacturing services in which we purchase components specified by our customers. In the past, supply shortages have substantially curtailed production of all assemblies using a particular component and industry-wide shortages of electronic components, particularly of memory and logic devices, have occurred. For example, the 2011 earthquake and tsunami in Japan disrupted the global supply chain for certain components manufactured in Japan that were incorporated in the products we manufactured. The 2011 Thailand flood had a similar impact. Any such component shortages may result in delayed shipments, which could have an adverse effect on our profit margins. Because of the continued increase in demand for surface mount
13
components, we anticipate component shortages and longer lead times for certain components to occur from time to time. Also, we may bear the risk of component price increases that occur between periodic re-pricings of products during the term of a customer contract. Accordingly, certain component price increases could adversely affect our gross profit margins. We are dependent on the success of our customers and the markets in which they operate. When our customers or the markets in which they operate experience declines or grow at a significantly slower pace than anticipated, we may be adversely affected. We are dependent on the continued growth, viability and financial stability of our customers. Our customers are OEMs of:
industrial equipment, equipment for the aerospace and defense industries; telecommunication equipment; computers and related products for business enterprises; medical devices; and testing and instrumentation products.
These markets are subject to rapid technological change, vigorous competition, short product life cycles and consequent product obsolescence. When our customers are adversely affected by these factors, we may be similarly affected. The loss of a major customer would adversely affect us. Our sales are dependent on the success of our customers, some of which operate in businesses associated with rapid technological change and consequent product obsolescence. Developments adverse to our major customers or their products, or the failure of a major customer to pay for components or services, could have an adverse effect on us. A substantial percentage of our sales are made to a small number of customers, and the loss of a major customer, if not replaced, would adversely affect us. Sales to our ten largest customers represented 44%, 46% and 43% of our sales in 2018, 2017 and 2016, respectively. In 2018, sales to International Business Machines Corporation represented 13% of our sales. Further, as part of our ongoing process to review marginal and dilutive contracts, we have notified a Computing customer that we will not renew in its current form a legacy contract that expires at the end of 2019. We expect to continue to depend on sales to our largest customers, and any material delay, cancellation or reduction of orders from these customers or other significant customers would have a material adverse effect on our results of operations. In addition, we generate significant accounts receivable in connection with providing services to our customers. If one or more of our customers were to become insolvent or otherwise unable to pay for the services provided by us, our operating results and financial condition would be adversely affected.

14
Most of our customers do not commit to long-term production schedules, which makes it difficult for us to schedule production and achieve maximum efficiency of our manufacturing capacity. The volume and timing of sales to our customers vary due to:
changes in demand for their products; their attempts to manage their inventory; design changes; changes in their manufacturing strategies; and acquisitions of, or consolidations among, customers.
Due in part to these factors, most of our customers do not commit to firm production schedules for more than one quarter in advance. Our inability to forecast the level of customer orders with certainty makes it difficult to schedule production and maximize utilization of manufacturing capacity. In the past, we have been required to increase staffing and other expenses in order to meet the anticipated demand of our customers. Anticipated orders from many of our customers have, in the past, failed to materialize or delivery schedules have been deferred as a result of changes in our customers’ business needs, thereby adversely affecting our results of operations. On other occasions, our customers have required rapid increases in production, which have placed an excessive burden on our resources. Such customer order fluctuations and deferrals have had a material adverse effect on us in the past, and may again in the future. A business downturn resulting from any of these external factors could have a material adverse effect on our operating income. See Management’s Discussion and Analysis of Financial Condition and Results of Operations in Item 7 of this Report. Winning business is subject to lengthy, competitive bid selection processes that often require us to incur significant expense, from which we may ultimately generate no revenue. Our business is dependent on us winning competitive bid selection processes. These selection processes are typically lengthy and can require us to dedicate significant development expenditures and scarce engineering resources in pursuit of a single customer opportunity. Failure to obtain a particular design win may prevent us from obtaining design wins in subsequent generations of a particular product. This can result in lost revenue and could weaken our position in future competitive bid selection processes. Our customers may cancel their orders, change production quantities, delay production or change their sourcing strategies. EMS providers must provide increasingly rapid product turnaround for their customers. We generally do not obtain firm, long-term purchase commitments from our customers, and we continue to experience reduced lead-times in customer orders. Customers may cancel their orders, change production quantities, delay production or change their sourcing strategy for a number of reasons. Cancellations, reductions, delays or changes in the sourcing strategy by a significant customer or by a group of customers could negatively impact our operating income. In addition, we make significant decisions, including determining the levels of business that we will seek and accept, production schedules, component procurement commitments, personnel needs, capital expenditures and other resource requirements, based on our estimate of customer requirements. The short-term nature of our customers’ commitments and the possibility of rapid changes in demand for their products impede our ability to accurately estimate the future requirements of those customers. The degree of success or failure of our customers’ products in the market also affects our business. On occasion, customers require rapid increases in production, which can stress our resources and reduce operating margins. In addition, because many of our costs and operating expenses are relatively fixed, a reduction in customer demand can harm our gross profits and operating results. See Management’s Discussion and Analysis of Financial Condition and Results of Operations in Item 7 of this Report.

15
We may encounter significant delays or defaults in payments owed to us by customers for products we have manufactured or components that are unique to particular customers. We structure our agreements with customers to mitigate our risks related to obsolete or unsold inventory. However, enforcement of these contracts may result in material expense and delay in payment for inventory. If any of our significant customers become unable or unwilling to purchase such inventory, our business may be materially harmed. See Management’s Discussion and Analysis of Financial Condition and Results of Operations in Item 7 of this Report. Government contracts are subject to significant regulation, including rules related to bidding, billing, kickbacks and false claims, and any non-compliance could subject us to fines and penalties or debarment.
Like all government contractors, we are subject to risks associated with this contracting. These risks include substantial civil and criminal fines and penalties if we were to fail to follow procurement integrity and bidding rules or cost accounting standards, employ improper billing practices, receive or pay kickbacks or file false claims. We have been, and expect to continue to be, subjected to audits and investigations by U.S. and foreign government agencies and authorities. The failure to comply with the terms of our government contracts could result in progress payments being withheld, our suspension or debarment from future government contracts or harm to our business reputation. Our financial results depend, in part, on our ability to perform on our U.S. government contracts, which are subject to uncertain levels of funding, timing and termination. We provide services both as a prime contractor and subcontractor for the U.S. government. Consequently, a portion of our financial results depends on our performance under these contracts. Delays, cost overruns or product failures in connection with one or more contracts, could lead to their termination and negatively impact our results of operations, financial condition or liquidity. We can give no assurance that we would be awarded new contracts to offset the revenues lost as a result of such a termination. U.S. government programs require congressional appropriations, which are typically made for a single fiscal year even though a program may extend over several years. Programs often are only partially funded, and additional funding requires further congressional appropriations. The programs in which we participate compete with other programs for consideration and funding during the budget and appropriations process, which can be impacted by shifting and often competing political priorities. Our government contracts often involve the development, application and manufacture of advanced defense and technology systems and products aimed at achieving challenging goals. New technologies used for these contracts may be untested or unproven and product requirements and specifications may be modified. Consequently, technological and other performance difficulties may cause delays, cost overruns or product failures. Moreover, there can be no assurance that the amounts we spend to develop new products or solutions to compete for a government contract will be recovered since we may not be awarded the contract.
16
Our international operations are subject to certain risks. During 2018, 2017 and 2016, 45%, 47% and 45%, respectively, of our sales were from our international operations. These international operations are subject to a number of risks, including:
difficulties in staffing and managing foreign operations; coordinating communications and logistics across geographic distances and multiple time zones; less flexible employee relationships, which complicate meeting demand fluctuations and can be difficult
and expensive to terminate; political and economic instability (including acts of terrorism and outbreaks of war), which could impact
our ability to ship and/or receive product; changes in foreign or domestic government policies, regulatory requirements and laws, which could
impact our business; longer customer payment cycles and difficulty collecting accounts receivable; export duties, import controls and trade barriers (including quotas and border taxes); governmental restrictions on the transfer of funds; risk of governmental expropriation of our property; burdens of complying with a wide variety of foreign laws and labor practices, including various and
changing minimum wage regulations; fluctuations in currency exchange rates, which could affect foreign taxes due, component costs, local
payroll, utility and other expenses; and inability to utilize net operating losses incurred by our foreign operations to reduce our U.S. income
taxes. Changes made that impact the way we operate internally could have a negative impact on us and reduce the demand for our foreign manufacturing facilities. Moreover, any retaliatory actions by other countries where we operate could also negatively impact our financial performance. In addition, changes in policies by the U.S. or other governments could negatively affect our operating results due to trade wars, changes in duties, tariffs or taxes, currency exchange rate fluctuations, or limitations on currency or fund transfers, as well as government-imposed restrictions on producing certain products in, or shipping them to, specific countries. For example, potential changes in the North American Free Trade Agreement (NAFTA), including as a result of the U.S.-Mexico-Canada Agreement, could adversely affect our operations in Mexico. Also, our current facilities in Mexico operate under the Mexican Maquiladora (IMMEX) program. This program provides for reduced tariffs and eased import regulations. We could be adversely affected by changes in the IMMEX program or our failure to comply with its requirements. Additionally, increasing tariffs and other trade protection measures between the U.S. and China may affect the cost of our products originating in China as well as the demand for our products manufactured in China in the event our customers reduce operations in China as a result of such tariffs or trade protection measures. These actions could also affect the cost and/or availability of components that we procure from suppliers in China. In addition, several of the countries where we operate have emerging or developing economies, which may be subject to greater currency volatility, negative growth, high inflation, limited availability of foreign exchange and other risks. Certain events, including natural disasters, can impact the infrastructure of a developing country more severely than they would impact the infrastructure of a developed country. A developing country can also take longer to recover from such events, which could lead to delays in our ability to resume full operations. These factors may harm our results of operations, and any measures that we may implement to reduce the effect of volatile currencies and other risks of our international operations may not be effective. In our experience, entry into new international markets requires considerable management time as well as start-up expenses for market development, hiring and establishing office facilities before any significant revenues are generated. As a result, initial operations in a new market may operate at low margins or may be unprofitable. Certain foreign jurisdictions, as well as the U.S. government, restrict the amount of cash that can be transferred to the U.S. or impose taxes and penalties on such transfers of cash. To the extent we have excess cash in foreign

17
locations that could be used in, or is needed by, our operations in the United States, we may incur penalties and/or taxes to repatriate these funds. Another significant legal risk resulting from our international operations is compliance with the U.S. Foreign Corrupt Practices Act (FCPA). In many foreign countries, particularly in those with developing economies, it may be a local custom that businesses operating in such countries engage in business practices that are prohibited by the FCPA, other U.S. laws and regulations, or similar laws of host countries and related anti-bribery conventions. Although we have implemented policies and procedures designed to comply with the FCPA and similar laws, there can be no assurance that all of our employees, agents, or those companies to which we outsource certain of our business operations, will not take actions in violation of our policies. Any such violation, even if prohibited by our policies, could have a material adverse effect on our business. Regulatory, legislative or self-regulatory/standard developments regarding privacy and data security matters could adversely affect our ability to conduct our business.
U.S. privacy and data security laws apply to our various businesses. We also do business globally in countries that have more stringent data protection laws than those in the United States that may be inconsistent across jurisdictions and are subject to evolving and differing interpretations. Governments, privacy advocates and class action attorneys are increasingly scrutinizing how companies collect, process, use, store, share and transmit personal data. In Europe, the General Data Protection Regulation (GDPR) requires us to protect the privacy of certain personal data of European Union (EU) citizens. While we have implemented processes and controls to comply with GDPR requirements, we could incur significant fines, individual damages and reputational risks if our controls and processes are ineffective and we fail to comply.
We operate in a highly competitive industry; if we are not able to compete effectively in the EMS industry, our business could be adversely affected. We compete against many providers of electronics manufacturing services. Some of our competitors have substantially greater resources and more geographically diversified international operations than we do. Our competitors include Celestica Inc., Flex Ltd., Hon Hai Precision Industry Co., Ltd., Jabil Circuit, Inc., Plexus Corp and Sanmina Corporation, some of whom have greater financial, manufacturing or marketing resources than we do. In addition, we may in the future encounter competition from other large electronic manufacturers that are selling, or may begin to sell, electronics manufacturing services. We also face competition from the manufacturing operations of our current and future customers, who are continually evaluating the merits of manufacturing products internally against the advantages of outsourcing to EMS providers. In addition, in recent years, ODMs that provide design and manufacturing services to OEMs, have significantly increased their share of outsourced manufacturing services provided to OEMs in several markets, such as notebook and desktop computers, personal computer motherboards, and consumer electronic products. Competition from ODMs may increase if our business in these markets grows or if ODMs expand further into or beyond these markets. During periods of recession in the electronics industry, our competitive advantages in the areas of quick turnaround manufacturing and responsive customer service may be of reduced importance to electronics OEMs, who may become more price sensitive. We may also be at a competitive disadvantage with respect to price when compared to manufacturers with lower cost structures, particularly those with more offshore facilities located where labor and other costs are lower. We experience intense competition, which can intensify further as more companies enter the markets in which we operate, as existing competitors expand capacity and as the industry consolidates. The availability of excess manufacturing capacity at many of our competitors creates intense pricing and competitive pressure on the EMS industry as a whole. To compete effectively, we must continue to provide technologically advanced manufacturing
18
services, maintain strict quality standards, respond flexibly and rapidly to customers’ design and schedule changes and deliver products globally on a reliable basis at competitive prices. Our inability to do so could have an adverse effect on us. We may experience fluctuations in quarterly results. Our quarterly results may vary significantly depending on various factors, many of which are beyond our control. These factors include:
the volume of customer orders relative to our capacity; customer introduction and market acceptance of new products; changes in demand for customer products; seasonality in demand for customer products; pricing and other competitive pressures; the timing of our expenditures in anticipation of future orders; our effectiveness in managing manufacturing processes; changes in cost and availability of labor and components; changes in our product mix; changes in tax laws in the jurisdictions in which we operate; changes in tariffs, trade agreements and other trade protection measures; fluctuations in currency exchange rates; changes in political and economic conditions; and local factors and events that may affect our production volume, such as local holidays or natural
disasters.
Additionally, as is the case with many high technology companies, a significant portion of our shipments typically occur in the last few weeks of a given quarter. Accordingly, sales shifts from quarter to quarter may not be readily apparent until the end of a given quarter, and may have a significant effect on projected and reported results. Acquisitions may pose difficulties for us. Our capabilities have historically grown through acquisitions, and we may pursue additional acquisitions in the future. Our projections of results and successfully integrating acquired operations into our network involve risks, including:
integration and management of the operations; as noted above, demand can vary, and our projections of results may be wrong due to deferred or
reduced demand; retention of key personnel; integration of purchasing operations and information systems; retention of the customer base of acquired businesses; management of an increasingly larger and more geographically disparate business; the possibility that past transactions or practices may lead to future commercial or regulatory risks; and diversion of management’s attention from other ongoing business concerns.
Our profitability will suffer if we are unable to successfully integrate an acquisition, if the acquisition does not further our business strategy as we expected or if we do not achieve sufficient revenue to offset the increased expenses associated with these acquisitions. We may overpay for, or otherwise not realize the expected return on, our investments, which could adversely affect our operating results and potentially cause impairments to assets that we record as a part of an acquisition including intangible assets and goodwill.
19
Start-up costs and inefficiencies related to new or transferred programs can adversely affect our operating results and such costs may not be recoverable if the new programs or transferred programs are cancelled. Start-up costs, the management of labor and equipment resources in connection with the establishment of new programs and new customer relationships, and the need to estimate required resources in advance can adversely affect our gross margins and operating results. These factors are particularly evident in the early stages of the life cycle of new products and new programs or program transfers and in the opening of new facilities. These factors also affect our ability to efficiently use labor and equipment. We are currently managing a number of new programs. If any of these new programs or new customer relationships were terminated, our operating results could be harmed, particularly in the short term. We may not be able to recoup these start-up costs or replace anticipated new program revenues. We may be affected by consolidation in the electronics industry, which could create increased pricing and competitive pressures on our business. Consolidation in the electronics industry could result in a decrease in manufacturing capacity as companies seek to close plants or take other steps to increase efficiencies and realize synergies of mergers, creating increased pricing and competitive pressures for the EMS industry as a whole and our business in particular. In addition, consolidation could also result in an increasing number of very large electronics companies offering products in multiple sectors of the electronics industry. The growth of these large companies, with significant purchasing and marketing power, could also result in increased pricing and competitive pressures for us. Accordingly, industry consolidation could harm our business. We may need to increase our efficiencies to compete and may incur additional restructuring charges. Unanticipated changes in our tax position, the adoption of new tax legislation or exposure to additional tax liabilities could adversely affect our financial results. We base our tax position upon the anticipated nature and conduct of our business and upon our understanding of the tax laws of the various countries in which we have assets or conduct activities. Our tax position, however, is subject to review and possible challenge by taxing authorities and to possible changes in law. We cannot determine in advance the extent to which some jurisdictions may assess additional tax or interest and penalties on such additional taxes. Several countries where we operate allow for tax holidays or provide other tax incentives to attract and retain business. We have obtained holidays or other incentives where available. Our taxes could increase if certain tax holidays or incentives were retracted, or if they were not renewed upon expiration, or tax rates applicable to us in such jurisdictions were otherwise increased. In addition, further acquisitions may cause our effective tax rate to increase. Given the scope of our international operations and our international tax arrangements, changes to the manner in which U.S. based multinational companies are taxed in the U.S. could have a material impact on our financial results and competitiveness. As a result of the U.S. Tax Cuts and Jobs Act (U.S. Tax Reform) enacted in December 2017, we incurred a net estimated tax expense of $93.3 million due to the one-time mandatory transition tax on the deemed repatriation of undistributed foreign earnings and the re-measurement of U.S. deferred tax assets and liabilities. See Part II, Item 7. Management’s Discussion and Analysis of Financial Condition and Results of Operations—Results of Operations—Income taxes and Note 10 to the Consolidated Financial Statements of this Report for additional information. We are exposed to intangible asset risk; our goodwill may become impaired. We have recorded intangible assets, including goodwill, in connection with business acquisitions. We are required to assess goodwill and intangible assets for impairment at least on an annual basis and whenever events or circumstances indicate that the carrying value may not be recoverable from estimated future cash flows. A
20
significant and sustained decline in our market capitalization could result in material charges in future periods that could be adverse to our operating results and financial position. As of December 31, 2018, we had $192.1 million in goodwill and $75.7 million of identifiable intangible assets. See Note 1(h) to the Consolidated Financial Statements in Item 8 of this Report. There are inherent uncertainties involved in estimates, judgments and assumptions used in the preparation of financial statements in accordance with U.S. GAAP. Any changes in estimates, judgments and assumptions could have a material adverse effect on our financial position and results of operations. The consolidated financial statements included in the periodic reports we file with the SEC are prepared in accordance with accounting principles generally accepted in the United States (U.S. GAAP). The preparation of financial statements in accordance with U.S. GAAP involves making estimates, judgments and assumptions that affect reported amounts of assets (including intangible assets), liabilities and related reserves, revenues, expenses and income. Estimates, judgments and assumptions are inherently subject to change in the future, and any such changes could result in corresponding changes to the amounts of assets, liabilities, revenues, expenses and income. Any such changes could have a material adverse effect on our financial position and results of operations. Any litigation, even where a claim is without merit, could result in substantial costs and diversion of resources. In the past, we have been notified of claims relating to various matters including intellectual property rights, contractual matters, labor issues or other matters arising in the ordinary course of business. In the event of any such claim, we may be required to spend a significant amount of money and resources, even where the claim is without merit. Accordingly, the resolution of such disputes, even those encountered in the ordinary course of business, could have a material adverse effect on our business, consolidated financial conditions and results of operations. During the fourth quarter of 2018, we recognized $1.4 million related to a litigation arbitration decision against the Company. See Part I, Item 3. Legal Proceedings. Our success will continue to depend to a significant extent on our key personnel. We depend significantly on our executive officers and other key personnel. The unexpected loss of the services of any one of these executive officers or other key personnel, or the failure to attract and retain new personnel, could have an adverse effect on us. If we are unable to maintain our technological and manufacturing process expertise, our business could be adversely affected. The market for our manufacturing and engineering services is characterized by rapidly changing technology and continuing process development. We are continually evaluating the advantages and feasibility of new manufacturing processes. We believe that our future success will depend upon our ability to develop and provide manufacturing services that meet our customers’ changing needs. This requires that we maintain technological leadership and successfully anticipate or respond to technological changes in manufacturing processes on a cost-effective and timely basis. Our failure to maintain our technological and manufacturing process expertise could have a material adverse effect on our business. Our operations are subject to cyberattacks that could have a material adverse effect on our business. We are increasingly dependent on digital technologies and services to conduct our business. We use these technologies for internal purposes, including data storage, processing and transmissions, as well as in our interactions with customers and suppliers. Examples of these digital technologies include ERP, shop floor control and other similar business applications, our global infrastructure and networks as well as external systems, analytics, automation, and cloud services. Digital technologies and services are subject to the risk of cyberattacks and, given
21
the nature of such attacks, some incidents can remain undetected for a period of time despite our efforts to detect and respond to them in a timely manner. We routinely monitor our systems for cyber threats and have processes in place to detect and remediate vulnerabilities. Nevertheless, we have experienced occasional cyberattacks and attempted breaches over the past year, including phishing emails and other targeted attacks. We detected and remediated all of these incidents. No known leakage of financial, technical or customer data occurred and none of the incidents had a material adverse effect on our business, operations, reputation, or consolidated results of operations or consolidated financial condition. If our systems for protecting against cybersecurity risks prove not to be sufficient, we could be adversely affected by, among other things: loss of or damage to intellectual property, proprietary or confidential information, or customer, supplier, or employee data; interruption of our business operations; and increased costs required to prevent, respond to, or mitigate cybersecurity attacks. These risks could harm our reputation and our relationships with customers, suppliers, employees and other third parties, and may result in claims against us. These risks could have a material adverse effect on our business, consolidated results of operations and consolidated financial condition.
Any delay in the upgrade of our information systems could disrupt our operations and cause unanticipated increases in our costs. We are currently upgrading our enterprise resource planning system in our manufacturing facilities, which we anticipate taking several years. Failure to complete the upgrade could leave us with sites without the systems capabilities to flexibly support future customer requirements for manufacturing capabilities and data driven analytics, as well as result in unanticipated increases in costs. Our stock price is volatile. Our common shares have experienced significant price volatility, which may continue in the future. The price of our shares can fluctuate widely in response to a range of factors, including our financial results and changing conditions in the economy generally or in our industry in particular. In addition, stock markets generally experience significant price and volume volatility from time to time which may affect the market price of our shares for reasons unrelated to our performance. Provisions in our governing documents and state law may make it harder for others to obtain control of the Company. Certain provisions of our governing documents and the Texas Business Organizations Code may delay, inhibit or prevent someone from gaining control of the Company through a tender offer, business combination, proxy contest or some other method, even if shareholders might consider such a development beneficial. These provisions include:
a provision in our certificate of formation granting the Board of Directors authority to issue preferred stock in one or more series and to fix the relative rights and preferences of such preferred stock;
provisions in our bylaws restricting shareholders from acting by less than unanimous written consent and requiring advance notification of shareholder nominations and proposals;
a provision in our bylaws restricting anyone, other than the Chief Executive Officer, the President, the Board of Directors or the holders of at least 10% of all outstanding shares entitled to vote, from calling a special meeting of the shareholders;
a statutory restriction on the ability of shareholders to take action by less than unanimous written consent; and
a statutory restriction on business combinations with some types of interested shareholders.

22
Our business or stock price could be negatively affected by the actions of activist shareholders or others. Responding to actions by activist shareholders or others can be costly and time-consuming, disrupt our operations and divert the attention of management and our employees. Our ability to execute our strategic plan could also be impaired. In addition, a proxy contest for the election of directors would require us to incur significant fees and expenses, as well as requiring significant time and attention by management and our Board of Directors. Perceived uncertainties as to our future direction also could affect the market price and volatility of our common shares, our ability to attract and retain qualified personnel and business partners and may affect our relationships with vendors, customers or others. Compliance or the failure to comply with environmental regulations could cause us significant expense. We are subject to a variety of federal, state, local and foreign environmental laws and regulations relating to environmental, waste management, and health and safety concerns, including the handling, storage, discharge and disposal of hazardous materials used in or derived from our manufacturing processes. If we or companies we acquire have failed or fail in the future to comply with such laws and regulations, then we could incur liabilities and fines and our operations could be suspended. Such laws and regulations could also restrict our ability to modify or expand our facilities, could require us to acquire costly equipment, or could impose other significant expenditures. In addition, our operations may give rise to claims of property contamination or human exposure to hazardous chemicals or conditions. Our worldwide operations are subject to local laws and regulations. Over the last several years, we have become subject to the RoHS directive and the Waste Electrical and Electronic Equipment Directive. These directives restrict the distribution of products containing certain substances, including lead, within applicable geographies and require a manufacturer or importer to recycle products containing those substances. These directives affect the worldwide electronics and electronics components industries as a whole. If we or our customers fail to comply with such laws and regulations, we could incur liabilities and fines and our operations could be suspended. In addition, as climate change concerns become more prevalent, the U.S. and foreign governments have sought to limit the effects of any such changes. This increasing governmental focus on climate change may result in new environmental regulations that may negatively affect us, our suppliers and our customers. This could cause us to incur additional direct costs or obligations in complying with any new environmental regulations, as well as increased indirect costs resulting from our customers, suppliers or both incurring additional compliance costs that get passed on to us. These costs may adversely impact our operations and financial condition. Our business may be adversely impacted by geopolitical events. As a global business, we operate and have customers located in many countries. Geopolitical events such as terrorist acts may affect the overall economic environment and negatively impact the demand for our customers’ products or our ability to ship or receive products. As a result, customer orders may be lower and our financial results may be adversely affected. Our business may be adversely impacted by natural disasters. Some of our facilities, including our corporate headquarters, are located in areas that may be impacted by hurricanes, earthquakes, water shortages, tsunamis, floods, typhoons, fires, extreme weather conditions and other natural or manmade disasters. For example, our facilities in Thailand experienced extensive flooding in 2011. Our insurance coverage for natural disasters is limited and is subject to deductibles and coverage limits. This coverage may not be adequate, or may not continue to be available at commercially reasonable rates and terms. See “We bear the risk of uninsured losses.”
23
In addition, some of our facilities possess certifications necessary to work on specialized products that our other locations lack. If work is disrupted at one of these facilities, it may be impractical, or we may be unable, to transfer such specialized work to another facility without significant costs and delays. Thus, any disruption in operations at a facility with specialized certifications could adversely affect our ability to provide products and services to our customers, and thus negatively affect our relationships and financial results. We bear the risk of uninsured losses. As a result of extensive 2011 flooding in Thailand, we have been unable to obtain cost-effective flood insurance to adequately cover assets at our facilities in Thailand. We continue to monitor the insurance market in Thailand. We maintain insurance on all our properties and operations—including our assets in Thailand—for risks and in amounts customary in the industry. While such insurance includes general liability, property & casualty, and directors & officers liability coverage, not all losses are insured, and we retain certain risks of loss through deductibles, limits and self-retentions. In the event we experience a significant uninsured loss in Thailand or elsewhere, it could have a material adverse effect on our business, financial condition and results of operations. Our level of indebtedness may limit our flexibility in operating our business and reacting to changes in our business or industry, or prevent us from making payments on our debt or obtaining additional financing. As of December 31, 2018, our total outstanding debt (excluding unamortized debt issuance costs) was $150.0 million, all of which represented borrowings under our $150.0 million term loan facility (the Term Loan). Our level of indebtedness could have important consequences. For example, it could:
increase our vulnerability to general adverse economic and industry conditions; impair our ability to obtain additional debt or equity financing in the future for working capital, capital
expenditures, acquisitions or other purposes; require us to dedicate a material portion of our cash flows from operations to the payment of principal and
interest on our indebtedness, thereby reducing the availability of our cash flows to fund working capital needs, capital expenditures, acquisitions and other purposes;
expose us to the risk of increased interest rates since the Term Loan has a variable rate; limit our flexibility in planning for, or reacting to, changes in our business or industry; place us at a disadvantage compared to our competitors that have less debt; and make it more difficult for us to satisfy our debt obligations.
Any of these risks could materially impact our ability to fund our operations or limit our ability to expand our business, which could have a material adverse effect on our business, financial condition and results of operations. We may be exposed to interest rate fluctuations. We have exposure to interest rate risk on our outstanding borrowings under our variable rate credit agreement. These borrowings’ interest rates are based on the spread, at our option, over the London interbank offered rate (LIBOR), the bank’s prime rate or the federal funds rate. We are also exposed to interest rate risk on our invested cash balances. Changes in financial accounting standards or policies have affected, and in the future may affect, our reported financial condition or results of operations. Additionally, changes in securities laws and regulations could increase our operating costs. We prepare our financial statements in conformity with U.S. GAAP. These principles are subject to interpretation by the Financial Accounting Standards Board (FASB), the American Institute of Certified Public Accountants, the SEC and various bodies formed to interpret and create appropriate accounting policies. A change in these policies can
24
have a significant effect on our reported results and may affect our reporting of transactions that are completed before a change is announced. Changes to those rules or questions as to how we interpret or implement them may have a material adverse effect on our reported financial results or on the way we conduct business. For example, in May 2014 the FASB issued a new standard (commonly referred to as ASC 606) which changed the way we recognize revenue and significantly expanded the disclosures requirements for revenue arrangements. We adopted the requirements of this new standard on January 1, 2018. Under ASC 606, we recognize revenue as the customer takes control of the products. Under the majority of our manufacturing contracts with customers, the customer controls all of the work-in-progress as products are being built. Revenues under these contracts are recognized progressively based on the cost-to-cost method. Accordingly, we now recognize revenue under these contracts earlier than under the previous accounting rules. In addition, in February 2016, the FASB established Topic 842, Leases, and issued a new accounting standards update which requires lessees to recognize leases on-balance sheet and disclose key information about leasing arrangements. The new standard establishes a right-of-use model (ROU) that requires a lessee to recognize a ROU asset and lease liability on the balance sheet for all leases with a term longer than 12 months. Leases will be classified as finance or operating, with classification affecting the pattern and classification of expense recognition in the income statement. The adoption of the standard will have a material effect on our financial statements. The most significant effects of adoption relate to (1) the recognition of new ROU assets and lease liabilities on the Company’s balance sheet for its real estate and equipment operating leases; and (2) providing significant new disclosures about our leasing activities beginning with the Quarterly Report on Form 10-Q for the first quarter of 2019. See Note 1(q) of the Notes to the Consolidated Financial Statements in Item 8 of this Report for additional information relating to our 2018 adoption of the new revenue recognition standard and our 2019 adoption of the new leases standard. We review our internal controls over financial reporting annually. In doing so, we may identify deficiencies in those controls. A material weakness or deficiency in our internal controls could increase the likelihood that a material misstatement or lack of disclosure within the annual or interim financial statements will not be prevented or detected. Adverse publicity related to the disclosure of a material weakness or deficiency in internal controls over financial reporting could have a negative impact on our reputation, business and stock price. Corporate governance, public disclosure and compliance practices continue to evolve based upon government action and the policies of stockholder advisory groups. As a result, the number of rules and regulations applicable to us may increase, which would also increase our legal and financial compliance costs and the amount of time management must devote to compliance activities. For example, the Dodd-Frank Wall Street Reform and Consumer Protection Act contains provisions instituted to improve transparency and accountability concerning the supply of certain minerals originating from the Democratic Republic of Congo (DRC) and adjoining countries that are believed to benefit armed groups. These disclosure requirements may decrease the acceptable sources of supply of such minerals, increase their cost and disrupt our supply chain if we need to obtain components from different suppliers. Since we manufacture products containing such minerals for our customers, we are required to comply with these rules. The compliance process is time-consuming and costly. Failure to comply with applicable new regulations could result in additional costs (including fines and penalties) as well as affect our reputation. Increasing regulatory burdens could also make it more difficult for us to attract and retain members of our board of directors, particularly to serve on our audit committee, and executive officers in light of an increase in actual or perceived workload and liability for serving in such positions. Energy price increases may negatively impact our results of operations. Some of the components that we use in our manufacturing activities are petroleum-based. In addition, we, along with our suppliers and customers, rely on various energy sources (including oil) in our transportation activities. While significant uncertainty exists about the future levels of energy prices, a significant increase is possible. Increased energy prices could cause an increase in our raw material and transportation costs. In addition, increased costs of our suppliers or customers could be passed along to us, and we may not be able to increase our product prices enough to offset them. Moreover, any increase in our product prices may reduce our future customer orders and profitability.
25
Introducing programs requiring implementation of new competencies, including new process technology within our mechanical operations, could affect our operations and financial results. The introduction of programs requiring implementation of new competencies, including new process technology within our mechanical operations, presents challenges in addition to opportunities. Deployment of such programs may require us to invest significant resources and capital in facilities, equipment and/or personnel. We may not meet our customers’ expectations or otherwise execute properly or in a cost-efficient manner, which could damage our customer relationships and result in remedial costs or the loss of our invested capital and anticipated revenues and profits. In addition, there are risks of market acceptance and product performance that could result in less demand than anticipated and our having excess capacity. The failure or inability to reflect the anticipated costs, risks and rewards of such an opportunity in our customer contracts could adversely affect our profitability. If we do not meet one or more of these challenges, our operations and financial results could be adversely affected. If our manufacturing processes and services do not comply with applicable regulatory requirements, or if we manufacture products containing design or manufacturing defects, demand for our services may decline and we may be subject to liability claims. We manufacture and design products to our customers’ specifications; in some cases, our processes and facilities must comply with applicable regulatory requirements. For example, medical devices that we manufacture or design, as well as the facilities and manufacturing processes that we use to produce them, are regulated by the U.S. Food and Drug Administration or non-U.S. counterparts of this agency. Similarly, items we manufacture for customers in the aerospace and defense industries, as well as the processes we use to produce them, are regulated by the Department of Defense and the Federal Aviation Authority, which have increased their focus and penalties related to counterfeit materials. In addition, our customers’ products and the manufacturing processes or documentation that we use to produce them often are highly complex. As a result, products that we manufacture may at times contain manufacturing or design defects, and our manufacturing processes may be subject to errors or noncompliant with applicable statutory and regulatory requirements. Defects in the products we manufacture or design, whether caused by a design, manufacturing or component failure or error, or deficiencies in our manufacturing processes, may result in delayed shipments to customers or reduced or cancelled customer orders. If these defects or deficiencies were significant, our business reputation could also be damaged. The failure of our products, manufacturing processes or facilities to comply with applicable statutory and regulatory requirements could subject us to fines or penalties and, in some cases, require us to shut down or incur considerable expense to correct a product, process or facility. In addition, these defects may result in liability claims against us or expose us to liability to pay for the recall of a product. The magnitude of any such claim may increase as we expand our medical and aerospace and defense manufacturing services, as defects in medical, aerospace or defense devices or systems could seriously harm or kill users of these products and others. Even if our customers are responsible for the defects, they may not, or may not have resources to, assume responsibility for any costs or liabilities arising from these defects, which could expose us to additional liability claims. Customer relationships with emerging companies may present more risks than with established companies. Customer relationships with emerging companies present special risks because these companies do not have an extensive product history. As a result, there is less demonstration of market acceptance of their products, making it harder for us to anticipate needs and requirements than with established customers. In addition, funding for such companies may be more difficult to obtain and these customer relationships may not continue or materialize to the extent we plan or previously experienced. This tightening of financing for start-up customers, together with many start-up customers’ lack of prior operations and unproven product markets increase our credit risk, especially in trade accounts receivable and inventories. Although we perform ongoing credit evaluations of our customers and adjust our allowance for doubtful accounts receivable for all customers, including start-up customers, based on the information available, these allowances may not be adequate. This risk may exist for any new emerging company customers in the future.

26
Item 1B. Unresolved Staff Comments. None. Item 2. Properties. Our customers market numerous products throughout the world and therefore need to access manufacturing services on a global basis. To enhance our service offerings, we seek to locate our facilities either near our customers and our customers’ end markets in major centers for the electronics industry or, where appropriate, in lower cost locations. The following chart summarizes the approximate square footage of our principal manufacturing facilities by country:
Location Sq. Ft.
United States:
Alabama . . . . . . . . . . . . . . . . . . . . . . . . . . . . . . . . . . . . . . . . . . . . . . . . . . . . . . . . . . . 200,000
Arizona . . . . . . . . . . . . . . . . . . . . . . . . . . . . . . . . . . . . . . . . . . . . . . . . . . . . . . . . . . . . 199,000
California . . . . . . . . . . . . . . . . . . . . . . . . . . . . . . . . . . . . . . . . . . . . . . . . . . . . . . . . . . 388,000
Minnesota . . . . . . . . . . . . . . . . . . . . . . . . . . . . . . . . . . . . . . . . . . . . . . . . . . . . . . . . . . 453,000
New Hampshire . . . . . . . . . . . . . . . . . . . . . . . . . . . . . . . . . . . . . . . . . . . . . . . . . . . . . . 171,000
Texas . . . . . . . . . . . . . . . . . . . . . . . . . . . . . . . . . . . . . . . . . . . . . . . . . . . . . . . . . . . . . 155,000
China . . . . . . . . . . . . . . . . . . . . . . . . . . . . . . . . . . . . . . . . . . . . . . . . . . . . . . . . . . . . . . 326,000
Malaysia . . . . . . . . . . . . . . . . . . . . . . . . . . . . . . . . . . . . . . . . . . . . . . . . . . . . . . . . . . . . 347,000
Mexico . . . . . . . . . . . . . . . . . . . . . . . . . . . . . . . . . . . . . . . . . . . . . . . . . . . . . . . . . . . . . 728,000
Netherlands . . . . . . . . . . . . . . . . . . . . . . . . . . . . . . . . . . . . . . . . . . . . . . . . . . . . . . . . . . 159,000
Romania . . . . . . . . . . . . . . . . . . . . . . . . . . . . . . . . . . . . . . . . . . . . . . . . . . . . . . . . . . . . 131,000
Thailand . . . . . . . . . . . . . . . . . . . . . . . . . . . . . . . . . . . . . . . . . . . . . . . . . . . . . . . . . . . . 756,000
Total . . . . . . . . . . . . . . . . . . . . . . . . . . . . . . . . . . . . . . . . . . . . . . . . . . . . . . . . . . . . 4,013,000
Our principal manufacturing facilities consist of 1.9 million square feet in facilities that we own, with the remaining 2.1 million square feet in leased facilities whose terms expire between 2019 and 2028. We currently lease our corporate headquarters in Tempe, Arizona. This lease consists of approximately 64,000 square feet. We lease other facilities with a total of 67,000 square feet dedicated to engineering, sales and procurement services. Item 3. Legal Proceedings. We are involved in various legal actions arising in the ordinary course of business. Information about our legal proceedings is included in Note 18 to the Consolidated Financial Statements in Item 8 of this Report and is incorporated by reference herein. Other than as described in Note 18, in the opinion of management, the ultimate disposition of these matters will not have a material adverse effect on our consolidated financial position or results of operations.
27
Item 4. Mine Safety Disclosures. Not applicable.
PART II
Item 5. Market for Registrant’s Common Equity, Related Shareholder Matters and Issuer Purchases of Equity Securities.
Our common shares are listed on the New York Stock Exchange under the symbol “BHE.”
The last reported sale price of our common shares on February 27, 2019, as reported by the New York Stock Exchange, was $27.59. There were approximately 500 record holders of our common shares as of February 26, 2019. Because many of our common shares are held by brokers and other institutions on behalf of shareholders, we are unable to estimate the total number of shareholders represented by these record holders. Dividends We began declaring and paying quarterly dividends of $0.15 per share during the first quarter of 2018. During 2018, cash dividends paid totaled $21.0 million. The Board of Directors currently intends to continue paying quarterly dividends. However, the Company’s future dividend policy is subject to its compliance with applicable law, and depending on, among other things, our results of operations, financial condition, level of indebtedness, capital requirements, contractual restrictions, restrictions in the our debt agreements, and other factors that the Board of Directors may deem relevant. Dividend payments are not mandatory or guaranteed; there can be no assurance that we will continue to pay a dividend in the future.
28
Issuer Purchases of Equity Securities The following table provides information about the Company’s repurchase of its equity securities that are registered pursuant to Section 12 of the Exchange Act during the quarter ending December 31, 2018, at a total cost of $89.8 million:
(d)
Maximum
Number (or
(c) Approximate
Total Number of Dollar Value)
Shares (or Units) of Shares (or
Purchased as Units) that
(a) Part of May Yet Be
Total Number of (b) Publicly Purchased
Shares (or Average Price Announced Under the
Units) Paid per Share Plans or Plans or
Period Purchased(1) (or Unit)(2) Programs Programs(3)
October 1 to 31, 2018 . . . . . 1,249,624 $23.71 1,249,624 $261.7 million
November 1 to 30, 2018 . . . 1,634,221 $23.70 1,634,221 $222.9 million
December 1 to 31, 2018 . . . 951,830 $22.44 951,830 $201.6 million
Total . . . . . . . . . . . . . . . . . 3,835,675 $23.39 3,835,675
(1) All share repurchases were made on the open market. (2) Average price paid per share is calculated on a settlement basis and excludes commissions. (3) On March 6, 2018, the Board of Directors approved an expanded stock repurchase authorization granting the
Company authority to repurchase up to $250 million in common stock in addition to the $100 million previously approved on December 7, 2015. On October 26, 2018, the Board of Directors authorized the repurchase of an additional $100 million of the Company’s common stock. Net of shares repurchased to date, the total remaining authorization outstanding as of December 31, 2018 is $201.6 million. Stock purchases may be made in the open market, in privately negotiated transactions or block transactions, at the discretion of the Company’s management and as market conditions warrant. Purchases are funded from available cash and may be commenced, suspended or discontinued at any time without prior notice. Shares of stock repurchased under the program are retired.
During 2018, the Company repurchased a total of 8.2 million common shares for $211.9 million at an average price of $25.71 per share. Since 2014, the Company has repurchased a total of 16.1 million common shares for $395.3 million at an average price of $24.56 per share.
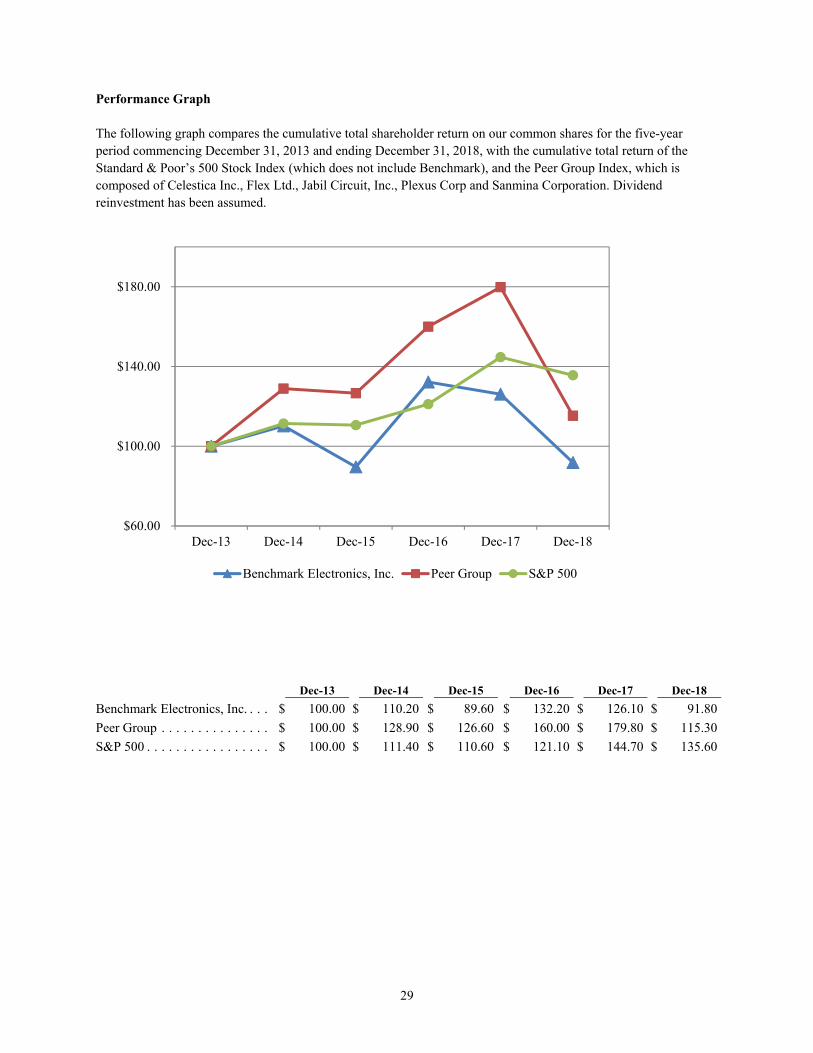
29
Performance Graph The following graph compares the cumulative total shareholder return on our common shares for the five-year period commencing December 31, 2013 and ending December 31, 2018, with the cumulative total return of the Standard & Poor’s 500 Stock Index (which does not include Benchmark), and the Peer Group Index, which is composed of Celestica Inc., Flex Ltd., Jabil Circuit, Inc., Plexus Corp and Sanmina Corporation. Dividend reinvestment has been assumed.
Dec-13 Dec-14 Dec-15 Dec-16 Dec-17 Dec-18
Benchmark Electronics, Inc. . . . $ 100.00 $ 110.20 $ 89.60 $ 132.20 $ 126.10 $ 91.80
Peer Group . . . . . . . . . . . . . . . $ 100.00 $ 128.90 $ 126.60 $ 160.00 $ 179.80 $ 115.30
S&P 500 . . . . . . . . . . . . . . . . . $ 100.00 $ 111.40 $ 110.60 $ 121.10 $ 144.70 $ 135.60
$60.00
$100.00
$140.00
$180.00
Dec-13 Dec-14 Dec-15 Dec-16 Dec-17 Dec-18
Benchmark Electronics, Inc. Peer Group S&P 500
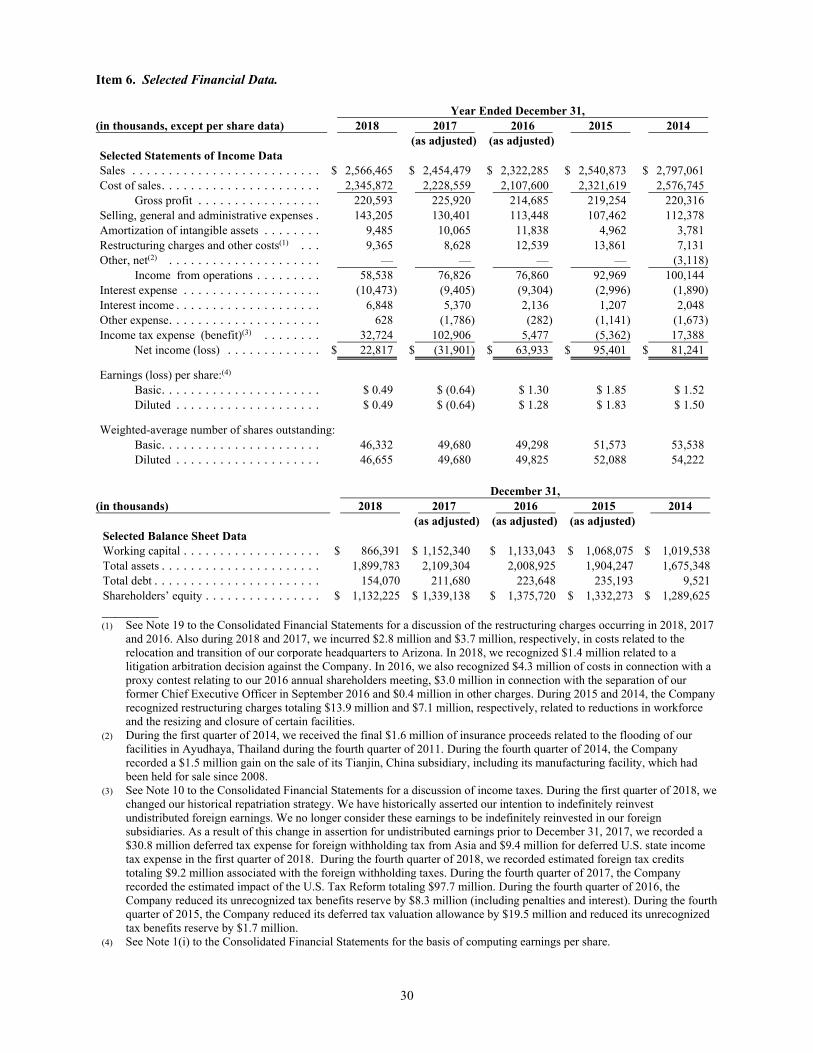
30
Item 6. Selected Financial Data.
Year Ended December 31, (in thousands, except per share data) 2018 2017 2016 2015 2014 (as adjusted) (as adjusted) Selected Statements of Income Data Sales . . . . . . . . . . . . . . . . . . . . . . . . . . $ 2,566,465 $ 2,454,479 $ 2,322,285 $ 2,540,873 $ 2,797,061 Cost of sales . . . . . . . . . . . . . . . . . . . . . . 2,345,872 2,228,559 2,107,600 2,321,619 2,576,745 Gross profit . . . . . . . . . . . . . . . . . 220,593 225,920 214,685 219,254 220,316 Selling, general and administrative expenses . 143,205 130,401 113,448 107,462 112,378 Amortization of intangible assets . . . . . . . . 9,485 10,065 11,838 4,962 3,781 Restructuring charges and other costs(1) . . . 9,365 8,628 12,539 13,861 7,131 Other, net(2) . . . . . . . . . . . . . . . . . . . . . — — — — (3,118) Income from operations . . . . . . . . . 58,538 76,826 76,860 92,969 100,144 Interest expense . . . . . . . . . . . . . . . . . . . (10,473) (9,405) (9,304) (2,996) (1,890) Interest income . . . . . . . . . . . . . . . . . . . . 6,848 5,370 2,136 1,207 2,048 Other expense . . . . . . . . . . . . . . . . . . . . . 628 (1,786) (282) (1,141) (1,673) Income tax expense (benefit)(3) . . . . . . . . 32,724 102,906 5,477 (5,362) 17,388 Net income (loss) . . . . . . . . . . . . . $ 22,817 $ (31,901) $ 63,933 $ 95,401 $ 81,241
Earnings (loss) per share:(4) Basic . . . . . . . . . . . . . . . . . . . . . . $ 0.49 $ (0.64) $ 1.30 $ 1.85 $ 1.52 Diluted . . . . . . . . . . . . . . . . . . . . $ 0.49 $ (0.64) $ 1.28 $ 1.83 $ 1.50
Weighted-average number of shares outstanding: Basic . . . . . . . . . . . . . . . . . . . . . . 46,332 49,680 49,298 51,573 53,538 Diluted . . . . . . . . . . . . . . . . . . . . 46,655 49,680 49,825 52,088 54,222 December 31, (in thousands) 2018 2017 2016 2015 2014 (as adjusted) (as adjusted) (as adjusted) Selected Balance Sheet Data Working capital . . . . . . . . . . . . . . . . . . . $ 866,391 $ 1,152,340 $ 1,133,043 $ 1,068,075 $ 1,019,538 Total assets . . . . . . . . . . . . . . . . . . . . . . 1,899,783 2,109,304 2,008,925 1,904,247 1,675,348 Total debt . . . . . . . . . . . . . . . . . . . . . . . 154,070 211,680 223,648 235,193 9,521 Shareholders’ equity . . . . . . . . . . . . . . . . $ 1,132,225 $ 1,339,138 $ 1,375,720 $ 1,332,273 $ 1,289,625
(1) See Note 19 to the Consolidated Financial Statements for a discussion of the restructuring charges occurring in 2018, 2017 and 2016. Also during 2018 and 2017, we incurred $2.8 million and $3.7 million, respectively, in costs related to the relocation and transition of our corporate headquarters to Arizona. In 2018, we recognized $1.4 million related to a litigation arbitration decision against the Company. In 2016, we also recognized $4.3 million of costs in connection with a proxy contest relating to our 2016 annual shareholders meeting, $3.0 million in connection with the separation of our former Chief Executive Officer in September 2016 and $0.4 million in other charges. During 2015 and 2014, the Company recognized restructuring charges totaling $13.9 million and $7.1 million, respectively, related to reductions in workforce and the resizing and closure of certain facilities.
(2) During the first quarter of 2014, we received the final $1.6 million of insurance proceeds related to the flooding of our facilities in Ayudhaya, Thailand during the fourth quarter of 2011. During the fourth quarter of 2014, the Company recorded a $1.5 million gain on the sale of its Tianjin, China subsidiary, including its manufacturing facility, which had been held for sale since 2008.
(3) See Note 10 to the Consolidated Financial Statements for a discussion of income taxes. During the first quarter of 2018, we changed our historical repatriation strategy. We have historically asserted our intention to indefinitely reinvest undistributed foreign earnings. We no longer consider these earnings to be indefinitely reinvested in our foreign subsidiaries. As a result of this change in assertion for undistributed earnings prior to December 31, 2017, we recorded a $30.8 million deferred tax expense for foreign withholding tax from Asia and $9.4 million for deferred U.S. state income tax expense in the first quarter of 2018. During the fourth quarter of 2018, we recorded estimated foreign tax credits totaling $9.2 million associated with the foreign withholding taxes. During the fourth quarter of 2017, the Company recorded the estimated impact of the U.S. Tax Reform totaling $97.7 million. During the fourth quarter of 2016, the Company reduced its unrecognized tax benefits reserve by $8.3 million (including penalties and interest). During the fourth quarter of 2015, the Company reduced its deferred tax valuation allowance by $19.5 million and reduced its unrecognized tax benefits reserve by $1.7 million.
(4) See Note 1(i) to the Consolidated Financial Statements for the basis of computing earnings per share.
31
Item 7. Management’s Discussion and Analysis of Financial Condition and Results of Operations. The following discussion should be read in conjunction with the Consolidated Financial Statements and Notes thereto in Item 8 of this Report. You should also bear in mind the Risk Factors set forth in Item 1A, any of which could materially and adversely affect the Company’s business, operating results, financial condition and the actual results of the matters addressed by the forward-looking statements contained in the following discussion.
2018 HIGHLIGHTS Sales for 2018 were $2.6 billion, a 5% increase from sales of $2.5 billion in 2017. During 2018, sales to customers in our various industry sectors fluctuated from 2017 as follows:
Industrials decreased by 1%, A&D increased by 4%, Medical increased by 5%, Test & Instrumentation increased by 2%, Computing increased by 7%, and Telecommunications increased by 10%.
The overall revenue increase was driven by strong Telecommunications growth from increased demand from new and existing customers, Computing strength from enterprise storage programs, Medical growth from higher demand and program ramps from new and existing customers, and A&D growth primarily from defense programs. Our sales depend on the success of our customers, some of which operate in businesses associated with rapid technological change and consequent product obsolescence. Developments adverse to our major customers or their products, or the failure of a major customer to pay for components or services, can adversely affect us. A substantial percentage of our sales are made to a small number of customers, and the loss of a major customer, if not replaced, would adversely affect us. Sales to our ten largest customers represented 44% and 46% of our sales in 2018 and 2017, respectively. In 2018, sales to International Business Machines Corporation (IBM) represented 13% of our sales. In 2017, sales to IBM and Applied Materials, Inc. represented 12% and 10%, respectively, of our sales. As part of our ongoing process to review marginal and dilutive contracts, we have notified a long standing Computing customer that we will not renew in its current form a legacy contract that expires at the end of 2019. During 2018, we incurred a $3.4 million charge for the write-down of inventory and a provision for accounts receivable associated with the insolvency of a customer. These charges increased cost of sales by $1.7 million and selling, general and administrative expenses by $1.7 million. In 2018, we also recovered $0.9 million of amounts written down in 2017 associated with the insolvency of another customer. We experience fluctuations in gross profit from period to period. Different programs contribute different gross profits depending on the type of services involved, location of production, size of the program, complexity of the product and level of material costs associated with the various products. Moreover, new programs can contribute relatively less to our gross profit in their early stages when manufacturing volumes are usually lower, resulting in inefficiencies and unabsorbed manufacturing overhead costs. In addition, a number of our new and higher-volume programs remain subject to competitive constraints that can exert downward pressure on our margins. During periods of low production volume, we generally have idle capacity and reduced gross profit. We have undertaken initiatives to restructure our business operations with the intention of improving utilization and reducing costs. During 2018, we recognized $5.2 million of restructuring charges in connection with reductions in workforce of certain facilities primarily in the Americas. In addition, we incurred $2.8 million in costs related to the relocation and transition of our corporate headquarters to Arizona and $1.4 million related to a litigation arbitration decision against the Company.
32
RESULTS OF OPERATIONS The following table presents the percentage relationship that certain items in our Consolidated Statements of Income bear to sales for the periods indicated. The financial information and the discussion below should be read in conjunction with the Consolidated Financial Statements and Notes thereto in Item 8 of this Report.
Year ended December 31,
2018 2017 2016
Sales . . . . . . . . . . . . . . . . . . . . . . . . . . . . . . . . . . . . . . . . . . . . . . . 100.0 % 100.0 % 100.0 %
Cost of sales . . . . . . . . . . . . . . . . . . . . . . . . . . . . . . . . . . . . . . . . . 91.4 90.8 90.8
Gross profit . . . . . . . . . . . . . . . . . . . . . . . . . . . . . . . . . . . . 8.6 9.2 9.2
Selling, general and administrative expenses . . . . . . . . . . . . . . . . . . 5.6 5.3 4.9
Amortization of intangible assets . . . . . . . . . . . . . . . . . . . . . . . . . . 0.4 0.4 0.5
Restructuring charges and other costs . . . . . . . . . . . . . . . . . . . . . . . 0.4 0.4 0.5
Income from operations . . . . . . . . . . . . . . . . . . . . . . . . . . . 2.3 3.1 3.3
Other expense, net . . . . . . . . . . . . . . . . . . . . . . . . . . . . . . . . . . . . . (0.1) (0.2) (0.3)
Income before income taxes . . . . . . . . . . . . . . . . . . . . . . . . 2.2 2.9 3.0
Income tax expense . . . . . . . . . . . . . . . . . . . . . . . . . . . . . . . . . . . . 1.3 4.2 0.2
Net income (loss) . . . . . . . . . . . . . . . . . . . . . . . . . . . . . . . 0.9 % (1.3)% 2.8 %
2018 Compared With 2017 Sales As noted above, sales increased 5% in 2018. The percentages of our sales by sector were as follows:
2018 2017
Higher-Value Markets
Industrials . . . . . . . . . . . . . . . . . . . . . . . . . . . . . . . . . . . . . . . . . . . . . . . . . . . . . . . 19 % 20 %
A&D . . . . . . . . . . . . . . . . . . . . . . . . . . . . . . . . . . . . . . . . . . . . . . . . . . . . . . . . . . 16 16
Medical . . . . . . . . . . . . . . . . . . . . . . . . . . . . . . . . . . . . . . . . . . . . . . . . . . . . . . . . . 15 15
Test & instrumentation . . . . . . . . . . . . . . . . . . . . . . . . . . . . . . . . . . . . . . . . . . . . . . 14 14
64 65
Traditional Markets
Computing . . . . . . . . . . . . . . . . . . . . . . . . . . . . . . . . . . . . . . . . . . . . . . . . . . . . . . 23 22
Telecommunications . . . . . . . . . . . . . . . . . . . . . . . . . . . . . . . . . . . . . . . . . . . . . . . 13 13
36 35
Total . . . . . . . . . . . . . . . . . . . . . . . . . . . . . . . . . . . . . . . . . . . . . . . . . . . . . . . . . . . 100 % 100 %
Industrials. 2018 sales decreased 1% to $493.1 million from $496.4 million in 2017. Aerospace and Defense. 2018 sales increased 4% to $406.4 million from $391.7 million in 2017 primarily due to increased demand from our defense customers. Medical. 2018 sales increased 5% to $394.0 million from $373.8 million in 2017 from higher demand and program ramps from new and existing customers. Test & Instrumentation. 2018 sales increased 2% to $355.0 million from $346.3 million in 2017. The increase reflected growth in our precision machining serving the semi-capital equipment market.
33
Computing. 2018 sales increased 7% to $580.8 million from $540.4 million in 2017. The increase is primarily due to increased strength from our existing enterprise storage customers. Telecommunications. 2018 sales increased 10% to $337.2 million from $305.9 million in 2017. The increase is primarily due to increased demand from new and existing customers. Our international operations are subject to the risks of doing business abroad. See Item 1A for factors pertaining to international sales, fluctuations in foreign currency exchange rates and a discussion of potential adverse effects in operating results associated with the risks of doing business abroad. During 2018 and 2017, 45% and 47%, respectively, of our sales were from international operations.
Gross Profit Gross profit decreased 2% to $220.6 million for 2018 from $225.9 million in 2017. During 2018 and 2017, we incurred a $0.8 million and $1.0 million, respectively, in net charges for the write-down of inventory associated with the insolvency of two customers. Gross margin decreased to 8.6% in 2018 from 9.2% in 2017 primarily due to a higher mix of traditional market sales in 2018,which generally have lower margins.
Selling, General and Administrative Expenses SG&A increased to $143.2 million in 2018 from $130.4 million in 2017. During both 2018 and 2017, we had $1.7 million in charges for a provision to accounts receivable associated with the insolvency of two customers. Including this provision to accounts receivable, SG&A, as a percentage of sales, increased to 5.6% in 2018 from 5.3% in 2017. Excluding this provision to accounts receivable, SG&A as a percentage of sales increased to 5.5% in 2018 from 5.2% in 2017. The increase in SG&A is related primarily to increased variable and stock-based compensation and the investment in our sales and marketing organization. Amortization of Intangible Assets Amortization of intangible assets decreased to $9.5 million in 2018 from $10.1 million in 2017 due primarily to certain customer relationship intangible assets that became fully amortized.
Restructuring Charges and Other Costs During 2018, we recognized $5.2 million of restructuring charges in connection with reductions in workforce of certain facilities primarily in the Americas. In addition, we incurred $2.8 million in costs related to the relocation and transition of our corporate headquarters to Arizona and $1.4 million related to a litigation arbitration decision against the Company. See Note 18 to the Consolidated Financial Statements in Item 8 of this Report for information about our legal proceedings. During 2017, we recognized $4.9 million of restructuring charges in connection with reductions in workforce of certain facilities primarily in the Americas and $3.7 million in costs related to the relocation and transition of our corporate headquarters to Arizona. See Note 19 to the Consolidated Financial Statements in Item 8 of this Report.
Interest Expense Interest expense increased to $10.5 million during 2018 from $9.4 million in 2017 period due to a $2.0 million write-off of deferred financing costs in connection with the refinancing of our credit facilities partially offset by lower outstanding debt levels.

34
Interest Income Interest income increased to $6.8 million in 2018 from $5.4 million in 2017 due to investment of higher levels of available cash in interest bearing cash equivalents at higher interest rates. Income Tax Expense. Income tax expense of $32.7 million in 2018 represented a 58.9% effective tax rate for 2018, compared with $102.9 million for 2017 that represented an effective tax rate of 144.9%. In 2018, we changed our historical repatriation strategy. We have historically asserted our intention to indefinitely reinvest undistributed foreign earnings. We no longer consider these earnings to be indefinitely reinvested in our foreign subsidiaries. As a result of this change in assertion for undistributed earnings prior to December 31, 2017, we recorded a net tax expense of $21.6 million consisting of tax expense of $30.8 million relating to foreign withholding taxes from Asia and a net benefit of $9.2 million for U.S. foreign tax credits to offset the foreign taxes paid during 2018. In addition, we also have recorded applicable U.S state income tax expense net of federal benefits related to the cash repatriation. Also during 2018, we incurred a net $4.4 million benefit associated with finalizing the provisional impact of the U.S. Tax Reform as required by SAB 118. In 2017, we incurred a net estimated tax expense of $97.7 million due to the one-time mandatory transition tax on the deemed repatriation of undistributed foreign earnings and the re-measurement of U.S. deferred tax assets and liabilities as a result of the U.S. Tax Reform. Also during 2017, we recorded a $1.7 million excess tax benefit for stock based compensation. Excluding these tax items, the effective tax rate would have been 13.1% in 2018 compared to 9.6% in 2017, primarily due to the U.S. Tax Reform implementation of the Global Intangible Low Taxes Income (GILTI) tax provision effective January 1, 2018. We have been granted certain tax incentives, including tax holidays, for our subsidiaries in China, Malaysia and Thailand that will expire at various dates, unless extended or otherwise renegotiated, through 2018 in China, 2021 in Malaysia, and 2028 in Thailand. We expect to submit an application for a new tax incentive in China during the second half of 2019. See Note 10 to the Consolidated Financial Statements in Item 8 of this Report.
Net Income (Loss) We reported a net income of $22.8 million, or $0.49 per diluted share for 2018, compared with a net loss of $31.9 million, or $0.64 per diluted share, for 2017. The net increase of $70.2 million in 2018 is primarily the result of the tax expense related to the effects of the 2017 U.S. Tax Reform discussed above.

35
2017 Compared With 2016 Sales Sales for 2017 were $2.5 billion, a 6% increase from sales of $2.3 billion in 2016. The percentages of our sales by sector were as follows:
2017 2016
Higher-Value Markets
Industrials . . . . . . . . . . . . . . . . . . . . . . . . . . . . . . . . . . . . . . . . . . . . . . . . . . . . . . . 20 % 23 %
A&D . . . . . . . . . . . . . . . . . . . . . . . . . . . . . . . . . . . . . . . . . . . . . . . . . . . . . . . . . . 16 16
Medical . . . . . . . . . . . . . . . . . . . . . . . . . . . . . . . . . . . . . . . . . . . . . . . . . . . . . . . . . 15 15
Test & instrumentation . . . . . . . . . . . . . . . . . . . . . . . . . . . . . . . . . . . . . . . . . . . . . . 14 11
65 65
Traditional Markets
Computing . . . . . . . . . . . . . . . . . . . . . . . . . . . . . . . . . . . . . . . . . . . . . . . . . . . . . . 22 19
Telecommunications . . . . . . . . . . . . . . . . . . . . . . . . . . . . . . . . . . . . . . . . . . . . . . . 13 16 35 35
Total . . . . . . . . . . . . . . . . . . . . . . . . . . . . . . . . . . . . . . . . . . . . . . . . . . . . . . . . . . . 100 % 100 %
Industrials. 2017 sales decreased 9% to $496.4 million from $543.8 million in 2016 primarily as a result of softness across several of our top customers. Aerospace and Defense. 2017 sales increased 6% to $391.7 million from $369.7 million in 2016 primarily due to increased demand from our defense customers. Computing. 2017 sales increased 21% to $540.4 million from $447.2 million in 2016. The increase is primarily due to increased strength from our existing storage customers and new security programs. Medical. 2017 sales increased 8% to $373.8 million from $346.0 million in 2016 from higher demand and program ramps from new and existing customers. Test & Instrumentation. 2017 sales increased 42% to $346.3 million from $243.4 million in 2016. The increase reflected strong growth in our precision machining serving the semi-capital equipment market. Telecommunications. 2017 sales decreased 18% to $305.9 million from $372.2 million in 2016. The decrease is primarily due to sales from new programs not offsetting lower demand from our existing customer base. During 2017 and 2016, 47% and 45%, respectively, of our sales were from international operations.
Gross Profit Gross profit increased 5% to $225.9 million for 2017 from $214.7 million in 2016. During 2017, we incurred a $1.0 million charge for the write-down of inventory associated with the insolvency of a customer. Gross margin was 9.2% in both 2017 and 2016.
Selling, General and Administrative Expenses SG&A increased to $130.4 million in 2017 from $113.4 million in 2016. The increase was primarily a result of increased variable and stock-based compensation, investments in our sales and marketing organization and a $1.7 million charge for a provision to accounts receivable associated with the insolvency of a customer. Including this provision to accounts receivable, SG&A, as a percentage of sales, increased to 5.3% in 2017 from 4.9% in 2016.

36
Excluding this provision to accounts receivable, SG&A as a percentage of sales increased to 5.2% in 2017 from 4.9% in 2016. Amortization of Intangible Assets Amortization of intangible assets decreased to $10.1 million in 2017 from $11.8 million in 2016 due primarily to certain customer relationship intangible assets that became fully amortized as of December 31, 2016.
Restructuring Charges and Other Costs During 2017, we recognized $4.9 million of restructuring charges in connection with reductions in workforce of certain facilities primarily in the Americas. In addition, we incurred $3.7 million in costs related to the relocation and transition of our corporate headquarters to Arizona. During 2016, we recognized $4.7 million of restructuring charges in connection with reductions in workforce of certain facilities primarily in the Americas, and $0.1 million of integration costs. In 2016, we also recognized $4.3 million of costs in connection with a proxy contest relating to our 2016 annual shareholders meeting, $3.0 million in connection with the separation of our former Chief Executive Officer in September 2016 and $0.4 million in other charges.
Interest Income Interest income increased to $5.4 million in 2017 from $2.1 million in 2016 due to investment of higher levels of available cash in interest bearing cash equivalents at higher interest rates. Income Tax Expense Income tax expense of $102.9 million in 2017 represented a 144.9% effective tax rate for 2017, compared with $5.5 million for 2016 that represented an effective tax rate of 7.9%. In 2017, we incurred a net estimated tax expense of $97.7 million due to the one-time mandatory transition tax on the deemed repatriation of undistributed foreign earnings and the re-measurement of U.S. deferred tax assets and liabilities as a result of the U.S. Tax Reform. Also during 2017, we recorded a $1.7 million excess tax benefit for stock based compensation. In 2016, we recorded the reversal of uncertain tax benefits of $8.3 million relating to the expiration of the statute of limitations for a liquidated foreign subsidiary. Excluding these tax items, the effective tax rate would have been 9.6% in 2017 compared to 19.8% in 2016. The decrease in the effective tax rate results primarily from a taxable loss in the U.S. and higher taxable income in geographies with lower tax rates.
Net Income (Loss) We reported a net loss of $31.9 million, or $0.64 per diluted share, for 2017, compared with net income of $63.9 million, or $1.28 per diluted share for 2016. The net decrease of $95.8 million in 2017 is primarily the result of the tax expense related to the effects of the 2017 U.S. Tax Reform discussed above.
LIQUIDITY AND CAPITAL RESOURCES We have historically financed our organic growth and operations through funds generated from operations and occasional borrowings under our revolving credit facility. Cash and cash equivalents totaled $458.1 million at December 31, 2018 and $742.5 million at December 31, 2017, of which $154.4 million and $673.4 million, respectively, were held outside the U.S. in various foreign subsidiaries. During 2018, we repatriated $560.6 million of foreign earnings to the U.S. Cash provided by operating activities was $76.7 million in 2018. The cash provided by operations during 2018 consisted primarily of $22.8 million of net income, adjusted for $51.8 million of depreciation and amortization, a $34.0 million increase in accounts receivable, a $43.3 million increase in inventories, a $23.8 million decrease in

37
income tax liabilities, net and a $61.4 million increase in accounts payable. The increase in accounts payable was a result of the timing of payments. Working capital was $0.9 billion at December 31, 2018 and $1.2 billion at December 31, 2017. We purchase components only after customer orders or forecasts are received, which mitigates, but does not eliminate, the risk of loss on inventories. Supplies of electronic components and other materials used in operations are subject to industry-wide shortages. In certain instances, suppliers may allocate available quantities to us. If shortages of these components and other material supplies used in operations occur, vendors may not ship the quantities we need for production, and we may be forced to delay shipments, which can increase backorders and impact cash flows. Cash used in investing activities was $68.8 million in 2018 primarily due to purchases of additional property, plant and equipment totaling $62.8 million. The purchases of property, plant and equipment were primarily for machinery and equipment in the Americas and Asia. Cash used in financing activities was $291.0 million in 2018. Share repurchases totaled $211.9 million, net principal payments on long-term debt totaled $58.0 million, dividends paid totaled $21.0 million, and we received $3.6 million from the exercise of stock options. Under the terms of our $650.0 million Credit Agreement, in addition to the Term Loan facility, we have a $500.0 million five-year revolving credit facility to be used for general corporate purposes, both with a maturity date of July 20, 2023. The Credit Agreement includes an accordion feature pursuant to which total commitments under the facility may be increased by an additional $275.0 million, subject to satisfaction of certain conditions. As of December 31, 2018, we had $150.0 million in borrowings outstanding under the Term Loan facility and $2.8 million in letters of credit outstanding under our revolving credit facility. During 2018, the Company borrowed and repaid $50.0 million under the revolving credit facility. $497.2 million remains available for future borrowings under the revolving credit facility. See Note 7 to the Consolidated Financial Statements in Item 8 of this Report for more information regarding the terms of the Credit Agreement. The Credit Agreement contains certain financial covenants as to interest coverage and debt leverage, and certain customary affirmative and negative covenants, including restrictions on our ability to incur additional debt and liens, pay dividends, repurchase shares, sell assets and merge or consolidate with other persons. Amounts due under the Credit Agreement could be accelerated upon specified events of default, including a failure to pay amounts due, breach of a covenant, material inaccuracy of a representation, or occurrence of bankruptcy or insolvency, subject, in some cases, to cure periods. As of December 31, 2018, we were in compliance with all of these covenants and restrictions. Our operations, and the operations of businesses we acquire, are subject to certain foreign, federal, state and local regulatory requirements relating to environmental, waste management, health and safety matters. We believe we operate in substantial compliance with all applicable requirements and we seek to ensure that newly acquired businesses comply or will comply substantially with applicable requirements. To date, the costs of compliance and workplace and environmental remediation have not been material to us. However, material costs and liabilities may arise from these requirements or from new, modified or more stringent requirements in the future. In addition, our past, current and future operations, and the operations of businesses we have or may acquire, may give rise to claims of exposure by employees or the public, or to other claims or liabilities relating to environmental, waste management or health and safety concerns. As of December 31, 2018, we had cash and cash equivalents totaling $458.1 million and $497.2 million available for borrowings under the Credit Agreement. During the next 12 months, we believe our capital expenditures will approximate $40 to $50 million, principally for machinery and equipment to support our ongoing business around the globe.

38
On March 6, 2018, our Board of Directors approved an expanded stock repurchase program granting us the authority to repurchase up to $250 million in common stock in addition to the $100 million approved on December 7, 2015. On October 26, 2018, the Board of Directors authorized an additional $100 million shares for repurchase above our existing program. As of December 31, 2018, we had $201.6 million remaining under the share repurchase authorization to purchase additional shares. We are under no commitment or obligation to repurchase any particular amount of common stock. Management believes that our existing cash balances and funds generated from operations will be sufficient to permit us to meet our liquidity requirements over the next 12 months. Management further believes that our ongoing cash flows from operations and any borrowings we may incur under our revolving credit facility will enable us to meet operating cash requirements in future years. If we consummated significant acquisitions in the future, our capital needs would increase and could possibly result in our need to increase available borrowings under our Credit Agreement or access public or private debt and equity markets. There can be no assurance, however, that we would be successful in raising additional debt or equity on acceptable terms.
CRITICAL ACCOUNTING POLICIES AND ESTIMATES Management’s discussion and analysis of financial condition and results of operations is based upon our consolidated financial statements, which have been prepared in accordance with U.S. GAAP. Our significant accounting policies are summarized in Note 1 to the Consolidated Financial Statements in Item 8 of this Report. The preparation of these financial statements requires us to make estimates and judgments that affect the reported amounts of assets, liabilities, revenues and expenses, and related disclosure of contingent assets and liabilities. On an ongoing basis, we evaluate our estimates, including those related to accounts receivable, inventories, income taxes, long-lived assets, stock-based compensation and contingencies and litigation. We base our estimates on historical experience and on various other assumptions that we believe to be reasonable under the circumstances, the results of which form the basis for making judgments about the carrying values of assets and liabilities that are not readily apparent from other sources. Actual results may differ materially from these estimates. We believe the following critical accounting policies affect our more significant judgments and estimates used in the preparation of our consolidated financial statements. Allowance for Doubtful Accounts Our accounts receivable balance is recorded net of allowances for amounts not expected to be collected from our customers. Because our accounts receivable are typically unsecured, we periodically evaluate their collectibility based on a combination of factors, including a particular customer’s ability to pay as well as the age of the receivables. To evaluate a specific customer’s ability to pay, we analyze financial statements, payment history and various information or disclosures by the customer or other publicly available information. In cases where the evidence suggests a customer may not be able to satisfy its obligation to us, we establish a specific allowance in an amount we determine appropriate for the perceived risk. If the financial condition of our customers were to deteriorate, resulting in an impairment of their ability to make payments, additional allowances may be required. Inventory Obsolescence We purchase inventory based on forecasted demand and record inventory at the lower of cost or net realizable value. We write down inventory for estimated obsolescence, as necessary, in an amount equal to the difference between the cost of inventory and estimated market value based on assumptions of future demands and market conditions. We evaluate our inventory on a quarterly basis based on current and forecasted usage and the latest forecasts of product demand and production requirements from our customers. Customers frequently make changes to their forecasts, which requires us to make changes to our inventory purchases, commitments, and production scheduling and may require us to cancel open purchase commitments with our vendors. This process may lead to on-hand inventory quantities and on-order purchase commitments that exceed our customers’ revised needs, or parts that become obsolete before use in production. We write down excess and obsolete inventory when we determine that our
39
customers are not responsible for it, or if we believe our customers will be unable to fulfill their obligation to ultimately purchase it. If actual market conditions are less favorable than those we projected, additional inventory write-downs may be required. Income Taxes We estimate our income tax provision in each of the jurisdictions where we operate, including estimating exposures related to uncertain tax positions. We must also make judgments regarding the ability to realize our deferred tax assets. We record a valuation allowance to reduce our deferred tax assets to the amount that we believe is more likely than not to be realized. Our valuation allowance as of December 31, 2018 of $13.7 million primarily relates to deferred tax assets from our foreign net operating loss tax carryforwards of $10.3 million. Differences in our future operating results as compared to the estimates utilized in the determination of the valuation allowances could result in adjustments in valuation allowances in future periods. For example, a significant increase in our operations in the United States, future accretive acquisitions in the United States and any movement in the mix of profits from our international operations to the United States would result in a reduction in the valuation allowance and would increase income in the period such determination was made. Alternatively, significant economic downturns in the United States generating additional operating loss carryforwards and potential movements in the mix of profits to international locations would result in an increase in the valuation allowance and would decrease income in the period such determination was made. On December 22, 2017, the SEC staff issued Staff Accounting Bulletin No. 118 (SAB 118), which provides guidance on accounting for the tax effects of the U.S. Tax Reform. SAB 118 provided a measurement period that would not extend beyond one year from the U.S. Tax Reform enactment date for companies to complete their accounting of the impact on income taxes. Until the accounting was complete, companies could record provisional estimates. As a result of the U.S. Tax Reform, we recorded provisional amounts in relation to the accounting of the transition tax in 2017. We have finalized our accounting for SAB 118 as of December 31, 2018 within the measurement period. See Note 10 to the Consolidated Financial Statements in Item 8 of this Report. We are subject to examination by tax authorities for different periods in various U.S. and foreign tax jurisdictions. During the course of such examinations, disputes may occur as to matters of fact and/or law. In most tax jurisdictions the passage of time without examination will result in the expiration of applicable statutes of limitations, thereby precluding the taxing authority from examining the relevant tax period(s). We believe that we have adequately provided for our tax liabilities. Impairment of Long-Lived Assets and Goodwill Long-lived assets, such as property, plant, and equipment and purchased intangibles subject to amortization, are reviewed for impairment whenever events or changes in circumstances indicate that the carrying amount of an asset may not be recoverable. The recoverability of assets to be held and used is measured by a comparison of the carrying amount of an asset to the estimated undiscounted future cash flows expected to be generated by the asset. If the carrying amount of an asset exceeds its estimated undiscounted future cash flows, an impairment charge is recognized by the amount that the carrying amount of the asset exceeds the fair value of the asset. Goodwill is tested for impairment on an annual basis, at a minimum, and whenever events and circumstances indicate that the carrying amount may be impaired. Circumstances that may lead to impairment include unforeseen decreases in future performance or industry demand or the restructuring of our operations as a result of a change in our business strategy. We perform a qualitative assessment to determine if goodwill is potentially impaired. If the qualitative assessment indicates that it is more likely than not that the fair value of a reporting unit is less than its carrying amount, or if we elect not to perform a qualitative assessment, then we would be required to perform a quantitative impairment test for goodwill. This two-step process involves determining the fair values of the reporting units and comparing those fair values to the carrying values, including goodwill, of the reporting unit. An

40
impairment loss would be recognized to the extent that the carrying amount exceeds the asset’s fair value. For purposes of performing our goodwill impairment assessment, our reporting units are the same as our operating segments as defined in Note 15 to the Consolidated Financial Statements in Item 8 of this Report. As of December 31, 2018 and 2017, we had goodwill of approximately $192.1 million and $191.6 million, respectively, associated with our Americas and Asia business segments. Based on our qualitative assessments of goodwill as of December 31, 2018, 2017 and 2016, we concluded that it was more likely than not that the fair value of our Americas and Asia business segments were greater than their carrying amounts, and therefore no further testing was required. Changes in economic and operating conditions that occur after the annual impairment analysis or an interim impairment analysis, and that impact these assumptions, may result in a future goodwill impairment charge. Stock-Based Compensation We recognize stock-based compensation expense in our consolidated statements of income. For performance-based restricted stock unit awards, compensation expense is based on the probability that the performance goals will be achieved, which is monitored by management throughout the measurement period. If it becomes probable, based on our expectation of performance during that measurement period, that more or less than the previous estimate of the awarded shares will vest, an adjustment to stock-based compensation expense is recognized as a change in accounting estimate. If actual results or future changes in estimates differ significantly from our current estimates, stock-based compensation could increase or decrease. See Note 1(l) to the Consolidated Financial Statements in Item 8 of this Report. Recently Enacted Accounting Principles See Note 1(q) to the Consolidated Financial Statements in Item 8 of this Report for a discussion of recently enacted accounting principles.
CONTRACTUAL OBLIGATIONS We have certain contractual obligations that extend beyond 2019 under lease obligations and debt arrangements. Non-cancelable purchase commitments do not typically extend beyond the normal lead-time of several weeks. Purchase orders beyond this time frame are typically cancelable. We do not use off-balance sheet financing techniques other than traditional operating leases, and we have not guaranteed the obligations of any entity that is not one of our wholly owned subsidiaries. The total contractual cash obligations in existence at December 31, 2018 due pursuant to contractual commitments are:
Payments due by period
Less than 1-3 3-5 More than
(in thousands) Total 1 year years years 5 years
Operating lease obligations . . . $ 110,217 $ 15,272 $ 26,721 $ 20,356 $ 47,868
Capital lease obligations . . . . . 7,661 1,746 3,597 2,318 —
Long-term debt obligations . . . 150,000 5,625 15,000 129,375 —
Deemed repatriation tax (1) . . . 63,847 5,471 12,878 18,512 26,986
Total obligations . . . . . . . . . . $ 331,725 $ 28,114 $ 58,196 $ 170,561 $ 74,854
(1) U.S federal income tax on deemed mandatory repatriation is payable over 7 years pursuant to the U.S. Tax Reform. See Note 10 to the Consolidated Financial Statements in Item 8 of this Report.
41
OFF-BALANCE SHEET ARRANGEMENTS As of December 31, 2018, we did not have any significant off-balance sheet arrangements. See Note 12 to the Consolidated Financial Statements in Item 8 of this Report. Item 7A. Quantitative and Qualitative Disclosures About Market Risk. Our international sales comprise a significant portion of our net sales. We are exposed to risks associated with operating internationally, including:
• Foreign currency exchange risk; • Import and export duties, taxes and regulatory changes; • Inflationary economies or currencies; and • Economic and political instability.
Additionally, some of our operations are in developing countries. Certain events, including natural disasters, can impact the infrastructure of a developing country more severely than they would impact the infrastructure of a developed country. A developing country can also take longer to recover from such events, which could lead to delays in our ability to resume full operations. We transact business in various foreign countries and are subject to foreign currency fluctuation risks. We use natural hedging and forward contracts to economically hedge transactional exposure primarily associated with trade accounts receivable, other receivables and trade accounts payable that are denominated in a currency other than the functional currency of the respective operating entity. We do not use derivative financial instruments for speculative purposes. The forward contract in place as of December 31, 2018 has not been designated as an accounting hedge and, therefore, changes in fair value are recorded within our Consolidated Statements of Income. Our sales are substantially denominated in U.S. dollars. Our foreign currency cash flows are generated in certain European and Asian countries and Mexico. We are also exposed to market risk for changes in interest rates on our financial instruments, a portion of which relates to our invested cash balances. We do not use derivative financial instruments in our investing activities. We place cash and cash equivalents and investments with various major financial institutions. We protect our invested principal funds by limiting default risk, market risk and reinvestment risk. We mitigate default risk by generally investing in investment grade securities. We are also exposed to interest rate risk on borrowings under our Credit Agreement. As of December 31, 2018, we had $150.0 million outstanding on the floating rate term loan facility, and we have an interest rate swap agreement with a notional amount of $150.0 million. Under this swap agreement, we receive variable rate interest rate payments and pay fixed rate interest payments. The effect of this swap is to convert a portion of our floating rate interest expense to fixed interest rate expense. The interest rate swap is designated as a cash flow hedge. For additional information, see Note 12 to the Notes to Consolidated Financial Statements in Item 8 of this Report.
See accompanying notes to consolidated financial statements.
42
Item 8. Financial Statements and Supplementary Data. BENCHMARK ELECTRONICS, INC. AND SUBSIDIARIES
Consolidated Balance Sheets
December 31,
(in thousands, except par value) 2018 2017
(as adjusted)
Assets Current assets: Cash and cash equivalents . . . . . . . . . . . . . . . . . . . . . . . . . . . . . . . . . . . . . . . . . . . . . . . $ 458,102 $ 742,546 Accounts receivable, net of allowance for doubtful accounts of $1,733 and $105, respectively . . . . . . . . . . . . . . . . . . . . . . . . . . . . . . . . . . . . . . . . . . . . . . . . 468,161 436,560 Contract assets . . . . . . . . . . . . . . . . . . . . . . . . . . . . . . . . . . . . . . . . . . . . . . . . . . . . . . . 140,082 146,496 Inventories . . . . . . . . . . . . . . . . . . . . . . . . . . . . . . . . . . . . . . . . . . . . . . . . . . . . . . . . . . 309,975 268,917 Prepaid expenses and other assets . . . . . . . . . . . . . . . . . . . . . . . . . . . . . . . . . . . . . . . . . 27,024 36,018 Income taxes receivable . . . . . . . . . . . . . . . . . . . . . . . . . . . . . . . . . . . . . . . . . . . . . . . . 206 120 Total current assets . . . . . . . . . . . . . . . . . . . . . . . . . . . . . . . . . . . . . . . . . . . . . . . . . 1,403,550 1,630,657 Property, plant and equipment, net . . . . . . . . . . . . . . . . . . . . . . . . . . . . . . . . . . . . . . . . . . 210,954 186,473 Goodwill . . . . . . . . . . . . . . . . . . . . . . . . . . . . . . . . . . . . . . . . . . . . . . . . . . . . . . . . . . . . 192,116 191,616 Deferred income taxes . . . . . . . . . . . . . . . . . . . . . . . . . . . . . . . . . . . . . . . . . . . . . . . . . . . 2,478 4,034 Other, net . . . . . . . . . . . . . . . . . . . . . . . . . . . . . . . . . . . . . . . . . . . . . . . . . . . . . . . . . . . . 90,685 96,524 $ 1,899,783 $ 2,109,304
Liabilities and Shareholders’ Equity Current liabilities: Current installments of long-term debt and capital lease obligations . . . . . . . . . . . . . . . . . $ 6,793 $ 18,274 Accounts payable . . . . . . . . . . . . . . . . . . . . . . . . . . . . . . . . . . . . . . . . . . . . . . . . . . . . . 422,053 362,701 Income taxes payable . . . . . . . . . . . . . . . . . . . . . . . . . . . . . . . . . . . . . . . . . . . . . . . . . . 10,435 11,663 Accrued liabilities . . . . . . . . . . . . . . . . . . . . . . . . . . . . . . . . . . . . . . . . . . . . . . . . . . . . 97,878 85,679 Total current liabilities . . . . . . . . . . . . . . . . . . . . . . . . . . . . . . . . . . . . . . . . . . . . . . 537,159 478,317 Long-term debt and capital lease obligations, less current installments . . . . . . . . . . . . . . . . 147,277 193,406 Other long-term liabilities . . . . . . . . . . . . . . . . . . . . . . . . . . . . . . . . . . . . . . . . . . . . . . . . 68,799 89,749 Deferred income taxes . . . . . . . . . . . . . . . . . . . . . . . . . . . . . . . . . . . . . . . . . . . . . . . . . . . 14,323 8,694 Shareholders’ equity: Preferred stock, $0.10 par value; 5,000 shares authorized, none issued . . . . . . . . . . . . . . . — — Common stock, $0.10 par value; 145,000 shares authorized; issued and outstanding – 41,357 and 49,143, respectively . . . . . . . . . . . . . . . . . . . . . . . 4,136 4,914 Additional paid-in capital . . . . . . . . . . . . . . . . . . . . . . . . . . . . . . . . . . . . . . . . . . . . . . . 554,939 634,192 Retained 584,274 708,181 Accumulated other comprehensive loss . . . . . . . . . . . . . . . . . . . . . . . . . . . . . . . . . . . . . (11,124) (8,149) Total shareholders’ equity . . . . . . . . . . . . . . . . . . . . . . . . . . . . . . . . . . . . . . . . . . . . 1,132,225 1,339,138 Commitments and contingencies $ 1,899,783 $ 2,109,304

See accompanying notes to consolidated financial statements.
43
BENCHMARK ELECTRONICS, INC. AND SUBSIDIARIES Consolidated Statements of Income (Loss)
Year ended December 31,
(in thousands, except per share data) 2018 2017 2016 (as adjusted) (as adjusted)
Sales . . . . . . . . . . . . . . . . . . . . . . . . . . . . . . . . . . . . . . . . . . . . . . . . . . . . . . $ 2,566,465 $ 2,454,479 $ 2,322,285Cost of sales . . . . . . . . . . . . . . . . . . . . . . . . . . . . . . . . . . . . . . . . . . . . . . . . 2,345,872 2,228,559 2,107,600 Gross profit . . . . . . . . . . . . . . . . . . . . . . . . . . . . . . . . . . . . . . . . . . . . . 220,593 225,920 214,685Selling, general and administrative expenses . . . . . . . . . . . . . . . . . . . . . . . . . 143,205 130,401 113,448Amortization of intangible assets . . . . . . . . . . . . . . . . . . . . . . . . . . . . . . . . . 9,485 10,065 11,838Restructuring charges and other costs . . . . . . . . . . . . . . . . . . . . . . . . . . . . . . 9,365 8,628 12,539 Income from operations . . . . . . . . . . . . . . . . . . . . . . . . . . . . . . . . . . . . 58,538 76,826 76,860Interest expense . . . . . . . . . . . . . . . . . . . . . . . . . . . . . . . . . . . . . . . . . . . . . (10,473) (9,405) (9,304)Interest income . . . . . . . . . . . . . . . . . . . . . . . . . . . . . . . . . . . . . . . . . . . . . 6,848 5,370 2,136Other income (expense) . . . . . . . . . . . . . . . . . . . . . . . . . . . . . . . . . . . . . . 628 (1,786) (282) Income before income taxes . . . . . . . . . . . . . . . . . . . . . . . . . . . . . . . . . 55,541 71,005 69,410Income tax expense . . . . . . . . . . . . . . . . . . . . . . . . . . . . . . . . . . . . . . . . . . . 32,724 102,906 5,477 Net income (loss). . . . . . . . . . . . . . . . . . . . . . . . . . . . . . . . . . . . . . . . . $ 22,817 $ (31,901) $ 63,933 Earnings (loss) per share: Basic . . . . . . . . . . . . . . . . . . . . . . . . . . . . . . . . . . . . . . . . . . . . . . . . . $ 0.49 $ (0.64) $ 1.30 Diluted . . . . . . . . . . . . . . . . . . . . . . . . . . . . . . . . . . . . . . . . . . . . . . . $ 0.49 $ (0.64) $ 1.28 Weighted-average number of shares outstanding: Basic . . . . . . . . . . . . . . . . . . . . . . . . . . . . . . . . . . . . . . . . . . . . . . . . . 46,332 49,680 49,298 Diluted . . . . . . . . . . . . . . . . . . . . . . . . . . . . . . . . . . . . . . . . . . . . . . . 46,655 49,680 49,825
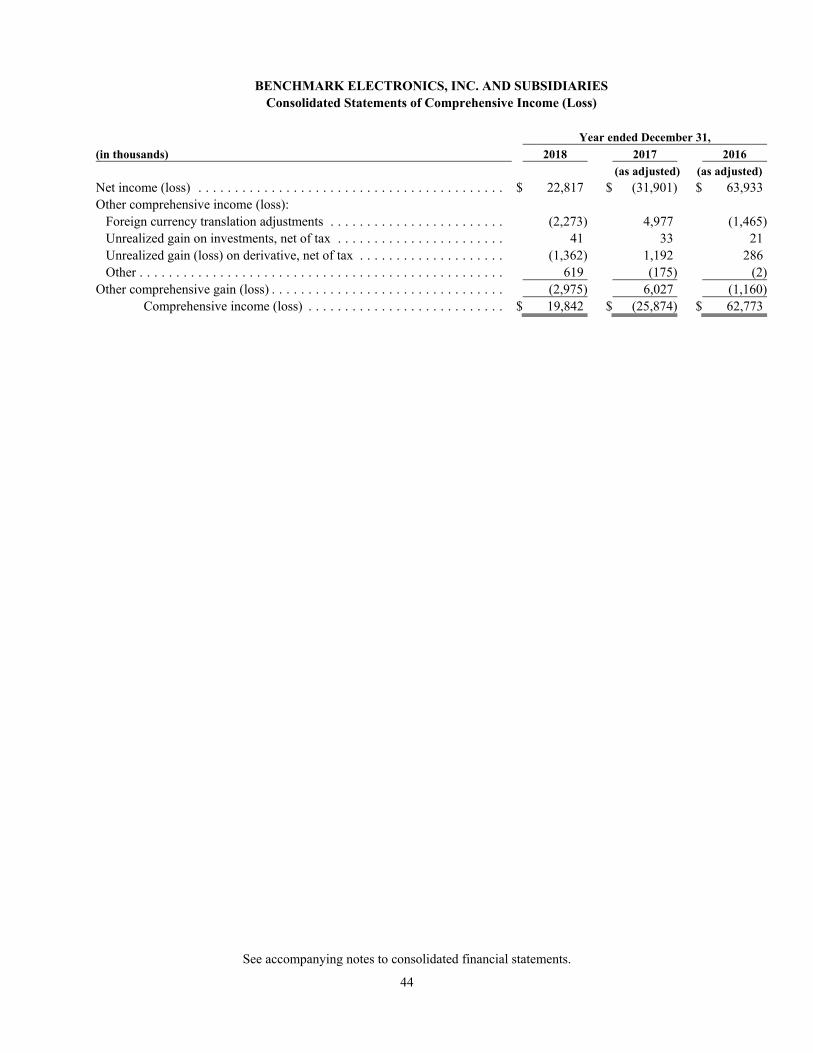
See accompanying notes to consolidated financial statements.
44
BENCHMARK ELECTRONICS, INC. AND SUBSIDIARIES Consolidated Statements of Comprehensive Income (Loss)
Year ended December 31,
(in thousands) 2018 2017 2016 (as adjusted) (as adjusted)
Net income (loss) . . . . . . . . . . . . . . . . . . . . . . . . . . . . . . . . . . . . . . . . . . $ 22,817 $ (31,901) $ 63,933Other comprehensive income (loss): Foreign currency translation adjustments . . . . . . . . . . . . . . . . . . . . . . . . (2,273) 4,977 (1,465) Unrealized gain on investments, net of tax . . . . . . . . . . . . . . . . . . . . . . . 41 33 21 Unrealized gain (loss) on derivative, net of tax . . . . . . . . . . . . . . . . . . . . (1,362) 1,192 286 Other . . . . . . . . . . . . . . . . . . . . . . . . . . . . . . . . . . . . . . . . . . . . . . . . . . 619 (175) (2)Other comprehensive gain (loss) . . . . . . . . . . . . . . . . . . . . . . . . . . . . . . . . (2,975) 6,027 (1,160) Comprehensive income (loss) . . . . . . . . . . . . . . . . . . . . . . . . . . . $ 19,842 $ (25,874) $ 62,773
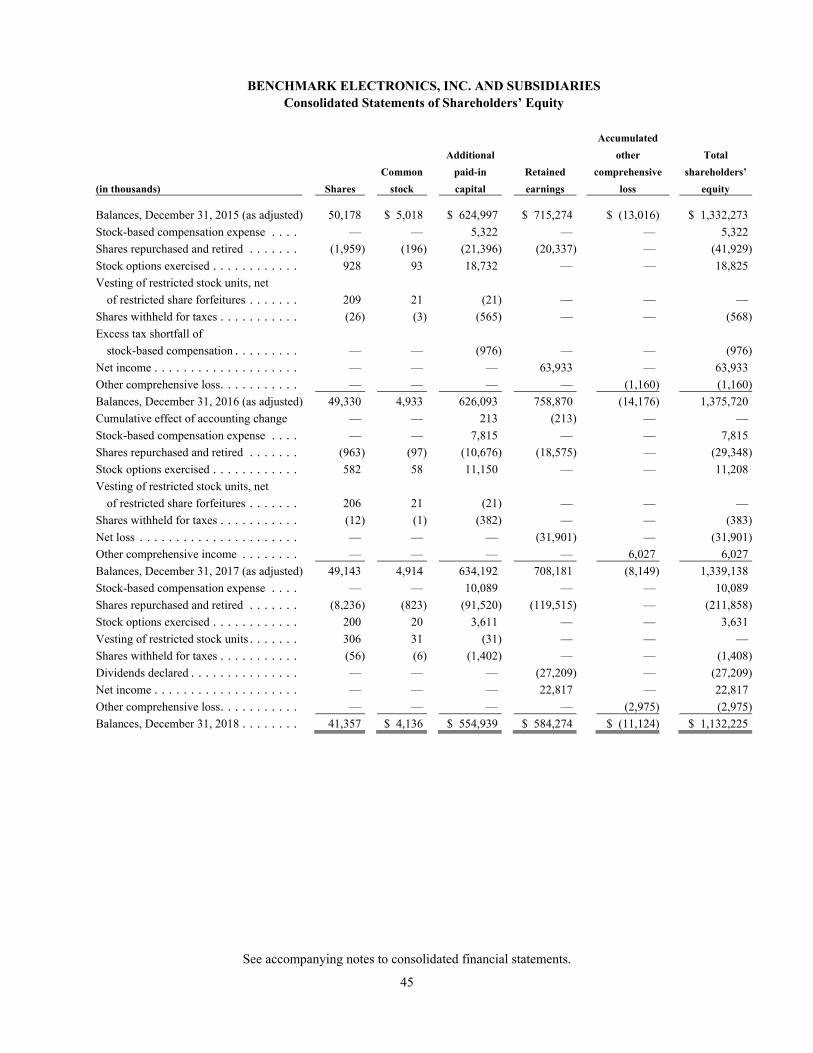
See accompanying notes to consolidated financial statements.
45
BENCHMARK ELECTRONICS, INC. AND SUBSIDIARIES Consolidated Statements of Shareholders’ Equity
Accumulated
Additional other Total
Common paid-in Retained comprehensive shareholders’
(in thousands) Shares stock capital earnings loss equity
Balances, December 31, 2015 (as adjusted) 50,178 $ 5,018 $ 624,997 $ 715,274 $ (13,016) $ 1,332,273
Stock-based compensation expense . . . . — — 5,322 — — 5,322
Shares repurchased and retired . . . . . . . (1,959) (196) (21,396) (20,337) — (41,929)
Stock options exercised . . . . . . . . . . . . 928 93 18,732 — — 18,825
Vesting of restricted stock units, net
of restricted share forfeitures . . . . . . . 209 21 (21) — — —
Shares withheld for taxes . . . . . . . . . . . (26) (3) (565) — — (568)
Excess tax shortfall of
stock-based compensation . . . . . . . . . — — (976) — — (976)
Net income . . . . . . . . . . . . . . . . . . . . — — — 63,933 — 63,933
Other comprehensive loss . . . . . . . . . . . — — — — (1,160) (1,160)
Balances, December 31, 2016 (as adjusted) 49,330 4,933 626,093 758,870 (14,176) 1,375,720
Cumulative effect of accounting change — — 213 (213) — —
Stock-based compensation expense . . . . — — 7,815 — — 7,815
Shares repurchased and retired . . . . . . . (963) (97) (10,676) (18,575) — (29,348)
Stock options exercised . . . . . . . . . . . . 582 58 11,150 — — 11,208
Vesting of restricted stock units, net
of restricted share forfeitures . . . . . . . 206 21 (21) — — —
Shares withheld for taxes . . . . . . . . . . . (12) (1) (382) — — (383)
Net loss . . . . . . . . . . . . . . . . . . . . . . — — — (31,901) — (31,901)
Other comprehensive income . . . . . . . . — — — — 6,027 6,027
Balances, December 31, 2017 (as adjusted) 49,143 4,914 634,192 708,181 (8,149) 1,339,138
Stock-based compensation expense . . . . — — 10,089 — — 10,089
Shares repurchased and retired . . . . . . . (8,236) (823) (91,520) (119,515) — (211,858)
Stock options exercised . . . . . . . . . . . . 200 20 3,611 — — 3,631
Vesting of restricted stock units . . . . . . . 306 31 (31) — — —
Shares withheld for taxes . . . . . . . . . . . (56) (6) (1,402) — — (1,408)
Dividends declared . . . . . . . . . . . . . . . — — — (27,209) — (27,209)
Net income . . . . . . . . . . . . . . . . . . . . — — — 22,817 — 22,817
Other comprehensive loss . . . . . . . . . . . — — — — (2,975) (2,975)
Balances, December 31, 2018 . . . . . . . . 41,357 $ 4,136 $ 554,939 $ 584,274 $ (11,124) $ 1,132,225
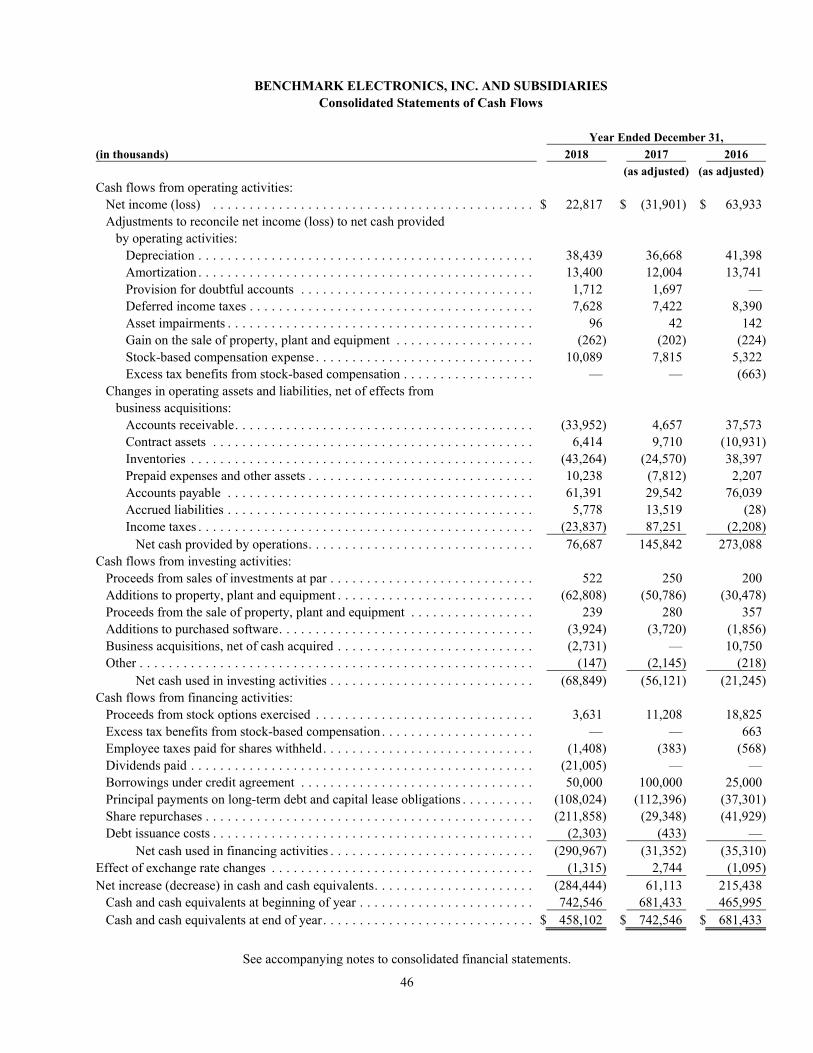
See accompanying notes to consolidated financial statements.
46
BENCHMARK ELECTRONICS, INC. AND SUBSIDIARIES Consolidated Statements of Cash Flows
Year Ended December 31,
(in thousands) 2018 2017 2016
(as adjusted) (as adjusted)
Cash flows from operating activities: Net income (loss) . . . . . . . . . . . . . . . . . . . . . . . . . . . . . . . . . . . . . . . . . . . . $ 22,817 $ (31,901) $ 63,933 Adjustments to reconcile net income (loss) to net cash provided by operating activities: Depreciation . . . . . . . . . . . . . . . . . . . . . . . . . . . . . . . . . . . . . . . . . . . . . . 38,439 36,668 41,398 Amortization . . . . . . . . . . . . . . . . . . . . . . . . . . . . . . . . . . . . . . . . . . . . . . 13,400 12,004 13,741 Provision for doubtful accounts . . . . . . . . . . . . . . . . . . . . . . . . . . . . . . . . 1,712 1,697 — Deferred income taxes . . . . . . . . . . . . . . . . . . . . . . . . . . . . . . . . . . . . . . . 7,628 7,422 8,390 Asset impairments . . . . . . . . . . . . . . . . . . . . . . . . . . . . . . . . . . . . . . . . . . 96 42 142 Gain on the sale of property, plant and equipment . . . . . . . . . . . . . . . . . . . (262) (202) (224) Stock-based compensation expense . . . . . . . . . . . . . . . . . . . . . . . . . . . . . . 10,089 7,815 5,322 Excess tax benefits from stock-based compensation . . . . . . . . . . . . . . . . . . — — (663) Changes in operating assets and liabilities, net of effects from business acquisitions: Accounts receivable . . . . . . . . . . . . . . . . . . . . . . . . . . . . . . . . . . . . . . . . . (33,952) 4,657 37,573 Contract assets . . . . . . . . . . . . . . . . . . . . . . . . . . . . . . . . . . . . . . . . . . . . 6,414 9,710 (10,931) Inventories . . . . . . . . . . . . . . . . . . . . . . . . . . . . . . . . . . . . . . . . . . . . . . . (43,264) (24,570) 38,397 Prepaid expenses and other assets . . . . . . . . . . . . . . . . . . . . . . . . . . . . . . . 10,238 (7,812) 2,207 Accounts payable . . . . . . . . . . . . . . . . . . . . . . . . . . . . . . . . . . . . . . . . . . 61,391 29,542 76,039 Accrued liabilities . . . . . . . . . . . . . . . . . . . . . . . . . . . . . . . . . . . . . . . . . . 5,778 13,519 (28) Income taxes . . . . . . . . . . . . . . . . . . . . . . . . . . . . . . . . . . . . . . . . . . . . . . (23,837) 87,251 (2,208) Net cash provided by operations . . . . . . . . . . . . . . . . . . . . . . . . . . . . . . . 76,687 145,842 273,088Cash flows from investing activities: Proceeds from sales of investments at par . . . . . . . . . . . . . . . . . . . . . . . . . . . . 522 250 200 Additions to property, plant and equipment . . . . . . . . . . . . . . . . . . . . . . . . . . . (62,808) (50,786) (30,478) Proceeds from the sale of property, plant and equipment . . . . . . . . . . . . . . . . . 239 280 357 Additions to purchased software . . . . . . . . . . . . . . . . . . . . . . . . . . . . . . . . . . . (3,924) (3,720) (1,856) Business acquisitions, net of cash acquired . . . . . . . . . . . . . . . . . . . . . . . . . . . (2,731) — 10,750 Other . . . . . . . . . . . . . . . . . . . . . . . . . . . . . . . . . . . . . . . . . . . . . . . . . . . . . . (147) (2,145) (218) Net cash used in investing activities . . . . . . . . . . . . . . . . . . . . . . . . . . . . (68,849) (56,121) (21,245)Cash flows from financing activities: Proceeds from stock options exercised . . . . . . . . . . . . . . . . . . . . . . . . . . . . . . 3,631 11,208 18,825 Excess tax benefits from stock-based compensation . . . . . . . . . . . . . . . . . . . . . — — 663 Employee taxes paid for shares withheld . . . . . . . . . . . . . . . . . . . . . . . . . . . . . (1,408) (383) (568) Dividends paid . . . . . . . . . . . . . . . . . . . . . . . . . . . . . . . . . . . . . . . . . . . . . . . (21,005) — — Borrowings under credit agreement . . . . . . . . . . . . . . . . . . . . . . . . . . . . . . . . 50,000 100,000 25,000 Principal payments on long-term debt and capital lease obligations . . . . . . . . . . (108,024) (112,396) (37,301) Share repurchases . . . . . . . . . . . . . . . . . . . . . . . . . . . . . . . . . . . . . . . . . . . . . (211,858) (29,348) (41,929) Debt issuance costs . . . . . . . . . . . . . . . . . . . . . . . . . . . . . . . . . . . . . . . . . . . . (2,303) (433) — Net cash used in financing activities . . . . . . . . . . . . . . . . . . . . . . . . . . . . (290,967) (31,352) (35,310)Effect of exchange rate changes . . . . . . . . . . . . . . . . . . . . . . . . . . . . . . . . . . . . (1,315) 2,744 (1,095)Net increase (decrease) in cash and cash equivalents . . . . . . . . . . . . . . . . . . . . . . (284,444) 61,113 215,438 Cash and cash equivalents at beginning of year . . . . . . . . . . . . . . . . . . . . . . . . 742,546 681,433 465,995 Cash and cash equivalents at end of year . . . . . . . . . . . . . . . . . . . . . . . . . . . . . $ 458,102 $ 742,546 $ 681,433
47
Notes to Consolidated Financial Statements (amounts in thousands, except per share data, unless otherwise noted)
Note 1—Summary of Significant Accounting Policies
(a) Business Benchmark Electronics, Inc. (the Company) is a Texas corporation that provides innovative product design, engineering services, technology solutions and advanced manufacturing services. From initial product concept to volume production, including direct order fulfillment and aftermarket services, the Company has been providing integrated services and solutions to original equipment manufacturers (OEMs) since 1979. The Company serves the following industries: aerospace and defense (A&D), medical technologies, complex industrials, test and instrumentation, next-generation telecommunications and high-end computing. The Company has manufacturing operations located in the United States and Mexico (the Americas), Asia and Europe.
(b) Principles of Consolidation The consolidated financial statements have been prepared in accordance with accounting principles generally accepted in the United States (U.S. GAAP) and include the financial statements of Benchmark Electronics, Inc. and its wholly owned and majority owned subsidiaries. All significant intercompany balances and transactions have been eliminated in consolidation. Effective January 1, 2018, the Company adopted the requirements of a new accounting standard related to revenue recognition as discussed in Note 1(q). All amounts and disclosures set forth in this Form 10-K have been updated to comply with the new standard, as indicated by the “as adjusted” column heading.
(c) Cash and Cash Equivalents The Company considers all highly liquid debt instruments with an original maturity at the date of purchase of three months or less to be cash equivalents. Cash equivalents of $265.4 million and $581.4 million at December 31, 2018 and 2017, respectively, consisted primarily of money-market funds and time deposits with an initial term of less than three months.
(d) Allowance for Doubtful Accounts Accounts receivable are recorded net of allowances for amounts not expected to be collected. In estimating the allowance, management considers a specific customer’s financial condition, payment history, and various information or disclosures by the customer or other publicly available information. Accounts receivable are charged against the allowance after all reasonable efforts to collect the full amount (including litigation, where appropriate) have been exhausted. During both the third quarter of 2018 and the first quarter of 2017, the Company recorded $1.7 million in charges for a provision to accounts receivable associated with the insolvency of two customers.
(e) Inventories Inventories include material, labor and overhead and are stated at the lower of cost (principally first-in, first-out method) or net realizable value.
(f) Property, Plant and Equipment Property, plant and equipment are stated at cost. Depreciation is calculated on the straight-line method over the
48
useful lives of the assets – 5 to 40 years for buildings and building improvements, 2 to 15 years for machinery and equipment, 2 to 12 years for furniture and fixtures and 2 to 8 years for vehicles. Leasehold improvements are amortized on the straight-line method over the shorter of the useful life of the improvement or the remainder of the lease term. (g) Goodwill and Other Intangible Assets Goodwill represents the excess of purchase price over fair value of net assets acquired. Goodwill and intangible assets acquired in a business combination and determined to have an indefinite useful life are not amortized, but instead assessed for impairment at least annually. Intangible assets, including those acquired in a business combination, with estimable useful lives are amortized over their respective estimated useful lives to their estimated residual values. (h) Impairment of Long-Lived Assets and Goodwill Long-lived assets, such as property, plant, and equipment, and purchased intangibles subject to amortization, are reviewed for impairment whenever events or changes in circumstances indicate that the carrying amount of an asset may not be recoverable. Recoverability of assets to be held and used is evaluated by a comparison of the carrying amount of an asset to estimated undiscounted future cash flows expected to be generated by the asset. If the carrying amount of an asset exceeds its estimated undiscounted future cash flows, an impairment charge is recognized by the amount by which the carrying amount of the asset exceeds the estimated fair value of the asset. Assets to be disposed of would be separately disclosed and reported at the lower of the carrying amount or estimated fair value less costs to sell, and are no longer depreciated. The assets and liabilities of a disposed group classified as held for sale would be disclosed separately in the appropriate asset and liability sections of the consolidated balance sheet. Goodwill is tested for impairment on an annual basis, during the fourth quarter, and whenever events and changes in circumstances suggest that the carrying amount may be impaired. Circumstances that may lead to the impairment of goodwill include unforeseen decreases in future performance or industry demand or the restructuring of our operations as a result of a change in our business strategy. A qualitative assessment is allowed to determine if goodwill is potentially impaired. Based on this qualitative assessment, if the Company determines that it is more likely than not that the reporting unit’s fair value is less than its carrying value, then it performs a two-step goodwill impairment test, otherwise no further analysis is required. In connection with its annual qualitative goodwill impairment assessments as of December 31, 2018, 2017 and 2016, the Company concluded that goodwill was not impaired. (i) Earnings (Loss) Per Share Basic earnings per share is computed using the weighted-average number of shares outstanding. Diluted earnings per share is computed using the weighted-average number of shares outstanding adjusted for the incremental shares attributed to outstanding stock equivalents. Stock equivalents include common shares issuable upon the exercise of stock options and other equity instruments, and are computed using the treasury stock method. Under the treasury stock method, the exercise price of a share, the amount of compensation cost, if any, for future service that the Company has not yet recognized are assumed to be used to repurchase shares in the current period.
49
The following table sets forth the calculation of basic and diluted earnings (loss) per share.
Year Ended December 31,
(in thousands, except per share data) 2018 2017 2016
(as adjusted)
Net income (loss) . . . . . . . . . . . . . . . . . . . . . . . . . . . . . . . . . . . . . . . . . $ 22,817 $ (31,901) $ 63,933
Denominator for basic earnings per share – weighted-average number of common shares outstanding during the period . . . . . . . . . . . . . . . . . . 46,332 49,680 49,298
Incremental common shares attributable to exercise of dilutive options . . 104 — 313
Incremental common shares attributable to outstanding restricted stock units . . . . . . . . . . . . . . . . . . . . . . . . . . . . . . . . . . . . . 219 — 214
Denominator for diluted earnings per share . . . . . . . . . . . . . . . . . . . . . . 46,655 49,680 49,825
Basic earnings (loss) per share . . . . . . . . . . . . . . . . . . . . . . . . . . . . . . . $ 0.49 $ (0.64) $ 1.30
Diluted earnings (loss) per share . . . . . . . . . . . . . . . . . . . . . . . . . . . . . . $ 0.49 $ (0.64) $ 1.28
Potentially dilutive securities totaling 0.6 million common shares in 2017 were not included in the computation of diluted loss per share because their effect would have decreased the loss per share. Options to purchase 0.4 million common shares in 2016 were not included in the computation of diluted earnings per share because their effect would have been anti-dilutive.
(j) Revenue Recognition The Company recognizes revenue as the customer takes control of the manufactured products built to customer specifications. Under the majority of the Company’s manufacturing contracts with customers, the customer controls all of the work-in-progress as products are being built. Revenues under these contracts are recognized over time based on the cost-to-cost method. Under other manufacturing contracts, the customer does not take control of the product until it is completed. Under these contracts, the Company continues to recognize revenue upon transfer of control of product to the customer, which is generally when the goods are shipped. Revenue from design, development and engineering services also continues to be recognized over time as the services are performed. The Company’s performance obligations generally have an expected duration of one year or less. The Company applies the practical expedients and does not disclose information about remaining performance obligations that have original expected durations of one year or less or any significant financing components in the contracts. The Company recognizes the incremental costs, if any, of obtaining contracts as an expense when incurred since the amortization period of the assets that the Company otherwise would have recognized is one year less. (k) Income Taxes Income taxes are accounted for under the asset and liability method. Deferred income taxes are recognized for the future tax consequences attributable to differences between the financial statement carrying amounts of existing assets and liabilities and their respective tax bases. Deferred tax assets and liabilities are measured using enacted tax rates expected to apply to taxable income in the years in which those temporary differences are expected to be recovered or settled. The effect on deferred taxes of a change in tax rates is recognized in income in the period that includes the enactment date. The Company records a valuation allowance to reduce its deferred tax assets to the amounts that are more likely than not to be realized. The Company has considered the scheduled reversal of deferred tax liabilities, projected future taxable income and tax planning strategies in assessing the need for the valuation allowance.
50
(l) Stock-Based Compensation All share-based payments to employees, including grants of employee stock options (which have not been awarded since 2015), are recognized in the financial statements based on their grant date fair values. The total compensation cost recognized for stock-based awards was $10.1 million, $7.8 million and $5.3 million for 2018, 2017 and 2016, respectively. The total income tax benefit recognized in the income statement for stock-based awards was $2.4 million, $2.8 million and $1.1 million for 2018, 2017 and 2016, respectively. The fair value of each option grant is estimated on the date of grant using the Black-Scholes option pricing model. Awards of restricted stock units and performance-based restricted stock units are valued at the closing market price of the Company’s common stock on the date of grant. For performance-based restricted stock units, compensation expense is based on the probability that the performance goals will be achieved, which is monitored by management throughout the requisite service period. When it becomes probable, based on the Company’s expectation of performance during the measurement period, that more or less than the previous estimate of the awarded shares will vest, an adjustment to stock-based compensation expense is recognized as a change in accounting estimate. As of December 31, 2018, the unrecognized compensation cost and remaining weighted-average amortization related to stock-based awards were as follows:
Performance-
based
Restricted Restricted
Stock Stock Stock
(in thousands) Options Units Units(1)
Unrecognized compensation cost . . . . . . . . . . . . . . . . . . . . . . . . . . . $ 44 $ 12,738 $ 2,461
Remaining weighted-average amortization period . . . . . . . . . . . . . . . 0.2 years 2.4 years 1.2 years (1) Based on the probable achievement of the performance goals identified in each award. The total cash received as a result of stock option exercises in 2018, 2017 and 2016 was approximately $3.6 million, $11.2 million and $18.8 million, respectively. The actual tax benefit realized as a result of stock option exercises and the vesting of other share-based awards during 2018, 2017 and 2016 was $2.5 million, $5.0 million and $3.7 million, respectively. For 2018, 2017 and 2016, the total intrinsic value of stock options exercised was $2.3 million, $7.7 million and $5.1 million, respectively. The Company awarded performance-based restricted stock units to employees during 2018, 2017 and 2016. The number of performance-based restricted stock units that will ultimately be earned will not be determined until the end of the corresponding performance periods, and may vary from as low as zero to as high as 2.5 times the target number depending on the level of achievement of certain performance goals. The level of achievement of these goals is based upon the financial results of the Company for the last full calendar year within the performance period. The performance goals consist of certain levels of achievement using the following financial metrics: revenue growth, operating margin expansion, and return on invested capital. If the performance goals are not met based on the Company’s financial results, the applicable performance-based restricted stock units will not vest and will be forfeited. Shares subject to forfeited performance-based restricted stock units will be available for issuance under the Company’s 2010 Omnibus Incentive Compensation Plan (the 2010 Plan). (m) Use of Estimates Management of the Company has made a number of estimates and assumptions relating to the reporting of assets and liabilities and the disclosure of contingent assets and liabilities to prepare these financial statements in accordance with U.S. GAAP. On an ongoing basis, management evaluates these estimates, including those related to
51
accounts receivable, inventories, income taxes, long-lived assets, stock-based compensation and contingencies and litigation. Actual results could differ from those estimates. (n) Fair Values of Financial Instruments Fair value is defined as the exchange price that would be received for an asset or paid to transfer a liability (an exit price) in the principal or most advantageous market for the asset or liability in an orderly transaction between market participants on the measurement date. A three-tier fair value hierarchy of inputs is employed to determine fair value measurements.
Level 1 inputs are quoted prices (unadjusted) in active markets for identical assets and liabilities. Level 2 inputs are observable prices that are not quoted on active exchanges, such as quoted prices for
similar assets or liabilities; quoted prices in markets that are not active; and model-derived valuations whose inputs are observable or whose significant value drivers are observable.
Level 3 inputs are unobservable inputs employed for measuring the fair value of assets or liabilities. This hierarchy requires the Company to use observable market data, when available, and to minimize the use of unobservable inputs when determining fair value. The Company’s financial instruments include cash equivalents, accounts and other receivables, accounts payable, accrued liabilities and long-term debt and capital lease obligations. The Company believes that the carrying values of these instruments approximate their fair value. As of December 31, 2018, all of the Company’s long-term investments and derivative instruments were recorded at fair value using Level 3 inputs. See Note 12. (o) Foreign Currency For foreign subsidiaries using the local currency as their functional currency, assets and liabilities are translated at exchange rates in effect at the balance sheet date and income and expenses are translated at average exchange rates. The effects of these translation adjustments are reported in other comprehensive income. Exchange losses arising from transactions denominated in a currency other than the functional currency of the entity involved are included in other expense and totaled approximately $1.0 million, $2.1 million and $0.5 million in 2018, 2017 and 2016, respectively. These amounts include the amount of gain (loss) recognized in income due to forward currency exchange contracts. (p) Derivative Instruments All derivative instruments are recorded on the balance sheet at fair value. The Company uses derivative instruments to manage the variability of foreign currency obligations and interest rates. The Company does not enter into derivative arrangements for speculative purposes. Generally, if a derivative instrument is designated as a cash flow hedge, the change in the fair value of the derivative is recorded in other comprehensive income to the extent the derivative is effective, and recognized in the consolidated statement of income when the hedged item affects earnings. Changes in fair value of derivatives that are not designated as hedges are recorded in earnings. Cash receipts and cash payments related to derivative instruments are recorded in the same category as the cash flows from the items being hedged on the consolidated statements of cash flows. (q) New Accounting Pronouncements Adopted in 2018 In May 2017, the Financial Accounting Standards Board (FASB) issued a new accounting standards update that provides guidance about which changes to the terms or conditions of a share-based payment award require an entity to apply modification accounting. The Company adopted the new guidance effective January 1, 2018. The impact of adoption on the Company's consolidated financial statements is dependent on future changes to stock-based compensation awards.
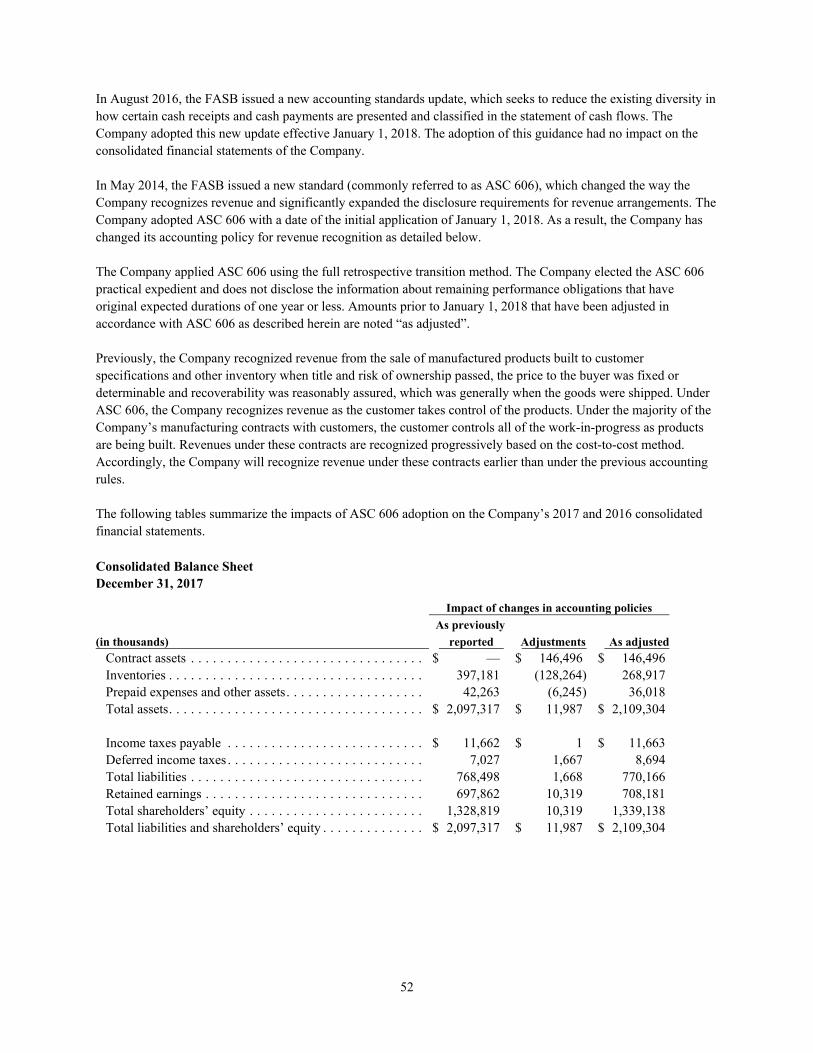
52
In August 2016, the FASB issued a new accounting standards update, which seeks to reduce the existing diversity in how certain cash receipts and cash payments are presented and classified in the statement of cash flows. The Company adopted this new update effective January 1, 2018. The adoption of this guidance had no impact on the consolidated financial statements of the Company. In May 2014, the FASB issued a new standard (commonly referred to as ASC 606), which changed the way the Company recognizes revenue and significantly expanded the disclosure requirements for revenue arrangements. The Company adopted ASC 606 with a date of the initial application of January 1, 2018. As a result, the Company has changed its accounting policy for revenue recognition as detailed below. The Company applied ASC 606 using the full retrospective transition method. The Company elected the ASC 606 practical expedient and does not disclose the information about remaining performance obligations that have original expected durations of one year or less. Amounts prior to January 1, 2018 that have been adjusted in accordance with ASC 606 as described herein are noted “as adjusted”. Previously, the Company recognized revenue from the sale of manufactured products built to customer specifications and other inventory when title and risk of ownership passed, the price to the buyer was fixed or determinable and recoverability was reasonably assured, which was generally when the goods were shipped. Under ASC 606, the Company recognizes revenue as the customer takes control of the products. Under the majority of the Company’s manufacturing contracts with customers, the customer controls all of the work-in-progress as products are being built. Revenues under these contracts are recognized progressively based on the cost-to-cost method. Accordingly, the Company will recognize revenue under these contracts earlier than under the previous accounting rules. The following tables summarize the impacts of ASC 606 adoption on the Company’s 2017 and 2016 consolidated financial statements. Consolidated Balance Sheet December 31, 2017
Impact of changes in accounting policies
As previously
(in thousands) reported Adjustments As adjusted
Contract assets . . . . . . . . . . . . . . . . . . . . . . . . . . . . . . . . $ — $ 146,496 $ 146,496 Inventories . . . . . . . . . . . . . . . . . . . . . . . . . . . . . . . . . . . 397,181 (128,264) 268,917 Prepaid expenses and other assets . . . . . . . . . . . . . . . . . . . 42,263 (6,245) 36,018 Total assets . . . . . . . . . . . . . . . . . . . . . . . . . . . . . . . . . . . $ 2,097,317 $ 11,987 $ 2,109,304 Income taxes payable . . . . . . . . . . . . . . . . . . . . . . . . . . . $ 11,662 $ 1 $ 11,663 Deferred income taxes . . . . . . . . . . . . . . . . . . . . . . . . . . . 7,027 1,667 8,694 Total liabilities . . . . . . . . . . . . . . . . . . . . . . . . . . . . . . . . 768,498 1,668 770,166 Retained earnings . . . . . . . . . . . . . . . . . . . . . . . . . . . . . . 697,862 10,319 708,181 Total shareholders’ equity . . . . . . . . . . . . . . . . . . . . . . . . 1,328,819 10,319 1,339,138 Total liabilities and shareholders’ equity . . . . . . . . . . . . . . $ 2,097,317 $ 11,987 $ 2,109,304
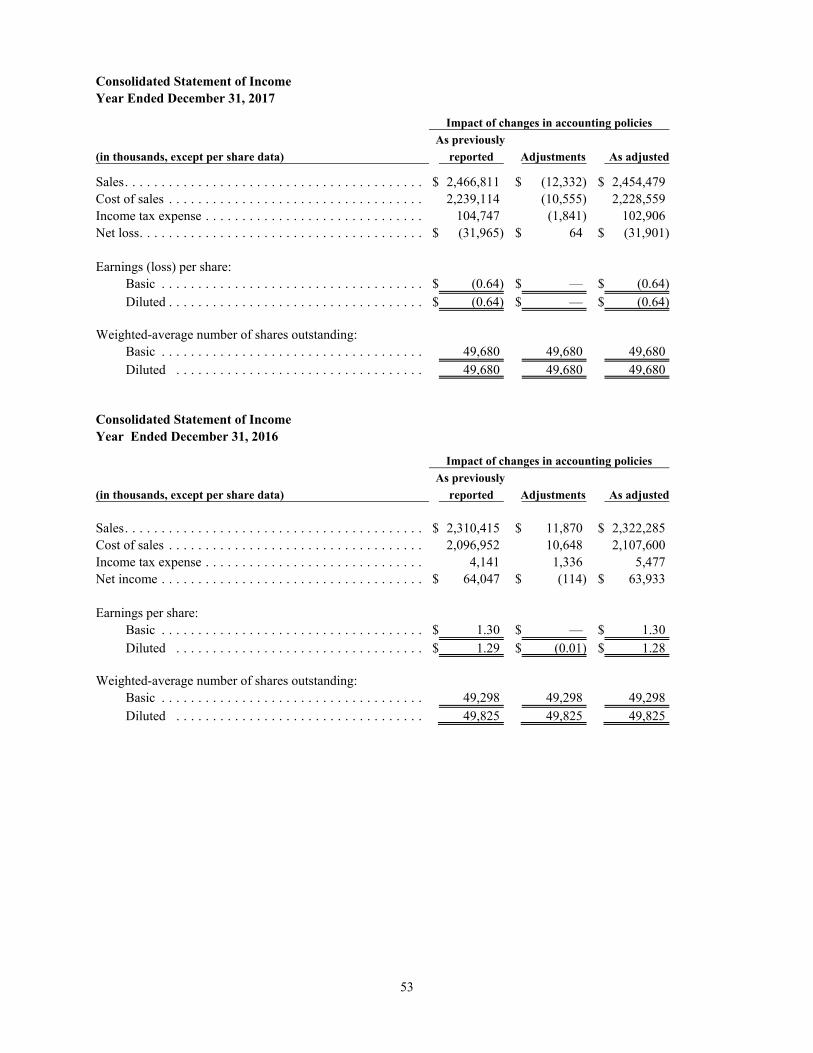
53
Consolidated Statement of Income Year Ended December 31, 2017
Impact of changes in accounting policies
As previously
(in thousands, except per share data) reported Adjustments As adjusted
Sales . . . . . . . . . . . . . . . . . . . . . . . . . . . . . . . . . . . . . . . . . $ 2,466,811 $ (12,332) $ 2,454,479Cost of sales . . . . . . . . . . . . . . . . . . . . . . . . . . . . . . . . . . . 2,239,114 (10,555) 2,228,559Income tax expense . . . . . . . . . . . . . . . . . . . . . . . . . . . . . . 104,747 (1,841) 102,906Net loss . . . . . . . . . . . . . . . . . . . . . . . . . . . . . . . . . . . . . . . $ (31,965) $ 64 $ (31,901) Earnings (loss) per share: Basic . . . . . . . . . . . . . . . . . . . . . . . . . . . . . . . . . . . . $ (0.64) $ — $ (0.64) Diluted . . . . . . . . . . . . . . . . . . . . . . . . . . . . . . . . . . . $ (0.64) $ — $ (0.64) Weighted-average number of shares outstanding: Basic . . . . . . . . . . . . . . . . . . . . . . . . . . . . . . . . . . . . 49,680 49,680 49,680 Diluted . . . . . . . . . . . . . . . . . . . . . . . . . . . . . . . . . . 49,680 49,680 49,680 Consolidated Statement of Income Year Ended December 31, 2016
Impact of changes in accounting policies
As previously
(in thousands, except per share data) reported Adjustments As adjusted
Sales . . . . . . . . . . . . . . . . . . . . . . . . . . . . . . . . . . . . . . . . . $ 2,310,415 $ 11,870 $ 2,322,285Cost of sales . . . . . . . . . . . . . . . . . . . . . . . . . . . . . . . . . . . 2,096,952 10,648 2,107,600Income tax expense . . . . . . . . . . . . . . . . . . . . . . . . . . . . . . 4,141 1,336 5,477Net income . . . . . . . . . . . . . . . . . . . . . . . . . . . . . . . . . . . . $ 64,047 $ (114) $ 63,933 Earnings per share: Basic . . . . . . . . . . . . . . . . . . . . . . . . . . . . . . . . . . . . $ 1.30 $ — $ 1.30 Diluted . . . . . . . . . . . . . . . . . . . . . . . . . . . . . . . . . . $ 1.29 $ (0.01) $ 1.28 Weighted-average number of shares outstanding: Basic . . . . . . . . . . . . . . . . . . . . . . . . . . . . . . . . . . . . 49,298 49,298 49,298 Diluted . . . . . . . . . . . . . . . . . . . . . . . . . . . . . . . . . . 49,825 49,825 49,825
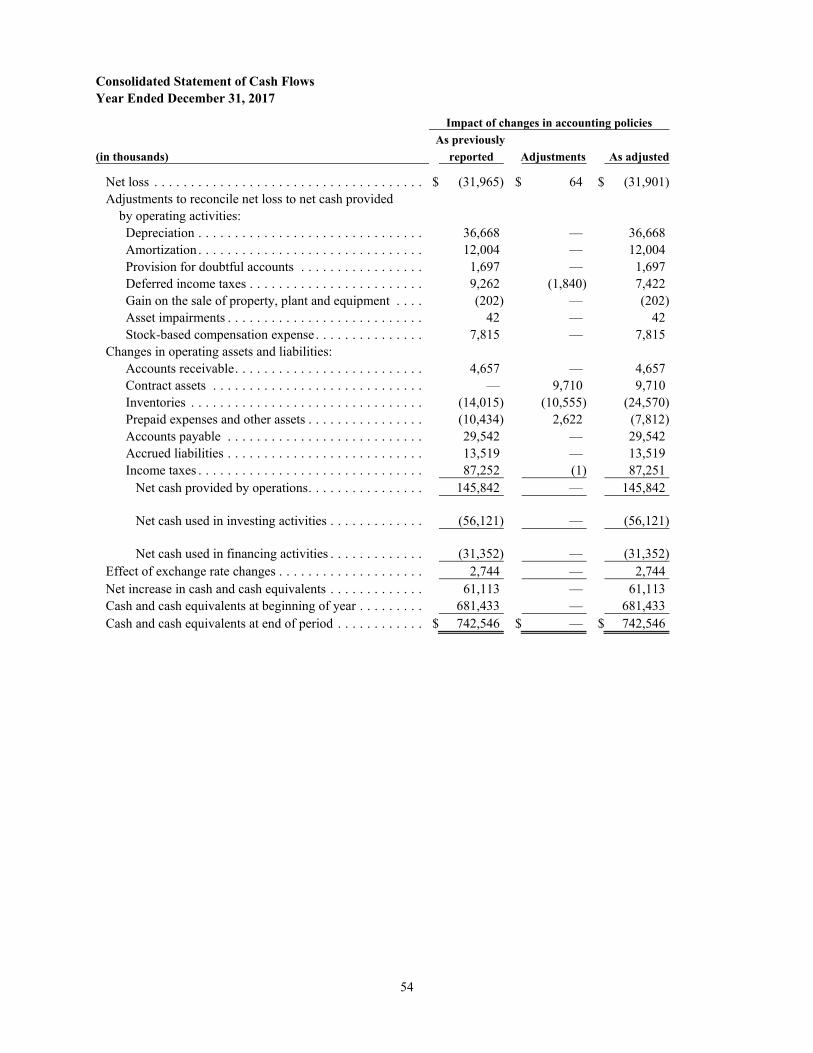
54
Consolidated Statement of Cash Flows Year Ended December 31, 2017
Impact of changes in accounting policies
As previously
(in thousands) reported Adjustments As adjusted
Net loss . . . . . . . . . . . . . . . . . . . . . . . . . . . . . . . . . . . . . $ (31,965) $ 64 $ (31,901) Adjustments to reconcile net loss to net cash provided by operating activities: Depreciation . . . . . . . . . . . . . . . . . . . . . . . . . . . . . . . 36,668 — 36,668 Amortization . . . . . . . . . . . . . . . . . . . . . . . . . . . . . . . 12,004 — 12,004 Provision for doubtful accounts . . . . . . . . . . . . . . . . . 1,697 — 1,697 Deferred income taxes . . . . . . . . . . . . . . . . . . . . . . . . 9,262 (1,840) 7,422 Gain on the sale of property, plant and equipment . . . . (202) — (202) Asset impairments . . . . . . . . . . . . . . . . . . . . . . . . . . . 42 — 42 Stock-based compensation expense . . . . . . . . . . . . . . . 7,815 — 7,815 Changes in operating assets and liabilities: Accounts receivable . . . . . . . . . . . . . . . . . . . . . . . . . . 4,657 — 4,657 Contract assets . . . . . . . . . . . . . . . . . . . . . . . . . . . . . — 9,710 9,710 Inventories . . . . . . . . . . . . . . . . . . . . . . . . . . . . . . . . (14,015) (10,555) (24,570) Prepaid expenses and other assets . . . . . . . . . . . . . . . . (10,434) 2,622 (7,812) Accounts payable . . . . . . . . . . . . . . . . . . . . . . . . . . . 29,542 — 29,542 Accrued liabilities . . . . . . . . . . . . . . . . . . . . . . . . . . . 13,519 — 13,519 Income taxes . . . . . . . . . . . . . . . . . . . . . . . . . . . . . . . 87,252 (1) 87,251 Net cash provided by operations . . . . . . . . . . . . . . . . 145,842 — 145,842 Net cash used in investing activities . . . . . . . . . . . . . (56,121) — (56,121) Net cash used in financing activities . . . . . . . . . . . . . (31,352) — (31,352) Effect of exchange rate changes . . . . . . . . . . . . . . . . . . . . 2,744 — 2,744 Net increase in cash and cash equivalents . . . . . . . . . . . . . 61,113 — 61,113 Cash and cash equivalents at beginning of year . . . . . . . . . 681,433 — 681,433 Cash and cash equivalents at end of period . . . . . . . . . . . . $ 742,546 $ — $ 742,546

55
Consolidated Statement of Cash Flows Year Ended December 31, 2016
Impact of changes in accounting policies
As previously
(in thousands) reported Adjustments As adjusted
Net income . . . . . . . . . . . . . . . . . . . . . . . . . . . . . . . . . . . $ 64,047 $ (114) $ 63,933 Adjustments to reconcile net income to net cash provided by operating activities: Depreciation . . . . . . . . . . . . . . . . . . . . . . . . . . . . . . . 41,398 — 41,398 Amortization . . . . . . . . . . . . . . . . . . . . . . . . . . . . . . . 13,741 — 13,741 Deferred income taxes . . . . . . . . . . . . . . . . . . . . . . . . 7,055 1,335 8,390 Gain on the sale of property, plant and equipment . . . . (224) — (224) Asset impairments . . . . . . . . . . . . . . . . . . . . . . . . . . . 142 — 142 Stock-based compensation expense . . . . . . . . . . . . . . . 5,322 — 5,322 Excess tax benefits from stock-based compensation . . . (663) — (663) Changes in operating assets and liabilities: Accounts receivable . . . . . . . . . . . . . . . . . . . . . . . . . . 37,573 — 37,573 Contract assets . . . . . . . . . . . . . . . . . . . . . . . . . . . . . — (10,931) (10,931) Inventories . . . . . . . . . . . . . . . . . . . . . . . . . . . . . . . . 27,749 10,648 38,397 Prepaid expenses and other assets . . . . . . . . . . . . . . . . 3,147 (940) 2,207 Accounts payable . . . . . . . . . . . . . . . . . . . . . . . . . . . 76,039 — 76,039 Accrued liabilities . . . . . . . . . . . . . . . . . . . . . . . . . . . (28) — (28) Income taxes . . . . . . . . . . . . . . . . . . . . . . . . . . . . . . . (2,210) 2 (2,208) Net cash provided by operations . . . . . . . . . . . . . . . . 273,088 — 273,088 Net cash used in investing activities . . . . . . . . . . . . . (21,245) — (21,245) Net cash used in financing activities . . . . . . . . . . . . . (35,310) — (35,310) Effect of exchange rate changes . . . . . . . . . . . . . . . . . . . . (1,095) — (1,095) Net increase in cash and cash equivalents . . . . . . . . . . . . . 215,438 — 215,438 Cash and cash equivalents at beginning of year . . . . . . . . . 465,995 — 465,995 Cash and cash equivalents at end of period . . . . . . . . . . . . $ 681,433 $ — $ 681,433
Not Yet Adopted In February 2018, the FASB issued optional new accounting guidance that allows the reclassification of certain tax effects from accumulated other comprehensive income to retained earnings. This guidance is effective January 1, 2019, with early adoption permitted. The Company is evaluating whether it will adopt this new guidance along with any impacts on the Company’s financial position, results of operations and cash flows, none of which are expected to be material. In June 2016, the FASB issued a new accounting standards update, which replaces the current incurred loss impairment methodology with a methodology that reflects expected credit losses and requires consideration of a broader range of reasonable and supportable information to inform credit loss estimates. This update is effective for annual reporting periods beginning after December 15, 2019. The Company does not expect the implementation of this update to have a material impact on its consolidated financial position, results of operations or cash flows; and will adopt this update effective January 1, 2020.

56
In February 2016, the FASB established Topic 842, Leases, and issued a new accounting standards update (ASU) No. 2016-02, which requires lessees to recognize leases on-balance sheet and disclose key information about leasing arrangements. Topic 842 was subsequently amended by ASU No. 2018-01, Land Easement Practical Expedient for Transition to Topic 842; ASU No. 2018-10, Codification Improvements to Topic 842, Leases; and ASU No. 2018-11, Targeted Improvements. The new standard establishes a right-of-use model (ROU) that requires a lessee to recognize a ROU asset and lease liability on the balance sheet for all leases with a term longer than 12 months. Leases will be classified as finance or operating, with classification affecting the pattern and classification of expense recognition in the income statement. The Company adopted the new standard on its effective date of January 1, 2019 using the effective date as our date of initial application under the modified retrospective transition approach. Consequently, financial information will not be updated and the disclosures required under the new standard will not be provided for dates and periods before January 1, 2019. The new standard provides a number of optional practical expedients in transition. Management elected the ‘package of practical expedients’, which permits the Company not to reassess under the new standard its prior conclusions about lease identification, lease classification and initial direct costs. Management does not expect to elect the use-of-hindsight or the practical expedient pertaining to land easements; the latter not being applicable to the Company. Management elected all of the new standard’s available transition practical expedients. The Company has completed its preliminary assessment of adopting ASC 842 as of January 1, 2019. The adoption of the standard will have a material effect on its financial statements. The most significant effects of adoption relate to (1) the recognition of new ROU assets and lease liabilities on the Company’s balance sheet for its real estate and equipment operating leases; and (2) providing significant new disclosures about our leasing activities beginning with the Quarterly Report on Form 10-Q for the first quarter of 2019. Management does not expect a significant change in the Company’s leasing activities as a result of the adoption. On adoption, the Company expects to recognize additional operating liabilities in the range of approximately $85 million to $90 million, with corresponding ROU assets based on the present value of the remaining expected rental payments. The new standard also provides practical expedients for an entity’s ongoing accounting. Management currently expects to elect the short-term lease recognition exemption for all of the Company’s leases that qualify. This means, for those leases that qualify, the Company will not recognize ROU assets or lease liabilities, and this includes not recognizing ROU assets or lease liabilities for existing short-term leases of those assets in transition. The Company also expects to elect the practical expedient to not separate lease and non-lease components for all of its leases other than leases of real estate. The Company has determined that other recently issued accounting standards will either have no material impact on its consolidated financial position, results of operations or cash flows, or will not apply to its operations.
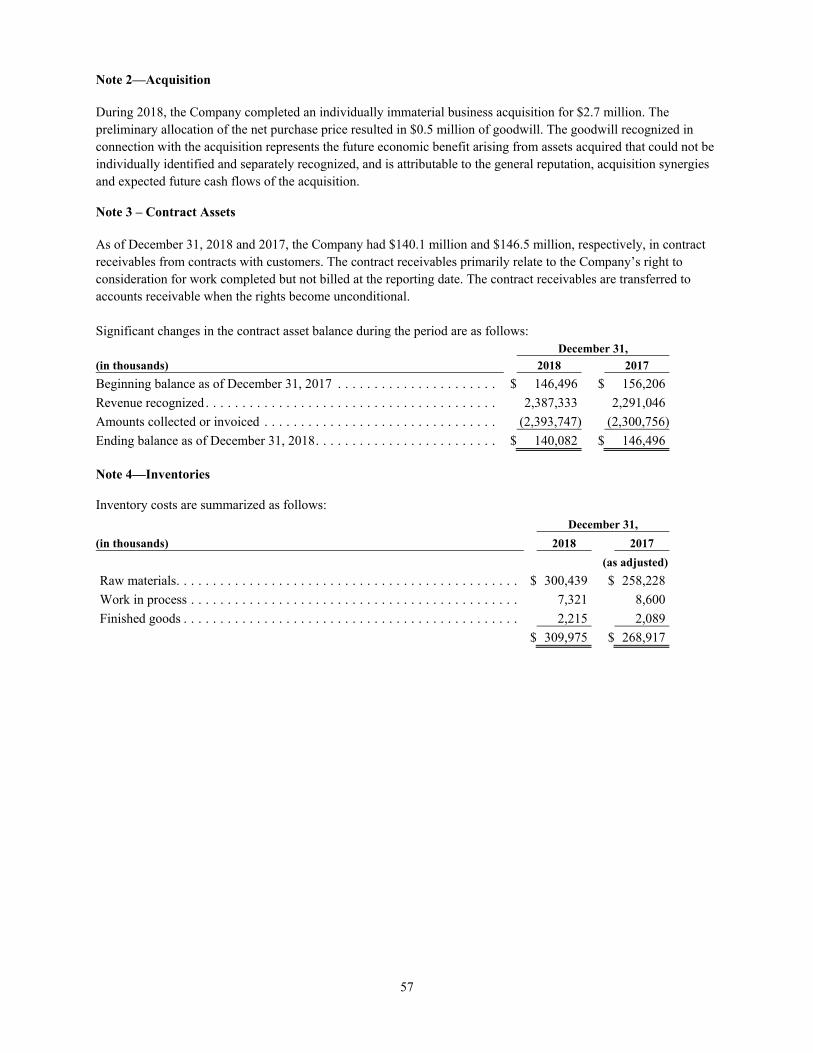
57
Note 2—Acquisition During 2018, the Company completed an individually immaterial business acquisition for $2.7 million. The preliminary allocation of the net purchase price resulted in $0.5 million of goodwill. The goodwill recognized in connection with the acquisition represents the future economic benefit arising from assets acquired that could not be individually identified and separately recognized, and is attributable to the general reputation, acquisition synergies and expected future cash flows of the acquisition. Note 3 – Contract Assets As of December 31, 2018 and 2017, the Company had $140.1 million and $146.5 million, respectively, in contract receivables from contracts with customers. The contract receivables primarily relate to the Company’s right to consideration for work completed but not billed at the reporting date. The contract receivables are transferred to accounts receivable when the rights become unconditional. Significant changes in the contract asset balance during the period are as follows: December 31,
(in thousands) 2018 2017
Beginning balance as of December 31, 2017 . . . . . . . . . . . . . . . . . . . . . . $ 146,496 $ 156,206
Revenue recognized . . . . . . . . . . . . . . . . . . . . . . . . . . . . . . . . . . . . . . . . 2,387,333 2,291,046
Amounts collected or invoiced . . . . . . . . . . . . . . . . . . . . . . . . . . . . . . . . (2,393,747) (2,300,756)
Ending balance as of December 31, 2018 . . . . . . . . . . . . . . . . . . . . . . . . . $ 140,082 $ 146,496 Note 4—Inventories Inventory costs are summarized as follows:
December 31,
(in thousands) 2018 2017
(as adjusted)
Raw materials. . . . . . . . . . . . . . . . . . . . . . . . . . . . . . . . . . . . . . . . . . . . . . . $ 300,439 $ 258,228
Work in process . . . . . . . . . . . . . . . . . . . . . . . . . . . . . . . . . . . . . . . . . . . . . 7,321 8,600
Finished goods . . . . . . . . . . . . . . . . . . . . . . . . . . . . . . . . . . . . . . . . . . . . . . 2,215 2,089
$ 309,975 $ 268,917

58
Note 5—Property, Plant and Equipment Property, plant and equipment consists of the following:
December 31,
(in thousands) 2018 2017
Land . . . . . . . . . . . . . . . . . . . . . . . . . . . . . . . . . . . . . . . . . . . . . . . . . . . . . $ 6,169 $ 6,169
Buildings and building improvements. . . . . . . . . . . . . . . . . . . . . . . . . . . . . . 97,103 90,577
Machinery and equipment . . . . . . . . . . . . . . . . . . . . . . . . . . . . . . . . . . . . . . 514,450 476,466
Furniture and fixtures . . . . . . . . . . . . . . . . . . . . . . . . . . . . . . . . . . . . . . . . . 9,343 8,468
Vehicles . . . . . . . . . . . . . . . . . . . . . . . . . . . . . . . . . . . . . . . . . . . . . . . . . . . 1,341 1,244
Leasehold improvements . . . . . . . . . . . . . . . . . . . . . . . . . . . . . . . . . . . . . . . 30,122 25,153
Construction in progress . . . . . . . . . . . . . . . . . . . . . . . . . . . . . . . . . . . . . . . 13,134 10,439
671,662 618,516
Less accumulated depreciation . . . . . . . . . . . . . . . . . . . . . . . . . . . . . . . . . . . (460,708) (432,043)
$ 210,954 $ 186,473 Note 6—Goodwill and Other Intangible Assets The changes each year in goodwill allocated to the Company’s reportable segments were as follows:
(in thousands) Americas Asia Total
Goodwill as of December 31, 2015 . . . . . . . . . . . . . . . . . . . . . $ 161,188 $ 38,102 $ 199,290
Purchase accounting adjustments . . . . . . . . . . . . . . . . . . . . . . . (7,674) — (7,674)
Goodwill as of December 31, 2016 . . . . . . . . . . . . . . . . . . . . . 153,514 38,102 191,616
Goodwill as of December 31, 2017 . . . . . . . . . . . . . . . . . . . . . $ 153,514 $ 38,102 $ 191,616
Acquisition . . . . . . . . . . . . . . . . . . . . . . . . . . . . . . . . . . . . . . 500 — 500
Goodwill as of December 31, 2018 . . . . . . . . . . . . . . . . . . . . . $ 154,014 $ 38,102 $ 192,116
During 2018, the Company completed an individually immaterial business acquisition for $2.7 million. See Note 2.

59
Other assets consist primarily of acquired identifiable intangible assets and capitalized purchased software costs. Acquired identifiable intangible assets as of December 31, 2018 and 2017 were as follows:
Gross Net
Carrying Accumulated Carrying
(in thousands) Amount Amortization Amount
Customer relationships . . . . . . . . . . . . . . . . . . . . . . . . . . . . $ 100,146 $ (40,661) $ 59,485
Purchased software costs . . . . . . . . . . . . . . . . . . . . . . . . . . . 39,069 (30,626) 8,443
Technology licenses . . . . . . . . . . . . . . . . . . . . . . . . . . . . . . 28,800 (21,006) 7,794
Trade names and trademarks . . . . . . . . . . . . . . . . . . . . . . . . 7,800 — 7,800
Other . . . . . . . . . . . . . . . . . . . . . . . . . . . . . . . . . . . . . . . . . 868 (285) 583
Intangible assets, December 31, 2018 . . . . . . . . . . . . . . . . . . $ 176,683 $ (92,578) $ 84,105
Gross Net
Carrying Accumulated Carrying
(in thousands) Amount Amortization Amount
Customer relationships . . . . . . . . . . . . . . . . . . . . . . . . . . . . $ 100,200 $ (34,372) $ 65,828
Purchased software costs . . . . . . . . . . . . . . . . . . . . . . . . . . . 35,328 (29,612) 5,716
Technology licenses . . . . . . . . . . . . . . . . . . . . . . . . . . . . . . 28,800 (17,887) 10,913
Trade names and trademarks . . . . . . . . . . . . . . . . . . . . . . . . 7,800 — 7,800
Other . . . . . . . . . . . . . . . . . . . . . . . . . . . . . . . . . . . . . . . . . 868 (261) 607
Intangible assets, December 31, 2017 . . . . . . . . . . . . . . . . . . $ 172,996 $ (82,132) $ 90,864
Customer relationships are being amortized on a straight-line basis over a period of 10 to 14 years. Capitalized purchased software costs are amortized straight-line over the estimated useful life of the related software, which ranges from 2 to 10 years. Technology licenses are being amortized over their estimated useful lives in proportion to the economic benefits consumed. During 2018, 2017 and 2016, $3.9 million, $3.7 million and $1.9 million, respectively, of purchased software costs were capitalized. Amortization on the statements of cash flow for 2018, 2017 and 2016 was as follows: Year Ended December 31,
(in thousands) 2018 2017 2016 Amortization of intangible assets . . . . . . . . . . . . . . . . . . . . . . $ 9,485 $ 10,065 $ 11,838Amortization of capitalized purchased software costs . . . . . . . . 1,198 1,078 1,147Amortization of debt costs . . . . . . . . . . . . . . . . . . . . . . . . . . . 2,717 861 756 $ 13,400 $ 12,004 $ 13,741 The estimated future amortization expense of acquired intangible assets for each of the next five years is as follows (in thousands):
Year ending December 31, Amount
2019 . . . . . . . . . . . . . . . . . . . . . . . . . . . . . . . . . . . . . . . . . . . . . . . . . . . . . . . . . . . . . . . $ 10,950
2020 . . . . . . . . . . . . . . . . . . . . . . . . . . . . . . . . . . . . . . . . . . . . . . . . . . . . . . . . . . . . . . . 10,215
2021 . . . . . . . . . . . . . . . . . . . . . . . . . . . . . . . . . . . . . . . . . . . . . . . . . . . . . . . . . . . . . . . 7,136
2022 . . . . . . . . . . . . . . . . . . . . . . . . . . . . . . . . . . . . . . . . . . . . . . . . . . . . . . . . . . . . . . . 6,943
2023 . . . . . . . . . . . . . . . . . . . . . . . . . . . . . . . . . . . . . . . . . . . . . . . . . . . . . . . . . . . . . . . 6,543
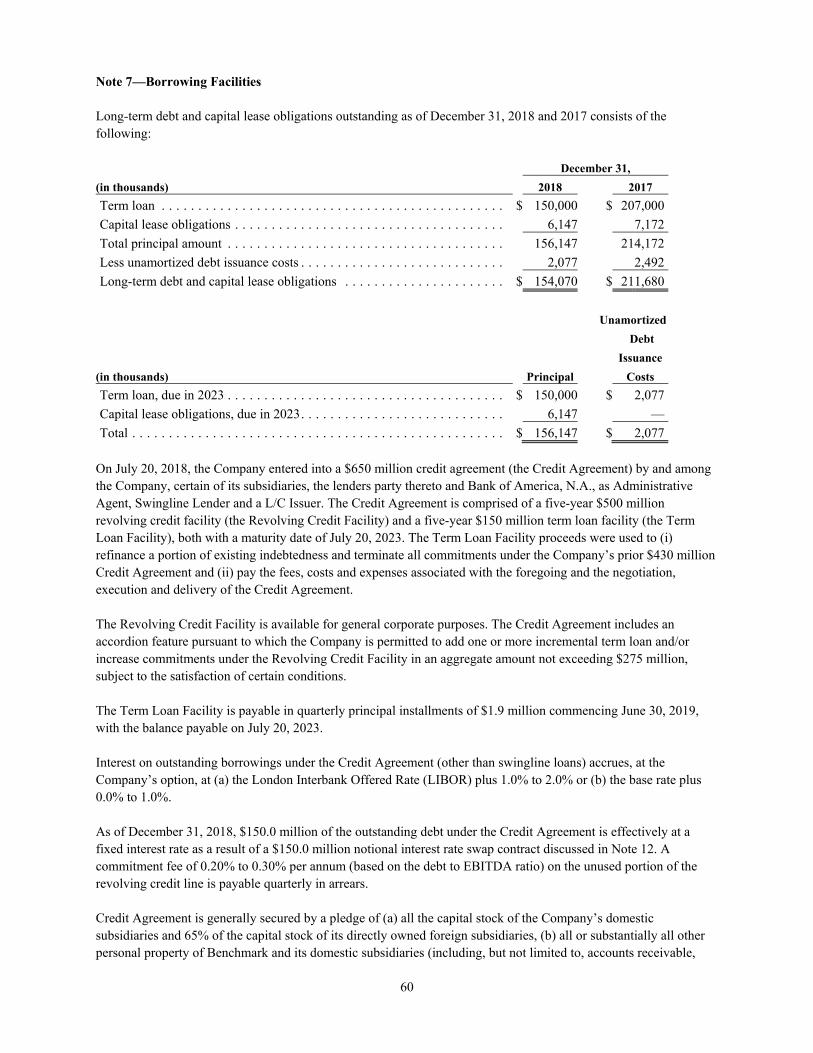
60
Note 7—Borrowing Facilities Long-term debt and capital lease obligations outstanding as of December 31, 2018 and 2017 consists of the following:
December 31,
(in thousands) 2018 2017
Term loan . . . . . . . . . . . . . . . . . . . . . . . . . . . . . . . . . . . . . . . . . . . . . . . $ 150,000 $ 207,000
Capital lease obligations . . . . . . . . . . . . . . . . . . . . . . . . . . . . . . . . . . . . . 6,147 7,172
Total principal amount . . . . . . . . . . . . . . . . . . . . . . . . . . . . . . . . . . . . . . 156,147 214,172
Less unamortized debt issuance costs . . . . . . . . . . . . . . . . . . . . . . . . . . . . 2,077 2,492
Long-term debt and capital lease obligations . . . . . . . . . . . . . . . . . . . . . . $ 154,070 $ 211,680
Unamortized
Debt
Issuance
(in thousands) Principal Costs
Term loan, due in 2023 . . . . . . . . . . . . . . . . . . . . . . . . . . . . . . . . . . . . . . $ 150,000 $ 2,077
Capital lease obligations, due in 2023 . . . . . . . . . . . . . . . . . . . . . . . . . . . . 6,147 —
Total . . . . . . . . . . . . . . . . . . . . . . . . . . . . . . . . . . . . . . . . . . . . . . . . . . . $ 156,147 $ 2,077 On July 20, 2018, the Company entered into a $650 million credit agreement (the Credit Agreement) by and among the Company, certain of its subsidiaries, the lenders party thereto and Bank of America, N.A., as Administrative Agent, Swingline Lender and a L/C Issuer. The Credit Agreement is comprised of a five-year $500 million revolving credit facility (the Revolving Credit Facility) and a five-year $150 million term loan facility (the Term Loan Facility), both with a maturity date of July 20, 2023. The Term Loan Facility proceeds were used to (i) refinance a portion of existing indebtedness and terminate all commitments under the Company’s prior $430 million Credit Agreement and (ii) pay the fees, costs and expenses associated with the foregoing and the negotiation, execution and delivery of the Credit Agreement. The Revolving Credit Facility is available for general corporate purposes. The Credit Agreement includes an accordion feature pursuant to which the Company is permitted to add one or more incremental term loan and/or increase commitments under the Revolving Credit Facility in an aggregate amount not exceeding $275 million, subject to the satisfaction of certain conditions. The Term Loan Facility is payable in quarterly principal installments of $1.9 million commencing June 30, 2019, with the balance payable on July 20, 2023. Interest on outstanding borrowings under the Credit Agreement (other than swingline loans) accrues, at the Company’s option, at (a) the London Interbank Offered Rate (LIBOR) plus 1.0% to 2.0% or (b) the base rate plus 0.0% to 1.0%. As of December 31, 2018, $150.0 million of the outstanding debt under the Credit Agreement is effectively at a fixed interest rate as a result of a $150.0 million notional interest rate swap contract discussed in Note 12. A commitment fee of 0.20% to 0.30% per annum (based on the debt to EBITDA ratio) on the unused portion of the revolving credit line is payable quarterly in arrears. Credit Agreement is generally secured by a pledge of (a) all the capital stock of the Company’s domestic subsidiaries and 65% of the capital stock of its directly owned foreign subsidiaries, (b) all or substantially all other personal property of Benchmark and its domestic subsidiaries (including, but not limited to, accounts receivable,
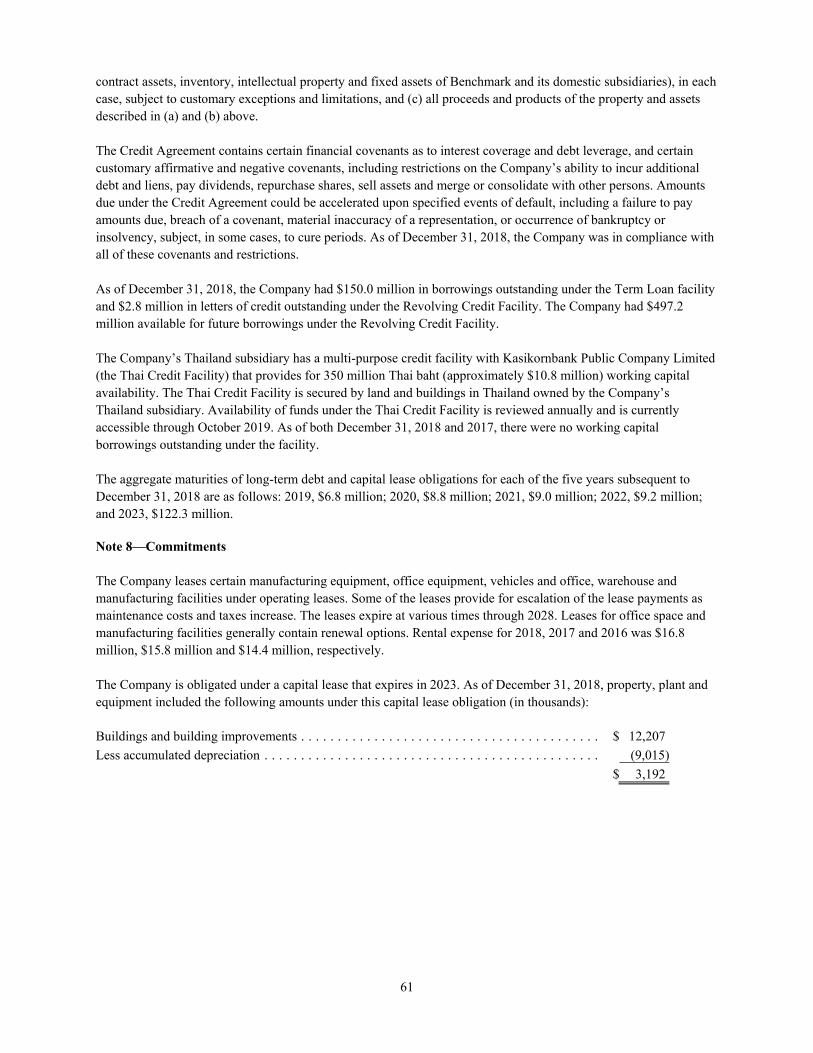
61
contract assets, inventory, intellectual property and fixed assets of Benchmark and its domestic subsidiaries), in each case, subject to customary exceptions and limitations, and (c) all proceeds and products of the property and assets described in (a) and (b) above. The Credit Agreement contains certain financial covenants as to interest coverage and debt leverage, and certain customary affirmative and negative covenants, including restrictions on the Company’s ability to incur additional debt and liens, pay dividends, repurchase shares, sell assets and merge or consolidate with other persons. Amounts due under the Credit Agreement could be accelerated upon specified events of default, including a failure to pay amounts due, breach of a covenant, material inaccuracy of a representation, or occurrence of bankruptcy or insolvency, subject, in some cases, to cure periods. As of December 31, 2018, the Company was in compliance with all of these covenants and restrictions. As of December 31, 2018, the Company had $150.0 million in borrowings outstanding under the Term Loan facility and $2.8 million in letters of credit outstanding under the Revolving Credit Facility. The Company had $497.2 million available for future borrowings under the Revolving Credit Facility. The Company’s Thailand subsidiary has a multi-purpose credit facility with Kasikornbank Public Company Limited (the Thai Credit Facility) that provides for 350 million Thai baht (approximately $10.8 million) working capital availability. The Thai Credit Facility is secured by land and buildings in Thailand owned by the Company’s Thailand subsidiary. Availability of funds under the Thai Credit Facility is reviewed annually and is currently accessible through October 2019. As of both December 31, 2018 and 2017, there were no working capital borrowings outstanding under the facility. The aggregate maturities of long-term debt and capital lease obligations for each of the five years subsequent to December 31, 2018 are as follows: 2019, $6.8 million; 2020, $8.8 million; 2021, $9.0 million; 2022, $9.2 million; and 2023, $122.3 million. Note 8—Commitments The Company leases certain manufacturing equipment, office equipment, vehicles and office, warehouse and manufacturing facilities under operating leases. Some of the leases provide for escalation of the lease payments as maintenance costs and taxes increase. The leases expire at various times through 2028. Leases for office space and manufacturing facilities generally contain renewal options. Rental expense for 2018, 2017 and 2016 was $16.8 million, $15.8 million and $14.4 million, respectively. The Company is obligated under a capital lease that expires in 2023. As of December 31, 2018, property, plant and equipment included the following amounts under this capital lease obligation (in thousands):
Buildings and building improvements . . . . . . . . . . . . . . . . . . . . . . . . . . . . . . . . . . . . . . . . . $ 12,207
Less accumulated depreciation . . . . . . . . . . . . . . . . . . . . . . . . . . . . . . . . . . . . . . . . . . . . . . (9,015)
$ 3,192
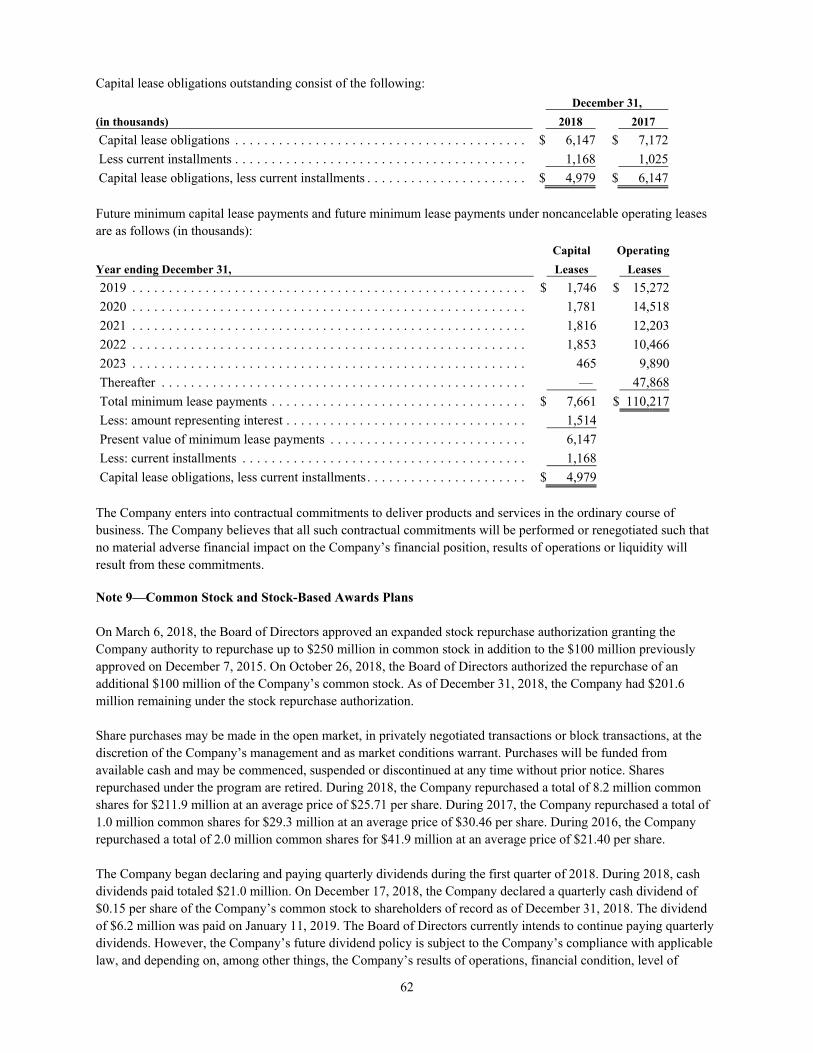
62
Capital lease obligations outstanding consist of the following:
December 31,
(in thousands) 2018 2017
Capital lease obligations . . . . . . . . . . . . . . . . . . . . . . . . . . . . . . . . . . . . . . . . $ 6,147 $ 7,172
Less current installments . . . . . . . . . . . . . . . . . . . . . . . . . . . . . . . . . . . . . . . . 1,168 1,025
Capital lease obligations, less current installments . . . . . . . . . . . . . . . . . . . . . . $ 4,979 $ 6,147 Future minimum capital lease payments and future minimum lease payments under noncancelable operating leases are as follows (in thousands):
Capital Operating
Year ending December 31, Leases Leases
2019 . . . . . . . . . . . . . . . . . . . . . . . . . . . . . . . . . . . . . . . . . . . . . . . . . . . . . . $ 1,746 $ 15,272
2020 . . . . . . . . . . . . . . . . . . . . . . . . . . . . . . . . . . . . . . . . . . . . . . . . . . . . . . 1,781 14,518
2021 . . . . . . . . . . . . . . . . . . . . . . . . . . . . . . . . . . . . . . . . . . . . . . . . . . . . . . 1,816 12,203
2022 . . . . . . . . . . . . . . . . . . . . . . . . . . . . . . . . . . . . . . . . . . . . . . . . . . . . . . 1,853 10,466
2023 . . . . . . . . . . . . . . . . . . . . . . . . . . . . . . . . . . . . . . . . . . . . . . . . . . . . . . 465 9,890
Thereafter . . . . . . . . . . . . . . . . . . . . . . . . . . . . . . . . . . . . . . . . . . . . . . . . . . — 47,868
Total minimum lease payments . . . . . . . . . . . . . . . . . . . . . . . . . . . . . . . . . . . $ 7,661 $ 110,217
Less: amount representing interest . . . . . . . . . . . . . . . . . . . . . . . . . . . . . . . . . 1,514
Present value of minimum lease payments . . . . . . . . . . . . . . . . . . . . . . . . . . . 6,147
Less: current installments . . . . . . . . . . . . . . . . . . . . . . . . . . . . . . . . . . . . . . . 1,168
Capital lease obligations, less current installments . . . . . . . . . . . . . . . . . . . . . . $ 4,979 The Company enters into contractual commitments to deliver products and services in the ordinary course of business. The Company believes that all such contractual commitments will be performed or renegotiated such that no material adverse financial impact on the Company’s financial position, results of operations or liquidity will result from these commitments. Note 9—Common Stock and Stock-Based Awards Plans On March 6, 2018, the Board of Directors approved an expanded stock repurchase authorization granting the Company authority to repurchase up to $250 million in common stock in addition to the $100 million previously approved on December 7, 2015. On October 26, 2018, the Board of Directors authorized the repurchase of an additional $100 million of the Company’s common stock. As of December 31, 2018, the Company had $201.6 million remaining under the stock repurchase authorization. Share purchases may be made in the open market, in privately negotiated transactions or block transactions, at the discretion of the Company’s management and as market conditions warrant. Purchases will be funded from available cash and may be commenced, suspended or discontinued at any time without prior notice. Shares repurchased under the program are retired. During 2018, the Company repurchased a total of 8.2 million common shares for $211.9 million at an average price of $25.71 per share. During 2017, the Company repurchased a total of 1.0 million common shares for $29.3 million at an average price of $30.46 per share. During 2016, the Company repurchased a total of 2.0 million common shares for $41.9 million at an average price of $21.40 per share. The Company began declaring and paying quarterly dividends during the first quarter of 2018. During 2018, cash dividends paid totaled $21.0 million. On December 17, 2018, the Company declared a quarterly cash dividend of $0.15 per share of the Company’s common stock to shareholders of record as of December 31, 2018. The dividend of $6.2 million was paid on January 11, 2019. The Board of Directors currently intends to continue paying quarterly dividends. However, the Company’s future dividend policy is subject to the Company’s compliance with applicable law, and depending on, among other things, the Company’s results of operations, financial condition, level of
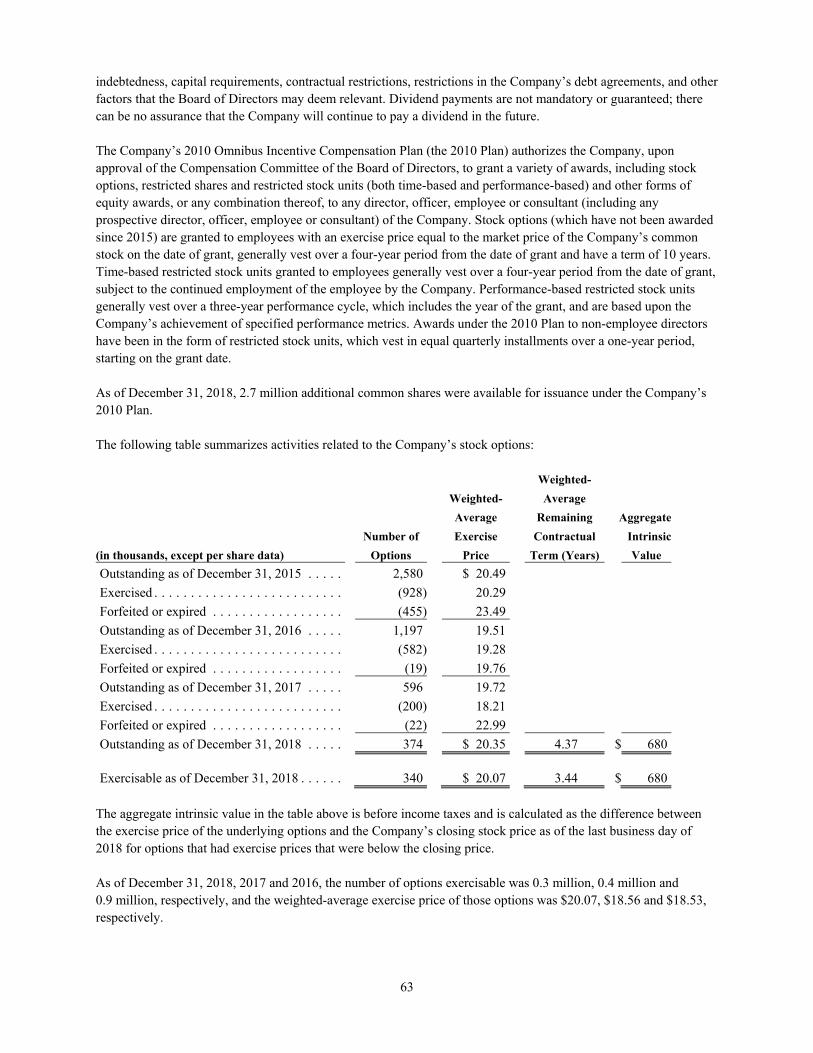
63
indebtedness, capital requirements, contractual restrictions, restrictions in the Company’s debt agreements, and other factors that the Board of Directors may deem relevant. Dividend payments are not mandatory or guaranteed; there can be no assurance that the Company will continue to pay a dividend in the future. The Company’s 2010 Omnibus Incentive Compensation Plan (the 2010 Plan) authorizes the Company, upon approval of the Compensation Committee of the Board of Directors, to grant a variety of awards, including stock options, restricted shares and restricted stock units (both time-based and performance-based) and other forms of equity awards, or any combination thereof, to any director, officer, employee or consultant (including any prospective director, officer, employee or consultant) of the Company. Stock options (which have not been awarded since 2015) are granted to employees with an exercise price equal to the market price of the Company’s common stock on the date of grant, generally vest over a four-year period from the date of grant and have a term of 10 years. Time-based restricted stock units granted to employees generally vest over a four-year period from the date of grant, subject to the continued employment of the employee by the Company. Performance-based restricted stock units generally vest over a three-year performance cycle, which includes the year of the grant, and are based upon the Company’s achievement of specified performance metrics. Awards under the 2010 Plan to non-employee directors have been in the form of restricted stock units, which vest in equal quarterly installments over a one-year period, starting on the grant date. As of December 31, 2018, 2.7 million additional common shares were available for issuance under the Company’s 2010 Plan. The following table summarizes activities related to the Company’s stock options:
Weighted-
Weighted- Average
Average Remaining Aggregate
Number of Exercise Contractual Intrinsic
(in thousands, except per share data) Options Price Term (Years) Value
Outstanding as of December 31, 2015 . . . . . 2,580 $ 20.49
Exercised . . . . . . . . . . . . . . . . . . . . . . . . . . (928) 20.29
Forfeited or expired . . . . . . . . . . . . . . . . . . (455) 23.49
Outstanding as of December 31, 2016 . . . . . 1,197 19.51
Exercised . . . . . . . . . . . . . . . . . . . . . . . . . . (582) 19.28
Forfeited or expired . . . . . . . . . . . . . . . . . . (19) 19.76
Outstanding as of December 31, 2017 . . . . . 596 19.72
Exercised . . . . . . . . . . . . . . . . . . . . . . . . . . (200) 18.21
Forfeited or expired . . . . . . . . . . . . . . . . . . (22) 22.99
Outstanding as of December 31, 2018 . . . . . 374 $ 20.35 4.37 $ 680
Exercisable as of December 31, 2018 . . . . . . 340 $ 20.07 3.44 $ 680 The aggregate intrinsic value in the table above is before income taxes and is calculated as the difference between the exercise price of the underlying options and the Company’s closing stock price as of the last business day of 2018 for options that had exercise prices that were below the closing price. As of December 31, 2018, 2017 and 2016, the number of options exercisable was 0.3 million, 0.4 million and 0.9 million, respectively, and the weighted-average exercise price of those options was $20.07, $18.56 and $18.53, respectively.
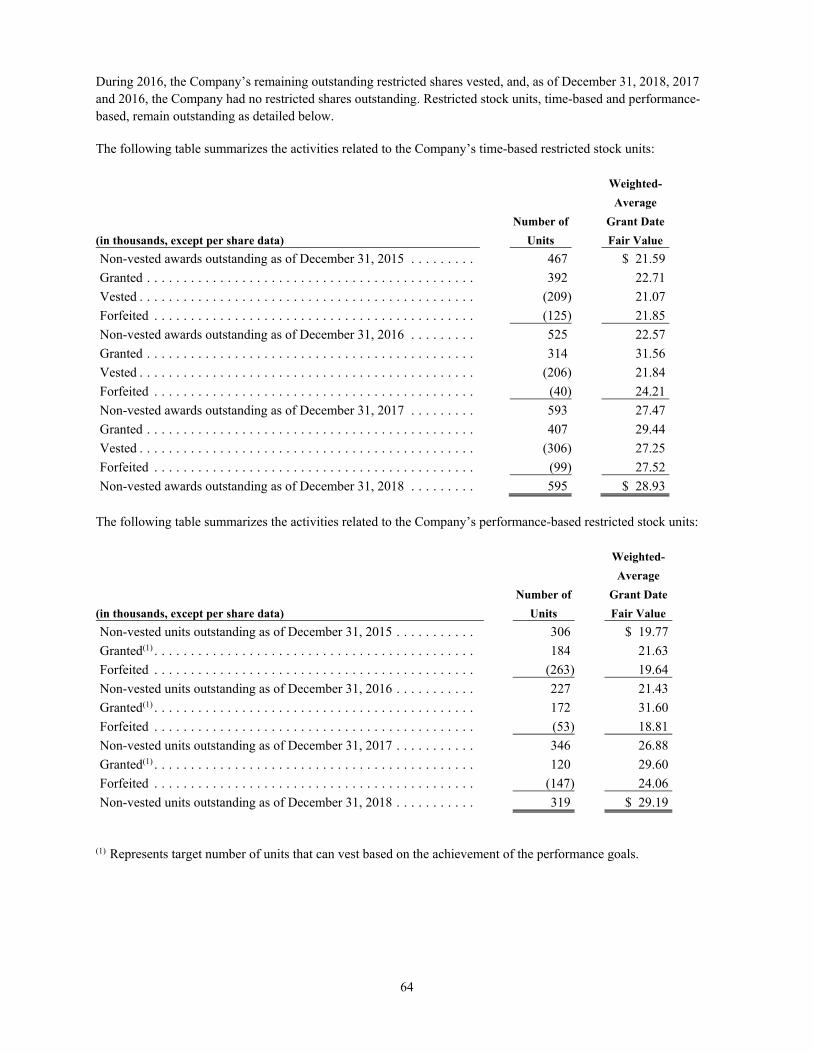
64
During 2016, the Company’s remaining outstanding restricted shares vested, and, as of December 31, 2018, 2017 and 2016, the Company had no restricted shares outstanding. Restricted stock units, time-based and performance-based, remain outstanding as detailed below. The following table summarizes the activities related to the Company’s time-based restricted stock units:
Weighted-
Average
Number of Grant Date
(in thousands, except per share data) Units Fair Value
Non-vested awards outstanding as of December 31, 2015 . . . . . . . . . 467 $ 21.59
Granted . . . . . . . . . . . . . . . . . . . . . . . . . . . . . . . . . . . . . . . . . . . . . 392 22.71
Vested . . . . . . . . . . . . . . . . . . . . . . . . . . . . . . . . . . . . . . . . . . . . . . (209) 21.07
Forfeited . . . . . . . . . . . . . . . . . . . . . . . . . . . . . . . . . . . . . . . . . . . . (125) 21.85
Non-vested awards outstanding as of December 31, 2016 . . . . . . . . . 525 22.57
Granted . . . . . . . . . . . . . . . . . . . . . . . . . . . . . . . . . . . . . . . . . . . . . 314 31.56
Vested . . . . . . . . . . . . . . . . . . . . . . . . . . . . . . . . . . . . . . . . . . . . . . (206) 21.84
Forfeited . . . . . . . . . . . . . . . . . . . . . . . . . . . . . . . . . . . . . . . . . . . . (40) 24.21
Non-vested awards outstanding as of December 31, 2017 . . . . . . . . . 593 27.47
Granted . . . . . . . . . . . . . . . . . . . . . . . . . . . . . . . . . . . . . . . . . . . . . 407 29.44
Vested . . . . . . . . . . . . . . . . . . . . . . . . . . . . . . . . . . . . . . . . . . . . . . (306) 27.25
Forfeited . . . . . . . . . . . . . . . . . . . . . . . . . . . . . . . . . . . . . . . . . . . . (99) 27.52
Non-vested awards outstanding as of December 31, 2018 . . . . . . . . . 595 $ 28.93 The following table summarizes the activities related to the Company’s performance-based restricted stock units:
Weighted-
Average
Number of Grant Date
(in thousands, except per share data) Units Fair Value
Non-vested units outstanding as of December 31, 2015 . . . . . . . . . . . 306 $ 19.77
Granted(1) . . . . . . . . . . . . . . . . . . . . . . . . . . . . . . . . . . . . . . . . . . . . 184 21.63
Forfeited . . . . . . . . . . . . . . . . . . . . . . . . . . . . . . . . . . . . . . . . . . . . (263) 19.64
Non-vested units outstanding as of December 31, 2016 . . . . . . . . . . . 227 21.43
Granted(1) . . . . . . . . . . . . . . . . . . . . . . . . . . . . . . . . . . . . . . . . . . . . 172 31.60
Forfeited . . . . . . . . . . . . . . . . . . . . . . . . . . . . . . . . . . . . . . . . . . . . (53) 18.81
Non-vested units outstanding as of December 31, 2017 . . . . . . . . . . . 346 26.88
Granted(1) . . . . . . . . . . . . . . . . . . . . . . . . . . . . . . . . . . . . . . . . . . . . 120 29.60
Forfeited . . . . . . . . . . . . . . . . . . . . . . . . . . . . . . . . . . . . . . . . . . . . (147) 24.06
Non-vested units outstanding as of December 31, 2018 . . . . . . . . . . . 319 $ 29.19
(1) Represents target number of units that can vest based on the achievement of the performance goals.

65
Note 10—Income Taxes
Income tax expense (benefit) based on income before income taxes consisted of the following:
Year Ended December 31,
(in thousands) 2018 2017 2016
(as adjusted)
Current:
U.S. Federal . . . . . . . . . . . . . . . . . . . . . . . . . . . . . . . . . . . . $ (14,831) $ 85,633 $ (1,032)
State and local . . . . . . . . . . . . . . . . . . . . . . . . . . . . . . . . . . 10,110 804 498
Foreign . . . . . . . . . . . . . . . . . . . . . . . . . . . . . . . . . . . . . . . 29,817 9,047 (2,379)
25,096 95,484 (2,913)
Deferred:
U.S. Federal . . . . . . . . . . . . . . . . . . . . . . . . . . . . . . . . . . . . (249) 8,337 5,261
State and local . . . . . . . . . . . . . . . . . . . . . . . . . . . . . . . . . . (550) (213) 1,196
Foreign . . . . . . . . . . . . . . . . . . . . . . . . . . . . . . . . . . . . . . . 8,427 (702) 1,933
7,628 7,422 8,390
$ 32,724 $ 102,906 $ 5,477
Worldwide income (loss) before income taxes consisted of the following:
Year Ended December 31,
(in thousands) 2018 2017 2016
(as adjusted)
United States . . . . . . . . . . . . . . . . . . . . . . . . . . . . . . . . . . . . . $ (23,645) $ (14,984) $ 9,994
Foreign . . . . . . . . . . . . . . . . . . . . . . . . . . . . . . . . . . . . . . . . . 79,186 85,989 59,416
$ 55,541 $ 71,005 $ 69,410 Income tax expense differed from the amounts computed by applying the U.S. Federal statutory income tax rate to income before income taxes as a result of the following:
Year Ended December 31,
(in thousands) 2018 2017 2016
(as adjusted)
Tax at statutory rate . . . . . . . . . . . . . . . . . . . . . . . . . . . . . . . . $ 11,664 $ 24,852 $ 24,294
State taxes, net of federal tax effect . . . . . . . . . . . . . . . . . . . . . 7,553 384 1,102
Effect of foreign operations and tax incentives . . . . . . . . . . . . . (11,945) (20,703) (15,496)
Change in valuation allowance . . . . . . . . . . . . . . . . . . . . . . . . . 2,114 (203) (1,152)
Excess tax-benefits of stock-based compensation . . . . . . . . . . . (143) (1,658) —
Provisional impact of U.S. Tax Reform . . . . . . . . . . . . . . . . . . (4,353) 97,707 —
Impact of cash repatriation . . . . . . . . . . . . . . . . . . . . . . . . . . . 21,612 — —
GILTI . . . . . . . . . . . . . . . . . . . . . . . . . . . . . . . . . . . . . . . . . . 3,206 — —
Losses in foreign jurisdictions for which no benefit has been provided . . . . . . . . . . . . . . . . . . . . . . . . . . . . . . . . . . . 1,423 106 2,106
Change in uncertain tax benefits reserve . . . . . . . . . . . . . . . . . . (317) — (8,270)
Other . . . . . . . . . . . . . . . . . . . . . . . . . . . . . . . . . . . . . . . . . . . 1,910 2,421 2,893
Total income tax expense . . . . . . . . . . . . . . . . . . . . . . . . . . . . $ 32,724 $ 102,906 $ 5,477 The U.S. Tax Cuts and Jobs Act (U.S. Tax Reform), which was signed into law on December 22, 2017, significantly changed U.S. tax law by, among other things, lowering corporate income tax rates, implementing a territorial tax system, adding a global intangible taxation regime and imposing a transition (Transition Tax) tax on deemed
66
repatriated cumulative earnings of foreign subsidiaries. The U.S. Tax Reform reduced the U.S. corporate income tax rate from a maximum of 35% to a flat 21% rate, effective January 1, 2018. The Company recorded the effects of the changes in the tax rate in our deferred tax assets and liabilities as of December 31, 2017. To minimize tax base erosion with a territorial tax system, the U.S. Tax Reform enacted a new global intangible low-taxed income (GILTI) provision that requires the Company to include in its U.S. income tax return foreign subsidiary earnings in excess of an allowable return on the foreign subsidiaries tangible assets. The taxable earnings can be offset by a limited deemed paid foreign tax credit with no carrybacks or carryforwards available. The Company is subject to the GILTI provisions. The Company elected to account for the GILTI as a period cost and include the effect in the period in which it is incurred and not include it as a factor in the determination of deferred taxes. On December 22, 2017, additional guidance was issued on accounting for the tax effects of the U.S. Tax Reform (Staff Accounting Bulletin No. 118 (SAB 118)). SAB 118 provided a measurement period that should not extend beyond one year from the U.S. Tax Reform enactment date for companies to complete their accounting. The Company recorded a provisional tax expense of $101.6 million for the Transition Tax, and recognized a provisional deferred tax benefit of $3.9 million for a total net expense of $97.7 million as of December 31, 2017. As of December 31, 2018, the Company has completed the accounting for the tax effects of U.S. Tax Reform within the period required from the enactment date. The Company recognized during the fourth quarter of 2018 after filing its U.S. income tax return, a discrete tax benefit adjustment of $6.4 million for the Transition Tax, and recorded a discrete tax expense adjustment of $2.0 million for the finalization of the deferred tax assets and liabilities for a net total adjustment of $4.4 million. These adjustments were based on additional analysis of undistributed cumulative foreign earnings, cumulative foreign taxes, changes in interpretations, and additional regulatory guidance that was issued during 2018 by the Internal Revenue Service (IRS). As a result of the completed accounting for the Transition Tax, the Company determined that its total Transition Tax liability is currently $63.8 million after reduction for U.S. tax carryforward losses, U.S. tax credit carryforwards, and foreign tax credit carrybacks that are allowed to be utilized against the total liability. The Company intends to pay this liability over the remaining seven year payment period as prescribed by the U.S. Tax Reform and regulatory guidance issued by the IRS. $58.4 million of the Transition Tax liability is included in other long term liabilities. During 2018, the Company repatriated $560.6 million of foreign earnings to the U.S. As of December 31, 2018, the Company has approximately $330 million in cumulative undistributed foreign earnings of its foreign subsidiaries. These earnings would not be subject to U.S. income tax, if distributed to the Company. The Company has changed its assertion on its foreign subsidiaries earnings that are permanently reinvested. A certain amount of earnings from specific foreign subsidiaries are permanently reinvested, and certain foreign earnings from other specific foreign subsidiaries is considered to be non-permanently reinvested and is available for immediate distribution to the Company. Income taxes have been accrued on the non-permanently reinvested foreign earnings including the 2017 Transition Tax, the U.S. tax on Global Intangible Low Taxed Income (GILTI), and any applicable local withholding taxes. The Company estimates that it has approximately $2.3 million of unrecognized deferred tax liability related to any remaining undistributed foreign earnings that have not already been subject to the 2017 Transition Tax, the U.S. tax on GILTI, and any applicable foreign income tax or local withholding taxes on cash distributions. As a result of this change in assertion for undistributed earnings prior to December 31, 2017, the Company recorded a net tax expense of $21.6 million consisting of tax expense of $30.8 million relating to foreign withholding tax from Asia and a net benefit of $9.2 million for U.S. foreign tax credits to offset the foreign taxes paid during 2018. In addition, the Company recorded applicable U.S. state income tax expense net of federal benefits related to the cash repatriation. Also during 2018, the Company incurred a net $4.4 million benefit associated with finalizing the provisional impact of the U.S. Tax Reform described above as required by SAB 118, and incurred a $3.2 million tax expense as a result of GILTI.

67
The tax effects of temporary differences that give rise to significant portions of the deferred tax assets and deferred tax liabilities are presented below:
December 31,
(in thousands) 2018 2017
(as adjusted)
Deferred tax assets:
Carrying value of inventories . . . . . . . . . . . . . . . . . . . . . . . . . . . . . . . . . . . $ 2,787 $ 2,474
Accrued liabilities and allowances deductible for tax purposes on a cash basis 6,108 6,387
Goodwill . . . . . . . . . . . . . . . . . . . . . . . . . . . . . . . . . . . . . . . . . . . . . . . . . 2,351 2,732
Stock-based compensation . . . . . . . . . . . . . . . . . . . . . . . . . . . . . . . . . . . . . 2,347 2,359
Net operating loss carryforwards . . . . . . . . . . . . . . . . . . . . . . . . . . . . . . . . 20,028 22,096
Tax credit carryforwards . . . . . . . . . . . . . . . . . . . . . . . . . . . . . . . . . . . . . . 1,923 2,007
Other . . . . . . . . . . . . . . . . . . . . . . . . . . . . . . . . . . . . . . . . . . . . . . . . . . . . 4,373 5,924
39,917 43,979
Less: valuation allowance . . . . . . . . . . . . . . . . . . . . . . . . . . . . . . . . . . . . . (13,709) (15,823)
Net deferred tax assets . . . . . . . . . . . . . . . . . . . . . . . . . . . . . . . . . . . . . . . . 26,208 28,156
Deferred tax liabilities:
Plant and equipment, due to differences in depreciation . . . . . . . . . . . . . . . . (7,617) (8,543)
Intangible assets, due to differences in amortization . . . . . . . . . . . . . . . . . . . (18,593) (20,891)
ASC 606 revenue recognition . . . . . . . . . . . . . . . . . . . . . . . . . . . . . . . . . . (1,640) (1,667)
Foreign withholding tax. . . . . . . . . . . . . . . . . . . . . . . . . . . . . . . . . . . . . . . (9,212) -
Other . . . . . . . . . . . . . . . . . . . . . . . . . . . . . . . . . . . . . . . . . . . . . . . . . . . . (991) (1,715)
Gross deferred tax liability . . . . . . . . . . . . . . . . . . . . . . . . . . . . . . . . . . . . . (38,053) (32,816)
Net deferred tax liability . . . . . . . . . . . . . . . . . . . . . . . . . . . . . . . . . . . . . . $ (11,845) $ (4,660)
The net deferred tax liability is classified as follows:
Long-term asset . . . . . . . . . . . . . . . . . . . . . . . . . . . . . . . . . . . . . . . . . . . . $ 2,478 $ 4,034
Long-term liability . . . . . . . . . . . . . . . . . . . . . . . . . . . . . . . . . . . . . . . . . . (14,323) (8,694)
Total . . . . . . . . . . . . . . . . . . . . . . . . . . . . . . . . . . . . . . . . . . . . . . . . . . . . $ (11,845) $ (4,660)
All deferred taxes are classified as non-current on the balance sheet as of December 31, 2018 and 2017. All deferred tax assets and liabilities are offset and presented as a single net noncurrent amount by each tax jurisdiction.
The net change in the total valuation allowance for 2018, 2017 and 2016 was a $2.1 million decrease, a $0.2 million decrease and a $1.2 million decrease, respectively. In assessing the realizability of deferred tax assets, management considers whether it is more likely than not that some portion or all of the deferred tax assets will not be realized. The ultimate realization of deferred tax assets is dependent upon the generation of future taxable income during the periods in which those temporary differences become deductible. Management considers the scheduled reversal of deferred tax liabilities, projected future taxable income and tax planning strategies in making this assessment. Based upon the level of historical taxable income and projections for future taxable income over the periods which the deferred tax assets are deductible, management believes it is more likely than not the Company will realize the benefits of these deductible differences, net of the existing valuation allowances as of December 31, 2018. As of December 31, 2018, the Company had $24.4 million in U.S. Federal operating loss carryforwards which will expire from 2025 to 2036; state operating loss carryforwards of approximately $67.0 million which will expire from 2019 to 2031; foreign operating loss carryforwards of approximately $24.8 million with indefinite carryforward periods; and foreign operating loss carryforwards of approximately $20.5 million which will expire at varying dates

68
through 2028. The utilization of these net operating loss carryforwards is limited to the future operations of the Company in the tax jurisdictions in which such carryforwards arose. The Company has state tax credit carryforwards of $1.9 million which will expire at varying dates through 2036. The Company has been granted certain tax incentives, including tax holidays, for its subsidiaries in China, Malaysia and Thailand that will expire at various dates, unless extended or otherwise renegotiated, through 2018 in China, 2021 in Malaysia and 2028 in Thailand, and are subject to certain conditions with which the Company expects to comply. The net impact of these tax incentives was to lower income tax expense for 2018, 2017, and 2016 by approximately $7.9 million (approximately $0.17 per diluted share), $7.2 million (approximately $0.15 per diluted share) and $6.7 million (approximately $0.13 per diluted share), respectively, as follows:
Year Ended December 31,
(in thousands) 2018 2017 2016
China . . . . . . . . . . . . . . . . . . . . . . . . . . . . . . . . . . . . . . . . . . . $ 1,884 $ 1,398 $ 1,302
Malaysia . . . . . . . . . . . . . . . . . . . . . . . . . . . . . . . . . . . . . . . . 3,287 4,295 2,346
Thailand . . . . . . . . . . . . . . . . . . . . . . . . . . . . . . . . . . . . . . . . 2,715 1,545 3,068
$ 7,886 $ 7,238 $ 6,716
The Company must determine whether it is “more-likely-than-not” that a tax position will be sustained upon examination, including resolution of any related appeals or litigation processes, based on the technical merits of the position. Once it is determined that a position meets the more-likely-than-not recognition threshold, the position is measured to determine the amount of benefit to recognize in the financial statements. As of December 31, 2018, the total amount of the reserve for uncertain tax benefits including interest and penalties was $0.4 million. A reconciliation of the beginning and ending amount of unrecognized tax benefits, excluding interest and penalties, is as follows:
December 31,
(in thousands) 2018 2017 2016
Balance as of January 1 . . . . . . . . . . . . . . . . . . . . . . . . . . . . . . $ 708 $ 7,791 $ 13,114
Additions related to current year tax positions . . . . . . . . . . . . . . 137 220 —
Decreases as a result of a lapse of applicable statute of limitations in current year . . . . . . . . . . . . . . . . . . . . . . . . . . — — (5,079)
Additions related to prior year tax positions . . . . . . . . . . . . . . . — 894 89
Decreases related to prior year tax positions . . . . . . . . . . . . . . . (532) (8,197) (333)
Balance as of December 31 . . . . . . . . . . . . . . . . . . . . . . . . . . . $ 313 $ 708 $ 7,791
During 2018, the Company released $0.5 million of uncertain tax benefits from an IRS audit related to the Secure Communication Systems, Inc. acquisition. During the first quarter of 2018, the IRS indicated that this examination of years 2013 to 2015 was closed. In addition, the IRS also notified the Company that the examination of the Company’s consolidated U.S. income tax return filings for 2014 was also closed with no additional tax costs. During 2017, the Company released $0.9 million of uncertain tax benefits related to the liquidation of a foreign subsidiary company. Also during 2017, the Company received a denial of its appeal to the local tax authorities related to an examination for a subsidiary in Thailand for the years 2004 to 2005. Consequently, the Company recorded $0.9 million of additional accruals for uncertain tax benefits. The Company decided not to challenge this decision and therefore, the $7.3 million reserve for uncertain tax benefits was written off. This decrease in the unrecognized tax benefit reserve did not impact the Company’s effective tax rate. The decrease in the reserve during 2016 of $5.1 million was a result of the expiration of the statute of limitations for a foreign subsidiary that was liquidated in 2011 and closed its operations in 2005.
69
The reserve is classified as a current or long-term liability in the consolidated balance sheet based on the Company’s expectation of when the items will be settled. The Company records interest expense and penalties accrued in relation to uncertain income tax benefits as a component of current income tax expense. The amount of accrued potential interest on unrecognized tax benefits included in the reserve as of December 31, 2018 is $0.1 million. The reserve for potential penalties is $17.0 thousand. The total amount of interest and penalties included in income tax expense was $0.1 million during 2018. The Company did not incur any interest and penalties in 2017 or 2016. The Company and its subsidiaries in Brazil, China, Ireland, Malaysia, Mexico, the Netherlands, Romania, Singapore, Thailand and the United States remain open to examination by the various local taxing authorities, in total or in part, for fiscal years 2011 to 2018. Currently, the Company does not have any ongoing income tax examinations by any jurisdiction. During the course of such income tax examinations, disputes may occur as to matters of fact or law. Also, in most tax jurisdictions, the passage of time without examination will result in the expiration of applicable statutes of limitations thereby precluding examination of the tax period(s) for which such statute of limitation has expired. The Company believes that it has adequately provided for its tax liabilities. Note 11—Major Customers The Company’s customers operate in industries that are, to a varying extent, subject to rapid technological change, vigorous competition and short product life cycles. Developments adverse to the electronics industry, the Company’s customers or their products could impact the Company’s overall credit risk. The Company extends credit based on evaluation of its customers’ financial condition and generally does not require collateral or other security from its customers and would incur a loss equal to the carrying value of the accounts receivable if its customer failed to perform according to the terms of the credit arrangement. Sales to the ten largest customers represented 44%, 46% and 43% of total sales for 2018, 2017 and 2016, respectively. Sales to our largest customers were as follows for the indicated periods:
Year ended December 31,
(in thousands) 2018 2017 2016
International Business Machines Corporation . . . . . . . . . . . . . . $ 323,795 $ 284,636 $ *
Applied Materials, Inc. . . . . . . . . . . . . . . . . . . . . . . . . . . . . . $ * $ 248,183 $ * * amount is less than 10% of total.
Note 12—Financial Instruments and Concentration of Credit Risk The Company’s financial instruments include cash equivalents, accounts and other receivables, accounts payable, accrued liabilities and long-term debt and capital lease obligations. The Company believes that the carrying values of these instruments approximate fair value. As of December 31, 2018, the Company’s long-term investments and derivative instruments were recorded at fair value using Level 3 inputs. The Company uses derivative instruments to manage the variability of foreign currency obligations and interest rates. The Company does not enter into derivative arrangements for speculative purposes. The forward currency exchange contract in place as of December 31, 2018 has not been designated as accounting hedges and, therefore, changes in fair value are recorded within the Consolidated Statements of Income. The Company has an interest rate swap agreement with a notional amount of $150.0 million as of December 31, 2018 to hedge a portion of its interest rate exposure on outstanding borrowings under the Credit Agreement. Under this interest rate swap agreement, the Company receives variable rate interest rate payments based on the one-month LIBOR rate and pays fixed rate interest payments. The fixed interest rate for the contract is 2.928%. The effect of
70
this swap is to convert a portion of the floating rate interest expense to fixed interest rate expense. Based on the terms of the interest rate swap contract and the underlying borrowings outstanding under the Credit Agreement, the interest rate contract was determined to be highly effective, and thus qualifies and has been designated as a cash flow hedge. As such, changes in the fair value of the interest rate swap are recorded in other comprehensive income on the accompanying Condensed Consolidated Balance Sheets until earnings are affected by the variability of cash flows. As of December 31, 2017, the Company had an interest rate swap agreement with a notional amount of $155.3 million with a fixed interest rate of 1.4935%. During 2018, the Company terminated this agreement for $3.5 million and the gain is being amortized to offset interest expense over the original term of the swap agreement. The fair value of the interest rate swap agreements was a $3.0 million liability as of December 31, 2018 and a $2.0 million asset as of December 31, 2017. During the year ended December 31, 2018, the Company recorded unrealized losses of $1.5 million ($1.1 million net of tax) on the swaps in other comprehensive income and transferred unrealized gains of $0.3 million ($0.2 million net of tax) on the swaps to interest expense. During the year ended December 31, 2017, the Company recorded unrealized gains of $1.5 million ($0.9 million net of tax) on the swap in other comprehensive income. See Note 21. Financial instruments that subject the Company to credit risk consist of cash and cash equivalents, investments and trade accounts receivable. Management maintains the majority of the Company’s cash and cash equivalents with financial institutions. One of the most significant credit risks is the ultimate realization of accounts receivable. This risk is mitigated by (i) sales to well established companies, (ii) ongoing credit evaluation of customers, and (iii) frequent contact with customers, thus enabling management to monitor current changes in business operations and to respond accordingly. Management considers these concentrations of credit risks in establishing our allowance for doubtful accounts and believes these allowances are adequate. The Company had one customer whose gross accounts receivable exceeded 10% of total gross accounts receivable as of December 31, 2018. Our largest customer represented 19% of our total gross accounts receivable. Note 13—Concentrations of Business Risk Substantially all of the Company’s sales are derived from manufacturing services in which the Company purchases components specified by its customers. The Company uses numerous suppliers of electronic components and other materials for its operations. Some components used by the Company have been subject to industry-wide shortages, and suppliers have been forced to allocate available quantities among their customers. The Company’s inability to obtain any needed components during periods of allocation could cause delays in manufacturing and could adversely affect results of operations. Note 14—Accounts Receivable Sale Program As of December 31, 2018, in connection with a trade accounts receivable sale program with an unaffiliated financial institution, the Company may elect to sell, at a discount, on an ongoing basis, up to a maximum of $80.0 million of specific accounts receivable at any one time. During the years ended December 31, 2018 and 2017, the Company sold $160.0 million and $145.0 million, respectively, of accounts receivable under this program, and in exchange, the Company received cash proceeds of $159.5 million and $144.7 million, respectively, net of the discount. The loss on the sale resulting from the discount was recorded to other expense within the Consolidated Statements of Income.
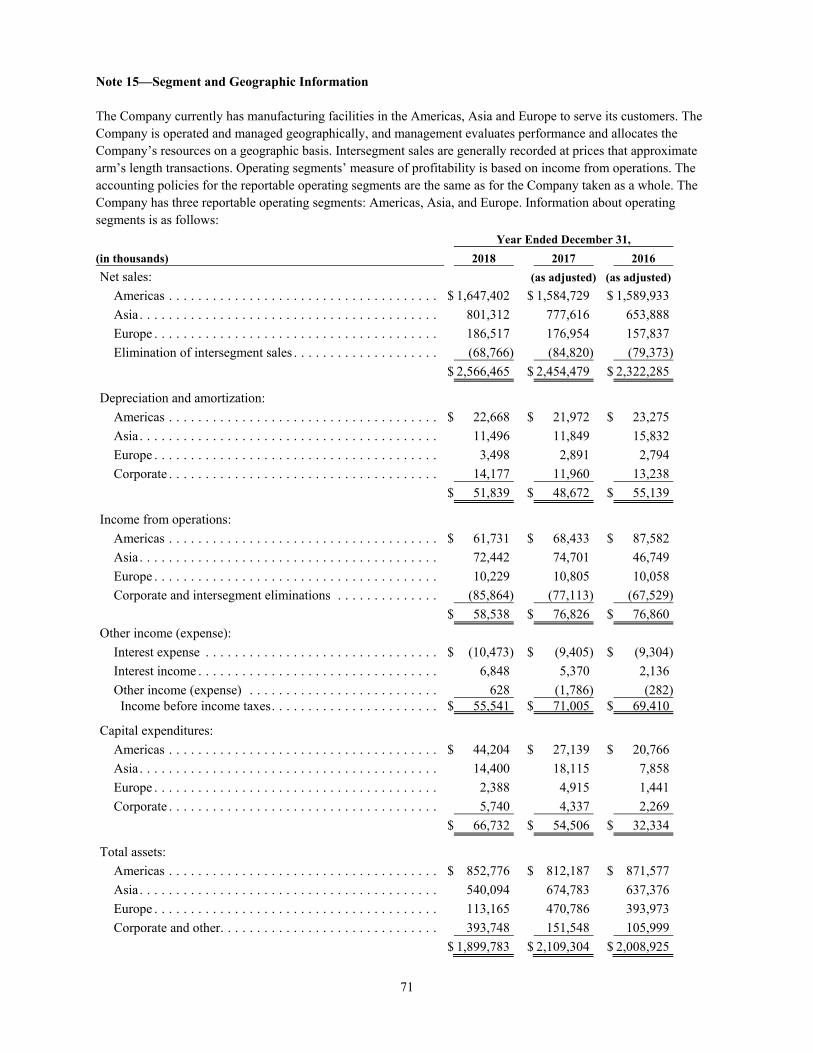
71
Note 15—Segment and Geographic Information The Company currently has manufacturing facilities in the Americas, Asia and Europe to serve its customers. The Company is operated and managed geographically, and management evaluates performance and allocates the Company’s resources on a geographic basis. Intersegment sales are generally recorded at prices that approximate arm’s length transactions. Operating segments’ measure of profitability is based on income from operations. The accounting policies for the reportable operating segments are the same as for the Company taken as a whole. The Company has three reportable operating segments: Americas, Asia, and Europe. Information about operating segments is as follows:
Year Ended December 31,
(in thousands) 2018 2017 2016
Net sales: (as adjusted) (as adjusted)
Americas . . . . . . . . . . . . . . . . . . . . . . . . . . . . . . . . . . . . . $ 1,647,402 $ 1,584,729 $ 1,589,933
Asia . . . . . . . . . . . . . . . . . . . . . . . . . . . . . . . . . . . . . . . . . 801,312 777,616 653,888
Europe . . . . . . . . . . . . . . . . . . . . . . . . . . . . . . . . . . . . . . . 186,517 176,954 157,837
Elimination of intersegment sales . . . . . . . . . . . . . . . . . . . . (68,766) (84,820) (79,373)
$ 2,566,465 $ 2,454,479 $ 2,322,285
Depreciation and amortization:
Americas . . . . . . . . . . . . . . . . . . . . . . . . . . . . . . . . . . . . . $ 22,668 $ 21,972 $ 23,275
Asia . . . . . . . . . . . . . . . . . . . . . . . . . . . . . . . . . . . . . . . . . 11,496 11,849 15,832
Europe . . . . . . . . . . . . . . . . . . . . . . . . . . . . . . . . . . . . . . . 3,498 2,891 2,794
Corporate . . . . . . . . . . . . . . . . . . . . . . . . . . . . . . . . . . . . . 14,177 11,960 13,238
$ 51,839 $ 48,672 $ 55,139
Income from operations:
Americas . . . . . . . . . . . . . . . . . . . . . . . . . . . . . . . . . . . . . $ 61,731 $ 68,433 $ 87,582
Asia . . . . . . . . . . . . . . . . . . . . . . . . . . . . . . . . . . . . . . . . . 72,442 74,701 46,749
Europe . . . . . . . . . . . . . . . . . . . . . . . . . . . . . . . . . . . . . . . 10,229 10,805 10,058
Corporate and intersegment eliminations . . . . . . . . . . . . . . (85,864) (77,113) (67,529)
$ 58,538 $ 76,826 $ 76,860
Other income (expense):
Interest expense . . . . . . . . . . . . . . . . . . . . . . . . . . . . . . . . $ (10,473) $ (9,405) $ (9,304)
Interest income . . . . . . . . . . . . . . . . . . . . . . . . . . . . . . . . . 6,848 5,370 2,136
Other income (expense) . . . . . . . . . . . . . . . . . . . . . . . . . . 628 (1,786) (282) Income before income taxes . . . . . . . . . . . . . . . . . . . . . . . $ 55,541 $ 71,005 $ 69,410
Capital expenditures:
Americas . . . . . . . . . . . . . . . . . . . . . . . . . . . . . . . . . . . . . $ 44,204 $ 27,139 $ 20,766
Asia . . . . . . . . . . . . . . . . . . . . . . . . . . . . . . . . . . . . . . . . . 14,400 18,115 7,858
Europe . . . . . . . . . . . . . . . . . . . . . . . . . . . . . . . . . . . . . . . 2,388 4,915 1,441
Corporate . . . . . . . . . . . . . . . . . . . . . . . . . . . . . . . . . . . . . 5,740 4,337 2,269
$ 66,732 $ 54,506 $ 32,334
Total assets:
Americas . . . . . . . . . . . . . . . . . . . . . . . . . . . . . . . . . . . . . $ 852,776 $ 812,187 $ 871,577
Asia . . . . . . . . . . . . . . . . . . . . . . . . . . . . . . . . . . . . . . . . . 540,094 674,783 637,376
Europe . . . . . . . . . . . . . . . . . . . . . . . . . . . . . . . . . . . . . . . 113,165 470,786 393,973
Corporate and other . . . . . . . . . . . . . . . . . . . . . . . . . . . . . . 393,748 151,548 105,999
$ 1,899,783 $ 2,109,304 $ 2,008,925

72
Geographic net sales information provided below reflects the destination of the product shipped. Long-lived assets information is based on the physical location of the asset.
Year Ended December 31,
(in thousands) 2018 2017 2016
Geographic net sales: (as adjusted) (as adjusted)
United States . . . . . . . . . . . . . . . . . . . . . . . . . . . . . . . . . $ 1,741,321 $ 1,650,791 $ 1,624,050
Asia . . . . . . . . . . . . . . . . . . . . . . . . . . . . . . . . . . . . . . . . 423,245 432,530 336,022
Europe . . . . . . . . . . . . . . . . . . . . . . . . . . . . . . . . . . . . . . 299,676 291,006 254,272
Other . . . . . . . . . . . . . . . . . . . . . . . . . . . . . . . . . . . . . . . 102,223 80,152 107,941
$ 2,566,465 $ 2,454,479 $ 2,322,285
Long-lived assets:
United States . . . . . . . . . . . . . . . . . . . . . . . . . . . . . . . . . $ 190,056 $ 167,858 $ 167,367
Asia . . . . . . . . . . . . . . . . . . . . . . . . . . . . . . . . . . . . . . . . 79,051 77,750 67,998
Europe . . . . . . . . . . . . . . . . . . . . . . . . . . . . . . . . . . . . . . 9,537 11,042 8,415
Other . . . . . . . . . . . . . . . . . . . . . . . . . . . . . . . . . . . . . . . 22,945 25,830 24,290
$ 301,589 $ 282,480 $ 268,070 Note 16 – Revenue The Company’s revenues are generated primarily from the sale of manufactured products built to customer specifications. The Company also generates revenue from design, development and engineering services, in addition to the sale of other inventory. Revenue is measured based on the consideration specified in a contract with a customer. The Company recognizes revenue when it satisfies a performance obligation by transferring control over a manufactured product to a customer. The Company’s contracts with customers are generally short-term in nature. Customers are generally billed when the product is shipped or as services are performed. Under the majority of the Company’s manufacturing contracts with customers, the customer controls all of the work-in-progress as products are being built. Revenues under these contracts are recognized progressively based on the cost-to-cost method. For other manufacturing contracts, the customer does not take control of the product until it is completed. Under these contracts, the Company recognizes revenue upon transfer of control of the product to the customer. Revenue from design, development and engineering services is recognized over time as the services are performed. The Company assumes no significant obligations after shipment as it typically warrants workmanship only. Therefore, the warranty provisions are generally not significant. If the Company records revenue, but does not issue an invoice, a contract asset is recognized. The contract asset is transferred to accounts receivable when the entitlement to payment becomes unconditional. Taxes assessed by governmental authorities that are both imposed on and concurrent with a specific revenue-producing transaction, that are collected by the Company from a customer, are excluded from revenue. Shipping and handling costs associated with outbound freight after control over a product has transferred to a customer are accounted for as fulfillment costs and are included in cost of sales.

73
Disaggregation of revenue In the following tables, revenue is disaggregated by market sector. The tables also include a reconciliation of the disaggregated revenue with the reportable operating segments. Reportable Operating Segments
Year Ended December 31, 2018
(in thousands) Americas Asia Europe Total
Market Sector:
Industrials . . . . . . . . . . . . . . . . . . . . . . . . . . $ 184,500 $ 241,765 $ 66,798 $ 493,063
A&D . . . . . . . . . . . . . . . . . . . . . . . . . . . . . . 374,852 — 31,550 406,402
Medical . . . . . . . . . . . . . . . . . . . . . . . . . . . . 235,287 144,528 14,152 393,967
Test and instrumentation . . . . . . . . . . . . . . . . 155,687 135,299 63,992 354,978
Computing . . . . . . . . . . . . . . . . . . . . . . . . . . 504,391 69,657 6,797 580,845
Telecommunications . . . . . . . . . . . . . . . . . . . 162,813 171,520 2,877 337,210
External revenue . . . . . . . . . . . . . . . . . . . . 1,617,530 762,769 186,166 2,566,465
Elimination of intersegment sales . . . . . . . . . . 29,872 38,543 351 68,766
Segment revenue . . . . . . . . . . . . . . . . . . . . $ 1,647,402 $ 801,312 $ 186,517 $ 2,635,231
Year Ended December 31, 2017 (as adjusted)
Americas Asia Europe Total
Market Sector:
Industrials . . . . . . . . . . . . . . . . . . . . . . . . . . $ 213,699 $ 213,504 $ 69,233 $ 496,436
A&D . . . . . . . . . . . . . . . . . . . . . . . . . . . . . . 361,200 2,430 28,060 391,690
Medical . . . . . . . . . . . . . . . . . . . . . . . . . . . . 204,677 149,650 19,458 373,785
Test and instrumentation . . . . . . . . . . . . . . . . 158,151 140,967 47,223 346,341
Computing . . . . . . . . . . . . . . . . . . . . . . . . . . 444,401 85,988 9,971 540,360
Telecommunications . . . . . . . . . . . . . . . . . . . 172,122 130,954 2,791 305,867
External revenue . . . . . . . . . . . . . . . . . . . . 1,554,250 723,493 176,736 2,454,479
Elimination of intersegment sales . . . . . . . . . . 30,479 54,123 218 84,820
Segment revenue . . . . . . . . . . . . . . . . . . . . $ 1,584,729 $ 777,616 $ 176,954 $ 2,539,299
Year Ended December 31, 2016 (as adjusted)
(in thousands) Americas Asia Europe Total
Market Sector:
Industrials . . . . . . . . . . . . . . . . . . . . . . . . . . $ 307,261 $ 176,184 $ 60,358 $ 543,803
A&D . . . . . . . . . . . . . . . . . . . . . . . . . . . . . . 333,383 1,113 35,178 369,674
Medical . . . . . . . . . . . . . . . . . . . . . . . . . . . . 190,167 136,398 19,409 345,974
Test and instrumentation . . . . . . . . . . . . . . . . 125,680 90,708 27,019 243,407
Computing . . . . . . . . . . . . . . . . . . . . . . . . . . 369,719 66,695 10,768 447,182
Telecommunications . . . . . . . . . . . . . . . . . . . 239,779 129,061 3,405 372,245
External revenue . . . . . . . . . . . . . . . . . . . . 1,565,989 600,159 156,137 2,322,285
Elimination of intersegment sales . . . . . . . . . . 23,944 53,729 1,700 79,373
Segment revenue . . . . . . . . . . . . . . . . . . . . $ 1,589,933 $ 653,888 $ 157,837 $ 2,401,658 During 2018, 2017 and 2016, 93.0%, 93.4% and 92.7%, respectively, of the Company’s revenue was recognized as products and services are transferred over time.
74
Note 17—Employee Benefit Plans The Company has defined contribution plans qualified under Section 401(k) of the Internal Revenue Code for the benefit of all its U.S. employees. The Company’s contributions to the plans are based on employee contributions and compensation. During 2018, 2017 and 2016, the Company made contributions to the plans of approximately $5.6 million, $5.2 million and $5.2 million, respectively. The Company also has defined contribution benefit plans for certain of its international employees primarily dictated by the custom of the regions in which it operates. During 2018, 2017 and 2016, the Company made contributions to the international plans of approximately $0.1 million, $0.1 million and $0.1 million, respectively. Note 18—Contingencies The Company is involved in various legal actions arising in the ordinary course of business. Other than designated below, in the opinion of management, the ultimate disposition of these matters will not have a material adverse effect on the Company’s consolidated financial position or results of operations. In the case of Nick Myers vs. Benchmark Electronics, Inc. AAA Case No. 01-17-0005-7313, the claimant asserted various breach of contract and misrepresentation claims in connection with the former employee’s compensation package and claims under the Maryland Wage Payment and Collection Law, seeking recovery of allegedly unpaid bonuses. The assigned arbitrator rendered a decision on July 9, 2018, finding in favor of claimant on the issue of liability. A separate damages hearing was held in October 2018 and, on January 3, 2019, the arbitrator awarded $1.4 million to the claimant. On January 25, 2019, the Company filed an action in the United States District Court for the District of Maryland seeking to vacate the final arbitration award. During the fourth quarter of 2018, the Company reserved the full amount of this claim. Note 19—Restructuring Charges The Company has undertaken initiatives to restructure its business operations to improve utilization and realize cost savings. These initiatives have included changing the number and location of production facilities, largely to align capacity and infrastructure with current and anticipated customer demand. This alignment includes transferring programs from higher cost geographies to lower cost geographies. The process of restructuring entails moving production between facilities, reducing staff levels, realigning our business processes, reorganizing our management and other activities. The Company recognized restructuring charges during 2018, 2017 and 2016 primarily related to the closure of facilities in the Americas, capacity reduction and reductions in workforce in certain facilities across various regions.
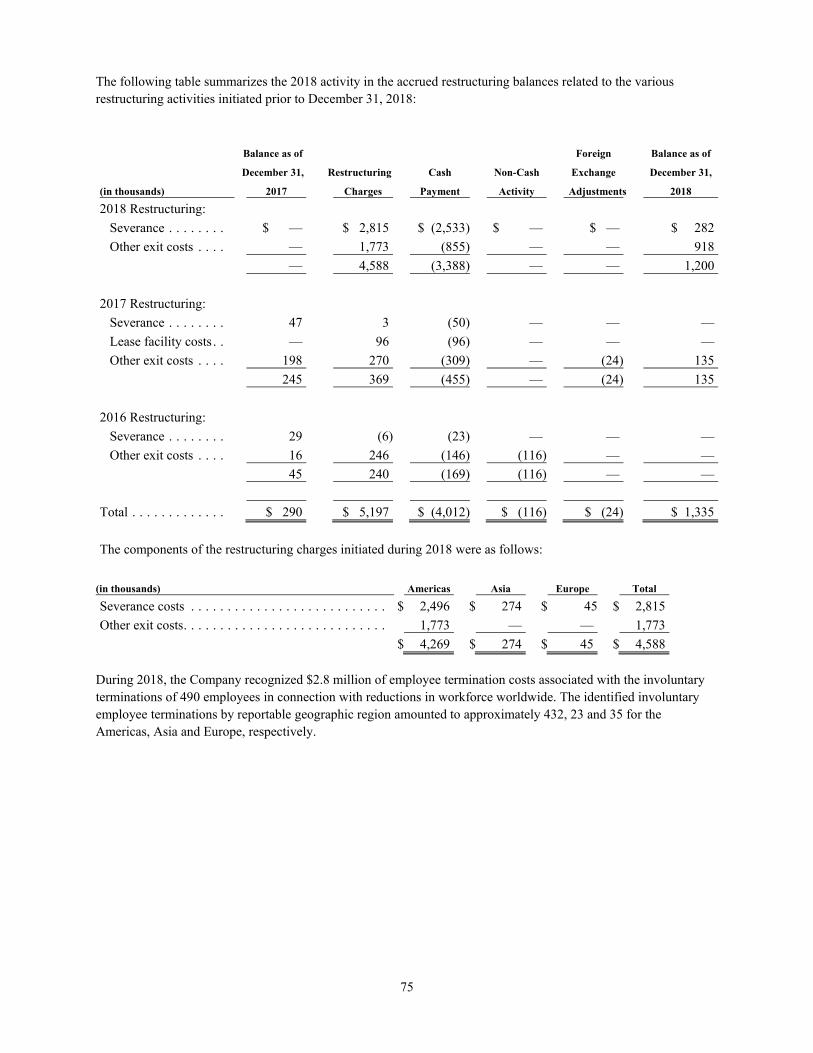
75
The following table summarizes the 2018 activity in the accrued restructuring balances related to the various restructuring activities initiated prior to December 31, 2018:
Balance as of Foreign Balance as of
December 31, Restructuring Cash Non-Cash Exchange December 31,
(in thousands) 2017 Charges Payment Activity Adjustments 2018
2018 Restructuring:
Severance . . . . . . . . $ — $ 2,815 $ (2,533) $ — $ — $ 282
Other exit costs . . . . — 1,773 (855) — — 918
— 4,588 (3,388) — — 1,200
2017 Restructuring:
Severance . . . . . . . . 47 3 (50) — — —
Lease facility costs . . — 96 (96) — — —
Other exit costs . . . . 198 270 (309) — (24) 135
245 369 (455) — (24) 135
2016 Restructuring:
Severance . . . . . . . . 29 (6) (23) — — —
Other exit costs . . . . 16 246 (146) (116) — —
45 240 (169) (116) — —
Total . . . . . . . . . . . . . $ 290 $ 5,197 $ (4,012) $ (116) $ (24) $ 1,335
The components of the restructuring charges initiated during 2018 were as follows:
(in thousands) Americas Asia Europe Total
Severance costs . . . . . . . . . . . . . . . . . . . . . . . . . . . $ 2,496 $ 274 $ 45 $ 2,815
Other exit costs . . . . . . . . . . . . . . . . . . . . . . . . . . . . 1,773 — — 1,773
$ 4,269 $ 274 $ 45 $ 4,588 During 2018, the Company recognized $2.8 million of employee termination costs associated with the involuntary terminations of 490 employees in connection with reductions in workforce worldwide. The identified involuntary employee terminations by reportable geographic region amounted to approximately 432, 23 and 35 for the Americas, Asia and Europe, respectively.

76
The following table summarizes the 2017 activity in the accrued restructuring balances related to the various restructuring activities initiated prior to December 31, 2017:
Balance as of Foreign Balance as of
December 31, Restructuring Cash Non-Cash Exchange December 31,
(in thousands) 2016 Charges Payment Activity Adjustments 2017
2017 Restructuring:
Severance . . . . . . . . . $ — $ 2,172 $ (2,125) $ — $ — $ 47
Lease facility costs . . — 264 (264) — — —
Other exit costs . . . . . — 531 (335) — 2 198
— 2,967 (2,724) — 2 245
2016 Restructuring:
Severance . . . . . . . . . 738 (42) (667) — — 29
Lease facility costs . . — 58 (58) — — —
Other exit costs . . . . . 545 1,953 (2,442) (42) 2 16
1,283 1,969 (3,167) (42) 2 45
Total . . . . . . . . . . . . . . $ 1,283 $ 4,936 $ (5,891) $ (42) $ 4 $ 290
The components of the restructuring charges initiated during 2017 were as follows:
(in thousands) Americas Asia Total
Severance costs . . . . . . . . . . . . . . . . . . . . . . . . . . . $ 1,985 $ 187 $ 2,172
Lease facility costs . . . . . . . . . . . . . . . . . . . . . . . . . 264 — 264
Other exit costs . . . . . . . . . . . . . . . . . . . . . . . . . . . 531 — 531
$ 2,780 $ 187 $ 2,967 During 2017, the Company recognized $2.2 million of employee termination costs associated with the involuntary terminations of 163 employees in connection with reductions in workforce worldwide. The identified involuntary employee terminations by reportable geographic region amounted to approximately 160 and 3 for the Americas and Asia, respectively. The components of the restructuring charges initiated during 2016 were as follows:
(in thousands) Americas Asia Europe Total
Severance costs . . . . . . . . . . . . . . . . . . . . . . . . . . . $ 1,726 $ 1,904 $ — $ 3,630
Other exit costs . . . . . . . . . . . . . . . . . . . . . . . . . . . 924 — 53 977
$ 2,650 $ 1,904 53 $ 4,607 During 2016, the Company recognized $3.6 million of employee termination costs associated with the involuntary terminations of 582 employees in connection with reductions in workforce worldwide. The identified involuntary employee terminations by reportable geographic region amounted to approximately 370 and 212 for the Americas and Asia, respectively. .
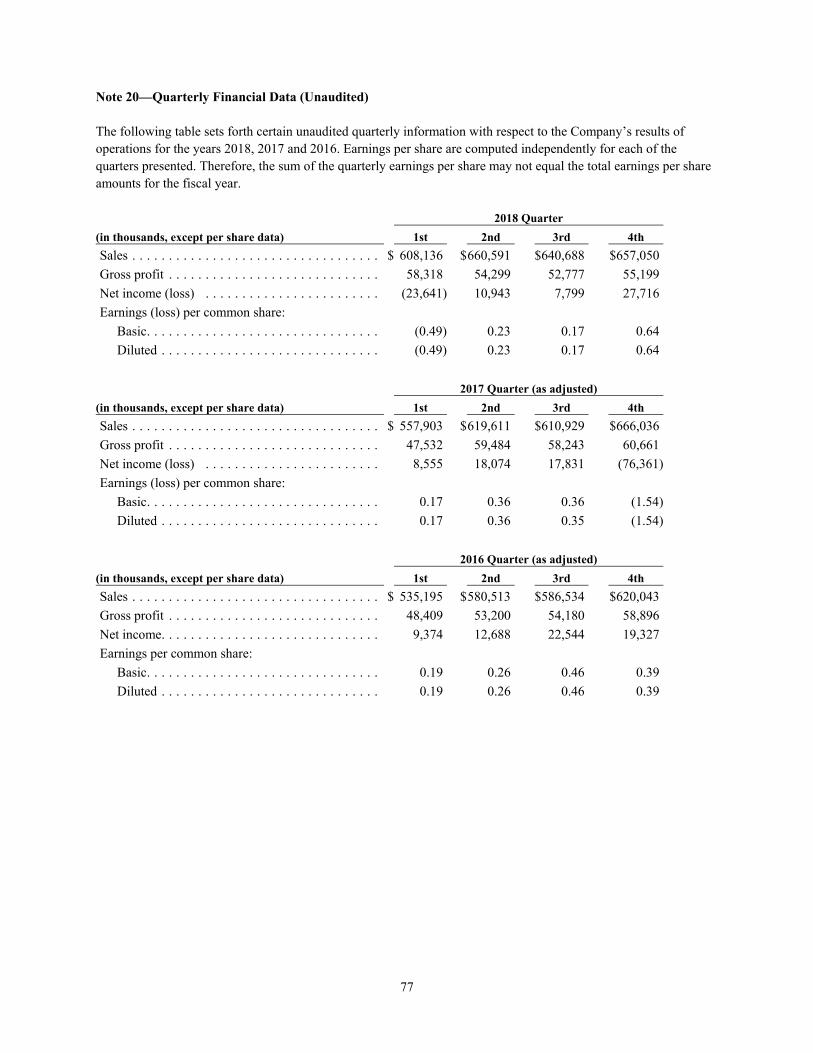
77
Note 20—Quarterly Financial Data (Unaudited) The following table sets forth certain unaudited quarterly information with respect to the Company’s results of operations for the years 2018, 2017 and 2016. Earnings per share are computed independently for each of the quarters presented. Therefore, the sum of the quarterly earnings per share may not equal the total earnings per share amounts for the fiscal year.
2018 Quarter
(in thousands, except per share data) 1st 2nd 3rd 4th
Sales . . . . . . . . . . . . . . . . . . . . . . . . . . . . . . . . . . $ 608,136 $660,591 $640,688 $657,050
Gross profit . . . . . . . . . . . . . . . . . . . . . . . . . . . . . 58,318 54,299 52,777 55,199
Net income (loss) . . . . . . . . . . . . . . . . . . . . . . . . (23,641) 10,943 7,799 27,716
Earnings (loss) per common share:
Basic . . . . . . . . . . . . . . . . . . . . . . . . . . . . . . . . (0.49) 0.23 0.17 0.64
Diluted . . . . . . . . . . . . . . . . . . . . . . . . . . . . . . (0.49) 0.23 0.17 0.64
2017 Quarter (as adjusted)
(in thousands, except per share data) 1st 2nd 3rd 4th
Sales . . . . . . . . . . . . . . . . . . . . . . . . . . . . . . . . . . $ 557,903 $619,611 $610,929 $666,036
Gross profit . . . . . . . . . . . . . . . . . . . . . . . . . . . . . 47,532 59,484 58,243 60,661
Net income (loss) . . . . . . . . . . . . . . . . . . . . . . . . 8,555 18,074 17,831 (76,361)
Earnings (loss) per common share:
Basic . . . . . . . . . . . . . . . . . . . . . . . . . . . . . . . . 0.17 0.36 0.36 (1.54)
Diluted . . . . . . . . . . . . . . . . . . . . . . . . . . . . . . 0.17 0.36 0.35 (1.54)
2016 Quarter (as adjusted)
(in thousands, except per share data) 1st 2nd 3rd 4th
Sales . . . . . . . . . . . . . . . . . . . . . . . . . . . . . . . . . . $ 535,195 $580,513 $586,534 $620,043
Gross profit . . . . . . . . . . . . . . . . . . . . . . . . . . . . . 48,409 53,200 54,180 58,896
Net income . . . . . . . . . . . . . . . . . . . . . . . . . . . . . . 9,374 12,688 22,544 19,327
Earnings per common share:
Basic . . . . . . . . . . . . . . . . . . . . . . . . . . . . . . . . 0.19 0.26 0.46 0.39
Diluted . . . . . . . . . . . . . . . . . . . . . . . . . . . . . . 0.19 0.26 0.46 0.39

78
Note 21—Accumulated Other Comprehensive Loss The changes in accumulated other comprehensive loss by component were as follows:
Foreign Unrealized
currency Derivative loss on
translation instruments, investments,
(in thousands) adjustments net of tax net of tax Other Total
Balances, December 31, 2015 . . . . . . . . . . . . . . . . . . $ (13,079) $ — $ (95) $ 158 $ (13,016)
Other comprehensive gain (loss) before reclassifications (1,465) 286 21 (1) (1,159)
Amounts reclassified from accumulated
other comprehensive loss . . . . . . . . . . . . . . . . . . . — — — (1) (1)
Net current period other comprehensive loss . . . . . . . . . (1,465) 286 21 (2) (1,160)
Balances, December 31, 2016 . . . . . . . . . . . . . . . . . . (14,544) 286 (74) 156 (14,176)
Other comprehensive gain (loss) before reclassifications 4,977 1,192 33 (175) 6,027
Net current period other comprehensive gain (loss) . . . 4,977 1,192 33 (175) 6,027
Balances, December 31, 2017 . . . . . . . . . . . . . . . . . . (9,567) 1,478 (41) (19) (8,149)
Other comprehensive gain (loss) before reclassifications (2,273) (1,126) 41 619 (2,739)
Amounts reclassified from accumulated
other comprehensive loss . . . . . . . . . . . . . . . . . . . — (236) — — (236)
Net current period other comprehensive gain (loss) . . . (2,273) (1,362) 41 619 (2,975)
Balances, December 31, 2018 . . . . . . . . . . . . . . . . . . $ (11,840) $ 116 $ — $ 600 $ (11,124)
See Note 12 for further explanation of the change in derivative instruments that is recorded to Accumulated Other Comprehensive Loss. Amounts reclassified from accumulated other comprehensive loss during 2018 and 2016 primarily affected interest expense and selling, general and administrative expenses, respectively.
Note 22—Supplemental Cash Flow and Non-Cash Information
The following is additional information concerning supplemental disclosures of cash payments.
Year ended December 31,
(in thousands) 2018 2017 2016
Income taxes paid, net . . . . . . . . . . . . . . . . . . . . . . . . . . . . . . . . . . . . . . . $ 48,918 $ 6,453 $ 7,865
Interest paid . . . . . . . . . . . . . . . . . . . . . . . . . . . . . . . . . . . . . . . . . . . . . . $ 7,868 $ 8,698 $ 8,305
Non-cash investing activity:
Additions to property, plant and equipment in accounts payable . . . . . . . . . $ 6,148 $ 7,761 $ 2,111
79
Report of Independent Registered Public Accounting Firm To the Shareholders and Board of Directors Benchmark Electronics, Inc.: Opinions on the Consolidated Financial Statements and Internal Control Over Financial Reporting We have audited the accompanying consolidated balance sheets of Benchmark Electronics, Inc. and subsidiaries (the Company) as of December 31, 2018 and 2017, the related consolidated statements of income (loss), comprehensive income (loss), shareholders’ equity, and cash flows for each of the years in the three-year period ended December 31, 2018, and the related notes and financial statement schedules listed in Item 15(2) (collectively, the consolidated financial statements). We also have audited the Company’s internal control over financial reporting as of December 31, 2018, based on criteria established in Internal Control – Integrated Framework (2013) issued by the Committee of Sponsoring Organizations of the Treadway Commission. In our opinion, the consolidated financial statements referred to above present fairly, in all material respects, the financial position of the Company as of December 31, 2018 and 2017, and the results of its operations and its cash flows for each of the years in the three-year period ended December 31, 2018, in conformity with U.S. generally accepted accounting principles. Also in our opinion, the Company maintained, in all material respects, effective internal control over financial reporting as of December 31, 2018 based on criteria established in Internal Control – Integrated Framework (2013) issued by the Committee of Sponsoring Organizations of the Treadway Commission. Change in Accounting Principle As discussed in Note 1(q) to the consolidated financial statements, the Company has changed its method of accounting for revenue transactions with customers due to the adoption of Accounting Standards Update No. 2014-09, Revenue from Contracts with Customers, as amended. Basis for Opinions The Company’s management is responsible for these consolidated financial statements, for maintaining effective internal control over financial reporting, and for its assessment of the effectiveness of internal control over financial reporting, included in the accompanying Management’s Report on Internal Control over Financial Reporting. Our responsibility is to express an opinion on the Company’s consolidated financial statements and an opinion on the Company’s internal control over financial reporting based on our audits. We are a public accounting firm registered with the Public Company Accounting Oversight Board (United States) (PCAOB) and are required to be independent with respect to the Company in accordance with the U.S. federal securities laws and the applicable rules and regulations of the Securities and Exchange Commission and the PCAOB. We conducted our audits in accordance with the standards of the PCAOB. Those standards require that we plan and perform the audits to obtain reasonable assurance about whether the consolidated financial statements are free of material misstatement, whether due to error or fraud, and whether effective internal control over financial reporting was maintained in all material respects. Our audits of the consolidated financial statements included performing procedures to assess the risks of material misstatement of the consolidated financial statements, whether due to error or fraud, and performing procedures that respond to those risks. Such procedures included examining, on a test basis, evidence regarding the amounts and disclosures in the consolidated financial statements. Our audits also included evaluating the accounting principles used and significant estimates made by management, as well as evaluating the overall presentation of the consolidated financial statements. Our audit of internal control over financial reporting included obtaining an understanding of internal control over financial reporting, assessing the risk that a material weakness exists, and testing and evaluating the design and operating effectiveness of internal control based on the assessed risk. Our audits also included performing such other procedures as we considered necessary in the circumstances. We believe that our audits provide a reasonable basis for our opinions.
80
Definition and Limitations of Internal Control Over Financial Reporting A company’s internal control over financial reporting is a process designed to provide reasonable assurance regarding the reliability of financial reporting and the preparation of financial statements for external purposes in accordance with generally accepted accounting principles. A company’s internal control over financial reporting includes those policies and procedures that (1) pertain to the maintenance of records that, in reasonable detail, accurately and fairly reflect the transactions and dispositions of the assets of the company; (2) provide reasonable assurance that transactions are recorded as necessary to permit preparation of financial statements in accordance with generally accepted accounting principles, and that receipts and expenditures of the company are being made only in accordance with authorizations of management and directors of the company; and (3) provide reasonable assurance regarding prevention or timely detection of unauthorized acquisition, use, or disposition of the company’s assets that could have a material effect on the financial statements. Because of its inherent limitations, internal control over financial reporting may not prevent or detect misstatements. Also, projections of any evaluation of effectiveness to future periods are subject to the risk that controls may become inadequate because of changes in conditions, or that the degree of compliance with the policies or procedures may deteriorate.
We have served as the Company’s auditor since 1986. Houston, Texas February 28, 2019 Management’s Report Benchmark’s management has prepared and is responsible for the consolidated financial statements and related financial data contained in this Report. The consolidated financial statements were prepared in accordance with U.S. generally accepted accounting principles and necessarily include certain amounts based upon management’s best estimates and judgments. The financial information contained elsewhere in this Report is consistent with that in the consolidated financial statements. The Company maintains internal accounting control systems that are adequate to prepare financial records and to provide reasonable assurance that the assets are safeguarded from loss or unauthorized use. We believe these systems are effective, and the cost of the systems does not exceed the benefits obtained. The Audit Committee, composed exclusively of independent, outside directors, has reviewed all financial data included in this Report and recommended to the full Board inclusion of the audited financial statements contained in the Report. The committee meets periodically with the Company’s management and independent registered public accountants on financial reporting matters. The independent registered public accountants have complete access to the Audit Committee and may meet with the committee, without management present, to discuss their audit results and opinions on the quality of financial reporting. The role of independent registered public accountants is to render a professional, independent opinion on management’s financial statements to the extent required by the standards of the Public Company Accounting Oversight Board (United States). Benchmark’s responsibility is to conduct its affairs according to the highest standards of personal and corporate conduct.

81
Item 9. Changes in and Disagreements with Accountants on Accounting and Financial Disclosure. None. Item 9A. Controls and Procedures. Conclusion Regarding the Effectiveness of Disclosure Controls and Procedures As of the end of the period covered by this Report, the Company’s management (with the participation of its chief executive officer and chief financial officer) conducted an evaluation pursuant to Rule 13a-15e promulgated under the Exchange Act, of the effectiveness of the design and operation of the Company’s disclosure controls and procedures (as such term is defined in Rule 13a-15(e) or 15d-15(e) of the Exchange Act). Based on this evaluation, the Company’s chief executive officer and chief financial officer concluded that as of the end of the period covered by this Report such disclosure controls and procedures were effective to provide reasonable assurance that information required to be disclosed by the Company in reports it files or submits under the Exchange Act is recorded, processed, summarized and reported within the time periods specified in the rules and forms of the SEC, and include controls and procedures designed to ensure that information required to be disclosed by the Company in such reports is accumulated and communicated to the Company’s management, including the Company’s chief executive officer and chief financial officer, as appropriate to allow timely decisions regarding required disclosure. Management’s Report on Internal Control over Financial Reporting Our management is responsible for establishing and maintaining adequate internal control over financial reporting (as such term is defined in Rule 13a-15(f) or Rule 15d-15(f) of the Exchange Act. Under the supervision and with the participation of our management, including our principal executive officer and principal financial officer, we conducted an evaluation of the effectiveness of our internal control over financial reporting based on the framework in Internal Control-Integrated Framework (2013) issued by the Committee of Sponsoring Organizations of the Treadway Commission (COSO). Based on our evaluation under the framework, our management concluded that our internal control over financial reporting was effective as of December 31, 2018. The effectiveness of the Company’s internal control over financial reporting as of December 31, 2018 has been audited by KPMG LLP, an independent registered public accounting firm, as stated in their report included in Item 8 of this Report. Changes in Internal Control Over Financial Reporting There has been no change in our internal control over financial reporting that occurred during the last fiscal quarter covered by this Annual Report on Form 10-K that has materially affected, or is reasonably likely to materially affect, our internal control over financial reporting. Limitations on Effectiveness of Controls and Procedures Our management, including our chief executive officer and chief financial officer, does not expect that our disclosure controls and internal controls will prevent all errors and all fraud. A control system, no matter how well conceived and operated, can provide only reasonable, not absolute, assurance that the objectives of the control system are met. Further, the design of a control system must reflect the fact that there are resource constraints, and the benefits of controls must be considered relative to their costs. Because of the inherent limitations in all control systems, no evaluation of controls can provide absolute assurance that all control issues and instances of fraud, if any, within the company have been detected. These inherent limitations include the realities that judgments in decision-making can be faulty, and that breakdowns can occur because of simple error or mistake. Additionally, controls can be circumvented by the individual acts of some persons, by collusion of two or more people, or by management override of the control. The design of any system of controls also is based in part upon certain
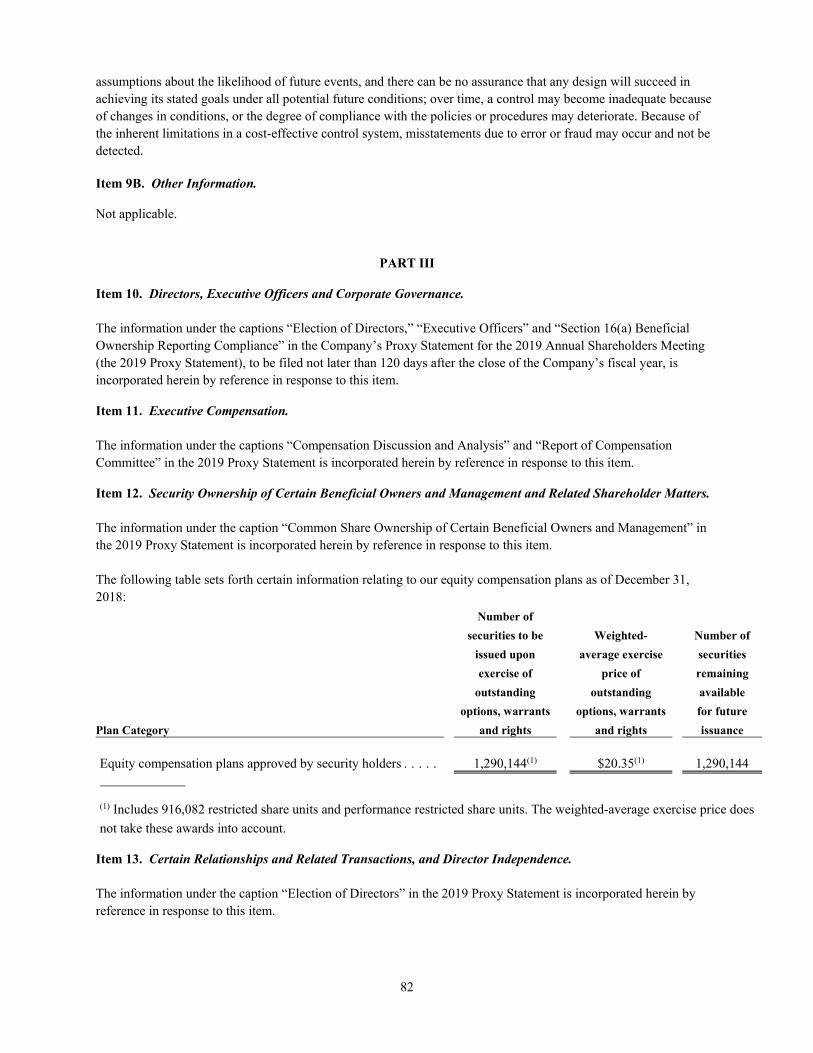
82
assumptions about the likelihood of future events, and there can be no assurance that any design will succeed in achieving its stated goals under all potential future conditions; over time, a control may become inadequate because of changes in conditions, or the degree of compliance with the policies or procedures may deteriorate. Because of the inherent limitations in a cost-effective control system, misstatements due to error or fraud may occur and not be detected. Item 9B. Other Information. Not applicable.
PART III Item 10. Directors, Executive Officers and Corporate Governance. The information under the captions “Election of Directors,” “Executive Officers” and “Section 16(a) Beneficial Ownership Reporting Compliance” in the Company’s Proxy Statement for the 2019 Annual Shareholders Meeting (the 2019 Proxy Statement), to be filed not later than 120 days after the close of the Company’s fiscal year, is incorporated herein by reference in response to this item. Item 11. Executive Compensation. The information under the captions “Compensation Discussion and Analysis” and “Report of Compensation Committee” in the 2019 Proxy Statement is incorporated herein by reference in response to this item. Item 12. Security Ownership of Certain Beneficial Owners and Management and Related Shareholder Matters. The information under the caption “Common Share Ownership of Certain Beneficial Owners and Management” in the 2019 Proxy Statement is incorporated herein by reference in response to this item. The following table sets forth certain information relating to our equity compensation plans as of December 31, 2018:
Number of
securities to be Weighted- Number of
issued upon average exercise securities
exercise of price of remaining
outstanding outstanding available
options, warrants options, warrants for future
Plan Category and rights and rights issuance Equity compensation plans approved by security holders . . . . . 1,290,144(1) $20.35(1) 1,290,144
(1) Includes 916,082 restricted share units and performance restricted share units. The weighted-average exercise price does
not take these awards into account. Item 13. Certain Relationships and Related Transactions, and Director Independence. The information under the caption “Election of Directors” in the 2019 Proxy Statement is incorporated herein by reference in response to this item.
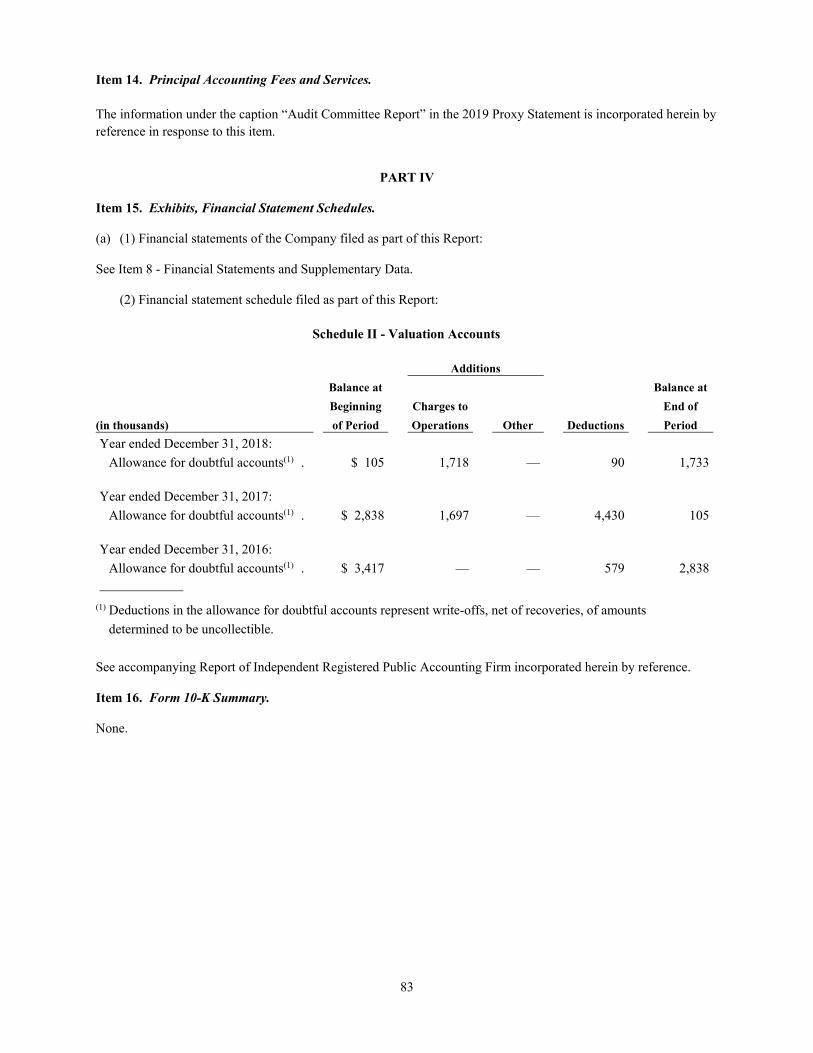
83
Item 14. Principal Accounting Fees and Services. The information under the caption “Audit Committee Report” in the 2019 Proxy Statement is incorporated herein by reference in response to this item.
PART IV Item 15. Exhibits, Financial Statement Schedules. (a) (1) Financial statements of the Company filed as part of this Report: See Item 8 - Financial Statements and Supplementary Data.
(2) Financial statement schedule filed as part of this Report:
Schedule II - Valuation Accounts
Additions
Balance at Balance at
Beginning Charges to End of
(in thousands) of Period Operations Other Deductions Period
Year ended December 31, 2018:
Allowance for doubtful accounts(1) . $ 105 1,718 — 90 1,733
Year ended December 31, 2017:
Allowance for doubtful accounts(1) . $ 2,838 1,697 — 4,430 105
Year ended December 31, 2016:
Allowance for doubtful accounts(1) . $ 3,417 — — 579 2,838
(1) Deductions in the allowance for doubtful accounts represent write-offs, net of recoveries, of amounts
determined to be uncollectible.
See accompanying Report of Independent Registered Public Accounting Firm incorporated herein by reference. Item 16. Form 10-K Summary. None.
Exhibit
Number Description of Exhibit
84
2.1 Purchase Agreement dated October 20, 2015 (incorporated by reference to Exhibit 2.1 to the Company's Current Report on Form 8-K dated November 12, 2015 (Commission file number 1-10560))
3.1 Restated Certificate of Formation dated May 17, 2016 (incorporated by reference to Exhibit 3.1
to the Company’s Current Report on Form 8-K dated May 17, 2016) (the 8-K) (Commission file number 1-10560)
3.2 Amended and Restated Bylaws of the Company dated May 11, 2016 (incorporated by reference
to Exhibit 3.2 to the 8-K) 4.1 Specimen form of certificate evidencing the Common Shares (incorporated by reference to
Exhibit 4.1 to the Company’s Quarterly Report on Form 10-Q for the quarter ended September 30, 2014) (the 10-Q) (Commission file number 1-10560)
10.1 Form of Indemnity Agreement between the Company and its directors and senior officers
(incorporated by reference to Exhibit 10.1 to the 10-Q) 10.2 (1) Benchmark Electronics, Inc. 2000 Stock Awards Plan (2000 Plan) (incorporated by reference to
Exhibit 4.8 to the Company’s Registration Statement on Form S-8 (Registration Number 333-54186))
10.3 (1) Form of nonqualified stock option agreement for use under the 2000 Plan (incorporated by
reference to Exhibit 10.10 to the Company’s Annual Report on Form 10-K for the year ended December 31, 2008 (Commission file number 1-10560))
10.4 (1) Benchmark Electronics, Inc. 2002 Stock Option Plan for Non-Employee Directors (2002 Plan)
(incorporated by reference to Appendix A to the Company’s Definitive Proxy Statement on Schedule 14A filed April 15, 2002 (Commission file number 1-10560))
10.5 (1) Amendment No. 1 to the 2002 Plan (incorporated by reference to Exhibit 99.3 to the Company’s
Current Report on Form 8-K dated May 19, 2006 (Commission file number 1-10560)) 10.6 (1) Benchmark Electronics, Inc. 2010 Omnibus Incentive Compensation Plan (2010 Plan)
(incorporated by reference to Exhibit 99.1 to the Company’s Registration Statement on Form S-8 (Registration Number 333-168427))
10.7 (1) First Amendment to the 2010 Plan (incorporated by reference to Annex A to the Company's
Definitive Proxy Statement on Schedule 14A filed March 28, 2014 (Commission file number 1-10560))
10.8 (1) Form of option award agreement for use under the 2010 Plan (incorporated by reference to
Exhibit 4.10 to the Company’s Registration Statement on Form S-8 (Registration Number 333-168427))

Exhibit
Number Description of Exhibit
85
10.9 (1) Form of restricted share award agreement for use under the 2010 Plan (incorporated by reference to Exhibit 4.11 to the Company’s Registration Statement on Form S-8 (Registration Number 333-168427))
10.10 (1) Form of restricted stock unit award agreement for use under the 2010 Plan (incorporated by
reference to Exhibit 4.12 to the Company’s Registration Statement on Form S-8 (Registration Number 333-168427))
10.11 (1) Amended form of restricted stock unit award agreement for use under the 2010 Plan
(incorporated by reference to Exhibit 10.2 to the Company’s Quarterly Report on Form 10-Q for the quarter ended March 31, 2017 (Commission file number 1-10560))
10.12 (1) Form of performance-based restricted stock unit award agreement for use under the 2010 Plan
(incorporated by reference to Exhibit 10.1 to the Company’s Quarterly Report on Form 10-Q filed on May 10, 2016 (Commission file number 1-10560))
10.13 (1) Amended form of performance-based restricted stock unit award agreement for use under the
2010 Plan (incorporated by reference to Exhibit 10.3 to the Company’s Quarterly Report on Form 10-Q for the quarter ended March 31, 2017 (Commission file number 1-10560))
10.14 (1) Benchmark Electronics, Inc. Deferred Compensation Plan dated as of December 16, 2008
(incorporated by reference to Exhibit 99.1 to the Company’s Form S-8 (Registration Number 333-156202))
10.15 (1) Employment Agreement dated December 1, 2016 between the Company and Paul J. Tufano
(incorporated by reference to Exhibit 10.1 to the Company’s Current Report on Form 8-K dated December 1, 2016 (Commission file number 1-10560))
10.16 (1) Employment Agreement between the Company and Donald F. Adam dated as of March 10, 2009
(incorporated by reference to Exhibit 10.1 to the Company’s Current Report on Form 8-K dated March 10, 2009 (Commission file number 1-10560))
10.17 (1) Agreement between the Company and Jon J. King dated as of May 15, 2017 (incorporated by
reference to Exhibit 10.1 to the Company’s quarterly report on Form 10-Q filed for the quarter ended June 30, 2017 (Commission file number 1-10560))
10.18 (1) Form of Executive Severance Agreement (incorporated by referent to Exhibit 10.15 to the
Company’s Annual Report on Form 10-K for the year ended December 31, 2015 (Commission file number 1-10560))
10.19 Code of Conduct (incorporated by reference to Exhibit 10.20 to the Company’s Annual Report
on Form 10-K for the year ended December 31, 2009 (Commission file number 1-10560)) 10.20 (1) Amendment to Employment Agreement, dated as of February 22, 2018, between the Company
and Paul J. Tufano (incorporated by reference to Exhibit 10.1 to the Company’s Current Report on Form 8-K dated February 23, 2018 (Commission file number 1-10560))
10.21 Credit Agreement, dated July 20, 2018, by and among the Company, certain of its subsidiaries,
the lenders party thereto and Bank of America, N.A., as Administrative Agent, Swingline Lender and a L/C Issuer (incorporated by reference to Exhibit 10.1 to the Company’s Current Report on Form 8-K dated July 23, 2018 (Commission file number 1-10560))
10.22 (1) Separation Agreement dated September 15, 2016 between the Company and Gayla J. Delly
(incorporated by reference to Exhibit 10.1 to the Company’s Current Report Form 8-K dated September 15, 2016 (Commission file number 1-10560))
Exhibit
Number Description of Exhibit
86
10.23 Cooperation Agreement, dated as of December 19, 2016, by and among the Company and Engaged Capital, LLC, Engaged Capital Flagship Master Fund, LP, Engaged Capital Flagship Fund, LP, Engaged Capital Flagship Fund, Ltd. and Engaged Capital Holdings, LLC (incorporated by reference to Exhibit 10.1 to the Company’s Current Report on Form 8-K dated December 19, 2016 (Commission file number 1-10560))
10.24 (1) Form of Key Management Severance Agreement (incorporated by reference to Exhibit 10.1 to
the Company’s Current Report on Form 8-K dated December 11, 2017 (Commission file number 1-10560))
10.25 (1) Transition Agreement and Release of All Claims by and between Scott Peterson and the
Company (incorporated by reference to Exhibit 10.2 to the Company’s Current Report on Form 8-K dated December 11, 2017 (Commission file number 1-10560))
10.26 (1) Transition Agreement and Release of All Claims by and between Donald F. Adam and the
Company (incorporated by reference to Exhibit 10.2 to the Company’s Current Report on Form 8-K dated December 20, 2017 (Commission file number 1-10560))
16 Letter of Hein & Associates LLP dated November 21, 2017 (incorporated by reference to Exhibit
16.1 to the Company’s Current Report on Form 8-K dated November 21, 2017 (Commission file number 1-10560))
21 (2) Subsidiaries of Benchmark Electronics, Inc. 23 (2) Consent of Independent Registered Public Accounting Firm concerning incorporation by
reference in the Company’s Registration Statements on Form S-8 (Registration No. 333-28997, No. 333-101744, No. 333-156202, No. 333-168427 and No. 333-198404)
31.1 (2) Section 302 Certification of Chief Executive Officer 31.2 (2) Section 302 Certification of Chief Financial Officer 32.1 (2) Section 1350 Certification of Chief Executive Officer 32.2 (2) Section 1350 Certification of Chief Financial Officer 101.INS (3) XBRL Instance Document 101.SCH (3) XBRL Taxonomy Extension Schema Document 101.CAL (3) XBRL Taxonomy Extension Calculation Linkbase Document 101.LAB (3) XBRL Taxonomy Extension Label Linkbase Document 101.PRE (3) XBRL Taxonomy Extension Presentation Linkbase Document 101.DEF (3) XBRL Taxonomy Extension Definition Linkbase Document
(1) Indicates management contract or compensatory plan or arrangement. (2) Filed herewith. (3) XBRL (Extensible Business Reporting Language) information is furnished and not filed or a part of a registration statement or prospectus for purposes of Sections 11 or 12 of the Securities Act of 1933, is deemed not filed for purposes of Section 18 of the Securities Exchange Act of 1934 and otherwise is not subject to liability under these sections.

87
SIGNATURES
Pursuant to the requirements of Section 13 or 15(d) of the Securities Exchange Act of 1934, the registrant has duly caused this Report to be signed on its behalf by the undersigned, thereunto duly authorized.
BENCHMARK ELECTRONICS, INC.
By: /s/ Paul J. Tufano
Paul J. Tufano
Chief Executive Officer Date: February 28, 2019
Pursuant to the requirements of the Securities Exchange Act of 1934, this Report has been signed below by the following persons on behalf of the registrant, in the capacities and on the dates indicated.
Name Position Date
/s/ David W. Scheible Chairman of the Board February 28, 2019
David W. Scheible
/s/ Paul J. Tufano President, Chief Executive Officer and Director February 28, 2019
Paul J. Tufano (principal executive officer)
/s/ Roop K. Lakkaraju Chief Financial Officer February 28, 2019
Roop K. Lakkaraju (principal financial and accounting officer)
/s/ Bruce A. Carlson Director February 28, 2019
Bruce A. Carlson
/s/ Douglas G. Duncan Director February 28, 2019
Douglas G. Duncan
/s/ Robert K. Gifford Director February 28, 2019
Robert K. Gifford
/s/ Kenneth T. Lamneck Director February 28, 2019
Kenneth T. Lamneck
/s/ Jeffrey S. McCreary Director February 28, 2019
Jeffrey S. McCreary
/s/ Merilee Raines Director February 28, 2019
Merilee Raines
/s/ Clay C. Williams Director February 28, 2019
Clay C. Williams