Embed Size (px)
Citation preview
Behavioral/Systems/Cognitive
Temporal Cortex Neurons Encode Articulated Actions asSlow Sequences of Integrated Poses
Jedediah M. Singer1 and David L. Sheinberg2
1Brain Science Program and 2Department of Neuroscience, Brown University, Providence, Rhode Island 02912
Form and motion processing pathways of the primate visual system are known to be interconnected, but there has been surprisingly littleinvestigation of how they interact at the cellular level. Here we explore this issue with a series of three electrophysiology experimentsdesigned to reveal the sources of action selectivity in monkey temporal cortex neurons. Monkeys discriminated between actions per-formed by complex, richly textured, rendered bipedal figures and hands. The firing patterns of neurons contained enough information todiscriminate the identity of the character, the action performed, and the particular conjunction of action and character. This suggestsconvergence of motion and form information within single cells. Form and motion information in isolation were both sufficient to driveaction discrimination within these neurons, but removing form information caused a greater disruption to the original response. Finally,we investigated the temporal window across which visual information is integrated into a single pose (or, equivalently, the timing withwhich poses are differentiated). Temporal cortex neurons under normal conditions represent actions as sequences of poses integratedover �120 ms. They receive both motion and form information, however, and can use either if the other is absent.
IntroductionOur ability to perceive actions and movement, and to combinethat information with the perception of who or what is acting ormoving, is fundamental to our visual experience. What compu-tations allow for successful perception of motion and the bindingof these motions to the correct actors? What are the neural sub-strates of these computations? Visual processing has beenroughly divided into ventral (“what”) and dorsal (“where/how”)streams (Ungerleider and Mishkin, 1982). These two streams arenot wholly independent: neurons encoding both types of infor-mation have been described, particularly in the superior tempo-ral sulcus (STS) (Bruce et al., 1981; Oram and Perrett, 1996;Jellema et al., 2004). This object/spatial distinction is, however, awidely accepted if rough subdivision of the function of the visualsystem.
Information from the dorsal and ventral streams can be en-coded separately (Wu et al., 2004). In normal perception, how-ever, information from different visual modalities is correctlybound together to give coherent percepts of objects with partic-ular shapes and colors at particular places doing particular things.Must a binding problem (Treisman and Gelade, 1980) be solvedto rejoin form with articulated action, or might the two remaincoupled throughout the visual pathway?
Many neurons in the upper bank and fundus of anterior STSare selective for motion direction, and some are relatively invari-
ant to visual form (Bruce et al., 1981). Some respond selectively tospecific combinations of orientation and motion direction whenmonkeys observe humans walking or objects being moved invarious locations and directions (Perrett et al., 1985; Oram andPerrett, 1996; Vangeneugden et al., 2009) Many of these neuronseven respond to static poses reached during the performance ofsuch actions (Jellema and Perrett, 2003). This area is reciprocallyconnected with inferior temporal cortex (IT) and receives inputfrom more posterior dorsal-stream sources such as medial supe-rior temporal area MST; nearby regions in the fundus of theposterior STS also project to IT (Baizer et al., 1991). Given theseconnections, it is not surprising that Gross et al. (1972) foundthat virtually all observed IT neurons were sensitive or even se-lective to motion. A region in the lower bank of the posterior STSshows heightened blood-oxygen-level-dependent responses tobiological motion (Grossman et al., 2000; Beauchamp et al.,2003) of point-light walkers (Johansson, 1973). A nearby regionshows a strong preference for motionless bodies relative to otherobjects (Downing et al., 2001), and this preference correlates on avoxel-by-voxel basis with preference for biological versus scram-bled motion (Peelen et al., 2006).
In this study, we use visually rich, controlled, repeatable stim-uli to show that temporal cortex neurons carry informationabout both object form and complex actions. We explore thenature and origins (pose-based vs motion-based) of the informa-tion giving rise to the action discrimination of these neurons. Wealso investigate the timescale of temporal integration (into a rep-resentation of a pose) versus differentiation (between poses).
Materials and MethodsSubjectsThree male rhesus monkeys (Macaca mulatta; monkeys G, R, and S),aged 7–11 years and weighing between 8 and 12 kg, were the subjects inthese experiments. Before the experiment, the monkeys had been famil-
Received June 28, 2009; revised Nov. 25, 2009; accepted Jan. 14, 2010.This work was supported by the James S. McDonnell Foundation, National Institutes of Health Grant
R01EY014681, and National Science Foundation Grants SBE-0542013 (to the Temporal Dynamics of LearningCenter) and IIS-0827427. We thank Cheston Tan and Feraz Azhar for helpful comments about this manuscript.
Correspondence should be addressed to David Sheinberg, Brown University, Department of Neuroscience, BoxGL-N, Providence, RI 02912. E-mail: [email protected].
DOI:10.1523/JNEUROSCI.3211-09.2010Copyright © 2010 the authors 0270-6474/10/303133-13$15.00/0
The Journal of Neuroscience, February 24, 2010 • 30(8):3133–3145 • 3133
iarized with the behavioral apparatus and hadparticipated in unrelated studies. Monkeys hada recording chamber implanted over the left(tasks 1 and 2) or right (task 3) hemisphere(Horsley–Clark coordinates: �15 anterior,�20 lateral) and a titanium head post for headrestraint. All surgeries were performed usingsterile technique while the animals were intu-bated and anesthetized using isoflurane gas. Allprocedures conformed to the National Re-search Council Guide for the Care and Use ofLaboratory Animals as well as the Brown Uni-versity Institutional Animal Care and UseCommittee.
Stimulus apparatusStimuli were presented on a dual-processor�86 graphics workstation, running a customOpenGL-based stimulation program underWindows XP (Microsoft). The screen resolu-tion was 1024 � 768 with a vertical refresh rateof 100 Hz. Behavioral control for the experi-ments was maintained by a network of inter-connected personal computers running theQNX real-time operating system (QSSL; QNXSoftware Systems). This system provides deter-ministic control and acquisition of button responses (with submillisec-ond precision) and eye position and communicates with the dedicatedgraphics machine using isolated high-speed Ethernet and direct digitalinput/output. Experimental control and data collection of behavioralmeasures were conducted using custom software. All behavioral data,such as button responses and eye-position signals, were available foronline monitoring and stored to disk for offline analysis.
Monkeys were seated in a primate chair, with the head fixed. Theyresponded by means of two buttons on a board on which they rested theirhands (one button under each hand). Eye movements were recordedusing an EyeLink II video eye-tracking system, running at 500 Hz (SRResearch). Each recording session began with a simple eye-movementtask to calibrate the eye-tracking system. Aside from the stimulus display,the recording booth was dark and well isolated from acoustic and elec-tromagnetic interference.
Stimuli and tasksTask 1: action recognition. Each trial consisted of the same general se-quence (Fig. 1), beginning with a fixation spot presented against a graybackground. Once the monkey maintained continuous fixation for 450ms, the spot disappeared. After a 500 ms blank period, one of eight fullytextured rendered three-dimensional humanoid characters (Geo-metricks) appeared, in a neutral upright pose. Rendering relied onGranny3D (RadGameTools). Each character subtended �6° vertically inthis neutral pose. The character remained motionless for 300 ms andthen began performing one of eight different actions (MeGa MoCap V2;Credo Interactive). The segue into the action was blended with the neu-tral pose, so the initial moments of motion were subtle and difficult todistinguish. After 1300 ms of action, the character began moving backtoward the neutral pose, reaching it after a total of 1900 ms of motion. At800 ms later, the character vanished, ending the trial. The monkey’s taskwas to use two buttons to classify the actions into two preset arbitrary(but fixed) groups. See supplemental Figure 1 (available at www.jneurosci.org as supplemental material) for images of all eight charactersand supplemental Movie 1 (available at www.jneurosci.org as supple-mental material) to see all eight actions performed by one of the charac-ters. A button-press response immediately ended the trial, removing thecharacter from the screen. The monkey received auditory feedback aftereach trial, accompanied by juice after a correct choice or a penalty delayof 2 s if incorrect. If the monkey did not respond by the end of the trial, itreceived the same feedback as if it responded incorrectly, and the stimu-lus was saved for reuse later in the block.
Task 2: reduced action recognition. Most aspects of this task were iden-tical to the action recognition task. However, many of the action movies
were manipulated, to either remove form information or remove motioninformation. The task requirements were identical, as were the particularactions and characters used. Only one character was used in a givenrecording session, however, to allow for sufficient trials with all actionsand all types of stimuli. The character used for a particular session waschosen by eye to maximize action discrimination, based on real-timerasters during an initial survey using all characters and all actions.
The first new stimuli in this experiment, “strobe” stimuli, were iden-tical to the original textured animated characters except that they werevisible only for periodic 10 ms monitor refreshes separated by blankscreens. The period of this strobe-light effect (determined by the lengthof the blank between frames) took several different values in differenttrials: 40, 80, 120, 180, or 260 ms. These were designed to remove motioninformation, to test responses to single snapshots, and to examine thetime over which those static images could potentially combine to elicitneural responses similar to those driven by moving stimuli. For an ex-ample, see supplemental Movie 9 (available at www.jneurosci.org as sup-plemental material).
The second manipulation was designed to remove form informationand to test the contribution of motion-sensitive mechanisms to theaction-discriminative neurons from which we recorded. Constructionof these stimuli, “formless dot fields,” is fully described by Singer andSheinberg (2008). Essentially, these stimuli appear at any instant to beuniform random fields of �2000 2 � 2 pixel white dots. The dots persistfor only 40 ms, and those that are situated on the screen in a positionabove the underlying animated stimulus (which is not visibly rendered)move as the stimulus moves. Although conveying essentially nothing aboutform, these stimuli contain motion information almost identical to the orig-inal stimuli. Supplemental Movie 10 (available at www.jneurosci.org as sup-plemental material) shows an example of such stimuli.
Finally, we used stimuli identical to the formless dot fields except thatthe foreground dots (over the figure) and the background dots wererendered in two different colors. This enabled easy segmentation of fig-ure from ground, without providing any local form or texture informa-tion. We also showed strobed versions of these colored dot field stimuli,with the same frequencies as for the fully textured stimuli. SupplementalMovie 2 (available at www.jneurosci.org as supplemental material)shows examples of all manipulations used in this task.
Task 3: clipped action viewing. Both the monkeys’ behavioral task andthe stimuli were new in this experiment. After the monkey fixated on apoint at the center of the screen, a rendered image of a hand (subtending�6° of visual angle vertically) appeared. The hand remained motionlessfor 300 ms and then performed an action for 1200 ms before returning to
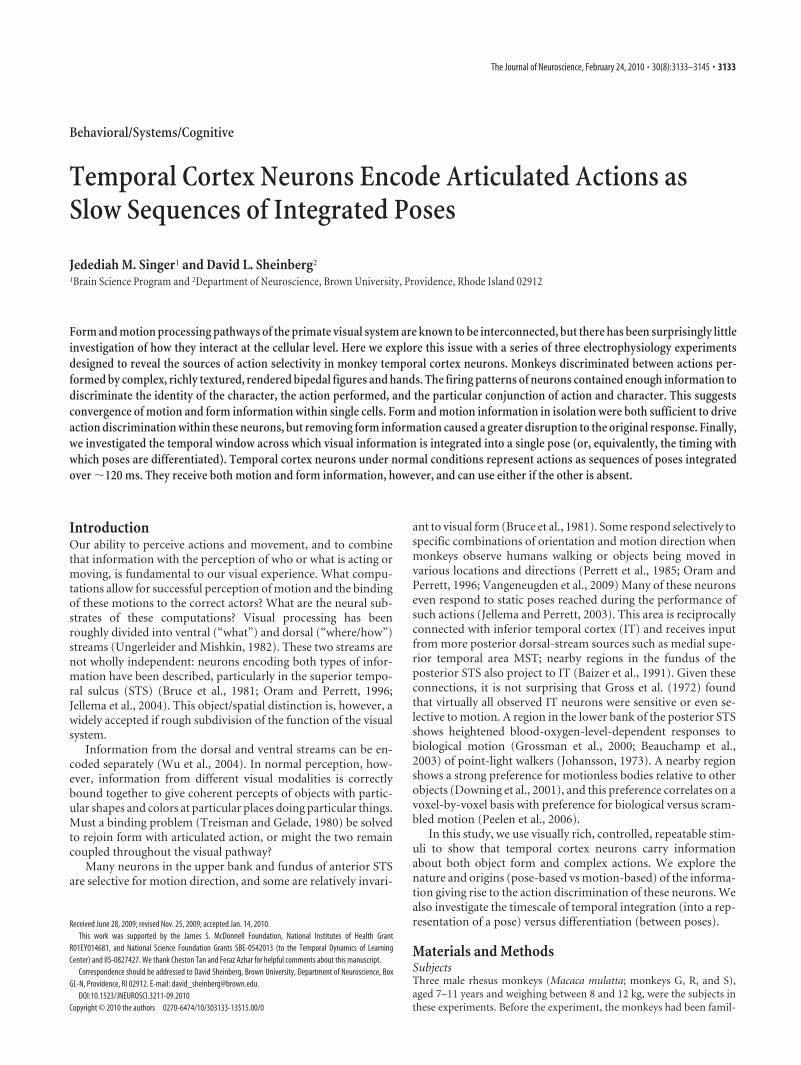
Figure 1. Sequence of events in the action recognition and reduced action recognition tasks. The monkey initiated the trial byfixating for 450 ms on a central fixation point. This then vanished, leaving a blank screen for 500 ms. A humanoid figure (possiblysubject to one of the manipulations in the reduced action task) appeared and stood in a neutral motionless pose for 300 ms beforebeginning an action. This action lasted 1900 ms or until the monkey responded; if the monkey still had not responded by the timethe action completed, the figure remained motionless in the neutral pose for up to 800 ms longer.
3134 • J. Neurosci., February 24, 2010 • 30(8):3133–3145 Singer and Sheinberg • Temporal Coding of Actions
its initial neutral pose and stopping. During this time, the monkey wasrequired to keep its gaze on the hand; excursions beyond �0.5° from theextent of the hand aborted the trial. After the hand stopped moving, twoperipheral targets appeared, one on each side of the hand; the monkeywas then free to look where it wished and had to respond based on achange in one of the targets. The behavioral aspect of the task ensured
that the monkey was attending to the task but isirrelevant to this experiment. For practical pur-poses, one may consider the monkeys to haveperformed viewing-only tasks. Because of therange of stimulus manipulations used in thisexperiment (see below), we decided not toteach the monkeys to respond differentially tothe particular animated sequences; we did notwant to bias them to attend to particular as-pects of the actions. Our interest here was tobetter understand how single-neuron responseswere affected by altering the temporal dynamicsof the action sequences.
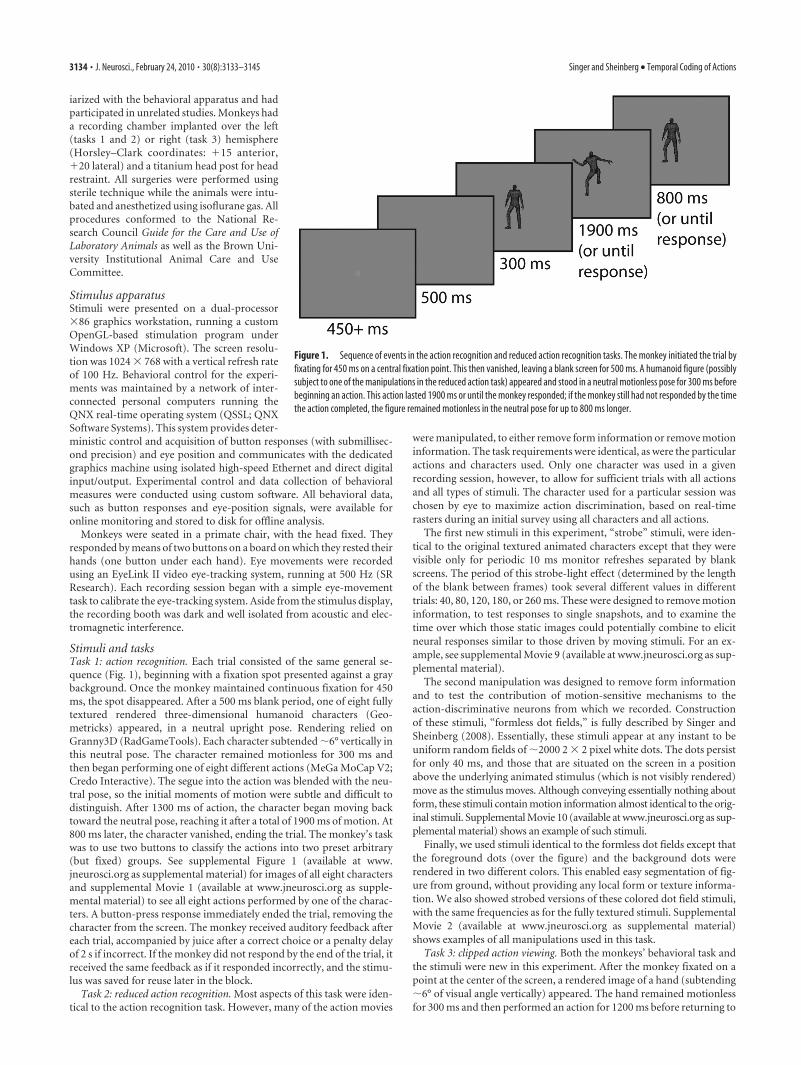
There were two basic actions that the handcould perform, spelling out either “LW” or“WL” in American Sign Language. These ac-tions were identical but with the temporal or-der of individual frames reversed. There werealso “clipped” trials: the movie of the actionwas broken up into short clips, and each clipwas played backward while maintaining theoverall order of the clips. One may conceptual-ize this manipulation by imagining a movieconsisting of several reels, each correspondingto a clip. In the normal version of the movie,the reels are played in the correct order. In theclipped version, the same sequence of reels isused, but the film has been wound backwardon each reel so that each reel starts at the endand plays in reverse. We used clip lengths of 4,8, 12, 20, 30, and 60 frames (shown on a 100 Hzmonitor), dividing up the 120 frames of theoverall action. For example, with a clip lengthof 60 frames, the first half of the action playedbackward, followed by the second half runningbackward. Figure 2 schematizes full-motionand 30-frame (300 ms) clipped versions ofboth actions. In this way, we constructed arange of stimuli between the two basic actions:using 40 ms clips looks like a slightly jitteryversion of the basic action, whereas using 600ms clips is equivalent to playing the oppositebasic action but playing the second half of itfirst (for examples, see supplemental Movie 3,available at www.jneurosci.org as supplemen-tal material). We also presented formless dotfield versions of these stimuli at all clip lengths.
Recording apparatusIn the first two tasks, at the beginning of eachrecording session, a 25 gauge guide tube wasinserted to a level just below the dura. A singleelectrode was advanced through the guide tubeusing a micropositioner (David Kopf Instru-ments). In the third task, single electrodes werelowered through chronically implanted guidetubes that could be pivoted to provide access toan extended region of cortex. Electrodes werecomposed of a tungsten core with glass coating(Alpha Omega). Neural signals were amplified(model A-1; BAK Electronics), bandpass fil-tered between 100 Hz and 12 kHz (model 3364;Krohn-Hite), and digitized at 34.375 kHz. Werecorded from single units or small groups of
units. The signals were thresholded and (when more than one unit wasrecorded at once) sorted using “wave_clus” (Quiroga et al., 2004).
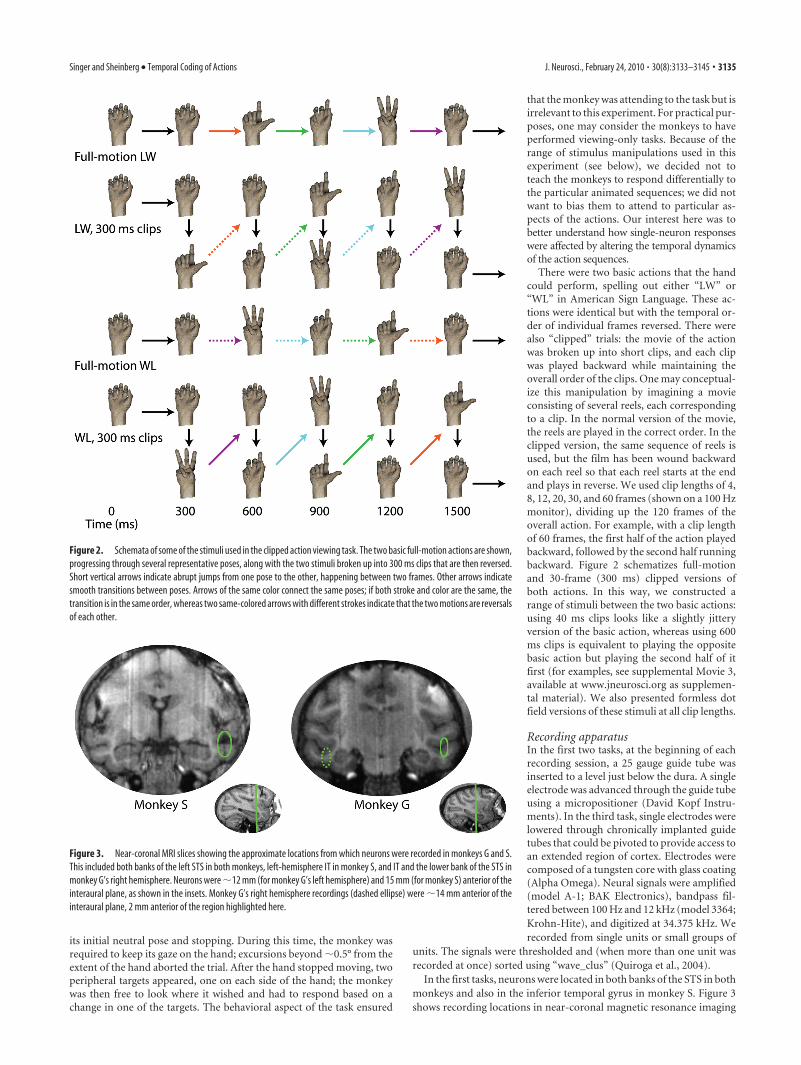
In the first tasks, neurons were located in both banks of the STS in bothmonkeys and also in the inferior temporal gyrus in monkey S. Figure 3shows recording locations in near-coronal magnetic resonance imaging
Figure 2. Schemata of some of the stimuli used in the clipped action viewing task. The two basic full-motion actions are shown,progressing through several representative poses, along with the two stimuli broken up into 300 ms clips that are then reversed.Short vertical arrows indicate abrupt jumps from one pose to the other, happening between two frames. Other arrows indicatesmooth transitions between poses. Arrows of the same color connect the same poses; if both stroke and color are the same, thetransition is in the same order, whereas two same-colored arrows with different strokes indicate that the two motions are reversalsof each other.
Figure 3. Near-coronal MRI slices showing the approximate locations from which neurons were recorded in monkeys G and S.This included both banks of the left STS in both monkeys, left-hemisphere IT in monkey S, and IT and the lower bank of the STS inmonkey G’s right hemisphere. Neurons were �12 mm (for monkey G’s left hemisphere) and 15 mm (for monkey S) anterior of theinteraural plane, as shown in the insets. Monkey G’s right hemisphere recordings (dashed ellipse) were �14 mm anterior of theinteraural plane, 2 mm anterior of the region highlighted here.
Singer and Sheinberg • Temporal Coding of Actions J. Neurosci., February 24, 2010 • 30(8):3133–3145 • 3135
(MRI) slices, �12 mm (for monkey G) and 15 mm (for monkey S)anterior of the interaural plane. We removed the recording hardwarefrom monkey S after the first task so that only monkey G performed thesecond task, during which we recorded from the same site as in the firsttask. In the third task, we recorded from deep in the STS and in IT inmonkey G, �14 mm anterior to the interaural plane. Monkey R alsoperformed the third task; we do not have an MR image of monkey R’sbrain, but based on the stereotaxic coordinates of the chamber and twoatlases of macaque brains (Paxinos et al., 2000; Saleem and Logothetis,2006), we estimate that these cells were in the upper bank of the STS, inthe superior temporal polysensory area TPO and/or area TAa in thesuperior temporal gyrus, �12 mm anterior to the interaural plane.
Data analysisThe responses of the neurons we observed tended to be more diverse,more extended, and more robust than is commonly seen using flashedstatic images. Most stimuli elicited responses, and the responses some-times persisted for several hundred milliseconds after the stimuli disap-peared. This is in contrast to the typical selective phasic responses weobserved to flashed static images while lowering the electrode and hunt-ing for visual neurons. For these reasons, the conventional notion of“selectivity” (poor response to most stimuli and a strong response to theselected stimulus) is not useful. We speak instead of discrimination orinformation: are the firing rates of these neurons able to tell us what themonkey is looking at? Our analyses reflect this; instead of finding thestimulus for which each neuron was selective, we examined the capabilityof populations of neurons to represent various aspects of the stimuli. Wealso tested the generality of these representations and the importance ofdifferent stimulus properties in their construction, comparing responsesbetween different stimulus conditions.
Poisson models. To demonstrate how effectively even relatively smallpopulations of cells could differentiate between the individual stimulipresented, we developed and tested a model based on the populations ofneurons recorded from in each monkey in the first two tasks. We treatedeach unit as a rate-varying Poisson process; the rate parameter of such aprocess can be estimated by the mean observed rate. For each unit, foreach trial, we determined the spike counts in each 40 ms bin after stim-ulus onset. We chose 40 ms because it maximized performance of themodel, although bin sizes between 5s and 100 ms yielded qualitativelysimilar results and nearly the same level of performance. Then, for eachunit and for each distinct stimulus, we calculated the average spike countin each bin, leaving one trial out for verification purposes. In the actionrecognition task, there were 64 distinct stimuli (8 actions � 8 characters);in the reduced action recognition task, there were only eight actions,because we only showed one character on any given day. There weretypically only a small number of trials for each condition for each neuron;to overcome problems with unusual bins having an inordinate impact onthe performance of the model, we processed the resulting (bin-indexed)vectors. Each vector was convolved with a Gaussian kernel with an SD ofone bin. Then, any binwise firing rates less than the mean firing rateduring the 500 ms before the onset of the stimulus were averaged withthis baseline rate. At this point, we had estimates of the rate for each unit,at each time bin, in response to each of the 8 or 64 stimuli. Given aPoisson process with rate parameter � per unit time, the probability of
observing n events in one unit of time ise���n
n!. The probability of ob-
serving one of the left-out spike trains from a unit, given that a particularstimulus was shown, is the product of this term across all time bins.
No more than a few of these units were ever recorded simultaneously.However, as long as there are no long-term changes over time in thefunctioning of these populations of neurons, we can consider together allneurons from all recording sessions as one pseudo-population. In doingso, we treat the left-out trials of all the neurons, for each stimulus, ashaving been responses to the same presentation of that stimulus. Previ-ous work has found no loss of information in comparing IT neuronresponses across days in this manner (Anderson et al., 2007). It is thenpossible to construct a confusion matrix for the population of cells, plot-ting the probabilities assigned (as described above) to each of the 8 or 64stimuli against each of the 8 or 64 left-out trials. The diagonal of the
matrix indicates how reliably the responses to a given stimulus identifythat stimulus, whereas the entries off the diagonal give a measure of thesimilarity in pseudo-population responses to the two stimuli indexed.Such a confusion matrix is based on a specific set of left-out trials; differ-ent sets of left-out trials yield different confusion matrices. By creatingmany confusion matrices and multiplying them together, we can esti-mate the information that these neurons are intrinsically capable of rep-resenting or simulate what a larger population (consisting of manyneurons similar to each recorded neuron) might be able to do on a singletrial. We evaluated the performance of each model by counting the num-ber of left-out trials that were assigned the highest probability by theirrespective Poisson processes. In addition to collapsing across all time binsin the entire trial, we also looked at the accumulation of information(that is, the increase in performance) as successive bins were added to themodel, increasing the temporal window of the model one bin at a time.
Evaluating the performance of these models is a way of measuringsimilarity: in these cases, similarity between individual (left-out) re-sponses to each stimulus and the average responses to each stimulus. Inthe reduced action recognition task, we also used these models to quan-tify the similarity of responses between conditions. We did this by usingmodels created from one set of data to evaluate trials from another.
Local and global similarity scores. There were only two basic actions inthe clipped action viewing task. Creating a classifier that successfullydiscriminated between them would tell us very little. Moreover, we wereinterested in comparing responses to a given stimulus at particular timeswith responses to other stimuli at different times. Specifically, are theresponses to a given frame of animation more influenced by temporallylocal context (the order of frames within the clip, or motion information)or by the global action context in which the frame occurs (that is, theorder of the clips: LW vs WL)? We therefore followed a different ap-proach for analyzing these data, calculating local and global similarityscores. These tell us how similar the responses are to visually identicalframes when they appear in the same local context or in the same globalcontext, respectively. At clip durations for which the local similarity scoreis higher, information within clips exerts more influence on the re-sponses to the frames of an action. When the global similarity score ishigher, the positions of the frames within the overall action exert a greaterinfluence.
For each neuron, for each basic action, and for each clip length, webinned the spike counts into 1 ms bins. These histograms were smoothedwith a Gaussian window of 5 ms SD and then rebinned into 10 ms bins.Each such bin can be indexed by basic action, time bin, and clip duration.For each bin, we exhaustively calculated its absolute differences from allother bins. We used these differences to calculate a similarity value foreach comparison, leading to local and global similarity scores for eachclip length. For a given clip length, let Di, j
same refer to the sum of the twoabsolute differences between same-action conditions at bin i in the full-motion action and bin j in the clipped action. For example, D31,19
same com-pares bin 31 of the full-motion LW action to bin 19 of the clipped LWaction (for the clip length being considered), adding that difference to thedifference between bin 31 of the full-motion WL action and bin 19 of theclipped WL action. Let Di, j
opp refer to the corresponding sum of the twodifferences between opposite-action conditions. We then defined our simi-
larity value for the same-action comparison asDi, j
opp � 0.025
Di, jsame � 0.025
and for
opposite-action comparisons as its reciprocal,Di, j
same � 0.025
Di, jopp � 0.025
. These sim-
ilarity values for all i,j yield a similarity matrix, indexed by time in full-motion trials and time in clipped trials. There is one such matrix forsame-action comparisons and one for opposite-action comparisons(corresponding values in these two matrices are reciprocal).
Di,jsame is low when the firing rate of the cell is low or when the responses
in the ith bin of the full-motion action and the jth bin of the clippedaction are similar. In the latter case, this similarity leads to a low Di,j
opp
also, unless the similarity is particular to the same-action comparison.Therefore, the similarity value for same-action comparisons should behigh if and only if Di,j
same is low because of something particular to thesame-action comparison. Likewise, opposite-action similarity should be
3136 • J. Neurosci., February 24, 2010 • 30(8):3133–3145 Singer and Sheinberg • Temporal Coding of Actions
high if and only if Di,jopp is low but Di,j
same is not. The value of the constantadded to the numerator and denominator (0.025) is somewhat arbi-trarily chosen such that it carries the same weight as a 25 Hz firing rate;other values work without qualitatively changing the results. It serves toprevent similarity values from becoming extremely high solely because ofa low denominator and to help compensate for increased variance lead-ing to increased rate differences at higher firing rates.
Relative to a full-motion action, the clipped versions of the oppositeaction contain all the same motion (except for the abrupt transitionsbetween clips), but the clips are in the reverse order; the global sequenceof poses is reversed. Conversely, full-motion and clipped versions of the
same action contain the same overall sequencesof general poses, but within each clip the localmotion is reversed. By comparing the same-action versus opposite-action similarity valuesfor visually identical frames, we can see the ef-fect of stimulus history on the responses tothose frames. Higher similarity values betweenmatching frames in same-action comparisonsindicate that a correct progression of generalposes through the action is more important tothe representation of the action. Higher simi-larity values between matching frames in theopposite-action cases indicate that the contextwithin the clip of that frame is more important.
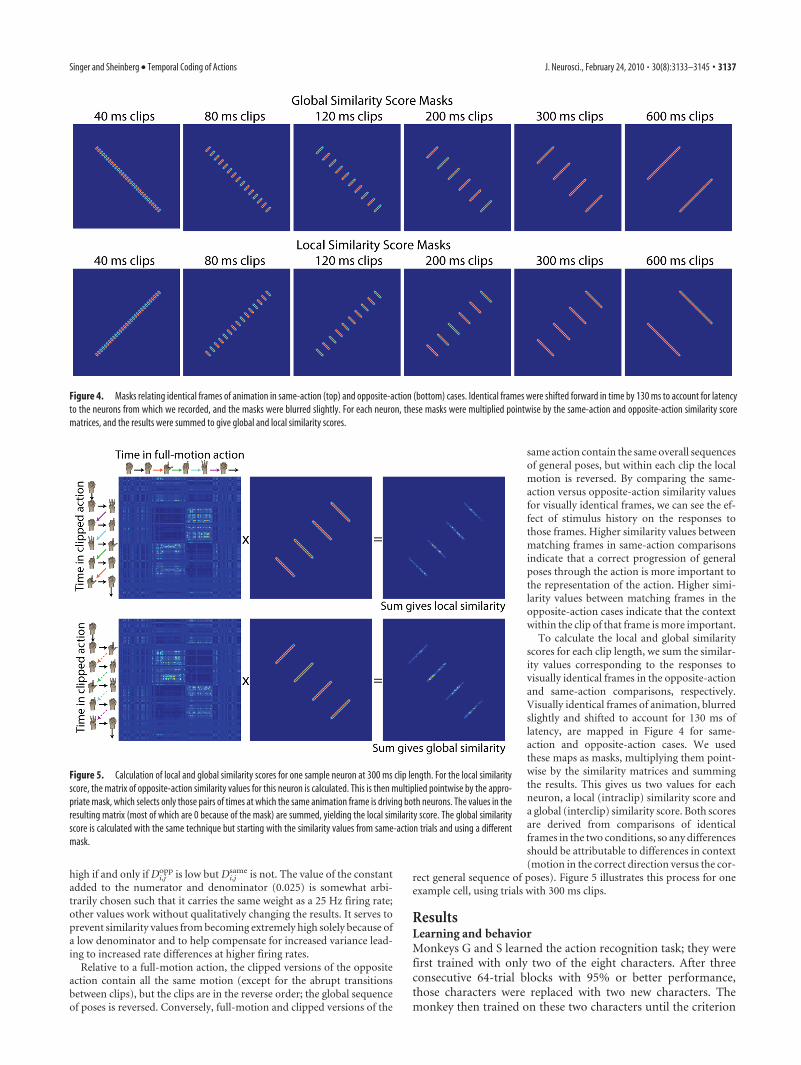
To calculate the local and global similarityscores for each clip length, we sum the similar-ity values corresponding to the responses tovisually identical frames in the opposite-actionand same-action comparisons, respectively.Visually identical frames of animation, blurredslightly and shifted to account for 130 ms oflatency, are mapped in Figure 4 for same-action and opposite-action cases. We usedthese maps as masks, multiplying them point-wise by the similarity matrices and summingthe results. This gives us two values for eachneuron, a local (intraclip) similarity score anda global (interclip) similarity score. Both scoresare derived from comparisons of identicalframes in the two conditions, so any differencesshould be attributable to differences in context(motion in the correct direction versus the cor-
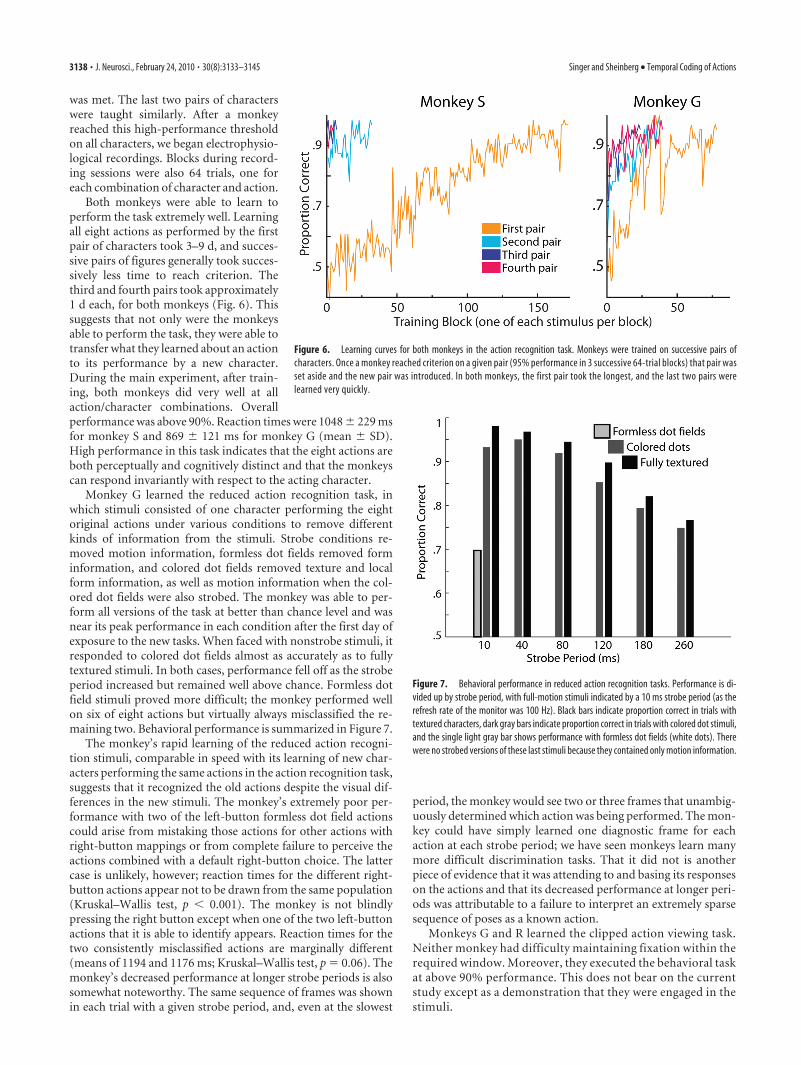
rect general sequence of poses). Figure 5 illustrates this process for oneexample cell, using trials with 300 ms clips.
ResultsLearning and behaviorMonkeys G and S learned the action recognition task; they werefirst trained with only two of the eight characters. After threeconsecutive 64-trial blocks with 95% or better performance,those characters were replaced with two new characters. Themonkey then trained on these two characters until the criterion
Figure 4. Masks relating identical frames of animation in same-action (top) and opposite-action (bottom) cases. Identical frames were shifted forward in time by 130 ms to account for latencyto the neurons from which we recorded, and the masks were blurred slightly. For each neuron, these masks were multiplied pointwise by the same-action and opposite-action similarity scorematrices, and the results were summed to give global and local similarity scores.
Figure 5. Calculation of local and global similarity scores for one sample neuron at 300 ms clip length. For the local similarityscore, the matrix of opposite-action similarity values for this neuron is calculated. This is then multiplied pointwise by the appro-priate mask, which selects only those pairs of times at which the same animation frame is driving both neurons. The values in theresulting matrix (most of which are 0 because of the mask) are summed, yielding the local similarity score. The global similarityscore is calculated with the same technique but starting with the similarity values from same-action trials and using a differentmask.
Singer and Sheinberg • Temporal Coding of Actions J. Neurosci., February 24, 2010 • 30(8):3133–3145 • 3137
was met. The last two pairs of characterswere taught similarly. After a monkeyreached this high-performance thresholdon all characters, we began electrophysio-logical recordings. Blocks during record-ing sessions were also 64 trials, one foreach combination of character and action.
Both monkeys were able to learn toperform the task extremely well. Learningall eight actions as performed by the firstpair of characters took 3–9 d, and succes-sive pairs of figures generally took succes-sively less time to reach criterion. Thethird and fourth pairs took approximately1 d each, for both monkeys (Fig. 6). Thissuggests that not only were the monkeysable to perform the task, they were able totransfer what they learned about an actionto its performance by a new character.During the main experiment, after train-ing, both monkeys did very well at allaction/character combinations. Overallperformance was above 90%. Reaction times were 1048 � 229 msfor monkey S and 869 � 121 ms for monkey G (mean � SD).High performance in this task indicates that the eight actions areboth perceptually and cognitively distinct and that the monkeyscan respond invariantly with respect to the acting character.
Monkey G learned the reduced action recognition task, inwhich stimuli consisted of one character performing the eightoriginal actions under various conditions to remove differentkinds of information from the stimuli. Strobe conditions re-moved motion information, formless dot fields removed forminformation, and colored dot fields removed texture and localform information, as well as motion information when the col-ored dot fields were also strobed. The monkey was able to per-form all versions of the task at better than chance level and wasnear its peak performance in each condition after the first day ofexposure to the new tasks. When faced with nonstrobe stimuli, itresponded to colored dot fields almost as accurately as to fullytextured stimuli. In both cases, performance fell off as the strobeperiod increased but remained well above chance. Formless dotfield stimuli proved more difficult; the monkey performed wellon six of eight actions but virtually always misclassified the re-maining two. Behavioral performance is summarized in Figure 7.
The monkey’s rapid learning of the reduced action recogni-tion stimuli, comparable in speed with its learning of new char-acters performing the same actions in the action recognition task,suggests that it recognized the old actions despite the visual dif-ferences in the new stimuli. The monkey’s extremely poor per-formance with two of the left-button formless dot field actionscould arise from mistaking those actions for other actions withright-button mappings or from complete failure to perceive theactions combined with a default right-button choice. The lattercase is unlikely, however; reaction times for the different right-button actions appear not to be drawn from the same population(Kruskal–Wallis test, p � 0.001). The monkey is not blindlypressing the right button except when one of the two left-buttonactions that it is able to identify appears. Reaction times for thetwo consistently misclassified actions are marginally different(means of 1194 and 1176 ms; Kruskal–Wallis test, p � 0.06). Themonkey’s decreased performance at longer strobe periods is alsosomewhat noteworthy. The same sequence of frames was shownin each trial with a given strobe period, and, even at the slowest
period, the monkey would see two or three frames that unambig-uously determined which action was being performed. The mon-key could have simply learned one diagnostic frame for eachaction at each strobe period; we have seen monkeys learn manymore difficult discrimination tasks. That it did not is anotherpiece of evidence that it was attending to and basing its responseson the actions and that its decreased performance at longer peri-ods was attributable to a failure to interpret an extremely sparsesequence of poses as a known action.
Monkeys G and R learned the clipped action viewing task.Neither monkey had difficulty maintaining fixation within therequired window. Moreover, they executed the behavioral taskat above 90% performance. This does not bear on the currentstudy except as a demonstration that they were engaged in thestimuli.
Figure 6. Learning curves for both monkeys in the action recognition task. Monkeys were trained on successive pairs ofcharacters. Once a monkey reached criterion on a given pair (95% performance in 3 successive 64-trial blocks) that pair wasset aside and the new pair was introduced. In both monkeys, the first pair took the longest, and the last two pairs werelearned very quickly.
Figure 7. Behavioral performance in reduced action recognition tasks. Performance is di-vided up by strobe period, with full-motion stimuli indicated by a 10 ms strobe period (as therefresh rate of the monitor was 100 Hz). Black bars indicate proportion correct in trials withtextured characters, dark gray bars indicate proportion correct in trials with colored dot stimuli,and the single light gray bar shows performance with formless dot fields (white dots). Therewere no strobed versions of these last stimuli because they contained only motion information.
3138 • J. Neurosci., February 24, 2010 • 30(8):3133–3145 Singer and Sheinberg • Temporal Coding of Actions
Neural responses in action recognition taskWe recorded from 107 units in monkey S and 69 in monkey G.We considered for additional analysis those cells for which thenumber of spikes in at least one of the two 600 ms windowsbetween 100 and 1300 ms after stimulus onset carried significantinformation about the stimuli. Significance was determined witha permutation test at the p � 0.05 level, using the mutual infor-mation between spike count and stimulus as the permuted statis-tic. We calculated mutual information using the algorithm for thecalculation of “Icount” with the classical debiaser as described byVictor (2002). This was done for both characters and actions,giving each cell four chances to pass the permutation test at anuncorrected p � 0.05 level. With this criterion in place, 55 cellsfrom monkey S and 50 from monkey G remained. Note that thisexcluded many cells that were visually responsive but did notdiscriminate between the stimuli we used.
Further breaking down the results of this permutation testalso reveals that we did not simply record from two differentpopulations of cells with response properties suited exclusivelyfor either character or action discrimination. In monkey G, 33 of50 units carried information about both action and character.This left only three that carried significant information aboutaction but no significant information about character and 14 thatcarried character but not action information. In monkey S, 18units carried significant information about both character andaction, leaving six that only discriminated between actions and 31that showed only character information.
The number of neurons that carried information only aboutaction was no greater than would be expected by chance, in linewith the idea that most cells in this region of the STS and IT are atleast somewhat responsive to form. Nevertheless, more than halfof all informative cells did carry information about actions. Al-though the majority of these neurons (considering both monkeystogether) were in the STS, many of the action-discriminative cellswere located in IT (and many of the action-discriminative STSneurons were in the lower bank of the STS, part of temporalcortex area TE).
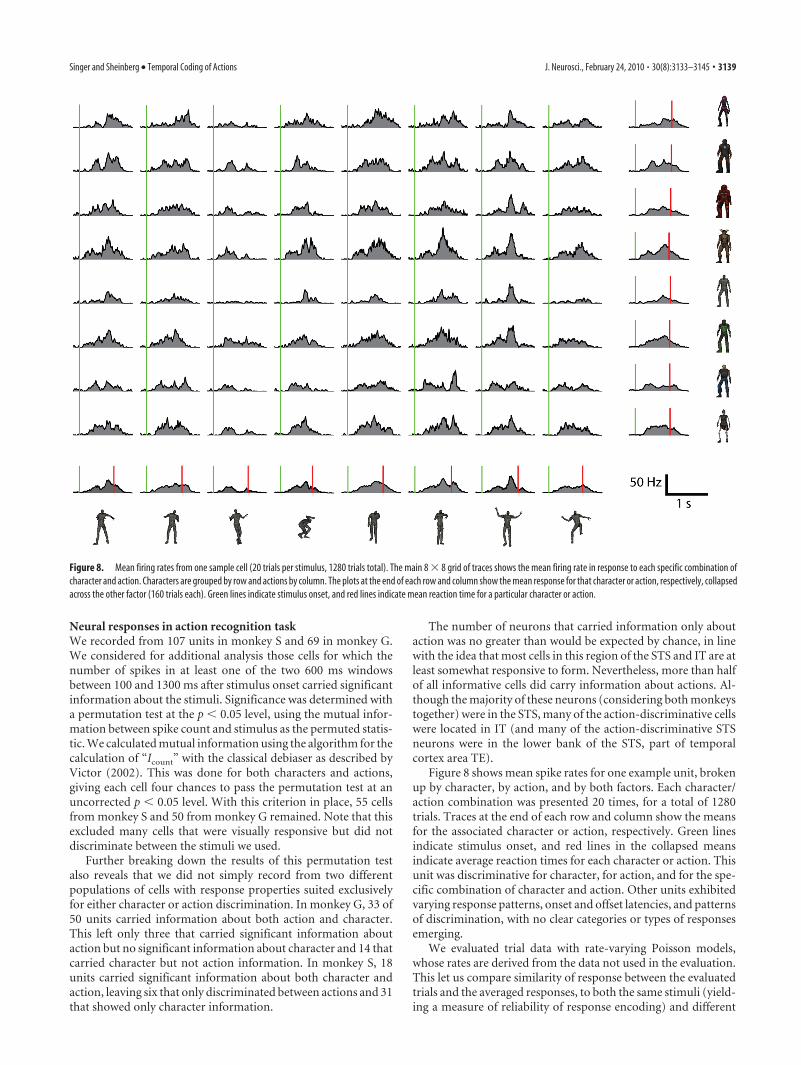
Figure 8 shows mean spike rates for one example unit, brokenup by character, by action, and by both factors. Each character/action combination was presented 20 times, for a total of 1280trials. Traces at the end of each row and column show the meansfor the associated character or action, respectively. Green linesindicate stimulus onset, and red lines in the collapsed meansindicate average reaction times for each character or action. Thisunit was discriminative for character, for action, and for the spe-cific combination of character and action. Other units exhibitedvarying response patterns, onset and offset latencies, and patternsof discrimination, with no clear categories or types of responsesemerging.
We evaluated trial data with rate-varying Poisson models,whose rates are derived from the data not used in the evaluation.This let us compare similarity of response between the evaluatedtrials and the averaged responses, to both the same stimuli (yield-ing a measure of reliability of response encoding) and different
Figure 8. Mean firing rates from one sample cell (20 trials per stimulus, 1280 trials total). The main 8 � 8 grid of traces shows the mean firing rate in response to each specific combination ofcharacter and action. Characters are grouped by row and actions by column. The plots at the end of each row and column show the mean response for that character or action, respectively, collapsedacross the other factor (160 trials each). Green lines indicate stimulus onset, and red lines indicate mean reaction time for a particular character or action.
Singer and Sheinberg • Temporal Coding of Actions J. Neurosci., February 24, 2010 • 30(8):3133–3145 • 3139
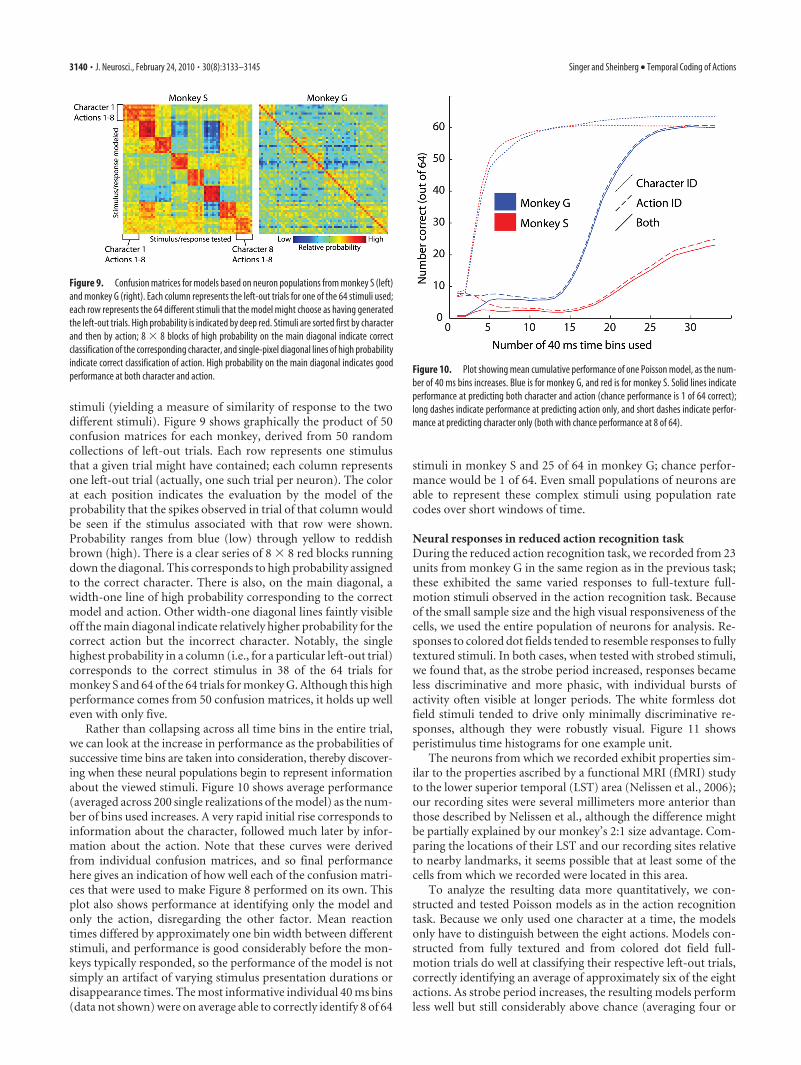
stimuli (yielding a measure of similarity of response to the twodifferent stimuli). Figure 9 shows graphically the product of 50confusion matrices for each monkey, derived from 50 randomcollections of left-out trials. Each row represents one stimulusthat a given trial might have contained; each column representsone left-out trial (actually, one such trial per neuron). The colorat each position indicates the evaluation by the model of theprobability that the spikes observed in trial of that column wouldbe seen if the stimulus associated with that row were shown.Probability ranges from blue (low) through yellow to reddishbrown (high). There is a clear series of 8 � 8 red blocks runningdown the diagonal. This corresponds to high probability assignedto the correct character. There is also, on the main diagonal, awidth-one line of high probability corresponding to the correctmodel and action. Other width-one diagonal lines faintly visibleoff the main diagonal indicate relatively higher probability for thecorrect action but the incorrect character. Notably, the singlehighest probability in a column (i.e., for a particular left-out trial)corresponds to the correct stimulus in 38 of the 64 trials formonkey S and 64 of the 64 trials for monkey G. Although this highperformance comes from 50 confusion matrices, it holds up welleven with only five.
Rather than collapsing across all time bins in the entire trial,we can look at the increase in performance as the probabilities ofsuccessive time bins are taken into consideration, thereby discover-ing when these neural populations begin to represent informationabout the viewed stimuli. Figure 10 shows average performance(averaged across 200 single realizations of the model) as the num-ber of bins used increases. A very rapid initial rise corresponds toinformation about the character, followed much later by infor-mation about the action. Note that these curves were derivedfrom individual confusion matrices, and so final performancehere gives an indication of how well each of the confusion matri-ces that were used to make Figure 8 performed on its own. Thisplot also shows performance at identifying only the model andonly the action, disregarding the other factor. Mean reactiontimes differed by approximately one bin width between differentstimuli, and performance is good considerably before the mon-keys typically responded, so the performance of the model is notsimply an artifact of varying stimulus presentation durations ordisappearance times. The most informative individual 40 ms bins(data not shown) were on average able to correctly identify 8 of 64
stimuli in monkey S and 25 of 64 in monkey G; chance perfor-mance would be 1 of 64. Even small populations of neurons areable to represent these complex stimuli using population ratecodes over short windows of time.
Neural responses in reduced action recognition taskDuring the reduced action recognition task, we recorded from 23units from monkey G in the same region as in the previous task;these exhibited the same varied responses to full-texture full-motion stimuli observed in the action recognition task. Becauseof the small sample size and the high visual responsiveness of thecells, we used the entire population of neurons for analysis. Re-sponses to colored dot fields tended to resemble responses to fullytextured stimuli. In both cases, when tested with strobed stimuli,we found that, as the strobe period increased, responses becameless discriminative and more phasic, with individual bursts ofactivity often visible at longer periods. The white formless dotfield stimuli tended to drive only minimally discriminative re-sponses, although they were robustly visual. Figure 11 showsperistimulus time histograms for one example unit.
The neurons from which we recorded exhibit properties sim-ilar to the properties ascribed by a functional MRI (fMRI) studyto the lower superior temporal (LST) area (Nelissen et al., 2006);our recording sites were several millimeters more anterior thanthose described by Nelissen et al., although the difference mightbe partially explained by our monkey’s 2:1 size advantage. Com-paring the locations of their LST and our recording sites relativeto nearby landmarks, it seems possible that at least some of thecells from which we recorded were located in this area.
To analyze the resulting data more quantitatively, we con-structed and tested Poisson models as in the action recognitiontask. Because we only used one character at a time, the modelsonly have to distinguish between the eight actions. Models con-structed from fully textured and from colored dot field full-motion trials do well at classifying their respective left-out trials,correctly identifying an average of approximately six of the eightactions. As strobe period increases, the resulting models performless well but still considerably above chance (averaging four or
Figure 9. Confusion matrices for models based on neuron populations from monkey S (left)and monkey G (right). Each column represents the left-out trials for one of the 64 stimuli used;each row represents the 64 different stimuli that the model might choose as having generatedthe left-out trials. High probability is indicated by deep red. Stimuli are sorted first by characterand then by action; 8 � 8 blocks of high probability on the main diagonal indicate correctclassification of the corresponding character, and single-pixel diagonal lines of high probabilityindicate correct classification of action. High probability on the main diagonal indicates goodperformance at both character and action.
Figure 10. Plot showing mean cumulative performance of one Poisson model, as the num-ber of 40 ms bins increases. Blue is for monkey G, and red is for monkey S. Solid lines indicateperformance at predicting both character and action (chance performance is 1 of 64 correct);long dashes indicate performance at predicting action only, and short dashes indicate perfor-mance at predicting character only (both with chance performance at 8 of 64).
3140 • J. Neurosci., February 24, 2010 • 30(8):3133–3145 Singer and Sheinberg • Temporal Coding of Actions
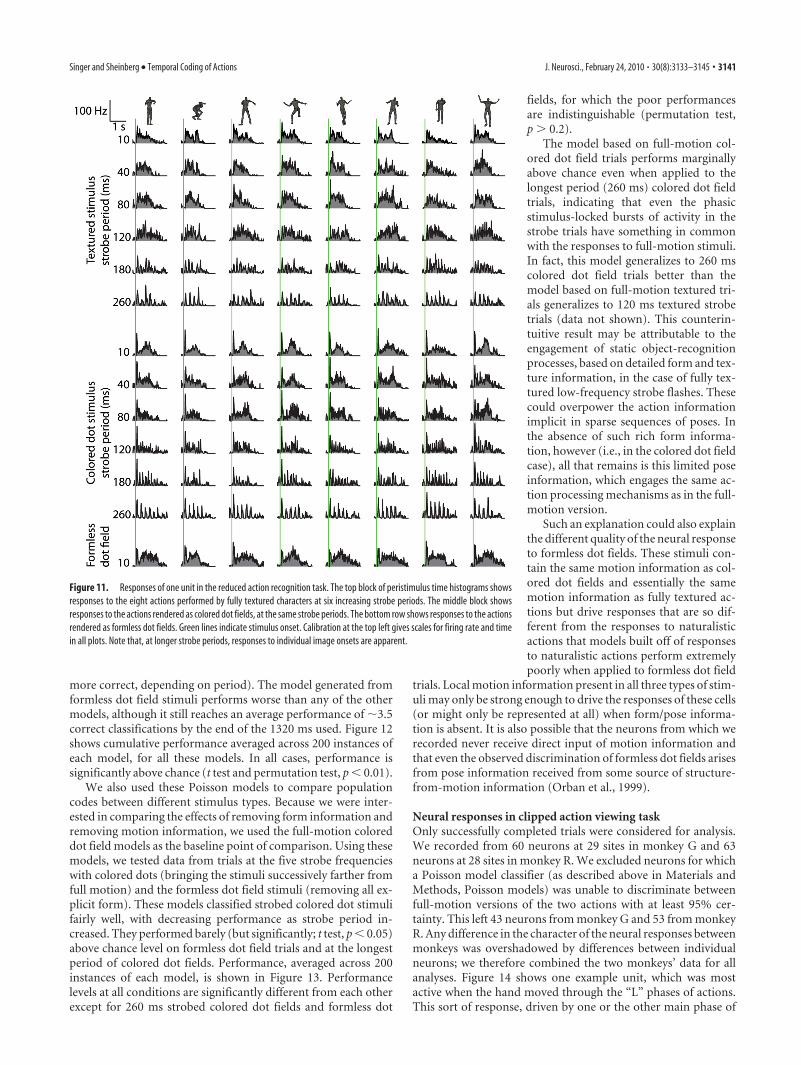
more correct, depending on period). The model generated fromformless dot field stimuli performs worse than any of the othermodels, although it still reaches an average performance of �3.5correct classifications by the end of the 1320 ms used. Figure 12shows cumulative performance averaged across 200 instances ofeach model, for all these models. In all cases, performance issignificantly above chance (t test and permutation test, p � 0.01).
We also used these Poisson models to compare populationcodes between different stimulus types. Because we were inter-ested in comparing the effects of removing form information andremoving motion information, we used the full-motion coloreddot field models as the baseline point of comparison. Using thesemodels, we tested data from trials at the five strobe frequencieswith colored dots (bringing the stimuli successively farther fromfull motion) and the formless dot field stimuli (removing all ex-plicit form). These models classified strobed colored dot stimulifairly well, with decreasing performance as strobe period in-creased. They performed barely (but significantly; t test, p � 0.05)above chance level on formless dot field trials and at the longestperiod of colored dot fields. Performance, averaged across 200instances of each model, is shown in Figure 13. Performancelevels at all conditions are significantly different from each otherexcept for 260 ms strobed colored dot fields and formless dot
fields, for which the poor performancesare indistinguishable (permutation test,p � 0.2).
The model based on full-motion col-ored dot field trials performs marginallyabove chance even when applied to thelongest period (260 ms) colored dot fieldtrials, indicating that even the phasicstimulus-locked bursts of activity in thestrobe trials have something in commonwith the responses to full-motion stimuli.In fact, this model generalizes to 260 mscolored dot field trials better than themodel based on full-motion textured tri-als generalizes to 120 ms textured strobetrials (data not shown). This counterin-tuitive result may be attributable to theengagement of static object-recognitionprocesses, based on detailed form and tex-ture information, in the case of fully tex-tured low-frequency strobe flashes. Thesecould overpower the action informationimplicit in sparse sequences of poses. Inthe absence of such rich form informa-tion, however (i.e., in the colored dot fieldcase), all that remains is this limited poseinformation, which engages the same ac-tion processing mechanisms as in the full-motion version.
Such an explanation could also explainthe different quality of the neural responseto formless dot fields. These stimuli con-tain the same motion information as col-ored dot fields and essentially the samemotion information as fully textured ac-tions but drive responses that are so dif-ferent from the responses to naturalisticactions that models built off of responsesto naturalistic actions perform extremelypoorly when applied to formless dot field
trials. Local motion information present in all three types of stim-uli may only be strong enough to drive the responses of these cells(or might only be represented at all) when form/pose informa-tion is absent. It is also possible that the neurons from which werecorded never receive direct input of motion information andthat even the observed discrimination of formless dot fields arisesfrom pose information received from some source of structure-from-motion information (Orban et al., 1999).
Neural responses in clipped action viewing taskOnly successfully completed trials were considered for analysis.We recorded from 60 neurons at 29 sites in monkey G and 63neurons at 28 sites in monkey R. We excluded neurons for whicha Poisson model classifier (as described above in Materials andMethods, Poisson models) was unable to discriminate betweenfull-motion versions of the two actions with at least 95% cer-tainty. This left 43 neurons from monkey G and 53 from monkeyR. Any difference in the character of the neural responses betweenmonkeys was overshadowed by differences between individualneurons; we therefore combined the two monkeys’ data for allanalyses. Figure 14 shows one example unit, which was mostactive when the hand moved through the “L” phases of actions.This sort of response, driven by one or the other main phase of
Figure 11. Responses of one unit in the reduced action recognition task. The top block of peristimulus time histograms showsresponses to the eight actions performed by fully textured characters at six increasing strobe periods. The middle block showsresponses to the actions rendered as colored dot fields, at the same strobe periods. The bottom row shows responses to the actionsrendered as formless dot fields. Green lines indicate stimulus onset. Calibration at the top left gives scales for firing rate and timein all plots. Note that, at longer strobe periods, responses to individual image onsets are apparent.
Singer and Sheinberg • Temporal Coding of Actions J. Neurosci., February 24, 2010 • 30(8):3133–3145 • 3141
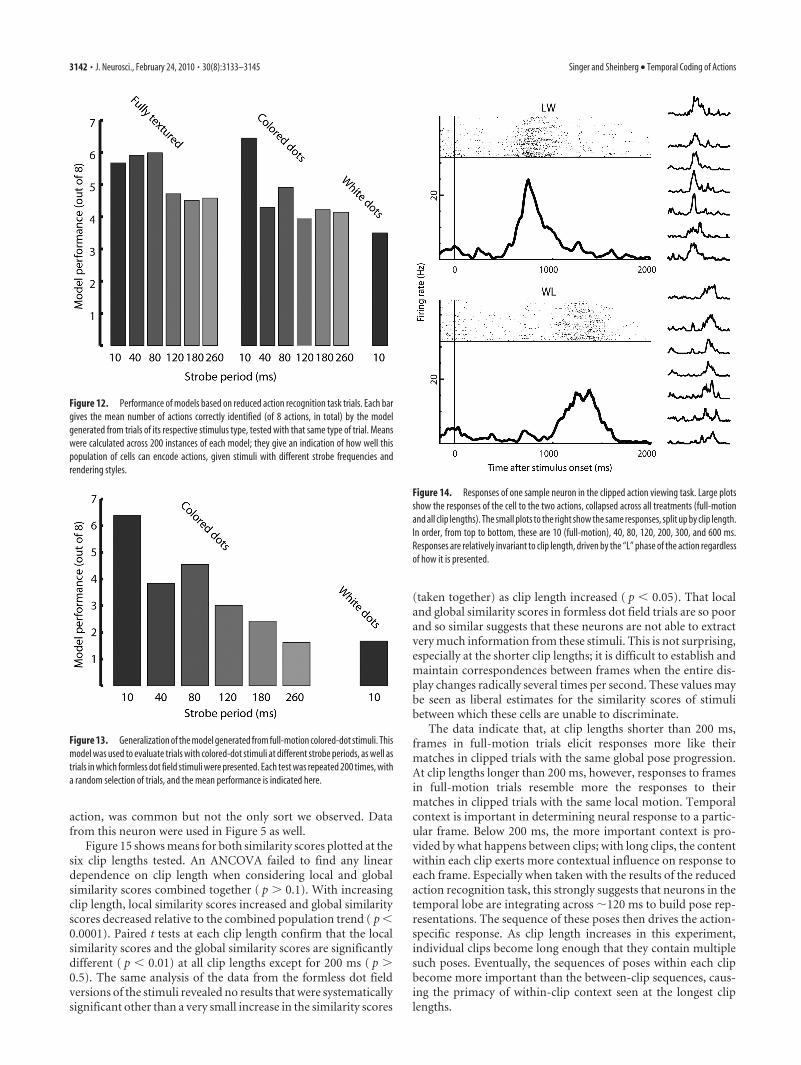
action, was common but not the only sort we observed. Datafrom this neuron were used in Figure 5 as well.
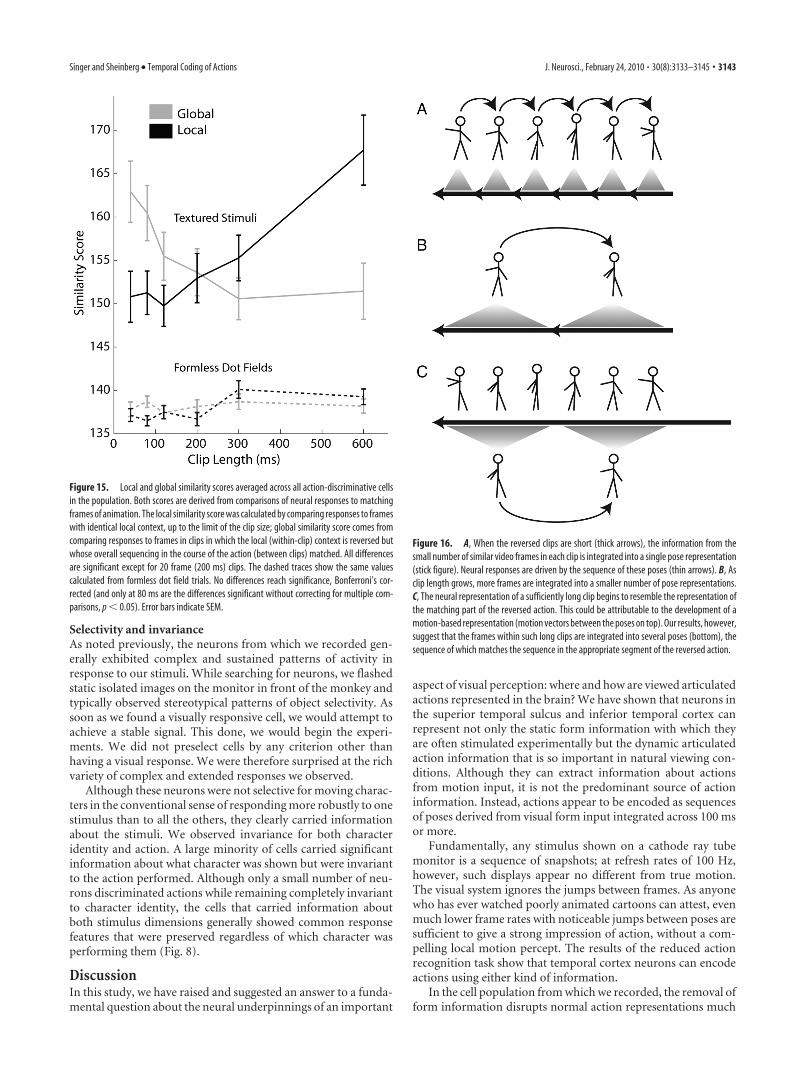
Figure 15 shows means for both similarity scores plotted at thesix clip lengths tested. An ANCOVA failed to find any lineardependence on clip length when considering local and globalsimilarity scores combined together ( p � 0.1). With increasingclip length, local similarity scores increased and global similarityscores decreased relative to the combined population trend ( p �0.0001). Paired t tests at each clip length confirm that the localsimilarity scores and the global similarity scores are significantlydifferent ( p � 0.01) at all clip lengths except for 200 ms ( p �0.5). The same analysis of the data from the formless dot fieldversions of the stimuli revealed no results that were systematicallysignificant other than a very small increase in the similarity scores
(taken together) as clip length increased ( p � 0.05). That localand global similarity scores in formless dot field trials are so poorand so similar suggests that these neurons are not able to extractvery much information from these stimuli. This is not surprising,especially at the shorter clip lengths; it is difficult to establish andmaintain correspondences between frames when the entire dis-play changes radically several times per second. These values maybe seen as liberal estimates for the similarity scores of stimulibetween which these cells are unable to discriminate.
The data indicate that, at clip lengths shorter than 200 ms,frames in full-motion trials elicit responses more like theirmatches in clipped trials with the same global pose progression.At clip lengths longer than 200 ms, however, responses to framesin full-motion trials resemble more the responses to theirmatches in clipped trials with the same local motion. Temporalcontext is important in determining neural response to a partic-ular frame. Below 200 ms, the more important context is pro-vided by what happens between clips; with long clips, the contentwithin each clip exerts more contextual influence on response toeach frame. Especially when taken with the results of the reducedaction recognition task, this strongly suggests that neurons in thetemporal lobe are integrating across �120 ms to build pose rep-resentations. The sequence of these poses then drives the action-specific response. As clip length increases in this experiment,individual clips become long enough that they contain multiplesuch poses. Eventually, the sequences of poses within each clipbecome more important than the between-clip sequences, caus-ing the primacy of within-clip context seen at the longest cliplengths.
Figure 12. Performance of models based on reduced action recognition task trials. Each bargives the mean number of actions correctly identified (of 8 actions, in total) by the modelgenerated from trials of its respective stimulus type, tested with that same type of trial. Meanswere calculated across 200 instances of each model; they give an indication of how well thispopulation of cells can encode actions, given stimuli with different strobe frequencies andrendering styles.
Figure 13. Generalization of the model generated from full-motion colored-dot stimuli. Thismodel was used to evaluate trials with colored-dot stimuli at different strobe periods, as well astrials in which formless dot field stimuli were presented. Each test was repeated 200 times, witha random selection of trials, and the mean performance is indicated here.
Figure 14. Responses of one sample neuron in the clipped action viewing task. Large plotsshow the responses of the cell to the two actions, collapsed across all treatments (full-motionand all clip lengths). The small plots to the right show the same responses, split up by clip length.In order, from top to bottom, these are 10 (full-motion), 40, 80, 120, 200, 300, and 600 ms.Responses are relatively invariant to clip length, driven by the “L” phase of the action regardlessof how it is presented.
3142 • J. Neurosci., February 24, 2010 • 30(8):3133–3145 Singer and Sheinberg • Temporal Coding of Actions
Selectivity and invarianceAs noted previously, the neurons from which we recorded gen-erally exhibited complex and sustained patterns of activity inresponse to our stimuli. While searching for neurons, we flashedstatic isolated images on the monitor in front of the monkey andtypically observed stereotypical patterns of object selectivity. Assoon as we found a visually responsive cell, we would attempt toachieve a stable signal. This done, we would begin the experi-ments. We did not preselect cells by any criterion other thanhaving a visual response. We were therefore surprised at the richvariety of complex and extended responses we observed.
Although these neurons were not selective for moving charac-ters in the conventional sense of responding more robustly to onestimulus than to all the others, they clearly carried informationabout the stimuli. We observed invariance for both characteridentity and action. A large minority of cells carried significantinformation about what character was shown but were invariantto the action performed. Although only a small number of neu-rons discriminated actions while remaining completely invariantto character identity, the cells that carried information aboutboth stimulus dimensions generally showed common responsefeatures that were preserved regardless of which character wasperforming them (Fig. 8).
DiscussionIn this study, we have raised and suggested an answer to a funda-mental question about the neural underpinnings of an important
aspect of visual perception: where and how are viewed articulatedactions represented in the brain? We have shown that neurons inthe superior temporal sulcus and inferior temporal cortex canrepresent not only the static form information with which theyare often stimulated experimentally but the dynamic articulatedaction information that is so important in natural viewing con-ditions. Although they can extract information about actionsfrom motion input, it is not the predominant source of actioninformation. Instead, actions appear to be encoded as sequencesof poses derived from visual form input integrated across 100 msor more.
Fundamentally, any stimulus shown on a cathode ray tubemonitor is a sequence of snapshots; at refresh rates of 100 Hz,however, such displays appear no different from true motion.The visual system ignores the jumps between frames. As anyonewho has ever watched poorly animated cartoons can attest, evenmuch lower frame rates with noticeable jumps between poses aresufficient to give a strong impression of action, without a com-pelling local motion percept. The results of the reduced actionrecognition task show that temporal cortex neurons can encodeactions using either kind of information.
In the cell population from which we recorded, the removal ofform information disrupts normal action representations much
Figure 16. A, When the reversed clips are short (thick arrows), the information from thesmall number of similar video frames in each clip is integrated into a single pose representation(stick figure). Neural responses are driven by the sequence of these poses (thin arrows). B, Asclip length grows, more frames are integrated into a smaller number of pose representations.C, The neural representation of a sufficiently long clip begins to resemble the representation ofthe matching part of the reversed action. This could be attributable to the development of amotion-based representation (motion vectors between the poses on top). Our results, however,suggest that the frames within such long clips are integrated into several poses (bottom), thesequence of which matches the sequence in the appropriate segment of the reversed action.
Figure 15. Local and global similarity scores averaged across all action-discriminative cellsin the population. Both scores are derived from comparisons of neural responses to matchingframes of animation. The local similarity score was calculated by comparing responses to frameswith identical local context, up to the limit of the clip size; global similarity score comes fromcomparing responses to frames in clips in which the local (within-clip) context is reversed butwhose overall sequencing in the course of the action (between clips) matched. All differencesare significant except for 20 frame (200 ms) clips. The dashed traces show the same valuescalculated from formless dot field trials. No differences reach significance, Bonferroni’s cor-rected (and only at 80 ms are the differences significant without correcting for multiple com-parisons, p � 0.05). Error bars indicate SEM.
Singer and Sheinberg • Temporal Coding of Actions J. Neurosci., February 24, 2010 • 30(8):3133–3145 • 3143
more than the removal of motion information (Fig. 12). Thissuggests that action representations are based more on form in-formation, when both are available. These neurons were able toextract as much information about action from two or three staticframes as they were from full-motion information in the absenceof form cues. Moreover, the responses of neurons under all butthe slowest strobe conditions were much more similar to how theneurons responded under natural viewing conditions than wereresponses to formless (but full-motion) dot fields (Fig. 13). Thisis in accord with recent fMRI evidence: Peelen et al. (2006) foundcorrelations in fMRI signal between selectivity for biological mo-tion and selectivity for bodies, but not selectivity for motion, inevery brain region they considered. The neurons from which werecorded certainly carry information about action: at least 0.1 bitper neuron over the course of less than 1 s of animation, based onthe ability of our simple model to discriminate actions. We haveno way of knowing whether the cell populations we examined arenormally necessary for biological motion perception; however, astudy of human lesions showed that loss of tissue in the superiortemporal gyrus, superior temporal sulcus, and middle temporal gy-rus (along with frontal and supramarginal cortex) was implicated insignificant biological motion perception deficits (Saygin, 2007).
Previous fMRI (Nelissen et al., 2006) and single-neuron(Vangeneugden et al., 2009) recordings have suggested that var-ious regions of temporal cortex respond and adapt differently todifferent aspects of moving stimuli. However, we could not findany correlations between recording location and any of our mu-tual information measures in either monkey in the action recog-nition task. Although this might be explained by imprecision inlocating the neurons from which we recorded, our stimuli weremore complex than those used in previous experiments. The re-sponse patterns we observed were also more complex than thosepreviously reported, and, in fact, most visual neurons that weencountered were well driven by most of the stimuli we used. Itwould not be surprising if a larger input space were mapped ontoa larger region of representation space, that is, cortex. Without ahistological study (which is not possible because the monkeys arestill involved in other experiments), we have no way of distin-guishing between these possibilities.
At timescales shorter than 200 ms, the temporal direction oflocal motion in the clipped action viewing task is less importantto driving responses than the more global sequence of poses (Fig.15). In other words, the neurons are driven more by what hap-pens from clip to clip than they are by what happens within a clip.For animation clips longer than 200 ms, however, this reverses;the direction in which each clip plays exerts more influence onthe responses of the neurons than does the order in which theclips play.
This result can be viewed as a measure of the timescale ofintegration (into a single pose) versus differentiation (betweenposes). Short clips are integrated into single elements, in terms oftheir representational power, whereas longer clips are differenti-ated into multiple pieces. The shift occurs as clips grow from 120to 300 ms. Effectively, increasing clip length decreases the framerate of the original action and increases the “actionhood” of theindividual clips, which shift from being interpreted as poses tosegments of the opposite action (Fig. 16). This result can also beunderstood from the perspective of the influence of recent input(that is, context or history) on neural response. The history lead-ing up to a single frame of animation influences the response thatframe elicits; this influence appears to span 120 –200 ms.
The idea of a neural window of pose integration fits well withmany previous behavioral studies. Face parts are integrated into a
holistic face percept when presented with interstimulus intervalsas long as 120 ms (Singer and Sheinberg, 2006) or even 200 ms(Anaki et al., 2007). Caudek et al. (2002) found that three-dimensional motions can be determined by three dots presentedsequentially for 182 ms each. EEG event-related potentials ex-hibit a characteristic component (putatively reflecting a break inintegration) when one element of a rapidly presented visual se-quence is omitted, as long as the period is faster than 180 ms(Czigler et al., 2006). Blake and Lee (2005) survey numerousother experiments, many of which show windows of integrationin the range of 100 –200 ms.
Although these results strongly suggest that ventral streamneurons in the temporal cortex represent actions as sequences ofposes, there is still much to understand about action recognition.Motion information clearly does reach these neurons; could thisbe an epiphenomenon of form extracted from motion (Orban etal., 1999)? It is also not clear whether this pose-based temporallobe representation is the primary visual representation of com-plex motions; neurons in frontal and parietal cortices, includingmirror neurons (Rizzolatti and Craighero, 2004), also respond toviewed actions. Although there may be dorsal stream neuronsselective for complex patterns of motion, they are typically de-scribed as selective for relatively simple patterns compatible withrigid object motion (Orban et al., 1992), as well as for three-dimensional depth derived from disparity (DeAngelis et al.,1998) or parallax (Nadler et al., 2008). The results presented hereare compatible with a model of visual function in which the lo-cations of the objects and changes in location are represented bythe dorsal stream, whereas their shapes, and changes in thoseshapes, are represented by ventral stream neurons, updated sev-eral times per second.
ReferencesAnaki D, Boyd J, Moscovitch M (2007) Temporal integration in face per-
ception: evidence of configural processing of temporally separated faceparts. J Exp Psychol Hum Percept Perform 33:1–19.
Anderson B, Sanderson MI, Sheinberg DL (2007) Joint decoding of visualstimuli by IT neurons’ spike counts is not improved by simultaneousrecording. Exp Brain Res 176:1–11.
Baizer JS, Ungerleider LG, Desimone R (1991) Organization of visual inputsto the inferior temporal and posterior parietal cortex in macaques. J Neu-rosci 11:168 –190.
Beauchamp MS, Lee KE, Haxby JV, Martin A (2003) fMRI responses tovideo and point-light displays of moving humans and manipulable ob-jects. J Cogn Neurosci 15:991–1001.
Blake R, Lee SH (2005) The role of temporal structure in human vision.Behav Cogn Neurosci Rev 4:21– 42.
Bruce C, Desimone R, Gross CG (1981) Visual properties of neurons in apolysensory area in superior temporal sulcus of the macaque. J Neuro-physiol 46:369 –384.
Caudek C, Domini F, Di Luca M (2002) Short-term temporal recruitmentin structure from motion. Vision Res 42:1213–1223.
Czigler I, Winkler I, Pato L, Varnagy A, Weisz J, Balazs L (2006) Visualtemporal window of integration as revealed by the visual mismatch neg-ativity event-related potential to stimulus omissions. Brain Res1104:129 –140.
DeAngelis GC, Cumming BG, Newsome WT (1998) Cortical area MT andthe perception of stereoscopic depth. Nature 394:677– 680.
Downing PE, Jiang Y, Shuman M, Kanwisher N (2001) A cortical area selec-tive for visual processing of the human body. Science 293:2470 –2473.
Gross CG, Rocha-Miranda CE, Bender DB (1972) Visual properties of neu-rons in inferotemporal cortex of the macaque. J Neurophysiol 35:96 –111.
Grossman E, Donnelly M, Price R, Pickens D, Morgan V, Neighbor G, BlakeR (2000) Brain areas involved in perception of biological motion. J CognNeurosci 12:711–720.
Jellema T, Perrett DI (2003) Cells in monkey STS responsive to articulatedbody motions and consequent static posture: a case of implied motion?Neuropsychologia 41:1728 –1737.
3144 • J. Neurosci., February 24, 2010 • 30(8):3133–3145 Singer and Sheinberg • Temporal Coding of Actions

Jellema T, Maassen G, Perrett DI (2004) Single cell integration of animateform, motion and location in the superior temporal cortex of the ma-caque monkey. Cereb Cortex 14:781–790.
Johansson G (1973) Visual perception of biological motion and a model forits analysis. Percept Psychophys 14:201–211.
Nadler JW, Angelaki DE, DeAngelis GC (2008) A neural representation ofdepth from motion parallax in macaque visual cortex. Nature 452:642–645.
Nelissen K, Vanduffel W, Orban GA (2006) Charting the lower superiortemporal region, a new motion-sensitive region in monkey superior tem-poral sulcus. J Neurosci 26:5929 –5947.
Oram MW, Perrett DI (1996) Integration of form and motion in the ante-rior superior temporal polysensory area (STPa) of the macaque monkey.J Neurophysiol 76:109 –129.
Orban GA, Lagae L, Verri A, Raiguel S, Xiao D, Maes H, Torre V (1992)First-order analysis of optical flow in monkey brain. Proc Natl Acad SciU S A 89:2595–2599.
Orban GA, Sunaert S, Todd JT, Van Hecke P, Marchal G (1999) Humancortical regions involved in extracting depth from motion. Neuron24:929 –940.
Paxinos G, Huang XF, Toga AW (2000) The rhesus monkey brain in stereo-taxic coordinates. San Diego: Academic.
Peelen MV, Wiggett AJ, Downing PE (2006) Patterns of fMRI activity dis-sociate overlapping functional brain areas that respond to biological mo-tion. Neuron 49:815– 822.
Perrett DI, Smith PA, Mistlin AJ, Chitty AJ, Head AS, Potter DD, Broenni-mann R, Milner AD, Jeeves MA (1985) Visual analysis of body move-
ments by neurones in the temporal cortex of the macaque monkey: apreliminary report. Behav Brain Res 16:153–170.
Quiroga RQ, Nadasdy Z, Ben-Shaul Y (2004) Unsupervised spike detectionand sorting with wavelets and superparamagnetic clustering. NeuralComput 16:1661–1687.
Rizzolatti G, Craighero L (2004) The mirror-neuron system. Annu RevNeurosci 27:169 –192.
Saleem KS, Logothetis NK (2006) A combined MRI and histology atlas ofthe rhesus monkey brain in stereotaxic coordinates, Ed 1. Boston:Elsevier.
Saygin AP (2007) Superior temporal and premotor brain areas necessary forbiological motion perception. Brain 130:2452–2461.
Singer JM, Sheinberg DL (2006) Holistic processing unites face parts acrosstime. Vision Res 46:1838 –1847.
Singer JM, Sheinberg DL (2008) A method for the realtime rendering offormless dot field structure-from-motion stimuli. J Vis 8:8.1– 8.8.
Treisman AM, Gelade G (1980) A feature-integration theory of attention.Cognit Psychol 12:97–136.
Ungerleider LG, Mishkin M (1982) Two cortical visual systems. In: Analysisof visual behavior (Ingle DJ, Goodale MA, Mansfield RJW, eds), pp 549 –586. Cambridge, MA: Massachusetts Institute of Technology.
Vangeneugden J, Pollick F, Vogels R (2009) Functional differentiation ofmacaque visual temporal cortical neurons using a parametric actionspace. Cereb Cortex 19:593– 611.
Victor JD (2002) Binless strategies for estimation of information from neu-ral data. Phys Rev E Stat Nonlin Soft Matter Phys 66:051903.
Wu DA, Kanai R, Shimojo S (2004) Vision: steady-state misbinding of co-lour and motion. Nature 429:262.
Singer and Sheinberg • Temporal Coding of Actions J. Neurosci., February 24, 2010 • 30(8):3133–3145 • 3145


![Behavioral/Systems/Cognitive ... · Behavioral/Systems/Cognitive AcuteCocaineInducesFastActivationofD1Receptorand ProgressiveDeactivationofD2ReceptorStriatalNeurons: InVivoOpticalMicroprobe[Ca2]](https://img.dokumen.tips/doc/110x75/6013f75e26e57852b94803cb/behavioralsystemscognitive-behavioralsystemscognitive-acutecocaineinducesfastactivationofd1receptorand.jpg)