Embed Size (px)
Citation preview
Journal of Colloid and Interface Science 404 (2013) 215–222
Contents lists available at SciVerse ScienceDirect
Journal of Colloid and Interface Science
www.elsevier .com/locate / jc is
Behavior of vitamin E acetate delivery systems under simulatedgastrointestinal conditions: Lipid digestion and bioaccessibilityof low-energy nanoemulsions
0021-9797/$ - see front matter � 2013 Elsevier Inc. All rights reserved.http://dx.doi.org/10.1016/j.jcis.2013.04.048
⇑ Corresponding author. Fax: +1 (413) 545 1262.E-mail address: [email protected] (D.J. McClements).
Sinja Mayer a, Jochen Weiss a, David Julian McClements b,⇑a Department of Food Physics and Meat Science, Institute of Food Science and Biotechnology, University of Hohenheim, 70599 Stuttgart, Germanyb Biopolymers and Colloids Research Laboratory, Department of Food Science, University of Massachusetts, Amherst, MA 01003, USA
a r t i c l e i n f o a b s t r a c t
Article history:Received 5 March 2013Accepted 26 April 2013Available online 9 May 2013
Keywords:NanoemulsionVitamin EDigestionBioaccessibilityLow energy methodsEmulsion phase inversionHigh energy methodsMicrofluidization
Colloidal delivery systems are needed to incorporate oil-soluble vitamins into aqueous-based foods andbeverage products. In this study, we encapsulated vitamin E acetate into oil-in-water nanoemulsions pro-duced using either a low-energy method (Emulsion Phase Inversion, EPI) or a high energy method (micro-fluidization). Oil-in-water nanoemulsions (d < 200 nm) could be produced using both low- and high-energy methods from a non-ionic surfactant (Tween 80) and medium chain triglycerides (MCTs). Theinfluence of surfactant-to-oil ratio (SOR) on lipid digestion and vitamin bioaccessibility of EPI nanoemul-sions was determined using a gastrointestinal tract (GIT) model that simulated the mouth, stomach, andsmall intestine. There were increases in the size and negative charge of the oil droplets after passagethrough the GIT, which was attributed to droplet coalescence and changes in interfacial composition.The rate and extent of lipid digestion decreased with increasing surfactant concentration, but the bioac-cessibility of vitamin E acetate was high in all of the samples (>95%). No appreciable influence of thepreparation method (low-energy versus high-energy) on lipid digestion and vitamin bioaccessibilitywas observed. The major advantage of the EPI method for forming nanoemulsions is that no expensiveequipment is required, but relatively high surfactant concentrations are needed compared tomicrofluidization.
� 2013 Elsevier Inc. All rights reserved.
1. Introduction
The term ‘‘vitamin E’’ is used to refer to a group of oil-solublecompounds with related molecular and biological characteristics,with a-tocopherol being the most abundant and bioactive form[1–4]. Foods and beverages are increasingly being fortified withvitamin E due to its high antioxidant activity and potential healthbenefits [1,4,5]. Vitamin E (a-tocopherol) is highly susceptible tooxidation and therefore it is usually incorporated into food, phar-maceutical, and cosmetic products in its more chemically stableesterified form (a-tocopherol acetate) [6,7]. Vitamin E acetate isconverted into vitamin E within the human body after ingestion[8–10]. Vitamin E acetate is a highly lipophilic molecule with alow water-solubility, and therefore suitable delivery systems areneeded to incorporate it into aqueous-based products [11,12].
Nanoemulsions are particularly suitable for the encapsulationand delivery of highly lipophilic components [13,14]. Nanoemul-sions (r < 100 nm) have several advantages over conventionalemulsions (r > 100 nm) for this purpose. Conventional emulsions
tend to be turbid because they contain droplets that have dimen-sions similar to the wavelength of light and therefore scatter lightwaves strongly [15,16]. Conversely, nanoemulsions tend to be clearor only slightly turbid because the droplets are so small that theyonly scatter light waves weakly [15–18]. Consequently, nanoemul-sions are particularly suitable for applications where lipophiliccomponents need to be incorporated into transparent food andbeverage products [14]. The small size of the droplets in nano-emulsions also improves their stability to gravitational separationand droplet aggregation, which increases the shelf-life of commer-cial products [15,19–21].
Any delivery system designed to encapsulate and protect a bio-active component within a food or beverage product should beable to release it within the gastrointestinal tract (GIT) after inges-tion [22]. Researchers have reported that nanoemulsions can im-prove the oral bioavailability of lipophilic components because oftheir small particle size [21,23–26]. A number of physicochemicaland physiological events determine the bioavailability of ingestedoil-soluble vitamins. After ingestion, vitamin E should be releasedfrom the food matrix and then solubilized within mixed micellesformed by bile salts and phospholipids, as well as any free fattyacids and monoacylglycerols resulting from lipid digestion, before
216 S. Mayer et al. / Journal of Colloid and Interface Science 404 (2013) 215–222
being transported to the epithelium cells where absorption occurs[22,27,28]. It is therefore important to understand how deliverysystem characteristics impact these processes.
There are two main approaches available to fabricate oil-in-water nanoemulsions: high-energy and low-energy methods[15,29]. High-energy methods use mechanical devices that gener-ate intense disruptive forces that break up and intermingle the oiland water phases e.g., high speed mixers, high pressure valvehomogenizers, microfluidizers, and ultrasonicators [17,30,31].Low-energy methods rely on the spontaneous formation of oildroplets in surfactant–oil–water mixtures under certain systemconditions [32,33]. Low-energy methods have a number of poten-tial advantages over high-energy methods: reduced equipmentand operating costs; high energy efficiency; and, simplicity ofimplementation [15,33]. On the other hand, they usually requireconsiderable higher amounts of surfactant than high energymethods [32,33]. Low-energy methods can be subdivided into anumber of types depending on their mode of operation: sponta-neous emulsification (SE); phase inversion temperature (PIT);phase inversion composition (PIC); and Emulsion Phase Inversion(EPI) [18].
In this study, we focused on the EPI method, which simply in-volves titrating an aqueous phase into an organic phase containinga mixture of oil(s) and hydrophilic surfactant [32,34,35]. Initially, awater-in-oil emulsion is formed when water is first titrated intothe organic phase. Then a multiple emulsion, and then an oil-in-water emulsion is formed. Under appropriate conditions, thismethod can lead to the formation of stable oil-in-water nanoemul-sions. We used the EPI method to form nanoemulsion-based deliv-ery systems for vitamin E acetate. Our main objective was toexamine the influence of surfactant-to-oil ratio (SOR) on lipiddigestion and vitamin bioaccessibility. Consequently, changes innanoemulsion properties were measured when they were passedthrough a gastrointestinal tract (GIT) model that simulated mouth,stomach, and small intestine conditions [36]. We also comparedthe influence of homogenization method (high energy versus lowenergy method) on lipid digestion and vitamin bioaccessibility.This study should provide information that will facilitate the ra-tional design of nanoemulsion-based delivery systems for oil-solu-ble vitamins.
2. Materials and methods
2.1. Materials
Medium chain triglycerides (MCT, Miglyol 812) were obtainedfrom Warner Graham (Cockeysville, MD). Tween 80, lipase (fromporcine pancreas) and bile extract (porcine) were purchased fromSigma–Aldrich (St. Louis, MO). Vitamin E acetate (VE) was kindlydonated by BASF (Ludwigshafen, Germany). Citric buffer was usedfor the aqueous phase of the emulsions, and consisted of 0.8 wt%citric acid and 0.08 wt% sodium benzoate adjusted to pH 3.0 (Sig-ma–Aldrich, St. Louis, MO). All other chemicals used were of ana-lytical grade. Double distilled water was used to prepare allsolutions and emulsions.
2.2. Methods
2.2.1. Emulsion preparation2.2.1.1. Low-energy method: Emulsion phase inversion. The organicphase (MCT, Tween 80, and VE) was stirred for 30 min on a stirplate (500 rpm) at ambient temperature. Then the water phase(citric buffer, pH 3) was titrated into the oil phase with constantstirring (500 rpm) with a flow rate of approximately 20 drops per10 s using a burette.
2.2.1.2. High-energy method: Microfluidization. MCT, Tween 80, VEand citric buffer were blended together for 2 min using a high-shear mixer (Barmix, Biospec Products, Bartlesville, OK). The coarseemulsions formed were then passed four times through a microflu-idizer (M-110L, Microfluidcs, Newton, MA) at 12,000 psi.
2.2.2. Emulsion characterizationThe particle size distribution and electrical charge (f-potential)
of the samples were measured before exposure to the GIT model,and after each individual stage of the GIT model (mouth, stomachand small intestine). Particle size distributions were monitoredusing a static light scattering instrument (Mastersizer 2000, Mal-vern Instruments Ltd., Malvern, Worcestershire, UK). Samples werediluted with appropriate buffer solutions prior to analysis to avoidmultiple scattering effects: initial – citrate buffer solution (pH 3);mouth – simulated saliva fluid without mucin (pH 6.8); stomach– simulated gastric fluid (pH 2.5); small intestine – phosphate buf-fer solution (pH 7). Mean particle diameters were reported as thesurface-weighted mean diameter (d32). Samples containing20 wt% Tween 80 contained particles that were too small to detectby static light scattering and so they were analyzed using a dy-namic light scattering instrument (Zetasizer Nano ZS, MalvernInstruments, Malvern, UK). Samples were diluted in appropriatebuffer solutions. The mean particle size from dynamic light scatter-ing is reported as the intensity weighted (‘‘Z-average’’) diameter.
The electrical charge (f-potential) was measured using electro-phoretic mobility measurements (Zetasizer Nano ZS, MalvernInstruments, Malvern, UK). Samples were diluted using appropri-ate buffer solutions (1:10) and placed in a clear disposable cell.Samples were equilibrated for 60 s in the instrument (25 �C) beforethey were measured using 10–100 runs per analysis.
Optical microscopy was used to study the microstructure of se-lected samples (Nikon Eclipse E400, Nikon Corp., Tokyo, Japan)with a 60 � oil immersion objective lens. An aliquot of samplewas put on a microscope slide and then covered by a coverslip.An image of the sample was taken and stored using digital imageprocessing software (Micro Video Instruments Inc., Avon, MA) [37].
2.2.3. Simulated gastrointestinal tract modelA three-stage gastrointestinal tract (GIT) model consisting of a
mouth, a gastric, and a small intestinal phase was used to deter-mine the potential biological fate of the vitamin nanoemulsions.
2.2.3.1. Mouth phase. Five milliliter of simulated saliva fluid (SSF)was added to 5 mL of sample, so that the final mixture contained2 wt% MCT. The mixture was adjusted to pH 6.8 and put in an incu-bator (37 �C, 100 rpm) for 10 min (Innova Incubator Shaker, Model4080, New Brunswick Scientific, New Jersey, USA). The SSF con-tained mucin and various salts and was prepared according to aprevious study [38].
2.2.3.2. Gastric phase. Simulated gastric fluid (SGF) was added tothe ‘‘bolus’’ sample (1:1) from the mouth phase, so that the mix-ture contained 1 wt% MCT. The pH was adjusted to pH 2.5 andthe final mixture was incubated for 2 h (37 �C, 100 rpm). SGF con-tained NaCl and HCl (pH 1.2) and was prepared according to amethod described previously [39].
2.2.3.3. Small intestinal phase. Thirty milliliter of sample from thegastric phase was incubated in a water bath (37 �C) for 10 min(Heated Recirculating Bath Neslab EX-10, Thermo Scientific). ThepH was adjusted to 7.0 and then 4 mL of bile extract solution(187.5 mg bile extract in 4 ml phosphate buffer, pH 7) and 1 mLof calcium chloride solution (110 mg CaCl2 in 1 ml phosphate buf-fer, pH 7) was added. The solution was re-adjusted to pH 7.0 priorto enzyme addition. 2.5 mL of freshly prepared lipase solution
S. Mayer et al. / Journal of Colloid and Interface Science 404 (2013) 215–222 217
(60 mg lipase in 2.5 ml phosphate buffer pH 7) was added. Fromthis point, the pH stat instrument (Metrohm, USA Inc.) maintaineda constant pH (pH 7.0) by adding NaOH solution (0.25 M) to neu-tralize any released free fatty acids (FFAs) from lipid digestion.The volume of NaOH (0.25 M) added to the emulsion was recordedand used to calculate the concentration of free fatty acids gener-ated by lipolysis. The amount of free fatty acids released was calcu-lated using the following equations:
Vmax ¼ 2� moil
MWoil� 1000
CNaOH
� �ð1Þ
%FFA Released ¼ ðVexp=VmaxÞ � 100 ð2Þ
Here, moil is the total mass of oil present in the reaction vessel (g),MWoil is the molecular weight of the oil (g per mol), CNaOH is theconcentration of sodium hydroxide in the titration burette (molper 1000 cm3), and Vmax is the calculated volume of NaOH that mustbe titrated into the reaction vessel to neutralize the FFAs releasedassuming that all the triacylglycerols are converted into two freefatty acids and one monogylceride. Vexp is the actual volume ofNaOH titrated into the reaction vessel to neutralize the FFA releasedduring the experiment. A molecular weight of MCT of 500 g per molwas used in the calculation of FFA released.
2.2.4. Vitamin E acetate bioaccessibilityThe bioaccessibility of vitamin E acetate (VE) was determined
after the sample had been passed through the entire GIT model.We used an organic solvent mixture of isooctane (HPLC Grade,Fisher scientific) and reagent alcohol (HLPC grade, Fisher scientific)with a ratio of 3:1 to extract the vitamin E acetate.
2.2.4.1. Raw digesta. Five milliliter solvent (isooctane: ethanol; 3:1)was added to 1 ml of raw digesta. The samples were vortexed(Vortex Genie 2, Scientific Industries) for 2 min and then centri-fuged for 10 min (1750 rpm, 25 �C) (CL10 centrifuge, ThermoScientific).
2.2.4.2. Micelle phase. Ten milliliter of each sample was centrifuged(4000 rpm, 25 �C) for 40 min. The phase over the sediment was as-sumed to be the ‘‘micelle’’ fraction in which the vitamin E acetatewas solubilized. 1 ml of the micelle phase was mixed with 5 ml sol-vent, vortexed and centrifuged for 10 min at 1750 rpm.
The resulting samples were analyzed spectrophotometrically(Ultraspec 3000 pro, GE Health Sciences, USA) at 295 nm usingquartz glass cuvettes (QS-284; 10 mm). A cuvette containing pureisooctane was used as reference. A calibration curve of absorbanceversus vitamin E acetate concentration in the solvent was prepared.The bioaccessibility was then calculated using the followingequation:
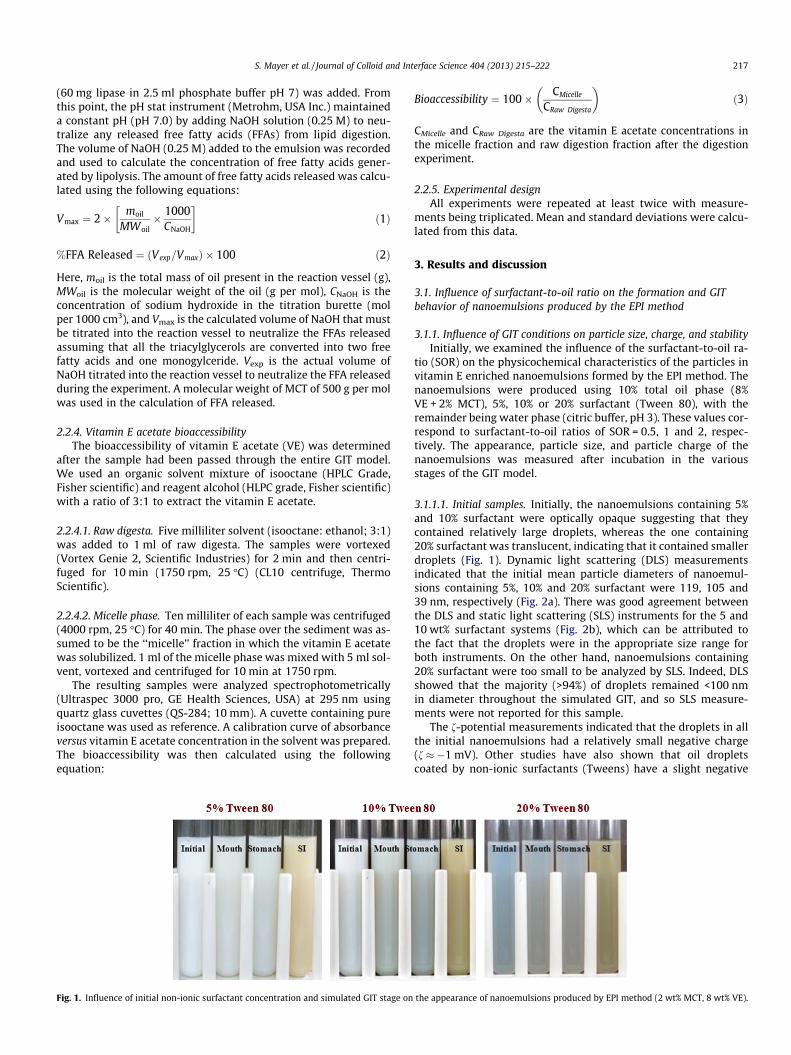
Fig. 1. Influence of initial non-ionic surfactant concentration and simulated GIT stage on
Bioaccessibility ¼ 100� CMicelle
CRaw Digesta
� �ð3Þ
CMicelle and CRaw Digesta are the vitamin E acetate concentrations inthe micelle fraction and raw digestion fraction after the digestionexperiment.
2.2.5. Experimental designAll experiments were repeated at least twice with measure-
ments being triplicated. Mean and standard deviations were calcu-lated from this data.
3. Results and discussion
3.1. Influence of surfactant-to-oil ratio on the formation and GITbehavior of nanoemulsions produced by the EPI method
3.1.1. Influence of GIT conditions on particle size, charge, and stabilityInitially, we examined the influence of the surfactant-to-oil ra-
tio (SOR) on the physicochemical characteristics of the particles invitamin E enriched nanoemulsions formed by the EPI method. Thenanoemulsions were produced using 10% total oil phase (8%VE + 2% MCT), 5%, 10% or 20% surfactant (Tween 80), with theremainder being water phase (citric buffer, pH 3). These values cor-respond to surfactant-to-oil ratios of SOR = 0.5, 1 and 2, respec-tively. The appearance, particle size, and particle charge of thenanoemulsions was measured after incubation in the variousstages of the GIT model.
3.1.1.1. Initial samples. Initially, the nanoemulsions containing 5%and 10% surfactant were optically opaque suggesting that theycontained relatively large droplets, whereas the one containing20% surfactant was translucent, indicating that it contained smallerdroplets (Fig. 1). Dynamic light scattering (DLS) measurementsindicated that the initial mean particle diameters of nanoemul-sions containing 5%, 10% and 20% surfactant were 119, 105 and39 nm, respectively (Fig. 2a). There was good agreement betweenthe DLS and static light scattering (SLS) instruments for the 5 and10 wt% surfactant systems (Fig. 2b), which can be attributed tothe fact that the droplets were in the appropriate size range forboth instruments. On the other hand, nanoemulsions containing20% surfactant were too small to be analyzed by SLS. Indeed, DLSshowed that the majority (>94%) of droplets remained <100 nmin diameter throughout the simulated GIT, and so SLS measure-ments were not reported for this sample.
The f-potential measurements indicated that the droplets in allthe initial nanoemulsions had a relatively small negative charge(f � �1 mV). Other studies have also shown that oil dropletscoated by non-ionic surfactants (Tweens) have a slight negative
the appearance of nanoemulsions produced by EPI method (2 wt% MCT, 8 wt% VE).
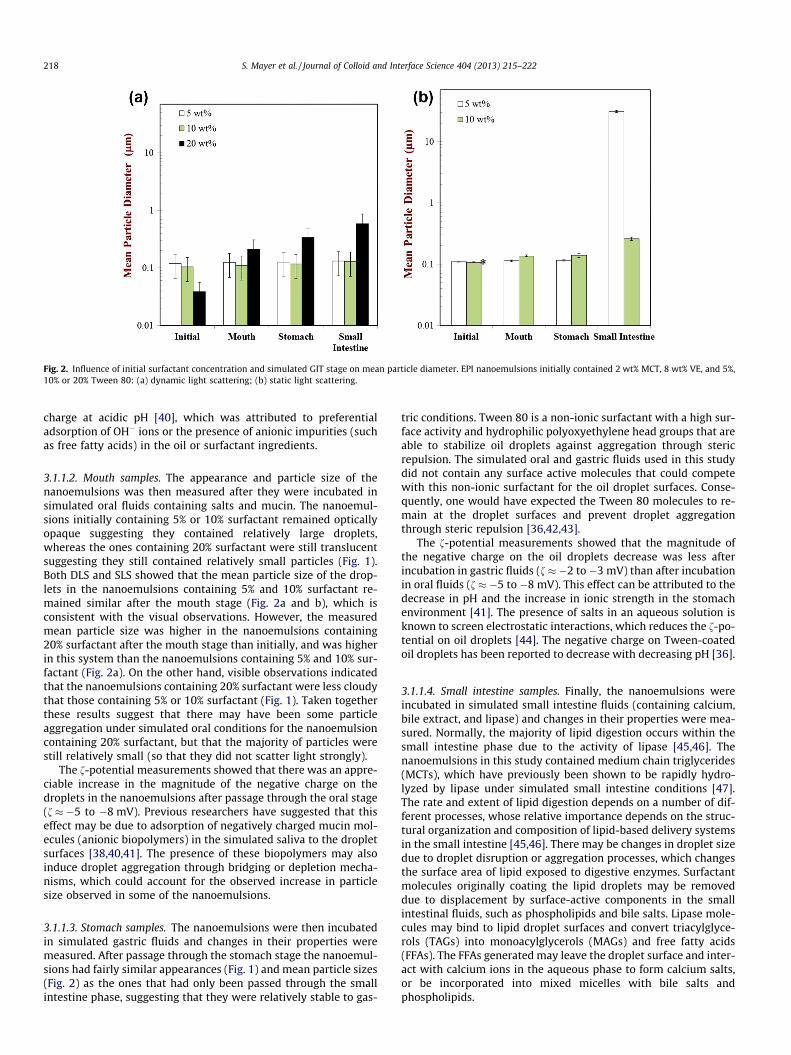
Fig. 2. Influence of initial surfactant concentration and simulated GIT stage on mean particle diameter. EPI nanoemulsions initially contained 2 wt% MCT, 8 wt% VE, and 5%,10% or 20% Tween 80: (a) dynamic light scattering; (b) static light scattering.
218 S. Mayer et al. / Journal of Colloid and Interface Science 404 (2013) 215–222
charge at acidic pH [40], which was attributed to preferentialadsorption of OH� ions or the presence of anionic impurities (suchas free fatty acids) in the oil or surfactant ingredients.
3.1.1.2. Mouth samples. The appearance and particle size of thenanoemulsions was then measured after they were incubated insimulated oral fluids containing salts and mucin. The nanoemul-sions initially containing 5% or 10% surfactant remained opticallyopaque suggesting they contained relatively large droplets,whereas the ones containing 20% surfactant were still translucentsuggesting they still contained relatively small particles (Fig. 1).Both DLS and SLS showed that the mean particle size of the drop-lets in the nanoemulsions containing 5% and 10% surfactant re-mained similar after the mouth stage (Fig. 2a and b), which isconsistent with the visual observations. However, the measuredmean particle size was higher in the nanoemulsions containing20% surfactant after the mouth stage than initially, and was higherin this system than the nanoemulsions containing 5% and 10% sur-factant (Fig. 2a). On the other hand, visible observations indicatedthat the nanoemulsions containing 20% surfactant were less cloudythat those containing 5% or 10% surfactant (Fig. 1). Taken togetherthese results suggest that there may have been some particleaggregation under simulated oral conditions for the nanoemulsioncontaining 20% surfactant, but that the majority of particles werestill relatively small (so that they did not scatter light strongly).
The f-potential measurements showed that there was an appre-ciable increase in the magnitude of the negative charge on thedroplets in the nanoemulsions after passage through the oral stage(f � �5 to �8 mV). Previous researchers have suggested that thiseffect may be due to adsorption of negatively charged mucin mol-ecules (anionic biopolymers) in the simulated saliva to the dropletsurfaces [38,40,41]. The presence of these biopolymers may alsoinduce droplet aggregation through bridging or depletion mecha-nisms, which could account for the observed increase in particlesize observed in some of the nanoemulsions.
3.1.1.3. Stomach samples. The nanoemulsions were then incubatedin simulated gastric fluids and changes in their properties weremeasured. After passage through the stomach stage the nanoemul-sions had fairly similar appearances (Fig. 1) and mean particle sizes(Fig. 2) as the ones that had only been passed through the smallintestine phase, suggesting that they were relatively stable to gas-
tric conditions. Tween 80 is a non-ionic surfactant with a high sur-face activity and hydrophilic polyoxyethylene head groups that areable to stabilize oil droplets against aggregation through stericrepulsion. The simulated oral and gastric fluids used in this studydid not contain any surface active molecules that could competewith this non-ionic surfactant for the oil droplet surfaces. Conse-quently, one would have expected the Tween 80 molecules to re-main at the droplet surfaces and prevent droplet aggregationthrough steric repulsion [36,42,43].
The f-potential measurements showed that the magnitude ofthe negative charge on the oil droplets decrease was less afterincubation in gastric fluids (f � �2 to �3 mV) than after incubationin oral fluids (f � �5 to �8 mV). This effect can be attributed to thedecrease in pH and the increase in ionic strength in the stomachenvironment [41]. The presence of salts in an aqueous solution isknown to screen electrostatic interactions, which reduces the f-po-tential on oil droplets [44]. The negative charge on Tween-coatedoil droplets has been reported to decrease with decreasing pH [36].
3.1.1.4. Small intestine samples. Finally, the nanoemulsions wereincubated in simulated small intestine fluids (containing calcium,bile extract, and lipase) and changes in their properties were mea-sured. Normally, the majority of lipid digestion occurs within thesmall intestine phase due to the activity of lipase [45,46]. Thenanoemulsions in this study contained medium chain triglycerides(MCTs), which have previously been shown to be rapidly hydro-lyzed by lipase under simulated small intestine conditions [47].The rate and extent of lipid digestion depends on a number of dif-ferent processes, whose relative importance depends on the struc-tural organization and composition of lipid-based delivery systemsin the small intestine [45,46]. There may be changes in droplet sizedue to droplet disruption or aggregation processes, which changesthe surface area of lipid exposed to digestive enzymes. Surfactantmolecules originally coating the lipid droplets may be removeddue to displacement by surface-active components in the smallintestinal fluids, such as phospholipids and bile salts. Lipase mole-cules may bind to lipid droplet surfaces and convert triacylglyce-rols (TAGs) into monoacylglycerols (MAGs) and free fatty acids(FFAs). The FFAs generated may leave the droplet surface and inter-act with calcium ions in the aqueous phase to form calcium salts,or be incorporated into mixed micelles with bile salts andphospholipids.
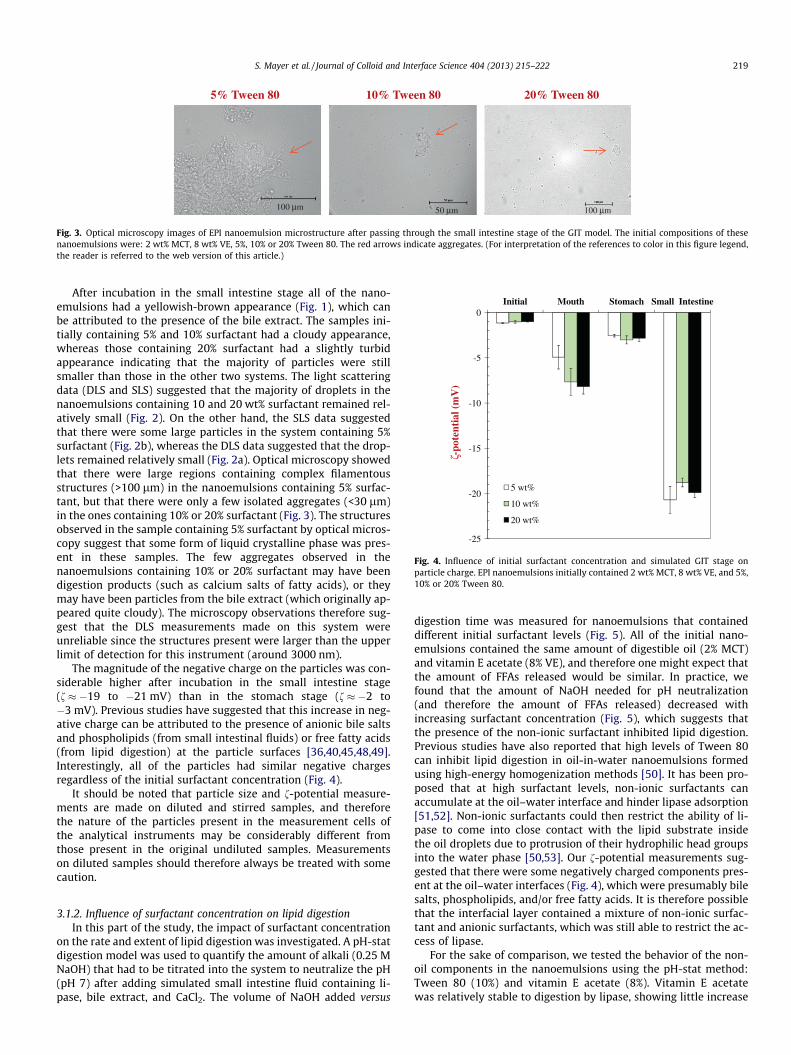
5% Tween 80 10% Tween 80 20% Tween 80
100 μm 50 μm 100 μm
Fig. 3. Optical microscopy images of EPI nanoemulsion microstructure after passing through the small intestine stage of the GIT model. The initial compositions of thesenanoemulsions were: 2 wt% MCT, 8 wt% VE, 5%, 10% or 20% Tween 80. The red arrows indicate aggregates. (For interpretation of the references to color in this figure legend,the reader is referred to the web version of this article.)
-25
-20
-15
-10
-5
0Initial Mouth Stomach Small Intestine
ζ-po
tent
ial (
mV
)
5 wt%
10 wt%
20 wt%
Fig. 4. Influence of initial surfactant concentration and simulated GIT stage onparticle charge. EPI nanoemulsions initially contained 2 wt% MCT, 8 wt% VE, and 5%,10% or 20% Tween 80.
S. Mayer et al. / Journal of Colloid and Interface Science 404 (2013) 215–222 219
After incubation in the small intestine stage all of the nano-emulsions had a yellowish-brown appearance (Fig. 1), which canbe attributed to the presence of the bile extract. The samples ini-tially containing 5% and 10% surfactant had a cloudy appearance,whereas those containing 20% surfactant had a slightly turbidappearance indicating that the majority of particles were stillsmaller than those in the other two systems. The light scatteringdata (DLS and SLS) suggested that the majority of droplets in thenanoemulsions containing 10 and 20 wt% surfactant remained rel-atively small (Fig. 2). On the other hand, the SLS data suggestedthat there were some large particles in the system containing 5%surfactant (Fig. 2b), whereas the DLS data suggested that the drop-lets remained relatively small (Fig. 2a). Optical microscopy showedthat there were large regions containing complex filamentousstructures (>100 lm) in the nanoemulsions containing 5% surfac-tant, but that there were only a few isolated aggregates (<30 lm)in the ones containing 10% or 20% surfactant (Fig. 3). The structuresobserved in the sample containing 5% surfactant by optical micros-copy suggest that some form of liquid crystalline phase was pres-ent in these samples. The few aggregates observed in thenanoemulsions containing 10% or 20% surfactant may have beendigestion products (such as calcium salts of fatty acids), or theymay have been particles from the bile extract (which originally ap-peared quite cloudy). The microscopy observations therefore sug-gest that the DLS measurements made on this system wereunreliable since the structures present were larger than the upperlimit of detection for this instrument (around 3000 nm).
The magnitude of the negative charge on the particles was con-siderable higher after incubation in the small intestine stage(f � �19 to �21 mV) than in the stomach stage (f � �2 to�3 mV). Previous studies have suggested that this increase in neg-ative charge can be attributed to the presence of anionic bile saltsand phospholipids (from small intestinal fluids) or free fatty acids(from lipid digestion) at the particle surfaces [36,40,45,48,49].Interestingly, all of the particles had similar negative chargesregardless of the initial surfactant concentration (Fig. 4).
It should be noted that particle size and f-potential measure-ments are made on diluted and stirred samples, and thereforethe nature of the particles present in the measurement cells ofthe analytical instruments may be considerably different fromthose present in the original undiluted samples. Measurementson diluted samples should therefore always be treated with somecaution.
3.1.2. Influence of surfactant concentration on lipid digestionIn this part of the study, the impact of surfactant concentration
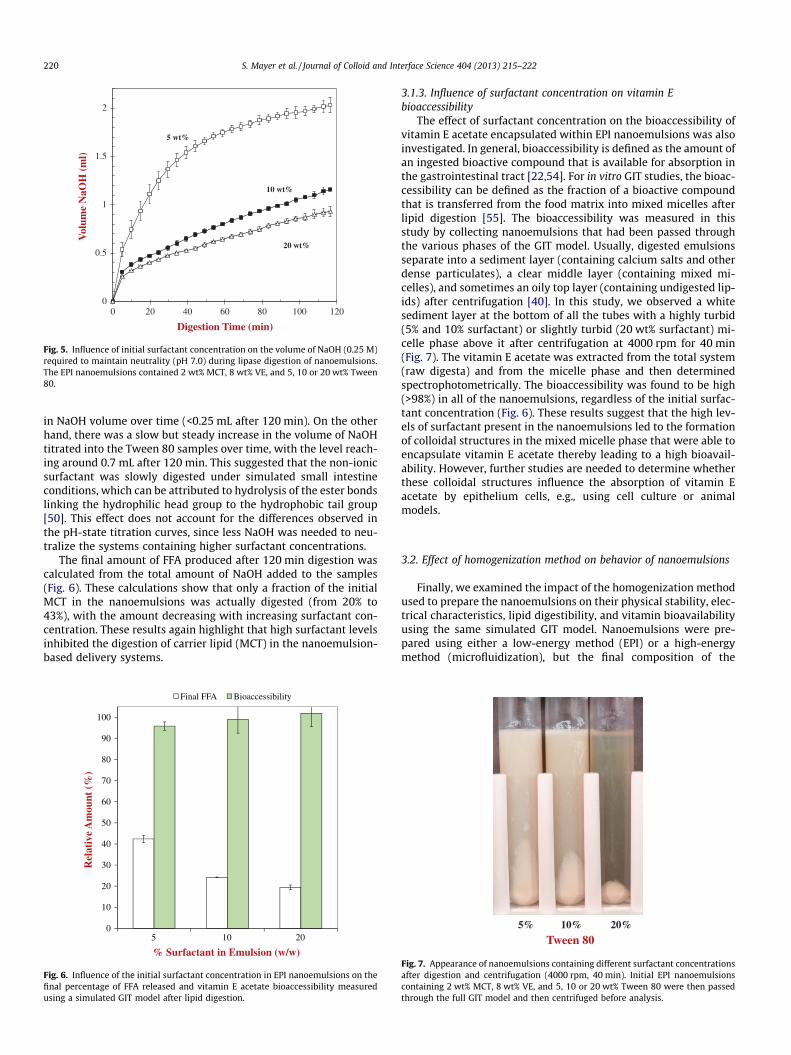
on the rate and extent of lipid digestion was investigated. A pH-statdigestion model was used to quantify the amount of alkali (0.25 MNaOH) that had to be titrated into the system to neutralize the pH(pH 7) after adding simulated small intestine fluid containing li-pase, bile extract, and CaCl2. The volume of NaOH added versus
digestion time was measured for nanoemulsions that containeddifferent initial surfactant levels (Fig. 5). All of the initial nano-emulsions contained the same amount of digestible oil (2% MCT)and vitamin E acetate (8% VE), and therefore one might expect thatthe amount of FFAs released would be similar. In practice, wefound that the amount of NaOH needed for pH neutralization(and therefore the amount of FFAs released) decreased withincreasing surfactant concentration (Fig. 5), which suggests thatthe presence of the non-ionic surfactant inhibited lipid digestion.Previous studies have also reported that high levels of Tween 80can inhibit lipid digestion in oil-in-water nanoemulsions formedusing high-energy homogenization methods [50]. It has been pro-posed that at high surfactant levels, non-ionic surfactants canaccumulate at the oil–water interface and hinder lipase adsorption[51,52]. Non-ionic surfactants could then restrict the ability of li-pase to come into close contact with the lipid substrate insidethe oil droplets due to protrusion of their hydrophilic head groupsinto the water phase [50,53]. Our f-potential measurements sug-gested that there were some negatively charged components pres-ent at the oil–water interfaces (Fig. 4), which were presumably bilesalts, phospholipids, and/or free fatty acids. It is therefore possiblethat the interfacial layer contained a mixture of non-ionic surfac-tant and anionic surfactants, which was still able to restrict the ac-cess of lipase.
For the sake of comparison, we tested the behavior of the non-oil components in the nanoemulsions using the pH-stat method:Tween 80 (10%) and vitamin E acetate (8%). Vitamin E acetatewas relatively stable to digestion by lipase, showing little increase
0
0.5
1
1.5
2
0 20 40 60 80 100 120
Vol
ume
NaO
H (
ml)
Digestion Time (min)
20 wt%
10 wt%
5 wt%
Fig. 5. Influence of initial surfactant concentration on the volume of NaOH (0.25 M)required to maintain neutrality (pH 7.0) during lipase digestion of nanoemulsions.The EPI nanoemulsions contained 2 wt% MCT, 8 wt% VE, and 5, 10 or 20 wt% Tween80.
220 S. Mayer et al. / Journal of Colloid and Interface Science 404 (2013) 215–222
in NaOH volume over time (<0.25 mL after 120 min). On the otherhand, there was a slow but steady increase in the volume of NaOHtitrated into the Tween 80 samples over time, with the level reach-ing around 0.7 mL after 120 min. This suggested that the non-ionicsurfactant was slowly digested under simulated small intestineconditions, which can be attributed to hydrolysis of the ester bondslinking the hydrophilic head group to the hydrophobic tail group[50]. This effect does not account for the differences observed inthe pH-state titration curves, since less NaOH was needed to neu-tralize the systems containing higher surfactant concentrations.
The final amount of FFA produced after 120 min digestion wascalculated from the total amount of NaOH added to the samples(Fig. 6). These calculations show that only a fraction of the initialMCT in the nanoemulsions was actually digested (from 20% to43%), with the amount decreasing with increasing surfactant con-centration. These results again highlight that high surfactant levelsinhibited the digestion of carrier lipid (MCT) in the nanoemulsion-based delivery systems.
0
10
20
30
40
50
60
70
80
90
100
5 10 20
Rel
ativ
e A
mou
nt (
%)
% Surfactant in Emulsion (w/w)
Final FFA Bioaccessibility
Fig. 6. Influence of the initial surfactant concentration in EPI nanoemulsions on thefinal percentage of FFA released and vitamin E acetate bioaccessibility measuredusing a simulated GIT model after lipid digestion.
3.1.3. Influence of surfactant concentration on vitamin Ebioaccessibility
The effect of surfactant concentration on the bioaccessibility ofvitamin E acetate encapsulated within EPI nanoemulsions was alsoinvestigated. In general, bioaccessibility is defined as the amount ofan ingested bioactive compound that is available for absorption inthe gastrointestinal tract [22,54]. For in vitro GIT studies, the bioac-cessibility can be defined as the fraction of a bioactive compoundthat is transferred from the food matrix into mixed micelles afterlipid digestion [55]. The bioaccessibility was measured in thisstudy by collecting nanoemulsions that had been passed throughthe various phases of the GIT model. Usually, digested emulsionsseparate into a sediment layer (containing calcium salts and otherdense particulates), a clear middle layer (containing mixed mi-celles), and sometimes an oily top layer (containing undigested lip-ids) after centrifugation [40]. In this study, we observed a whitesediment layer at the bottom of all the tubes with a highly turbid(5% and 10% surfactant) or slightly turbid (20 wt% surfactant) mi-celle phase above it after centrifugation at 4000 rpm for 40 min(Fig. 7). The vitamin E acetate was extracted from the total system(raw digesta) and from the micelle phase and then determinedspectrophotometrically. The bioaccessibility was found to be high(>98%) in all of the nanoemulsions, regardless of the initial surfac-tant concentration (Fig. 6). These results suggest that the high lev-els of surfactant present in the nanoemulsions led to the formationof colloidal structures in the mixed micelle phase that were able toencapsulate vitamin E acetate thereby leading to a high bioavail-ability. However, further studies are needed to determine whetherthese colloidal structures influence the absorption of vitamin Eacetate by epithelium cells, e.g., using cell culture or animalmodels.
3.2. Effect of homogenization method on behavior of nanoemulsions
Finally, we examined the impact of the homogenization methodused to prepare the nanoemulsions on their physical stability, elec-trical characteristics, lipid digestibility, and vitamin bioavailabilityusing the same simulated GIT model. Nanoemulsions were pre-pared using either a low-energy method (EPI) or a high-energymethod (microfluidization), but the final composition of the
5% 10% 20%
Tween 80
Fig. 7. Appearance of nanoemulsions containing different surfactant concentrationsafter digestion and centrifugation (4000 rpm, 40 min). Initial EPI nanoemulsionscontaining 2 wt% MCT, 8 wt% VE, and 5, 10 or 20 wt% Tween 80 were then passedthrough the full GIT model and then centrifuged before analysis.
0
10
20
30
40
50
60
70
80
90
100
Microfluidizer EPI
Rel
ativ
e A
mou
nt (
%)
Homogenization Method
Final FFA Bioaccessibility
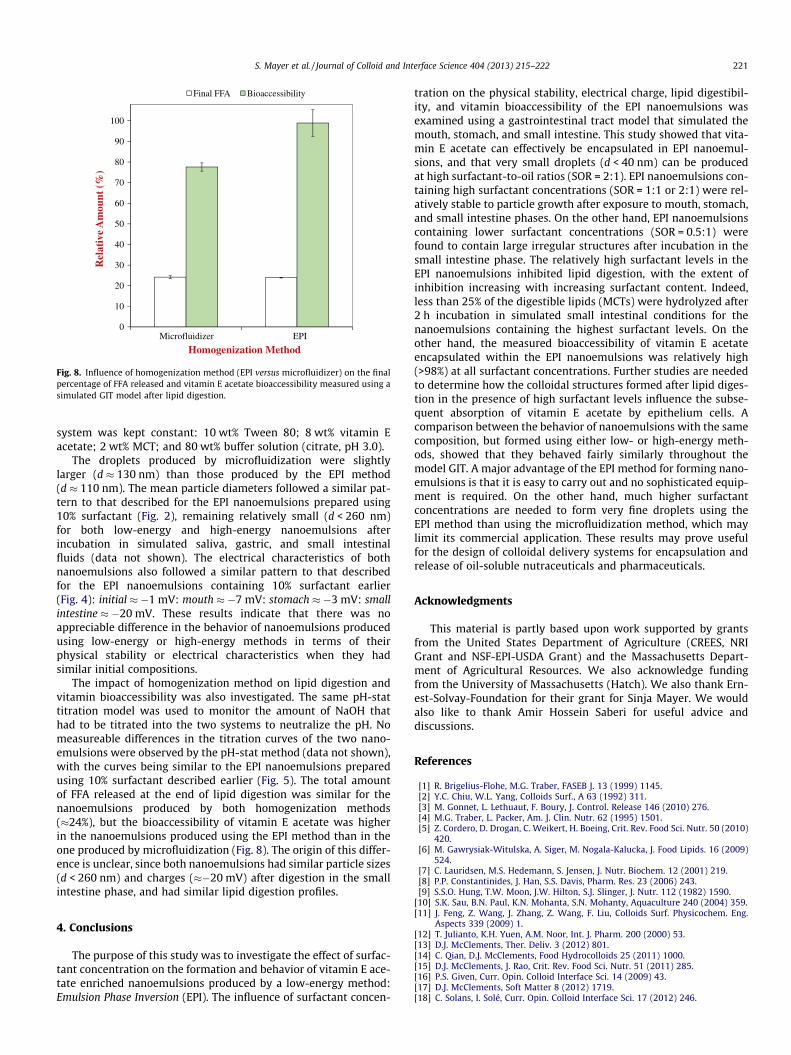
Fig. 8. Influence of homogenization method (EPI versus microfluidizer) on the finalpercentage of FFA released and vitamin E acetate bioaccessibility measured using asimulated GIT model after lipid digestion.
S. Mayer et al. / Journal of Colloid and Interface Science 404 (2013) 215–222 221
system was kept constant: 10 wt% Tween 80; 8 wt% vitamin Eacetate; 2 wt% MCT; and 80 wt% buffer solution (citrate, pH 3.0).
The droplets produced by microfluidization were slightlylarger (d � 130 nm) than those produced by the EPI method(d � 110 nm). The mean particle diameters followed a similar pat-tern to that described for the EPI nanoemulsions prepared using10% surfactant (Fig. 2), remaining relatively small (d < 260 nm)for both low-energy and high-energy nanoemulsions afterincubation in simulated saliva, gastric, and small intestinalfluids (data not shown). The electrical characteristics of bothnanoemulsions also followed a similar pattern to that describedfor the EPI nanoemulsions containing 10% surfactant earlier(Fig. 4): initial � �1 mV: mouth � �7 mV: stomach � �3 mV: smallintestine � �20 mV. These results indicate that there was noappreciable difference in the behavior of nanoemulsions producedusing low-energy or high-energy methods in terms of theirphysical stability or electrical characteristics when they hadsimilar initial compositions.
The impact of homogenization method on lipid digestion andvitamin bioaccessibility was also investigated. The same pH-stattitration model was used to monitor the amount of NaOH thathad to be titrated into the two systems to neutralize the pH. Nomeasureable differences in the titration curves of the two nano-emulsions were observed by the pH-stat method (data not shown),with the curves being similar to the EPI nanoemulsions preparedusing 10% surfactant described earlier (Fig. 5). The total amountof FFA released at the end of lipid digestion was similar for thenanoemulsions produced by both homogenization methods(�24%), but the bioaccessibility of vitamin E acetate was higherin the nanoemulsions produced using the EPI method than in theone produced by microfluidization (Fig. 8). The origin of this differ-ence is unclear, since both nanoemulsions had similar particle sizes(d < 260 nm) and charges (��20 mV) after digestion in the smallintestine phase, and had similar lipid digestion profiles.
4. Conclusions
The purpose of this study was to investigate the effect of surfac-tant concentration on the formation and behavior of vitamin E ace-tate enriched nanoemulsions produced by a low-energy method:Emulsion Phase Inversion (EPI). The influence of surfactant concen-
tration on the physical stability, electrical charge, lipid digestibil-ity, and vitamin bioaccessibility of the EPI nanoemulsions wasexamined using a gastrointestinal tract model that simulated themouth, stomach, and small intestine. This study showed that vita-min E acetate can effectively be encapsulated in EPI nanoemul-sions, and that very small droplets (d < 40 nm) can be producedat high surfactant-to-oil ratios (SOR = 2:1). EPI nanoemulsions con-taining high surfactant concentrations (SOR = 1:1 or 2:1) were rel-atively stable to particle growth after exposure to mouth, stomach,and small intestine phases. On the other hand, EPI nanoemulsionscontaining lower surfactant concentrations (SOR = 0.5:1) werefound to contain large irregular structures after incubation in thesmall intestine phase. The relatively high surfactant levels in theEPI nanoemulsions inhibited lipid digestion, with the extent ofinhibition increasing with increasing surfactant content. Indeed,less than 25% of the digestible lipids (MCTs) were hydrolyzed after2 h incubation in simulated small intestinal conditions for thenanoemulsions containing the highest surfactant levels. On theother hand, the measured bioaccessibility of vitamin E acetateencapsulated within the EPI nanoemulsions was relatively high(>98%) at all surfactant concentrations. Further studies are neededto determine how the colloidal structures formed after lipid diges-tion in the presence of high surfactant levels influence the subse-quent absorption of vitamin E acetate by epithelium cells. Acomparison between the behavior of nanoemulsions with the samecomposition, but formed using either low- or high-energy meth-ods, showed that they behaved fairly similarly throughout themodel GIT. A major advantage of the EPI method for forming nano-emulsions is that it is easy to carry out and no sophisticated equip-ment is required. On the other hand, much higher surfactantconcentrations are needed to form very fine droplets using theEPI method than using the microfluidization method, which maylimit its commercial application. These results may prove usefulfor the design of colloidal delivery systems for encapsulation andrelease of oil-soluble nutraceuticals and pharmaceuticals.
Acknowledgments
This material is partly based upon work supported by grantsfrom the United States Department of Agriculture (CREES, NRIGrant and NSF-EPI-USDA Grant) and the Massachusetts Depart-ment of Agricultural Resources. We also acknowledge fundingfrom the University of Massachusetts (Hatch). We also thank Ern-est-Solvay-Foundation for their grant for Sinja Mayer. We wouldalso like to thank Amir Hossein Saberi for useful advice anddiscussions.
References
[1] R. Brigelius-Flohe, M.G. Traber, FASEB J. 13 (1999) 1145.[2] Y.C. Chiu, W.L. Yang, Colloids Surf., A 63 (1992) 311.[3] M. Gonnet, L. Lethuaut, F. Boury, J. Control. Release 146 (2010) 276.[4] M.G. Traber, L. Packer, Am. J. Clin. Nutr. 62 (1995) 1501.[5] Z. Cordero, D. Drogan, C. Weikert, H. Boeing, Crit. Rev. Food Sci. Nutr. 50 (2010)
420.[6] M. Gawrysiak-Witulska, A. Siger, M. Nogala-Kalucka, J. Food Lipids. 16 (2009)
524.[7] C. Lauridsen, M.S. Hedemann, S. Jensen, J. Nutr. Biochem. 12 (2001) 219.[8] P.P. Constantinides, J. Han, S.S. Davis, Pharm. Res. 23 (2006) 243.[9] S.S.O. Hung, T.W. Moon, J.W. Hilton, S.J. Slinger, J. Nutr. 112 (1982) 1590.
[10] S.K. Sau, B.N. Paul, K.N. Mohanta, S.N. Mohanty, Aquaculture 240 (2004) 359.[11] J. Feng, Z. Wang, J. Zhang, Z. Wang, F. Liu, Colloids Surf. Physicochem. Eng.
Aspects 339 (2009) 1.[12] T. Julianto, K.H. Yuen, A.M. Noor, Int. J. Pharm. 200 (2000) 53.[13] D.J. McClements, Ther. Deliv. 3 (2012) 801.[14] C. Qian, D.J. McClements, Food Hydrocolloids 25 (2011) 1000.[15] D.J. McClements, J. Rao, Crit. Rev. Food Sci. Nutr. 51 (2011) 285.[16] P.S. Given, Curr. Opin. Colloid Interface Sci. 14 (2009) 43.[17] D.J. McClements, Soft Matter 8 (2012) 1719.[18] C. Solans, I. Solé, Curr. Opin. Colloid Interface Sci. 17 (2012) 246.
222 S. Mayer et al. / Journal of Colloid and Interface Science 404 (2013) 215–222
[19] T. Tadros, P. Izquierdo, J. Esquena, C. Solans, Adv. Colloid Interface Sci. 108–109(2004) 303.
[20] Q. Huang, H. Yu, Q. Ru, J. Food Sci. 75 (2010) 50.[21] E. Acosta, Curr. Opin. Colloid Interface Sci. 14 (2009) 3.[22] M.J. Rein, M. Renouf, C. Cruz-hernandez, L. Actis-goretta, S.K. Thakkar, S. Pinto,
Br. J. Clin. Pharmacol. 75 (2012) 588.[23] J.N. Cheong, C.P. Tan, Y.B.C. Man, M. Misran, J. Food Eng. 89 (2008) 204.[24] P. Ghosh, R. Majithiya, M. Umrethia, R.R. Murthy, AAPS PharmSciTech. 7 (2006)
172.[25] S. Khandavilli, R. Panchagnula, J. Invest. Dermatol. 127 (2007) 154.[26] F. Kuo, B. Subramanian, T. Kotyla, T.a. Wilson, S. Yoganathan, R.J. Nicolosi, Int. J.
Pharm. 363 (2008) 206.[27] A. Rigotti, Mol. Aspects Med. 28 (2007) 423.[28] M.G. Traber, I. Goldberg, E. Davidson, N. Lagmay, H.J. Kayden, Gastroenterology
98 (1990) 96.[29] I. Solè, A. Maestro, C. González, C. Solans, J.M. Gutiérrez, Langmuir 22 (2006)
8326.[30] U. Einhorn-Stoll, M. Weiss, H. Kunzek, Nahrung 46 (2002) 294.[31] N. Sadurni, C. Solans, N. Azemar, M.J. Garcia-Celma, Eur. J. Pharm. Sci. 26
(2005) 438.[32] N. Anton, T.F. Vandamme, Int. J. Pharm. 377 (2009) 142.[33] Y. Yang, C. Marshall-Breton, M.E. Leser, A.a. Sher, D.J. McClements, Food
Hydrocolloids 29 (2012) 398.[34] R.K. Thakur, C. Villette, J.M. Aubry, G. Delaplace, Colloids Surf. Physicochem.
Eng. Aspects 315 (2008) 285.
[35] F. Ostertag, J. Weiss, D.J. McClements, J. Colloid Interface Sci. 388 (2012) 95.[36] C. Qian, E.A. Decker, H. Xiao, D.J. McClements, Food Chem. 135 (2012) 1440.[37] Y. Li, D.J. McClements, J. Agric. Food Chem. 58 (2010) 8085.[38] A. Sarkar, K.K.T. Goh, H. Singh, Food Hydrocolloids 23 (2009) 1270.[39] A. Sarkar, K.K.T. Goh, R.P. Singh, H. Singh, Food Hydrocolloids 23 (2009) 1563.[40] D.J. McClements, H. Xiao, Food Funct. 3 (2012) 202.[41] S.J. Hur, E.a. Decker, D.J. McClements, Food Chem. 114 (2009) 253.[42] A.M. Nik, S. Langmaid, A.J. Wright, Food Funct. 3 (2012) 234.[43] M. Golding, T.J. Wooster, L. Day, M. Xu, L. Lundin, J. Keogh, P. Clifton, Soft
Matter 7 (2011) 3513.[44] S. Mun, E.a. Decker, D.J. McClements, Langmuir 21 (2005) 6228.[45] H. Singh, A. Ye, D. Horne, Prog. Lipid Res. 48 (2009) 92.[46] D.J. McClements, E.A. Decker, Y. Park, Crit. Rev. Food Sci. Nutr. 49 (2009) 48.[47] Y. Li, M. Hu, D.J. McClements, Food Chem. 126 (2011) 498.[48] C.W. Pouton, C.J.H. Porter, Adv. Drug Deliv. Rev. 60 (2008) 625.[49] P. Reis, K. Holmberg, H. Watzke, M.E. Leser, R. Miller, Adv. Colloid Interface Sci.
147–148 (2009) 237.[50] Y. Li, D.J. McClements, Eur. J. Pharmaceut. Biopharmaceut. 79 (2011) 423.[51] M.E. Lowe, J. Lipid Res. 43 (2002) 2007.[52] D. Werner, Chem. Eng. Process. 34 (1995) 205.[53] B. Chu, G.T. Rich, M.J. Ridout, R.M. Faulks, M.S.J. Wickham, P.J. Wilde, Langmuir
25 (2009) 9352.[54] F. Saura-Calixto, J. Serrano, I. Goni, Food Chem. 101 (2007) 492.[55] C. Sy, B. Gleize, O. Dangles, J. Landrier, C.C. Veyrat, P. Borel, Mol. Nutr. Food Res.
56 (2012) 1385.