Embed Size (px)
DESCRIPTION
BEEF CARCASS YIELD AND QUALITY GRADING. South Carolina Meat Judging Workshop. USDA Beef Carcass Grades. Purpose: Classify Carcasses Expected Cutability or Retail Yield Expected Eating Quality. Conformation Dictates Composition. USDA Yield Grade. - PowerPoint PPT Presentation
Citation preview
BEEF CARCASSYIELD AND QUALITY
GRADING
South Carolina Meat Judging Workshop
USDA Beef Carcass Grades
Purpose: Classify Carcasses
«Expected Cutability or Retail Yield
«Expected Eating Quality
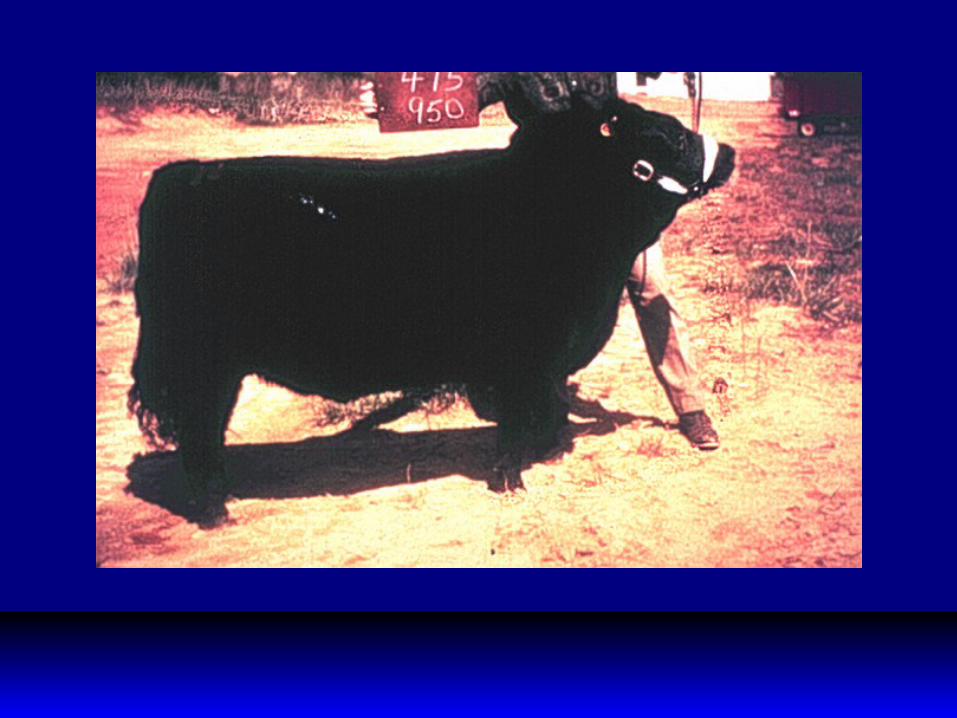
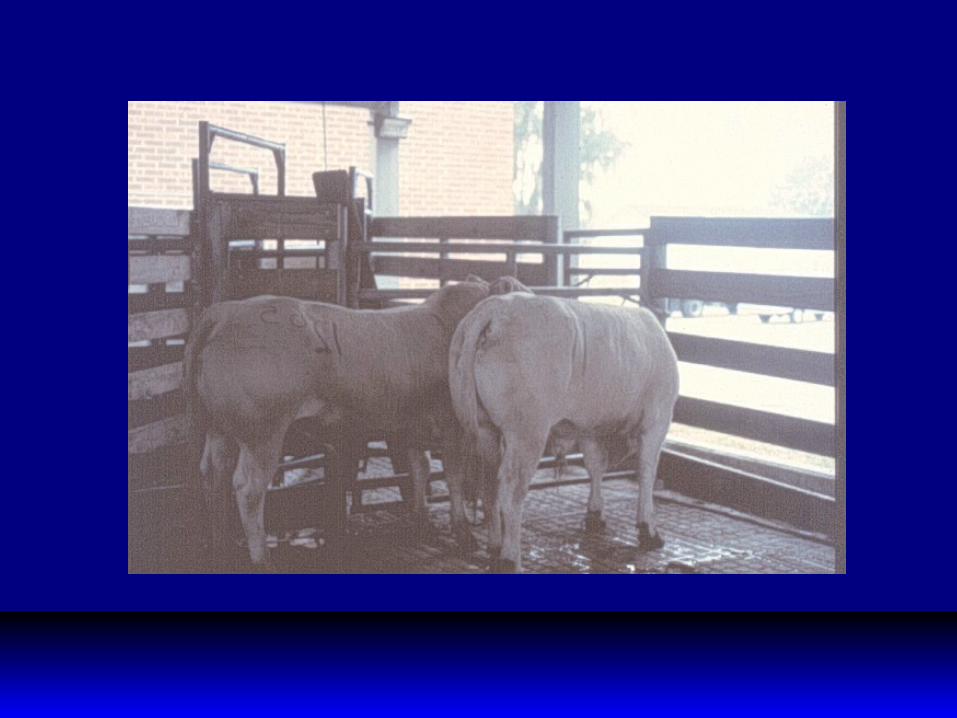
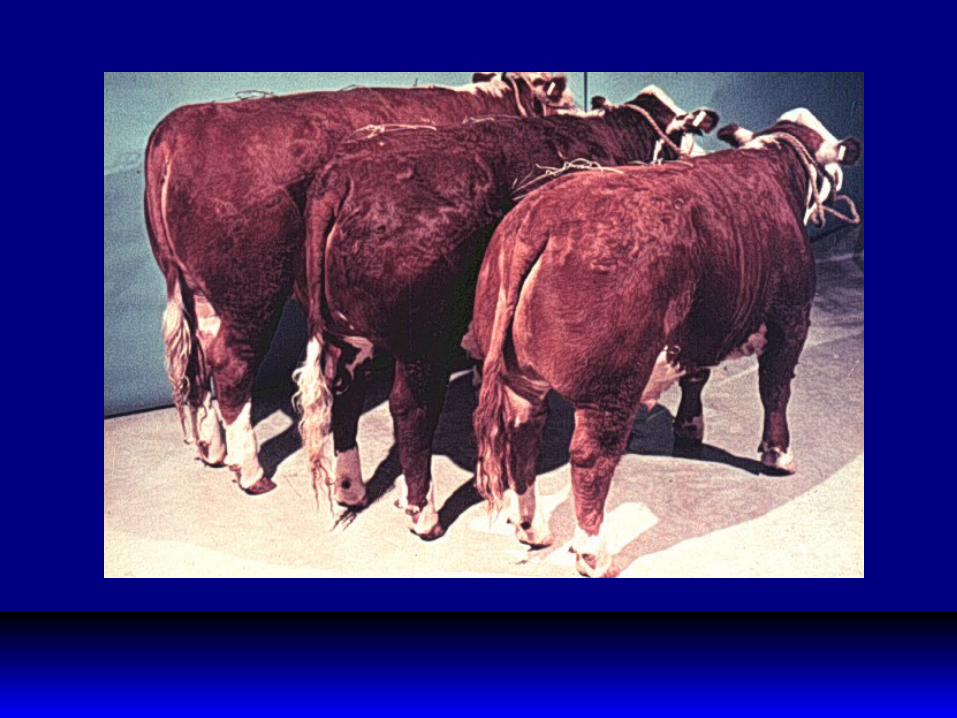
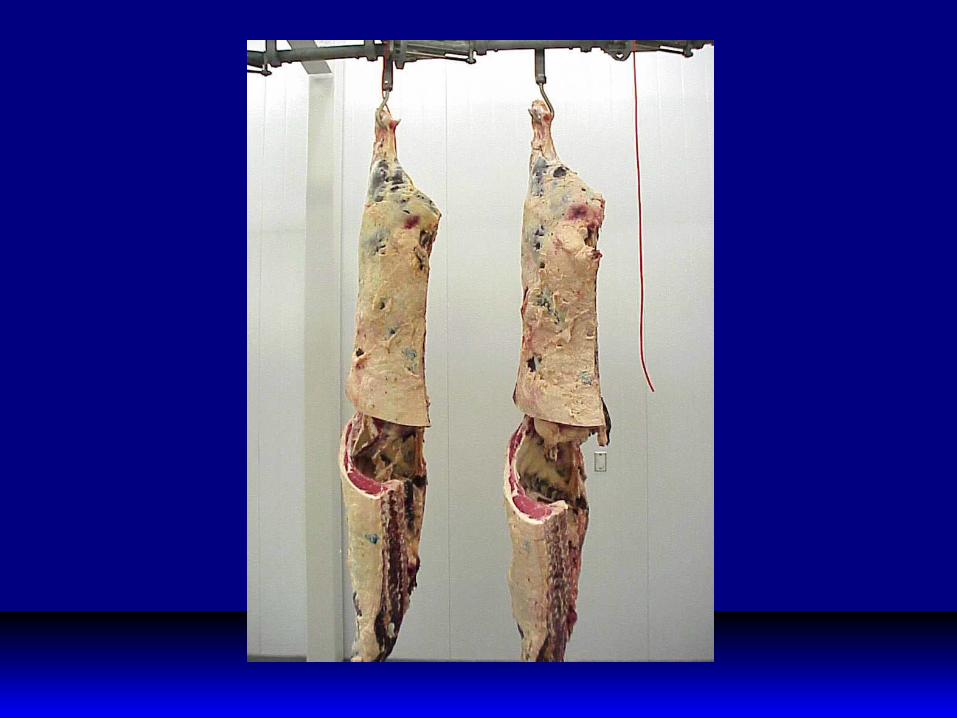
Conformation
Dictates
Composition
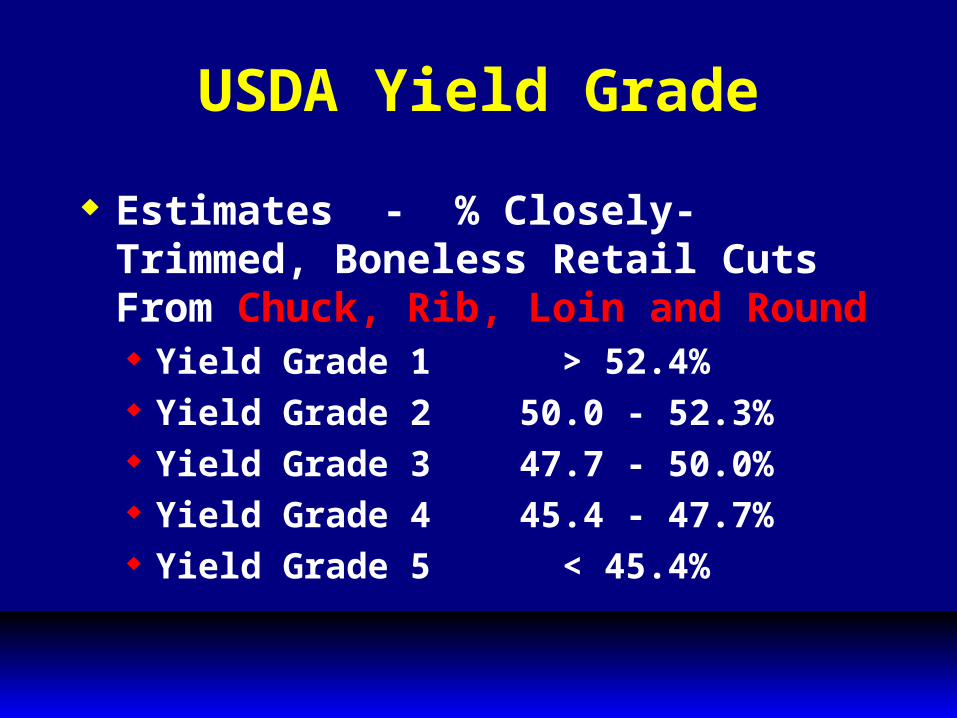
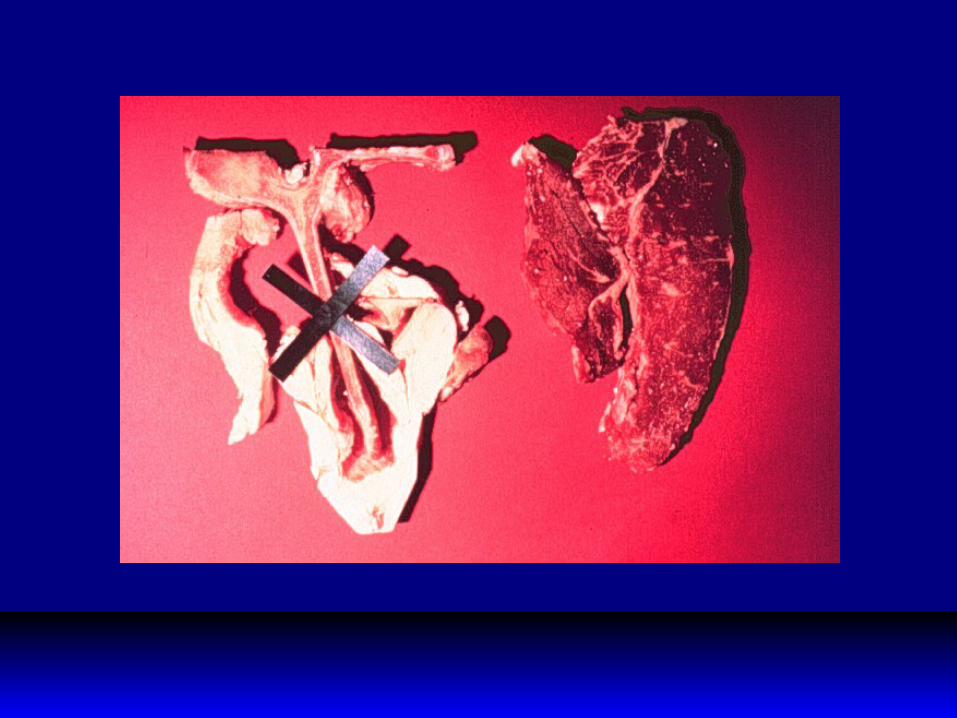
USDA Yield Grade
Estimates - % Closely-Trimmed, Boneless Retail Cuts From Chuck, Rib, Loin and Round Yield Grade 1 > 52.4% Yield Grade 2 50.0 - 52.3% Yield Grade 3 47.7 - 50.0% Yield Grade 4 45.4 - 47.7% Yield Grade 5 < 45.4%
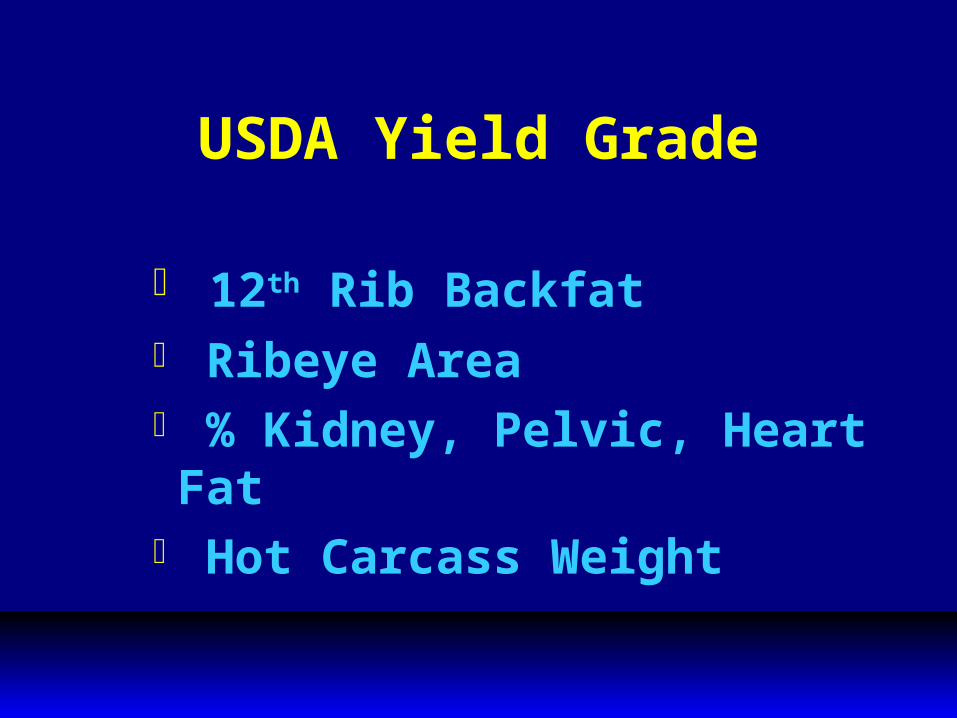
USDA Yield Grade
12th Rib Backfat Ribeye Area % Kidney, Pelvic, Heart Fat
Hot Carcass Weight
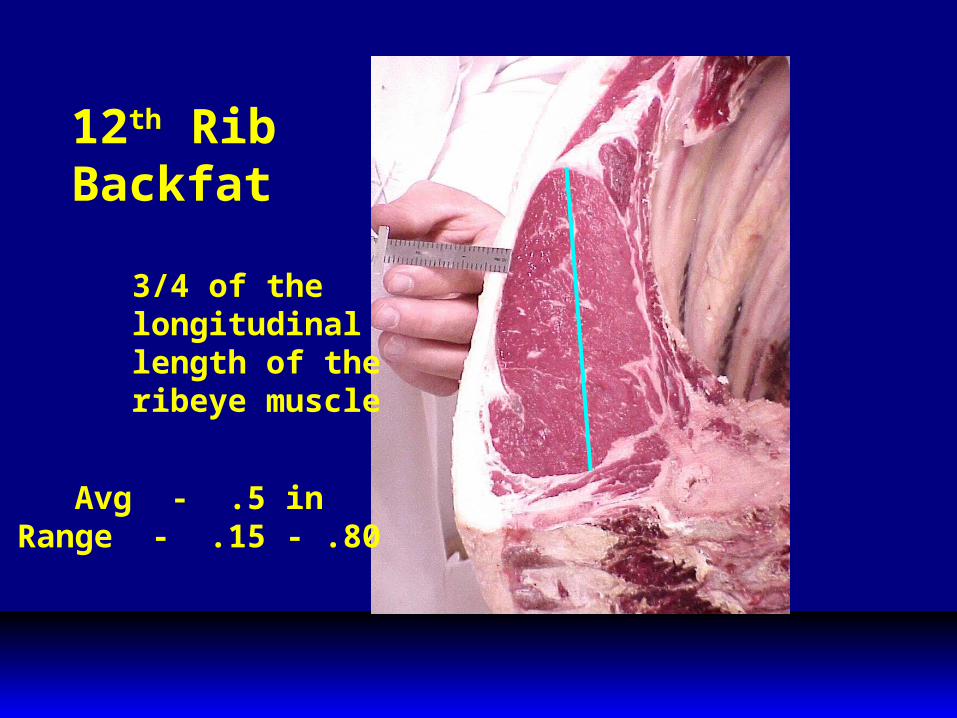
12th RibBackfat
3/4 of thelongitudinallength of theribeye muscle
Avg - .5 inRange - .15 - .80

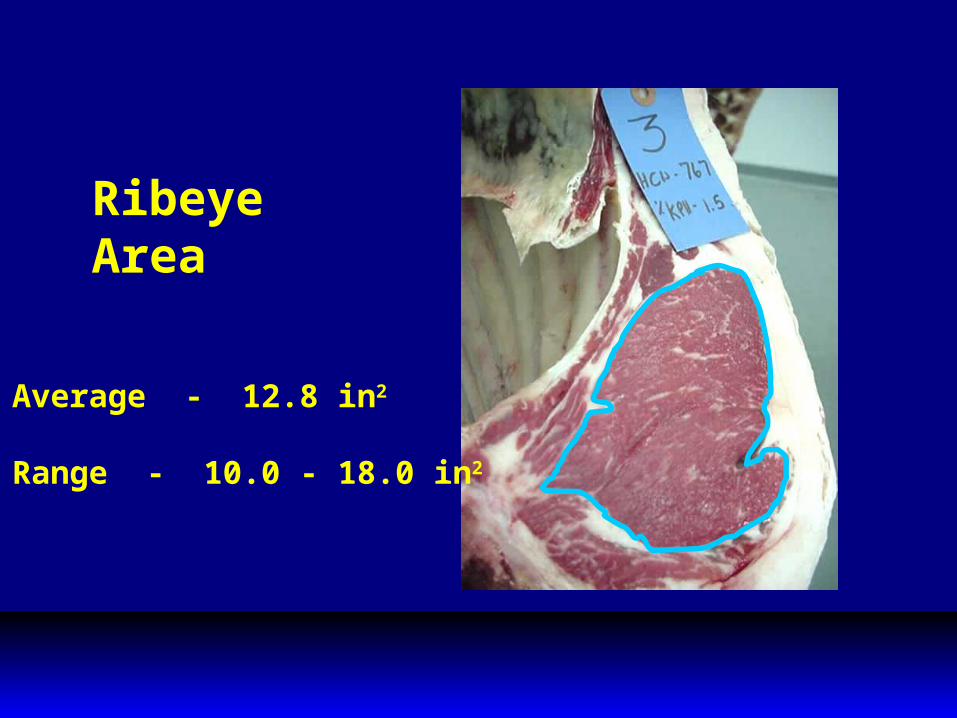
RibeyeArea
Average - 12.8 in2
Range - 10.0 - 18.0 in2
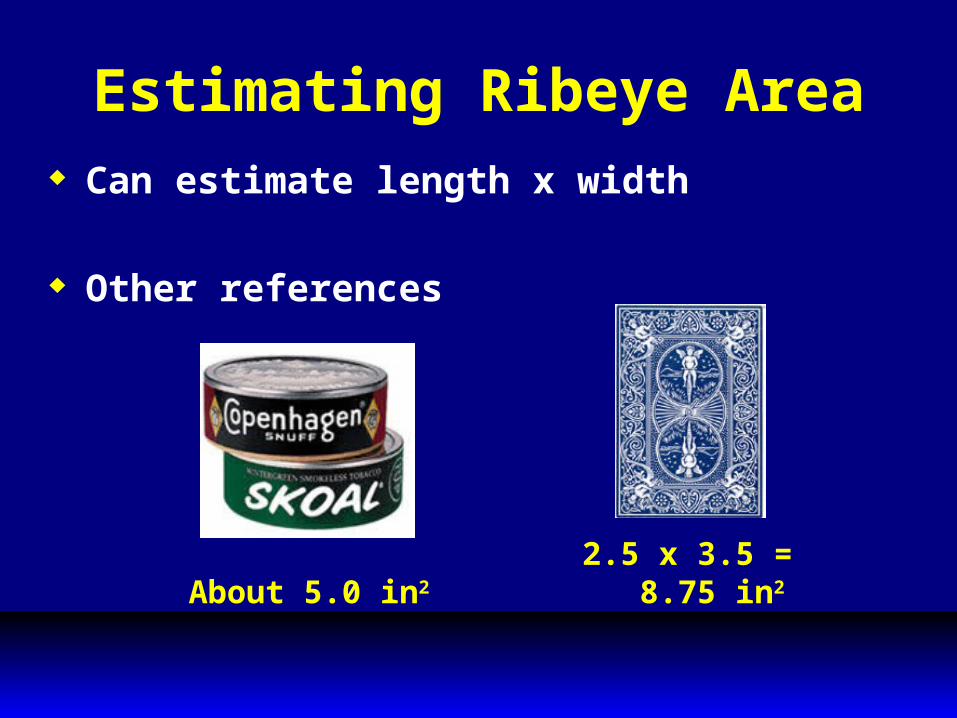
Estimating Ribeye Area Can estimate length x width
Other references
2.5 x 3.5 = 8.75 in2About 5.0 in2
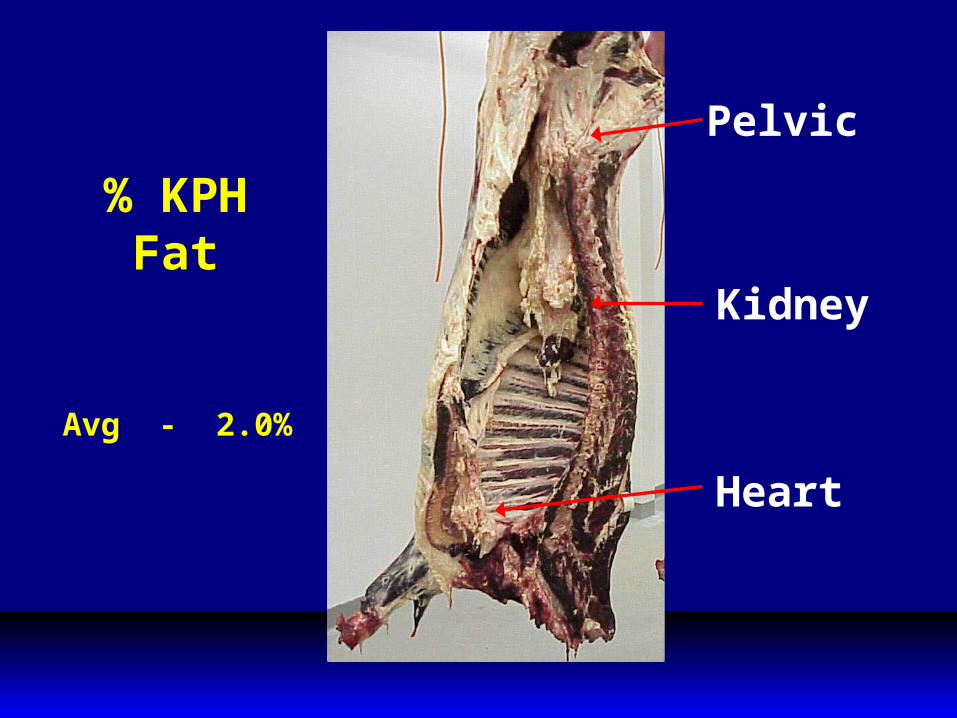
% KPHFat
Heart
Kidney
Pelvic
Avg - 2.0%
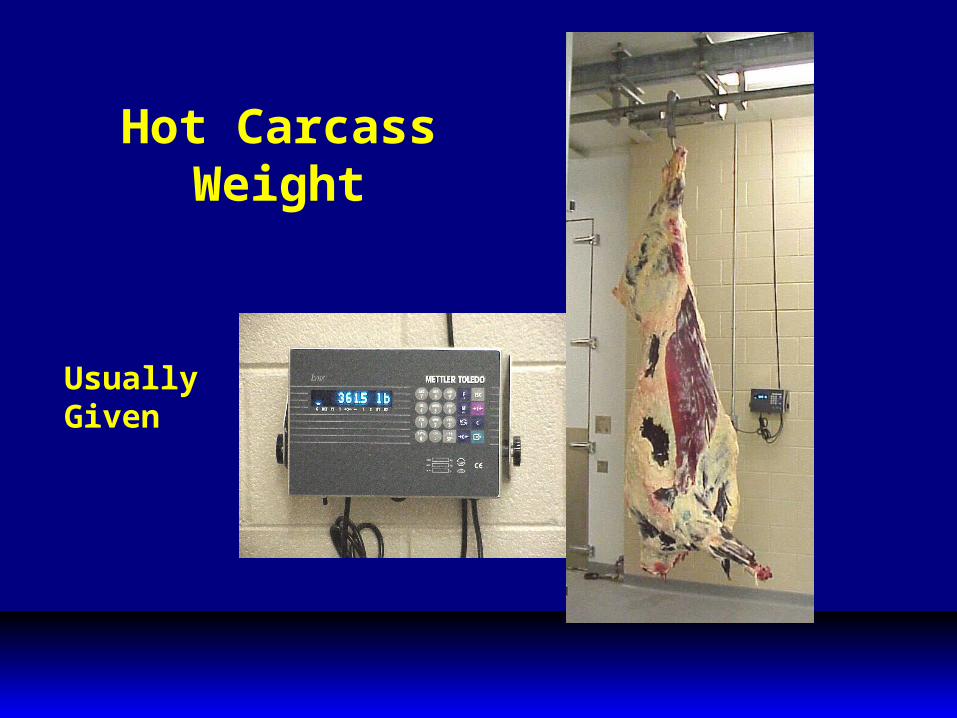
Hot CarcassWeight
UsuallyGiven
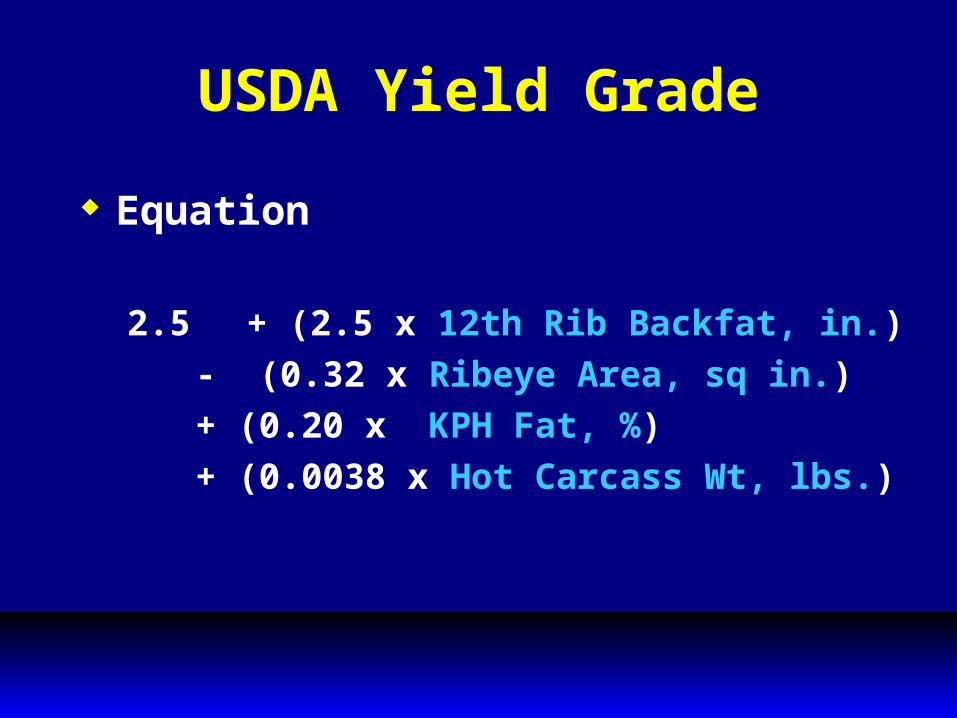
USDA Yield Grade
Equation
2.5 + (2.5 x 12th Rib Backfat, in.)- (0.32 x Ribeye Area,
sq in.)+ (0.20 x KPH Fat, %)+ (0.0038 x Hot Carcass
Wt, lbs.)
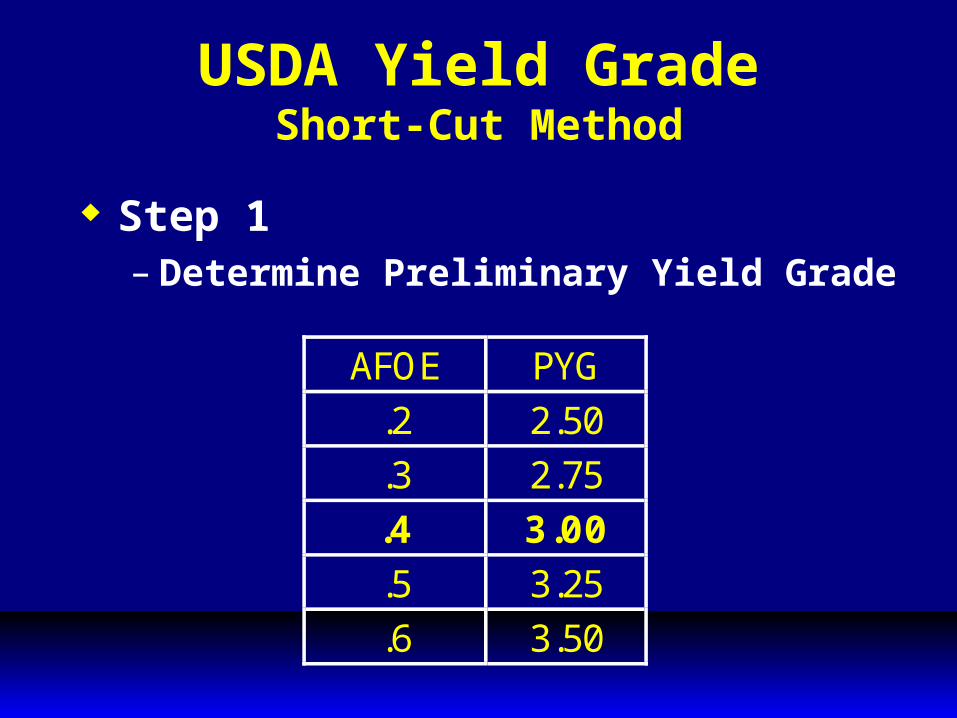
USDA Yield GradeShort-Cut Method
Step 1– Determine Preliminary Yield Grade
AFOE PYG.2 2.50.3 2.75.4 3.00.5 3.25.6 3.50
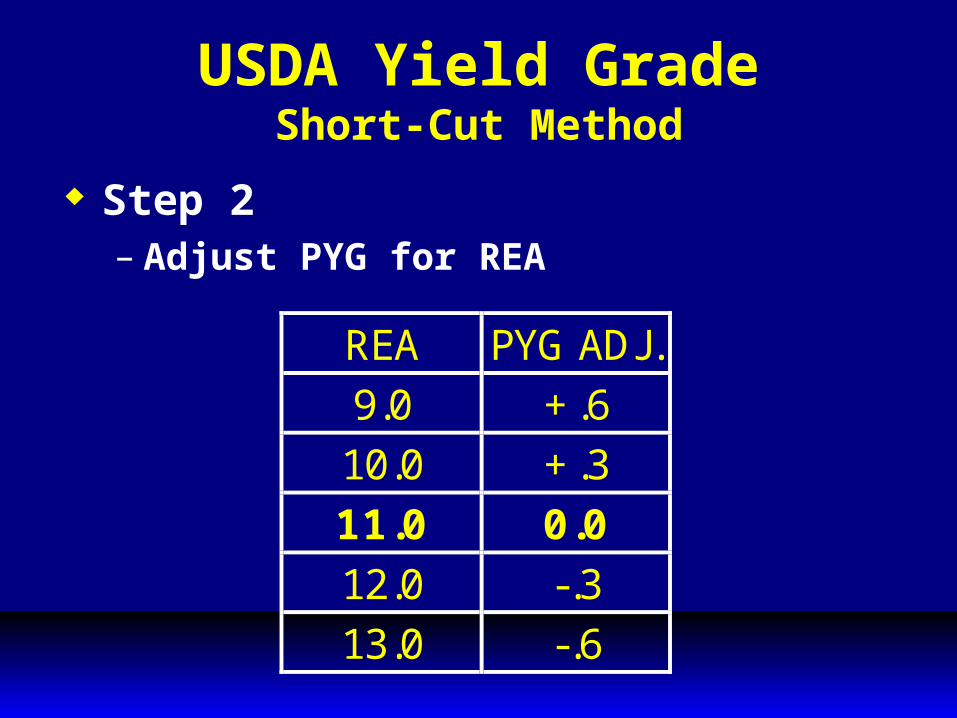
USDA Yield GradeShort-Cut Method
Step 2– Adjust PYG for REA
REA PYG ADJ .9.0 +.610.0 +.311.0 0.012.0 -.313.0 -.6
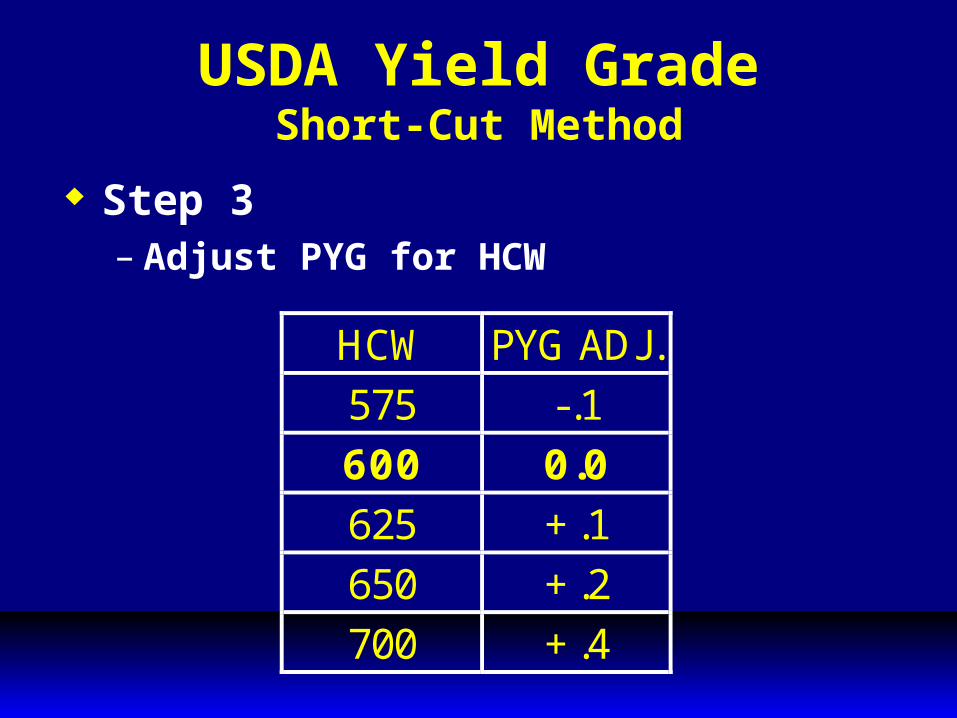
USDA Yield GradeShort-Cut Method
Step 3– Adjust PYG for HCW
HCW PYG ADJ.575 -.1600 0.0625 +.1650 +.2700 +.4
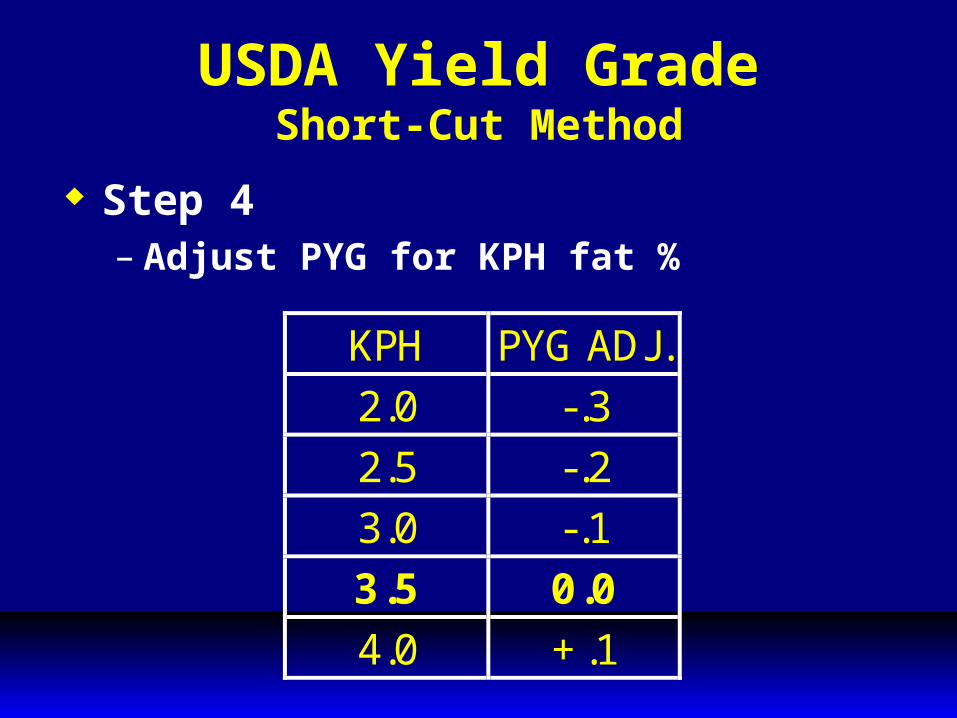
USDA Yield GradeShort-Cut Method
Step 4– Adjust PYG for KPH fat %
KPH PYG ADJ.2.0 -.32.5 -.23.0 -.13.5 0.04.0 +.1
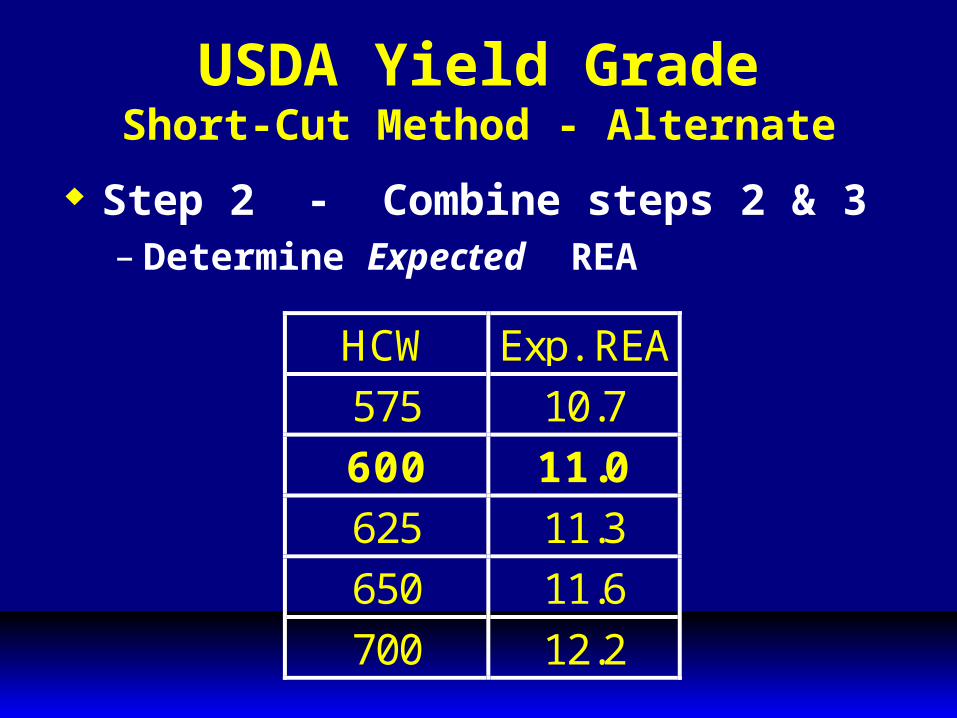
USDA Yield GradeShort-Cut Method - Alternate
Step 2 - Combine steps 2 & 3– Determine Expected REA
HCW Exp. REA575 10.7600 11.0625 11.3650 11.6700 12.2
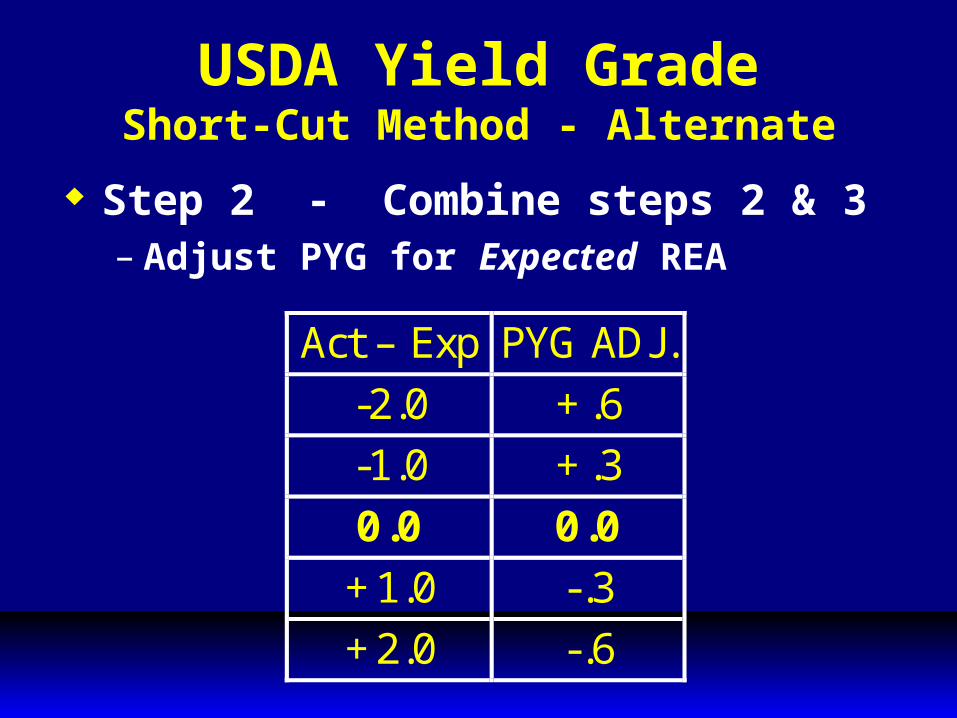
USDA Yield GradeShort-Cut Method - Alternate
Step 2 - Combine steps 2 & 3– Adjust PYG for Expected REA
Act – Exp PYG ADJ . -2.0 +.6 -1.0 +.3 0.0 0.0 +1.0 -.3 +2.0 -.6
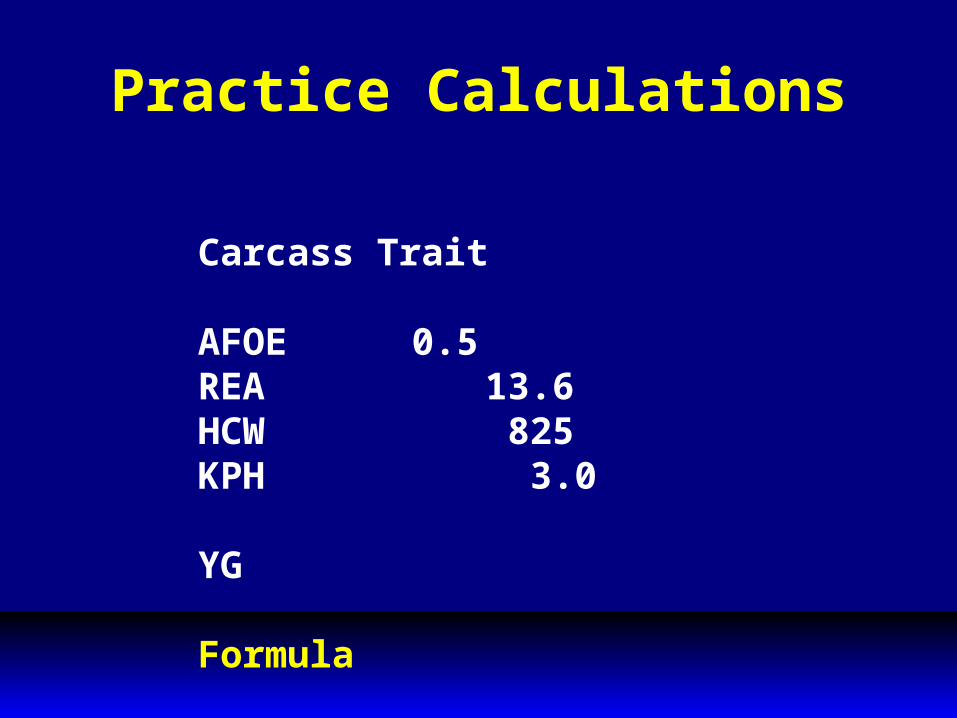
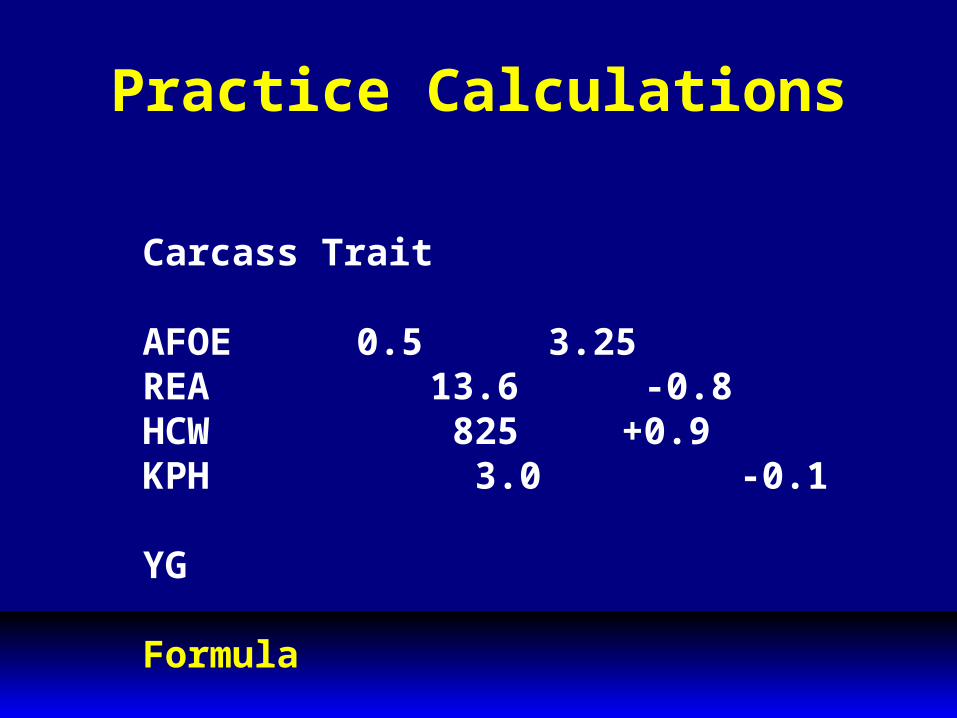
Practice Calculations
Carcass Trait
AFOE 0.5REA 13.6HCW 825KPH 3.0
YG
Formula
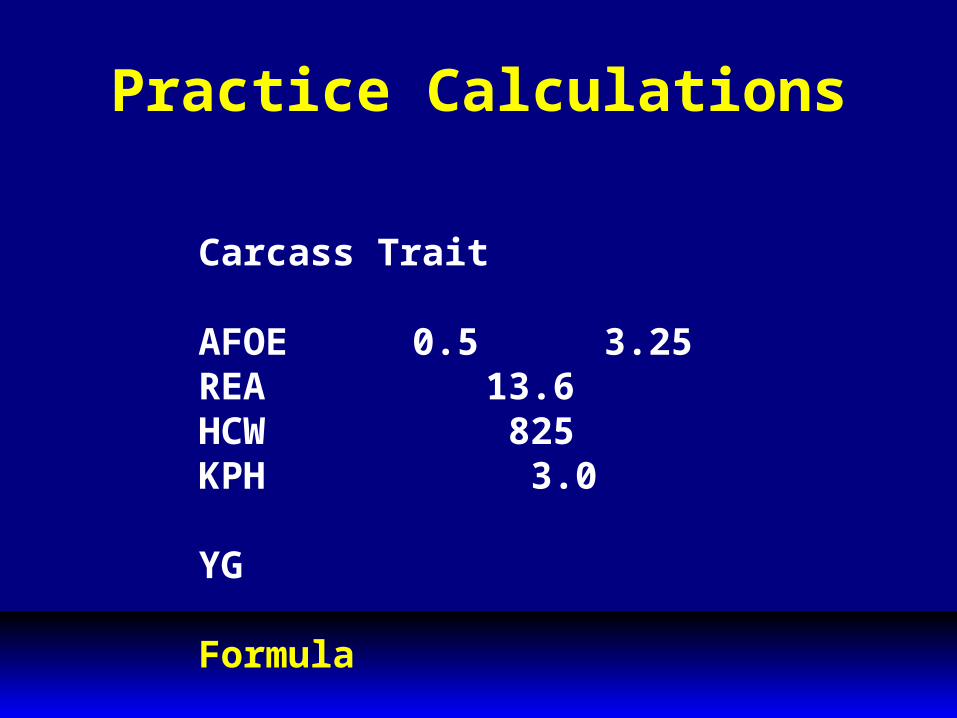
Practice Calculations
Carcass Trait
AFOE 0.5 3.25REA 13.6 HCW 825KPH 3.0
YG
Formula

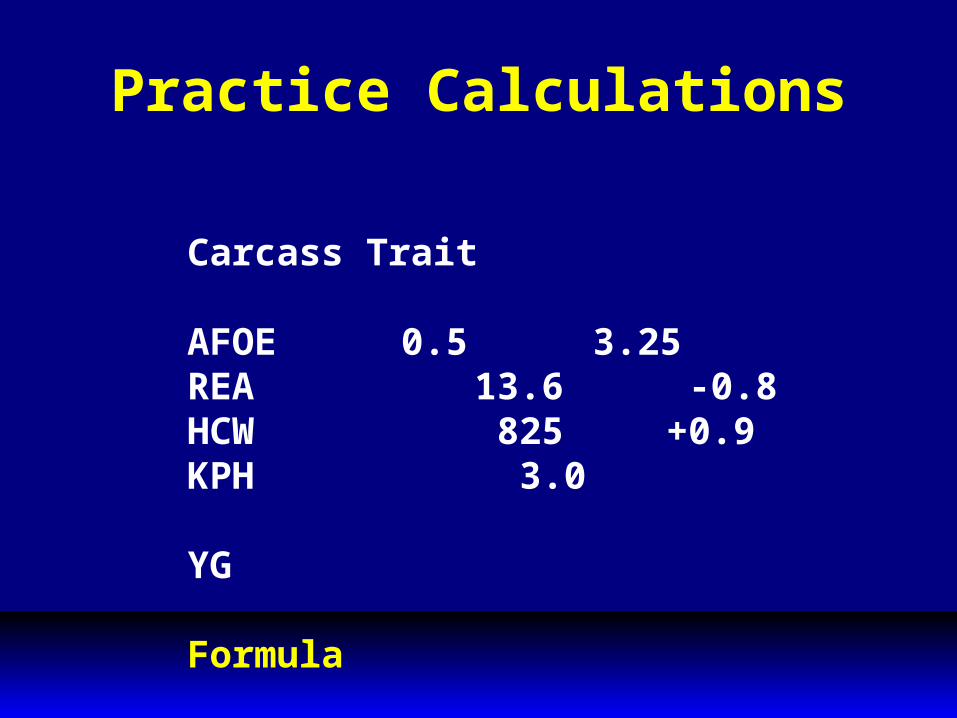
Practice Calculations
Carcass Trait
AFOE 0.5 3.25REA 13.6 -0.8HCW 825KPH 3.0
YG
Formula
Practice Calculations
Carcass Trait
AFOE 0.5 3.25REA 13.6 -0.8HCW 825 +0.9KPH 3.0
YG
Formula
Practice Calculations
Carcass Trait
AFOE 0.5 3.25REA 13.6 -0.8HCW 825 +0.9KPH 3.0 -0.1
YG
Formula
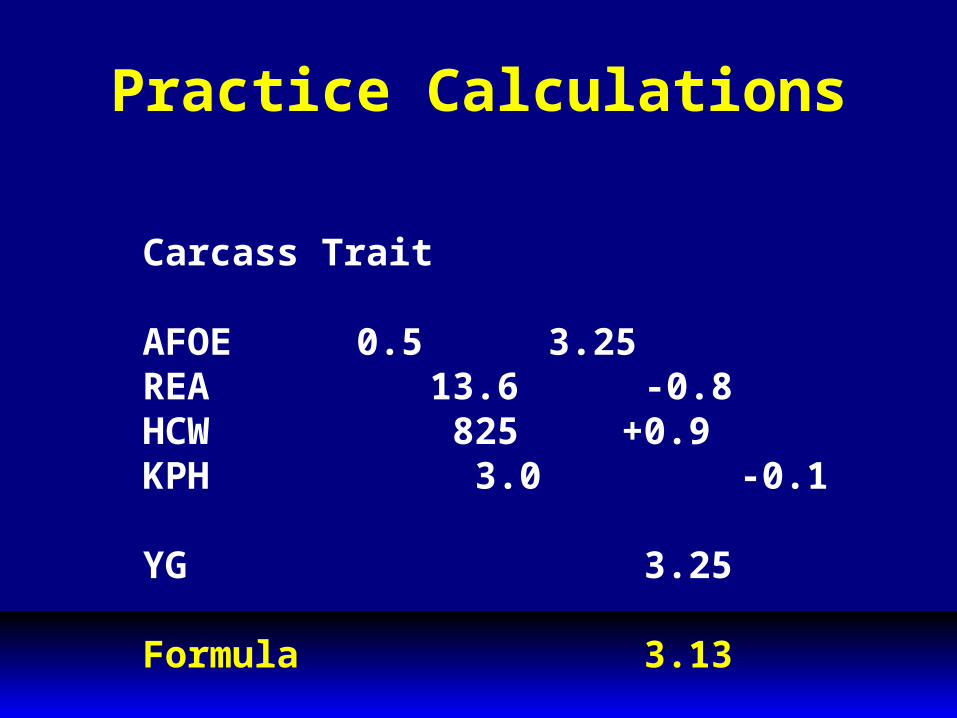
Practice Calculations
Carcass Trait
AFOE 0.5 3.25REA 13.6 -0.8HCW 825 +0.9KPH 3.0 -0.1
YG 3.25
Formula 3.13
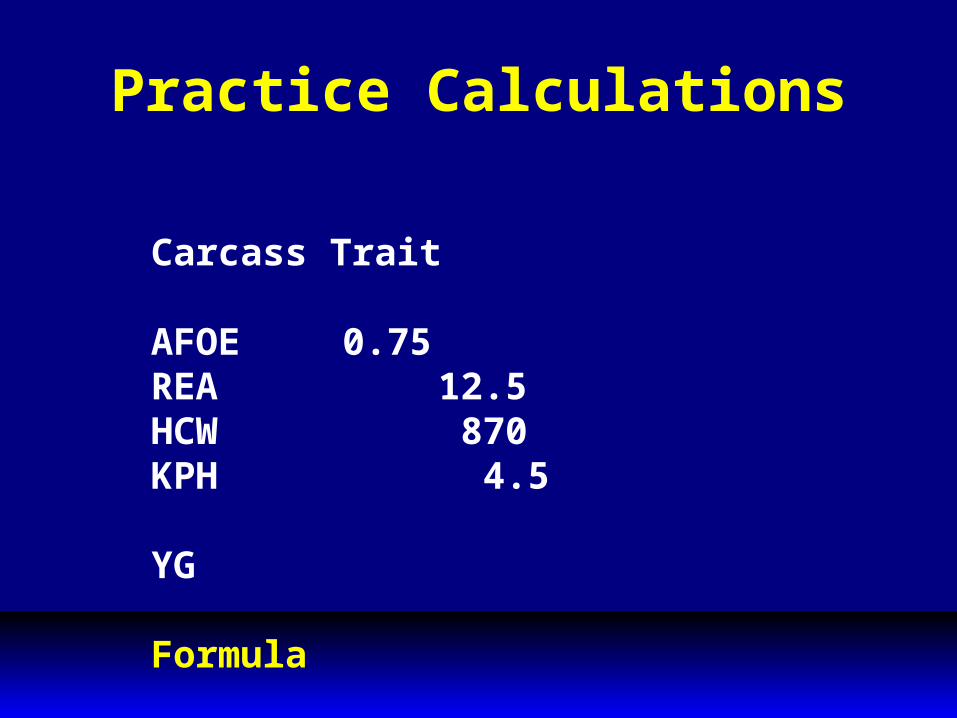
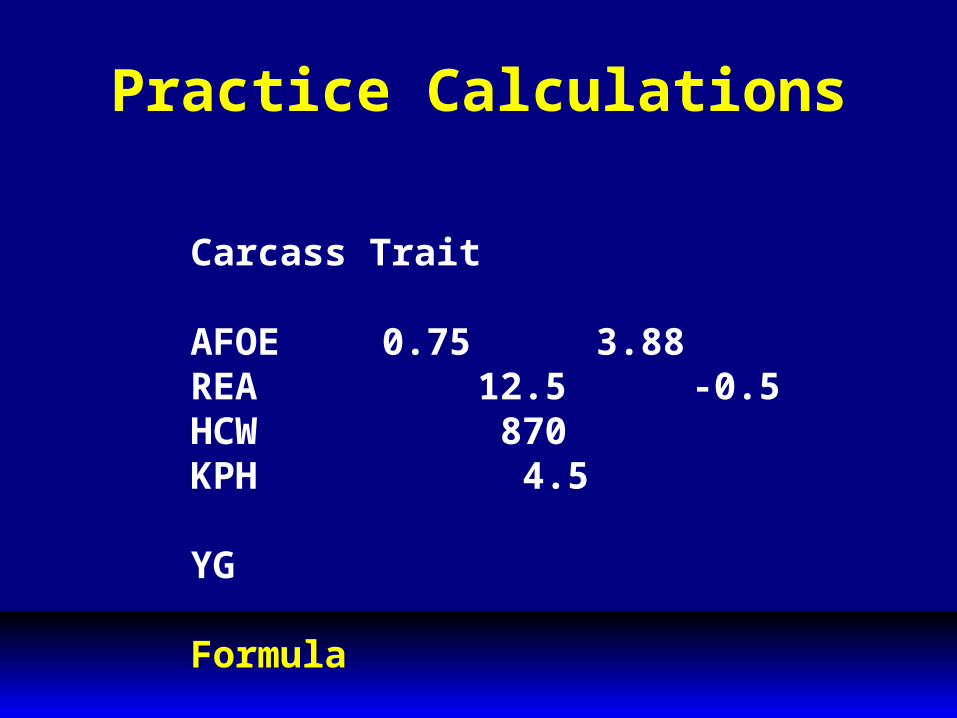
Practice Calculations
Carcass Trait
AFOE 0.75REA 12.5HCW 870KPH 4.5
YG
Formula
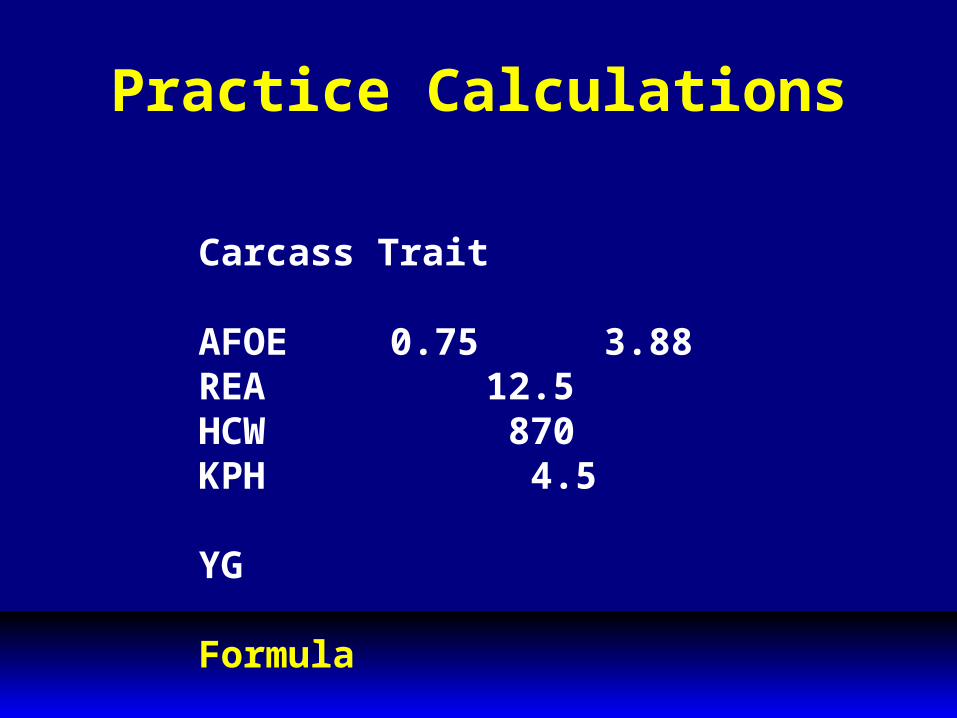
Practice Calculations
Carcass Trait
AFOE 0.75 3.88REA 12.5HCW 870KPH 4.5
YG
Formula
Practice Calculations
Carcass Trait
AFOE 0.75 3.88REA 12.5 -0.5HCW 870KPH 4.5
YG
Formula
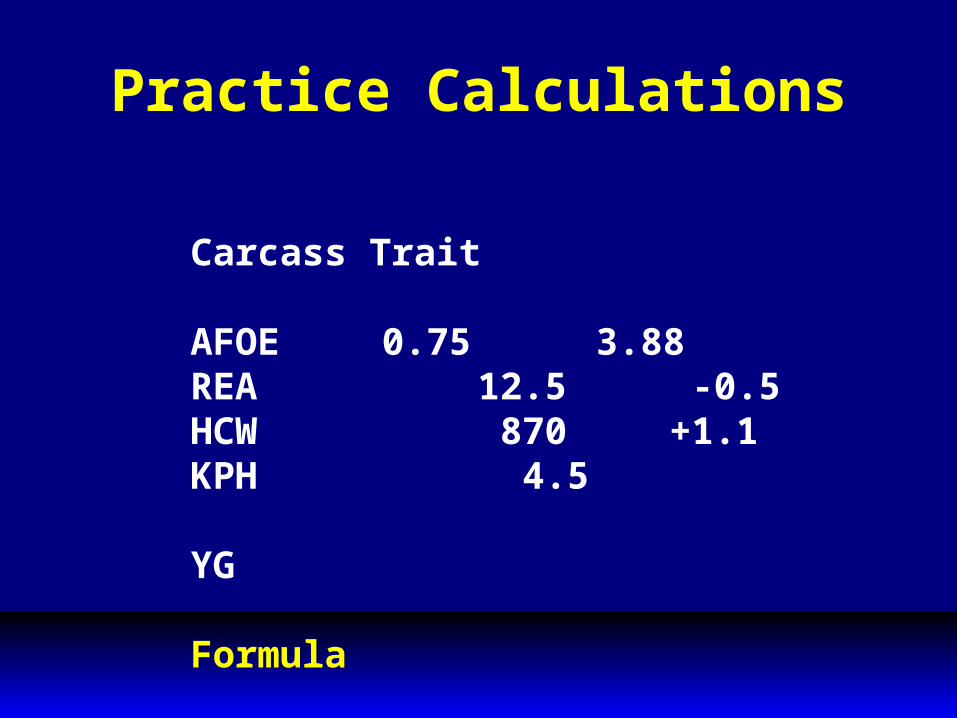
Practice Calculations
Carcass Trait
AFOE 0.75 3.88REA 12.5 -0.5HCW 870 +1.1KPH 4.5
YG
Formula
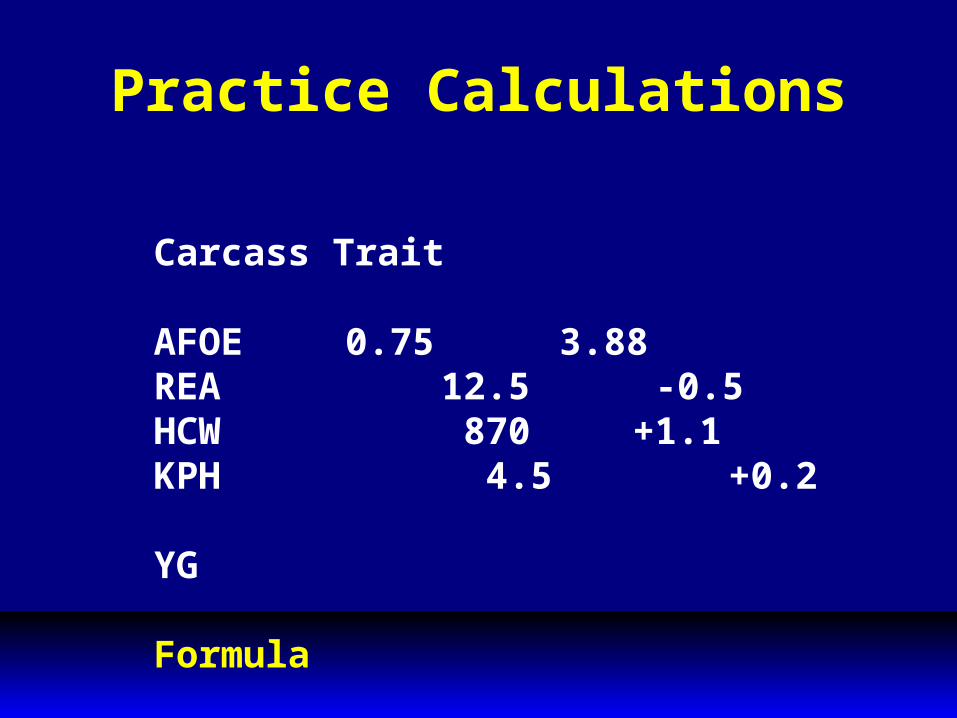
Practice Calculations
Carcass Trait
AFOE 0.75 3.88REA 12.5 -0.5HCW 870 +1.1KPH 4.5 +0.2
YG
Formula
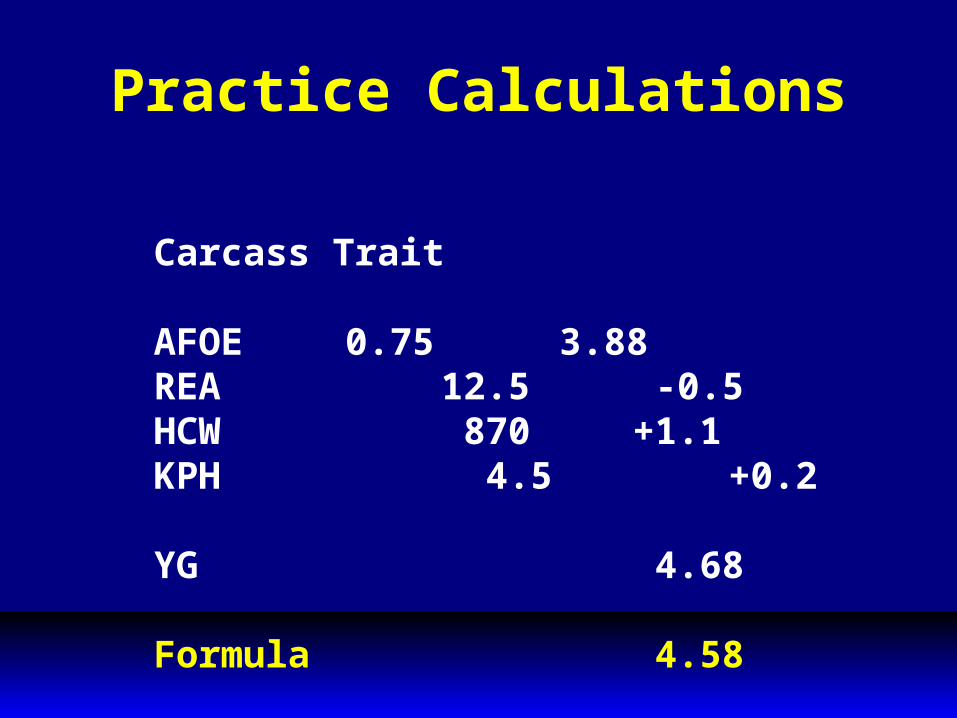
Practice Calculations
Carcass Trait
AFOE 0.75 3.88REA 12.5 -0.5HCW 870 +1.1KPH 4.5 +0.2
YG 4.68
Formula 4.58
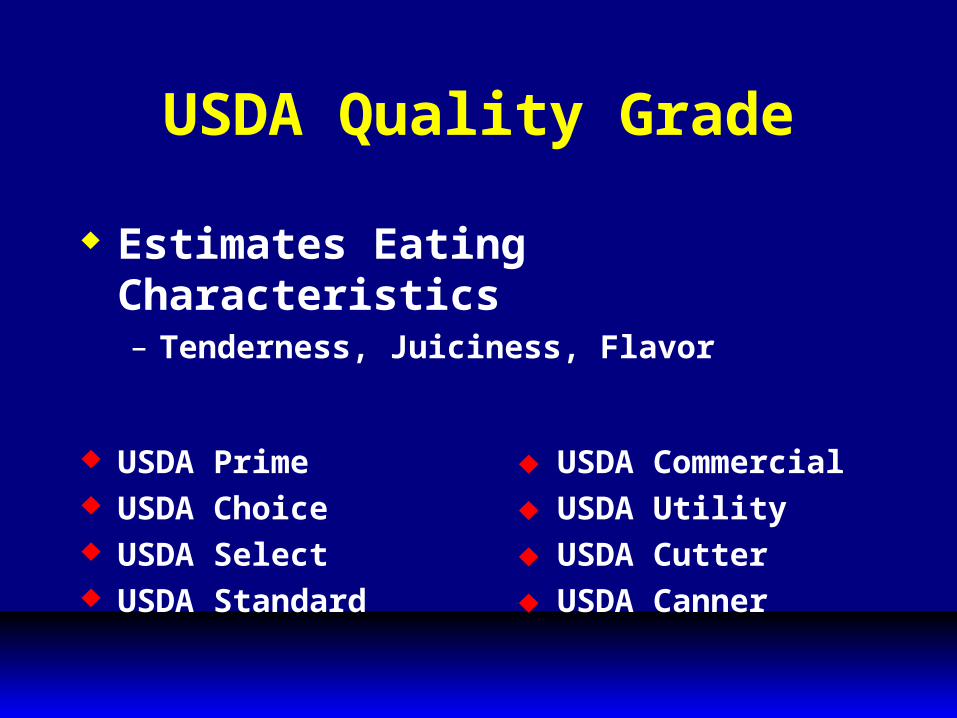
USDA Quality Grade
Estimates Eating Characteristics– Tenderness, Juiciness, Flavor
USDA Prime USDA Commercial USDA Choice USDA Utility USDA Select USDA Cutter USDA Standard USDA Canner
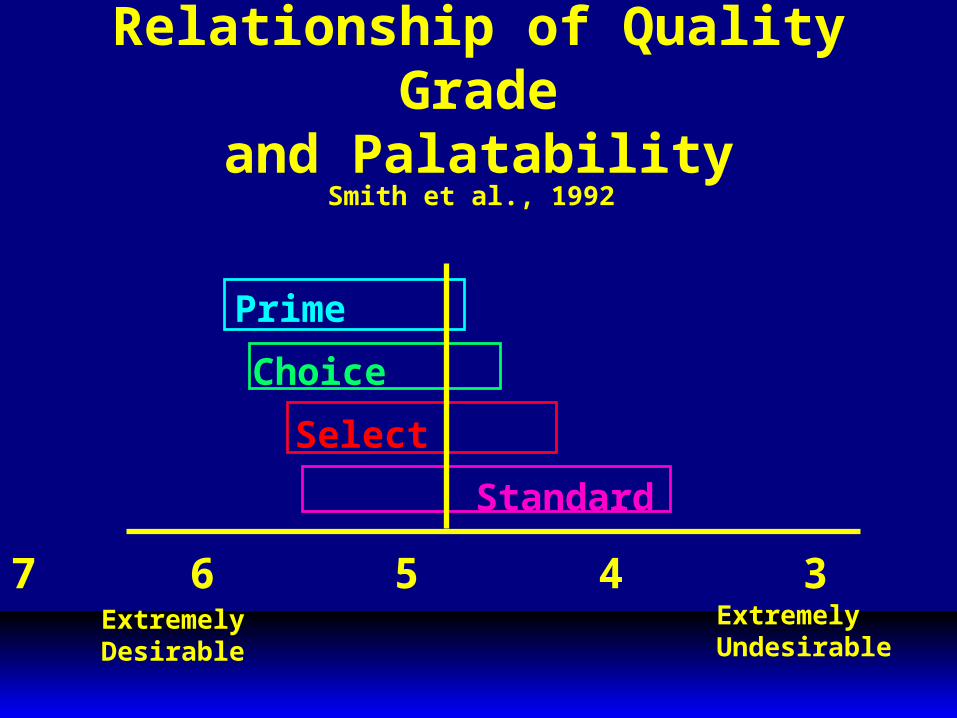
Relationship of Quality Grade
and PalatabilitySmith et al., 1992
8 7 6 5 4 3 2 1ExtremelyDesirable
ExtremelyUndesirable
Prime
Choice
Select
Standard
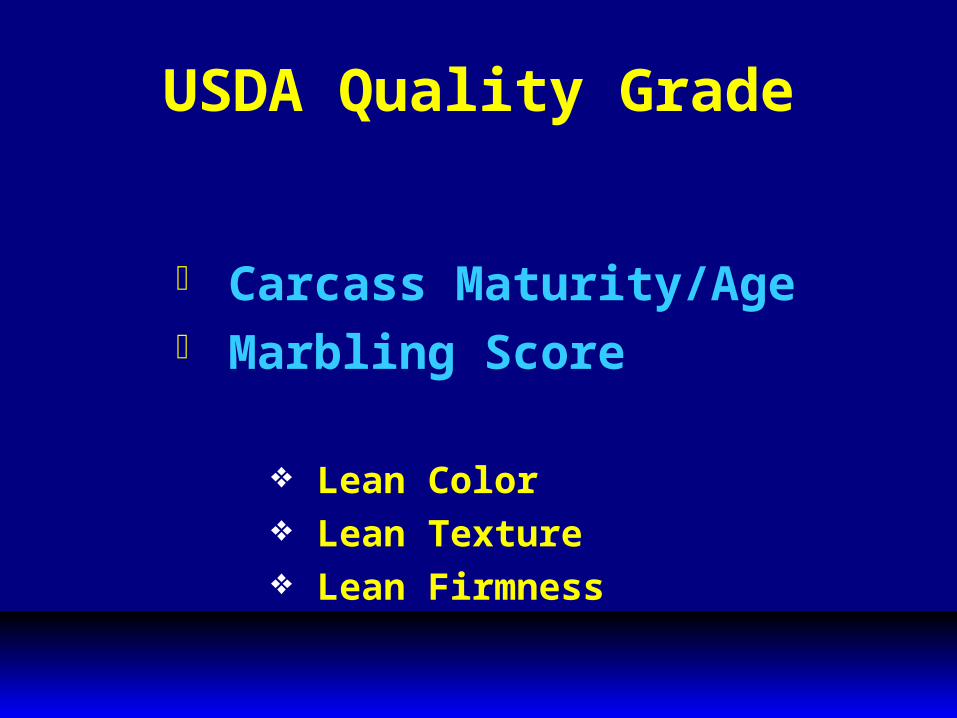
USDA Quality Grade
Carcass Maturity/Age Marbling Score
Lean Color Lean Texture Lean Firmness
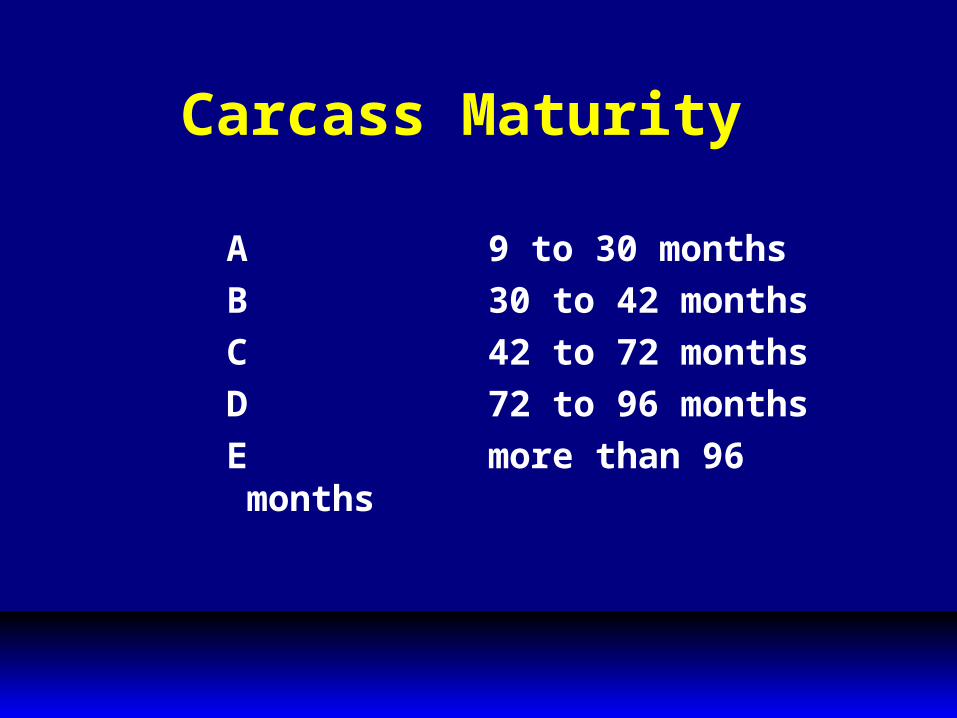
Carcass Maturity
A 9 to 30 monthsB 30 to 42 monthsC 42 to 72 monthsD 72 to 96 monthsE more than 96 months
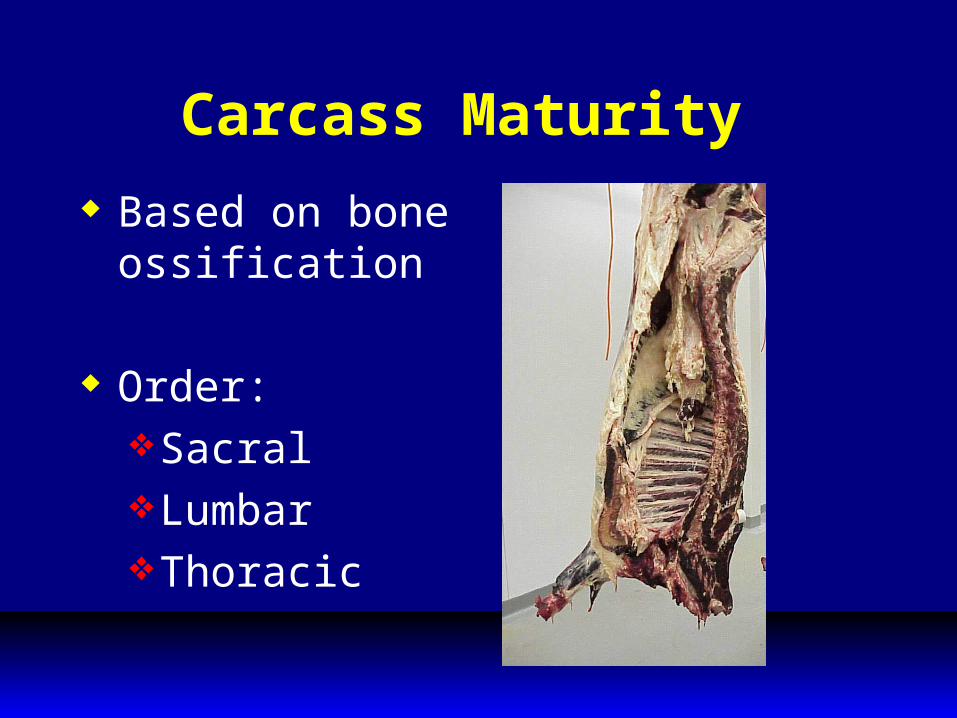
Carcass Maturity Based on bone
ossification
Order:SacralLumbarThoracic
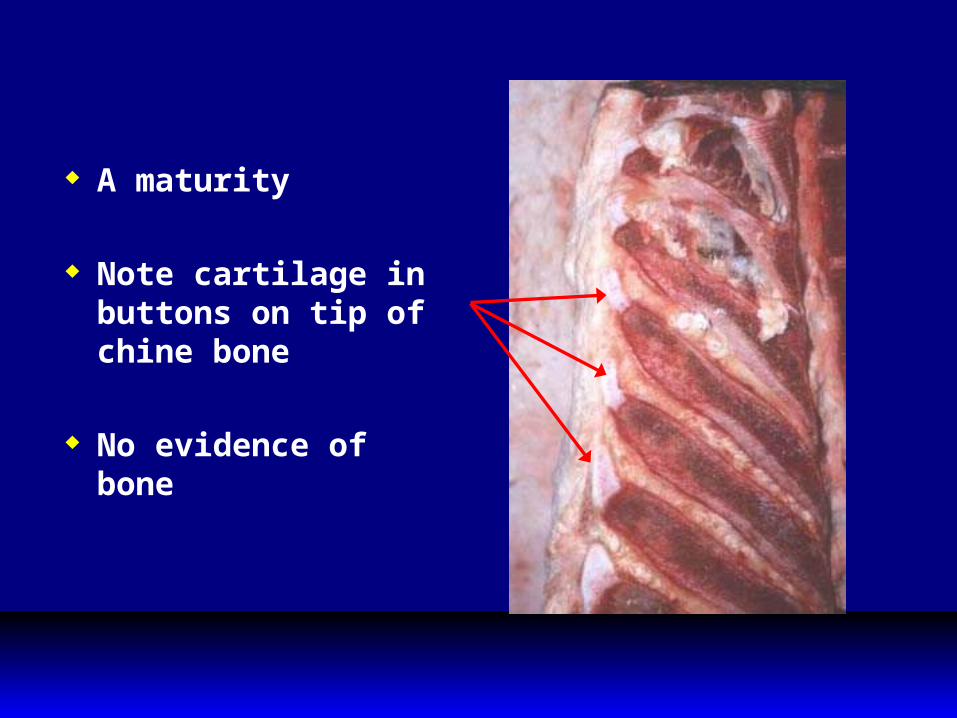
A maturity
Note cartilage in buttons on tip of chine bone
No evidence of bone
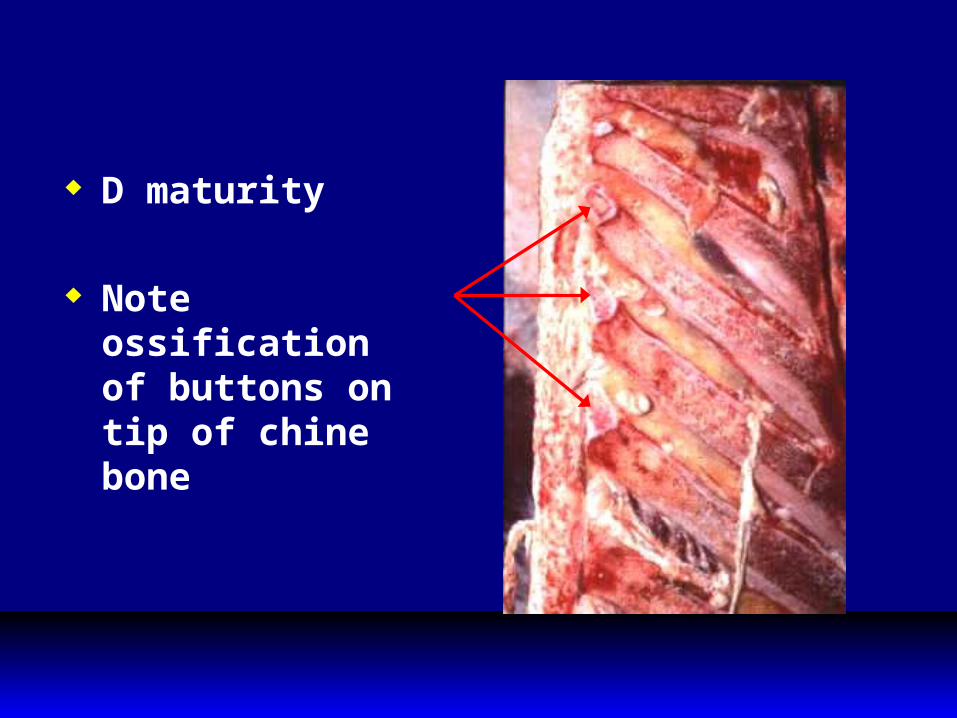
D maturity
Note ossification of buttons on tip of chine bone
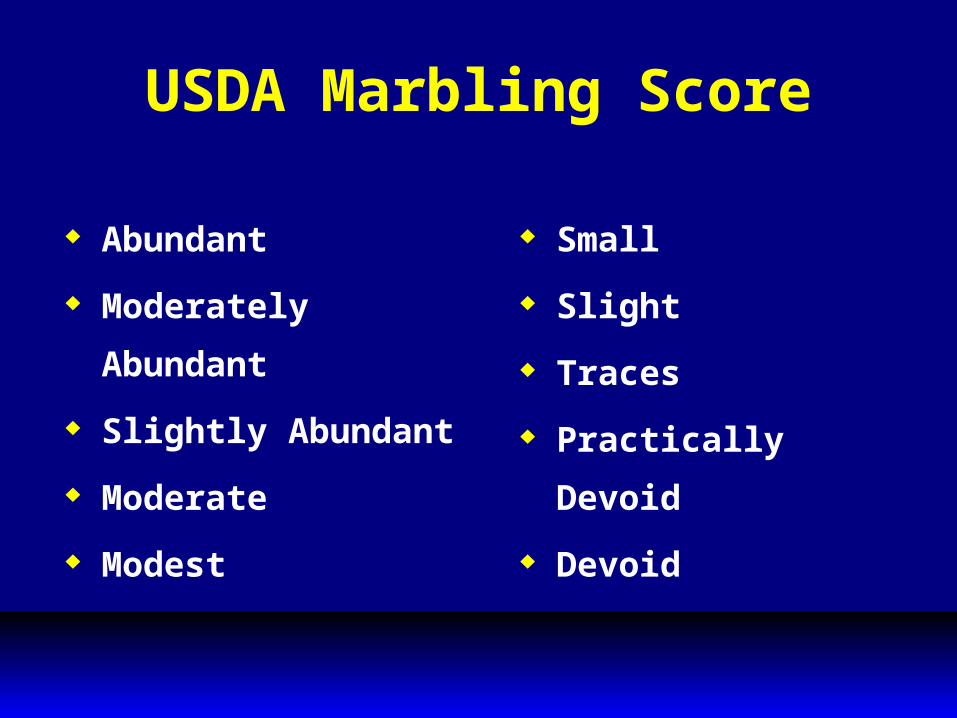
USDA Marbling Score
Abundant
Moderately
Abundant
Slightly Abundant
Moderate
Modest
Small
Slight
Traces
Practically
Devoid
Devoid
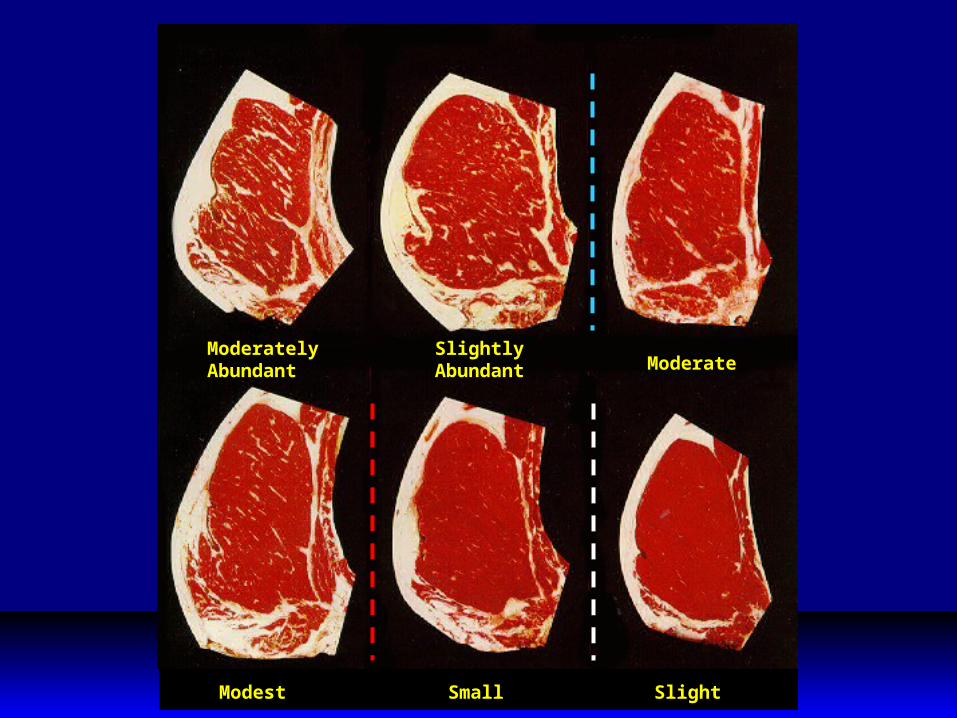
ModeratelyAbundant
SlightlyAbundant Moderate
SlightSmallModest
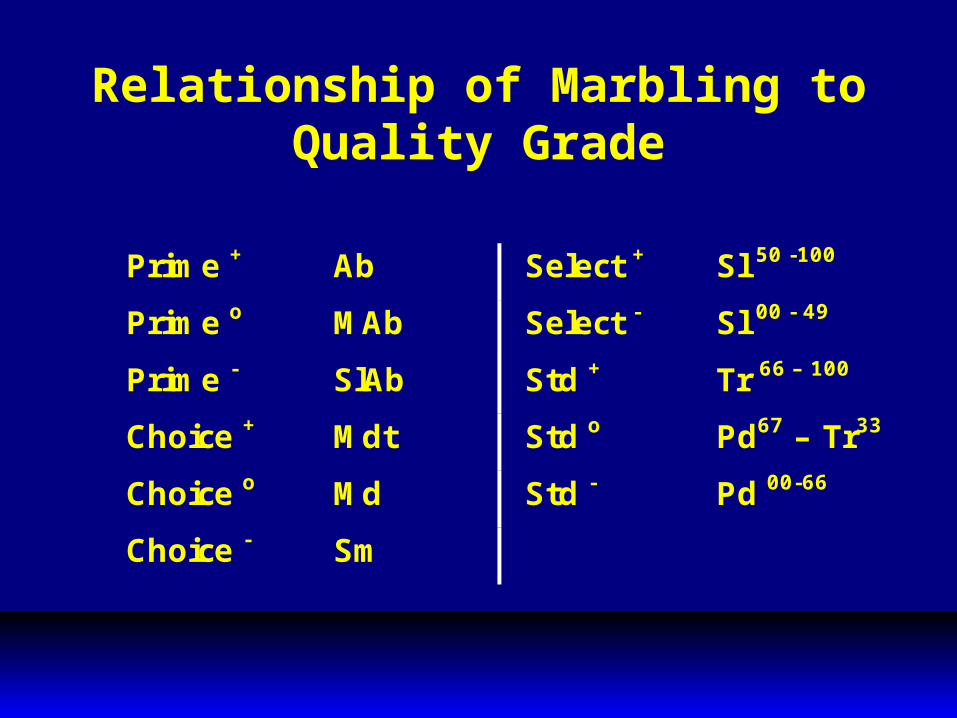
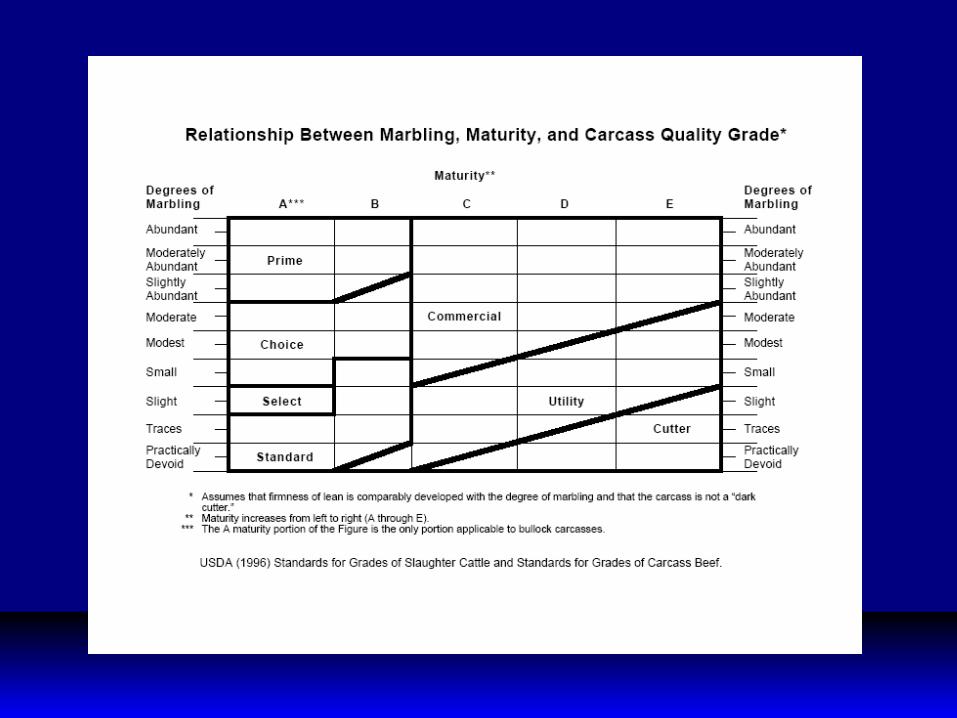
Relationship of Marbling to Quality Grade
Prime + Ab Select + Sl 50 -100
Prime o MAb Select - Sl 00 - 49
Prime - SlAb Std + Tr 66 – 100
Choice + Mdt Std o Pd67 – Tr33
Choice o Md Std - Pd 00-66
Choice - Sm